Embed Size (px)
Citation preview

FACTORS AFFECTING APPLICATION OF BALANCED SCORE CARD: A CASE STUDY OF NON
GOVERNMENTAL ORGANIZATIONS IN ELDORET, KENYA
CAROL CHEPNG’ENO KOSKE
- 1869 -
Vol. 2, Iss. 2 (116), pp 1868 – 1898, Nov 5, 2015, www.strategicjournals.com, ©Strategic Journals
FACTORS AFFECTING APPLICATION OF BALANCED SCORE CARD: A CASE STUDY OF NON
GOVERNMENTAL ORGANIZATIONS IN ELDORET, KENYA
1 Carol Chepng’eno Koske and 2 Dr. Willy Muturi
1 MBA Student, Jomo Kenyatta University of Agriculture & Technology (JKUAT), Kenya
2 Senior Lecturer, Jomo Kenyatta University of Agriculture & Technology (JKUAT), Kenya
Accepted: November 5, 2015
ABSTRACT
The balanced scorecard is a planning and management system that is slowly being adopted for use in non-governmental organization and industry, government, and nonprofit organizations worldwide to align organization activities to the vision and strategy of the organization. This study aimed at analyzing the factors affecting application of balanced score card by the non-governmental organizations. The objectives of the study were to determine how size of the organization, costs of adoption, and perceived benefits of the system and ease of use of the system affect the application of BSC. The researcher used a case study research design to carry out the study because it gave in-depth information about the study which involved several organizations in which data was collected. The information used in the study was collected from the management and other employees of various NGOs within Eldoret town. The target population included the 5 management employees of the 11 target NGOs operating in Eldoret Town. The research used questionnaires to collect data. The researcher consulted with the supervisor to ensure that the questionnaires were valid for use in the study. The researcher also carried out a pilot study to ensure that the questionnaires were reliable. After collecting data was analyzed using descriptive statistics and presented using tables, charts and graphs. From the findings, the study found out that the size of the organization largely affects the application of the tools of the balanced scorecard in non-governmental organizations. Most large organizations adopt BSC in order to improve their efficiency in coordinating the activities of the organizations this is according to 82 % of the respondents. 62 % of the respondents indicated that the more the perceived benefits of BSC in an organization according to the managers, the more they can adopt it much easier and faster. Managers also posses different characteristics and this affects their adoption of the tools of the model. Managers are also influenced by the costs of adoption of BSC according to 80% of the respondents. The study concludes that leadership support and employees involvement are also found to be important success factors in BSC use and performance improvements. It further concludes and recommends that a properly implemented and successful BSC, having the commitment and involvement of both employees and managers and being used as a strategic management system that aligns the entire organization to achieve its strategic goals, will eventually lead to a wide variety of performance improvements, both financial and non-financial.
Key Words: Balanced Score card, Non-Governmental Organizations
INTRODUCTION
Background of Study
The non government organizations are
becoming gratified to respond to the highly
challenging dynamic environmental forces that
could threaten their survival. It would be useful
to know if these forces are hindering movement
towards strategic planning. These forces
include: donors’ budget control, lack of staff,
size of the organization and range of
operations, changing customers’ expectations,
government policy changes, comparability,
stronger competition with other existing as well
as emerging non governments, competition for
international donors’, accountability imposed
by multiple stakeholders groups including public
administrators, legislators, and citizens, staff
and volunteers, and continuous government
failure to satisfy public needs which increase
the public demand for the services offered by
these organizations (Eisenberg.P. 2004).
Eisenberg argued that in response to these
pressures, strategic management was recently
introduced to the public and non government
sector, especially by the end of the 1980s and
the beginning of the 1990s, in order to address
the basic values of accountability and social
responsibility embedded in this sector (Djers,
2001).
Traditionally, non government organizations
across the world have tried only to generate
sufficient revenues to cover their expenses and
be able to serve public needs but they did not
seek to make operating profits, unlike for profit
making organizations. Recently, however
accountability from various stakeholders groups
on the efficient use of scarce resources are
becoming increasingly intense and although it is
still not all about profits, yet efficiency
considerations are among the important criteria
for assessing NGOs’ performance (Mucheru,
2008). Thus, in response to these demands
many non government/nonprofits are
becoming obliged to apply formal strategic
planning processes and utilize a balanced
scorecard approach to measuring performance
effectiveness as guided by their mission and
vision statements. The balanced scorecard can
be used effectively to assess performance.
Stakeholders are demanding increased
accountability and indicators of overall
organizational performance; therefore, a
systematic balanced means of promoting
improved organizational performance and
assessing performance are becoming
increasingly important. The current study
attempts to fill in this gap by studying the
factors affecting the application of balanced
score card in strategy implementation by the
non-governmental organizations (Mucheru,
2008).
Kaplan and Norton (1990) developed the
Balance Scorecard with the realization that
financials alone would not be enough for
organizations attempting to thrive, or even
compete in the twenty first century. They
organized a research study of a dozen of non-
governmental organizations attempting to
discern the best practices in performance
management and this led to development of
the balanced scorecard (Niven, 2005). The
Balanced Scorecard (BSC) is a strategic
performance management tool - a semi-
standard structured report, supported by
proven design methods and automation tools
that can be used by managers to keep track of
the execution of activities by the staff within
their control and to monitor the consequences
arising from these actions (Norton, 2000).

- 1871 -
It is perhaps the best known of several such
frameworks (it is the most widely adopted
performance management framework reported
in the annual survey of management tools
undertaken by Bain & Company, and has been
widely adopted in English-speaking western
countries and Scandinavia in the early 1990s).
Since 2000, use of the Balanced Scorecard, its
derivatives (e.g., Performance Prism), and other
similar tools (e.g., Results Based Management)
has also become common in the Middle East,
Asia and Spanish-speaking countries (Daniels,
2006).
While the "Balanced Scorecard" terminology
was coined by Schneiderman (2000), the roots
of performance management as an activity run
deep in management literature and practice. By
2004ed about 57% of global non-governmental
organizations were working with the balanced
scorecard (Bain, 2005). Much of the information
in the commercial sector is proprietary, because
it relates to the strategies of specific non-
governmental organizations. Public-sector
(government) organizations are usually not
concerned with proprietary information, but
also they may not have a mandate (or much
funding) to post their management information
on web sites (David, 2008).
Enhancing the strategic work is a key
component for driving the firms to succeed in
accomplishing the expected opportunities or
keeping away from the potential threats which
accordingly lead to clarify and breakdown the
goals and the requirements of each in the
internal environment. The elite non-
governmental organizations employ different
performance measurements for analyzing, and
judging the procedures, workforce, and
programs. This involves strategic management
(Doll, 1998).
The Balanced Score Card Concept
The conceptual framework of the Balanced
Scorecard was introduced by Kaplan and Norton
(1992, 1993,1996) for the purpose of
designating, evaluating and measuring factors
that drive an organization’s performance. The
Balanced Scorecard (BSC) is a strategic
performance management tool - a semi-
standard structured report, supported by
proven design methods and automation tools
that can be used by managers to keep track of
the execution of activities by the staff within
their control and to monitor the consequences
arising from these actions (Norton, 2000). It is
perhaps the best known of several such
frameworks (it is the most widely adopted
performance management framework reported
in the annual survey of management tools
undertaken by Bain & Company, and has been
widely adopted in English-speaking western
countries and Scandinavia in the early 1990s).
The balance score card is a management system
that enables organizations to clarify their vision
and strategy and translate them into action. It
provides feedback around both the internal
business processes and external outcomes in
order to continuously improve strategic
performance and results. The balance score
card which saw its initial development during
the years of 1987-1992(Schneider man, 2002),
links performance measures by looking at a
business’s strategic vision from four different
perspectives: financial, customer, innovation
and learning, and internal business process
The objectives and the measures for the
Balanced Scorecard are more than just a
somewhat adhoc collection of financial and
non-financial performance measures; they are
derived from a top-down process driven by the
mission and strategy of the non-governmental
- 1872 -
organization unit. The balanced scorecard
should translate a non-governmental
organization unit’s mission and strategy into
tangible objectives and measures. The
measures represent a balance between external
measures for shareholders and customers, and
internal measures of critical non-governmental
organization processes, innovation, and
learning and growth. The measures are
balanced between outcome measures-the
results from past efforts-and the measures that
drive future performance (Davis and Albright,
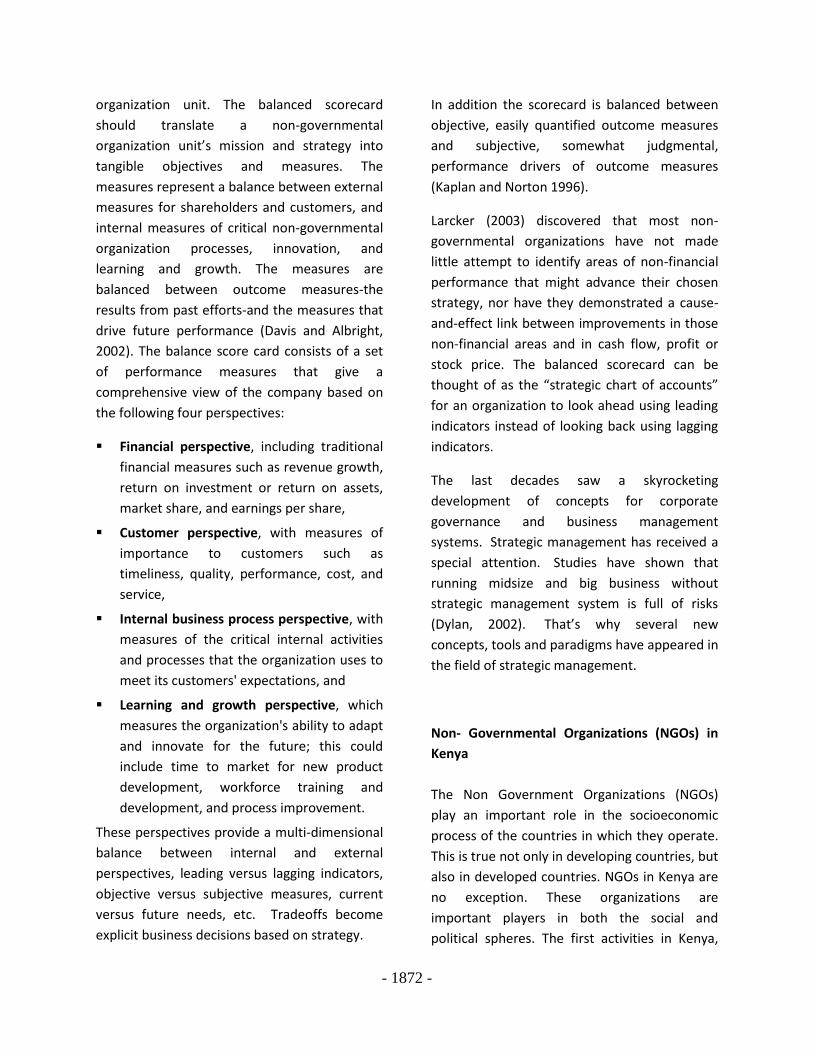
2002). The balance score card consists of a set
of performance measures that give a
comprehensive view of the company based on
the following four perspectives:
Financial perspective, including traditional
financial measures such as revenue growth,
return on investment or return on assets,
market share, and earnings per share,
Customer perspective, with measures of
importance to customers such as
timeliness, quality, performance, cost, and
service,
Internal business process perspective, with
measures of the critical internal activities
and processes that the organization uses to
meet its customers' expectations, and
Learning and growth perspective, which
measures the organization's ability to adapt
and innovate for the future; this could
include time to market for new product
development, workforce training and
development, and process improvement.
These perspectives provide a multi-dimensional
balance between internal and external
perspectives, leading versus lagging indicators,
objective versus subjective measures, current
versus future needs, etc. Tradeoffs become
explicit business decisions based on strategy.
In addition the scorecard is balanced between
objective, easily quantified outcome measures
and subjective, somewhat judgmental,
performance drivers of outcome measures
(Kaplan and Norton 1996).
Larcker (2003) discovered that most non-
governmental organizations have not made
little attempt to identify areas of non-financial
performance that might advance their chosen
strategy, nor have they demonstrated a cause-
and-effect link between improvements in those
non-financial areas and in cash flow, profit or
stock price. The balanced scorecard can be
thought of as the “strategic chart of accounts”
for an organization to look ahead using leading
indicators instead of looking back using lagging
indicators.
The last decades saw a skyrocketing
development of concepts for corporate
governance and business management
systems. Strategic management has received a
special attention. Studies have shown that
running midsize and big business without
strategic management system is full of risks
(Dylan, 2002). That’s why several new
concepts, tools and paradigms have appeared in
the field of strategic management.
Non- Governmental Organizations (NGOs) in
Kenya
The Non Government Organizations (NGOs)
play an important role in the socioeconomic
process of the countries in which they operate.
This is true not only in developing countries, but
also in developed countries. NGOs in Kenya are
no exception. These organizations are
important players in both the social and
political spheres. The first activities in Kenya,

- 1873 -
similar to those of an NGO emerged during the
British colonial period in the late 19th century.
About 100 years later, with the macro changes
in the country, a substantial expansion of NGO
presence in Kenya took place. A considerable
sum of funds, received from both national and
international sources is handled by these NGOs
(Ogendo, 2010). This situation has been further
enhanced by the post election violence of 2007,
which resulted in an unprecedented inflow of
financial and other resources in to the country
and the formation or representation in Kenya of
many more such organizations. The non
government sector in Kenya is mostly highly
fragmented and ignores the formal aspects of
strategic planning practices. This might be due
to their belief that they do not possess enough
resources to enable them to engage in formal
strategic planning processes (Okumu, 2003).
Most non-Governmental Organizations are
funded by institutional and private donors,
international agencies and the Kenyan
Government initiatives (www.ngobureau.or.ke).
These organizations are active in a cross section
of sectors which include agriculture, water and
sanitation, education, environment, health,
human rights, gender and development,
children’s rights, poverty alleviation, training,
counseling, small scale enterprises
development, many others. NGOs in Kenya play
complementary role in providing services and
essential facilities to deserving or underserved
regions despite institutional, financial and
program sustainability challenges (Niven, 2005).
Non-Governmental Organizations (NGOs) are
increasingly being recognized by governments
everywhere as potent forces for social and
economic development; important partners in
nation building and national development;
valuable forces in promoting the qualitative and
quantitative development of democracy and
not least, important contributors to GDP. The
activities of NGOs have increased since 1980s.
The 1980s and 1990s was a period in which
Kenyan NGOs changed in several ways. They
shifted their focus away from concerns about
relief to more general interests in development
(Niven, 2005).
The Government established the Non-
Governmental Organizations Co-ordination
Board (NGOs Co-ordination Board) through Act
of Parliament in 1990 and the board
commenced its non-governmental organization
on June 15, 1992. The main reason for the
creation of the Board was to streamline the
registration and Co-ordination of NGOs and
provide a ``one stop office” for registration and
co-ordination of NGOs in order to harmonize
their activities with the overall Government
policies and programs (Kiragu,2005). The
magnitude of the funds channeled through
these organizations creates considerable
responsibility in terms of follow up, monitoring
and accountability. Transparency thus becomes
an important issue. It is claimed that the
statutory regulatory environment is vague.
Clear procedures need to be provided to these
organizations on how to conduct their affairs,
including accounting and reporting activities. It
is also acknowledged however, that extensive
regulation is not necessarily fruitful, and that
“too high” regulation might turn out to be
equally as bad as “too low”, considering the
important role that these organizations play
vital role within society at large (Mukuru, 2008).
Statement of the Problem
The balanced scorecard is a planning and
management system that is slowly being
adopted by non-governmental organization and
industry, government, and nonprofit
- 1874 -
organizations worldwide to align non-
governmental organization activities to the
vision and strategy of the organization, improve
internal and external communications, and
monitor organization performance against
strategic goals. Today's organizations recognize
that competitive advantage comes through
intangible knowledge, capabilities and
relationships created by employees, and not
from physical assets and access to capital.
These organizations therefore should employ
the BSC as a guiding tool to effectively achieve
best performance standards.
The problem is that, non govermental
organizations in most developing countries are
faced with inefficieny in their performance and
management. The balanced scorecard is a
management tool that ensures efficiency in
organizational management by monitoring all
the four arms of management. Most non-
governmental organizations should follow the
balance scorecard strategy in management to
ensure efficiency and effectiveness in their
delivery of their services.
Ideally, NGOs should have a clear laid down
monitoring system for efficiency in
management. Through this, they can manage to
crystallize its vision and make it solid clear to its
employees and other stakeholders. The
employees of the organization can then come
up with strategies to implement them and work
towards achieving goals of the organization.
There arises a need to communicate and link
objectives, examine the performance of factors
in the past and analyze factors that would lead
to better performance in the future.
Scholars have studied the role of the balanced
scorecard in different sectors. Mucheru, (2008),
carried out a survey on the application of the
balanced scorecard in performance
management among commercial banks in
Kenya; Karimi. (2010). carried out a case study
of Safaricom, on the use of the balanced
scorecard Ogendo, (2010), carried out a study
on the application of the balanced scorecard by
Unilever Tea Kenya Limited. Although the
balanced scorecard has gained a lot of
popularity as a planning tool, it has factors
affecting its implementation. Due to the
contextual, sectoral and managerial differences
among organizations, the application of the
balanced scorecard and the challenges faced in
application of the same would not be assumed
to be similar, unless empirical studies
demonstrate so.
It is against this background therefore that the
study aimed to determine the factors affecting
application of balanced score card by the non-
governmental organizations.
Research Objectives
General objective
To determine the factors affecting the
application of balance score card in NGOs in
Eldoret.
Specific objectives
1. To determine how size of the
organization affect the application of
BSC by NGOs.
2. To assess how costs of adoption affect
the application of BSC by NGOs.
3. To determine how perceived benefits of
the BSC system affect the application of
BSC by NGOs.
4. To determine how the ease of use of the
BSC system affect the application of BSC
by NGOs.

- 1875 -
Research questions
1. How does the size of the organization affect
the application of BSC by NGOs?
2. How do costs of adoption affect the
application of BSC by NGOs?
3. How do perceived benefits of the BSC
system affect the application of BSC by
NGOs?
4. How does the ease of use of the BSC affect
the application of BSC by NGOs?
Significance of the Study
The findings from this study will be of value to
theory, policy and practice. The study will
provide an insight to the management of NGOs
and other stakeholders such as donors,
beneficiaries and Government of Kenya on how
the factors affecting the application of BSC in
strategy implementation in order to enhance
the strategic success and sustainability of the
civil society. The study would assist the NGOs in
understanding the strategic practices to engage
in and help different and diverse NGOs to
sustain themselves for the long term. The
results of this study will also be invaluable to
researchers and scholars, as it forms a basis for
further research. The researcher established
that they are very few studies that have focused
on strategic management in NGOs and lesser
studies still that have focused on the factors
affecting the application of the BSC model in
NGOs. The students and academics would use
this study as a basis for discussions on strategic
management in NGOs and the applicability of
the BSC model in that sector. The study is
therefore a source of reference material for
scholars, students and future researchers on
issues of the BSC applicability and strategic
planning in NGOs.
Scope of the Study
The main focus of this study was NGOs in
Eldoret where data was specifically collected
from management team. The aimed to collect
data from the respondents with a view to
establish factors affecting the application of BSC
in NGOs in Eldoret town.
LITERATURE REVIEW
Introduction
This chapter shall review the literature available
on strategy theories of adoption of balance
score card and factors affecting their
application of the balanced scorecard.
Theories of application of BSC
Stakeholder Theory
Stakeholder theory offers another multi-
dimensional approach for enterprise
performance measurement. Stakeholders are
defined as the groups or individuals, inside or
outside the enterprise, that have a stake or can
influence the organization’s performance. The
theory generally identifies five stakeholder
groups for a company: three of them,
shareholders, customers, and communities,
define the external expectations of a company’s
performance; the other two, suppliers and
employees, participate with the company to
plan, design, implement and deliver the
company’s products and services to its
customers (Atkinson et al., 1997).
Management control scholars who apply
stakeholder theory to performance
measurement, believe “performance
measurement design starts with stakeholders”
(Neely and Adams, 2002). The stakeholder
approach to performance measurement starts
by defining objectives for what each

- 1876 -
stakeholder group expects from the corporation
and how each group contributes to the success
of the corporation. Once stakeholder
expectations or, even further, implicit and
explicit contracts between the stakeholders and
the corporation get defined, the corporation
then defines a strategy to meet these
expectations and fulfill the contracts (Drucker,
1954). Thus, while the Balanced Scorecard
approach starts with strategy and then
identifies the inter-relationships and objectives
for various stakeholders, the stakeholder
approach starts with stakeholder objectives
and, in a second step, defines a strategy to
meet shareholder expectations.
Just as Chandler articulated that strategy
precedes structure, I strongly believe that
strategy also precedes stakeholders. The
stakeholder movement likely developed to
counter the narrow shareholder value
maximization view articulated by Milton
Friedman and, subsequently, financial
economists, such as Jensen (Kaplan and S.
Landekich, 1975). In this spirit, I believe the
stakeholder helped us appreciate the value
from nurturing multiple relationships that drive
long-term and sustainable value creation.
But stakeholder theory confuses means and
ends, and therefore ends up less powerful, less
actionable, and, ultimately, less satisfying (at
least to me) than the strategy map/Balanced
Scorecard approach (Howell, Brown, S. Soucy,
and A. Seed 1987). Kaplan and Norton advocate
selecting a strategy first, and only subsequently
working out the relationship with stakeholders,
as needed by the strategy. Strategy is about
choice. Companies cannot meet the
expectations of all their possible customers.
Strategy determines which customers the
company has decided to serve and the value
proposition that it will offer to win the loyalty of
those customer segments. The determination of
strategy must come before defining measures
of customer satisfaction and loyalty (Kaplan and
S. Landekich, 1975). Otherwise, following the
recommendations of the stakeholder theorists,
the company would attempt to meet the
expectations of all the existing and potential
customers it could serve, getting stuck “in the
middle,” as described by Michael Porter, with
both a high cost and a non-differentiated
approach, a recipe for strategy failure.
A similar situation occurs for employees
(Drucker, 1954). The Balanced Scorecard
deliberately did not label its fourth perspective
the “employees” or “people” perspective,
choosing a more generic name, “learning and
growth,” to signal that companies were not
taking a pure stakeholder approach.
Under the BSC approach, employee objectives
always appear (in the learning and growth
perspective) but they get there because they
are necessary for the strategy, not because
someone has labeled them as a “stakeholder.”
Consider a pharmaceutical company in the early
1990s (Berliner, C. and J. Brimson, 1991). One of
its most important groups of employees (what
we would subsequently call a strategic job
family) is the chemists performing research to
screen and identify new compounds to treat
specific diseases. The stakeholder approach
would interview these key employees to learn
their career expectations and develop a
strategy that would meet their expectations
and strive to continually motivate and satisfy
these employees.
Again, the stakeholder view would lock the
company into maintaining relationships with its
soon-to-be-obsolete employee group and
nonmoving swiftly enough to reflect that it

- 1877 -
needed entirely new employees to help it
implement the new strategy.
Stakeholder theorists also criticize the Balanced
Scorecard for not having a separate perspective
for suppliers, one of their five essential
stakeholder groups (Howell, Brown, S. Soucy,
and A. Seed 1987). But as with employees,
suppliers get on the scorecard (typically in the
Process perspective) when they are essential to
the strategy.
Finally, the Balanced Scorecard does include
performance in communities as process
perspective objectives when such performance
does contribute to the differentiation in the
strategy (Kaplan and Norton, 2003). This view
matches that articulated by Michael Porter
when he advocates that environmental and
social performance be aligned to and support
the company strategy (Porter and Kramer,
1999, 2006). Occasionally companies do not
want shareholder value to be the unifying
paradigm for its strategy. That’s ok; it’s their
choice. They don’t have to abandon the
Balanced Scorecard methodology and switch to
the stakeholder view. They can use strategy
map and Balanced Scorecard to articulate their
strategy that attempts to simultaneously create
economic, environmental and social value, and
to balance and manage the tensions among
them.
In summary, stakeholder theory was useful to
articulate a broader company mission beyond a
narrow, short-term shareholder value-
maximizing model. It increased companies
‘sensitivity about how failure to incorporate
stakeholder preferences and expectations can
undermine an excessive focus on short-term
financial results (Hustled, 1995). The Balanced
Scorecard, however, incorporates stakeholder
interests endogenously, within a coherent
strategy and value-creation framework, when
outstanding performance with those
stakeholders is critical for the success of the
strategy (Drucker, 1954). The converse is not
true for stakeholder theory. It does not enable
companies to develop a strategy when some of
the existing “stakeholders” are no longer
essential or even desirable in light of changes in
the external environment and internal
capabilities.
Uncertainty and Multi-Period Optimization
Many of the principal-agent models developed
by economists and finance scholars are single-
period in which the firm’s output gets revealed
at the end of the period and no further
managerial (agent) actions are required. In
these cases, contracting on output, such as
measured financial performance, can be
optimal (Howell et al 1987). Or, if financial
performance, measured by end-of-period stock
price or economic value added is a complete
and sufficient statistic for the value managers
have created during the period, then incentive
contracts based on stock prices or economic
value added can also be optimal.
Despite this, many of the actions that managers
take during a period – such as upgrading the
skills and motivation of employees, advancing
products through the research and
development pipeline, improving the quality of
processes, and enhancing trusted relationships
with customers and suppliers – are not revealed
to public investors so that their implications for
firm value cannot be incorporated into end-of-
period stock prices (Huselid, 1995). Also, while
managers may know the amount they spent on
enhancing their intangible assets, they may
have little idea, in the short-run, about how
much value they have created. And, for sure,
such value increases (or decreases if the

- 1878 -
expenditures do not generate future value in
excess of the amount spent) do not get
incorporated into the end-of-period stock price
or residual value (economic value added)
metric.
Dynamic programming teaches that the optimal
actions in the first period of a multi-period
model are far from the optimal actions in the
final period (Berliner, C. and J. Brimson, 1991).
Managers attempting to maximize total
shareholder value over, say, a ten year period
cannot accomplish this goal by optimizing
reported financial performance or stock price,
period-by-period.
The Balanced Scorecard recognizes the
limitation of managing to financial targets alone
in short-time horizons when managers are
following a long-term strategy of enhancing the
capabilities of their customer and supplier
relationships, operating and innovation
processes, human resources, information
resources, and organizational climate and
culture(Huselid, 1995). But because the links
from process improvements and investments in
intangible assets to customer and financial
outcomes are uncertain (recall the financial
problems of several of the early excellent-
quality companies), the Balanced Scorecard
includes the outcome metrics as well to signal
when the long-term strategy appears to be
delivering the expected and desired results.
Shareholder Value and the Principal-Agent
Framework
Not all strategies, however, had been exposed
to the recent advances in operations
management. Many remained focused on
economics and finance, especially the efficient
markets theory from the 1960s and early 1970s
(Fama, 1971). Economists also introduced
principal-agent theory (Jensen-Meckling, 1976,
Harris-Raviv, 1979; Holmström, 1979,
Grossman-Hart, 1983) to formalize the inherent
conflict of interests between hired executive
teams and the companies’ dispersed
shareholders (owners).
The principal-agent adherents urged companies
to provide more financial incentives to senior
executive teams, especially incentives based on
financial performance, the typical “outcome”
measure assumed in principal-agent models.
Efficient markets research; suggested that stock
prices continually reflected all the relevant
public information about companies’
performance, and that executives’
compensation could be better aligned with
owners’ interests through expanded use of
stock options and other equity rewards (Jensen-
Meckling, 1976; Fama-Jensen, 1983). In a
similar vein, some argued for aligning
compensation to better accounting surrogates
of stock market performance, especially
residual income under its new name, economic
value added (Stewart, 1991).
The 1980s saw a huge increase in the linkage
between executives’ pay and incentives to
financial performance (Kaplan and S., 1975). For
the financial economists at the vanguard of this
movement, the idea of senior executives paying
attention to nonfinancial performance metrics
was close to blasphemous.
As Michael Jensen (2001), a leading financial
economics scholar, stated: Balanced Scorecard
theory is flawed because it presents managers
with a scorecard which gives no score – that is
no single-valued measure how they have
performed. Thus managers evaluated with such
a systems have no way to make principled or
- 1879 -
purposeful decisions. Jensen states that
managers cannot be paid by a set of
unweighted performance metrics (Berliner, C.
and J. Brimson, 1991). Ultimately, if a company
wants to set bonuses based on measured
performance, it must reward based on a single
measure (either a stock market or accounting-
based metric) or provide a weighting among the
multiple measures a manager has been
instructed to improve. But linking performance
to pay is only one component of a
comprehensive management system.
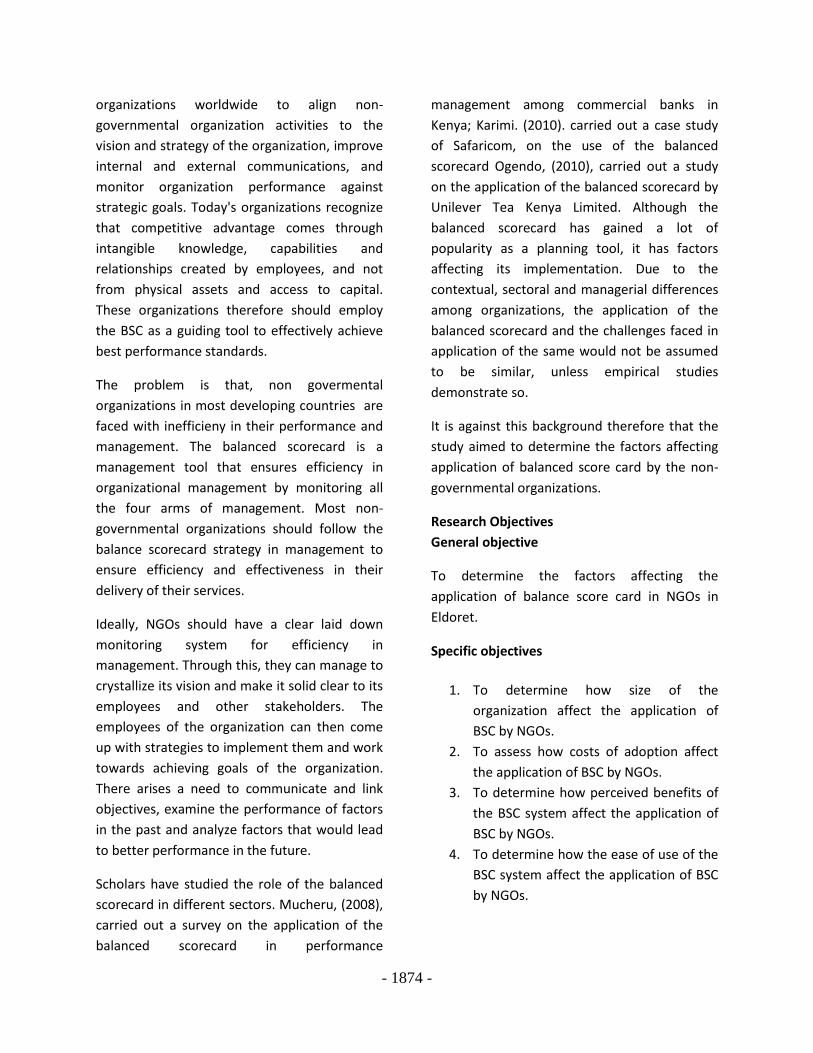
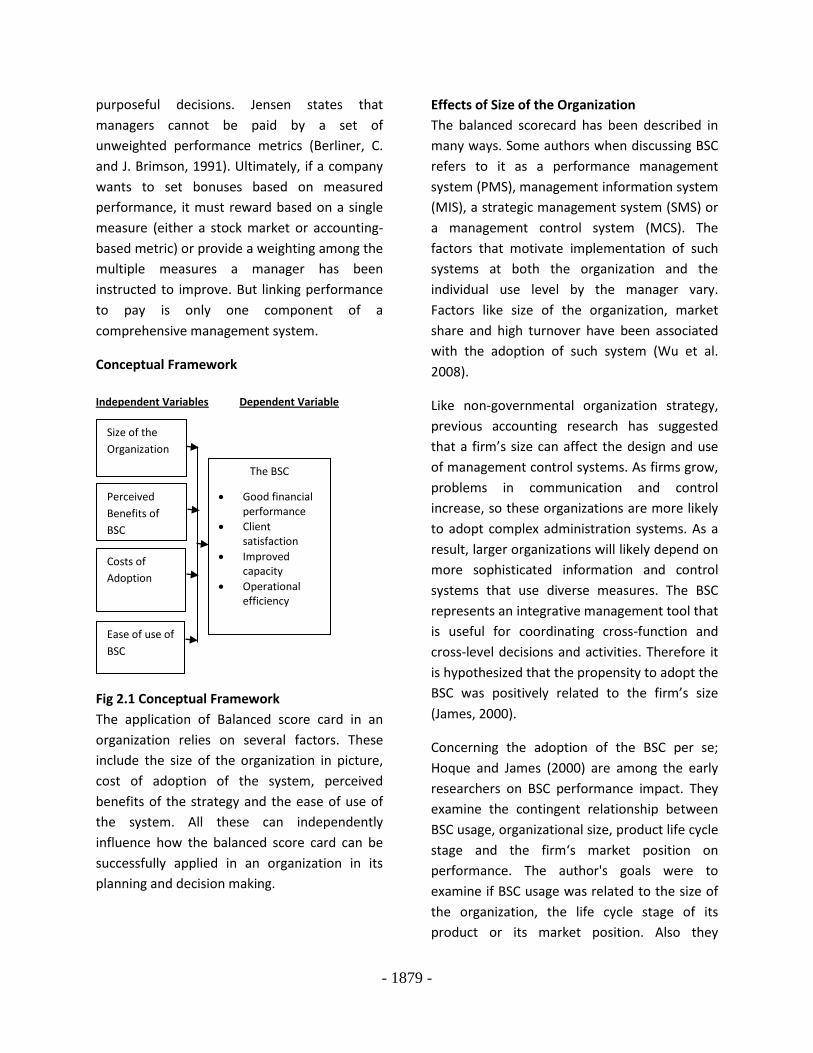
Conceptual Framework
Independent Variables Dependent Variable
Fig 2.1 Conceptual Framework
The application of Balanced score card in an
organization relies on several factors. These
include the size of the organization in picture,
cost of adoption of the system, perceived
benefits of the strategy and the ease of use of
the system. All these can independently
influence how the balanced score card can be
successfully applied in an organization in its
planning and decision making.
Effects of Size of the Organization
The balanced scorecard has been described in
many ways. Some authors when discussing BSC
refers to it as a performance management
system (PMS), management information system
(MIS), a strategic management system (SMS) or
a management control system (MCS). The
factors that motivate implementation of such
systems at both the organization and the
individual use level by the manager vary.
Factors like size of the organization, market
share and high turnover have been associated
with the adoption of such system (Wu et al.
2008).
Like non-governmental organization strategy,
previous accounting research has suggested
that a firm’s size can affect the design and use
of management control systems. As firms grow,
problems in communication and control
increase, so these organizations are more likely
to adopt complex administration systems. As a
result, larger organizations will likely depend on
more sophisticated information and control
systems that use diverse measures. The BSC
represents an integrative management tool that
is useful for coordinating cross-function and
cross-level decisions and activities. Therefore it
is hypothesized that the propensity to adopt the
BSC was positively related to the firm’s size
(James, 2000).
Concerning the adoption of the BSC per se;
Hoque and James (2000) are among the early
researchers on BSC performance impact. They
examine the contingent relationship between
BSC usage, organizational size, product life cycle
stage and the firm‘s market position on
performance. The author's goals were to
examine if BSC usage was related to the size of
the organization, the life cycle stage of its
product or its market position. Also they
Size of the
Organization
Perceived
Benefits of
BSC
Costs of
Adoption
Ease of use of
BSC
uuuuuihugytr
sd
The BSC
Good financial performance
Client satisfaction
Improved capacity
Operational efficiency

- 1880 -
wanted to establish if this relationship had an
impact on the performance of the company
(Bergeron, 1995).
The results from the study show that greater
BSC usage was associated with large
organization. Also non-governmental
organizations with product at an early and
growth stage of their life cycle are prone to use
BSC. The authors further observed that whereas
BSC usage is associated with the size of the
company; no relationships however exist
between BSC usage and market strength of the
firm. The study concluded that large firms with
a strong market position with new products in
their product portfolios use the BSC more. On
the other hand, Malina and Selto (2001) studied
how effective BSC can serve as a
communication vessel and a management
control tool. This study is one amongst the early
researches to show that BSC can be an effective
communication tool. Although Kaplan and
Norton (1996) commended the using BSC as a
tool for communication; this study echoes the
fact that BSC presents an opportunity to
develop, communicate and implement strategy.
Kaplan and Norton (1996) hinted that Strategy
focused organization were using this tool to
communicate objectives, measures and
organizational values to member. The results
from the study indicated that BSC is an effective
tool for setting objectives and measures. Also,
BSC can influence lower level managers to
conform their actions to the overall goals of the
organization (Creelman, 1998).
Effects of Benefits of BSC
How a manager perceives information from
new management information sources may
influence the way they use the BSC. Top
managers generally have a dominant position in
shaping an organization’s strategy,
organizational design, and management
systems and their perceptions of certain things
influence key decision making policies (Child
1972; Hambrick and Mason 1984). Having an
influential position in the organization and
being accountable for the effectiveness of the
company’s strategy and operations, their
involvement has been found to be one of the
most important determinants for the adoption
of innovations in general, and the adoption and
development of management tools and
practices in particular (Frambach, Barkema,
Nooteboom and Wedel 1998). Top
management involvement may help to create
commitment and generate organizational
support for an innovation, which will positively
affect the adoption of BSC. This should also
apply to the BSC. Although important,
leadership influence is restrained and
influenced by many internal and external
factors. A key factor is organizational structure.
Centralization refers to the inverse of the
amount of delegation of decision-making
authority throughout an organization and the
extent of participation by organizational
members in decision-making (Aiken and Hage,
1968).
Centralization has been argued to have an
ambiguous effect on innovation adoption
decisions (Wiersman (2009). Centralization may
hinder initial adoption because of
organizational rigidness. However, a high level
of centralization may help to create ready
acceptance of the innovation by the different
levels and functions of the organization once
top management has accepted it, so a positive
interaction between top management
involvement and centralization may exist. The
positive influence from top management
involvement will be much more effective in a
centralized than in a decentralized organization.

- 1881 -
High centralization allows for more speedy
dissemination of the early adoption than is
possible in decentralized organizations
(Burgess, 1995).
Almost two decade following the introduction
of BSC; a considerably larger amount of studies
have been carried out on the perceived
usefulness of the BSC system by managers.
Malina and Selto (2000) concluded in their
study of a large manufacturing organization
that the BSC was an effective tool for
communicating the goals of the organization to
its entire member. Also, Malmi (2001) has
identified five reasons that appear to influence
the decision of non-governmental organizations
in Finland to adopt the BSC. The pursuit of
quality awards such as Total Quality
Management (TQM ) certification, difficulties
associated with executing strategy, problems
related to implementing change within the
organization, a change from the budgetary
practice to a BSC framework and lastly, a mere
fashion sweeping the organizational world.
Likewise, Crabtree and Aaron (2008) found that
many firms adopt BSC as a way to implement
strategy and measure firm performance
(Crabtree et. al, 2008).
Wiersman (2009) has argued that although a
firm might decide to implement an Information
System, use of it by individual managers will still
differ. This is because individual managers have
their idiosyncrasies. Some Managers are more
innovative than others. That is to say,
innovative managers are quick to adopt new
accounting systems whereas; their counterparts
(less innovative managers) are not. Therefore
how the individual manager‘s use BSC will differ
greatly among managers. He further observed
that managers use BSC to support their
decisions making and rationalism. Decision
support means they use it in two ways. The first
is for problem solving and the other for decision
rationalizing. To use BSC to solve problems
means that managers use BSC report to justify
that the reported measures are accurate based
on the cause and effect logic of the BSC model
(Wiersman, 2009).
Effect of Costs of Adoption of BSC
Hewlett (1999) suggests that most strategic
plans are hurdled by the financial constraints
during the time of their implementation. It is
important, particularly at the non-governmental
organization level, to integrate non-financial
measures such as market share or market
growth in the budget, so that one can better
assess the extent to which improved
competitive strength is being achieved as well
as the extent to which deviations are due to
changes in the non-governmental organization
attractiveness. Also, since most budgets will be
based on operating departments, it is important
to superimpose key non-dollar factors that
would signal whether the strategic programs
are proceeding on schedule. The concern for
financial measurement accuracy in the budgets
seems to have jeopardized the concern for
relevance in some non-governmental
organizations' budgets (Hewlett, 1999).
The various program alternatives need to be
economically evaluated in two respects. First,
there are different ways to achieve a particular
strategic implementation action and these
alternatives should be compared. A cost/benefit
analysis is needed, but unfortunately is done
too often on narrow grounds. By only looking at
the financial costs and benefits without taking a
strategic risk-assessment into account one
might easily pursue the less favorable project or
fail to search for less risky alternatives (Porter
1985).

- 1882 -
To assess risk in this strategic context three
steps of analysis must be carried out: a specific
assessment of which budgetary factors might
significantly affect the strategic plan’s success;
an assessment of the degree of predictability of
each factor; and an assessment of one's own
potential for responding to a particular
environmental development to ameliorate
adverse effects or to take advantage of
favorable developments. Thus, the choice of
plan alternative should put major emphasis on
maintaining strategic flexibility (Eisenstat 1993).
Unfortunately, a too narrow financial analysis
typically seems to take place which does not
pay proper attention to maintaining strategic
flexibility. The second aspect of the economic
evaluation of the strategic planning activities
relates to the aggregation of strategic programs
into an overall "package" for the division. Many
non-governmental organizations do not take
existing programs into account when choosing
the overall "package" of strategic programs;
thus, the continued relevance of existing
strategic programs is not examined (Kaplan,
2005).
However, even if a "zero-base" approach has
been taken to the program package evaluation,
another problem seems to be that the package
is chosen according to some cut-off point on a
cost-benefit ranking, without paying proper
attention to how the combination of strategic
programs provides the direction agreed upon
for the non-governmental organization during
the objectives-setting stage. Too often, the
strategic programming activities are left open-
ended without proper assessment of overall
non-governmental organization strategy impact
and consistency with the non-governmental
organization objectives. When a set of strategic
programs has been decided upon it is implied
that resource allocations have been made for
these programs, often for several years into the
future. Without providing for the necessary
assets and strategic expenditures a strategic
program cannot be implemented (Eisenstat
1993).
Premchand (2004) states that implementation
of the strategic plan such as BSC requires an
advance program of action evolved within the
parameters of the ends of the budget and
means available adequate (Premchand, 2004).
This framework, he further states, should
include the following; identification and
enumeration of the implementation tasks,
assessment of the suitability of the means of
achieving the ends and prospects for the
improvement of means if they are less than
adequate (Premchand, 2004). The budgetary
and economic tasks are rendered operational
through the administrative process that
comprises four major interrelated phases of
work namely; an allocation system under which
expenditure is controlled by release of funds,
(Muleri, 2001).
Effect of Ease of Use of BSC
Another factor that might influence the
manager to use BSC is how they perceive their
company‘s BSC application software to be easy
to use for them. In the information system
literature different theories are used to explain
the way user feels when confronted to use
Information Systems. The main theory in this
regard, is the Technology Acceptance Model
(TAM) developed by (Davis 1989). The model
explains that the perceived usefulness and ease
of use of a technology by the user affect their
behavioral intentions to use the technology and
how they subsequent use the technology. Over
the years, the BSC concept has been
transformed into various powerful application
software tools (Davis et al. 2004).

- 1883 -
The advancement in modern technologies
development has encouraged the development
of different kinds of BSC applications software.
Before, the BSC may have been implemented
barely using simple spreadsheet applications
like MS Excel or Access. However, given the
complex nature of modern forms of
organization and the need to report real time
information has made it difficult to implement
BSC with these simple applications. As a result,
there are new BSC software applications
developed to facilitate its implementation.
Technology impact in the form of BSC
applications software is examined to see how
ease of use and their perceived usefulness of
the tool affect the manager‘s decision to use
BSC. When users are introduced to a new
technology, factors like ease of use of the
technology motivate them to use the system
(Whalley, 2006).
In most organizations, Information technology
investment is important and attracts much of a
company‘s budget since most non-
governmental organizations use IT applications
to build, sustain and extend their competitive
strength. They also use them to improve
decision making speed, accuracy and
comprehensiveness including to coordinate
disperse group within the organization. In our
knowledge-based economy, IT application tools
help in serving higher customer‘s expectations,
tightening control over personnel and
expenditure and also to comply with
governmental reporting regulations. The
proliferation of diverse Information technology
application in non-governmental organizations
is making the integration of such IT tools
difficult to use. These applications integration
usually become too complex for the users and
may affect their usage of the system especially
concerning usage by senior executive with very
little time to learn new skills. Therefore, the
influence of technology is used in this study as a
variable to test how the PU and PEOU of the
technology by the manager and their
satisfaction with their particular company BSC
applications software systems can motivate
them to use BSC. They believe is that their
satisfactions with their non-governmental
organizations BSC applications software‘s thus
influence their use of the system and the extent
to which they will eventually use it after (Niven,
2002).
Therefore, we use two constructs of the
technology acceptance model (TAM); Perceive
usefulness (PU) and perceived ease of use
(PEOU) of the BSC application software to
evaluate the user‘s satisfaction with their
company‘s BSC application software systems.
Because, the way the user perceives the system
as being useful in helping them perform their
job will affect how they use the system. That is,
when a person believes that by using the new
system it will enhance her job performance,
they definitely will use it more often. Thus, the
perceive ease of use (PEOU) and usefulness
variables explain that when users of
information technology feel at ease using the
technology they most probably like it and want
to use it more (Bergeron, 1995).
RESEARCH METHODOLOGY
Introduction
This chapter provides a discussion of the outline
of the research methodology that was used in
this study. It focuses on the research design,
population of study, sample and sampling
techniques, data collection methods and comes
to a conclusion with the data analysis and data
presentation.

- 1884 -
Research Design
Research design is considered as a blueprint for
research, dealing with at least four problems:
which questions to study, which data are
relevant, what data to collect, and how to
analyze the results. The best design depends on
the research question as well as the orientation
of the researcher (Robson, 2003). In this
research, case study research design was be
used to assess the factors affecting application
of balanced score card by NGOs in Eldoret
town.
Sample Size
Newman (2000) explains that the important
factor to consider when determining a sample
size is to keep it manageable enough. This
enables the research to derive from the
population detailed data within reasonable
periods and efficient resource use. The research
shall ensure a high degree of correspondence in
the sampling population to enhance accuracy.
Purposeful sampling shall be useful because the
information about application of BSC lies with
specific categories of people;management team
and staff members involved in strategic
planning and decision making. A visit to the
county government offices revealed that in Non
Governmental Organizations operating in
Eldoret town most of them have an average of
5 members in the management team and there
were 11 Ngos within Eldoret town.
Data Collection
The study used primary data collected from the
management and staff members of the various
sampled organizations. The questionnaires
were administered to the respondents who
included managers, their deputies, a member
from each of the core-non-governmental
organization areas of the organizations involved
in decision making and members from the
support service departments. Most of these
organizations in Eldoret such as The Kenya Red
Cross Society’s, APHIA II Rift Valley, USAID,
Open Arms International and Mercy Corps
Society just to name a few have core non-
governmental organization areas, around which
its activities revolve: Disaster Management,
Health and Social Services, Water and
Sanitation, Organizational Development, Supply
Chain and Finance. While, support services of
these organizations include the Public Relations,
Human Resources, Monitoring and Evaluation,
Training, Internal Audit, ICT, Legal Affairs and
Security. The questionnaires had structured
open ended questions to encourage the
respondent to give an in-depth response
without feeling held back in revealing any
information.
Data Analysis
Data analysis is the process of creating order,
structure and meaning to the mass of
information collected (Mugenda, 2003). Once
the data had been collected the responses
underwent coding before being entered into
computer statistical software for analysis to
develop inferences for the subjects of study.
The descriptive statistics used included
frequencies and percentages to determine the
views of the respondents regarding the topic
under study. Frequencies and percentages were
used for easier comparison of the responses
collected from the respondents and data was
then presented using graphs, tables and charts.
DATA ANALYSIS, RESULTS AND DISCUSSIONS
Introduction
This chapter presents the findings of the study.
Data was collected and analysed through the
use of both descriptive and inferential statistics.
The data was then presented in tables and
graphs and the findings discussed. Data findings
- 1885 -
were then linked with the researcher’s opinion
in relation to the existing knowledge for the
intricate interpretation and discussion. This
chapter is organized in sections beginning with
presentation of respondents’ background
information and the subsequent sections have
been organized following the research
objectives. A total of 55 respondents were
involved in filling the questionnaires. These
were self administered questionnaires.
Response Rate
The researcher sought to find out the response
rate of the respondents. All the 55
questionnaires administered were filled and
returned. This represented a response rate of
100 %. This response rate was considered
adequate for reliability and generalization of
the study.
Background Information of the Respondents
The study sought to assess the background
information of the respondents in terms of their
gender, age, their level of education and their
level of experience in the organization. The
results were as tabulated below.
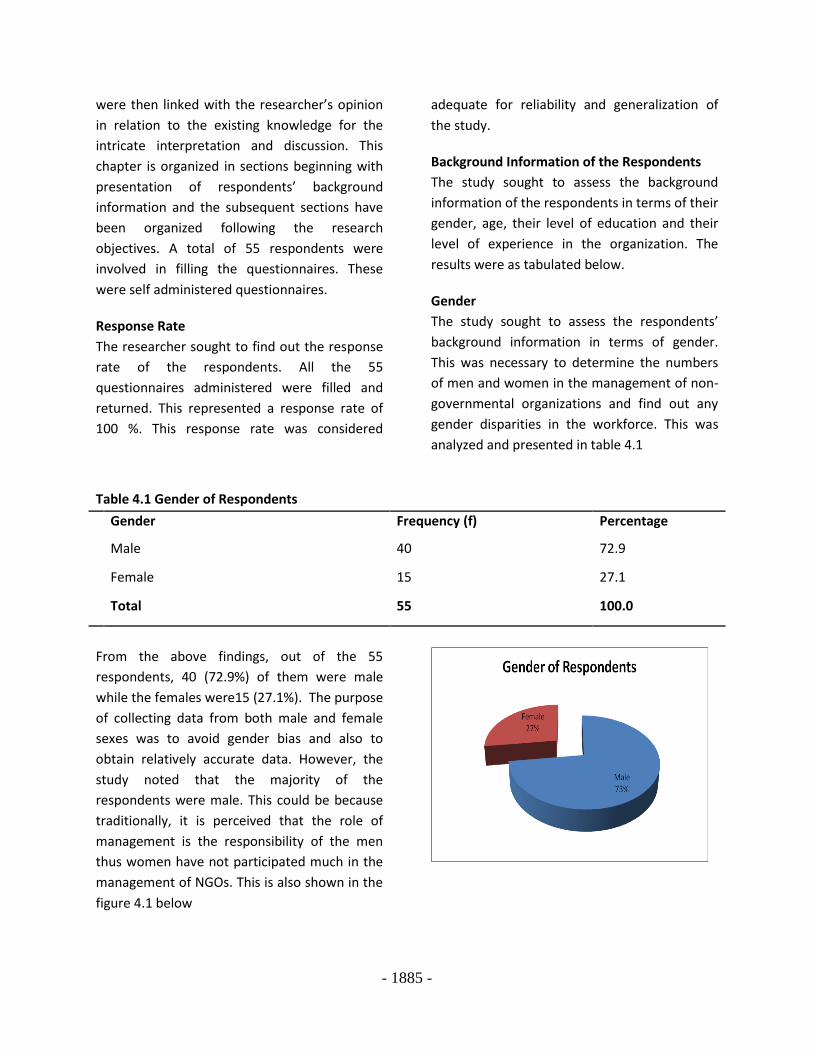
Gender
The study sought to assess the respondents’
background information in terms of gender.
This was necessary to determine the numbers
of men and women in the management of non-
governmental organizations and find out any
gender disparities in the workforce. This was
analyzed and presented in table 4.1
Table 4.1 Gender of Respondents
Gender Frequency (f) Percentage
Male 40 72.9
Female 15 27.1
Total 55 100.0
From the above findings, out of the 55
respondents, 40 (72.9%) of them were male
while the females were15 (27.1%). The purpose
of collecting data from both male and female
sexes was to avoid gender bias and also to
obtain relatively accurate data. However, the
study noted that the majority of the
respondents were male. This could be because
traditionally, it is perceived that the role of
management is the responsibility of the men
thus women have not participated much in the
management of NGOs. This is also shown in the
figure 4.1 below

- 1886 -
Figure 4.1 Gender of the Respondents
Ages of the respondents
It was necessary to also assess the respondents’
information in terms of age. The ages were
segmented into a five year difference in order
to accommodate respondents of every age
bracket. This was presented on table 4.2.
Table 4.2 Age range of respondents
Age range Frequency (f) Percentage (%)
25-30 3 5.2
31-35 19 34.4
36-40 17 30.8
41-46 6 10.6
46 and above 11 19.0
Total 55 100.0
According to the table 4.2, majority of the
respondents 19 (34.4 %) were aged between 31
– 35 years. 17 (30.8 %) were aged between 36
and 40 years, 11 (19.0 %) were aged 46 years
and above, 6 (10.6 %) were aged between 41
and 46 years and only 3 (5.2 %) were aged
between 25 and 30 years. From the table, it is
evident that most of the respondents are youth
aged between 31 and 35 years. These youth are
physically fit and are capable of doing all the
management functions including going out to
the field to manage disasters around the County
of Uasin Gishu.
Figure 4.2 Age of the Respondents
Level of education
The researcher sought to establish the level of
education of the respondents. This statistic was
important so that views of people of different
academic levels could be found as the levels of
academics influences the reasoning of people.
The findings were as presented on the figure
4.3 below.
Table 4.3 Level of Education of the Respondents
Level of Education Frequency (f) Percentage (%)
Certificate 2 3.6
Diploma 17 30.9
Degree 31 56.4
Others 5 9.1
Total 55 100.0

- 1887 -
From the data, 31 (56.4 %) were of degree level
of education, 17 (30.9%) were of diploma level
of education, 5 (9.1 %) had other qualifications
such as CPA and masters level of education and
only 2 (3.6 %) were of certificate level. The
majority of the respondents were of degree
level of education as most NGOs require a
degree as the basic need for employment.
Figure 4.3 Level of Education of Respondents
Level of work experience of the respondents
In order to obtain intensive and extensive
perspective in line with issues based on
performance of management and the
application of the BSC model in the
organization, the researcher requested the
respondents to indicate their work experience
in the NGO. The findings were analyzed and
presented in the figure 4.4
Level of Experience Frequency (f) Percentage (%)
Less than 3 years 36 65.4
Between 4-6 years 12 21.6
Between 7-9 years 4 7.2
10years and above 3 5.4
Total 55 100.0
From the study, it was established that 36 (65.4
%) of the respondents had a 3 year experience
working with the current organization, 12 (21.6
%) of the respondents had worked with the
organization for a period between 4 and 7
years. 4 (7.2%) had worked with the
organization for a period of between 7 and 10
years whereas only 3 (5.4 %) of the respondents
had over 10 years experience with the station.
This could be interpreted to mean that most of
the respondents were young employees with
less than 3 years of experience. This statistic can
be ascertained with the ages of the
respondents.

- 1888 -
Figure 4.4 Level of Experience of Respondents
Specific Information
The size of the organization and the
application of the BSC
Objective one of the study sought to establish
how the size of the organization affects the
application of the BSC in the management of
the organization. The findings were analyzed
and presented in the table 4.5
Table 4.5 The size of the organization and the application of the BSC
Key: SA: Strongly Agree, A: Agree, N: Neutral, D: Disagree, SD: Strongly Disagree, T: Total, M: Mean, F:
Frequency, %: Percentage
From the study findings (table 4.5), it was found
that majority of the respondents 82% were of
the opinion that the organization is large hence
there’s need for a sophisticated information
control system such as BSC, 76% of them were
of the opinion that the organization has great
product and services strength hence need for
BSC while 70% of them agreed with the fact
that the organization has great opportunity for
growth and development hence need for BSC.
Perceived benefits and the application of BSC
in NGOs
The study sought to establish the perceived
benefits on application of BSC in NGOs. The
findings were analyzed and presented in the
table 4.6
Table 4.6 perceived benefits on application of BSC in NGOs
Key: SA: Strongly Agree, A: Agree, N: Neutral, D: Disagree, SD: Strongly Disagree, T: Total, M: Mean, F:
Frequency, %: percentage
Statements SA A N D SD T M
Organization is large hence there’s need for a sophisticated
information control system such as BSC
F 21 27 2 1 4 55 4.1
% 38.9 49.8 3 1 7.4 100 82
The organization has great product and services strength
hence need for BSC
F 15 28 4 3 5 55 3.8
% 27.1 50.7 7.4 5.9 8.9 100 76
The organization has great opportunity for growth and
development hence need for BSC
F 11 25 6 8 5 55 3.5
% 20.2 45.3 10.3 14.3 9.9 100 70

- 1889 -
From the study findings (table 4.6), it was found
that majority of the respondents 62% were of
the opinion that BSC is perceived as a useful
tool for communication and decision making,
60% of them were of the opinion that the BSC is
perceived to enhance competitive strength of
the organization while 54% of them said that
the BSC is perceived to improve service delivery
through customer perspective.
The ease of use of the BSC system in NGOs
The researcher investigated the ease of use of
the BSC system in NGOs. The findings were
analyzed and presented in the table 4.7
Table 4.7 the ease of use of the BSC system in NGOs
Key: SA: Strongly Agree, A: Agree, N: Neutral, D: Disagree, SD: Strongly Disagree, T: Total, M: Mean, F:
Frequency, %: percentage
Statements SA A N D SD T M
BSC is perceived as a useful tool for communication
and decision making
F 11 19 7 6 12 55 3.1
% 20.7 33 12.8 10.8 22.7 100 62
BSC is perceived to enhance competitive strength of
the organization
F 9 17 8 11 10 55 3.0
% 17.7 30 14.3 19.7 18.2 100 60
BSC is perceived to improve service delivery through
customer perspective
F 3 19 6 7 20 55 2.7
% 5 32.5 11.3 12.3 34 100 54
Statements SA A N D SD T M
Technological impact in the organization has
enhanced the application and usage of BSC
F 13 26 4 7 5 55 3.7
% 25.6 48.3 9.4 4.9 11.8 100 74

- 1890 -
The study findings on table 4.7, showed that
majority of the respondents 74 % confirmed
that the technological impact in the
organization has enhanced the application and
usage of BSC, while 66% of the respondents
said that the Information from the BSC system
is clear and understandable and 64% of them
agreed with the fact the organizations’ BSC
system is a flexible program to apply and is easy
to be skilful in it.
Effects of costs on the application of BSC in
NGOs
The researcher sought to find out the effects of
costs on the application of BSC in NGOs. The
findings were analyzed and presented in the
table 4.8
Table 4.8 Effects of costs on the application of
BSC in NGOs
Key: SA: Strongly Agree, A: Agree, N: Neutral, D:
Disagree, SD: Strongly Disagree, T: Total, M:
Mean, F: Frequency, %: percentage
The organizations’ BSC system is a flexible program
to apply and is easy to be skillful in it
F 8 24 4 11 8 55 3.2
% 13.8 43.8 7.9 19.7 14.8 100 64
Information from the BSC system is clear and
understandable
F 9 23 10 6 7 55 3.3
% 16.3 39.9 17.7 12.8 13.3 100 66
Statements
SA
A
N
D
SD
T
M
Non financial measures are instead used in
evaluating the applicability of BSC in the
organization
F 18 28 6 1 2 55 4.0
% 32 49.3 11.3 3 4.4 100 80
The organization does cost-benefit analysis of using
BSC and opts for other strategies
F 11 20 12 7 5 55 3.5
% 20.2 37.4 21.2 12.3 8.9 100 70

- 1891 -
From the study findings (table 4.8), it was found
that majority of the respondents 80% were of
the opinion that the non financial measures are
instead used in evaluating the applicability of
BSC in the organization, 70% of them were of
the opinion the organization does cost-benefit
analysis of using BSC and opts for other
strategies while 56% of them said that the risk
of using BSC is higher than the benefit hence
other alternatives sought.
BSC in the Organization
The study sought to establish the state of
application of BSC in the respondents,
organization. The findings were analyzed and
presented in the table 4.9
Table 4.9: BSC in the Organization
Key: SA: Strongly Agree, A: Agree, N: Neutral, D: Disagree, SD: Strongly Disagree, T: Total, M: Mean, F:
Frequency, %: percentage
The risk of using BSC is higher than the benefit
hence other alternatives sought
F 7 15 9 8 16 55 2.8
% 12.3 28.6 16.3 12.8 30 100 56
Statements SA A N D SD T M
BSC is a valid strategic management tool for not for
profit organizations by enhancing financial
performance
F 14 17 13 7 4 55 3.5
% 25.6 30.5 23.2 13.3 7.4 100 70
BSC is a valid performance management tool in
enhancing the satisfaction of clients other
strategies
F 6 24 11 12 2 55 3.4
% 12.3 43.3 19.7 20.2 4.4 100 68
BSC assists the firm in improving the capacity and
the scale of operation
F 7 24 10.0 12 2 55 3.4
% 13.8 43.8 17.7 21.7 3 100 68

- 1892 -
From the study findings on table 4.9, it is
evident that majority of the respondents (70%)
said BSC is a valid strategic management tool
for not for profit organizations by enhancing
financial performance while 68% agree BSC is a
valid performance management tool in
enhancing the satisfaction of clients,68%agree
BSC assists the firm in improving the capacity
and the scale of operation.Also, 68% of the
respondents were of the opinion that, BSC is a
useful tool in improving the efficiency of the
organization.
SUMMARY, DISCUSSION, CONCLUSION AND
RECOMMENDATIONS
Introduction
This chapter presents a summary of findings,
discussions, conclusions reached and
recommendations following the objectives of
the study. The study sought to find out factors
affecting the application of Balanced Score Card
by NGOs: Case Study Of Eldoret Town. This
study set out to determine how size of the
organization affect the application of BSC by
NGOs, to assess how costs of adoption affect
the application of BSC by NGOs, to evaluate the
extent to which perceived benefits of the BSC
system affect the application of BSC by NGOs
and to determine how the ease of use of the
BSC system affect the application of BSC by
NGOs.
Summary of the findings
Based on the responses of the study, the
researcher summarized the findings as shown in
the table 5.1
Table 5.1: Summary of Findings
Objectives of the study Findings
1. The size of the organization and
the application of BSC by NGOs,
From the study findings (table 4.4), it was found that majority of
the respondents 82% were of the opinion that the organization
is large hence there’s need for a sophisticated information
control system such as BSC, 76% of them were of the opinion
that the organization has great product and services strength
hence need for BSC while 70% of them agreed with the fact that
the organization has great opportunity for growth and
development hence need for BSC in strategy.
2. Perceived benefit and the
application of BSC in NGOs
In respect to this, the study revealed that majority of the
respondents 62% were of the opinion that BSC is perceived as a
useful tool for communication and decision making, 60% of
them were of the opinion that the BSC is perceived to enhance
BSC is a useful tool in improving the efficiency of
the organization
F 12 22 6 8 7 55 3.4
% 21.7 39.9 11.3 14.3 12.8 100 68

- 1893 -
competitive strength of the organization while 54% of them said
that the BSC is perceived to improve service delivery through
customer perspective.
3. The costs of adoption and the
application of BSC by NGOs,
The study found out that majority of the respondents 80% were
of the opinion that the non financial measures are instead used
in evaluating the applicability of BSC in the organization, 70% of
them were of the opinion the organization does cost-benefit
analysis of using BSC and opts for other strategies while 56% of
them said that the risk of using BSC is higher than the benefit
hence other alternatives sought
4. The ease of use of the BSC system
affect the application of BSC by
NGOs
From the findings, showed that majority of the respondents 74
% confirmed that the technological impact in the organization
has enhanced the application and usage of BSC, while 66% of the
respondents said that the Information from the BSC system is
clear and understandable and 64% of them agreed with the fact
the organizations’ BSC system is a flexible program to apply and
is easy to be skilful in it.
5. Application of the BSC in the
Organization
that majority of the respondents (70%) said BSC is a valid
strategic management tool for not for profit organizations by
enhancing financial performance while 68% and BSC is a valid
performance management tool in enhancing the satisfaction of
clients other strategies, BSC assists the firm in improving the
capacity and the scale of operation. However, 68% of the
respondents were of the opinion that, BSC is a useful tool in
improving the efficiency of the organization.
Discussion of the Findings
This section gives a detailed discussion on the
findings of the study. The idea of factors
affecting the application of Balanced Score Card
by NGOs has existed for many years and has
revolved largely on strategic management and
other perceived benefits of the BSC. It has been
known that BSC plays a significant role in the
management of organizations.
The BSC emphasizes performance
measurement and management in four key
business areas. These four perspectives provide
a comprehensive evaluation of the organization
than the traditional emphasis on tangible and
financial assets of the organization. This is
because learning improves the internal business
processes; this improvement leads to improved
customer satisfaction; which in turn leads to
improved financial results. The BSC emphasizes
improvement and if an organization does not
continually improve, it will eventually lose out
to competitors that do.
Incorporating these perspectives in the BSC
offers a framework for translating strategic
objectives into performance measurements
that gauge the effects of implemented
strategies and provide feedback on the
performance of strategic initiatives. The BSC
offers some useful generic performance

- 1894 -
measurements that apply to practically all
organizations.
Firms, small or large, need to know how they
measure up to their own goals and standards,
and the BSC can give them the advantage they
need to evaluate themselves accurately and, as
a result, place themselves in a better position to
compete. The main goal for all businesses is to
manage their overall performance so that they
can make a profit. Consequently, this study
assessed the factors affecting the application of
Balanced Score Card by NGOs: Case Study of
Eldoret Town
Effects of Size of the Organization
According to the study findings on table 4.6 the
size of the organization affects the application
of BSC as agreed by a majority of the
respondents. These outcomes concur with the
findings by Wu et al. 2008, who argued that the
factors that motivate implementation of such
systems at both the organization and the
individual use level by the manager vary.
Factors like size of the organization, market
share and high turnover have been associated
with the adoption of such system.
In addition, James (2000) argued that the BSC
represents an integrative management tool that
is useful for coordinating cross-function and
cross-level decisions and activities. Therefore it
is hypothesized that the propensity to adopt the
BSC was positively related to the firm’s size.
Perceived benefits of the BSC system and the
application of BSC by NGOs.
The study found out that the perceived benefits
of the BSC system affects the application of BSC
by NGOs as confirmed by the 62% agreement of
this fact. This relates to a study by Child (1972),
Hambrick and Mason (1984) who conclude that
top managers generally have a dominant
position in shaping an organization’s strategy,
organizational design, and management
systems and their perceptions of certain things
influence key decision making policies.
Frambach, Barkema, Nooteboom and Wedel
(1998) also confirm that having an influential
position in the organization and being
accountable for the effectiveness of the
company’s strategy and operations, their
involvement has been found to be one of the
most important determinants for the adoption
of innovations in general, and the adoption and
development of management tools and
practices in particular Top management
involvement may help to create commitment
and generate organizational support for an
innovation, which will positively affect the
adoption of BSC.
Wiersman (2009) has also argued that although
a firm might decide to implement an
Information System, use of it by individual
managers will still differ. This is because
individual managers have their idiosyncrasies.
Some Managers are more innovative than
others. That is to say, innovative managers are
quick to adopt new accounting systems
whereas; their counterparts (less innovative
managers) are not. Therefore how the
individual manager‘s use BSC will differ greatly
among managers. He further observed that
managers use BSC to support their decisions
making and rationalism.
Effect of Costs of Adoption of the BSC
The literature of Hewlett (1999) suggests that
most strategic plans are hurdled by the financial
constraints during the time of their
implementation. It is important, particularly at
the non-governmental organization level, to
integrate non-financial measures such as
market share or market growth in the budget,

- 1895 -
so that one can better assess the extent to
which improved competitive strength is being
achieved as well as the extent to which
deviations are due to changes in the non-
governmental organization attractiveness. This
study agrees with his findings as indicated by
the 74% agreement of this opinion by the
respondents.
The various program alternatives need to be
economically evaluated in two respects
according to Porter (1985). First, there are
different ways to achieve a particular strategic
implementation action and these alternatives
should be compared. A cost/benefit analysis is
needed, but unfortunately is done too often on
narrow grounds.
Kaplan (2005) claimed that economic evaluation
of the strategic planning activities relates to the
aggregation of strategic programs into an
overall "package" for the division. Many non-
governmental organizations do not take existing
programs into account when choosing the
overall "package" of strategic programs; thus,
the continued relevance of existing strategic
programs is not examined
Effect of Ease of Use of BSC
According to this study, 80% of the respondents
showed positive feeling towards the use of the
BSC provided it was made easy to use. The main
theory in this regard, is the Technology
Acceptance Model (TAM) developed by (Davis
1989). The model explains that the perceived
usefulness and ease of use of a technology by
the user affect their behavioural intentions to
use the technology and how they subsequently
use the technology. Over the years, the BSC
concept has been transformed into various
powerful application software tools.
Davis et al. (2004) claims that Information
technology investment is important and attracts
much of a company‘s budget since most non-
governmental organizations use IT applications
to build, sustain and extend their competitive
strength. They also use them to improve
decision making speed, accuracy and
comprehensiveness including to coordinate
diverse groups within the organisation.
Application of BSC in organization
The findings indicate that, 70% of the
respondents agree that efficiency in the
management and operational effectiveness in
the organization is attributed to the adoption of
BSC. This however, shows that most NGOs
operating in Eldoret town have not utilised it
effectively.
The research provides clear evidence on the
benefits that an organization can gain after
implementing a BSC, both financial and non-
financial. It must be mentioned though that
much of the research focuses more on the
implementation phase of the BSC, and less on
the subsequent evaluation of its use.
Another factor that should be kept in mind is
the way performance is reported, considering
some of the researchers in the review are
skeptical when tracing the performance
improvements to the BSC. Caution should be
called for when relying on self-reported
performance results without using other data
sources for triangulation.
The overall findings are answering the research
question by confirming a positive influence of
the BSC adoption on organizational
performance. The reported performance
improvements are not limited to financial
measures, but researchers show an equal focus
and interest also in the non-financial ones,

- 1896 -
contrary to other findings in the literature
(Capelo and Dias, 2009; Tapinos et al., 2008;
Chenhall, 2005).
Aligned with the findings of Kaplan and Norton
(2001c), Speckbacher et al. (2003) and Ukko et
al. (2007), the findings of the research
suggested that tying incentives to the BSC
contributes positively to performance
improvement, by motivating the employees to
understand and achieve strategic goals. A
positive correlation is also found between the
maturity of the implemented BSC and
performance, as suggested also by other studies
(Evans, 2004; Ukko et al., 2007).
Conclusion of the Study
Leadership support and employees involvement
are also found to be important success factors
in BSC implementation and performance
improvements.
A properly implemented and successful BSC,
having the commitment and involvement of
both employees and managers and being used
as a strategic management system that aligns
the entire organization to achieve its strategic
goals, will eventually lead to a wide variety of
performance improvements, both financial and
non-financial: effective strategy
implementation and communication,
operational efficiency, improved financial
performance, effective decision- making,
increased customer and employee satisfaction
and improved image and branding
Recommendation
The research recommends that:
i. There is need to ensure that the BSC model
is adopted according to the size of the
organization. Large and complex
organizations should simplify their
structures to ensure that all the
management employees of the organization
are confident in the applying the model into
management.
ii. There are many benefits of BSC to every
organization hence management must be
enlightened on these benefits so that they
can adopt it.
iii. Organizations should provide enough
resources especially for funding further
comprehensive sensitization on the
importance of balanced score card in
relation to strategy.
iv. There is need for a vigorous capacity
building program to improve the
appreciation and usage of balanced score
card
Implications for further studies
The researcher suggests the following areas for
further studies;
i. Effectiveness of balance scorecard on
employee motivation
ii. Challenges faced by the management in the
application of balance scorecard
iii. Factors that influence the adoption of the
balance scorecard in other organizations
iv. An assessment of other factors that
influence adoption of balance scorecard

- 1897 -
REFERENCES
Bedford, D.S., Brown, D.A., Malmi, T. & Sivabalan, P. (2006). Balanced scorecards design and
performance impacts: some Australian evidence. Working paper University of Technology Sydney,
Helsinki School of Economics.
Bergeron, F., Raymond, L., Rivard, S. & Gara, M. (1995).Determinants of EIS use: Testing behavioral
model, Decision Support Systems, vol. 14, no. 2, pp. 131-146.
Burgess, R.L., Mackintosh, N.B. (1995).The nature and use of formal control systems for management
control and strategic planning process. Journal of Management, Vol. 10 pp.43-66
Burgess, T.F., Ong, T.S. & Shaw, N.E. (2007).Traditional or contemporary? The prevalence of
performance measurement system types. International Journal of Productivity and
Performance Management, vol. 56, no. 7, pp. 583-602.
Crabtree, A.D. & DeBusk, G.K. (2008).The effects of adopting the Balanced Scorecard on shareholder
returns. Advances in Accounting, vol. 24, no. 1, pp. 8-15.
Creelman, J., (1998). Building and Implementing a Balanced Scorecard. Non-governmental organization
Intelligence, Pp 16 - 22
David A.C (2008). The Impact of Balanced Scorecard Usage on Organizational Performance, University of
Minnesota.
Davis & Fred D. (1989).Perceived Usefulness, Perceived Ease of Use, And User Acceptance of
Information Technology. The MIS Quarterly, vol. 13; no. 3, pp. 318.
Davis,S.&Albright,T. (2004).An investigation of the effect of Balanced Scorecard implementation on
financial performance", Management Accounting Research, vol. 15, no. 2, pp. 135-153.
Dettmer, William H. Goldratt’s Theory of Constraints A Systems Approach to Continuous Improvement.
Milwaukee, Wisc.: ASQ Quality Press, 1997.
Doll, W.J. & Torkzadeh, G. (1998).Developing a multidimensional measure of system-use in an
organizational context, Information & Management, vol. 33, no. 4, pp. 171-185.
Drazin, R.&Howard, P. (2002). Strategy Implementation: A Technique For Organizational Design, Journal
of Management Studies, Vol. 34 No.3, Pp.465-85
Eisenstat, J., Schroeder, R., Mauriel, J. (1993), "A framework for linking culture and improvement
initiatives in organizations", Academy of Management Review, Vol. 25 No.4, pp.850-63.
Fernandes, K.J., Raja, V. & Whalley, A. (2006), "Lessons from implementing the balanced scorecard in a
small and medium size manufacturing organization", Technovation, vol. 26, no. 5-6, pp.
623-634.
Goldratt, Eliyahu M. and Cox, J. (1992)The Goal. Great Barrington, Mass.: The North River Press
Goldratt, Eliyahu M.(1990) .What is this thing called Theory of Constraints and how should it be
implemented? Great Barrington, Mass.: The North River Press
- 1898 -
Hewlett, B. (1999), Strategic Management for School Development, Paul Chapman Publishing, London
Jensen, P. (2002),Fragmenting work: blurring organizational boundaries and disordering hierarchies.
Administrative Science Quarterly, Vol. 50 No.2, pp.299-301.
Kaplan, R.S. & Norton, D.P. (1998) Putting the Balanced Scorecard to Work in The Economic Impact of
Knowledge,Butterworth-Heinemann, Boston, pp. 315-324.
Kaplan, R.S. (2008).Conceptual Foundations of the Balanced Scorecard.Handbook of Management
Accounting Research, ed. Christopher S. Chapman,Anthony G.Hopwood and Michael
D.Shields, Elsevier, , pp. 1253-1269.
Kiragu, D.N. (2005). A Survey on the Adoption of the Balanced Scorecard by Selected Non-governmental
organizations In Kenya., Unpublished MBA Project ,University Of Nairobi,Kenya
Mucheru, (2008). Application of The Balanced Scorecard In Performance Management Among
Commercial Banks In Kenya,Unpublished MBA Project,University Of Nairobi, Kenya.
Mugenda, O.M & Mugenda, A.G (2003). Research Methods, Quantitative and Qualitative Approaches,
Acts Press, Nairobi.
Muleri, B. (2001).Creating a strategic planning process environment. Business Horizons, Vol. 46 No.2,
pp.43-6.
Niven, P (2002). Balanced Scorecard Step - By - step: Maximizing performance and Maintaining Results,
John Wiley and sons, Inc.., New York
Niven, P.(2005), Driving Focus And Alignment With The Balanced Scorecard: Why Organizations Need A
Balanced Scorecard. The Journal For Quality And Participation, Pg 21-43.
Noreen, E, Debra S. and James T. M (1995). The Theory of Constraints and its Implications for
Management Accounting. Great Barrington, Mass.: The North River Press.
Ogendo, J. L. (2010), Application Of The Balanced Scorecard In Strategy Implementation By Unilever Tea
Kenya Limited. (Unpublished MBA Project). University Of Nairobi, Kenya.
Okumu, F. (2003), Great Strategy, Shame About The Implementation. Proceeding Of The 7th Annual
Hospitality Research Conference (CHME), Glasgow, 14-16 April, Pp.218-36
Porter, S.W.&Wooldridge, B. (1985), "Managing strategic consensus: the foundation of effective
implementation", Academy of Management Executive, Vol. 6 No.4, pp.27-39.
Premchand, R.S., Fryxell, G.E.& Judge, W.Q. (2004).Belaboring the not-so-obvious: consensus,
commitment, and strategic planning process speed and success. Journal of
Management, Vol. 26 No.6, pp.1237-57
Wedel, P. & Palmer, G. (1998). Quality Management: The Theory and Practice of Implementing Change,
Longman, Melbourne,
Wu, C., Zhao, J., Xia, L. & Zhu, Z. 2008, "Impact of Internal Factors on Information Technology Adoption:
An Empirical Investigation of Chinese Firms", Tsinghua Science & Technology, vol. 13, no.
3, pp. 318-322.


![Balanced Score Card[1]](https://img.pdfslide.us/doc/110x75/577cc7481a28aba711a0873e/balanced-score-card1.jpg)