Embed Size (px)
Citation preview

F A C T S H E E T S Q 1 2 0 1 8

Learn more @ www.inspireinvesting.com inspire
When you invest with Inspire, you are impacting more than just your financial future. You are investing in the lives of people in need all over the world. You are investing in spreading the message of hope found in the Bible. You are investing in clean water wells for the thirsty, food for the hungry, relief for the downtrodden, justice for the oppressed and freedom for the slave. And yes, you are buying an investment that offers lower fees and bench-mark-beating return potential, too.
When you invest with Inspire, you are joining a movement of passionate investors who have made the decision to align their investments for both the pursuit of financial returns and biblical impact. Together we are creating meaningful change in the lives of people all across the globe, inspiring transformation for God’s glory throughout the world.
Why would you settle for just another investment, when you could have so much more?
Welcome to Inspire. Welcome to the movement!
Blessings,
WELCOME TO INSPIRE. WELCOME TO T HE MOVEMENT .
Robert NetzlyCEO
Inspire average expense ratio: 0.61%. Industry average ETF expense ratio: 0.78%. Source: ETF.com as of 06/23/17Good values and good returns are not mutually exclusive, nor does investing with good values guarantee favorable results. All investing involves risk.
1 Low cost1 access to hundreds of inspiring, biblically aligned large companies from the U.S. and around the world.2 Inspire donates 50% of management fee profits to support Christian ministry3 Use as primary holding of your portfolio to seek long-term growth
KEY FACTS
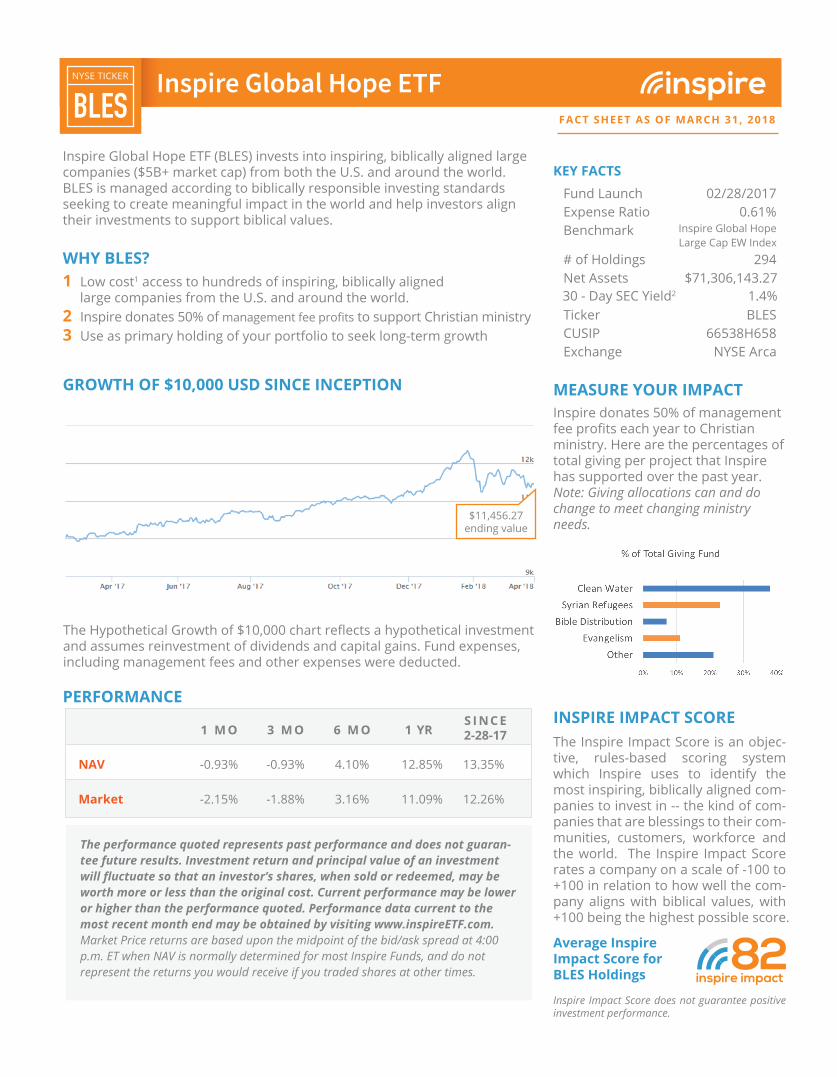
GROWTH OF $10,000 USD SINCE INCEPTION
The Hypothetical Growth of $10,000 chart reflects a hypothetical investment and assumes reinvestment of dividends and capital gains. Fund expenses, including management fees and other expenses were deducted.
PERFORMANCE
Inspire Global Hope ETF (BLES) invests into inspiring, biblically aligned large companies ($5B+ market cap) from both the U.S. and around the world. BLES is managed according to biblically responsible investing standards seeking to create meaningful impact in the world and help investors align their investments to support biblical values.
WHY BLES?
Fund Launch 02/28/2017 Expense Ratio 0.61% Benchmark Inspire Global Hope
Large Cap EW Index
# of Holdings 294 Net Assets $71,306,143.27 Ticker BLES CUSIP 66538H658 Exchange NYSE Arca
The performance quoted represents past performance and does not guaran-tee future results. Investment return and principal value of an investment will fluctuate so that an investor’s shares, when sold or redeemed, may be worth more or less than the original cost. Current performance may be lower or higher than the performance quoted. Performance data current to the most recent month end may be obtained by visiting www.inspireETF.com.Market Price returns are based upon the midpoint of the bid/ask spread at 4:00 p.m. ET when NAV is normally determined for most Inspire Funds, and do not represent the returns you would receive if you traded shares at other times.
The Inspire Impact Score is an objec-tive, rules-based scoring system which Inspire uses to identify the most inspiring, biblically aligned com-panies to invest in -- the kind of com-panies that are blessings to their com-munities, customers, workforce and the world. The Inspire Impact Score rates a company on a scale of -100 to +100 in relation to how well the com-pany aligns with biblical values, with +100 being the highest possible score.
INSPIRE IMPACT SCORE
Average Inspire Impact Score for BLES Holdings inspire impact
82
MEASURE YOUR IMPACTInspire donates 50% of management fee profits each year to Christian ministry. Here are the percentages of total giving per project that Inspire has supported over the past year. Note: Giving allocations can and do change to meet changing ministry needs.
Inspire Impact Score does not guarantee positive investment performance.
30 - Day SEC Yield2 1.4%
NAV 13.35%
1 M O
-0.93%
-2.15%
3 M O
-0.93%
-1.88%
6 M O
4.10%
3.16%
1 YR
12.85%
11.09% 12.26%Market
S I NC E2-28-17
$11,456.27ending value
�����������������������BLESNYSE TICKER
FACT SHEET AS OF MARCH 31, 2018

Inspire Global Hope ETFFact Sheet as of March 31, 2018
1Inspire’s average expense ratio of .61% is 22% less expensive than the average ETF expense of .78% (sourced ETF.com as of 6/23/17)2SEC Yield calculations are based on most recent Ex-Date. SEC Yield may include income, dividends, return of capital, or other distributions that are not considered short-term or long-term capital gains. Return of capital is considered a return of the investment principal and is not derived from net profits. Yield performance shown reflects fee waivers and/or expense reimburse-ments by the investment advisor to the fund resulting in a net expense ratio. Performance would have been lower without such waivers.Important Risk Information:Equity securities may fluctuate in value in response to the activities of individual companies and general market and economic conditions. While the shares of ETFs are tradable on secondary markets, they may not readily trade in all market conditions and may trade at significant discounts in periods of market stress. ETFs trade like stocks, are subject to investment risk, fluctuate in market value and may trade at prices above or below the ETFs net asset value. Brokerage commissions and ETF expenses will reduce returns. The Fund is a new fund with a limited history of opera-tions for investors to evaluate. There is no guarantee that the Fund will achieve its objective. Securities in the Index or in the Fund’s portfolio may underperform in comparison to the general securities markets or other asset classes. Investments in foreign securities could subject the Fund to greater risks including, currency fluctuation, economic conditions, and different governmental and accounting standards. Before investing, consider the funds' invest-ment objectives, risks, charges and expenses. To obtain a prospectus which contains this and other informa-tion, call 877.658.9473, or visit www.inspireinvesting.com. Read it carefully. The Inspire ETFs are distributed by Northern Lights Distributors, LLC, Member FINRA/SIPC. Inspire and Northern Lights Distributors, LLC are not affiliat-ed. Copyright © Inspire, 2017. All rights reserved. Control Number: 3344-NLD-4/6/2018
Inspire | 650 San Benito St, Ste. 130 Hollister, CA 95023 | (877)658-9473 | inspireinvesting.com
BLES
INSPIRING COMPANY HIGHLIGHT:XYLEM (ticker: XYL) | Percent Ownership: 0.33%
Xylem is a leading water technology company committed to “solving water” by creating innovative and smart technology solutions to meet the world’s water, wastewater and energy needs.
Xylem’s “Watermark Project” has the mission to provide and protect safe water resources for communities in need around the world and educate people about water issues.
As an investor in BLES, you are supporting and sharing in the revenues of this inspiring company working to provide clean water solutions to people in need around the world. That is what we call inspiring transformation!
INSPIRING COMPANY HIGHLIGHT:Incyte (ticker: INCY) | Percent Ownership: 0.33%
Incyte is a leader in the fight against cancer. INCY is a science-led biopharma-ceutical research company specializing in oncology [cancer treatment] prod-uct development and innovative medicines that are used worldwide.
Incyte’s research and medicines help improve the quality of cancer patients’ lives worldwide, and the Incyte Charitable Giving Foundation provides funds to help cancer patients and their families cope with their disease.
As an investor in BLES, you are supporting and sharing in the revenues of this inspiring company working to cure cancer and improve lives of cancer patients everywhere. That is what we call inspiring transformation!
GEOGRAPHIC ALLOCATION
Chart references target allocation. Actual allocation will change along with underlying security values and is rebalanced to target quarterly.
Get biblical investing tips and insights today!
Subscribe to the Inspire newsletter at
www.inspireinvesting.com
BLESNYSE TICKER
1 Low cost1 access to one-hundred inspiring, biblically aligned large companies in the U.S.2 Inspire donates 50% of management fee profits to support Christian ministry2
3 Use as primary holding of your portofolio to seek long-term growth
KEY FACTS
WHY BIBL?
Fund Launch 10/31/2017
Benchmark # of Holdings 100 Net Assets Ticker BIBL CUSIP 66538H534 Exchange NYSE Arca
Inspire 100 Index
$15,610,768.97
The Inspire Impact Score is an objective, rules-based scoring system which Inspire uses to identify the most inspiring, biblically aligned companies to invest in — the kind of companies that are blessings to their communities, customers, workforce and the world. The Inspire Impact Score rates a company on a scale of -100 to +100 in relation to how well the company aligns with biblical values, with +100 being the highest possible score.
INSPIRE IMPACT SCORE
Average Inspire Impact Score for BIBL Holdings inspire impact
90
MEASURE YOUR IMPACTInspire donates 50% of management fee profits each year to Christian ministry. Here are the percentages of total giving per project that Inspire has supported over the past year. Note: Giving allocations can and do change to meet changing ministry needs.
Inspire Impact Score does not guarantee positive investment performance.
30 - Day SEC Yield4 --
Net Expense RatioGross Expense Ratio 0.61%
0.35%3
The performance quoted represents past performance and does not guarantee future results. Investment return and principal value of an investment will fluctuate so that an investor’s shares, when sold or redeemed, may be worth more or less than the original cost. Current performance may be lower or higher than the performance quoted. Performance data current to the most recent month end may be obtained by visiting www.inspireETF.com.Market Price returns are based upon the midpoint of the bid/ask spread at 4:00 p.m. ET when NAV is normally determined for most Inspire Funds, and do not represent the returns you would receive if you traded shares at other times.1Inspire 100 ETF expense ratio of .35% is 55% less expensive than the average ETF expense of .78% (sourced ETF.com as of 6/23/17)2Management fees include all fees from ETF advisory, sub-advisory, separately managed account management and all other sources of management fee income.
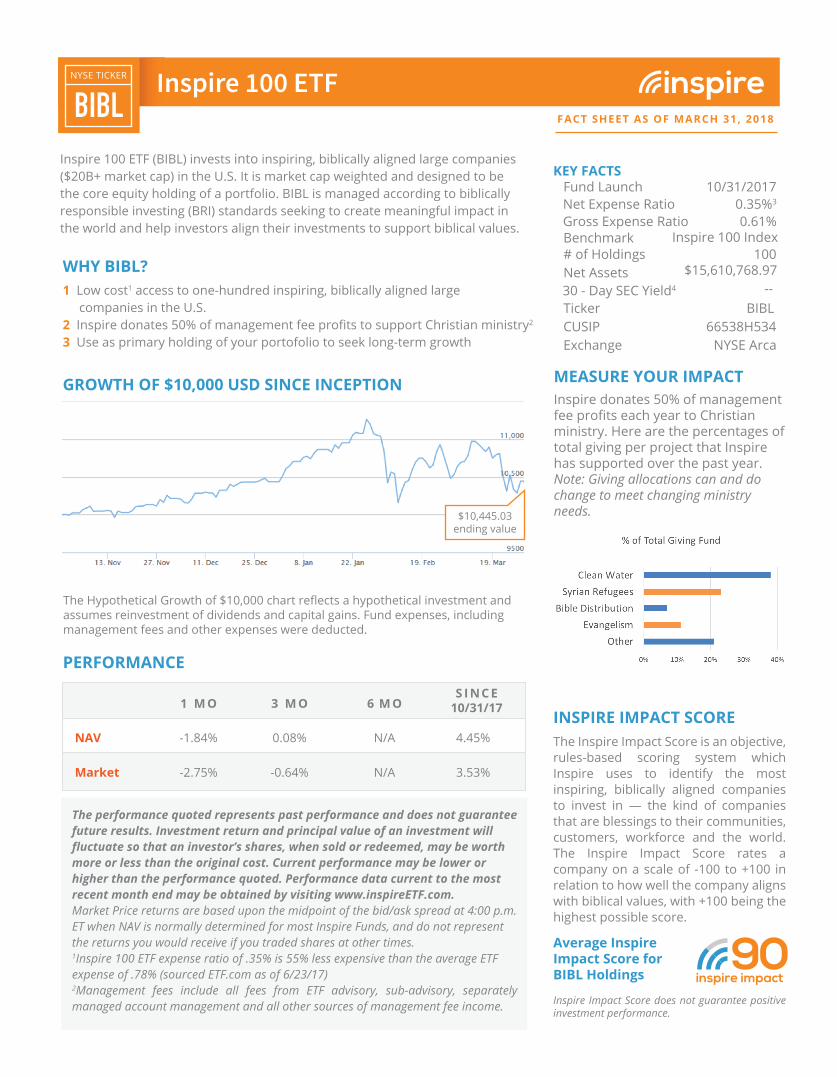
Inspire 100 ETF (BIBL) invests into inspiring, biblically aligned large companies ($20B+ market cap) in the U.S. It is market cap weighted and designed to be the core equity holding of a portfolio. BIBL is managed according to biblically responsible investing (BRI) standards seeking to create meaningful impact in the world and help investors align their investments to support biblical values.
GROWTH OF $10,000 USD SINCE INCEPTION
The Hypothetical Growth of $10,000 chart reflects a hypothetical investment and assumes reinvestment of dividends and capital gains. Fund expenses, including management fees and other expenses were deducted.
PERFORMANCE
1 M O 3 M O
NAV -1.84% 0.08% 4.45%
-2.75% -0.64%
6 M O
N/A
N/A 3.53%Market
S I NC E10/31/17
$10,445.03ending value
��������� ����BIBL
NYSE TICKER
FACT SHEET AS OF MARCH 31, 2018
Inspire 100 ETFFact Sheet as of March 31, 2018
INSPIRING COMPANY HIGHLIGHT:Abbvie (ticker: ABBV) | Percent Ownership: 5.21%
Abbvie is a world leader in groundbreaking research and productdevelopment that helps improve the lives of people fighting cancer,multiple sclerosis, Parkinson’s, Alzheimer's, HIV, Hepatitis C andother debilitating maladies.
The AbbVie Foundation also provides millions of dollars to helpthose in need, including families of children with cancer, HIV positivemothers and children in Africa and Syrian refugees.
That is what we call inspiring transformation!
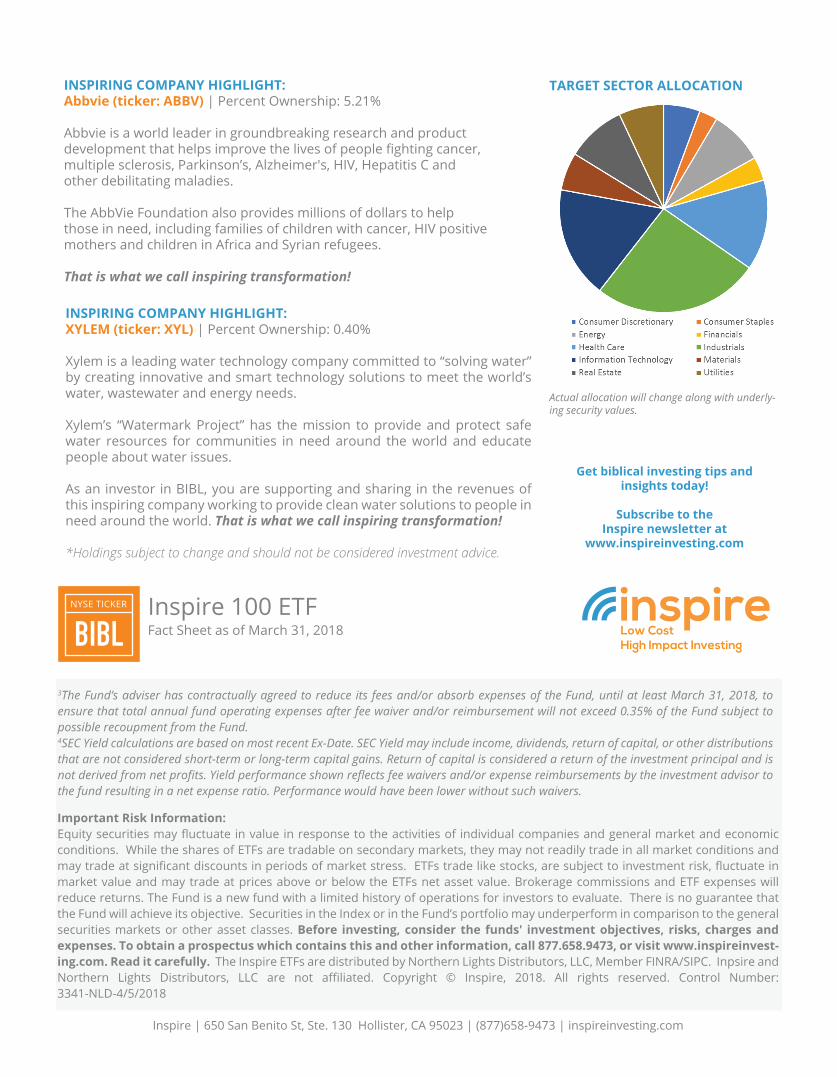
TARGET SECTOR ALLOCATION
Actual allocation will change along with underly-ing security values.
Get biblical investing tips and insights today!
Subscribe to the Inspire newsletter at
www.inspireinvesting.com
INSPIRING COMPANY HIGHLIGHT:XYLEM (ticker: XYL) | Percent Ownership: 0.40%
Xylem is a leading water technology company committed to “solving water” by creating innovative and smart technology solutions to meet the world’s water, wastewater and energy needs.
Xylem’s “Watermark Project” has the mission to provide and protect safe water resources for communities in need around the world and educate people about water issues.
As an investor in BIBL, you are supporting and sharing in the revenues of this inspiring company working to provide clean water solutions to people in need around the world. That is what we call inspiring transformation!
*Holdings subject to change and should not be considered investment advice.
Important Risk Information:Equity securities may fluctuate in value in response to the activities of individual companies and general market and economic conditions. While the shares of ETFs are tradable on secondary markets, they may not readily trade in all market conditions and may trade at significant discounts in periods of market stress. ETFs trade like stocks, are subject to investment risk, fluctuate in market value and may trade at prices above or below the ETFs net asset value. Brokerage commissions and ETF expenses will reduce returns. The Fund is a new fund with a limited history of operations for investors to evaluate. There is no guarantee that the Fund will achieve its objective. Securities in the Index or in the Fund’s portfolio may underperform in comparison to the general securities markets or other asset classes. Before investing, consider the funds' investment objectives, risks, charges and expenses. To obtain a prospectus which contains this and other information, call 877.658.9473, or visit www.inspireinvest-ing.com. Read it carefully. The Inspire ETFs are distributed by Northern Lights Distributors, LLC, Member FINRA/SIPC. Inpsire and Northern Lights Distributors, LLC are not affiliated. Copyright © Inspire, 2018. All rights reserved. Control Number: 3341-NLD-4/5/2018
Inspire | 650 San Benito St, Ste. 130 Hollister, CA 95023 | (877)658-9473 | inspireinvesting.com
3The Fund’s adviser has contractually agreed to reduce its fees and/or absorb expenses of the Fund, until at least March 31, 2018, to ensure that total annual fund operating expenses after fee waiver and/or reimbursement will not exceed 0.35% of the Fund subject to possible recoupment from the Fund.4SEC Yield calculations are based on most recent Ex-Date. SEC Yield may include income, dividends, return of capital, or other distributions that are not considered short-term or long-term capital gains. Return of capital is considered a return of the investment principal and is not derived from net profits. Yield performance shown reflects fee waivers and/or expense reimbursements by the investment advisor to the fund resulting in a net expense ratio. Performance would have been lower without such waivers.
BIBLNYSE TICKER
Low cost1 access to 500 inspiring, biblically aligned small and mid-sized companies in the United States.Inspire donates 50% of management fee profits to support Christian ministryUse as primary holding of your portfolio to seek aggressive growth
KEY FACTS
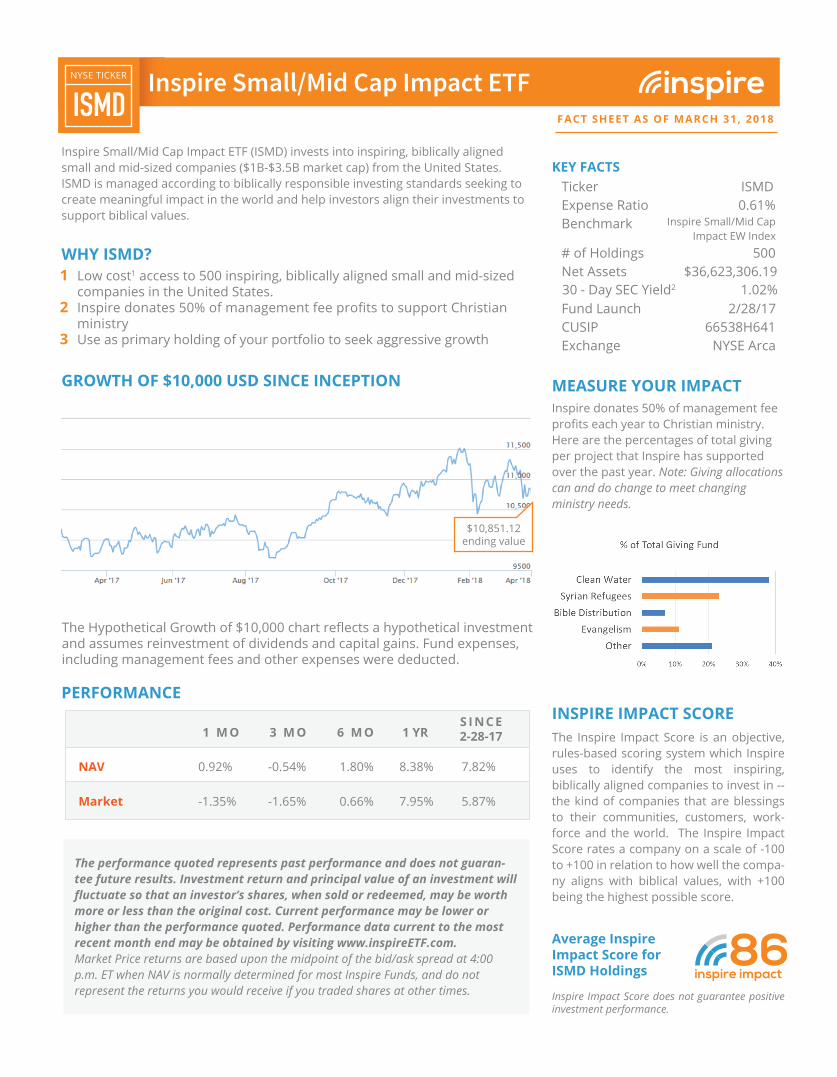
GROWTH OF $10,000 USD SINCE INCEPTION
The Hypothetical Growth of $10,000 chart reflects a hypothetical investment and assumes reinvestment of dividends and capital gains. Fund expenses, including management fees and other expenses were deducted.
PERFORMANCE
Inspire Small/Mid Cap Impact ETF (ISMD) invests into inspiring, biblically aligned small and mid-sized companies ($1B-$3.5B market cap) from the United States. ISMD is managed according to biblically responsible investing standards seeking to create meaningful impact in the world and help investors align their investments to support biblical values.
WHY ISMD?
The Inspire Impact Score is an objective, rules-based scoring system which Inspire uses to identify the most inspiring, biblically aligned companies to invest in -- the kind of companies that are blessings to their communities, customers, work-force and the world. The Inspire Impact Score rates a company on a scale of -100 to +100 in relation to how well the compa-ny aligns with biblical values, with +100 being the highest possible score.
INSPIRE IMPACT SCORE
Average Inspire Impact Score for ISMD Holdings inspire impact
86
MEASURE YOUR IMPACTInspire donates 50% of management fee profits each year to Christian ministry. Here are the percentages of total giving per project that Inspire has supported over the past year. Note: Giving allocations can and do change to meet changing ministry needs.
Inspire Impact Score does not guarantee positive investment performance.
Ticker ISMD Expense Ratio 0.61% Benchmark Inspire Small/Mid Cap
Impact EW Index
# of Holdings 500 Net Assets $36,623,306.19 Fund Launch 2/28/17 CUSIP 66538H641 Exchange NYSE Arca
30 - Day SEC Yield2 1.02%1
2
3
1 M O 3 M O 6 M O
NAV 0.92% -0.54% 1.80% 7.82%
-1.35% -1.65% 0.66%
1 YR
8.38%
7.95% 5.87%Market
S I NC E2-28-17
The performance quoted represents past performance and does not guaran-tee future results. Investment return and principal value of an investment will fluctuate so that an investor’s shares, when sold or redeemed, may be worth more or less than the original cost. Current performance may be lower or higher than the performance quoted. Performance data current to the most recent month end may be obtained by visiting www.inspireETF.com.Market Price returns are based upon the midpoint of the bid/ask spread at 4:00 p.m. ET when NAV is normally determined for most Inspire Funds, and do not represent the returns you would receive if you traded shares at other times.
$10,851.12ending value
ISMDNYSE TICKER
FACT SHEET AS OF MARCH 31, 2018
������������������������������
Inspire Small/Mid Cap Impact ETFFact Sheet as of March 31, 2018
1Inspire’s average expense ratio of .61% is 22% less expensive than the average ETF expense of .78% (sourced ETF.com as of 6/23/17)2SEC Yield calculations are based on most recent Ex-Date. SEC Yield may include income, dividends, return of capital, or other distributions that are not considered short-term or long-term capital gains. Return of capital is considered a return of the investment principal and is not derived from net profits. Yield performance shown reflects fee waivers and/or expense reimbursements by the investment advisor to the fund resulting in a net expense ratio. Performance would have been lower without such waivers.Important Risk Information:Equity securities may fluctuate in value in response to the activities of individual companies and general market and economic conditions. While the shares of ETFs are tradable on secondary markets, they may not readily trade in all market conditions and may trade at significant discounts in periods of market stress. ETFs trade like stocks, are subject to investment risk, fluctuate in market value and may trade at prices above or below the ETFs net asset value. Brokerage commissions and ETF expenses will reduce returns. The Fund is a new fund with a limited history of operations for investors to evaluate. There is no guarantee that the Fund will achieve its objective. Securities in the Index or in the Fund’s portfolio may underperform in comparison to the general securities markets or other asset classes. The earnings and prospects of small and medium sized companies are more volatile than larger companies and may experience higher failure rates than larger companies. Before investing, consider the funds' invest-ment objectives, risks, charges and expenses. To obtain a prospectus which contains this and other information, call 877.658.9473, or visit www.inspireinvesting.com. Read it carefully. The Inspire ETFs are distributed by Northern Lights Distrib-utors, LLC, Member FINRA/SIPC. Inspire and Northern Lights Distributors, LLC are not affiliated. Copyright © Inspire, 2018. All rights reserved. Control Number: 3345-NLD-4/6/2018
Inspire | 650 San Benito St, Ste. 130 Hollister, CA 95023 | (877)658-9473 | inspireinvesting.com
INSPIRING COMPANY HIGHLIGHT:LifePoint Health (ticker: LPNT) | Percent Ownership: 0.19%
LifePoint Health is a leading healthcare company dedicated to Making Communities Healthier®. They provide quality healthcare close to home in 22 states, offering comprehensive inpatient, outpatient and post-acute services. LifePoint provides charity and other uncompensated care to their communities across the nation. LifePoint Community Foundation also provides food to the homeless and assists in protecting women and children fleeing domestic violence.
As an investor in ISMD, you are supporting and sharing in the revenues of this inspir-ing company working to provide much needed healthcare within local communities in need. That is what we call inspiring transformation!
INSPIRING COMPANY HIGHLIGHT:United Natural Foods Inc (ticker: UNFI) | Percent Ownership: 0.17%
United Natural Foods (UNFI) has been delivering natural and organic food across North America for over 40 years. Their Moving Food Forward initiative focuses on growing and delivering organic foods more efficiently and making less impact on the earth. UNFI uses renewable energy, monitors fuel consumption, and build green buildings to conserve water.
UNFI has donated over 13 million pounds of food to combat hunger, and encourages community impact through setting volunteer hours and fundraising goals per facility. The UNFI foundation was created to educate farmers on organic processes and teach them how to conserve resources.
As an investor in ISMD, you are supporting and sharing in the revenues of this inspir-ing company working to bring healthier food options to people while also doing what is right for the earth. That is what we call inspiring transformation!
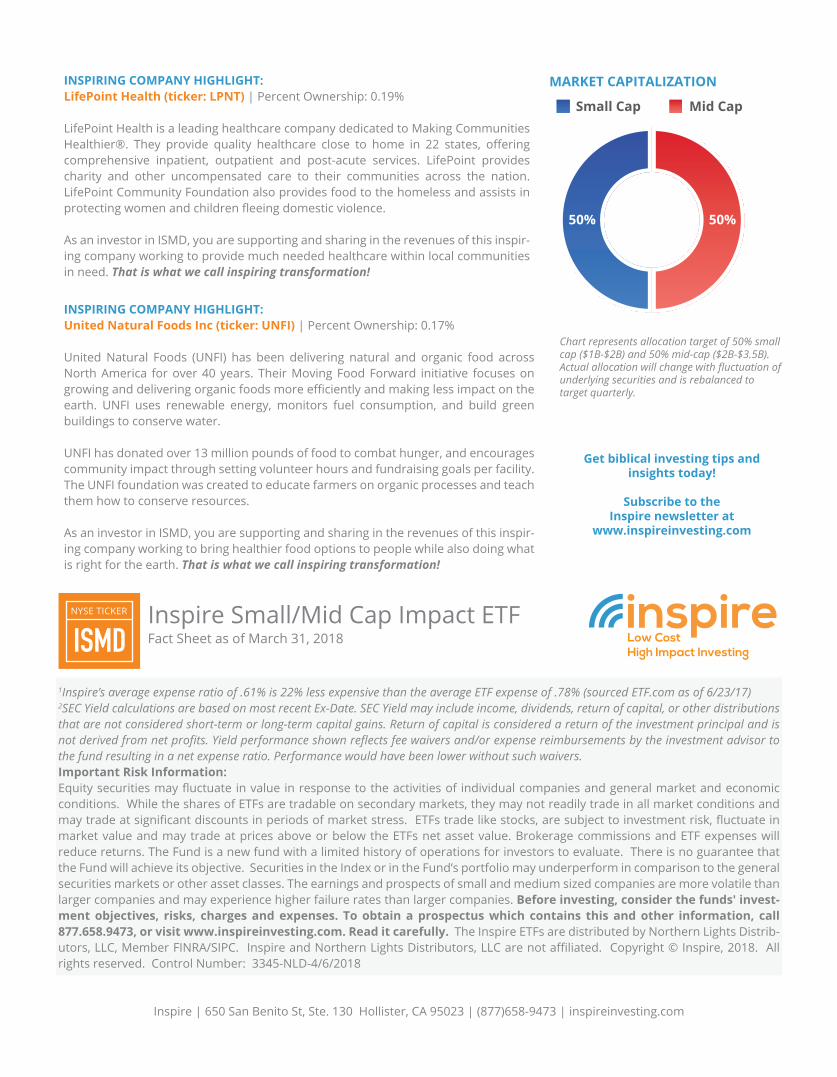
MARKET CAPITALIZATION
Chart represents allocation target of 50% small cap ($1B-$2B) and 50% mid-cap ($2B-$3.5B). Actual allocation will change with fluctuation of underlying securities and is rebalanced to target quarterly.
Important Risk Information:Equity securities may fluctuate in value in response to the activities of individual companies and general market and economic conditions. While the shares of ETFs are tradable on secondary markets, they may not readily trade in all market conditions and may trade at significant discounts in periods of market stress. ETFs trade like stocks, are subject to investment risk, fluctuate in market value and may trade at prices above or below the ETFs net asset value. Brokerage commissions and ETF expenses will reduce returns. The Fund is a new fund with a limited history of operations for investors to evaluate. There is no guarantee that the Fund will achieve its objective. Securities in the Index or in the Fund’s portfolio may underperform in comparison to the general securities markets or other asset classes. Before investing, consider the funds' investment objectives, risks, charges and expenses. To obtain a prospectus which contains this and other information, call 877.658.9473, or visit www.inspireinvest-ing.com. Read it carefully. The Inspire ETFs are distributed by Northern Lights Distributors, LLC, Member FINRA/SIPC. Inpsire and Northern Lights Distributors, LLC are not affiliated. Copyright © Inspire, 2018. All rights reserved. Control Number: 3341-NLD-4/5/2018
Inspire | 650 San Benito St, Ste. 130 Hollister, CA 95023 | (877)658-9473 | inspireinvesting.com
Get biblical investing tips and insights today!
Subscribe to the Inspire newsletter at
www.inspireinvesting.com
50%50%
Small Cap Mid Cap
ISMDNYSE TICKER
1 Low cost1 access to investment grade bonds of inspiring, biblically aligned large companies in the United States.2 Inspire donates 50% of management fee profits to support Christian ministry3 Use as primary bond holding of your portfolio to seek stable income.
KEY FACTS
GROWTH OF $10,000 USD SINCE INCEPTION
The Hypothetical Growth of $10,000 chart reflects a hypothetical investment and assumes reinvestment of dividends and capital gains. Fund expenses, including management fees and other expenses were deducted.
PERFORMANCE
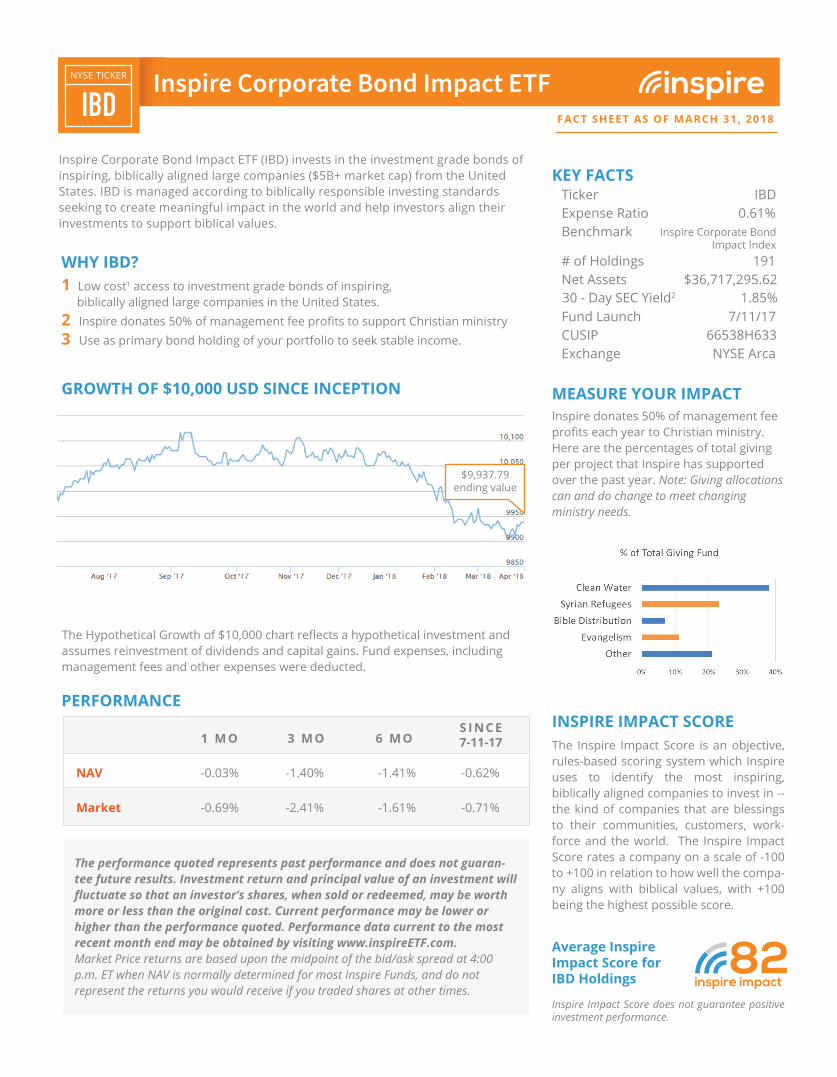
Inspire Corporate Bond Impact ETF (IBD) invests in the investment grade bonds of inspiring, biblically aligned large companies ($5B+ market cap) from the United States. IBD is managed according to biblically responsible investing standards seeking to create meaningful impact in the world and help investors align their investments to support biblical values.
WHY IBD?
The Inspire Impact Score is an objective, rules-based scoring system which Inspire uses to identify the most inspiring, biblically aligned companies to invest in -- the kind of companies that are blessings to their communities, customers, work-force and the world. The Inspire Impact Score rates a company on a scale of -100 to +100 in relation to how well the compa-ny aligns with biblical values, with +100 being the highest possible score.
INSPIRE IMPACT SCORE
Average Inspire Impact Score for IBD Holdings inspire impact
82
MEASURE YOUR IMPACTInspire donates 50% of management fee profits each year to Christian ministry. Here are the percentages of total giving per project that Inspire has supported over the past year. Note: Giving allocations can and do change to meet changing ministry needs.
Inspire Impact Score does not guarantee positive investment performance.
Ticker IBD Expense Ratio 0.61% Benchmark
# of Holdings 191 Net Assets $36,717,295.62 Fund Launch 7/11/17 CUSIP 66538H633 Exchange NYSE Arca
30 - Day SEC Yield2 1.85%
Inspire Corporate BondImpact Index
The performance quoted represents past performance and does not guaran-tee future results. Investment return and principal value of an investment will fluctuate so that an investor’s shares, when sold or redeemed, may be worth more or less than the original cost. Current performance may be lower or higher than the performance quoted. Performance data current to the most recent month end may be obtained by visiting www.inspireETF.com.Market Price returns are based upon the midpoint of the bid/ask spread at 4:00 p.m. ET when NAV is normally determined for most Inspire Funds, and do not represent the returns you would receive if you traded shares at other times.
1 M O 3 M O 6 M O
NAV -0.03% -1.40% -1.41% -0.62%
-0.69% -2.41% -1.61% -0.71%Market
S I NC E7-11-17
$9,937.79ending value
IBDNYSE TICKER
FACT SHEET AS OF MARCH 31, 2018
���������������������������������
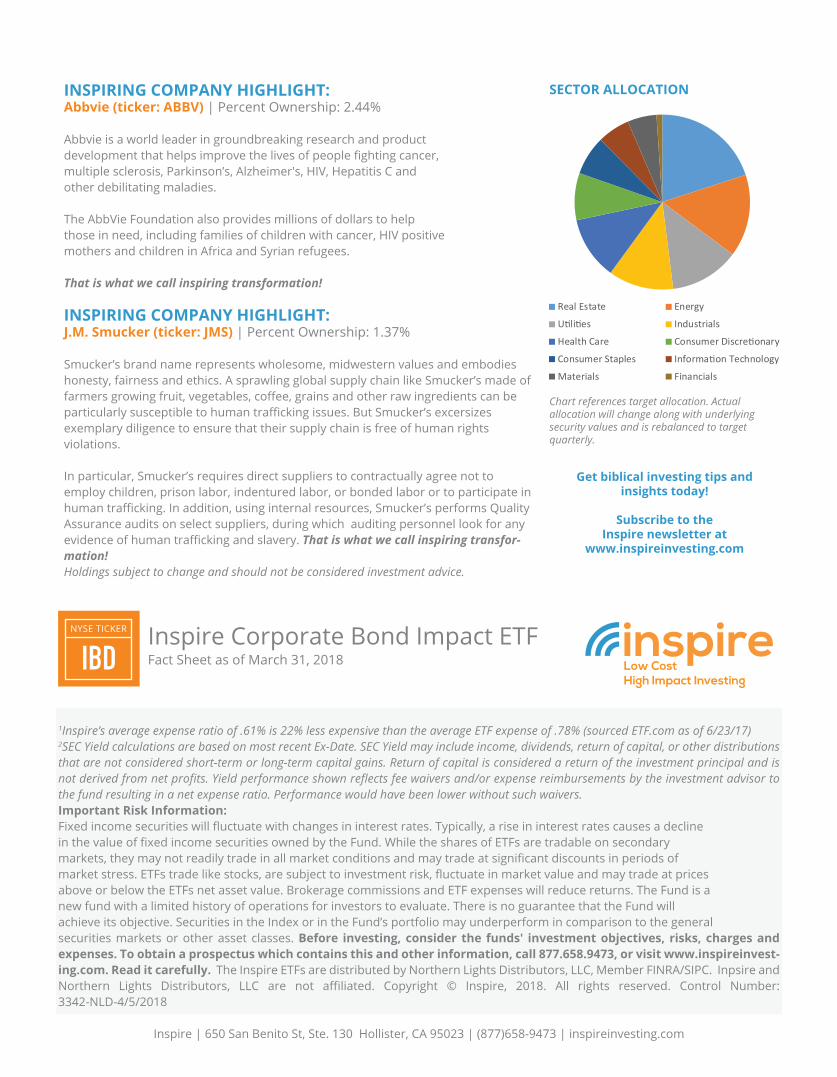
Real Estate Energy
Utilities Industrials
Health Care Consumer Discretionary
Consumer Staples Information Technology
Materials Financials
Inspire Corporate Bond Impact ETFFact Sheet as of March 31, 2018
1Inspire’s average expense ratio of .61% is 22% less expensive than the average ETF expense of .78% (sourced ETF.com as of 6/23/17)2SEC Yield calculations are based on most recent Ex-Date. SEC Yield may include income, dividends, return of capital, or other distributions that are not considered short-term or long-term capital gains. Return of capital is considered a return of the investment principal and is not derived from net profits. Yield performance shown reflects fee waivers and/or expense reimbursements by the investment advisor to the fund resulting in a net expense ratio. Performance would have been lower without such waivers.Important Risk Information:Fixed income securities will fluctuate with changes in interest rates. Typically, a rise in interest rates causes a declinein the value of fixed income securities owned by the Fund. While the shares of ETFs are tradable on secondarymarkets, they may not readily trade in all market conditions and may trade at significant discounts in periods ofmarket stress. ETFs trade like stocks, are subject to investment risk, fluctuate in market value and may trade at pricesabove or below the ETFs net asset value. Brokerage commissions and ETF expenses will reduce returns. The Fund is anew fund with a limited history of operations for investors to evaluate. There is no guarantee that the Fund willachieve its objective. Securities in the Index or in the Fund’s portfolio may underperform in comparison to the generalsecurities markets or other asset classes. Before investing, consider the funds' investment objectives, risks, charges and expenses. To obtain a prospectus which contains this and other information, call 877.658.9473, or visit www.inspireinvest-ing.com. Read it carefully. The Inspire ETFs are distributed by Northern Lights Distributors, LLC, Member FINRA/SIPC. Inpsire and Northern Lights Distributors, LLC are not affiliated. Copyright © Inspire, 2018. All rights reserved. Control Number: 3342-NLD-4/5/2018
Inspire | 650 San Benito St, Ste. 130 Hollister, CA 95023 | (877)658-9473 | inspireinvesting.com
INSPIRING COMPANY HIGHLIGHT:Abbvie (ticker: ABBV) | Percent Ownership: 2.44%
Abbvie is a world leader in groundbreaking research and productdevelopment that helps improve the lives of people fighting cancer,multiple sclerosis, Parkinson’s, Alzheimer's, HIV, Hepatitis C andother debilitating maladies.
The AbbVie Foundation also provides millions of dollars to helpthose in need, including families of children with cancer, HIV positivemothers and children in Africa and Syrian refugees.
That is what we call inspiring transformation!
INSPIRING COMPANY HIGHLIGHT:J.M. Smucker (ticker: JMS) | Percent Ownership: 1.37%
Smucker’s brand name represents wholesome, midwestern values and embodies honesty, fairness and ethics. A sprawling global supply chain like Smucker’s made of farmers growing fruit, vegetables, coffee, grains and other raw ingredients can be particularly susceptible to human trafficking issues. But Smucker’s excersizes exemplary diligence to ensure that their supply chain is free of human rights violations.
In particular, Smucker’s requires direct suppliers to contractually agree not to employ children, prison labor, indentured labor, or bonded labor or to participate in human trafficking. In addition, using internal resources, Smucker’s performs Quality Assurance audits on select suppliers, during which auditing personnel look for any evidence of human trafficking and slavery. That is what we call inspiring transfor-mation! Holdings subject to change and should not be considered investment advice.
SECTOR ALLOCATION
Chart references target allocation. Actual allocation will change along with underlying security values and is rebalanced to target quarterly.
Get biblical investing tips and insights today!
Subscribe to the Inspire newsletter at
www.inspireinvesting.com
IBDNYSE TICKER
ISIN: DE000SLA3UD9 | Bloomberg: INSP100 Index
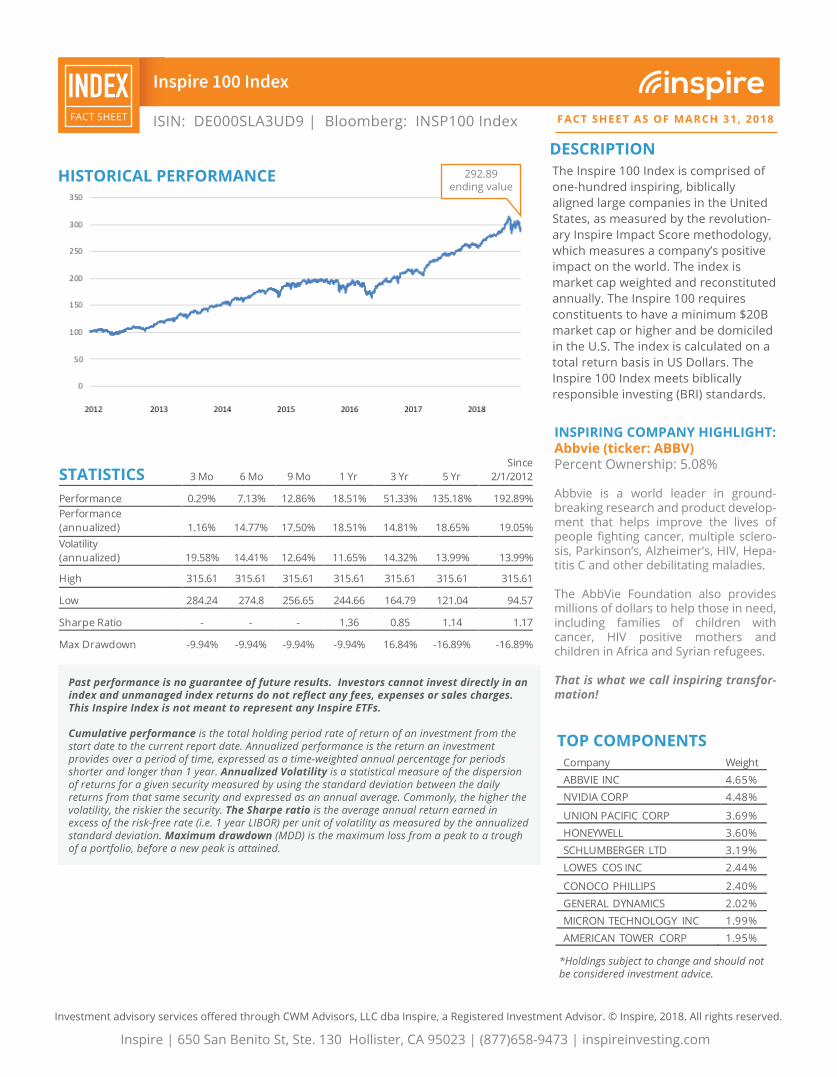
DESCRIPTIONThe Inspire 100 Index is comprised of one-hundred inspiring, biblically aligned large companies in the United States, as measured by the revolution-ary Inspire Impact Score methodology, which measures a company’s positive impact on the world. The index is market cap weighted and reconstituted annually. The Inspire 100 requires constituents to have a minimum $20B market cap or higher and be domiciled in the U.S. The index is calculated on a total return basis in US Dollars. The Inspire 100 Index meets biblically responsible investing (BRI) standards.
Investment advisory services offered through CWM Advisors, LLC dba Inspire, a Registered Investment Advisor. © Inspire, 2018. All rights reserved.
Inspire | 650 San Benito St, Ste. 130 Hollister, CA 95023 | (877)658-9473 | inspireinvesting.com
INSPIRING COMPANY HIGHLIGHT:Abbvie (ticker: ABBV) Percent Ownership: 5.08%
Abbvie is a world leader in ground-breaking research and product develop-ment that helps improve the lives of people fighting cancer, multiple sclero-sis, Parkinson’s, Alzheimer's, HIV, Hepa-titis C and other debilitating maladies.
The AbbVie Foundation also provides millions of dollars to help those in need, including families of children with cancer, HIV positive mothers and children in Africa and Syrian refugees.
That is what we call inspiring transfor-mation!
STATISTICS 3 Mo 6 Mo 9 Mo 1 Yr 3 Yr 5 Yr Since
2/1/2012
Performance 0.29% 7.13% 12.86% 18.51% 51.33% 135.18% 192.89% Performance (annualized) 1.16% 14.77% 17.50% 18.51% 14.81% 18.65% 19.05% Volatility (annualized) 19.58% 14.41% 12.64% 11.65% 14.32% 13.99% 13.99%
High 315.61 315.61 315.61 315.61 315.61 315.61 315.61
Low 284.24 274.8 256.65 244.66 164.79 121.04 94.57
Sharpe Ratio - - - 1.36 0.85 1.14 1.17
Max Drawdown -9.94% -9.94% -9.94% -9.94% 16.84% -16.89% -16.89%
TOP COMPONENTS
*Holdings subject to change and should not be considered investment advice.
Past performance is no guarantee of future results. Investors cannot invest directly in an index and unmanaged index returns do not reflect any fees, expenses or sales charges. This Inspire Index is not meant to represent any Inspire ETFs.
Cumulative performance is the total holding period rate of return of an investment from the start date to the current report date. Annualized performance is the return an investment provides over a period of time, expressed as a time-weighted annual percentage for periods shorter and longer than 1 year. Annualized Volatility is a statistical measure of the dispersion of returns for a given security measured by using the standard deviation between the daily returns from that same security and expressed as an annual average. Commonly, the higher the volatility, the riskier the security. The Sharpe ratio is the average annual return earned in excess of the risk-free rate (i.e. 1 year LIBOR) per unit of volatility as measured by the annualized standard deviation. Maximum drawdown (MDD) is the maximum loss from a peak to a trough of a portfolio, before a new peak is attained.
Company Weight ABBVIE INC 4.65% NVIDIA CORP 4.48%
UNION PACIFIC CORP 3.69% HONEYWELL 3.60% SCHLUMBERGER LTD 3.19% LOWES COS INC 2.44%
CONOCO PHILLIPS 2.40% GENERAL DYNAMICS 2.02% MICRON TECHNOLOGY INC 1.99% AMERICAN TOWER CORP 1.95%
HISTORICAL PERFORMANCE 292.89ending value
INDEXFACT SHEET FACT SHEET AS OF MARCH 31, 2018
��������� ������
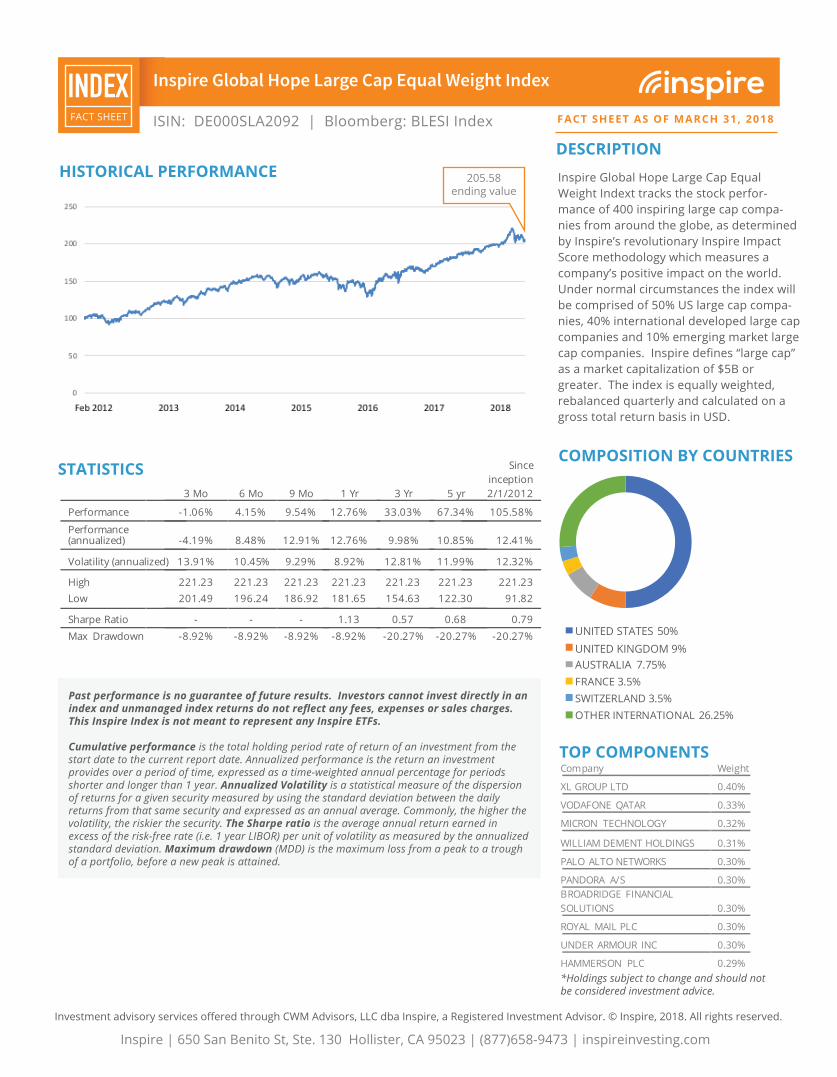
UNITED STATES 50%UNITED KINGDOM 9%AUSTRALIA 7.75%FRANCE 3.5%SWITZERLAND 3.5%OTHER INTERNATIONAL 26.25%
ISIN: DE000SLA2092 | Bloomberg: BLESI Index
TOP COMPONENTS
COMPOSITION BY COUNTRIES
DESCRIPTION
Inspire Global Hope Large Cap Equal Weight Indext tracks the stock perfor-mance of 400 inspiring large cap compa-nies from around the globe, as determined by Inspire’s revolutionary Inspire Impact Score methodology which measures a company’s positive impact on the world. Under normal circumstances the index will be comprised of 50% US large cap compa-nies, 40% international developed large cap companies and 10% emerging market large cap companies. Inspire defines “large cap” as a market capitalization of $5B or greater. The index is equally weighted, rebalanced quarterly and calculated on a gross total return basis in USD.
STATISTICS
HISTORICAL PERFORMANCE
Investment advisory services offered through CWM Advisors, LLC dba Inspire, a Registered Investment Advisor. © Inspire, 2018. All rights reserved.
Inspire | 650 San Benito St, Ste. 130 Hollister, CA 95023 | (877)658-9473 | inspireinvesting.com
*Holdings subject to change and should not be considered investment advice.
Past performance is no guarantee of future results. Investors cannot invest directly in an index and unmanaged index returns do not reflect any fees, expenses or sales charges. This Inspire Index is not meant to represent any Inspire ETFs. Cumulative performance is the total holding period rate of return of an investment from the start date to the current report date. Annualized performance is the return an investment provides over a period of time, expressed as a time-weighted annual percentage for periods shorter and longer than 1 year. Annualized Volatility is a statistical measure of the dispersion of returns for a given security measured by using the standard deviation between the daily returns from that same security and expressed as an annual average. Commonly, the higher the volatility, the riskier the security. The Sharpe ratio is the average annual return earned in excess of the risk-free rate (i.e. 1 year LIBOR) per unit of volatility as measured by the annualized standard deviation. Maximum drawdown (MDD) is the maximum loss from a peak to a trough of a portfolio, before a new peak is attained.
205.58ending value
3 Mo 6 Mo 9 Mo 1 Yr 3 Yr 5 yr
Since inception 2/1/2012
Performance -1.06% 4.15% 9.54% 12.76% 33.03% 67.34% 105.58%
Performance (annualized) -4.19% 8.48% 12.91% 12.76% 9.98% 10.85% 12.41%
Volatility (annualized) 13.91% 10.45% 9.29% 8.92% 12.81% 11.99% 12.32%
High 221.23 221.23 221.23 221.23 221.23 221.23 221.23 Low 201.49 196.24 186.92 181.65 154.63 122.30 91.82
Sharpe Ratio - - - 1.13 0.57 0.68 0.79 Max Drawdown
-8.92% -8.92% -8.92% -8.92% -20.27% -20.27% -20.27%
INDEXFACT SHEET FACT SHEET AS OF MARCH 31, 2018
������������������������������������������������
Investment advisory services offered through CWM Advisors, LLC dba Inspire, a Registered Investment Advisor. © Inspire, 2018. All rights reserved.
Inspire | 650 San Benito St, Ste. 130 Hollister, CA 95023 | (877)658-9473 | inspireinvesting.com
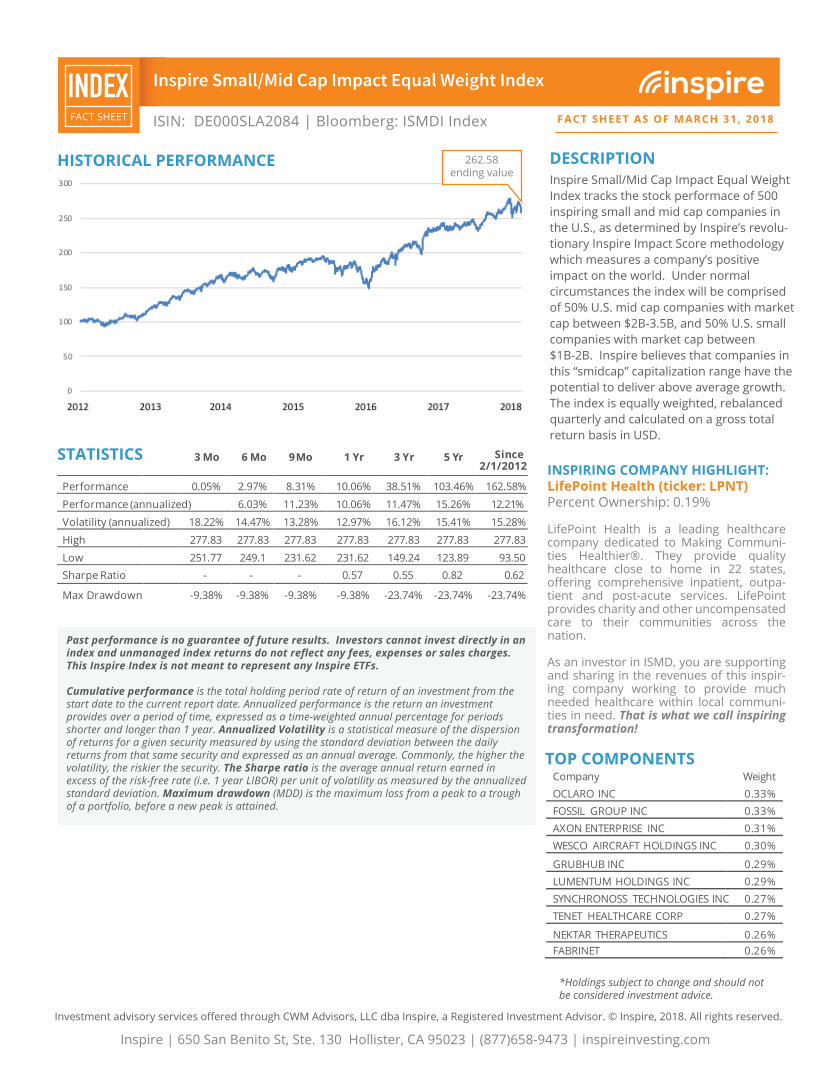
HISTORICAL PERFORMANCE DESCRIPTIONInspire Small/Mid Cap Impact Equal Weight Index tracks the stock performace of 500 inspiring small and mid cap companies in the U.S., as determined by Inspire’s revolu-tionary Inspire Impact Score methodology which measures a company’s positive impact on the world. Under normal circumstances the index will be comprised of 50% U.S. mid cap companies with market cap between $2B-3.5B, and 50% U.S. small companies with market cap between $1B-2B. Inspire believes that companies in this “smidcap” capitalization range have the potential to deliver above average growth. The index is equally weighted, rebalanced quarterly and calculated on a gross total return basis in USD.
TOP COMPONENTS
STATISTICSINSPIRING COMPANY HIGHLIGHT:LifePoint Health (ticker: LPNT)Percent Ownership: 0.19%
LifePoint Health is a leading healthcare company dedicated to Making Communi-ties Healthier®. They provide quality healthcare close to home in 22 states, offering comprehensive inpatient, outpa-tient and post-acute services. LifePoint provides charity and other uncompensated care to their communities across the nation.
As an investor in ISMD, you are supporting and sharing in the revenues of this inspir-ing company working to provide much needed healthcare within local communi-ties in need. That is what we call inspiring transformation!
Investment advisory services offered through CWM Advisors, LLC dba Inspire, a Registered Investment Advisor. © Inspire, 2018. All rights reserved.
Inspire | 650 San Benito St, Ste. 130 Hollister, CA 95023 | (877)658-9473 | inspireinvesting.com
*Holdings subject to change and should not be considered investment advice.
Past performance is no guarantee of future results. Investors cannot invest directly in an index and unmanaged index returns do not reflect any fees, expenses or sales charges. This Inspire Index is not meant to represent any Inspire ETFs. Cumulative performance is the total holding period rate of return of an investment from the start date to the current report date. Annualized performance is the return an investment provides over a period of time, expressed as a time-weighted annual percentage for periods shorter and longer than 1 year. Annualized Volatility is a statistical measure of the dispersion of returns for a given security measured by using the standard deviation between the daily returns from that same security and expressed as an annual average. Commonly, the higher the volatility, the riskier the security. The Sharpe ratio is the average annual return earned in excess of the risk-free rate (i.e. 1 year LIBOR) per unit of volatility as measured by the annualized standard deviation. Maximum drawdown (MDD) is the maximum loss from a peak to a trough of a portfolio, before a new peak is attained.
262.58ending value
Company Weight OCLARO INC 0.33% FOSSIL GROUP INC 0.33% AXON ENTERPRISE INC 0.31% WESCO AIRCRAFT HOLDINGS INC 0.30%
GRUBHUB INC 0.29% LUMENTUM HOLDINGS INC 0.29% SYNCHRONOSS TECHNOLOGIES INC 0.27% TENET HEALTHCARE CORP 0.27%
NEKTAR THERAPEUTICS 0.26% FABRINET 0.26%
3 Mo
6 Mo
9 Mo
1 Y r
3 Yr
5 Yr
Since 2/1/2012
Performance 0.05% 2.97% 8.31% 10.06% 38.51% 103.46% 162.58%
Performance (annualized) 6.03% 11.23% 10.06% 11.47% 15.26% 12.21%
Volatility (annualized) 18.22% 14.47% 13.28% 12.97% 16.12% 15.41% 15.28%
High 277.83 277.83 277.83 277.83 277.83 277.83 277.83
Low 251.77 249.1 231.62 231.62 149.24 123.89 93.50 Sharpe Ratio - - - 0.57 0.55 0.82 0.62
Max Drawdown -9.38% -9.38% -9.38% -9.38% -23.74% -23.74% -23.74%
ISIN: DE000SLA2084 | Bloomberg: ISMDI Index
INDEXFACT SHEET FACT SHEET AS OF MARCH 31, 2018
���������������������������������������������

Past performance is no guarantee of future results. Investors cannot invest directly in an index and unmanaged index returns do not reflect any fees, expenses or sales charges. This Inspire Index is not meant to represent any Inspire ETFs.
Cumulative performance is the total holding period rate of return of an investment from the start date to the current report date. Annualized performance is the return an investment provides over a period of time, expressed as a time-weighted annual percentage for periods shorter and longer than 1 year. Annualized Volatility is a statistical measure of the dispersion of returns for a given security measured by using the standard deviation between the daily returns from that same security and expressed as an annual average. Commonly, the higher the volatility, the riskier the security. The Sharpe ratio is the average annual return earned in excess of the risk-free rate (i.e. 1 year LIBOR) per unit of volatility as measured by the annualized standard deviation. Maximum drawdown (MDD) is the maximum loss from a peak to a trough of a portfolio, before a new peak is attained.
HISTORICAL PERFORMANCE DESCRIPTIONThe Inspire Corporate Bond Impact Equal Weight Index is comprised of 250 invest-ment grade, intermediate term corporate bonds issued by some of the most inspiring large cap “blue chip” companies in the United States, as determined by Inspire’s revolutionary Inspire Impact Score methodology which measures a company’s positive impact on the world. Inspire defines “large cap” as a market capitalization of $5B or greater and “investment grade” as BBB-/Baa3 or higher. The index is equally weighted, rebalanced quarterly and calculated on a total return basis in US Dollars.
STATISTICS
Investment advisory services offered through CWM Advisors, LLC dba Inspire, a Registered Investment Advisor. © Inspire, 2018. All rights reserved.
Inspire | 650 San Benito St, Ste. 130 Hollister, CA 95023 | (877)658-9473 | inspireinvesting.com
Investment advisory services offered through CWM Advisors, LLC dba Inspire, a Registered Investment Advisor. © Inspire, 2018. All rights reserved.
Inspire | 650 San Benito St, Ste. 130 Hollister, CA 95023 | (877)658-9473 | inspireinvesting.com
Consumer Discretionary Consumer StaplesEnergy FinancialsHealth Care IndustrialsInformation Technology MaterialsReal Estate Utilities
SECTOR ALLOCATION
Average Maturity (years) 3.67
Maximum Maturity (years) 8.75
Minimum Maturity (years) 0.75
MATURITY DETAILS
TOP COMPONENTS
*Holdings subject to change and should not be considered investment advice.
Bond Issuer Weight PRAXAIR INC 2.83%
SIMON PROPERTY GROUP 2.83%
KINDER MORGAN ENERGY 2.80%
WELLTOWER INC 2.40%
DOMINION RESOURCES INC 2.40%
LOWE’S COMPANIES 2.00%
NORFOLK SOUTHERN CORP 2.00%
VENTAS REALTY LP 2.00%
BOSTON PROPERTIES LP 2.00%
WILLIAMS PARNERS LP 2.00%
116.54ending value
3 Mo
6 Mo
9 Mo
1 Yr
3 Yr
5 yr
Since
2/1/2012 Performance -1.09% -0.88% 0.09% 1.54% 4.63% 9.64% 16.54%
Performance (annualized) -4.31% -1.74% 0.13% 1.54% 1.52% 1.86% 2.52%
Volatility (annualized) 1.70% 1.65% 1.75% 1.82% 2.56% 2.63% 2.54%
High 118.26 118.26 118.26 118.26 118.26 118.26 118.26
Low 116.14 116.14 116.14 114.92 107.06 103.55 99.59
Sharpe Ratio - - - -0.62 -0.45 -0.31 -0.06
Max Drawdown -1.34% -1.69% -1.79% -1.79% -4.45% -4.45% -4.45%
ISIN: DE000SLA2084
INDEXFACT SHEET FACT SHEET AS OF MARCH 31, 2018
������������������������������������������������
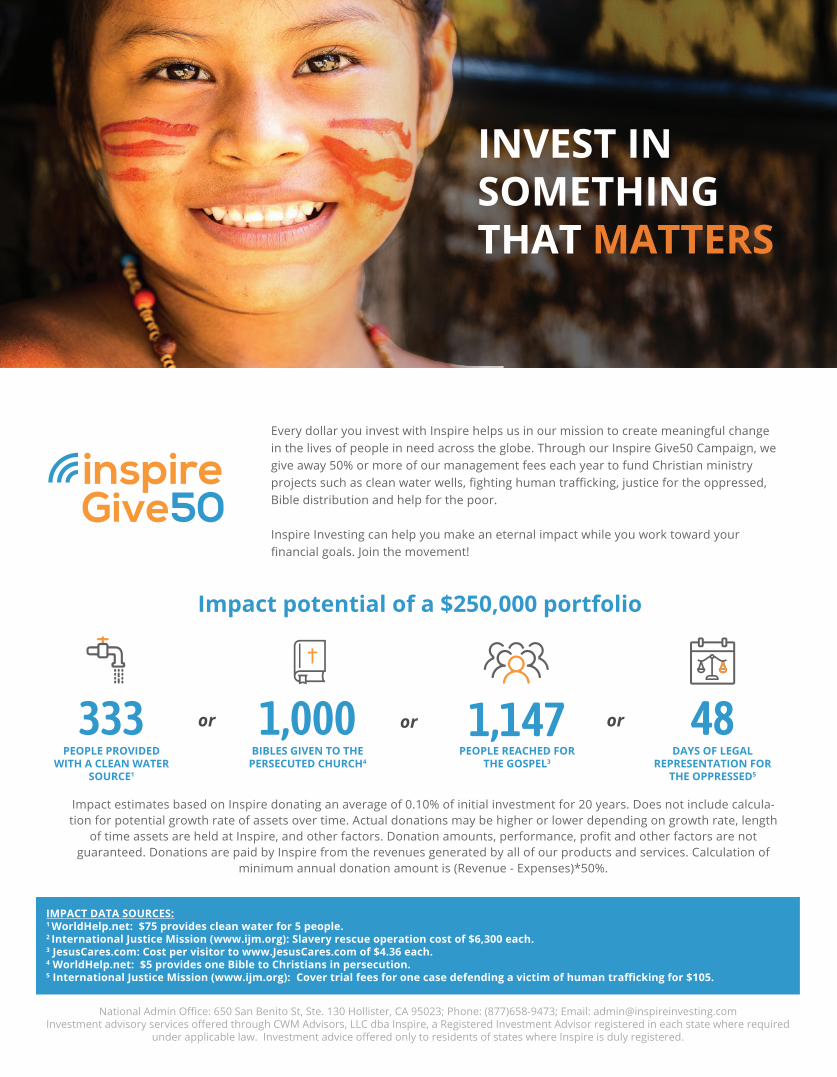
IMPACT DATA SOURCES:1 WorldHelp.net: $75 provides clean water for 5 people.2 International Justice Mission (www.ijm.org): Slavery rescue operation cost of $6,300 each.3 JesusCares.com: Cost per visitor to www.JesusCares.com of $4.36 each.4 WorldHelp.net: $5 provides one Bible to Christians in persecution.5 International Justice Mission (www.ijm.org): Cover trial fees for one case defending a victim of human trafficking for $105.
National Admin Office: 650 San Benito St, Ste. 130 Hollister, CA 95023; Phone: (877)658-9473; Email: [email protected] advisory services offered through CWM Advisors, LLC dba Inspire, a Registered Investment Advisor registered in each state where required
under applicable law. Investment advice offered only to residents of states where Inspire is duly registered.
Impact estimates based on Inspire donating an average of 0.10% of initial investment for 20 years. Does not include calcula-tion for potential growth rate of assets over time. Actual donations may be higher or lower depending on growth rate, length
of time assets are held at Inspire, and other factors. Donation amounts, performance, profit and other factors are not guaranteed. Donations are paid by Inspire from the revenues generated by all of our products and services. Calculation of
minimum annual donation amount is (Revenue - Expenses)*50%.
PEOPLE PROVIDED WITH A CLEAN WATER
SOURCE1
333 BIBLES GIVEN TO THE
PERSECUTED CHURCH4
1,000DAYS OF LEGAL
REPRESENTATION FOR THE OPPRESSED5
48
Impact potential of a $250,000 portfolio
PEOPLE REACHED FOR THE GOSPEL3
1,147or or or
Every dollar you invest with Inspire helps us in our mission to create meaningful change in the lives of people in need across the globe. Through our Inspire Give50 Campaign, we give away 50% or more of our management fees each year to fund Christian ministry projects such as clean water wells, fighting human trafficking, justice for the oppressed, Bible distribution and help for the poor.
Inspire Investing can help you make an eternal impact while you work toward your financial goals. Join the movement!
inspireGive50
INVEST IN SOMETHING THAT MATTERS
Investment advisory services offered through CWM Advisors, LLC dba Inspire, a Registered Investment Advisor. © Inspire, 2018. All rights reserved.
Inspire | 650 San Benito St, Ste. 130 Hollister, CA 95023 | (877)658-9473 | inspireinvesting.com
Learn more @ www.inspireinvesting.com
The Inspire ETFs are new with a limited history of operations for investors to evaluate. There is no guarantee that the Funds will achieve their objective, generate positive returns, or avoid losses.
ETF shares are not redeemable with the issuing fund other than in large Creation Unit aggregations. Instead, investors must buy or sell ETF Shares in the secondary market with the assistance of a stockbroker. In doing so, the investor may incur brokerage commissions and
may pay more than net asset value when buying and receive less than net asset value when selling. The Funds may focus their invest-ments in securities of a particular industry to the extent the Index does. This may cause the Fund's net asset value to fluctuate more
than that of a fund that does not focus in a particular industry.
The Funds are not actively managed and the Adviser will not sell shares of an equity security due to current or projected underperfor-mance of a security, industry or sector, unless that security is removed from the Index or the selling of shares of that security is other-wise required upon a rebalancing of the Index as addressed in the Index methodology. Tracking error may occur because of imperfect
correlation between the Fund’s holdings of portfolio securities and those in the Index. The Fund’s use of a representative sampling approach, if used, could result in its holding a smaller number of securities than are in the Index. To the extent the assets in the Funds
are smaller, these risks will be greater.
Before investing, consider the funds' investment objectives, risks, charges and expenses. To obtain a prospectus which contains this and other information, call 877.658.9473, or visit http://www.inspireetf.com. Read it carefully. The Inspire ETFs
are distributed by Northern Lights Distributors, LLC, Member FINRA/SIPC. CWM Advisors, LLC dba Inspire and Northern Lights Distributors, LLC are not affiliated. Control Number: 3355-NLD-4/6/2018
National Admin Office: 650 San Benito St, Ste. 130 Hollister, CA 95023; Phone: (877)658-9473; Email: [email protected] advisory services offered through CWM Advisors, LLC dba Inspire, a Registered Investment Advisor. The use of the Inspire Impact Score does not guarantee that an investment will generate profits or avoid losses.
Investment advisory services offered through CWM Advisors, LLC dba Inspire, a Registered Investment Advisor. © Inspire, 2018. All rights reserved.
Inspire | 650 San Benito St, Ste. 130 Hollister, CA 95023 | (877)658-9473 | inspireinvesting.com
INVESTIN WHAT
MATTERS