Embed Size (px)
Citation preview

Facility Management Reporting in Facilities: The
Value of Metrics & KPIs
Laurie Gilmer, PE, CFM, SFP, LEED AP, CxAFacility Engineering Associates

Meet Our Presenter:
Laurie Gilmer, PE, CFM, LEEDAP, CxAVice President
Facility Engineering Associates
• Lead FEA’s Facility Services division
• SME for IFMA’s Measurement, Monitoring & Reporting task group
• IFMA Instructor and serves as Chair of IFMA’s Scheme Committee for the SFP credential
• Co-authored the second manual in the sustainability “How-to Guide” series, EPA’s ENERGY STAR Portfolio Manager
Learning Objectives
• Understand the role of organizational drivers in choosing KPIs
• Choose the right metrics and KPIs
• Demonstrate alignment with organizational mission
• Identify the elements of a good facility management report - who are your stakeholders and what do they need to hear?

Agenda
• Demonstrating alignment
• Connecting with stakeholders
• Elements of a good report

Starting with the end in mind…
doesn’t mean skipping to the end.

1. Customer Satisfaction – Customer 2. Top Ten WO Trouble Codes3. Workforce Productivity - Process4. WOs Initiated by Staff as Result of Inspections/RCM5. PM to CM Ratio6. PM Schedule Completion Rate7. Workforce Productivity8. Work Distribution by Type9. Open Work Orders (WO) by Type10. WO Completion Targets11. Change in Facility Condition Index (FCI) - Financial
“We want to use industry standard KPIs.”

What is Important to Your Organization?

What is Important to Your Organization?
Be the best widget producer in our industry
Provide world class guest
service
Preserve our nation’s
treasures
Be a world class educational institution
Provide quality goods at a good price to our
customers
Maximize profit to our investors
Provide full service to our
clienteleExtend and preserve life
What does this mean for facilities?

Organizational Strategy• Produce a product or
provide a service• Satisfy stakeholders• Generate revenue
FM DriversCommunity commitments, Sustainability
initiatives, Regulatory requirements
Strategic Facility PlanOperational Structure
Supports , aligns with organizational strategy and FM Drivers
Operations Policies and Procedures
• Tactical initiatives
Operational Planning• Work Management• Measurement & Reporting
MissionVisionValues
Drives
Inspires
Influences Supports
Creates
Facility Management
Operations
Organization
Alignment

Internal Stakeholders
Facilities
Buildings
Architectural & Interiors
MEP
Grounds
Landscaping Infrastructure
Services
Access ControlCatering &
Conferences
Customers Support Services• HR, IT Finance• Service Providers• Vendor

Metrics vs. KPIs
Metrics
KPIs
A KPI is a core metric that defines top level success

KPI
Management
Process
1
2
3
Strategic Level(Reporting Value)
Tactical Level(Data)
Management Metrics (MMs)
Key Performance Indicators (KPIs)
Process metrics
Metrics at Organizational Levels
Tact
ical
Str
ateg
ic

Organizational Strategy• Produce a product or
provide a service• Satisfy stakeholders• Generate revenue
FM DriversCommunity commitments, Sustainability
initiatives, Regulatory requirements
Strategic Facility PlanOperational Structure
Supports , aligns with organizational strategy and FM Drivers
Operations Policies and Procedures
• Tactical initiatives
Operational Planning• Work Management• Measurement & Reporting
MissionVisionValues
Strategic Level(Reporting Value)
Key Performance Indicators (KPIs)
Management Metrics (MMs)
Operations
Management Level
KPIs: the most important performance
indicators without which the organization
would not be able to fulfill its mission. These
KPIs often tell the story of customer
satisfaction, commitment to corporate social
responsibility (CSR), and how well facilities
support business objectives.
Data• Cost• Labor Needs• Process Efficiency• Customer
Satisfaction
Process Metrics

Defining Outcomes
Desired Outcome How Will You Know?
Have great customer service • Timeliness of response• Reliability of services• Work quality• Positive interactions
Manage finances well • Improve capital budgeting process for long term needs
• Cost effectiveness of work performed• Cost of facilities
Reduce down-time • Manage scheduled down-time for lowest impact
• Improve critical system reliability• Perform the right about of maintenance
at the right time

Choosing Metrics
Desired Outcome How Will You Know?
Have great customer service • Timeliness of response• Reliability of services• Work quality• Positive interactions
Manage finances well • Improve capital budgeting process for long term needs
• Cost effectiveness of work performed• Cost of facilities
Reduce down-time • Manage scheduled down-time for lowest impact
• Improve critical system reliability• Perform the right about of maintenance
at the right time
Be the best widget producer in our industry

How Many Things Can You Measure?

Metrics Can Also Be Driven By…
1. Financial performance requirements
2. Mandatory reporting requirements (resource use, pollution)
3. Voluntary reporting requirements (corporate citizenship)

Financial Drivers
1. How much money do we need?
2. Where should it be directed?
3. How do we know we are using our resources wisely?

“…It is therefore the policy of the United
States that Federal agencies shall
increase energy efficiency; measure,
report, and reduce their greenhouse gas
emissions from direct and indirect
activities; conserve and protect water
resources through efficiency, reuse, and
stormwater management; eliminate waste,
recycle, and prevent pollution; leverage
agency acquisitions to foster markets for
sustainable technologies…”
-Federal Executive Order 13514
October 8, 2009
Mandatory Reporting

Environmental Performance Indicators (9 Aspects)
• Materials• Energy• Water• Biodiversity• Emissions, Effluents, Waste• Products and Services• Compliance• Transport• Overall
Global Reporting Framework
Voluntary Reporting

Voluntary and Mandatory Disclosure

Linking Information to the SourceCommonly Measured BAS EMS FM Information
SystemsOther Internal
SystemsStaff Internal
SurveysUtility Companies Service Companies
& Vendors
Facility Info
Occupancy
Space Use
Floor area
Energy Use
Electricity
Natural Gas
Diesel
GHGs
IEQCO2
Thermal Comfort
PurchasingConstruction
Consumables
FF&E
Water Source
Consumption
Uses
Waste Stream
Waste
Diversion Rate
Recycling
People stuffComplaints
Noise
Ergonomics
Sick days
Productivity?
OH&S?
SiteWaste water

Agenda
• Demonstrating alignment
• Connecting with stakeholders
• Elements of a good report

We Started Here…
What is Important to
Your Organization?
Now, tell the story!

The Perception: Facilities is a Cost Center

Facilities is an Investment in Organizational Success
The FM’s challenge:• Reduce Cost• Add Value

• Know how your organization views facilities, numbers and finance, and the intangibles
• Think (slow)!
• Know how your organization makes decisions
Understand How Decisions Are Made

Thinking Fast and SlowSystem 1 System 2
• Automatic• Instinctive• Emotional
• Slow• Logical• Deliberate

Understand How People Think
Insufficient Motivation
Cognitive Biases

Cognitive Biases that Effect Business Decisions
• Excessive Optimism
• Confirmation
• Loss Aversion
• Sunk-Cost Fallacy
• Status Quo

1
2
3
Management Reports(Weekly, Monthly)
Organizational Report(Quarterly, Annually)
Operations Reports(Daily)
Reporting at Organizational Levels
Tact
ical
Str
ateg
ic
Agenda
• Demonstrating alignment
• Connecting with stakeholders
• Elements of a good report

Purpose of a Report
Organizational Strategy• Produce a product or
provide a service• Satisfy stakeholders• Generate revenue
FM DriversCommunity commitments, Sustainability
initiatives, Regulatory requirements
Strategic Facility PlanOperational Structure
Supports , aligns with organizational strategy and FM Drivers
Operations Policies and Procedures
• Tactical initiatives
Operational Planning• Work Management• Measurement & Reporting
MissionVisionValues
Drives
Inspires
Influences Supports
Creates
Facility Management
Operations
Organization
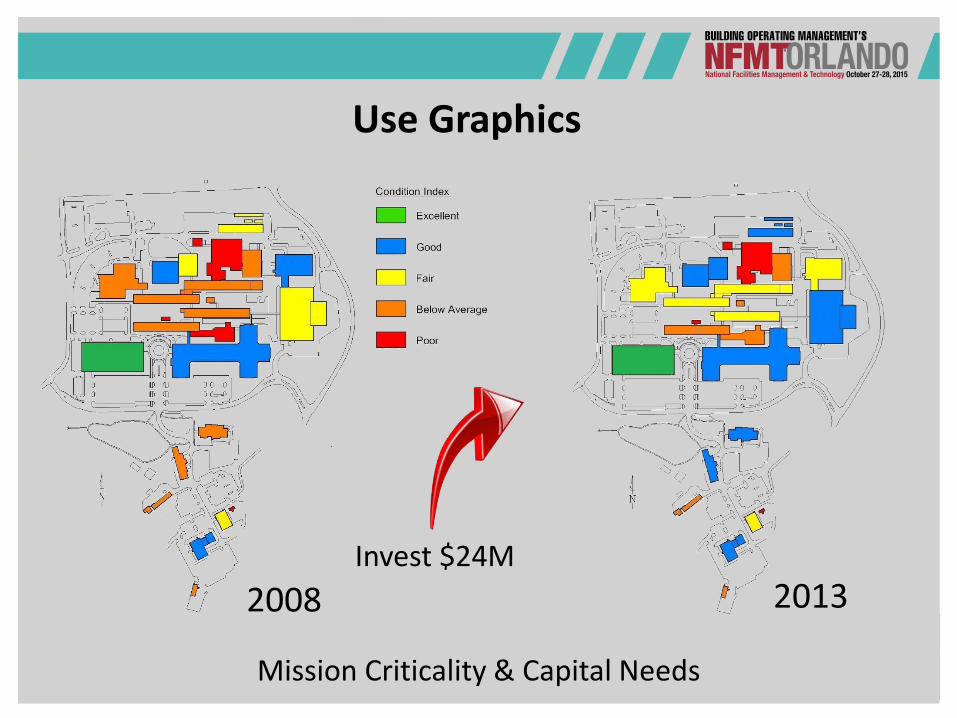
Mission Criticality & Capital Needs
2008 2013Invest $24M
Use Graphics

Reducing sick time by
• 1 day
• per employee
• per year…
Estimated savings: $105,000 each year
0
2
4
6
8
10
12
14
16
18
Avg
An
nu
al
Sic
k D
ays
per
Em
plo
yee
2003 2004 2005 2006 2007 2008
Year
Through these programs, the company reduced employee sick time
Based on 1,750 employees, average cost $60/employee
Healthy People Impact Profits
Use Trends

$0.00
$10,000.00
$20,000.00
$30,000.00
$40,000.00
$50,000.00
$60,000.00
2008 2009 2010
Electricity = 75% of energy cost
Annual energy cost ≈ $9.75 - $12/GSF
Natural Gas Electricity
Use Trends

$-
$2.00
$4.00
$6.00
$8.00
$10.00
$12.00
-
500,000
1,000,000
1,500,000
2,000,000
2,500,000
3,000,000
2010 2011 2012
En
erg
y C
on
su
pti
on
(kB
tu)
Total Elec Usage (kBtu) Total Gas Usage (kBtu) Annual Cost/SF
Include the Future
2014 2015 2016

Sketch it Out

• Succinct
• Targeted
• Evoke a response
A good report will be…

6 Tips for Success
1. Know your audience and how people think
2. Sketch it out
3. Use graphics
4. Use trends
5. Include the future as well as the past
6. Keep the focus on the right information
Telling the Story

Summary• Organizational drivers inform metrics and KPIs
• Metrics & KPIs: be selective
• Demonstrate alignment with organizational mission
• A well crafted report tells your audience what they need to understand past performance and future expectations