Embed Size (px)
Citation preview
Research ArticleFacile Preparation of ZnO Nanoparticles and Ag/ZnONanocomposite and Their Photocatalytic Activities underVisible Light
Thi Anh Tuyet Pham,1 Van Anh Tran,1 Van Duong Le,1 Minh Viet Nguyen,2
Duc Duc Truong,1 Xuan Truong Do,1 and Anh-Tuan Vu 1
1School of Chemical Engineering, Hanoi University of Science and Technology, Hanoi, Vietnam2Faculty of Chemical Engineering, Hanoi University of Industry, Vietnam
Correspondence should be addressed to Anh-Tuan Vu; [email protected]
Received 11 August 2020; Revised 10 September 2020; Accepted 7 October 2020; Published 22 October 2020
Academic Editor: Hao Li
Copyright © 2020 Thi Anh Tuyet Pham et al. This is an open access article distributed under the Creative Commons AttributionLicense, which permits unrestricted use, distribution, and reproduction in any medium, provided the original work isproperly cited.
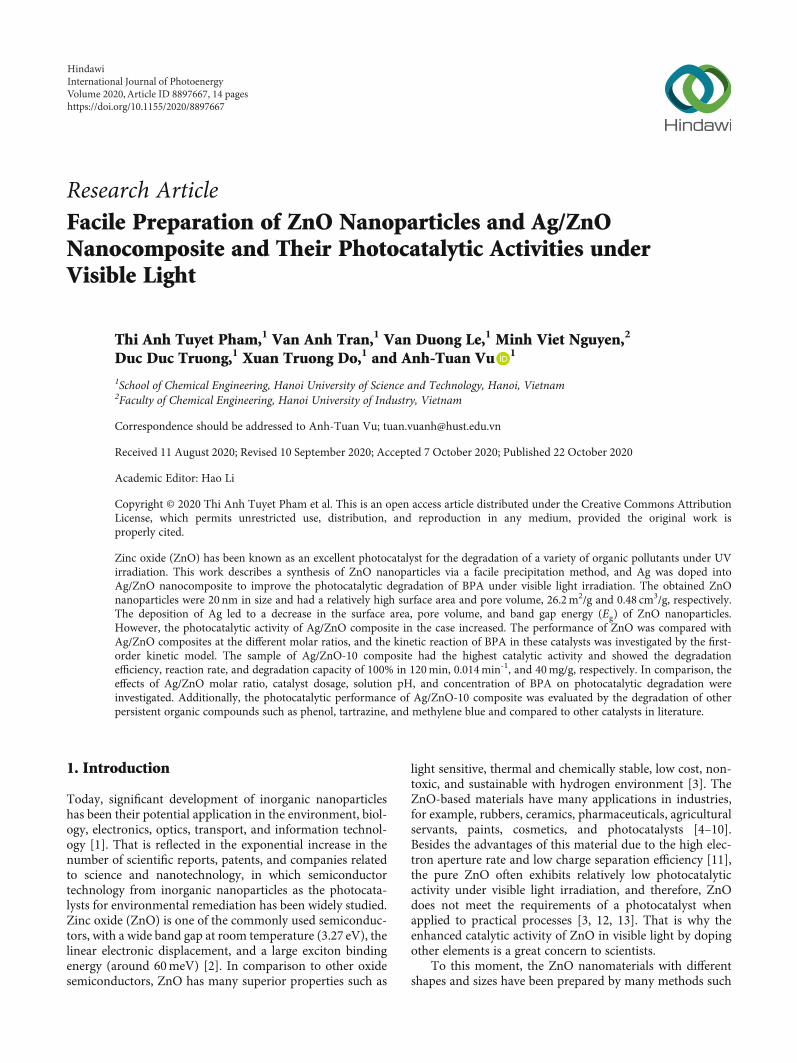
Zinc oxide (ZnO) has been known as an excellent photocatalyst for the degradation of a variety of organic pollutants under UVirradiation. This work describes a synthesis of ZnO nanoparticles via a facile precipitation method, and Ag was doped intoAg/ZnO nanocomposite to improve the photocatalytic degradation of BPA under visible light irradiation. The obtained ZnOnanoparticles were 20 nm in size and had a relatively high surface area and pore volume, 26.2m2/g and 0.48 cm3/g, respectively.The deposition of Ag led to a decrease in the surface area, pore volume, and band gap energy (Eg) of ZnO nanoparticles.However, the photocatalytic activity of Ag/ZnO composite in the case increased. The performance of ZnO was compared withAg/ZnO composites at the different molar ratios, and the kinetic reaction of BPA in these catalysts was investigated by the first-order kinetic model. The sample of Ag/ZnO-10 composite had the highest catalytic activity and showed the degradationefficiency, reaction rate, and degradation capacity of 100% in 120min, 0.014min-1, and 40mg/g, respectively. In comparison, theeffects of Ag/ZnO molar ratio, catalyst dosage, solution pH, and concentration of BPA on photocatalytic degradation wereinvestigated. Additionally, the photocatalytic performance of Ag/ZnO-10 composite was evaluated by the degradation of otherpersistent organic compounds such as phenol, tartrazine, and methylene blue and compared to other catalysts in literature.
1. Introduction
Today, significant development of inorganic nanoparticleshas been their potential application in the environment, biol-ogy, electronics, optics, transport, and information technol-ogy [1]. That is reflected in the exponential increase in thenumber of scientific reports, patents, and companies relatedto science and nanotechnology, in which semiconductortechnology from inorganic nanoparticles as the photocata-lysts for environmental remediation has been widely studied.Zinc oxide (ZnO) is one of the commonly used semiconduc-tors, with a wide band gap at room temperature (3.27 eV), thelinear electronic displacement, and a large exciton bindingenergy (around 60meV) [2]. In comparison to other oxidesemiconductors, ZnO has many superior properties such as
light sensitive, thermal and chemically stable, low cost, non-toxic, and sustainable with hydrogen environment [3]. TheZnO-based materials have many applications in industries,for example, rubbers, ceramics, pharmaceuticals, agriculturalservants, paints, cosmetics, and photocatalysts [4–10].Besides the advantages of this material due to the high elec-tron aperture rate and low charge separation efficiency [11],the pure ZnO often exhibits relatively low photocatalyticactivity under visible light irradiation, and therefore, ZnOdoes not meet the requirements of a photocatalyst whenapplied to practical processes [3, 12, 13]. That is why theenhanced catalytic activity of ZnO in visible light by dopingother elements is a great concern to scientists.
To this moment, the ZnO nanomaterials with differentshapes and sizes have been prepared by many methods such
HindawiInternational Journal of PhotoenergyVolume 2020, Article ID 8897667, 14 pageshttps://doi.org/10.1155/2020/8897667
as hydrothermal, emulsion, chemical vaporization, and com-bustion methods [14–17]. Each method has its advantagesand limitations. The hydrothermal method encounters a dif-ficulty to adjust the shape of the material, and the obtainedZnO is often the rode and plate shapes; in the emulsionmethods usually toxic solvents are used; the chemical evapo-ration method has a low efficiency leading to the high cost ofmaterials; the combustion method faces difficulty in adjust-ing the particle sizes [18]. Therefore, a facile method forproducing ZnO having high production and small particlesizes, at the same time an improved photocatalytic activity,is a crucial aspect for practical applications.
BPA (2,2-bis(4-hydroxyphenyl)propane) is chosen to bethe starting material for many synthetic plastics, mainly somepolycarbonates and epoxy resins, as well as certain polysul-fones and certain suitable materials because BPA-based plas-tics are strong and tough. It is used in many popularconsumer goods, such as plastic bottles, sports equipment,lining of water pipes, CDs, and DVDs [19]. About 4 milliontons of BPA chemicals are produced every year to producepolycarbonates, which makes BPA one of the most producedchemicals worldwide. BPA is suspected of being contami-nated with food (soluble in food) and has negative healtheffects such as changes in immune function, cardiovasculardisorders, cancer, and infertility [20–23]. It can be found innatural water as a consequence of untreated industrial efflu-ent, and it is very dangerous in the aquatic ecosystem dueto its role as an estrogen receptor agonist [24]. Accordingto the current U.S. Environmental Protection Agency stan-dard evaluation procedures, Bisphenol A was moderately toslightly toxic to the fish and invertebrates tested, with LC50or EC50 values from 1.1 to 10mg/L. These data did nottrigger freshwater or saltwater chronic tests [22]. Therefore,it is imperative and urgent to find a method to remove BPAfrom contaminated water.
Over the past decades, the treatment of BPA in the envi-ronment has been studied using many different approaches.Various technologies have been tested to remove BPA fromwastewater like adsorption [25, 26], reverse osmosis [27],mechanical method [28], advanced oxidation processes byFenton system [29], and photodegradation [30–32]. How-ever, due to its eco-friendly operations, which do not createbyproducts in the process, photodegradation has been pre-ferred and extensively used. When a photocatalyst absorbslight irradiation for generating charge carriers and shiftingelectrons from the valence band (VB) to the conduction band(CB), photodegradation reaction occurs on its active surfacethrough the formation of ⋅OH and ⋅O2
-, which rapidly break-down target pollutants into the end products of CO2 andH2O [33].
There have been many studies on synthesizing ZnO-based materials to decompose toxic organic substances inwastewater [9, 34–37], in which ZnO/TiO2 and ZnO/rGO-rGH showed the effective materials of degrading BPA underUV irradiation [38, 39]. However, the use of UV light canaffect the ecosystem as well as it is much more expensive thanusing visible light. Thereby, it is essential to improve the vis-ible light absorption of ZnO by loading noble metal (Au, Ag,Pt, and Ru) [40]. On the other hand, modifying ZnO with
noble metal nanoparticles also has attracted attention dueto promoting the separation of photogenerated charges inphotocatalysts through the formation of Schottky barrierand improving the photocatalytic stability [41, 42]. Amongthe various noble metal-semiconductor photocatalysts,Ag/ZnO can generate an effective Schottky barrier at thejunction interface, supporting electron capture, therebyincreasing the separation efficiency of electron-hole pairsand boost visible light harvesting capability.
In this study, a facile precipitation method was used tosynthesize ZnO nanomaterials, and then, Ag was doped intoAg/ZnO composite with the different molar ratios. As-synthesized samples were characterized by the X-ray powderdiffraction (XRD), the field emission scanning electronmicroscopy (FE-SEM), the transmission electron microscopy(TEM), the Fourier transform infrared spectroscopy (FTIR),and the UV-Vis diffuse reflectance spectra (DR-UV-Vis).The performance of the catalyst was evaluated by degradingBPA in water under visible light irradiation. The effects ofAg/ZnO molar ratio, a catalyst dosage, concentration ofBPA, and solution pH on photocatalytic degradation ofBPA were investigated. Ag was doped to enhance the photo-catalytic performance of Ag/ZnO composite with the degra-dation of BPA. The effects of the Ag content, a dosagecatalyst, a BPA concentration, and pH solution on degrada-tion efficiency of BPA under visible light irradiation wereinvestigated. The optimal reaction conditions and the photo-catalytic performance of Ag/ZnO-10 composite were evalu-ated by degradation of other persistent organic compoundssuch as phenol, tartrazine (TA), and methylene blue (MB).
2. Materials and Methods
2.1. Materials. Bisphenol A (99%) was purchased fromSigma-Aldrich. AgNO3 (99.8%), Zn(NO3)2·6H2O (99%),hexamethylenetetramine (C6H12N4, 99%), trisodium citrate(C6H5NaO7S·2H2O, 99%), and sodium borohydride(NaBH4, 98%) were obtained from Merck. All reagents wereused without any further purification. Distilled water wasused throughout all experiments.
2.2. Preparation of ZnO. Nano ZnO modified from the pre-cipitation method in the previous report [3]. Typically,0.02mol of Zn(NO3)2·6H2O, 0.02mol of hexamethylenetet-ramine, and 0.01mol of trisodium citrate were dissolved in100mL distilled water; the solution was stirred and heatedup to 90°C and then was kept at this temperature for 1 h with-out stirring. The precipitate was filtered and washed severaltimes with distilled water. The powder was dried at 80°Covernight and calcined at 400°C for 2 h at a heating rate of1°C/min to obtain nano ZnO.
2.3. Preparation of Nanocomposite Ag/ZnO. Typically, 1 g ofZnO and 0.1052 g of NaBH4 were dissolved in 50mL ofdistilled water. An amount of AgNO3 corresponding to adesired molar ratio of Ag/ZnO was added into the solution.In this study, molar ratios of 2, 5, 10, and 10 were selectedto investigate the effect of Ag content on photodegradationof BPA. The mixture was stirred for 1 h at 60°C and then
2 International Journal of Photoenergy
filtered and washed several times with distilled water. Thegrey powder obtained after drying overnight at 60°C wasdenoted as Ag/ZnO-x, in which x is the molar ratio ofAg/ZnO.
2.4. Characterization. The crystalline phase of samples wasinvestigated by the X-ray powder diffraction. XRD patternswere obtained by using the Bruker D8 Ax XRD diffractome-ter (Germany) with Cu Kα irradiation (40 kV, 40mA). The2θ ranging from 20 to 80° was selected for analyzing the crys-tal structure. The morphology and size of the samples wereobserved by transmission electron microscopy (TEM, JEM-2010). The morphology and size of the samples wereobserved by field emission scanning electron microscopy(FE-SEM, JEOL-7600F). The chemical composition of thecomposite was determined by energy dispersive spectrome-try (EDS: JEOL-7600F). The textural properties weremeasured via N2 adsorption/desorption isotherms using aMicromeritics (Gemini VII analyzer). The Fourier transforminfrared spectroscopy (FTIR, Madison, WI, USA) measure-ment was carried out to explore the changes in functionalgroups of Ag/ZnO by Nicolet IS50. UV-Vis diffuse reflec-tance spectra of the as-synthesized samples were measuredon a UV-Vis-NIR spectrometer (Cary 500).
2.5. Photocatalytic Experiment. The photodegradation ofBPA was performed in a Pyrex beaker using the as-synthesized sample as a photocatalyst under visible light(250W Hg lamp). BPA (20mg/L) solution was prepared in100mL distilled water and mixed with 50mg of catalyst.The mixture was stirred at a constant rate of 200 rpm. At reg-ular time intervals for 30min, analysis samples were takenfrom the reaction suspension and then filtered by a syringefilter (0.45μm PTFE membrane) to remove the catalyst.The BPA concentration of the filtrate was analyzed by aUV-Vis spectrophotometer (Agilent 8453) at the maximumabsorbance wavelength of 277 nm. The degradationefficiency and degradation capacity of BPA were calculatedby the following equations:
Degradation efficiency %ð Þ = C0−CtC0
× 100, ð1Þ
Degradation capacitymgg
� �=
C0−Ctð Þ ×Vm
: ð2Þ
The degradation rate of BPA was determined by fittingthe degradation profile with the first-order kinetic model, aspresented by the following equation:
lnC0Ct
= kap × t, ð3Þ
where kap (min-1) is the rate constant, C0 is the initialconcentration of dye, Ct is the concentration of BPA in time(mg/L), V is the volume of BPA solution (L),m is the mass ofthe catalyst (g), and t is the reaction time (min).
3. Results and Discussion
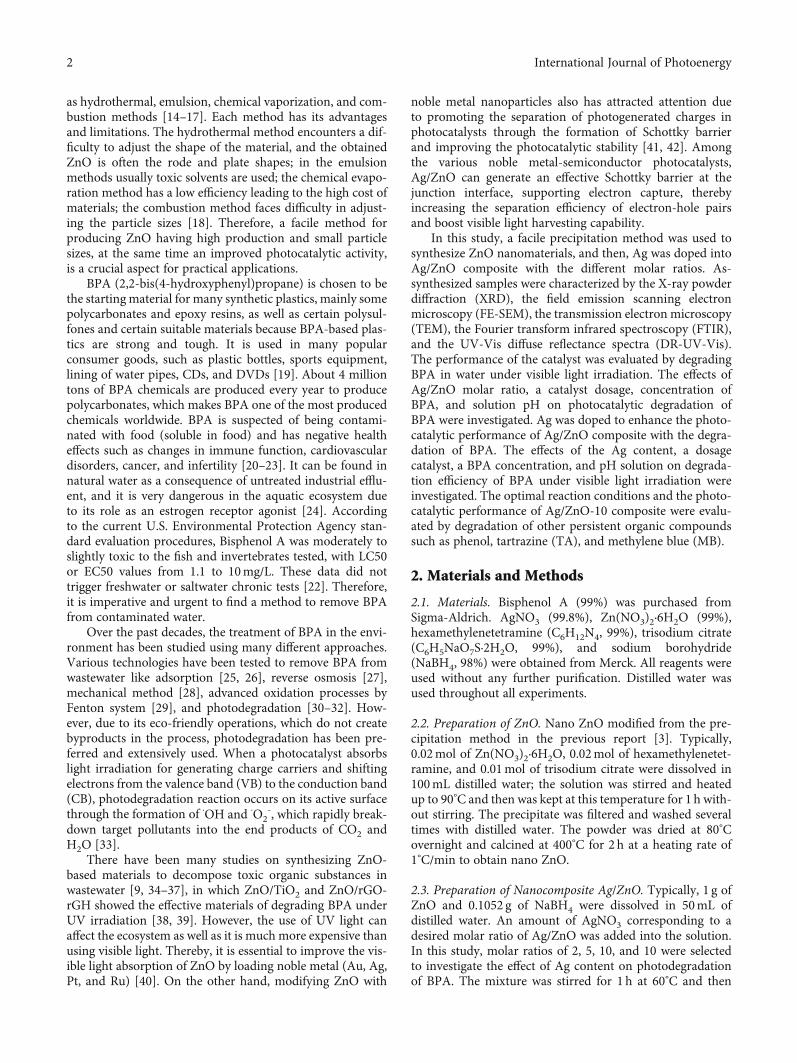
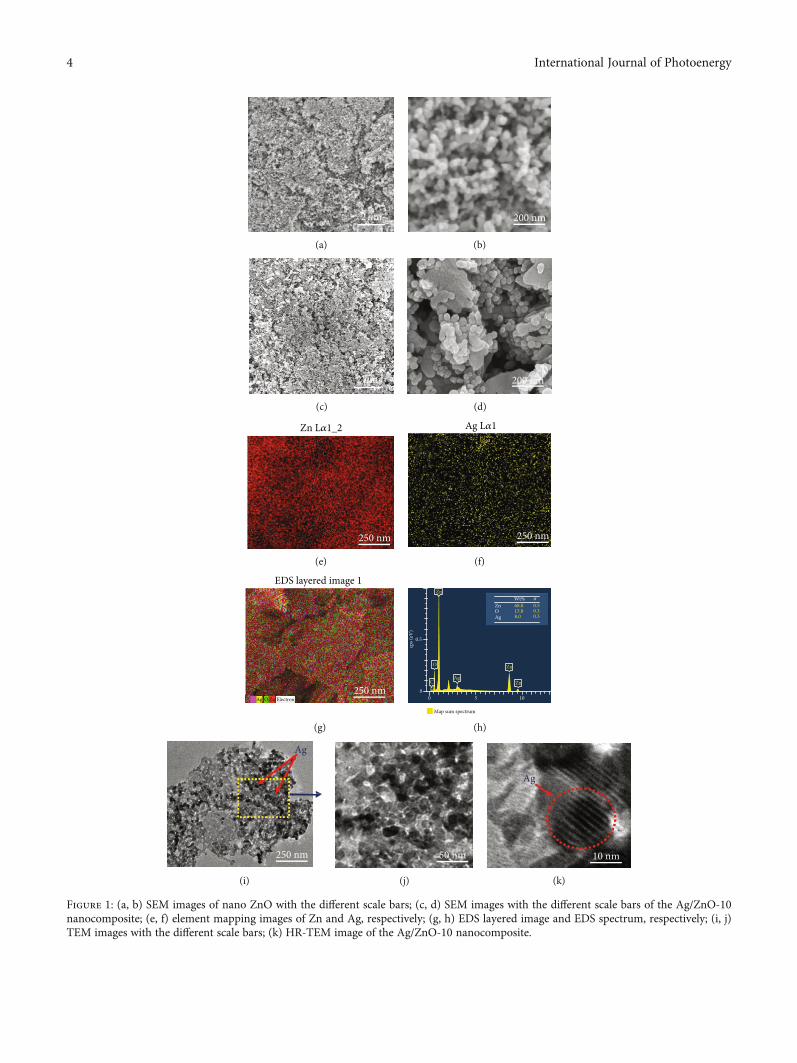
3.1. Characterization of the Catalyst. Figure 1 shows the SEM,EDS, and TEM images of the ZnO and Ag/ZnO-10 nano-composite. ZnO showed an aggregated morphology(Figure 1(a)) consisting of many small particles with approx-imately 20nm in size (Figure 1(b)). When Ag was doped intothe composite, the morphology of Ag/ZnO-10 at low magni-fication (Figure 1(c)) was like ZnO, but at the higher magni-fication, it showed more aggregate than ZnO, and theAg/ZnO sheets were observed in Figure 1(d). The elementalmaps for Ag and Zn shown in Figures 1(e) and 1(f) indicateda good dispersion of Ag in the composite; nanoparticles wereobserved with high dispersion in the EDS layered image(Figure 1(g)). The EDS spectrum in Figure 1(h) showed theAg, Zn, and O elements at the contents of 8.0, 68.0, and15.8%, respectively. The TEM images (Figures 1(i) and 1(j))and HR-TEM image (Figure 1(k)) gave the additional evi-dence of the dispersion of Ag in composite; Ag was crystalparticles with the particle size of about 10-20 nm inFigures 1(i)–1(k). This result was consistent with theobtained results from SEM and element mapping.
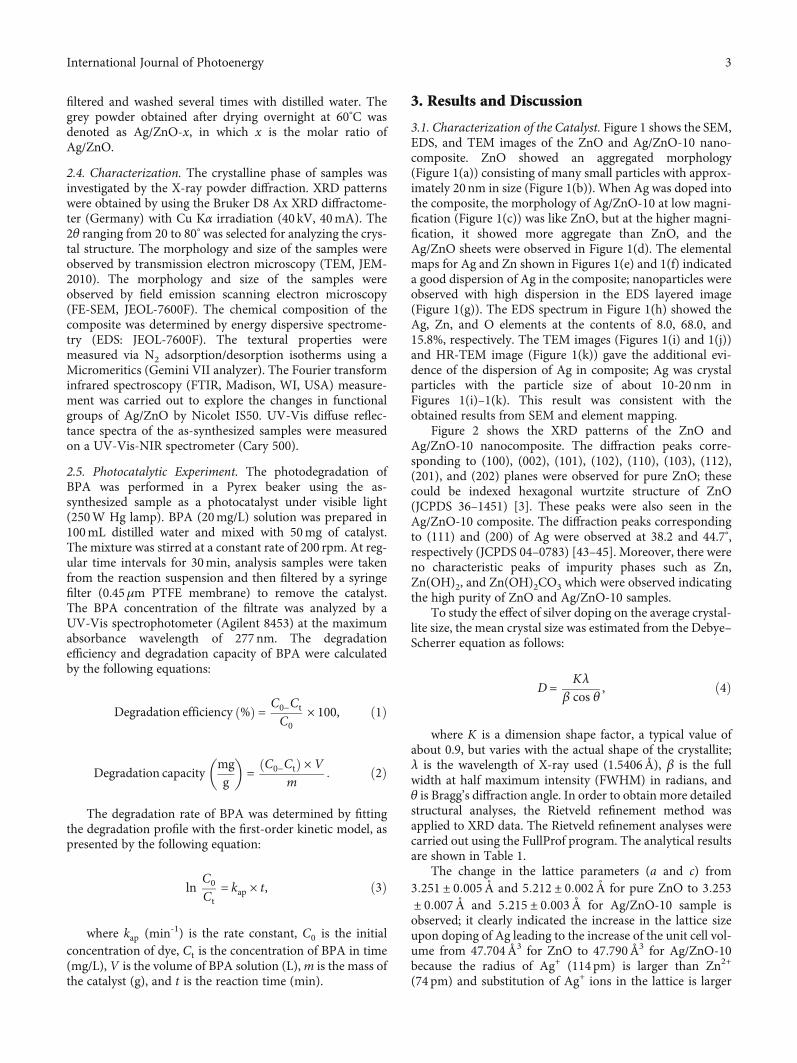
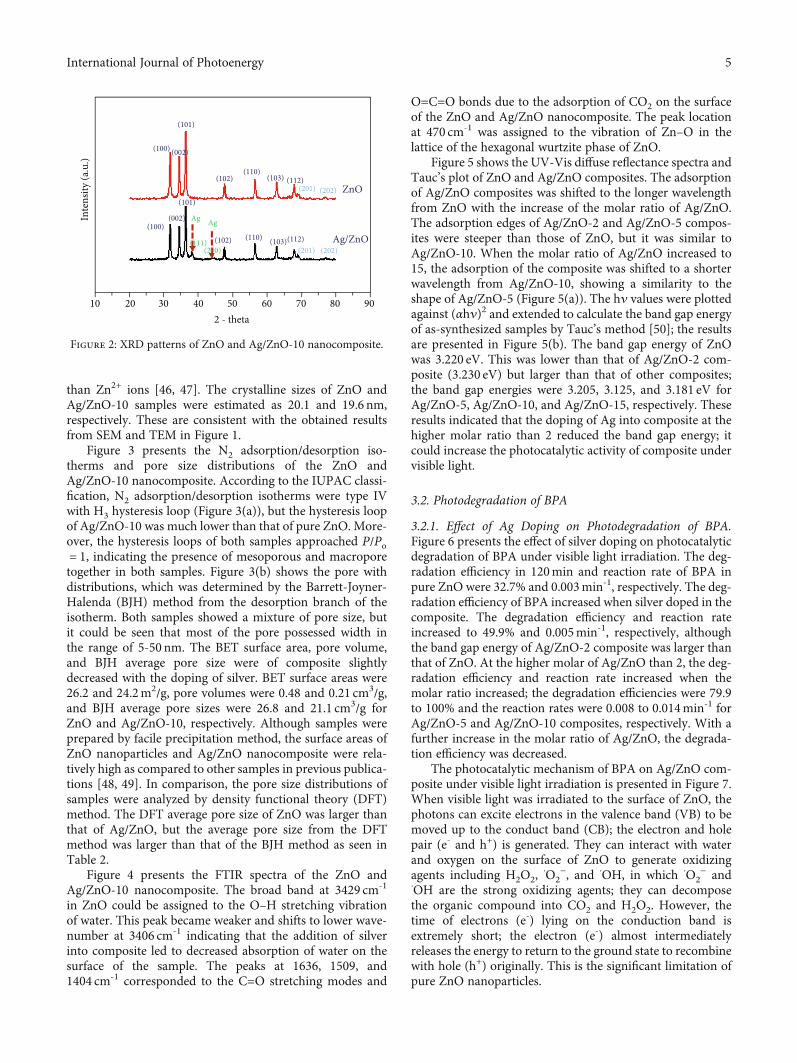
Figure 2 shows the XRD patterns of the ZnO andAg/ZnO-10 nanocomposite. The diffraction peaks corre-sponding to (100), (002), (101), (102), (110), (103), (112),(201), and (202) planes were observed for pure ZnO; thesecould be indexed hexagonal wurtzite structure of ZnO(JCPDS 36–1451) [3]. These peaks were also seen in theAg/ZnO-10 composite. The diffraction peaks correspondingto (111) and (200) of Ag were observed at 38.2 and 44.7°,respectively (JCPDS 04–0783) [43–45]. Moreover, there wereno characteristic peaks of impurity phases such as Zn,Zn(OH)2, and Zn(OH)2CO3 which were observed indicatingthe high purity of ZnO and Ag/ZnO-10 samples.
To study the effect of silver doping on the average crystal-lite size, the mean crystal size was estimated from the Debye–Scherrer equation as follows:
D =Kλ
β cos θ, ð4Þ
where K is a dimension shape factor, a typical value ofabout 0.9, but varies with the actual shape of the crystallite;λ is the wavelength of X-ray used (1.5406Å), β is the fullwidth at half maximum intensity (FWHM) in radians, andθ is Bragg’s diffraction angle. In order to obtain more detailedstructural analyses, the Rietveld refinement method wasapplied to XRD data. The Rietveld refinement analyses werecarried out using the FullProf program. The analytical resultsare shown in Table 1.
The change in the lattice parameters (a and c) from3:251 ± 0:005Å and 5:212 ± 0:002Å for pure ZnO to 3:253± 0:007Å and 5:215 ± 0:003Å for Ag/ZnO-10 sample isobserved; it clearly indicated the increase in the lattice sizeupon doping of Ag leading to the increase of the unit cell vol-ume from 47.704Å3 for ZnO to 47.790Å3 for Ag/ZnO-10because the radius of Ag+ (114 pm) is larger than Zn2+
(74 pm) and substitution of Ag+ ions in the lattice is larger
3International Journal of Photoenergy
2 𝜇m
(a)
200 nm
(b)
2 𝜇m
(c)
200 nm
(d)
Zn L𝛼1_2
250 nm
(e)
Ag L𝛼1
250 nm
(f)
EDS layered image 1
250 nmAg O Zn Electron
(g)
00 5 10
Zn
Zn
68.0 0.50.30.3
15.88.0
Ag
O
C
0.5
ZnWt%
Map sum spectrum
𝜎
OAg
cps (
eV)
Zn
(h)
250 nm
Ag
(i)
50 nm
(j)
10 nm
Ag
(k)
Figure 1: (a, b) SEM images of nano ZnO with the different scale bars; (c, d) SEM images with the different scale bars of the Ag/ZnO-10nanocomposite; (e, f) element mapping images of Zn and Ag, respectively; (g, h) EDS layered image and EDS spectrum, respectively; (i, j)TEM images with the different scale bars; (k) HR-TEM image of the Ag/ZnO-10 nanocomposite.
4 International Journal of Photoenergy
than Zn2+ ions [46, 47]. The crystalline sizes of ZnO andAg/ZnO-10 samples were estimated as 20.1 and 19.6 nm,respectively. These are consistent with the obtained resultsfrom SEM and TEM in Figure 1.
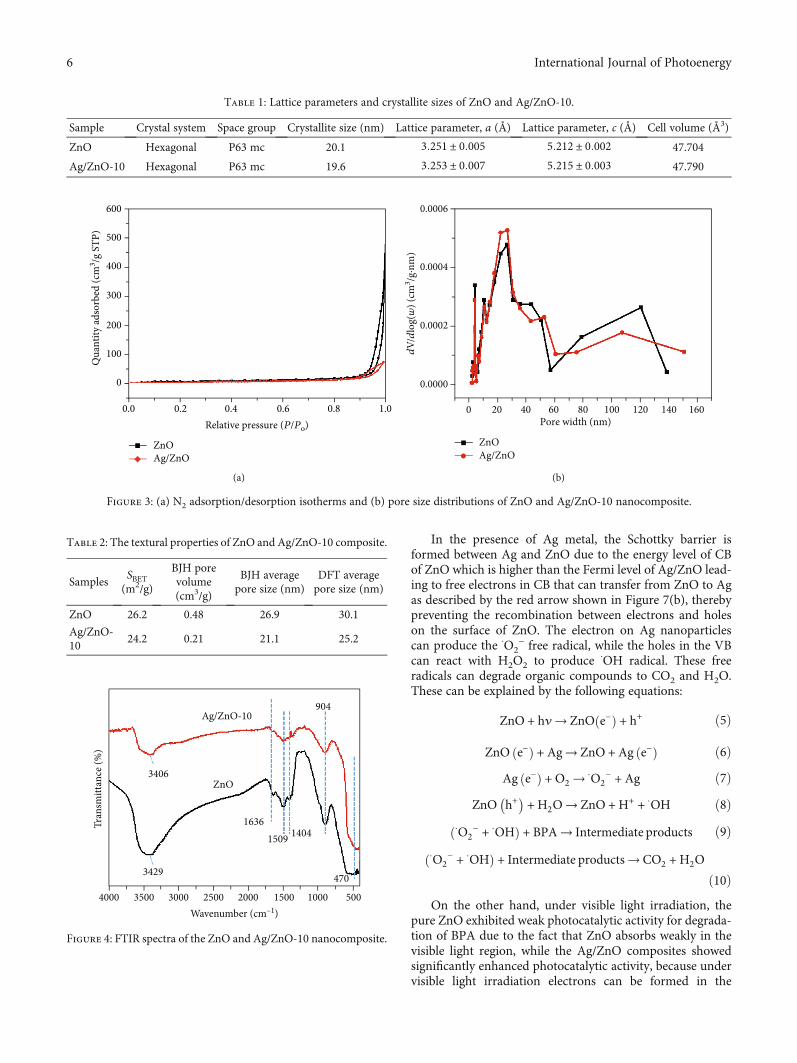
Figure 3 presents the N2 adsorption/desorption iso-therms and pore size distributions of the ZnO andAg/ZnO-10 nanocomposite. According to the IUPAC classi-fication, N2 adsorption/desorption isotherms were type IVwith H3 hysteresis loop (Figure 3(a)), but the hysteresis loopof Ag/ZnO-10 was much lower than that of pure ZnO. More-over, the hysteresis loops of both samples approached P/Po= 1, indicating the presence of mesoporous and macroporetogether in both samples. Figure 3(b) shows the pore withdistributions, which was determined by the Barrett-Joyner-Halenda (BJH) method from the desorption branch of theisotherm. Both samples showed a mixture of pore size, butit could be seen that most of the pore possessed width inthe range of 5-50 nm. The BET surface area, pore volume,and BJH average pore size were of composite slightlydecreased with the doping of silver. BET surface areas were26.2 and 24.2m2/g, pore volumes were 0.48 and 0.21 cm3/g,and BJH average pore sizes were 26.8 and 21.1 cm3/g forZnO and Ag/ZnO-10, respectively. Although samples wereprepared by facile precipitation method, the surface areas ofZnO nanoparticles and Ag/ZnO nanocomposite were rela-tively high as compared to other samples in previous publica-tions [48, 49]. In comparison, the pore size distributions ofsamples were analyzed by density functional theory (DFT)method. The DFT average pore size of ZnO was larger thanthat of Ag/ZnO, but the average pore size from the DFTmethod was larger than that of the BJH method as seen inTable 2.
Figure 4 presents the FTIR spectra of the ZnO andAg/ZnO-10 nanocomposite. The broad band at 3429 cm-1
in ZnO could be assigned to the O–H stretching vibrationof water. This peak became weaker and shifts to lower wave-number at 3406 cm-1 indicating that the addition of silverinto composite led to decreased absorption of water on thesurface of the sample. The peaks at 1636, 1509, and1404 cm-1 corresponded to the C=O stretching modes and
O=C=O bonds due to the adsorption of CO2 on the surfaceof the ZnO and Ag/ZnO nanocomposite. The peak locationat 470 cm-1 was assigned to the vibration of Zn–O in thelattice of the hexagonal wurtzite phase of ZnO.
Figure 5 shows the UV-Vis diffuse reflectance spectra andTauc’s plot of ZnO and Ag/ZnO composites. The adsorptionof Ag/ZnO composites was shifted to the longer wavelengthfrom ZnO with the increase of the molar ratio of Ag/ZnO.The adsorption edges of Ag/ZnO-2 and Ag/ZnO-5 compos-ites were steeper than those of ZnO, but it was similar toAg/ZnO-10. When the molar ratio of Ag/ZnO increased to15, the adsorption of the composite was shifted to a shorterwavelength from Ag/ZnO-10, showing a similarity to theshape of Ag/ZnO-5 (Figure 5(a)). The hν values were plottedagainst (αhν)2 and extended to calculate the band gap energyof as-synthesized samples by Tauc’s method [50]; the resultsare presented in Figure 5(b). The band gap energy of ZnOwas 3.220 eV. This was lower than that of Ag/ZnO-2 com-posite (3.230 eV) but larger than that of other composites;the band gap energies were 3.205, 3.125, and 3.181 eV forAg/ZnO-5, Ag/ZnO-10, and Ag/ZnO-15, respectively. Theseresults indicated that the doping of Ag into composite at thehigher molar ratio than 2 reduced the band gap energy; itcould increase the photocatalytic activity of composite undervisible light.
3.2. Photodegradation of BPA
3.2.1. Effect of Ag Doping on Photodegradation of BPA.Figure 6 presents the effect of silver doping on photocatalyticdegradation of BPA under visible light irradiation. The deg-radation efficiency in 120min and reaction rate of BPA inpure ZnO were 32.7% and 0.003min-1, respectively. The deg-radation efficiency of BPA increased when silver doped in thecomposite. The degradation efficiency and reaction rateincreased to 49.9% and 0.005min-1, respectively, althoughthe band gap energy of Ag/ZnO-2 composite was larger thanthat of ZnO. At the higher molar of Ag/ZnO than 2, the deg-radation efficiency and reaction rate increased when themolar ratio increased; the degradation efficiencies were 79.9to 100% and the reaction rates were 0.008 to 0.014min-1 forAg/ZnO-5 and Ag/ZnO-10 composites, respectively. With afurther increase in the molar ratio of Ag/ZnO, the degrada-tion efficiency was decreased.
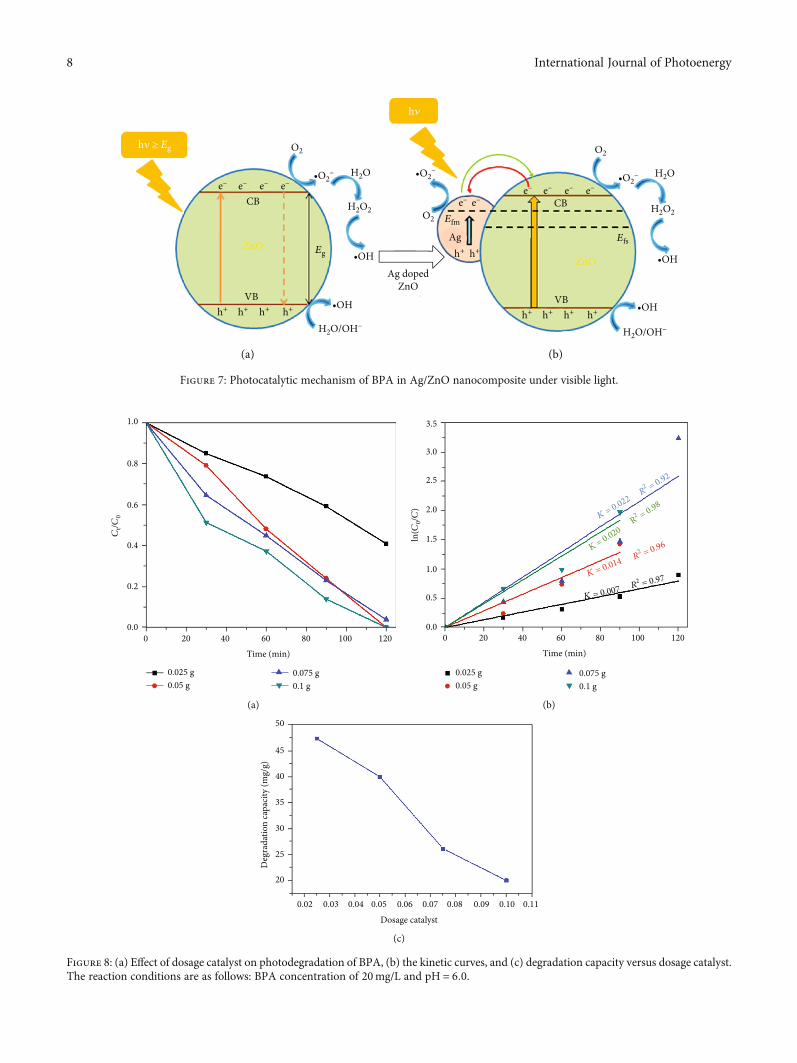
The photocatalytic mechanism of BPA on Ag/ZnO com-posite under visible light irradiation is presented in Figure 7.When visible light was irradiated to the surface of ZnO, thephotons can excite electrons in the valence band (VB) to bemoved up to the conduct band (CB); the electron and holepair (e- and h+) is generated. They can interact with waterand oxygen on the surface of ZnO to generate oxidizingagents including H2O2,
⋅O2−, and ⋅OH, in which ⋅O2
− and⋅OH are the strong oxidizing agents; they can decomposethe organic compound into CO2 and H2O2. However, thetime of electrons (e-) lying on the conduction band isextremely short; the electron (e-) almost intermediatelyreleases the energy to return to the ground state to recombinewith hole (h+) originally. This is the significant limitation ofpure ZnO nanoparticles.
10 20 30 40 502 - theta
Inte
nsity
(a.u
.)
60 70 80
Ag/ZnO
ZnO
(112)(103)(110)(102)
Ag
(200)(111)
Ag(002)
(101)
(002)
(102)(110)
(103) (112)(201)
(201)
(202)
(202)
(100)
(101)
(100)
90
Figure 2: XRD patterns of ZnO and Ag/ZnO-10 nanocomposite.
5International Journal of Photoenergy
In the presence of Ag metal, the Schottky barrier isformed between Ag and ZnO due to the energy level of CBof ZnO which is higher than the Fermi level of Ag/ZnO lead-ing to free electrons in CB that can transfer from ZnO to Agas described by the red arrow shown in Figure 7(b), therebypreventing the recombination between electrons and holeson the surface of ZnO. The electron on Ag nanoparticlescan produce the ⋅O2
− free radical, while the holes in the VBcan react with H2O2 to produce ⋅OH radical. These freeradicals can degrade organic compounds to CO2 and H2O.These can be explained by the following equations:
ZnO + hν→ ZnO e−ð Þ + h+ ð5Þ
ZnO e−ð Þ + Ag→ ZnO + Ag e−ð Þ ð6ÞAg e−ð Þ + O2 → ⋅O2
− + Ag ð7ÞZnO h+
� �+H2O→ ZnO +H+ + ⋅OH ð8Þ
⋅O2− + ⋅OHð Þ + BPA→ Intermediate products ð9Þ
⋅O2− + ⋅OHð Þ + Intermediate products→ CO2 + H2O
ð10ÞOn the other hand, under visible light irradiation, the
pure ZnO exhibited weak photocatalytic activity for degrada-tion of BPA due to the fact that ZnO absorbs weakly in thevisible light region, while the Ag/ZnO composites showedsignificantly enhanced photocatalytic activity, because undervisible light irradiation electrons can be formed in the
Table 1: Lattice parameters and crystallite sizes of ZnO and Ag/ZnO-10.
Sample Crystal system Space group Crystallite size (nm) Lattice parameter, a (Å) Lattice parameter, c (Å) Cell volume (Å3)
ZnO Hexagonal P63 mc 20.1 3:251 ± 0:005 5:212 ± 0:002 47.704
Ag/ZnO-10 Hexagonal P63 mc 19.6 3:253 ± 0:007 5:215 ± 0:003 47.790
Ag/ZnOZnO
0.0
600
500
400
300
200
100
Qua
ntity
adso
rbed
(cm
3 /g S
TP)
0
0.2 0.4Relative pressure (P/Po)
0.6 0.8 1.0
(a)
Pore width (nm)0
0.0000
0.0002
0.0004
0.0006
20 40 60 80 100 120 140 160
Ag/ZnOZnO
(b)
Figure 3: (a) N2 adsorption/desorption isotherms and (b) pore size distributions of ZnO and Ag/ZnO-10 nanocomposite.
Table 2: The textural properties of ZnO and Ag/ZnO-10 composite.
SamplesSBET(m2/g)
BJH porevolume(cm3/g)
BJH averagepore size (nm)
DFT averagepore size (nm)
ZnO 26.2 0.48 26.9 30.1
Ag/ZnO-10
24.2 0.21 21.1 25.2
4000 3500
Tran
smitt
ance
(%)
3000 2500 2000Wavenumber (cm–1)
1500 1000 500
470
140415091636
ZnO
Ag/ZnO-10904
3406
3429
Figure 4: FTIR spectra of the ZnO and Ag/ZnO-10 nanocomposite.
6 International Journal of Photoenergy

metallic Ag nanoparticles through the strong SPR effect,leading to strong absorption light in the visible region. Nev-ertheless, the Schottky barrier formed at the metal-semiconductor interface can hinder the transfer of electronsfrom Ag nanoparticles to ZnO. Up to now, many studieshave proven that electrons can overcome the Schottky barrierat the interface because of its strong electron oscillating col-lectively on the SPR excitation [51–53]. Therefore, electronscan transfer from Ag to the CB of ZnO as illustrated by thegreen arrow in Figure 7(b). Then, they are scavenged byadsorbed oxygen molecules to yield superoxide radical
anions (⋅O2-) to degrade BPA molecules. Meanwhile, the
photogenerated holes could transfer to the photocatalyst sur-face and directly oxidize the organic pollutants, resulting inan improved photocatalytic activity in the visible light region.
3.2.2. Effect of Catalyst Dosage on the Degradation of BPA. Toinvestigate the influence of a catalyst mount, the catalyticoxidation experiments were carried out by employing theAg/ZnO-10 composite at the different dosages (0.025,0.050, 0.075, and 0.100 g) under constant reaction condi-tions: BPA concentration of 20mg/L and pH = 6:0. The
300 350 400Wavelength (nm)
Adsorption edge
1.5
1.0
0.5
0.0
Abs
orba
nce
450 500
(a)
3.0 3.1 3.2 3.3 3.4 3.5 3.6
20
15
10
(𝛼h𝜈
)2
h𝜈 (eV)
5
0
ZnOAg/ZnO-2Ag/ZnO-5
Ag/ZnO-10Ag/ZnO-15
(b)
Figure 5: (a) UV-Vis diffuse reflectance spectra and (b) Tauc’s plot of the as-synthesized samples.
ZnOAg/ZnO-2Ag/ZnO-5
Ag/ZnO-10Ag/ZnO-15
1.0
0.8
0.6
0.4
0.2
Ct/C
0
0.00 20 40 60 80
Time (min)100 120
(a)
ZnOAg/ZnO-2Ag/ZnO-5
K = 0.014
1.5
1.0
0.5
0.0
ln(C
0/C
)
0 20 40 60 80Time (min)
100 120
R2 = 0.94
K = 0.011 R2 = 0.92
K = 0.008 R2 = 0.99
K = 0.005 R2 = 0.95
K = 0.003 R2 = 0.99
Ag/ZnO-10Ag/ZnO-15
(b)
Figure 6: (a) Photodegradation of BPA in ZnO and Ag/ZnO and (b) the kinetic curves (the reaction conditions: dosage catalyst 0.5 g/L, BPAconcentration of 20mg/L, and pH = 6:0).
7International Journal of Photoenergy
ZnOZnO
CB
VB VB
CBH2O2
Ag dopedZnO
(a) (b)
Ag
H2O2
H2O/OH–H2O/OH–
Eg
Efm
Efs
H2O H2O•O2–
•OH
•OH •OH
•OH
•O2–
•O2–
O2O2
e– e– e– e–e–
e– e–e– e– e–
h+h+h+h+ h+h+h+h+
h+ h+
O2
h𝜈 ≥ Eg
h𝜈
Figure 7: Photocatalytic mechanism of BPA in Ag/ZnO nanocomposite under visible light.
1.0
0.8
0.6
0.4
0.2
Ct/C
0
0.00 20
0.075 g0.1 g
40 60 80Time (min)
100 120
0.025 g0.05 g
(a)
1.0
1.5
2.0
2.5
3.0
3.5
0.5
0.0
ln(C
0/C)
0 20 40 60 80Time (min)
100 120
K = 0.020R2 = 0.98
K = 0.022R
2 = 0.92
K = 0.014 R2 = 0.96
K = 0.007 R2 = 0.97
0.075 g0.1 g
0.025 g0.05 g
(b)
50
45
40
35
30
20
0.02 0.03 0.04 0.05 0.06 0.07Dosage catalyst
0.08 0.09 0.10 0.11
25
Deg
rada
tion
capa
city
(mg/
g)
(c)
Figure 8: (a) Effect of dosage catalyst on photodegradation of BPA, (b) the kinetic curves, and (c) degradation capacity versus dosage catalyst.The reaction conditions are as follows: BPA concentration of 20mg/L and pH = 6:0.
8 International Journal of Photoenergy
catalytic efficiency as a function of catalyst amount isshowed in Figure 8. It could be seen that the degradationefficiency and reaction rate of BPA increased with anincrease in the dosage catalyst. The degradation efficiencieswere 9.24, 100, 96.08, and 100% and reaction rates were0.007, 0.014, 0.020, and 0.022min-1 at the catalyst dosageof 0.025, 0.050, 0.075, and 0.100 g, respectively. And thecorrelation coefficient (R2) values were in the range of0.92-0.98 (Figure 8(b)). However, the degradation capacitydecreased from 47.4 to 20mg/g when the dosage catalystincreased from 0.025 to 0.100 g (Figure 8(c)).
Since the increase of catalyst dosage leads to anincrease in the number of active sites on the surface ofcatalysts, the density of catalyst particles in the area ofillumination is improved [54]. However, the degradationcapacity of BPA per gram of catalyst was decreased withan increase in the catalyst dosage, as shown inFigure 8(c), due to increasing the suspended catalysts in
a solution. The short wave tail photons are not able toenter the reaction mixture and a decrease in visible lightpenetration increasing in scattering effect [55, 56]. Also,as more catalyst was added, each catalyst has less chanceto contact with BPA molecules because of fast reactionas shown in Figure 8(a). As a result, the reaction perfor-mance and rate can be improved with increasing catalystdosage, but degradation capacity became smaller.
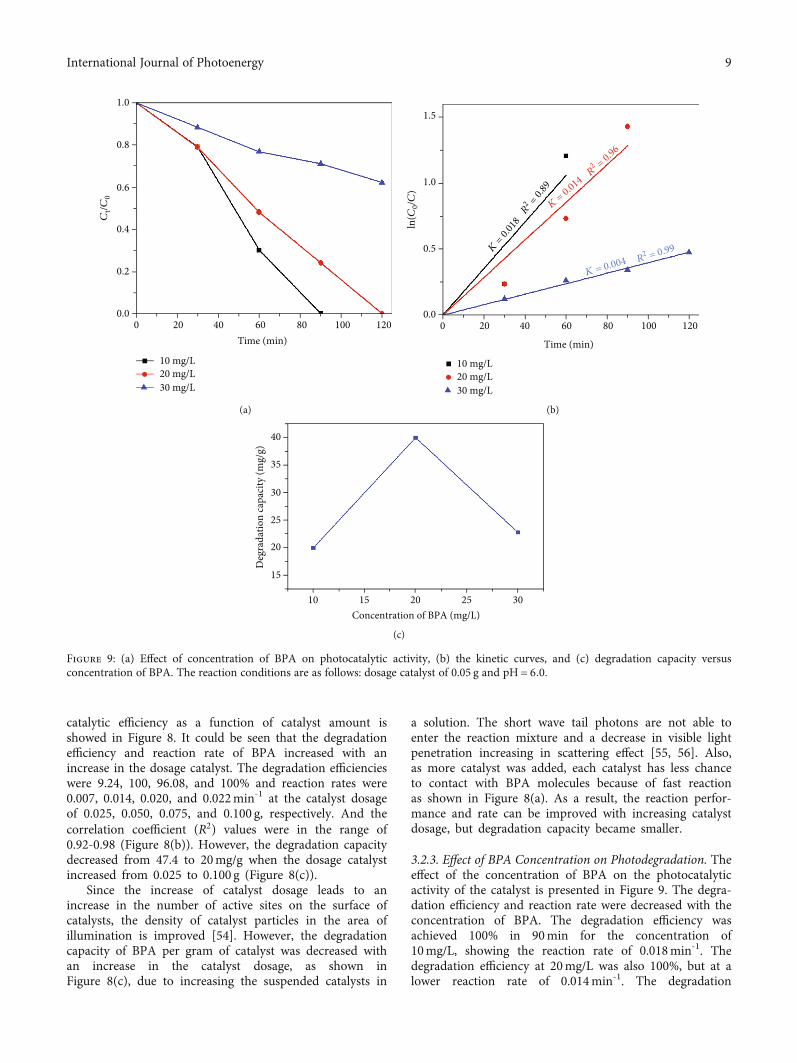
3.2.3. Effect of BPA Concentration on Photodegradation. Theeffect of the concentration of BPA on the photocatalyticactivity of the catalyst is presented in Figure 9. The degra-dation efficiency and reaction rate were decreased with theconcentration of BPA. The degradation efficiency wasachieved 100% in 90min for the concentration of10mg/L, showing the reaction rate of 0.018min-1. Thedegradation efficiency at 20mg/L was also 100%, but at alower reaction rate of 0.014min-1. The degradation
10 mg/L20 mg/L30 mg/L
1.0
0.8
0.6
0.4
0.2
Ct/C
0
0.00 20 40 60 80
Time (min)100 120
(a)
1.5
1.0
0.5
0.0
ln(C
0/C
)
0 20 40 60 80
Time (min)
100 120
K = 0.004 R2 = 0.99
K = 0.014
R2 = 0.96
K = 0.
018R
2 = 0.89
10 mg/L20 mg/L30 mg/L
(b)
40
35
30
20
15
10 15 20 25 30
25
Deg
rada
tion
capa
city
(mg/
g)
Concentration of BPA (mg/L)
(c)
Figure 9: (a) Effect of concentration of BPA on photocatalytic activity, (b) the kinetic curves, and (c) degradation capacity versusconcentration of BPA. The reaction conditions are as follows: dosage catalyst of 0.05 g and pH = 6:0.
9International Journal of Photoenergy
efficiency and reaction rate were 38.1% and 0.004min-1 ata high concentration of 30mg/L, respectively. R2 valueswere in the range of 0.89-0.99.
The negative effect of increased amount of BPA on reac-tion can be interpreted by the following reasons. (1) Thenumber of BPA molecules, adsorbed on the active sites ofthe catalyst surface, increases with the initial concentrationof BPA. Therefore, the generation rate of O2
⋅- and OH⋅ radi-cals on the same active sites became decreased. (2) Alterna-tively, increasing the dye concentration leads to generatingmany intermediates form dye molecules along with the reac-tion and may compete with BPA molecules in the constanttotal active sites. Despite lowering the degradation efficiencyand reaction rate of BPA with increasing the initial concen-tration of BPA, the degradation capacity at 20mg/L of40mg/g was higher than that of other concentrations(Figure 9(c)).
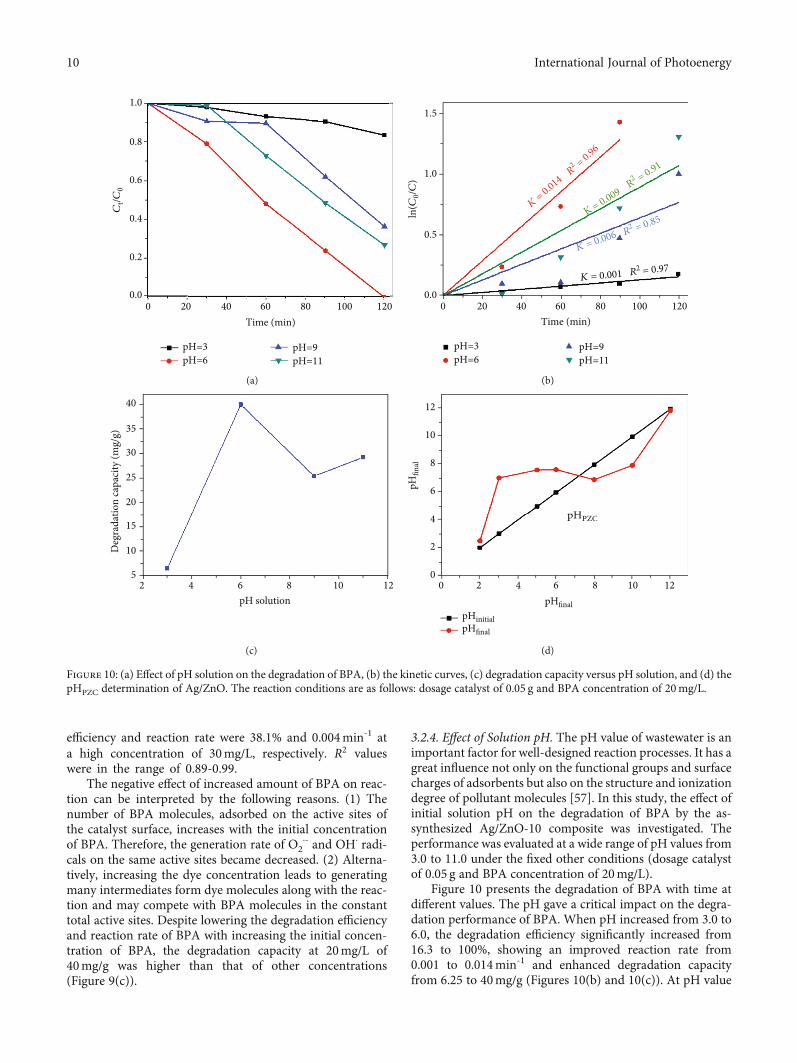
3.2.4. Effect of Solution pH. The pH value of wastewater is animportant factor for well-designed reaction processes. It has agreat influence not only on the functional groups and surfacecharges of adsorbents but also on the structure and ionizationdegree of pollutant molecules [57]. In this study, the effect ofinitial solution pH on the degradation of BPA by the as-synthesized Ag/ZnO-10 composite was investigated. Theperformance was evaluated at a wide range of pH values from3.0 to 11.0 under the fixed other conditions (dosage catalystof 0.05 g and BPA concentration of 20mg/L).
Figure 10 presents the degradation of BPA with time atdifferent values. The pH gave a critical impact on the degra-dation performance of BPA. When pH increased from 3.0 to6.0, the degradation efficiency significantly increased from16.3 to 100%, showing an improved reaction rate from0.001 to 0.014min-1 and enhanced degradation capacityfrom 6.25 to 40mg/g (Figures 10(b) and 10(c)). At pH value
1.0
0.8
0.6
0.4
0.2
Ct/C
0
0.00 20 40 60 80
Time (min)100 120
pH=3pH=6
pH=9pH=11
(a)
0 20 40 60 80Time (min)
100 120
1.5
1.0
0.5
0.0
ln(C
0/C
)
K = 0.014
R2 = 0.96
K = 0.009R2 = 0.91
K = 0.006 R2 = 0.85
K = 0.001 R2 = 0.97
pH=3pH=6
pH=9pH=11
(b)
40
35
30
20
15
52 4 6 8
pH solution10 12
10
25
Deg
rada
tion
capa
city
(mg/
g)
(c)
pHfin
al
pHfinal
pHinitial
pHfinal
pHPZC
12
10
8
6
4
2
00 2 4 6 8 10 12
pHPZC
(d)
Figure 10: (a) Effect of pH solution on the degradation of BPA, (b) the kinetic curves, (c) degradation capacity versus pH solution, and (d) thepHPZC determination of Ag/ZnO. The reaction conditions are as follows: dosage catalyst of 0.05 g and BPA concentration of 20mg/L.
10 International Journal of Photoenergy
higher than 6.0, the reaction performance was decreased, thedegradation efficiencies were 63.4 and 73%, and the reactionrates were 0.006 and 0.009min-1 at pH = 9:0 and 11.0,respectively. And R2 values were in the range of 0.85-0.97.
It was observed that the optimum pH for efficientdegradation of BPA on Ag/ZnO-10 composite is 6.0. Atlower pH than 6.0, the degradation efficiency is low; it isdue to the dissolution of ZnO in an acid medium (equa-tion (11)). At higher pH than 6, the efficient degradationis also low due to the dissolution of ZnO in an alkalinemedium (equation (12)).
ZnO sð Þ + 2H+ aqð Þ→ Zn2+ + H2O ð11Þ
ZnO sð Þ + 2OH− aqð Þ→ ZnO2− + H2O ð12Þ
On the other hand, the surface charge property ofnanoparticles, which depends on the pH point of zerocharge (pHPZC), is also the reason affecting the adsorptionproperties of dye molecules on the surface of photocata-lyst. The pHPZC of Ag/ZnO measured by the pH driftmethod reached 7.4, as shown in Figure 10(d). Hence, atthe pH of 6.0, the catalytic surface will adsorb efficientlythe organic anion (BPA donated protons) and lead toenhanced significant degradation of BPA on the Ag/ZnOcomposite.
3.2.5. Degradation of Other Organic Compounds andComparison of Degradation of BPA with Other Catalysts.The degradation efficiency of organic compounds by photo-catalysts depends not on only catalyst properties, such assurface area, pore volume and pore size distribution, and
1.0
0.8
0.6
0.4
0.2
Ct/C
0
0.060300 90
Time (min)120
BPAPhenol
TAMB
(a)
0 20 40 60 80Time (min)
100 120
1.0
1.5
2.0
2.5
3.0
0.5
0.0
ln(C
0/C
)
K = 0.020, R2 = 0.96
K =
0.04
5, R
2 = 1.
0
K = 0.006, R2 = 0.96K = 0.014, R
2 = 0.96
BPAPhenol
TAMB
(b)
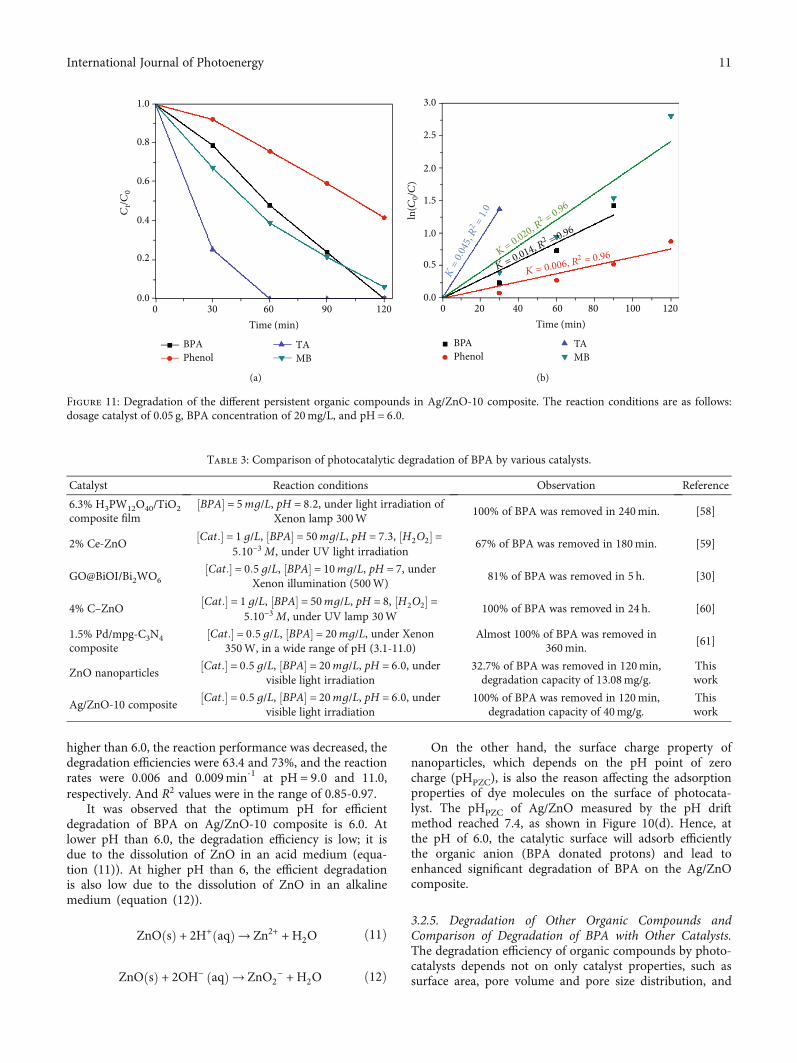
Figure 11: Degradation of the different persistent organic compounds in Ag/ZnO-10 composite. The reaction conditions are as follows:dosage catalyst of 0.05 g, BPA concentration of 20mg/L, and pH = 6:0.
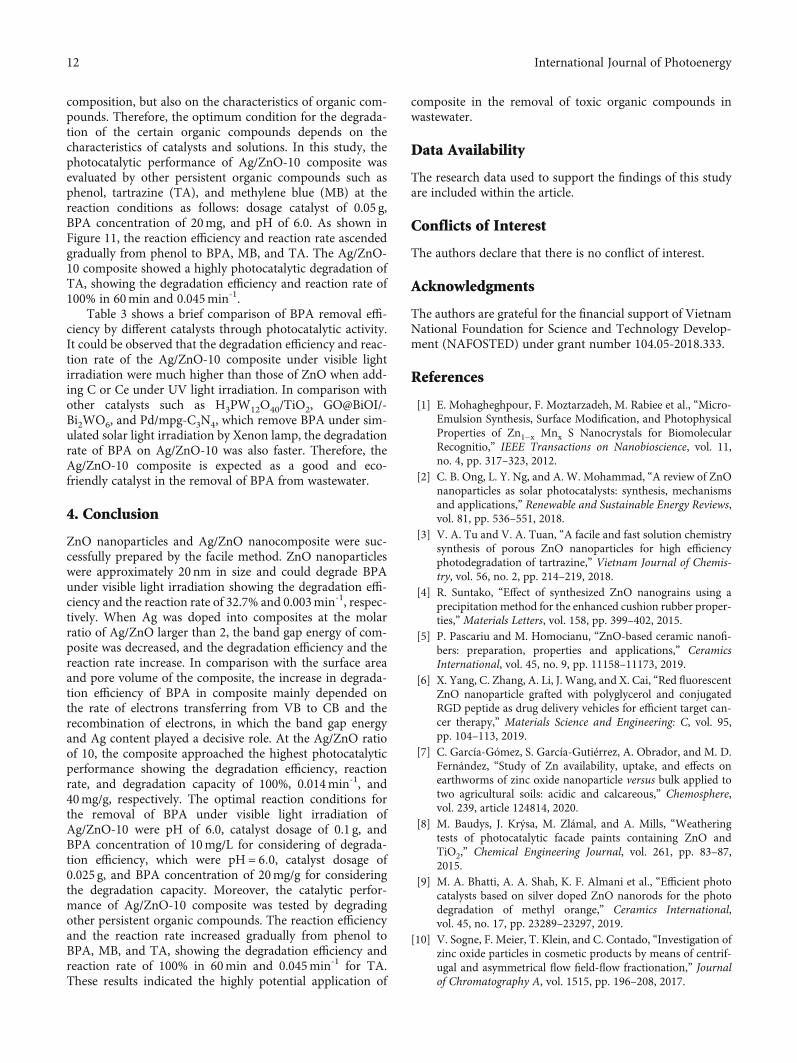
Table 3: Comparison of photocatalytic degradation of BPA by various catalysts.
Catalyst Reaction conditions Observation Reference
6.3% H3PW12O40/TiO2composite film
BPA½ � = 5mg/L, pH = 8:2, under light irradiation ofXenon lamp 300W
100% of BPA was removed in 240min. [58]
2% Ce-ZnOCat:½ � = 1 g/L, BPA½ � = 50mg/L, pH = 7:3, H2O2½ � =
5:10−3 M, under UV light irradiation67% of BPA was removed in 180min. [59]
GO@BiOI/Bi2WO6Cat:½ � = 0:5g/L, BPA½ � = 10mg/L, pH = 7, under
Xenon illumination (500W)81% of BPA was removed in 5 h. [30]
4% C–ZnOCat:½ � = 1g/L, BPA½ � = 50mg/L, pH = 8, H2O2½ � =
5:10−3 M, under UV lamp 30W100% of BPA was removed in 24 h. [60]
1.5% Pd/mpg-C3N4composite
Cat:½ � = 0:5g/L, BPA½ � = 20mg/L, under Xenon350W, in a wide range of pH (3.1-11.0)
Almost 100% of BPA was removed in360min.
[61]
ZnO nanoparticlesCat:½ � = 0:5 g/L, BPA½ � = 20mg/L, pH = 6:0, under
visible light irradiation32.7% of BPA was removed in 120min,degradation capacity of 13.08mg/g.
Thiswork
Ag/ZnO-10 compositeCat:½ � = 0:5 g/L, BPA½ � = 20mg/L, pH = 6:0, under
visible light irradiation100% of BPA was removed in 120min,
degradation capacity of 40mg/g.Thiswork
11International Journal of Photoenergy
composition, but also on the characteristics of organic com-pounds. Therefore, the optimum condition for the degrada-tion of the certain organic compounds depends on thecharacteristics of catalysts and solutions. In this study, thephotocatalytic performance of Ag/ZnO-10 composite wasevaluated by other persistent organic compounds such asphenol, tartrazine (TA), and methylene blue (MB) at thereaction conditions as follows: dosage catalyst of 0.05 g,BPA concentration of 20mg, and pH of 6.0. As shown inFigure 11, the reaction efficiency and reaction rate ascendedgradually from phenol to BPA, MB, and TA. The Ag/ZnO-10 composite showed a highly photocatalytic degradation ofTA, showing the degradation efficiency and reaction rate of100% in 60min and 0.045min-1.
Table 3 shows a brief comparison of BPA removal effi-ciency by different catalysts through photocatalytic activity.It could be observed that the degradation efficiency and reac-tion rate of the Ag/ZnO-10 composite under visible lightirradiation were much higher than those of ZnO when add-ing C or Ce under UV light irradiation. In comparison withother catalysts such as H3PW12O40/TiO2, GO@BiOI/-Bi2WO6, and Pd/mpg-C3N4, which remove BPA under sim-ulated solar light irradiation by Xenon lamp, the degradationrate of BPA on Ag/ZnO-10 was also faster. Therefore, theAg/ZnO-10 composite is expected as a good and eco-friendly catalyst in the removal of BPA from wastewater.
4. Conclusion
ZnO nanoparticles and Ag/ZnO nanocomposite were suc-cessfully prepared by the facile method. ZnO nanoparticleswere approximately 20 nm in size and could degrade BPAunder visible light irradiation showing the degradation effi-ciency and the reaction rate of 32.7% and 0.003min-1, respec-tively. When Ag was doped into composites at the molarratio of Ag/ZnO larger than 2, the band gap energy of com-posite was decreased, and the degradation efficiency and thereaction rate increase. In comparison with the surface areaand pore volume of the composite, the increase in degrada-tion efficiency of BPA in composite mainly depended onthe rate of electrons transferring from VB to CB and therecombination of electrons, in which the band gap energyand Ag content played a decisive role. At the Ag/ZnO ratioof 10, the composite approached the highest photocatalyticperformance showing the degradation efficiency, reactionrate, and degradation capacity of 100%, 0.014min-1, and40mg/g, respectively. The optimal reaction conditions forthe removal of BPA under visible light irradiation ofAg/ZnO-10 were pH of 6.0, catalyst dosage of 0.1 g, andBPA concentration of 10mg/L for considering of degrada-tion efficiency, which were pH = 6:0, catalyst dosage of0.025 g, and BPA concentration of 20mg/g for consideringthe degradation capacity. Moreover, the catalytic perfor-mance of Ag/ZnO-10 composite was tested by degradingother persistent organic compounds. The reaction efficiencyand the reaction rate increased gradually from phenol toBPA, MB, and TA, showing the degradation efficiency andreaction rate of 100% in 60min and 0.045min-1 for TA.These results indicated the highly potential application of
composite in the removal of toxic organic compounds inwastewater.
Data Availability
The research data used to support the findings of this studyare included within the article.
Conflicts of Interest
The authors declare that there is no conflict of interest.
Acknowledgments
The authors are grateful for the financial support of VietnamNational Foundation for Science and Technology Develop-ment (NAFOSTED) under grant number 104.05-2018.333.
References
[1] E. Mohagheghpour, F. Moztarzadeh, M. Rabiee et al., “Micro-Emulsion Synthesis, Surface Modification, and PhotophysicalProperties of Zn1−x Mnx S Nanocrystals for BiomolecularRecognitio,” IEEE Transactions on Nanobioscience, vol. 11,no. 4, pp. 317–323, 2012.
[2] C. B. Ong, L. Y. Ng, and A. W. Mohammad, “A review of ZnOnanoparticles as solar photocatalysts: synthesis, mechanismsand applications,” Renewable and Sustainable Energy Reviews,vol. 81, pp. 536–551, 2018.
[3] V. A. Tu and V. A. Tuan, “A facile and fast solution chemistrysynthesis of porous ZnO nanoparticles for high efficiencyphotodegradation of tartrazine,” Vietnam Journal of Chemis-try, vol. 56, no. 2, pp. 214–219, 2018.
[4] R. Suntako, “Effect of synthesized ZnO nanograins using aprecipitation method for the enhanced cushion rubber proper-ties,” Materials Letters, vol. 158, pp. 399–402, 2015.
[5] P. Pascariu and M. Homocianu, “ZnO-based ceramic nanofi-bers: preparation, properties and applications,” CeramicsInternational, vol. 45, no. 9, pp. 11158–11173, 2019.
[6] X. Yang, C. Zhang, A. Li, J. Wang, and X. Cai, “Red fluorescentZnO nanoparticle grafted with polyglycerol and conjugatedRGD peptide as drug delivery vehicles for efficient target can-cer therapy,” Materials Science and Engineering: C, vol. 95,pp. 104–113, 2019.
[7] C. García-Gómez, S. García-Gutiérrez, A. Obrador, and M. D.Fernández, “Study of Zn availability, uptake, and effects onearthworms of zinc oxide nanoparticle versus bulk applied totwo agricultural soils: acidic and calcareous,” Chemosphere,vol. 239, article 124814, 2020.
[8] M. Baudys, J. Krýsa, M. Zlámal, and A. Mills, “Weatheringtests of photocatalytic facade paints containing ZnO andTiO2,” Chemical Engineering Journal, vol. 261, pp. 83–87,2015.
[9] M. A. Bhatti, A. A. Shah, K. F. Almani et al., “Efficient photocatalysts based on silver doped ZnO nanorods for the photodegradation of methyl orange,” Ceramics International,vol. 45, no. 17, pp. 23289–23297, 2019.
[10] V. Sogne, F. Meier, T. Klein, and C. Contado, “Investigation ofzinc oxide particles in cosmetic products by means of centrif-ugal and asymmetrical flow field-flow fractionation,” Journalof Chromatography A, vol. 1515, pp. 196–208, 2017.
12 International Journal of Photoenergy
[11] P. Sánchez-Cid, C. Jaramillo-Páez, J. A. Navío, A. N. Martín-Gómez, and M. C. Hidalgo, “Coupling of Ag2CO3 to anoptimized ZnO photocatalyst: advantages vs. disadvantages,”Journal of Photochemistry and Photobiology A: Chemistry,vol. 369, pp. 119–132, 2019.
[12] M. R. D. Khaki, M. S. Shafeeyan, A. A. A. Raman, andW.M. A.W. Daud, “Application of doped photocatalysts for organicpollutant degradation - a review,” Journal of EnvironmentalManagement, vol. 198, Part 2, pp. 78–94, 2017.
[13] N. Yu, H. Peng, L. Qiu et al., “New pectin-induced green fab-rication of Ag@AgCl/ZnO nanocomposites for visible-lighttriggered antibacterial activity,” International Journal ofBiological Macromolecules, vol. 141, pp. 207–217, 2019.
[14] A. Stanković, S. Dimitrijević, and D. Uskoković, “Influence ofsize scale and morphology on antibacterial properties of ZnOpowders hydrothemally synthesized using different surfacestabilizing agents,” Colloids and Surfaces B: Biointerfaces,vol. 102, pp. 21–28, 2013.
[15] N. Neves, A. Lagoa, J. Calado et al., “Al-doped ZnO nanostruc-tured powders by emulsion detonation synthesis – Improvingmaterials for high quality sputtering targets manufacturing,”Journal of the European Ceramic Society, vol. 34, no. 10,pp. 2325–2338, 2014.
[16] B. P. Zhang, N. T. Binh, K. Wakatsuki et al., “Pressure-depen-dent ZnO nanocrsytal growth in a chemical vapor depositionprocess,” The Journal of Physical Chemistry B, vol. 108,no. 30, pp. 10899–10902, 2004.
[17] M. Park, S.-H. Lee, D. Kim, J. Kang, J.-Y. Lee, and S. M. Han,“Fabrication of a combustion-reacted high-performance ZnOelectron transport layer with silver nanowire electrodes fororganic solar cells,” ACS Applied Materials & Interfaces,vol. 10, no. 8, pp. 7214–7222, 2018.
[18] H. V. Vasei, S. M. Masoudpanah, M. Adeli, and M. R. Abouta-lebi, “Solution combustion synthesis of ZnO powders usingCTAB as fuel,” Ceramics International, vol. 44, no. 7,pp. 7741–7745, 2018.
[19] Y. Hu, Q. Zhu, X. Yan, C. Liao, and G. Jiang, “Occurrence, fateand risk assessment of BPA and its substituents in wastewatertreatment plant: a review,” Environmental Research, vol. 178,article 108732, 2019.
[20] M. Clinic, “Nutrition and Healthy Eating,” inHealthy Lifestyle,B. A. Bauer, Ed., Mayo Clinic, 2019.
[21] K. V. A. Kumar, B. Lakshminarayana, T. Vinodkumar, andC. Subrahmanyam, “Cu-ZnO for visible light induced mineral-ization of Bisphenol-A: impact of Cu ion doping,” Journal ofEnvironmental Chemical Engineering, vol. 7, no. 3, article103057, 2019.
[22] H. C. Alexander, D. C. Dill, L. W. Smith, P. D. Guiney, andP. Dorn, “Bisphenol a: acute aquatic toxicity,” EnvironmentalToxicology and Chemistry, vol. 7, no. 1, pp. 19–26, 1988.
[23] K. Pelch, J. A. Wignall, A. E. Goldstone et al., “A scopingreview of the health and toxicological activity of bisphenol A(BPA) structural analogues and functional alternatives,” Toxi-cology, vol. 424, article 152235, 2019.
[24] M. F. Brugnera, K. Rajeshwar, J. C. Cardoso, and M. V. B.Zanoni, “Bisphenol A removal from wastewater using self-organized TIO2 nanotubular array electrodes,” Chemosphere,vol. 78, no. 5, pp. 569–575, 2010.
[25] A. Bhatnagar and I. Anastopoulos, “Adsorptive removal ofbisphenol A (BPA) from aqueous solution: a review,” Chemo-sphere, vol. 168, pp. 885–902, 2017.
[26] Y. Zhang, W. Cui, W. An, L. Liu, Y. Liang, and Y. Zhu, “Com-bination of photoelectrocatalysis and adsorption for removalof bisphenol A over TiO2-graphene hydrogel with 3D networkstructure,” Applied Catalysis B: Environmental, vol. 221,pp. 36–46, 2018.
[27] G. Y. S. Chan, J. Chang, T. A. Kurniawan, C.-X. Fu, H. Jiang,and Y. Je, “Removal of non-biodegradable compounds fromstabilized leachate using VSEPROmembrane filtration,” Desa-lination, vol. 202, no. 1-3, pp. 310–317, 2007.
[28] P. Wang, X. Zhou, Y. Zhang, L. Wang, K. Zhi, and Y. Jiang,“Synthesis and application of magnetic reduced grapheneoxide composites for the removal of bisphenol A in aqueoussolution—a mechanistic study,” RSC Advances, vol. 6,no. 104, pp. 102348–102358, 2016.
[29] M. Vilve, S. Vilhunen, M. Vepsäläinen et al., “Degradation of1,2-dichloroethane from wash water of ion-exchange resinusing Fenton’s oxidation,” Environmental Science and Pollu-tion Research International, vol. 17, no. 4, pp. 875–884, 2010.
[30] Z. Mengting, T. Kurniawan, Y. Yanping, R. Avtar, andM. Othman, “2D graphene oxide (GO) doped p-n type BiOI/-Bi2WO6 as a novel composite for photodegradation of bisphe-nol A (BPA) in aqueous solutions under UV-vis irradiation,”Materials Science and Engineering: C, vol. 108, article 110420,2020.
[31] Q. Wang, C. Yang, G. Zhang, L. Hu, and P. Wang, “Photocat-alytic Fe-doped TiO2/PSF composite UF membranes: charac-terization and performance on BPA removal under visible-light irradiation,” Chemical Engineering Journal, vol. 319,pp. 39–47, 2017.
[32] H. Lan, G. Zhang, H. Zhang, H. Liu, R. Liu, and J. Qu, “Sol-vothermal synthesis of BiOI flower-like microspheres for effi-cient photocatalytic degradation of BPA under visible lightirradiation,” Catalysis Communications, vol. 98, pp. 9–12,2017.
[33] A. Sivakumar, B. Murugesan, A. Loganathan, andP. Sivakumar, “A review on decolourisation of dyes by photo-degradation using various bismuth catalysts,” Journal of theTaiwan Institute of Chemical Engineers, vol. 45, no. 5,pp. 2300–2306, 2014.
[34] H. Xing, H. Ma, Y. Fu et al., “Preparation of g-C3N4/ZnO com-posites and their enhanced photocatalytic activity,” MaterialsTechnology, vol. 30, no. 2, pp. 122–127, 2015.
[35] S. J. Yang, J. H. Im, T. Kim, K. Lee, and C. R. Park, “MOF-derived ZnO and ZnO@C composites with high photocatalyticactivity and adsorption capacity,” Journal of HazardousMaterials, vol. 186, no. 1, pp. 376–382, 2011.
[36] T. Chang, Z. Li, G. Yun, Y. Jia, and H. Yang, “Enhanced pho-tocatalytic activity of ZnO/CuO nanocomposites synthesizedby hydrothermal method,” Nano-Micro Letters, vol. 5, no. 3,pp. 163–168, 2013.
[37] H. A. Kiwaan, T. M. Atwee, E. A. Azab, and A. A. El-Bindary,“Efficient photocatalytic degradation of Acid Red 57 usingsynthesized ZnO nanowires,” Journal of the Chinese ChemicalSociety, vol. 66, no. 1, pp. 89–98, 2019.
[38] S. Yang, P. Wu, M. Chen et al., “Enhanced photo-degradationof bisphenol a under simulated solar light irradiation by Zn–Timixed metal oxides loaded on graphene from aqueous media,”RSC Advances, vol. 6, no. 32, pp. 26495–26504, 2016.
[39] C. Liu, M. Yue, L. Liu, Y. Rui, and W. Cui, “A separation-free3D network ZnO/rGO–rGH hydrogel: adsorption enrichedphotocatalysis for environmental applications,” RSC Advances,vol. 8, no. 40, pp. 22402–22410, 2018.
13International Journal of Photoenergy
[40] S. S. Naik, S. J. Lee, T. Begildayeva, Y. Yu, H. Lee, and M. Y.Choi, “Pulsed laser synthesis of reduced graphene oxidesupported ZnO/Au nanostructures in liquid with enhancedsolar light photocatalytic activity,” Environmental Pollution,vol. 266, article 115247, 2020.
[41] S. Kuriakose, V. Choudhary, B. Satpati, and S. Mohapatra,“Enhanced photocatalytic activity of Ag-ZnO hybridplasmonic nanostructures prepared by a facile wet chemicalmethod,” Beilstein Journal of Nanotechnology, vol. 5,pp. 639–650, 2014.
[42] J. Lu, H. Wang, D. Peng, T. Chen, S. Dong, and Y. Chang,“Synthesis and properties of Au/ZnO nanorods as a plasmonicphotocatalyst,” Physica E: Low-dimensional Systems andNanostructures, vol. 78, pp. 41–48, 2016.
[43] E. B. Choi and J.-H. Lee, “Dewetting behavior of Ag in Ag-coated Cu particle with thick Ag shell,” Applied Surface Sci-ence, vol. 480, pp. 839–845, 2019.
[44] B. L. Martínez-Vargas, S. M. Durón-Torres, D. Bahena, J. L.Rodríguez-López, J. M. Peralta-Hernández, and A. Picos,“One-pot synthesis of ZnO–Ag and ZnO–Co nanohybridmaterials for photocatalytic applications,” Journal of Physicsand Chemistry of Solids, vol. 135, article 109120, 2019.
[45] R. Anugrahwidya, N. Yudasari, and D. Tahir, “Optical andstructural investigation of synthesis ZnO/Ag nanoparticlesprepared by laser ablation in liquid,”Materials Science in Semi-conductor Processing, vol. 105, article 104712, 2020.
[46] P. Amornpitoksuk, S. Suwanboon, S. Sangkanu, A. Sukhoom,N. Muensit, and J. Baltrusaitis, “Synthesis, characterization,photocatalytic and antibacterial activities of Ag-doped ZnOpowders modified with a diblock copolymer,” Powder Technol-ogy, vol. 219, pp. 158–164, 2012.
[47] Ö. A. Yıldırım, H. E. Unalan, and C. Durucan, “Highly efficientroom temperature synthesis of silver-doped zinc oxide(ZnO:Ag) nanoparticles: structural, optical, and photocatalyticproperties,” Journal of the American Ceramic Society, vol. 96,no. 3, pp. 766–773, 2013.
[48] A. C. Lucilha, M. R. . Silva, R. A. Ando, L. H. Dall'Antonia, andK. Takashima, “ZnO and Ag-ZnO crystals: synthesis, charac-terization, and application in heterogeneous photocatalysis,”Química Nova, vol. 39, no. 4, pp. 409–414, 2016.
[49] V. H. Tran Thi, T. H. Cao, T. N. Pham, T. T. Pham, and M. C.Le, “Synergistic adsorption and photocatalytic activity undervisible irradiation using Ag-ZnO/GO nanoparticles derivedat low temperature,” Journal of Chemistry, vol. 2019, ArticleID 2979517, 13 pages, 2019.
[50] A. Kaur, G. Gupta, A. O. Ibhadon, D. B. Salunke, A. S. K.Sinha, and S. K. Kansal, “A facile synthesis of silver modifiedZnO nanoplates for efficient removal of ofloxacin drug inaqueous phase under solar irradiation,” Journal of Environ-mental Chemical Engineering, vol. 6, no. 3, pp. 3621–3630,2018.
[51] W. Li, F. Hua, J. Yue, and J. Li, “Ag@AgCl plasmon-inducedsensitized ZnO particle for high-efficiency photocatalyticproperty under visible light,” Applied Surface Science,vol. 285, no. Part B, pp. 490–497, 2013.
[52] S.-i. Naya, T. Nikawa, K. Kimura, and H. Tada, “Rapid andcomplete removal of nonylphenol by gold nanoparticle/rutiletitanium(IV) oxide plasmon photocatalyst,” ACS Catalysis,vol. 3, no. 5, pp. 903–907, 2013.
[53] H. Liu, Y. Hu, Z. Zhang, X. Liu, H. Jia, and B. Xu, “Synthesis ofspherical Ag/ZnO heterostructural composites with excellent
photocatalytic activity under visible light and UV irradiation,”Applied Surface Science, vol. 355, pp. 644–652, 2015.
[54] J. Y. C. Yang, Q. Li, and Y. Yu, “Facile synthesis of monodis-perse porous ZnO nanospheres for organic pollutant degrada-tion under simulated sunlight irradiation: the effect ofoperational parameters,” Materials Research Bulletin, vol. 87,pp. 72–83, 2017.
[55] M. Behnajady, N. Modirshahla, and R. Hamzavi, “Kineticstudy on photocatalytic degradation of C.I. Acid Yellow 23by ZnO photocatalyst,” Journal of Hazardous Materials,vol. 133, no. 1-3, pp. 226–232, 2006.
[56] A. Zyoud, A. Zu’bi, M. H. S. Helal, D. H. Park, G. Campet, andH. S. Hilal, “Optimizing photo-mineralization of aqueousmethyl orange by nano-ZnO catalyst under simulated naturalconditions,” Journal of Environmental Health Science &Engineering, vol. 13, no. 1, 2015.
[57] X. Yang, Y. Li, Q. Du et al., “Highly effective removal of basicfuchsin from aqueous solutions by anionic polyacrylamide/-graphene oxide aerogels,” Journal of Colloid and InterfaceScience, vol. 453, pp. 107–114, 2015.
[58] N. Lu, Y. Lu, F. Liu et al., “H3PW12O40/TiO2 catalyst-inducedphotodegradation of bisphenol A (BPA): kinetics, toxicity anddegradation pathways,” Chemosphere, vol. 91, no. 9, pp. 1266–1272, 2013.
[59] O. Bechambi, L. Jlaiel, W. Najjar, and S. Sayadi, “Photocata-lytic degradation of bisphenol A in the presence of Ce–ZnO:evolution of kinetics, toxicity and photodegradation mecha-nism,” Materials Chemistry and Physics, vol. 173, pp. 95–105,2016.
[60] O. Bechambi, S. Sayadi, and W. Najjar, “Photocatalytic degra-dation of bisphenol A in the presence of C-doped ZnO: effectof operational parameters and photodegradation mechanism,”Journal of Industrial and Engineering Chemistry, vol. 32,pp. 201–210, 2015.
[61] C. Chang, Y. Fu, M. Hu, C. Wang, G. Shan, and L. Zhu,“Photodegradation of bisphenol A by highly stablepalladium-doped mesoporous graphite carbon nitride(Pd/mpg-C3N4) under simulated solar light irradiation,”Applied Catalysis B: Environmental, vol. 142-143, pp. 553–560, 2013.
14 International Journal of Photoenergy