Embed Size (px)
Citation preview
F-actin and integrin like proteins in
Phytophthora cinnamomi
A thesis submitted in accordance with the requirements of
the University of Canterbury for the degree of
Master of Science in Biochemistry
Chad S. Harland
June 2007
1
Abstract
Tip growth is the primary form of growth in hyphal organisms and some plant cells. Tip
growth in hyphae is highly dependent on F-actin, which acts to regulate and support.
growth. One of the models suggested for tip growth, the amebae model of tip growth,
suggests that F-actin may also be the primary source of protrusive force for tip growth
in some conditions, and that proteins with a similar function to animal integrins would
be present an involved in tip growth (Heath and Steinberg 1999). In this thesis we
examine the role of F-actin in the growth of the oomycete Phytophthora cinnamomi and
the effects on growth of the F-actin disrupting compound Latrunculin B. We demonstrate
that F-actin plays a critical role in the tip growth of Phytophthora cinnamomi with it's
disruption causing rapid cessation in directional growth, followed by significant sub-
apical swelling. Further more we examine Phytophthora cinnamomi for the presence of
an B4 integrin like protein that has been previously reported in the oomycete Achlya
bisexualis (Chitcholtan & Garrill 2005) and show that the B4 integrin like protein is not
present in Phytophthora cinnamomi.
These experiments help further our understanding of tip growth in Phytophthora
cinnamomi an economically important plant pathogen.
2
Contents
Abstract..............................................................................................................................2
Abbreviations...................................................................................................................10
Introduction......................................................................................................................12
Phytophthora cinnamomi.............................................................................................12
Actin.............................................................................................................................18
Actin Inhibitors.........................................................................................................22
Hyphal Growth.............................................................................................................23
Integrins.......................................................................................................................28
Integrin Structure.....................................................................................................32
Ligand binding.........................................................................................................33
Methods:...........................................................................................................................38
Materials......................................................................................................................39
Microscope and capture software............................................................................39
Stock Cultures:.........................................................................................................39
Phytophthora cinnamomi ....................................................................................39
Achlya bisexualis.................................................................................................39
Experimental Culture preparation:...........................................................................40
Non-Invasive Cultures..........................................................................................40
Invasive Culture: .................................................................................................40
Imaging Methods..........................................................................................................41
Criteria for Imaging of Hyphae.................................................................................41
Image Processing.....................................................................................................41
Growth Rate Measurements Image Pro Plus............................................................42
3
Actin Experiments........................................................................................................42
Actin Staining...........................................................................................................42
Actin Staining: Latrunculin B....................................................................................43
Growth Rate Experiments............................................................................................43
Growth Rate measurements....................................................................................43
Growth Rate: Microscope method............................................................................43
Integrin-like Proteins....................................................................................................45
Integrin-like protein staining....................................................................................45
Western blot: Integrin like proteins..........................................................................46
Results..............................................................................................................................48
Actin Staining...............................................................................................................50
DIC images of growing Phytophthora cinnamomi hyphae.......................................50
Actin Stained Controls: Invasive Conditions.............................................................52
Actin Stained Controls: Non-invasive Conditions.....................................................54
Actin Stained Controls: 0.1% DMSO Control in Invasive Conditions........................56
Actin Stained Controls: 1% DMSO Controls in Invasive Conditions..........................58
Actin Staining: Latrunculin B 0.5ug/ml.....................................................................60
Actin Staining: Latrunculin B at 1ug/ml...................................................................62
Actin Staining: Latrunculin B at 5ug/ml...................................................................64
Actin Staining: Latrunculin B at 10ug/ml.................................................................66
Growth Rates................................................................................................................68
Plate Growth rates:..................................................................................................68
Growth Rate Results: Invasive Conditions 5μg/ml Latrunculin B.............................70
Non Invasive conditions 5μg....................................................................................72
Invasive conditions 0.5μg........................................................................................74
4
Non-Invasive Conditions 0.5μg................................................................................76
Growth rates Invasive and Non-Invasive.................................................................78
Growth Rates: Growth..............................................................................................80
Integrin like Protein Experiments.................................................................................82
Anti-Integrin β4 stained Phytophthora cinnamomi..................................................82
Controls: Stained Phytophthora cinnamomi............................................................85
Controls: Anti-Integrin β4 Stained Achlya bisexualis...............................................87
Anti-Integrin β4 Western blots.................................................................................89
Discussion........................................................................................................................92
The effects of Latrunculin B on the actin cytoskeleton................................................92
Integrin like proteins in Phytophthora cinnamomi.......................................................99
Conclusion......................................................................................................................102
Acknowledgements........................................................................................................103
References......................................................................................................................104
5
List of Figures
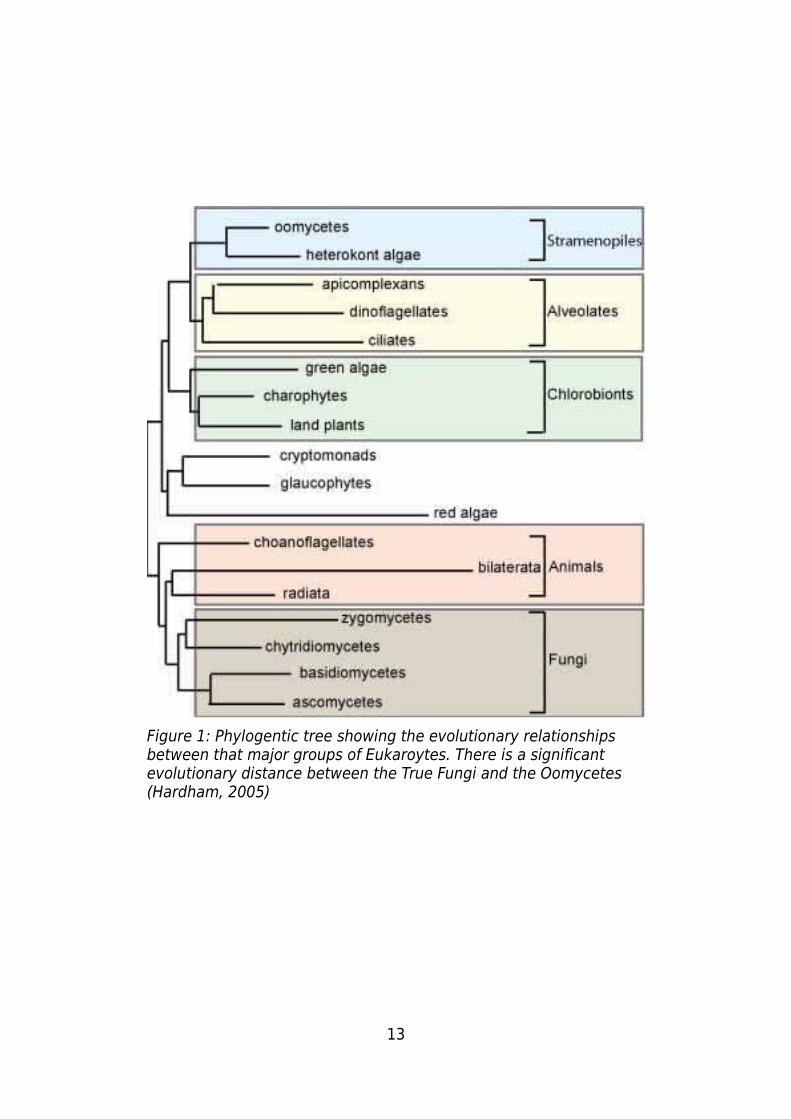
Figure 1: Phylogentic tree showing the evolutionary relationships between that major
groups of Eukaroytes. There is a significant evolutionary distance between the True
Fungi and the Oomycetes (Hardham, 2005)....................................................................13
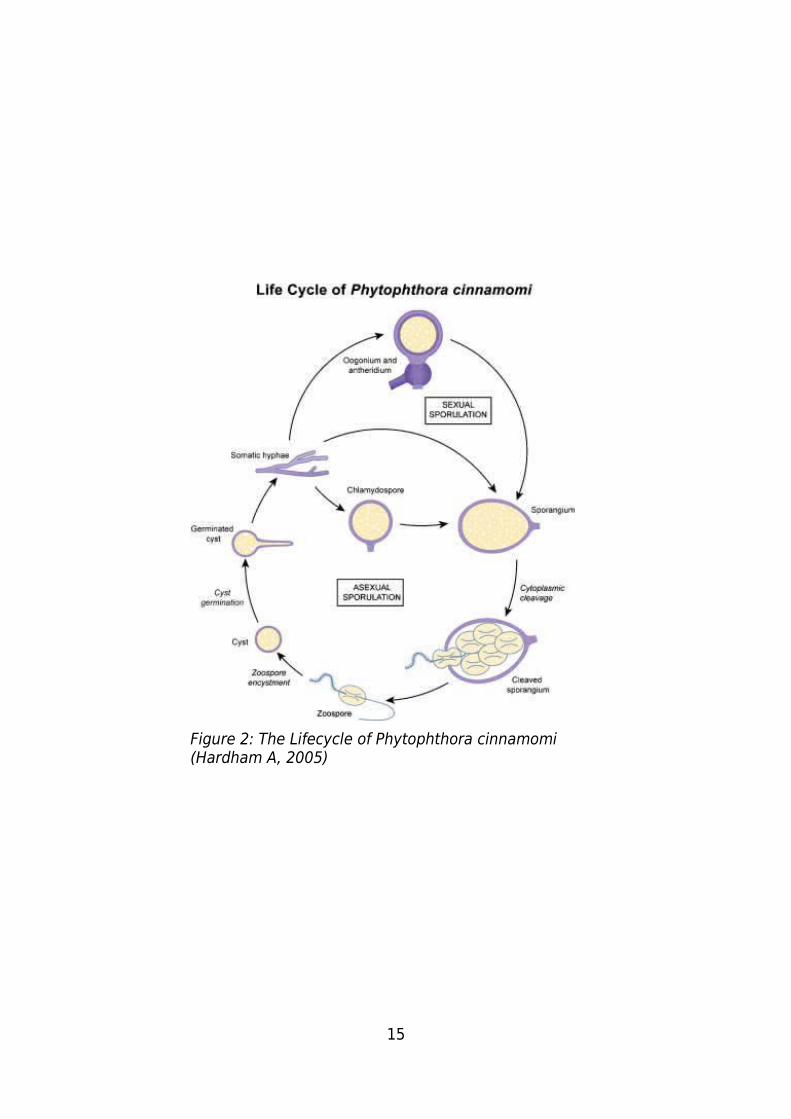
Figure 2: The Lifecycle of Phytophthora cinnamomi (Hardham A, 2005)........................15
Figure 3: A yeast actin monomer (yellow), in compelex with a gelsolin segment (blue).
The 4 actin subdomains can be seen along, as can the nucleotide binding site (red) with
a nucleotide present. The cation binding site can be seen with the presence of a Cation
(black) and it's associated water molecules (aqua). (Vorobiev et al, 2003).....................19
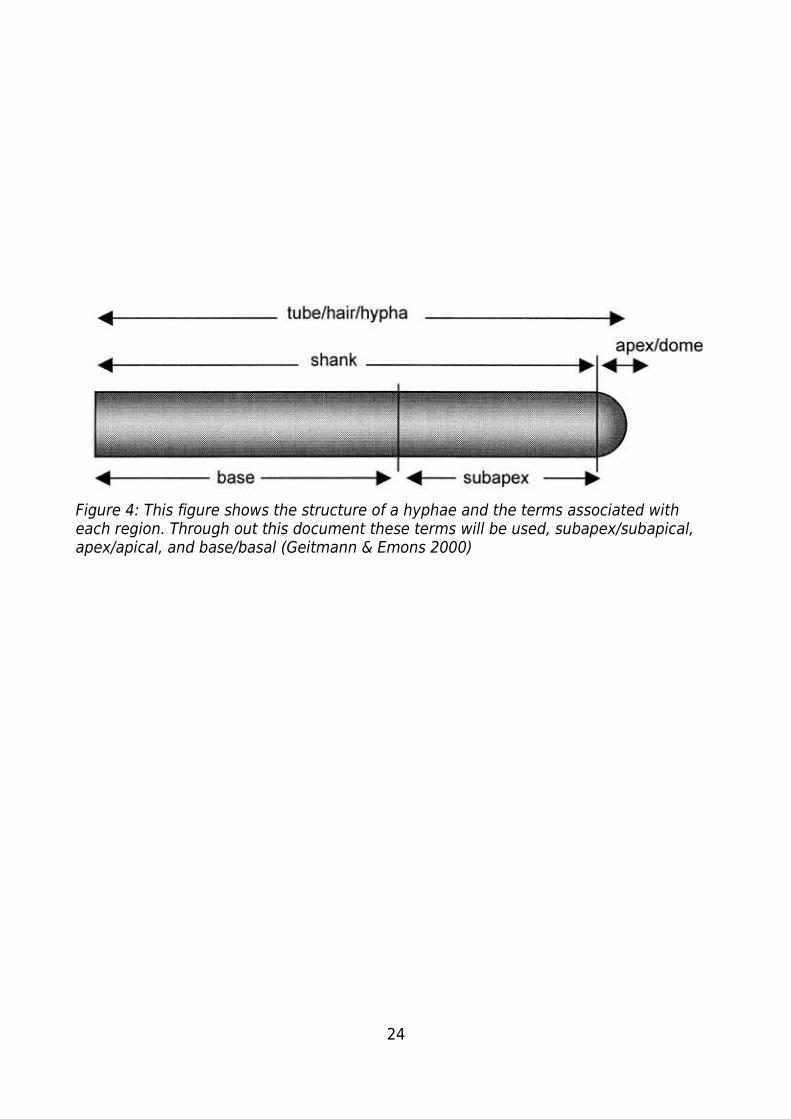
Figure 4: This figure shows the structure of a hyphae and the terms associated with each
region. Through out this document these terms will be used, subapex/subapical,
apex/apical, and base/basal (Geitmann & Emons 2000).................................................24
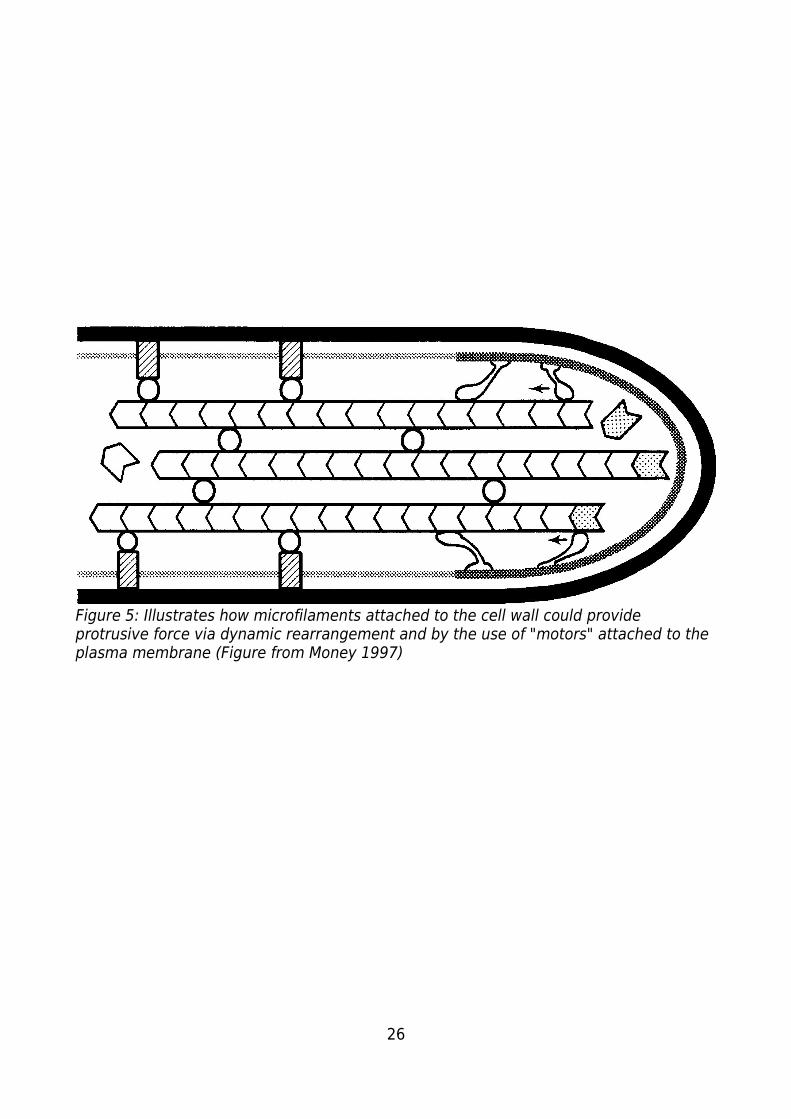
Figure 5: Illustrates how microfilaments attached to the cell wall could provide
protrusive force via dynamic rearrangement and by the use of "motors" attached to the
plasma membrane (Figure from Money 1997).................................................................26
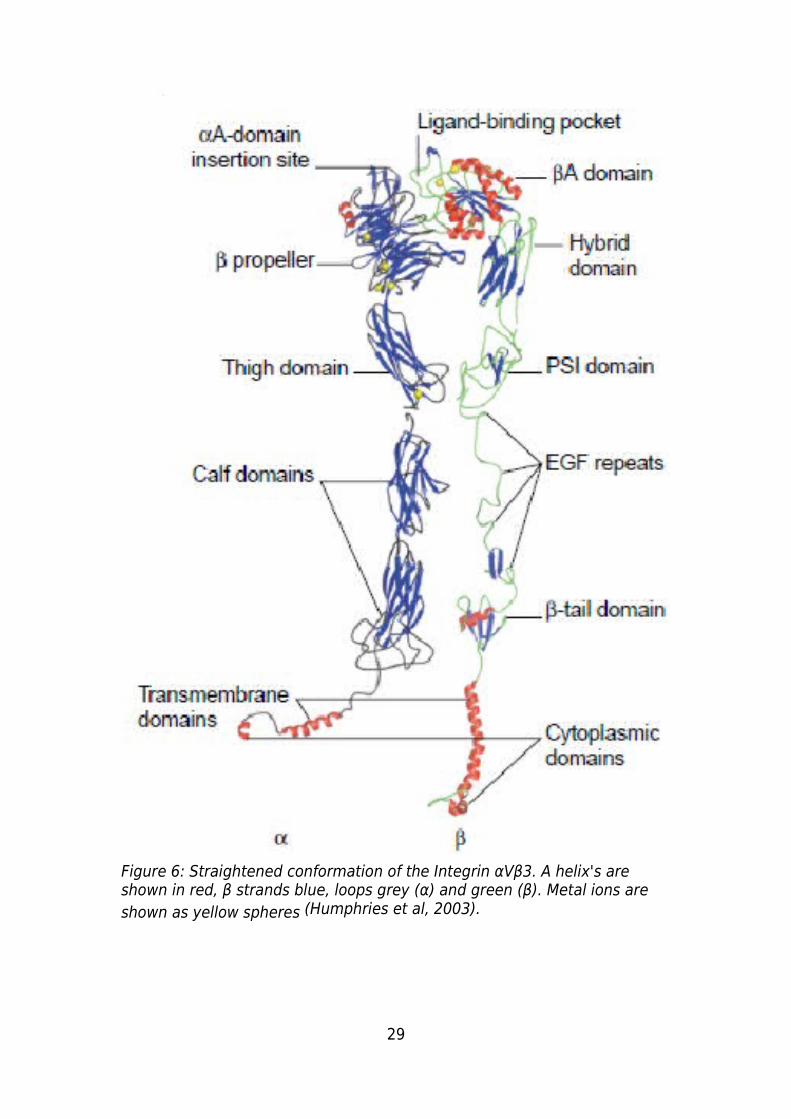
Figure 6: Straightened conformation of the Integrin αVβ3. Α helix's are shown in red, β
strands blue, loops grey (α) and green (β). Metal ions are shown as yellow spheres
(Humphries et al, 2003)...................................................................................................29
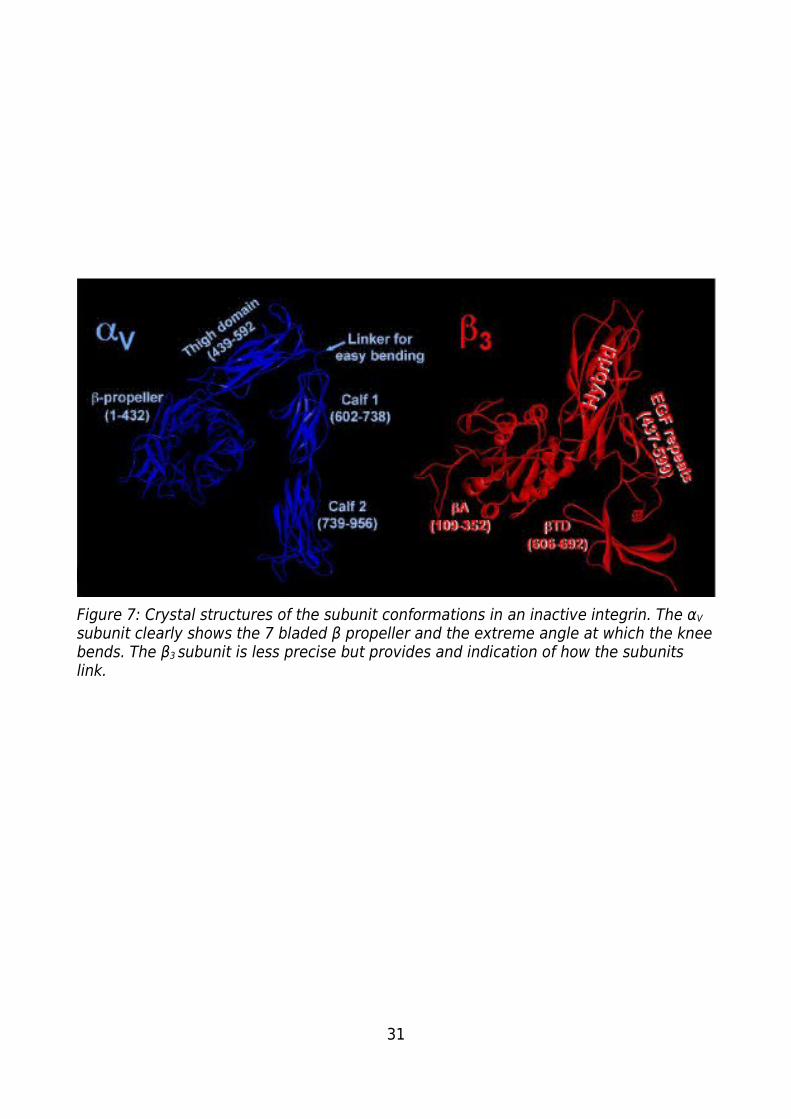
Figure 7: Crystal structures of the subunit conformations in an inactive integrin. The αV
subunit clearly shows the 7 bladed β propeller and the extreme angle at which the knee
bends. The β3 subunit is less precise but provides and indication of how the subunits
link....................................................................................................................................31
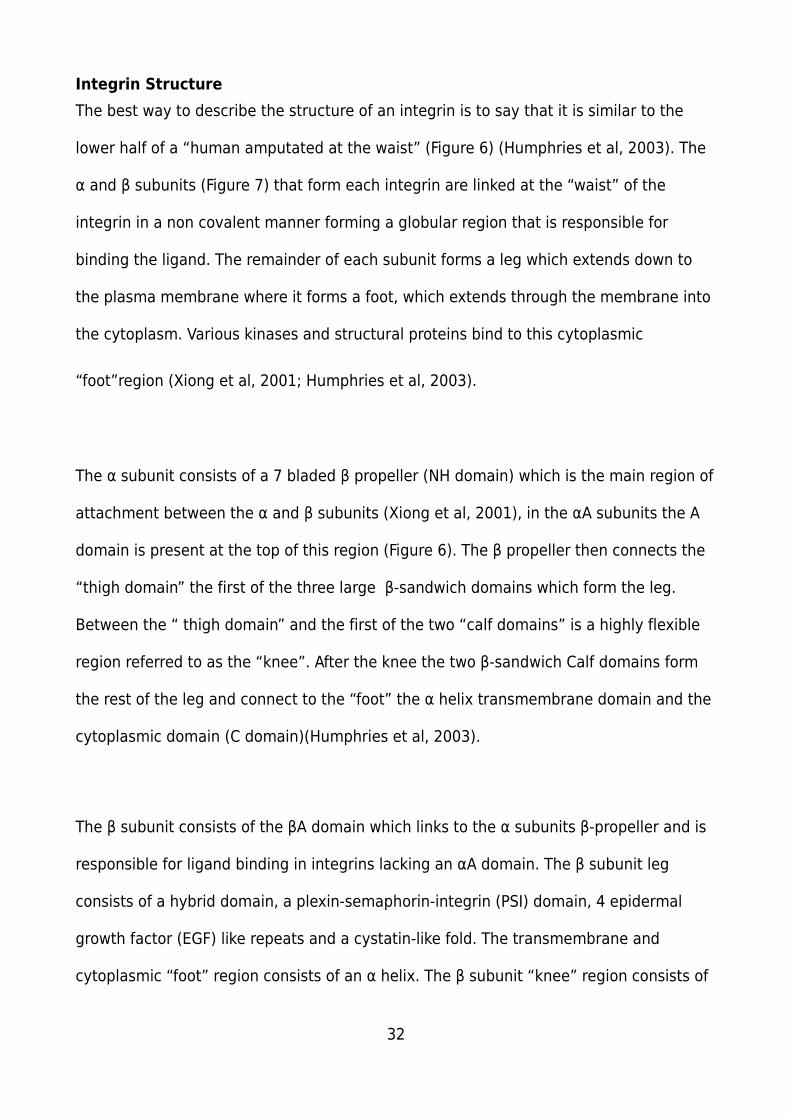
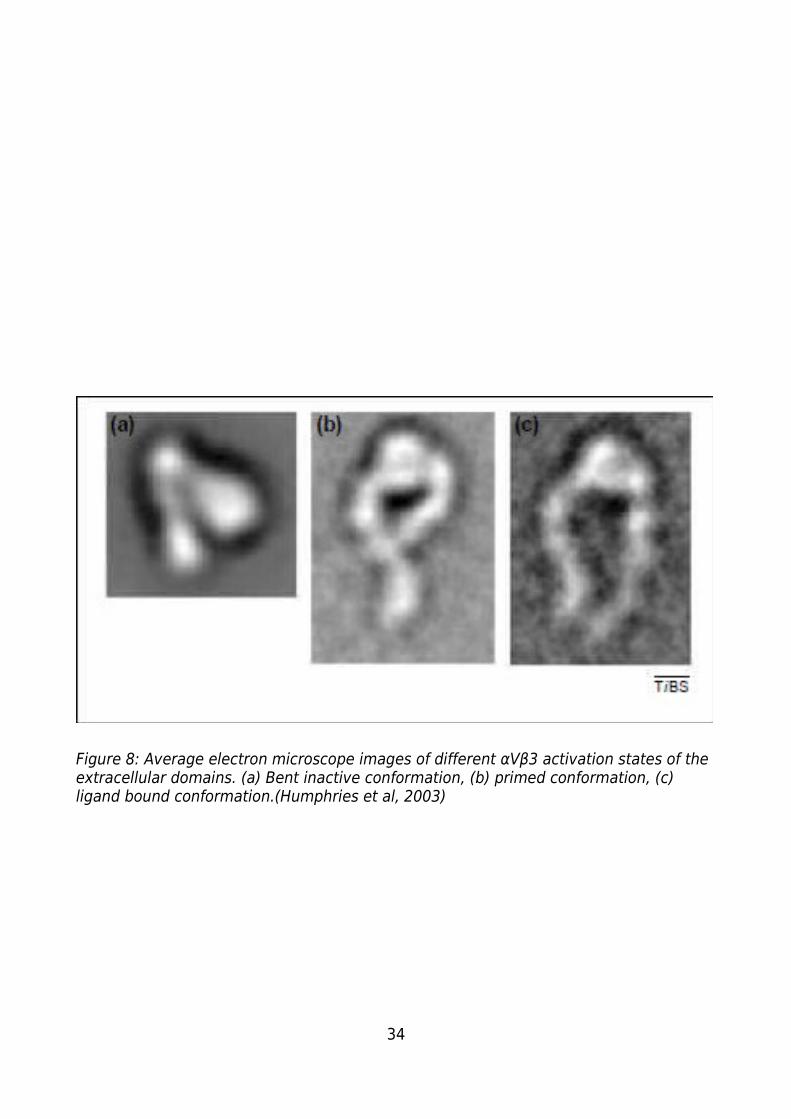
Figure 8: Average electron microscope images of different αVβ3 activation states of the
extracellular domains. (a) Bent inactive conformation, (b) primed conformation, (c)
6
ligand bound conformation.(Humphries et al, 2003).......................................................34
Figure 9: Hyphae A-F are DIC images of healthy growing hyphae. They show a pointed
tip and regular cytoplasm. Loss of focus for Images B, C and E due to movement on the
vertical plane....................................................................................................................51
Figure 10: Hyphae A-E were grown in invasive conditions fixed and stained with Alexa
Phalloidin. Image F is a control hypha grown in invasive conditions and fixed it was not
stained before viewing with the microscope....................................................................53
Figure 11: Images A-E show hyphae grown in non-invasive conditions stained with Alexa
Phalloidin, after fixing. Image F shows an unstained control...........................................55
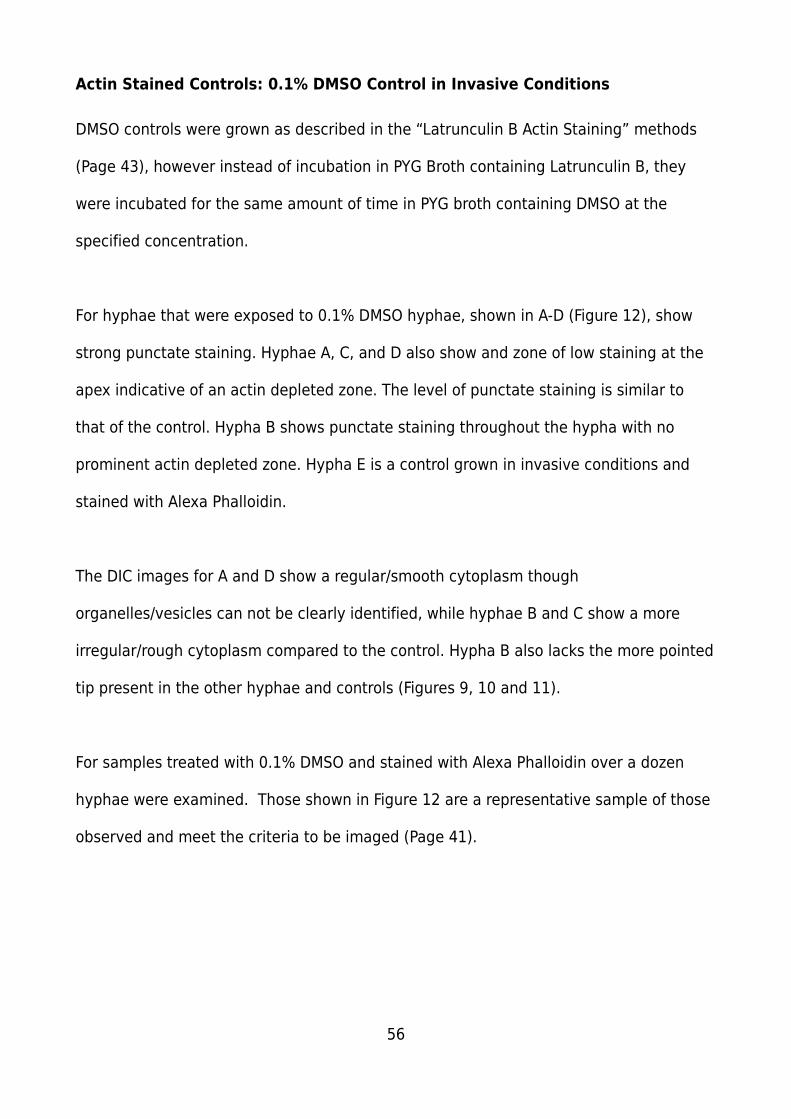
Figure 12: Images A-D are hyphae grown in invasive conditions then incubated with
0.1%DMSO in PYG Broth and stained with Alexa Phalloidin. Image E is an actin stained
hypha grown in invasive conditions.................................................................................57
Figure 13: Images A-D are 1% DMSO controls that were incubated for 30mins in PYG
Broth with 1% DMSO, fixed and stained with Alexa Phalloidin. Image E is a standard
control hypha grown in invasive conditions and stained with Alexa Phalloidin...............59
Figure 14: Hyphae A-E were stained with Alexa Phalloidin after exposure to 0.5ug/ml
LatB. Image F is an Alexa Phalloidin stained Control.......................................................61
Figure 15: Hyphae A-E, Alexa Phalloidin stained hyphae after treatment with 1ug/ml
LatB. Image F Alexa Phalloidin stained control. ..............................................................63
Figure 16: Hyphae A-E are Alexa Phalloidin stained hyphae grown in invasive conditions
then incubated with 5ug/ml LatB in PYG broth. Image F is a control stained with Alexa
Phalloidin..........................................................................................................................65
Figure 17: Hyphae A-E are hyphae grown in invasive conditions, and exposed to 10ug/ml
Latrunculin B before staining with Alexa Phalloidin. Image F is a control grown invasive
conditions, fixed, and then stained with Alexa Phalloidin................................................67
7
Figure 18: Growth Rates in μm/min against time for invasive hypahe with 5μg/ml LatB.71
Figure 19: Growth Rates in μm/min against time for non-invasive hyphae with 5μg/ml
LatB..................................................................................................................................73
Figure 20: Growth Rates in μm/min against time for invasive hyphae with 0.5μg/ml LatB
.........................................................................................................................................75
Figure 21: Growth Rates in μm/min vs time for non-invasive hyphen with 0.5μg/ml LatB
.........................................................................................................................................77
Figure 22: Merged Graph of Non-Invasive Growth rate samples, includes both 5μg/ml
and 0.5μg/ml LatB samples..............................................................................................79
Figure 23: Merged Graph of Invasive Growth rate samples, includes both 5μg/ml and
0.5μg/ml LatB samples.....................................................................................................79
Figure 24 Sequential images of Hyphae growing in non-invasive conditions before and
after the addition of 5μg/ml LatB Star or * indicate the addition of LatB (Times in
minutes: 0, 2, 4, 6, 8, 11*, 12, 14, 16, 18, 20, 25, 30).....................................................81
Figure 25: Sequential images of Hyphae growing in invasive conditions before and after
the addition of 0.5μg/ml LatB Star or * indicate the addition of LatB (Times in minutes: 0,
2, 4, 6, 8, 10, 12, 14*, 16, 18, 20, 22, 24, 26, 28, 30, 35, 40).........................................81
Figure 26: Phytophthora cinnamomi hyphae treated with mouse anti-Integrin β4
antibodies and stained with goat anti-mouse antibodies. Images A-F show the range of
observed patterns for stained hyphae. Hyphae A-C are non-invasive, D-F invasive........84
Figure 27: Phytophthora cinnamomi hyphae fixed and incubated with Goat Anti-Mouse
secondary antibody,.........................................................................................................86
Figure 28: Achlya bisexualis hyphae stained with mouse anti Integrin β4 antibody and
goat anti mouse antibody. Images A-D show the tips of stained hyphae. Image E shows
the basal region of a stained hyphae White pointers indicate stained integrin plaques. 88
8

Figure 29: SDS Page of Phytophthora cinnamomi protein extracts. Lane A is the Marker,
lanes B-F protein extracts................................................................................................90
Figure 30: Western of Phytophthora cinnamomi protein extracts incubated with mouse
anti-integrin β4 antibody. Lane A is the Marker, Lanes B-F are protein extracts at various
concentrations..................................................................................................................91
9
Abbreviations
°C Degree Celsius
dH20 Distiled H20
DIC Differential Interference Contrast
DMSO Dimethyl sulphoxide
EGTA Ethylene glycol-bis (β-aminoethyl ether)N, N, N, N,-tetraacetic acid
F-actin Filamentous actin
G-actin Globular actin
GIMP GNU Image Manipulation Program
g/l Grams per litre
Ilps Integrin like proteins
kDa Kilodalton
LMP Low Melting Point
mM Millimolar
μg/ml Micrograms per millilitres
μg Microgram
μl Microlitre
μm Micrometre
PAGE Polyacrylamide gel electrophoresis
PYG Peptone, Yeast extract, Glucose
10

PIPES Piperazine-N,N'-bis(2-ethanesulfonic acid)
pH Potential of hydrogen
SDS Sodium dodecyl sulfate
v/v Volume/volume
w/v Weight/Volume
11
Introduction
Phytophthora cinnamomi
Phytophthora cinnamomi Rands is a member of the genus Phytophthora of the
Oomycota which currently contains around 60 described species (Cooke et al, 2000)
(Phytophthora cinnamomi Rands; kingdom Chromista; phylum Oomycota; order
Peronosporales; family Peronosporaceae; genus Phytophthora)(Hardman, 2005). The
Oomycetes are recognised by their habit of hyphal growth, aseptate hyphae, and
production of biflagellate, heterokont zoos pores (Cooke et al, 2000). Due to
morphological similarities of oomycete and fungal hyphae (the vegetative growth form
of both types of organism) and similar methods of nutrient acquisition they have often
been mistakenly included with the true fungi. However, there a significant structural,
biochemical and genetic differences between the Oomycetes and true fungi of the
Kingdom Fungi (Cavalier-Smith, 1998). Biochemical and structural differences such as
the use of cellulose by oomycetes for the cell wall compared to chitin for true fungi, as
well genetic differences of which an example is changes to the small subunit ribosomal
RNA gene (Forster, 1990). These difference and others clearly place the oomycetes into
a different phylogenetic group to the true fungi (1313Figure 1).
Members of the Phytophthora genus are best known as the pathogens responsible for a
number of devastating plant diseases, which affect a wide range of economically
important crops and cause extensive damage to natural plant communities (Hardman,
2005; Cooke et al, 2000). .
12
13
Figure 1: Phylogentic tree showing the evolutionary relationships between that major groups of Eukaroytes. There is a significant evolutionary distance between the True Fungi and the Oomycetes (Hardham, 2005)
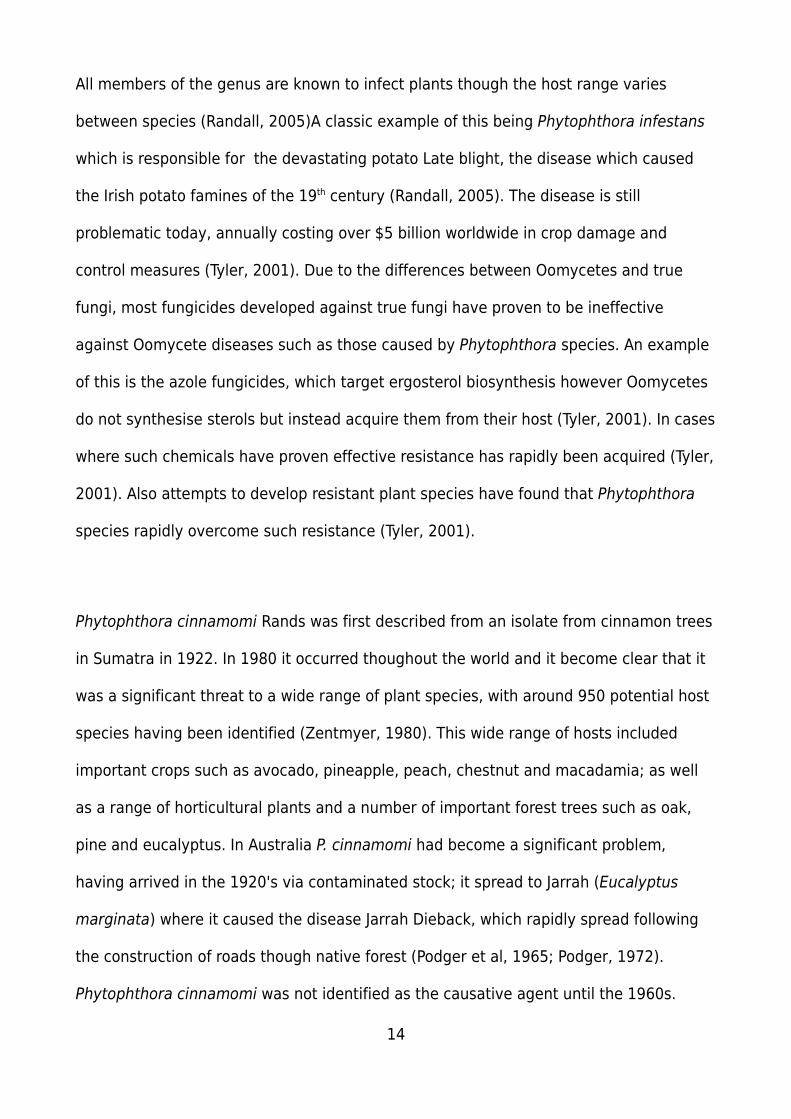
All members of the genus are known to infect plants though the host range varies
between species (Randall, 2005)A classic example of this being Phytophthora infestans
which is responsible for the devastating potato Late blight, the disease which caused
the Irish potato famines of the 19th century (Randall, 2005). The disease is still
problematic today, annually costing over $5 billion worldwide in crop damage and
control measures (Tyler, 2001). Due to the differences between Oomycetes and true
fungi, most fungicides developed against true fungi have proven to be ineffective
against Oomycete diseases such as those caused by Phytophthora species. An example
of this is the azole fungicides, which target ergosterol biosynthesis however Oomycetes
do not synthesise sterols but instead acquire them from their host (Tyler, 2001). In cases
where such chemicals have proven effective resistance has rapidly been acquired (Tyler,
2001). Also attempts to develop resistant plant species have found that Phytophthora
species rapidly overcome such resistance (Tyler, 2001).
Phytophthora cinnamomi Rands was first described from an isolate from cinnamon trees
in Sumatra in 1922. In 1980 it occurred thoughout the world and it become clear that it
was a significant threat to a wide range of plant species, with around 950 potential host
species having been identified (Zentmyer, 1980). This wide range of hosts included
important crops such as avocado, pineapple, peach, chestnut and macadamia; as well
as a range of horticultural plants and a number of important forest trees such as oak,
pine and eucalyptus. In Australia P. cinnamomi had become a significant problem,
having arrived in the 1920's via contaminated stock; it spread to Jarrah (Eucalyptus
marginata) where it caused the disease Jarrah Dieback, which rapidly spread following
the construction of roads though native forest (Podger et al, 1965; Podger, 1972).
Phytophthora cinnamomi was not identified as the causative agent until the 1960s.
14
15
Figure 2: The Lifecycle of Phytophthora cinnamomi (Hardham A, 2005)
Many of the understorey species also proved to be susceptible to the disease resulting
in epidemics as it spread through native forests.
With the continued problems with P. cinnamomi in Australia further research has been
done to examine the host range of the organism among the local species. Studies in
Western Australia (Wills, 1992), Tasmania (Brown et al, 2002) and Victoria (Weste, 2003)
have suggested that as many as 2000 species may be at risk from P. cinnamomi
(Shearer et al, 2004). Thus infection by P. cinnamomi leads to a significant change in the
composition of species in an area as susceptible species are killed off and replaced by
other resistant species often herbaceous perennials, rushes, sedges and introduced
weed species.
Examination of the conditions associated with the various epidemics has suggested that
epidemics occur when conditions favour asexual sporulation and zoospore production.
Such conditions include heavy rain and an increase in soil temperature. Further
supporting this link are recent surveys that have shown the re-establishment of
susceptible species in regions they had previously disappeared from, after 5 consecutive
years of the driest conditions on record (Hardham, 2005). The existence of this link
between environmental conditions and disease epidemics has led to the examination of
the possible effects of global warming on diseases caused by P. cinnamomi. Studies
suggest that an increase of rainfall and temperature could lead to an increase in the
severity of P. cinnamomi oak diseases in Europe and an increase in it's range
(Chakraborty et al, 1998; Bergot et al, 2004).
With P. cinnamomi diseases resulting in significant economic losses for various crop
16
species such as pineapple (Zentmyer, 1980), avocado (Erwin & Ribeiro, 1996 as cited by
Hardham, 2005) and forestry species such as pine (Zentmyer, 1980) as well as serious
damage to biodiversity P. cinnamomi is a species that is of considerable interest to both
commercial and non-commercial groups and thus an important target for research. A
better understanding of it's lifecycle (Figure 2), biochemistry, genetics and molecular
biology will help in the development of methods of control as well as providing insight
that will be of use in understanding and controlling other members of it's genus. While
significant research into the related species Phytophthora infestans has been underway
for some time, P. cinnamomi has significant differences in it's primary habitat and
methodology of infection compared to Phytophthora species such as Phytophthora
infestans. Phytophthora infestans can be considered as an example of Phytophthora
species which follow a lifestyle of aerial dispersion and infection involving caducous
papillate sporangia, while Phytophthora cinnamomi is an example of Phytophthora
species which tend towards a lifestyle as soil-inhabiting, root infecting parasites with
noncaducous sporangia (Cooke et al, 2000). This difference in lifestyle would suggest
that exact methods of control or management are likely to vary between the species
even though closely related. Thus it is important to study a variety of Phytophthora
species to better understand the genus, with Phytophthora cinnamomi, due to it's great
importance as a disease organism, being a prime candidate for study.
17
Actin
Actin is one of the two primary proteins that make up the cytoskeleton in most
organisms, the other being tubulin, which forms microtubules. It has a molecular weight
of approximately 42kDa, and can exist as either a monomer known as G-actin or as a
polymer of repeating monomer subunits. When two polymers link up they form a left-
handed helical structure referred to as a microfilament, which is also known as F-actin.
Microfilaments are capable of joining up to form cables and dynamic 3-dimensional
networks. These actin-based structures, in combination with microtubules, form the
basis of the cytoskeleton. Actin monomers consist of a single polypeptide with two
domains, a “large” and a “small”, each domain featuring two sub-domains (Figure 3)
(Vorobiev et al, 2003). There are two features of the actin monomers that are
particularly important in defining the characteristics of actin microfilaments. The first is
an ATP and cation binding site, the hydrolysis of ATP affects the dynamics of the
microfilament. The second is the longitudinally asymmetric nature of the monomer,
which affects the rates at which monomers can associate and disassociate from a
microfilament. As a result of the biochemical differences in the structure the association
of monomers occurs primarily at one end, the “barbed end”, and dissociation occurs
primarily at the “pointed end”. The dynamics of F-actin are affected by cellular
conditions, actin monomer concentrations, and the presence or absence of a large
variety of actin binding proteins (ABPs) (Walker and Garrill, 2006). Specific ABPs are
associated with various F-actin arrangements and structures, and ABPs may stabilise or
destabilise of F-actin microfilament and the more complex F-actin structures derived
from the microfilaments, these interactions allow F-actin structures to be highly
18
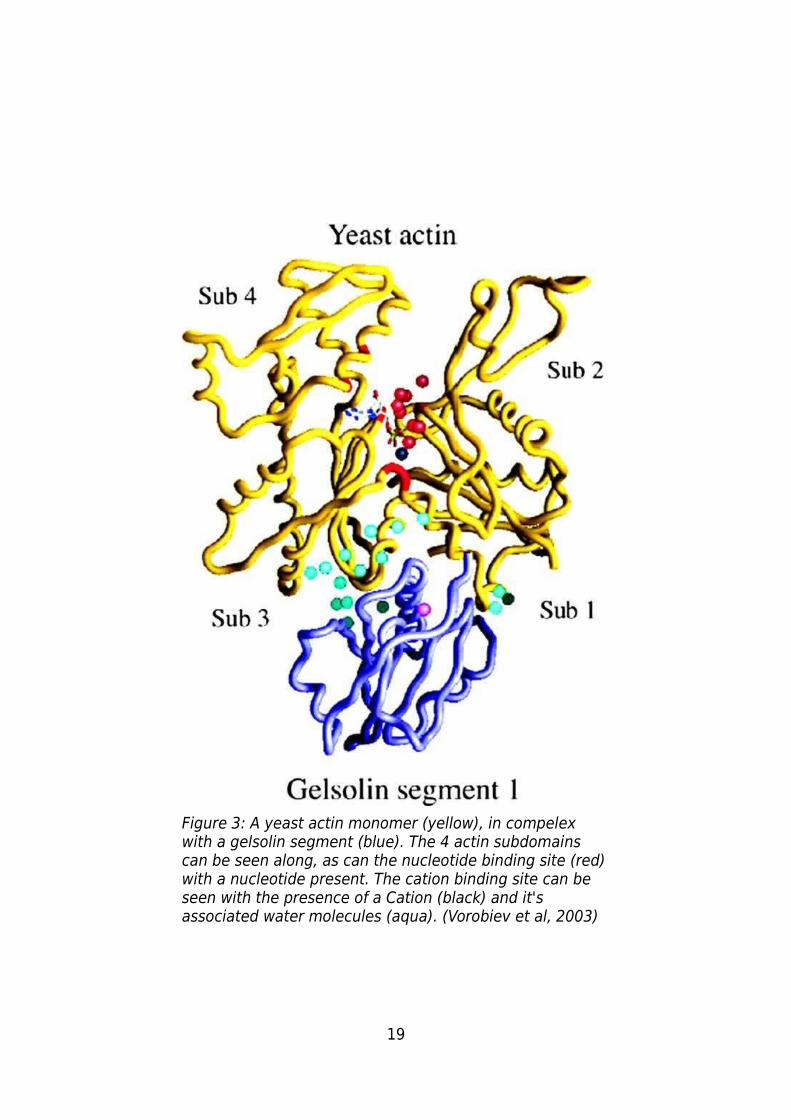
19
Figure 3: A yeast actin monomer (yellow), in compelex with a gelsolin segment (blue). The 4 actin subdomains can be seen along, as can the nucleotide binding site (red) with a nucleotide present. The cation binding site can be seen with the presence of a Cation (black) and it's associated water molecules (aqua). (Vorobiev et al, 2003)
dynamic. Many actin binding proteins appear to share a conserved actin binding domain
which targets a hydrophobic cleft in the monomers structure (Dominguez, 2004). A
large number of actin binding proteins have been described, Dos Remedios et al (2002)
provide a detailed review of such proteins.
In animal cells F-actin is links to integrin containing focal adhesions on the plasma
membrane of the cell (Blystone, 2004). These focal adhesions are aggregates of
transmembrane signalling proteins, and also act to link the cytoskeleton to the external
environment be that the extra cellular matrix or the substrate the cell is being grown on.
This link to the external environment helps anchor cytoskeleton, providing it with a solid
base against which force and be generated for use with in the cell, F-actin filaments in
conjunction with motor proteins such as myosin are thought to be among the major
sources of force generated in this manner. Such force can be used to move other
microfilaments, organelles, vesicles and other cellular elements, as well manipulate the
shape of the cell. Due to its importance as one of the two primary cytoskeleton proteins
and the large number of proteins that bind to it, F-actin has been studied in some depth,
with a wide range of methods developed to visualise it in hyphal organisms (Kaminskyj
& Heath 1994). As a result it has been found that the arrangement of F-actin in cells
varies significantly from species to species. None the less several recurring
arrangements of F-actin have been noted. One of the more common patterns in hyphal
organisms are patches or plaques of F-actin, usually found in the cortex or periphery
near the plasma membrane of the cell (hence these are typically described as cortical or
peripheral populations). In hyphae these tend to accumulate near the apex of the
hyphae or in areas of growth. Such plaques are dynamic being able to rapidly assemble,
disassemble and reassemble in a period of minutes (Heath et al, 2003; Ayscough et al,
20
1997). In yeast plaques have been partially purified (Young et al, 2004), with each
plaque consisting of on average, 85 filaments with an average length of 50nm (20 actin
subunits). Associated with the filaments was a Actin Related Protein complex (ARP2/3),
containing the actin related proteins Arp 2 and Arp 3, which act as a template for plaque
assembly and motility (Winter et al, 1997). There is some evidence for plaques being
involved in endocytosis (Engqvist-Goldstein & Drubin, 2003) and cell wall deposition
(Utsugi et al, 2002). F-actin is also known to form cables. These are formed when
numerous filaments are bundled together by the ABP fimbrin/sac6. Such cables tend to
form in a polarised manner, in hyphae aligning parallel to the longitudinal axis. These
cables, in conjunction with myosin, are thought to provide routes for the transportation
of organelles and vesicles (Adams & Pringle, 1984). This supposed role is supported by
sub-apical swelling caused by treatment with Latrunculin B, which inhibits the formation
of F-actin. Loss of the F-actin derived cables would lead to the delocalised delivery of
vesicles, as the lack of longitudinally aligned cables removes the guide and likely motive
source for vesicles. Another interesting pattern of F-actin distribution is that which is
found in oomycetes. Oomycetes typically contain a peripheral cap of microfilaments at
the hyphal tip. The cap can either be complete or contain an actin depleted zone at
apex (Yu et al, 2004; Walker et al, 2006). The actin depleted zone may allow for a
localised increase in protrusive force with out change in turgor, or serve as an area for
the accumulation of vesicles containing cell wall components (Walker et al, 2006). In the
sub apical region the cap changes to a diffuse network of plaques and fibrils. The F-actin
cap may play a role in the regulating the movement of organelles and vesicles into and
out of the sub-apical region of the hyphae, acting as a filter of sorts (Geitmann &
Emons, 2000). It may also play a role in the regulating turgor driven expansion of the
cell wall.
21
F-actin is involved in a wide range of cellular activities in a variety of species.
Controversially it has been suggested as a provider of a protrusive force in ameboidal
movement in hyphal organisms (Heath & Steinberg, 1999). In yeast the polymerisation
of a microfilament with the actin binding protein formin has been shown to generate a
force of 1pN (Kovar & Pollard, 2004), as well as having roles in morphogenesis,
polarisation, mitosis, meiosis, cytokinesis, septation, and the movement and positioning
of organelles (Walker & Garrill, 2006).
Actin Inhibitors
Of great importance in the study actin has been the ability to disrupt the formation of
its microfilaments. Two families of inhibitors are of regular use in actin related studies
the Cytochalasins and Latrunculins both inhibit F-actin formation although their methods
of action vary. Some members of the cytochalasin family are thought to bind to the
barbed end of F-actin filaments destabilising them and displacing them from their sites
of anchorage (Wakatsuki et al, 2000), however there is some suggestion that the
cytochalasins may not be entirely actin specific (Lin & Spudich, 1974; Treves et al,
1987). While the Latrunculins (A, and B) have been shown to bind to G-actin, preventing
the formation of F-actin, this combined with the dynamic disassembly of F-actin results
in a loss of G-actin preventing the assembly or reassembly of F-actin (Spector et al,
1989).
22

Hyphal Growth.
Hyphal growth or tip growth is a common highly polarised form of growth that occurs in
a wide range of organisms including fungi, oomycetes, and plants. Due to its
involvement in the growth of both plants and hyphal organisms it is important that the
mechanism of growth is well studied and understood, as this would provide a valuable
insight into how such organisms function, and would be of great use in the continued
effort to control tip growing pathogens. Currently there is no standard accepted model
of tip growth, but a number of hypothesises having been put forward. Most agree on the
basic activities that occur during growth but differ in certain areas including what the
source of the protrusive force is. In hyphae most of the critical processes are thought to
occur at the apex. At the apex, vesicles containing plasma membrane and cell wall
components along with agents (ie endoglucases) which soften and weaken the cell wall,
are deposited, leading to localised expansion at that area. The endogulcases are
thought to weaken the cell wall or increase its malleability, allowing the protrusive force
to push it outwards causing the hyphae to grow. The vesicles are thought to be guided
to the tip by the cytoskeleton, predominately by actin microfilaments. Various
experiments have shown that actin microfilaments are dominant compared to
microtubules in this area and the disruption of the actin microfilaments leads to
cessation or a significant reduction of the rate of growth. While disruption of the
microtubules causes a change in the morphology of the hyphae but generally not, a
cessation of growth or as a significant a reduction in the rate of growth compared to
actin disruption (Heath et al, 2000). While the mechanisms for the transport and
deposition of materials needed for growth may be agreed on, the source of the force
needed to extend the hyphae in both invasive and non-invasive conditions is an area of
23
24
Figure 4: This figure shows the structure of a hyphae and the terms associated with each region. Through out this document these terms will be used, subapex/subapical, apex/apical, and base/basal (Geitmann & Emons 2000)

debate.
Two major hypothesises have been put forward, the turgor pressure model and tube
growing ambae model. The earlier of the two to gain significant support, was the
hypothesis that the turgor pressure in a hypha drives growth and is the source of the
protrusive force required for tip growth in walled cells. Hyphal organisms for the most
part have varying degrees of turgor pressure in their hyphae and are able to regulate it
and adjust it with regards to the external environment. In the turgor pressure model, the
hydrostatic pressure in the hyphae drives the growth. As the cell wall at the hyphal tip is
weakened by the action of endogucanases or similar enzymes and the addition of
materials to the cell wall, the resistance of the cell wall decreases until it is less than
that of the turgor at the tip. The turgor pressure then forces the cell wall outward,
expanding the cell (Kropf et al, 1998), while additional compounds then strengthen that
particular region of cell wall as the hyphae tip moves further away and that region of
wall becomes a lateral wall (Bastmeyer et al, 2002). The model however isn't without
it's problems, with experimental data at times failing to show a link between turgor
pressure and growth rate (Money, 1997). Also a number of oomycetes have been found
that are unable to regulate turgor pressure under changing conditions (Lew et al, 2004),
and some hyphal organisms have been found that undergo tip growth in the absence of
any detectable turgor pressure (Harold et al, 1996). Such occurrences cannot be
explained by the current turgor pressure based models leading some to suggest that
while turgor pressure may play a role in tip growth that it may not be the primary or sole
source of the protrusive force needed for tip growth or that alternate mechanisms may
be present.
25
26
Figure 5: Illustrates how microfilaments attached to the cell wall could provide protrusive force via dynamic rearrangement and by the use of "motors" attached to the plasma membrane (Figure from Money 1997)

Another major hypothesis for explaining hyphal tip growth is that rather than utilizing
turgor pressure that it may instead be more readily compared to ameboid movement
and that hyphae as such can be modelled as tube dwelling Amebae. In this model
growth occurs as the apical cytoplasm is protruded by the action of actin microfilaments
in a manner similar to a pseudopodium, Studies have shown that the extension of a
microfilament generates a force of at least 1pN (Kovar & Pollard, 2004). Thus large
bundles of microfilaments attached to the cytoskeleton and the cell wall might provide
sufficient force to drive growth (Money, 1997).
In support of such a hypothesis are various similarities that can be observed between
hyphae tips and pseudopodia. With the observations of the critical importance of
dynamic F-actin remodelling in both hyphal tip growth and pseudopodia, the discovery
of Integrin like proteins in a number of hyphal organisms, and the migration of
cytoplasm to fill the enlarged cell wall. Further similarities between hyphal organism and
amebae can be seen in the zoospores of a number of hyphal organisms, which move in
a manner comparable to ameboid movement and a slime mutant of Neurospora, which
lacking a cell wall moves across solid substrates like amebae, via the extension of
tubular pseudopodia. An in-depth review of all such observations and support evidence
for the model has been produced by Heath and Steinberg (1999).
Overall, though various hypotheses have been proposed none have yet acquired
sufficient evidence to be fully supported. It is quite possible that the actual mechanism
of tip growth may be an amalgamation of the various theories or that differing groups
such as the Oomycota may utilise different mechanisms of growth from the Eumycota.
Either way, further research into such matters is needed to further our understanding of
the growth of hyphal organisms.
27
Integrins
Integrins are a large family of heterodimeric transmembrane receptors (Xiong et al,
2001; Xiong et al, 2002; , Giancotti et al 1999), consisting of an α and β subunit. They
have primarily been studied in animals though recent studies have found evidence of
epitopically related proteins that have been called the Integrin like proteins (Ilps) in both
plants and Fungi (Chitcholtan & Garrill, 2005; Heath & Steinberg, 1999). However for the
moment, such Ilps have not been characterised in depth, thus our understanding of
their possible roles and importance must be based largely on correlations made with
studies of integrins in animals, in which the proteins have been extensively examined.
In mammals there are 18 α subunits split into two categories, the 9 A domain containing
α subunits which have an A domain homologous to the A domain of the von Willebrand
factor and 9 α subunit that lack the A domain (Humphries et al, 2003). There are 8 β
subunits which combine with the 18 α units to form 24 different receptors (Xiong et al,
2001, 2002; Giancotti et al, 1999; Humphries et al, 2003) which are then named after
the subunits they're made up of. Integrins act to transfer chemical and mechanical
signals between the extra cellular matrix (ECM) and the cytoskeleton of the cells. Of
relevance to the current study they are also critical in the migration of cells via an
amebiodal mechanism.
Animal cells grow, move, and reproduce in tissue specific environments know as the
extra cellular matrix, an intracellular system of proteins, sugars, connective fibres, and
other biologically active molecules. The ECM helps to define the various tissues,
providing the cells that grow in it the necessary information to determine which tissue
they are in. This regulates the cell types they can differentiate into, as well as providing
28
29
Figure 6: Straightened conformation of the Integrin αVβ3. Α helix's are shown in red, β strands blue, loops grey (α) and green (β). Metal ions are shown as yellow spheres (Humphries et al, 2003).

other important information about the tissue and the nearby cells. Integrins are
considered to be the primary means of communication between the ECM and a cell
(Giancotti et al, 1999). Integrins are thought to provide bidirectional signalling through
the membrane (Xiong et al, 2002; Giancotti et al, 1999; Humphries et al, 2003).
Outside-in signal transduction is where binding of the integrin to ECM elements leads to
the transduction of a signal into the cell, and inside-out signal transduction is where the
binding of cytoplasmic factors to the integrins cytoplasmic domains regulates the extra
cellular functions of the integrin (Xiong et al, 2001; Xiong et al, 2002; , Giancotti et al,
1999). In vivo different integrins are thought to work together with other receptors such
as growth factor receptors and the insulin receptor, with different integrins being shown
to co-localize with different receptors (Giancotti et al, 1999).
This co-localization has been show to increase the sensitivity of both the integrin and
the receptor and it is postulated that the co-localization results in both being partially
activated (Giancotti et al, 1999).
The primary organizational structure associated with integrins is the focal adhesion. This
is a region of the membrane where integrins clump together with other receptors
(Giancotti et al, 1999), these adhesion sites are large enough that they can be observed
on the plasma membrane (Wozniak et al, 2004). A focal adhesion site consists of a
number of different integrins which are linked via their cytoplasmic domains to a
mixture of different kinases and structural proteins which connect them up to the actin
cytoskeleton. Focal adhesion sites are dynamic and seem to be critical for proper
integrin function (Wozniak et al, 2004).
30
31
Figure 7: Crystal structures of the subunit conformations in an inactive integrin. The αV
subunit clearly shows the 7 bladed β propeller and the extreme angle at which the knee bends. The β3 subunit is less precise but provides and indication of how the subunits link.
Integrin Structure
The best way to describe the structure of an integrin is to say that it is similar to the
lower half of a “human amputated at the waist” (Figure 6) (Humphries et al, 2003). The
α and β subunits (Figure 7) that form each integrin are linked at the “waist” of the
integrin in a non covalent manner forming a globular region that is responsible for
binding the ligand. The remainder of each subunit forms a leg which extends down to
the plasma membrane where it forms a foot, which extends through the membrane into
the cytoplasm. Various kinases and structural proteins bind to this cytoplasmic
“foot”region (Xiong et al, 2001; Humphries et al, 2003).
The α subunit consists of a 7 bladed β propeller (NH domain) which is the main region of
attachment between the α and β subunits (Xiong et al, 2001), in the αA subunits the A
domain is present at the top of this region (Figure 6). The β propeller then connects the
“thigh domain” the first of the three large β-sandwich domains which form the leg.
Between the “ thigh domain” and the first of the two “calf domains” is a highly flexible
region referred to as the “knee”. After the knee the two β-sandwich Calf domains form
the rest of the leg and connect to the “foot” the α helix transmembrane domain and the
cytoplasmic domain (C domain)(Humphries et al, 2003).
The β subunit consists of the βA domain which links to the α subunits β-propeller and is
responsible for ligand binding in integrins lacking an αA domain. The β subunit leg
consists of a hybrid domain, a plexin-semaphorin-integrin (PSI) domain, 4 epidermal
growth factor (EGF) like repeats and a cystatin-like fold. The transmembrane and
cytoplasmic “foot” region consists of an α helix. The β subunit “knee” region consists of
32
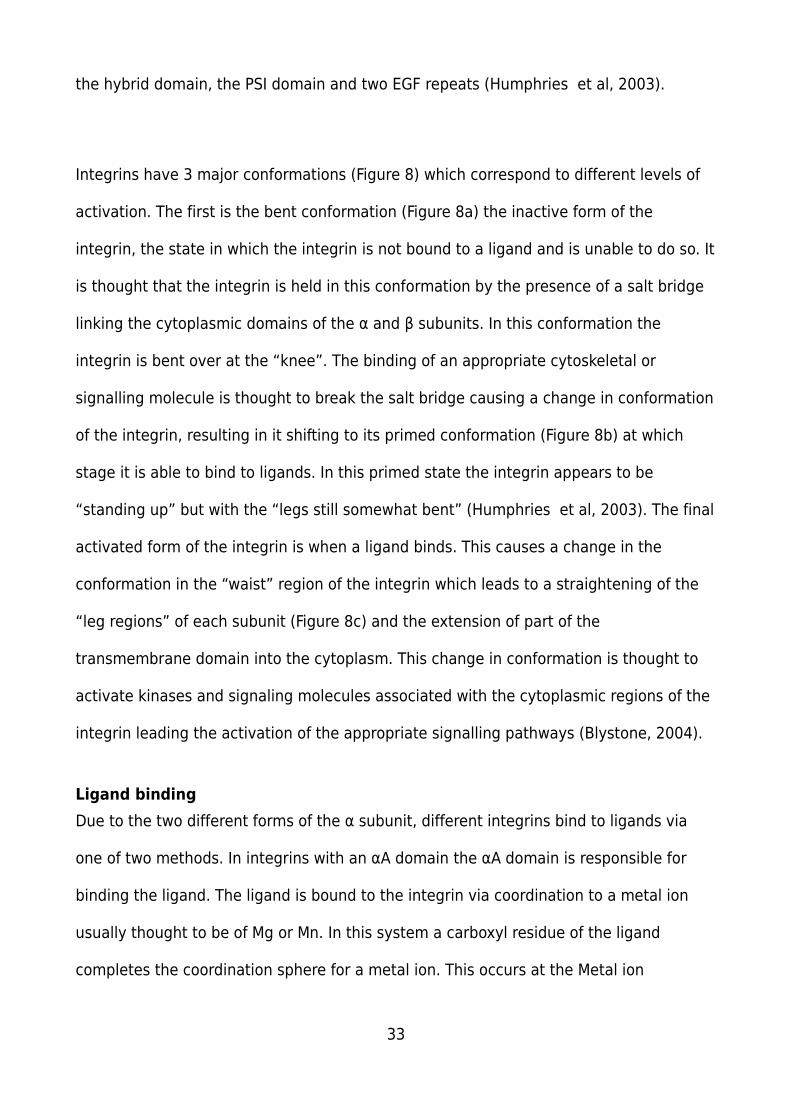
the hybrid domain, the PSI domain and two EGF repeats (Humphries et al, 2003).
Integrins have 3 major conformations (Figure 8) which correspond to different levels of
activation. The first is the bent conformation (Figure 8a) the inactive form of the
integrin, the state in which the integrin is not bound to a ligand and is unable to do so. It
is thought that the integrin is held in this conformation by the presence of a salt bridge
linking the cytoplasmic domains of the α and β subunits. In this conformation the
integrin is bent over at the “knee”. The binding of an appropriate cytoskeletal or
signalling molecule is thought to break the salt bridge causing a change in conformation
of the integrin, resulting in it shifting to its primed conformation (Figure 8b) at which
stage it is able to bind to ligands. In this primed state the integrin appears to be
“standing up” but with the “legs still somewhat bent” (Humphries et al, 2003). The final
activated form of the integrin is when a ligand binds. This causes a change in the
conformation in the “waist” region of the integrin which leads to a straightening of the
“leg regions” of each subunit (Figure 8c) and the extension of part of the
transmembrane domain into the cytoplasm. This change in conformation is thought to
activate kinases and signaling molecules associated with the cytoplasmic regions of the
integrin leading the activation of the appropriate signalling pathways (Blystone, 2004).
Ligand binding
Due to the two different forms of the α subunit, different integrins bind to ligands via
one of two methods. In integrins with an αA domain the αA domain is responsible for
binding the ligand. The ligand is bound to the integrin via coordination to a metal ion
usually thought to be of Mg or Mn. In this system a carboxyl residue of the ligand
completes the coordination sphere for a metal ion. This occurs at the Metal ion
33
34
Figure 8: Average electron microscope images of different αVβ3 activation states of the extracellular domains. (a) Bent inactive conformation, (b) primed conformation, (c) ligand bound conformation.(Humphries et al, 2003)
dependent adhesion site (MIDAS), where via a conserved, 5 amino acid, motif with the
ligand acid residue providing a 6th coordination site to stabilise the ion This is supported
by additional hydrogen bonding between the ligand and the integrin and secondary
binding at ligand specific sites on each integrin.
For integrins lacking the αA domain the initial binding occurs via the β subunits βA
domain. The βA domain is similar to the αA domain. In this type of integrin the ligands
carboxyl residue inserts between the β-propeller and the βA domain where it
coordinates with the βA MIDAS site in the same manner as the αA binding. However in
the βA domain a second metal ion binding occurs, the ligand dependent metal ion
binding (Xiong et al, 2002). The binding of the metal ion to the MIDAS site causes a
change in conformation in the the βA domain which forms a second coordination sphere
allowing the coordination of a second metal ion. Again this is thought to be followed up
by additional binding at ligand and integrin specific sites (Humphries et al, 2003). This
causes a change in conformation which is transmitted through the subunit “legs”
causing the extension of the transmembrane domains into the cytoplasm leading to the
activation of the integrin associated signalling molecules and kinases and thus the
signal cascade (Blystone 2004).
Integrins also have important roles in the regulation of many critical cellular functions.
Integrin activation and deactivation of various pathways can be linked to the control of
the Cell Cycle, Cell Death, Cell Growth, and Cell Shape (Giancotti et al 1999). Integrins
also play and important role in cell migration.
35
Many cell types move via an ameboidal method (Heath & Steinberg, 1999) with the cell
first extending a lamellipodia which attaches to the external environment and samples it
to determine if the environment is suitable for the growth of the organism (Giancotti et
al 1999). If the environment is suitable the cell then moves itself along after the
lamellipodia. If the environment is not suitable it can instead move in another direction.
For the cell to push itself along after the lamellipodia it needs an anchor point or strong
base attached to the external environment that it can exert force against, to propel the
cell forward without compromising the structural integrity of the cell. The anchor must
also connect to the actin cytoskeleton as that will be the primary source of the force.
Integrins are one of these adhesion molecules (Giancotti et al, 1999), being able to bind
to material in the external environment and forming focal adhesions which are
connected to the cytoskeleton. This provides a solid platform for the cytoskeleton to
“push” against. Therefore, in cell migration, integrins play several important roles.
Primarily as a means of transmembrane signaling between the external environment
(for example the ECM) helping to identify if the external environment around the
lamellipodia is suitable. Secondarily, due to their ability to bind to the external
environment, clump and form focal adhesions linked to the cytoskeleton, they can form
the anchor points or base needed by the cell for the cytoskeleton to exert force against,
to provide the motive force for the cell (Giancotti et al, 1999; Blystone, 2004). In hyphal
organisms it is assumed that the Integrin like proteins which are associated with the
plasma membrane (Chitcholtan & Garrill, 2005) act to link the cytoskeleton to the
plasma membrane and the cell wall. The cell wall effectively replaces the external
environment or ECM that integrins bind to in animal cells. This would allow the
cytoskeleton to be anchored to a structurally sound external structure against which
force could be generated, without risk of rupturing the cell. The cell wall is a suitable
36

structure due to its strength. The force generated could be used for a number of
different purposes, ranging from moving the cytoplasm along behind the growing tip or
supplying the protrusive force to keep the tip expanding at low levels of turgor pressure.
What the exact role of integrin like proteins is in hyphal organisms has yet to be
determined, although there is evidence that it is related to tip growth [ref:Kenny]. The
existence of integrin like proteins is also supportive of the tube dwelling Amebae
hypothesis for tip growth reviewed by Heath and Steinberg (1999).
Thus understanding integrins may be of considerable importance in understanding the
growth of hyphal organism, should integrin like proteins prove to be common and
widespread among hyphal organisms. Also greater understanding of the structure and
sequence of hyphal integrin like proteins will be of great use in determining their role
and importance in tip growth.
37
Methods:
MethodsMethods:...........................................................................................................................38
Materials......................................................................................................................39
Microscope and capture software............................................................................39
Stock Cultures:.........................................................................................................39
Phytophthora cinnamomi ....................................................................................39
Achlya bisexualis.................................................................................................39
Experimental Culture preparation:...........................................................................40
Non-Invasive Cultures..........................................................................................40
Invasive Culture: .................................................................................................40
Imaging Methods..........................................................................................................41
Criteria for Imaging of Hyphae.................................................................................41
Image Processing.....................................................................................................41
Growth Rate Measurements Image Pro Plus............................................................42
Actin Experiments........................................................................................................42
Actin Staining...........................................................................................................42
Actin Staining: Latrunculin B....................................................................................43
Growth Rate Experiments............................................................................................43
Growth Rate measurements....................................................................................43
Growth Rate: Microscope method............................................................................43
Integrin-like Proteins....................................................................................................45
Integrin-like protein staining....................................................................................45
Western blot: Integrin like proteins..........................................................................46
38
Materials
Microscope and capture software
A Olympus IX70 Microscope, Olympus Mercury Burner, Coolsnap camera and software
were used for both DIC (Differential Interference Contrast) and Epi-Fluorescent image
capture and microscope work.
Stock Cultures:
Phytophthora cinnamomi
Stock cultures of Phytophthora cinnamomi (University of Canterbury stock culture c216)
were maintained at 25°C in the dark on peptose-yeast-glucose (PYG) agar (3 g/l glucose,
(Merck), 1.25 g/l bactopeptone (Gibco BRL, UK), 1.25 g/l yeast extract (Gibco BRL, UK),
and 20g/l bacteriological agar (Oxoid, UK) made up in nano-pure water). For sub cultures
an agar plug with hyphae growing on it, was taken from the growing edge of the culture.
Achlya bisexualis
Stock cultures of Achlya bisexualis Coker (a University of Canterbury stock culture,
isolated from Xenopus laevis dung) were maintained at 20°C in the dark on peptose-
yeast-glucose (PYG) agar (3 g/l glucose, (Merck), 1.25 g/l bactopeptone (Gibco BRL, UK),
1.25 g/l yeast extract (Gibco BRL, UK), and 20g/l bacteriological agar (Oxoid, UK) made
up in nano-pure water). For sub cultures an agar plug with hyphae growing on it was
taken from the growing edge of the culture.
39
Experimental Culture preparation:
Two cultures of Phytophthora cinnamomi were prepared for experimental work, one of
these was for investigations of invasive growth and the other was for investigations of
non-invasive growth. The Phytophthora cinnamomi cultures were grown at 25°C in the
dark. Two cultures of Achlya bisexualis Coker (a University of Canterbury stock culture,
isolated from Xenopus laevis dung) were also used for experimental work, again one
was an invasive culture and the other a non-invasive culture. Achlya bisexualis cultures
were grown at 20°C in the dark. Cultures used for experimental work were between 4-7
days old after which they covered 40-80% of the plate, and thus were assumed to still
be healthily growing hyphae. Both organism's cultures were prepared in the same
manner as detailed below.
Non-Invasive Cultures
The non-invasive plates were prepared by placing a circle of colourless cellophane (John
Sands brand) on a PYG agar plate. Prior to use the cellophane was prepared by boiling 3
times for 10 minutes in nanopure water and autoclaved, to remove any manufacturing
residues. Previous work from this lab has indicated this is a necessary prerequisite that
ensures hyphal growth. The hyphal plug of the organism was then placed in the center
of the cellophane circle.
Invasive Culture:
The invasive plates were prepared by placing a circle of sterile boiled cellophane on PYG
agar. A hyphal plug was then placed in the center of the cellophane face down and the
plate was evenly covered with 6ml of molten 4% Low Melting Point agarose (LMP
agarose in dH20). This had the effect of providing a layer of agarose above the
40

cellophane and the culture through which hyphae would grow (invasively i.e. through
the media).
Imaging Methods
Criteria for Imaging of Hyphae
For experiments involving microscope work a simple criteria was decided one for
determining what hyphae would be imaged. Hyphae that met the criteria would be
imaged those that didn't were observed but neither epi-fluorescent nor DIC images were
taken.
Hyphae to be imaged were required to meet these requirements:
Good staining through out the hyphae
Low to moderate background fluorescence in the field of view.
No overlap with other hyphae near on the focal plane
Cytoplasm in good condition with out significant distortions
No significant distortion to the hyphae structure
Hyphae wall intact, with no signs of bursting in the on branches or at tips
Decent focus for the hyphae tip
Image Processing
All image processing was done in Adobe Photoshop, The GIMP (The GNU Image
Manipulation Program) and Image Pro Plus 4. Processing consisted of rotation and
41
alignment of images, level adjustments, cropping, and conversion to greyscale.
Growth Rate Measurements Image Pro Plus
The sequential images produced with the coolsnap camera were aligned manually in
The GIMP and cropped to produce a layered Photoshop file, showing the growth of the
hyphae. The layers were then split into individual files and imported into Image Pro Plus.
A 30μm scale line from an objective micrometer (0.01mm Olympus) was used to
calibrate Image Pro Plus. Then each hypha was measured and the results exported to
excel for analysis.
Actin Experiments
Actin Staining
For staining hyphae were prepared by cutting 1cm squares from the growing edge of the
organism and these were placed in welled slides and 700μl of PYG broth (3 g/l glucose,
(Merck), 1.25 g/l bactopeptone (Gibco BRL, UK), 1.25 g/l yeast extract (Gibco BRL, UK)
made up in nano-pure water) was added. The samples were then allowed to recover for
2 hours at room temperature in the dark. After this time the PYG broth was replaced
with 700μl fixing solution (4% formaldehyde (Sigma) with 0.5% methylglyoxal (Sigma) in
pipes buffer) and the hyphae were left to fix for 40 minutes in the dark. The samples
were then rinsed 2 times for 5`minutes in buffer and then stained by incubating in the
dark, at room temperature, for 30mins with 400μl of dilute Phalloidin tagged with the
fluorescent dye Alexa 488. A control was incubated in the same conditions for 30mins
with Pipes buffer (50mM pipes pH 6.8). The samples were washed twice for 15 minutes
with 10ml of Pipes buffer. Then were prepared with the addition of anti-fading solution
42
(0.1% w/v of p-phenylenediamine dihydrochloride) prior to observation under the
Microscope.
Actin Staining: Latrunculin B
For samples treated with LatB (Latrunculin B, Sigma) the Actin staining method
described above was used with an additional step. After the recovery step the broth was
replaced with 700μl of PYG broth containing LatB at the specified concentration and
incubated in the dark at room temperature for 30 minutes. For the control the broth was
replaced with fresh PYG broth.
Growth Rate Experiments
Growth Rate measurements
Plates were prepared according to the technique listed in “Culture preparation”. For LatB
plates the invasive method was used with the specified amount of LatB being mixed to
the molten LMP agrose, before it was poured onto the plate. Measurements were made
by marking the center and the edge of the inoculums. From this 6 evenly spaced lines
were then drawn on the bottom of the plate to it's edge. The distance the hyphae had
moved along each line was noted, and the six values were then averaged to give an
average growth rate.
Growth Rate: Microscope method
For growth rate experiments 1 cm square samples were cut at the edge of the mycelial
margin from both invasive and non-invasive plates. The samples were placed in welled
43

slides and 700μl of PYG broth was added to the sample. They were then allowed to
recover at room temperature in the dark for 2 hours. The samples were then observed
under the microscope. On the microscope a 0.6 x 0.6mm square of agar was placed
onto the sample to anchor the sample. Healthy hyphae, identified by regular or smooth
cytoplasm [reference] and the distinct presence and movement of cellular organelles,
were identified and observed for 5 minutes to determine if they were currently growing.
An initial image was taken, via the attached coolsnap camera, and a second after a
further 5 minutes. If a comparison of the images showed that the hyphae was growing
and was stable in the field of view having not significantly “drifted” then the hyphae was
selected for continued observation. If the hyphae did not meet the afore mentioned
requirements another was selected and the process repeated, after 3 attempts the
sample would be abandoned and the process begun on another. If the hyphae had met
all requirements then a time zero image was taken followed by additional images every
2 minutes. At T8-T10 (eight to ten minutes after the initial image) if the hyphae was still
growing then it would be used for the second stage of the experiment. The PYG broth
was removed and replaced with fresh PYG broth containing a specified amount of
Latrunculin B and the next image was taken this image was referred to as L0. The
hyphae was then observed for a minimum of a further 30 minutes with images taken
every 2 minutes. Once hyphal extension ceased, the interval for images was increased
to every 5 minutes.
44
Integrin-like Proteins
Integrin-like protein staining.
For experiments involving staining of integrin-like proteins, a 1 cm square sample was
cut from the growing edge of the culture, this was done for both invasive and non-
invasive cultures.
The samples were placed in welled slides and attached to the side of the well via the
application of molten LMP agarose (0.02g LMP agarose in 1ml dH20). Once the samples
were attached to the side of the well 700μl of PYG broth (3 g/l glucose, (Merck), 1.25 g/l
bactopeptone (Gibco BRL, UK), 1.25 g/l yeast extract (Gibco BRL, UK) made up in nano-
pure water) were added to the well, and the sample was allowed to recover for 2 hours
at room temperature (23°C) in the dark. After the recovery period the broth was
replaced with 700μl of fixing solution (4% formaldehyde with 0.5% methylglyoxal in
saline buffer containing 60mM Pipes pH 6.8, EGTA 2mM, MgCl2 2mM, KCl 0.27mM and
NaCl 137mM) and allowed to incubate for 40 minutes in the dark. The sample was then
washed 5 times for 5 minutes with 700μl of washing solution (saline buffer with 0.1% v/v
Tween 20 added) on an orbital shaker and incubated for 15 minutes with 400μl Driselase
digestion solution (saline solution with 10mg/ml Driselase (Sigma)) at room
temperature. After digestion the samples were then washed twice for 5 minutes and
incubated for 20 minutes with 400μl permeabilising solution (saline solution with 0.1%
v/v Triton X-100) at room temperature. The samples were washed twice more for 5
minutes and blocked for 30 minutes with blocking solution (saline solution with 2.5% w/v
skim milk powder), then washed 4 times for 5 minutes and incubated overnight with
400μl of diluted (1:100-1:1000) primary antibody, mouse anti-Integrin β4 [Manufacturer
name/details] at 4°C (fridge). The control was incubated overnight with 400μl of the
antibody dilution solution. The samples were then washed 3x for 5 minutes and
45
incubated with 400μl of dilute (1:500-1:1000) secondary antibody (Molecular Probes
Goat Anti-mouse, tagged with Alexea 488) for 2 hours in the dark at room temperature.
After this they were washed 7 times for 5 minutes with 700μl washing solution followed
by 3 times with 15ml of washing solution, both washes were carried out in the dark. The
samples were then moved to clean welled slides and anti-fading solution (0.1% w/v of p-
phenylenediamine dihydrochloride) was added to the samples to protect against photo-
bleaching.
The same method was used for both Achlya bisexualis and Phytophthora cinnamomi
samples.
Western blot: Integrin like proteins
Thirty plates of Phytophthora cinnamomi were grown on PYG covered with cellophane
and frozen with liquid nitrogen, then ground to a powder in extraction buffer (50mM
Tris-HCl pH 6.2, 10mM NaF, 2mM PMSF, 10mM β-mercapethanol, 7mM EDTA, 20% v/v
glycerol, 250mM sucrose). The slurry was resuspended in additional extraction buffer
and centrifuged at 10,000g for 30 minutes at 4°C; the supernatant was further
centrifuged at 100,000g for 2 hours at 4°C. The resulting pellet was resuspended in
additional buffer, and samples of the resulting suspension, along with the previous
soluble crude fractions, were precipitated on ice via the addition of trichloroacetic acid
(TCA).
The resulting precipitates were mixed with 5x Laemmli buffer and heated in a boiling
water bath for 5 minutes. The proteins were then separated via SDS PAGE on a 5%
stacking gel and 12% polyacrylamide separating gel. The proteins were transferred
overnight to a nitrocellulose membrane in buffer (15.6mM Tri-Base and 120mM glycine)
46
at 40V at 4°C. The membrane was examined for protein transfer via staining with 0.1%
w/v Ponceau Red for 20 minutes. With evidence of protein transfer the membrane was
rinsed with the kit washing solution [kit details] then washed 2 times for 15 minutes
with washing solution and once with nanopure water for 10 minutes. The membrane
was blocked for 60 minutes at room temperature with the [kit] blocking solution,
washed 3 times for 10 minutes with washing solution, once with nanopure water and
incubated overnight with the diluted primary antibody mouse monoclonal IgG1 anti-
Integrin β4 at 4°C. The membrane was visualized by Western Breeze™ (Western
Immunodetection System, Invitrogen).
47
Results
Results
Results..............................................................................................................................48
Actin Staining...............................................................................................................50
DIC images of growing Phytophthora cinnamomi hyphae.......................................50
Actin Stained Controls: Invasive Conditions.............................................................52
Actin Stained Controls: Non-invasive Conditions.....................................................54
Actin Stained Controls: 0.1% DMSO Control in Invasive Conditions........................56
Actin Stained Controls: 1% DMSO Controls in Invasive Conditions..........................58
Actin Staining: Latrunculin B 0.5ug/ml.....................................................................60
Actin Staining: Latrunculin B at 1ug/ml...................................................................62
Actin Staining: Latrunculin B at 5ug/ml...................................................................64
Actin Staining: Latrunculin B at 10ug/ml.................................................................66
Growth Rates................................................................................................................68
Plate Growth rates:..................................................................................................68
Growth Rate Results: Invasive Conditions 5μg/ml Latrunculin B.............................70
Non Invasive conditions 5μg....................................................................................72
Invasive conditions 0.5μg........................................................................................74
Non-Invasive Conditions 0.5μg................................................................................76
Growth rates Invasive and Non-Invasive.................................................................78
Growth Rates: Growth..............................................................................................80
Integrin like Protein Experiments.................................................................................82
Anti-Integrin β4 stained Phytophthora cinnamomi..................................................82
48

Controls: Stained Phytophthora cinnamomi............................................................85
Controls: Anti-Integrin β4 Stained Achlya bisexualis...............................................87
Anti-Integrin β4 Western blots.................................................................................89
49
Actin Staining
DIC images of growing Phytophthora cinnamomi hyphae
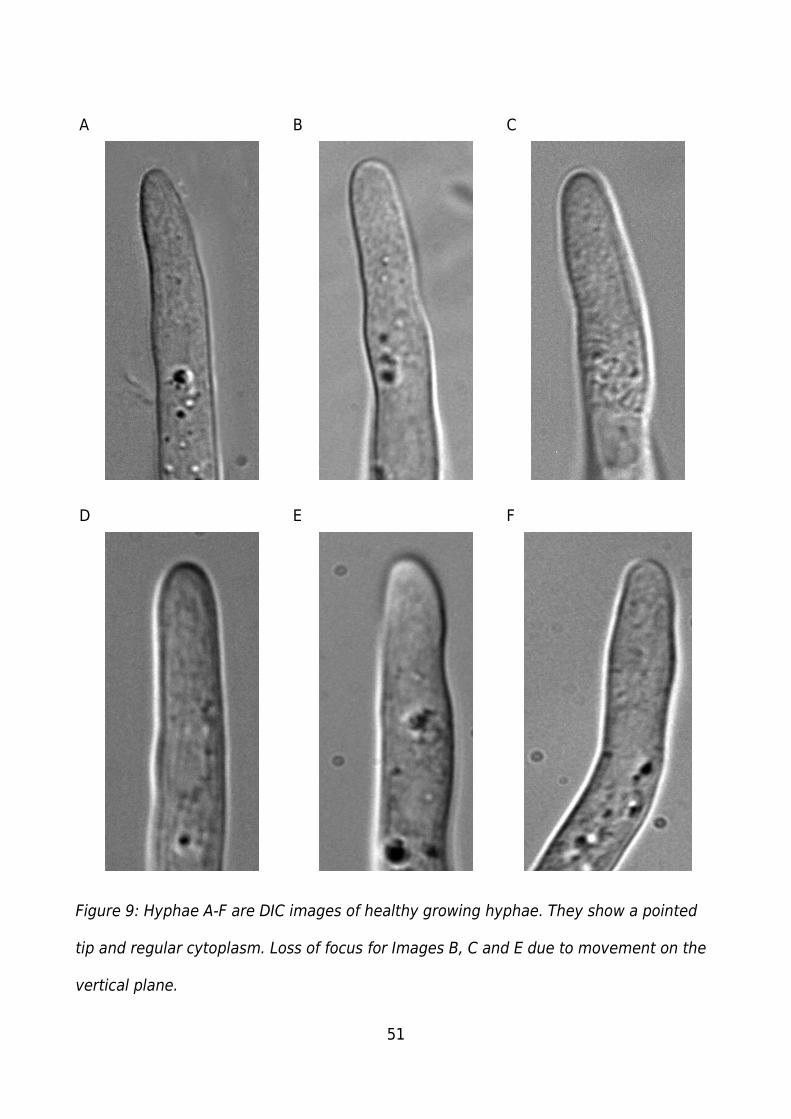
The hyphae (Figure 9) typically showed regular/smooth cytoplasm and the presence of
organelles or vesicles. For growth experiments hyphae were chosen based on
regular/smooth cytoplasm, and the observable movement of organelles/vesicles. These
structures appear as clear raised points (base of A, top B, centre C), or dark dots in the
cytoplasm (A, B, D, E, F). The hyphae have a pointed apex though this is less distinct
than in other organisms such as Achlya bisexualis . The Phytophthora cinnamomi
hyphae also grow in 3 dimensions, moving up and down through the focal pane as well
as side to side when growing. Movement in the vertical axis can be seen in B, C and E
(Figure 9) where at the base of each image the hyphae as started to move out of the
focal plane. F shows a change in direction of growth or movement on the horizontal
axis. Phytophthora cinnamomi hyphae regularly show a tendency to branch. This would
initiate when a swelling formed on the side of the hyphae, branches occur in any
direction. If the branch occurs close to the apex of the hyphae growth at the original
apex would decrease as the new branch started. Branches further back did not
significantly affect the growth rate of the original apex.
Around thirty living hyphae were observed and the images in Figure 9 are representative
sample.
50
A B C
D E F
Figure 9: Hyphae A-F are DIC images of healthy growing hyphae. They show a pointed
tip and regular cytoplasm. Loss of focus for Images B, C and E due to movement on the
vertical plane.
51

Actin Stained Controls: Invasive Conditions
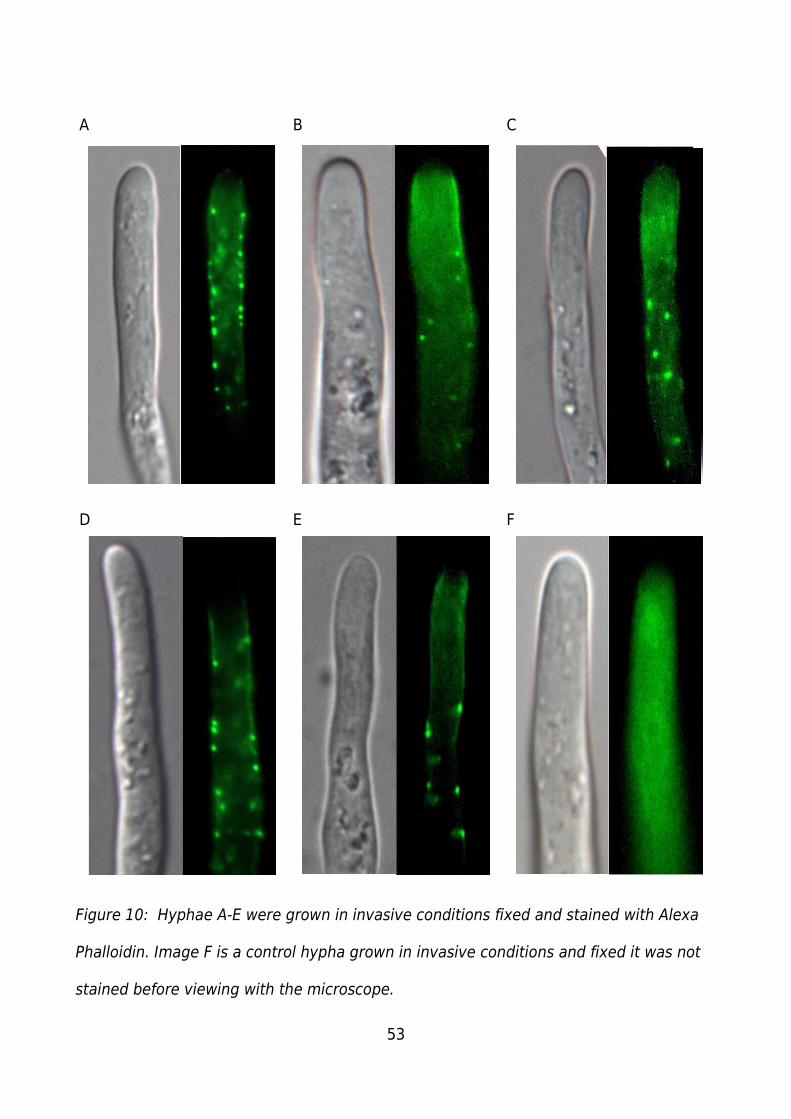
Figure 10 shows hyphae that were grown in invasive conditions and stained with Alexa
Phalloidin, as described in the actin staining method (Page 42).
For samples grown in invasive conditions and stained with Alexa Phalloidin over forty
hyphae were examined. Those shown in Figure 10 are a representative sample of those
observed and meet the criteria to be imaged (Page 41).
Hyphae A-E (Figure 10) show strong punctate staining back from the hyphal apex A, B,
D, and E show a distinct area of low staining at the apex forming an actin depleted zone.
Image C lacks a clear actin depleted zone with punctate staining further back from the
apex than other hyphae. Image F is the invasive control showing a lack of punctate
fluorescence, and fairly constant autofluorescence through out the hypha though a
decrease is present near the apex as would be expected with the decrease in cellular
material to autofluorescence.
The apparent variation in the location of the punctate staining in the stained hyphae is
primarily due to the limited focal plane of the microscope. Hyphae A, D and E share a
similar focal plane with punctate staining occurring at the edges of the hypha, and a
lower level of diffuse staining just below the apex. Hyphae B, and C at a different focal
plane showing more central punctate staining and a strong region of diffuse staining
below the apex.
All hyphae show regular/smooth cytoplasm in the DIC with the presence of
organelles/vesicles which is indicative of healthy hyphae and good chemical fixation.
52
A B C
D E F
Figure 10: Hyphae A-E were grown in invasive conditions fixed and stained with Alexa
Phalloidin. Image F is a control hypha grown in invasive conditions and fixed it was not
stained before viewing with the microscope.
53
Actin Stained Controls: Non-invasive Conditions
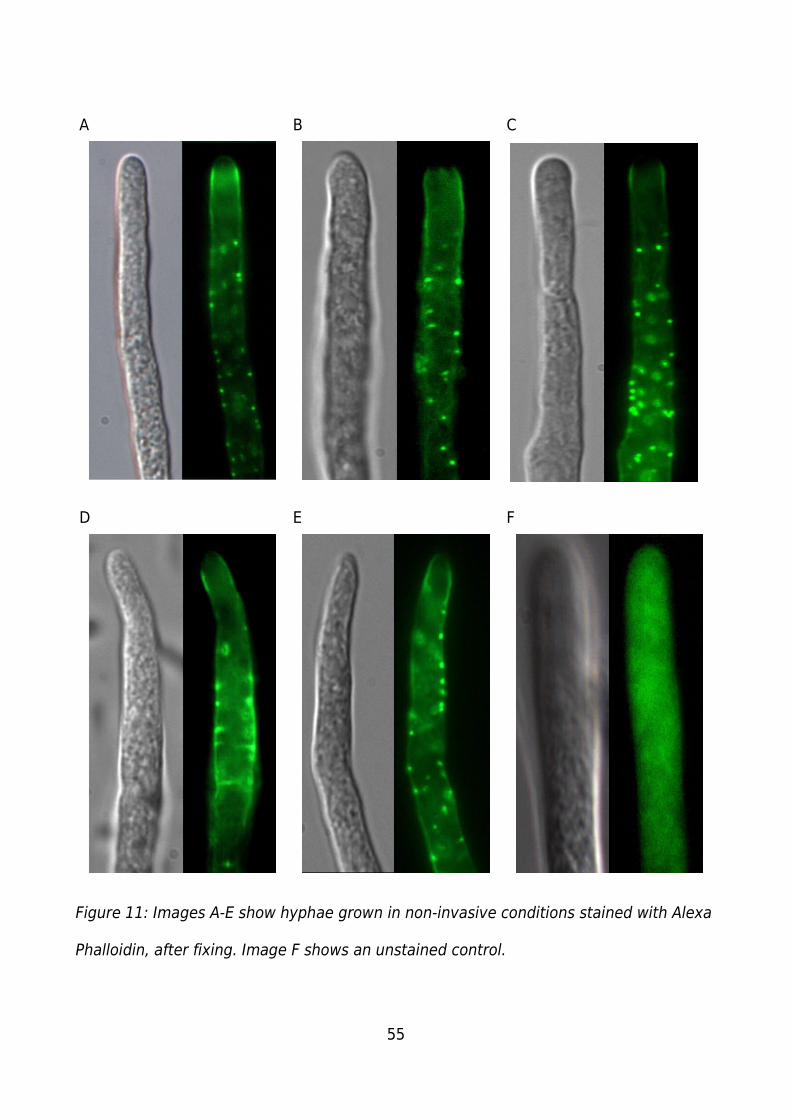
Figure 11 shows hyphae grown in non-invasive conditions and stained with Alexa
Phalloidin, as described in the actin staining methods (Page 42).
For samples grown in non-invasive conditions and stained with Alexa Phalloidin over
forty hyphae were examined. Those shown in Figure 11 are a representative sample of
those observed and meet the criteria to be imaged (Page 41). Hyphae A-E (Figure 11)
show strong punctate staining in the sub-apical region and an area of low staining for an
actin depleted zone at the apex, all hypha also show strong staining in bands along the
walls of the hypha. Hypha A shows a strong region of diffuse staining in the sub-apical
region and punctate staining throughout the rest of the hypha. Hyphae B, C and E show
punctate staining throughout the hypha. Hypha D shows large areas of overlapping
punctate staining along the edge of the hypha with very little central punctate staining.
Hypha F shows the control which is an unstained hypha, grown in non-invasive
conditions. The hypha lacks punctate staining and has a constant level of
autofluorescence through out. It lacks an area of low fluorescence at the apex as is
present at the apex of the stained hyphae.
The DIC images show a decrease in the regularity/smoothness of the cytoplasm and a
lack of distinguishable organelles/vesicles, compared to both the invasive hyphae
(Figure 10), and growing hyphae (Figure 17), indicating less than ideal fixing. The DIC for
Image F is also slightly out of focus due to the low level of signal for the control
compared to the stained hyphae, the controls were focused first under epi-fluorescent
conditions after which the DIC was taken, this combined with the hypha growing through
the plane of focus result in difficulties when attempting to focus for both fluorescent and
DIC conditions.
54
A B C
D E F
Figure 11: Images A-E show hyphae grown in non-invasive conditions stained with Alexa
Phalloidin, after fixing. Image F shows an unstained control.
55
Actin Stained Controls: 0.1% DMSO Control in Invasive Conditions
DMSO controls were grown as described in the “Latrunculin B Actin Staining” methods
(Page 43), however instead of incubation in PYG Broth containing Latrunculin B, they
were incubated for the same amount of time in PYG broth containing DMSO at the
specified concentration.
For hyphae that were exposed to 0.1% DMSO hyphae, shown in A-D (Figure 12), show
strong punctate staining. Hyphae A, C, and D also show and zone of low staining at the
apex indicative of an actin depleted zone. The level of punctate staining is similar to
that of the control. Hypha B shows punctate staining throughout the hypha with no
prominent actin depleted zone. Hypha E is a control grown in invasive conditions and
stained with Alexa Phalloidin.
The DIC images for A and D show a regular/smooth cytoplasm though
organelles/vesicles can not be clearly identified, while hyphae B and C show a more
irregular/rough cytoplasm compared to the control. Hypha B also lacks the more pointed
tip present in the other hyphae and controls (Figures 9, 10 and 11).
For samples treated with 0.1% DMSO and stained with Alexa Phalloidin over a dozen
hyphae were examined. Those shown in Figure 12 are a representative sample of those
observed and meet the criteria to be imaged (Page 41).
56
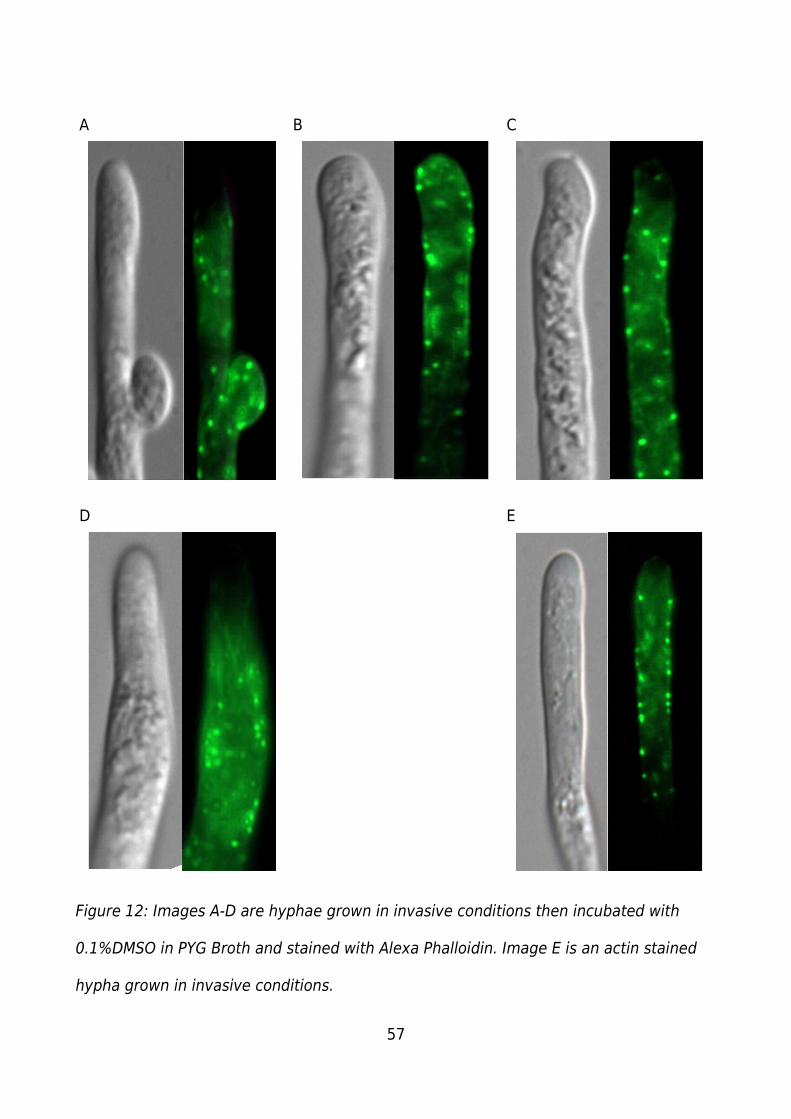
A B C
D E
Figure 12: Images A-D are hyphae grown in invasive conditions then incubated with
0.1%DMSO in PYG Broth and stained with Alexa Phalloidin. Image E is an actin stained
hypha grown in invasive conditions.
57
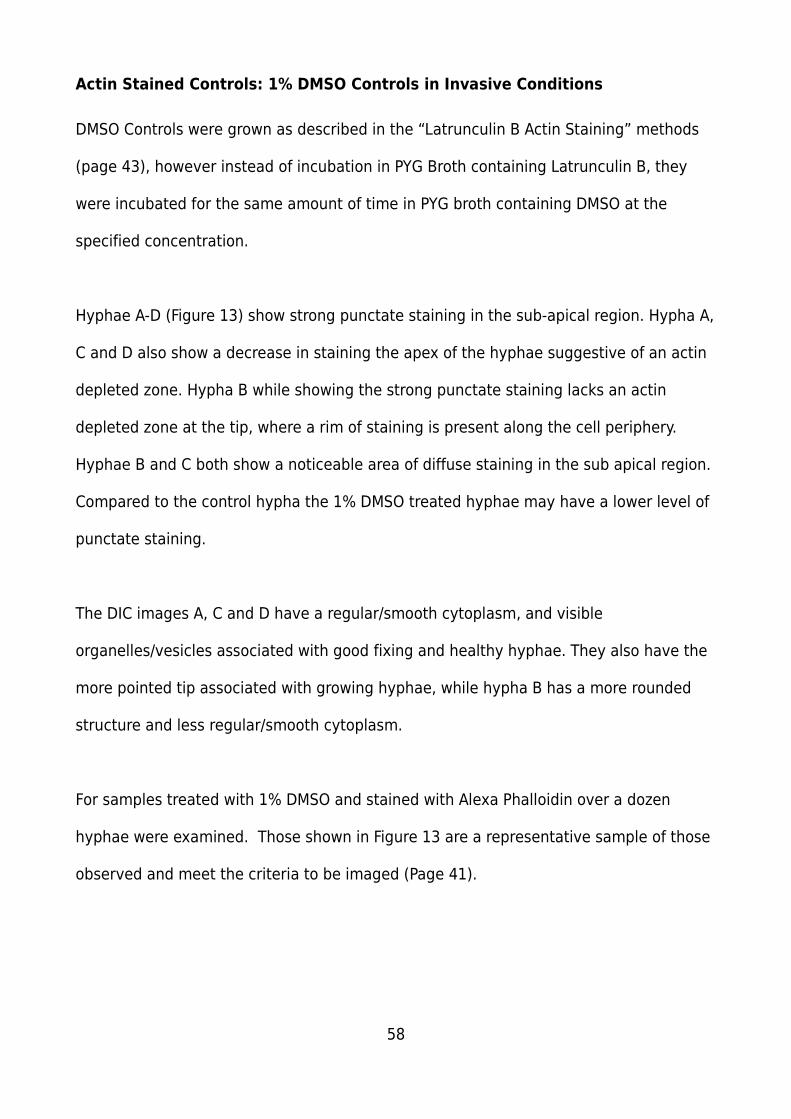
Actin Stained Controls: 1% DMSO Controls in Invasive Conditions
DMSO Controls were grown as described in the “Latrunculin B Actin Staining” methods
(page 43), however instead of incubation in PYG Broth containing Latrunculin B, they
were incubated for the same amount of time in PYG broth containing DMSO at the
specified concentration.
Hyphae A-D (Figure 13) show strong punctate staining in the sub-apical region. Hypha A,
C and D also show a decrease in staining the apex of the hyphae suggestive of an actin
depleted zone. Hypha B while showing the strong punctate staining lacks an actin
depleted zone at the tip, where a rim of staining is present along the cell periphery.
Hyphae B and C both show a noticeable area of diffuse staining in the sub apical region.
Compared to the control hypha the 1% DMSO treated hyphae may have a lower level of
punctate staining.
The DIC images A, C and D have a regular/smooth cytoplasm, and visible
organelles/vesicles associated with good fixing and healthy hyphae. They also have the
more pointed tip associated with growing hyphae, while hypha B has a more rounded
structure and less regular/smooth cytoplasm.
For samples treated with 1% DMSO and stained with Alexa Phalloidin over a dozen
hyphae were examined. Those shown in Figure 13 are a representative sample of those
observed and meet the criteria to be imaged (Page 41).
58
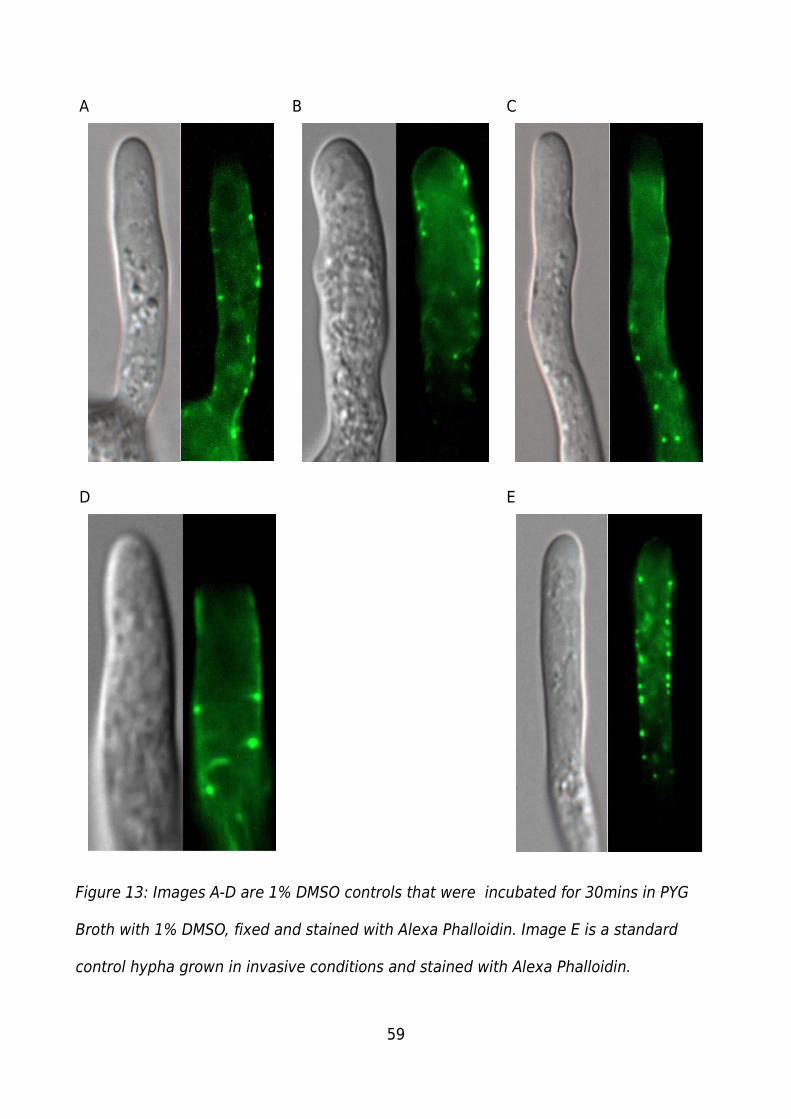
A B C
D E
Figure 13: Images A-D are 1% DMSO controls that were incubated for 30mins in PYG
Broth with 1% DMSO, fixed and stained with Alexa Phalloidin. Image E is a standard
control hypha grown in invasive conditions and stained with Alexa Phalloidin.
59
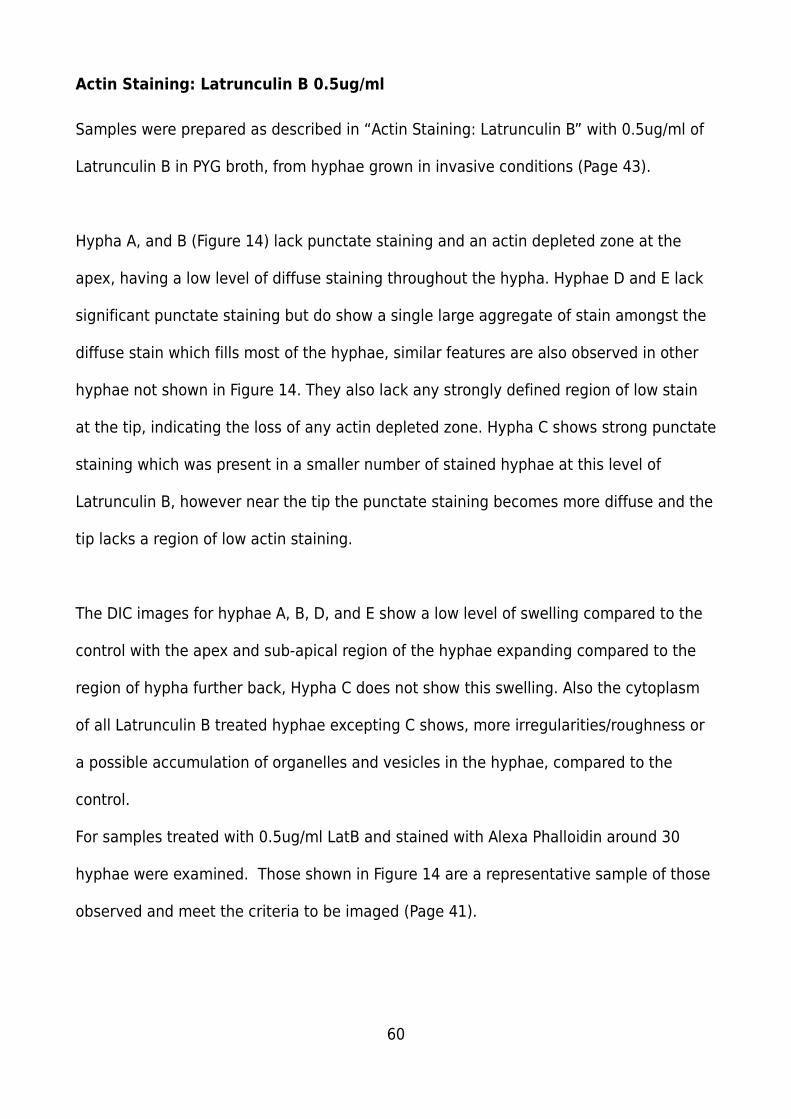
Actin Staining: Latrunculin B 0.5ug/ml
Samples were prepared as described in “Actin Staining: Latrunculin B” with 0.5ug/ml of
Latrunculin B in PYG broth, from hyphae grown in invasive conditions (Page 43).
Hypha A, and B (Figure 14) lack punctate staining and an actin depleted zone at the
apex, having a low level of diffuse staining throughout the hypha. Hyphae D and E lack
significant punctate staining but do show a single large aggregate of stain amongst the
diffuse stain which fills most of the hyphae, similar features are also observed in other
hyphae not shown in Figure 14. They also lack any strongly defined region of low stain
at the tip, indicating the loss of any actin depleted zone. Hypha C shows strong punctate
staining which was present in a smaller number of stained hyphae at this level of
Latrunculin B, however near the tip the punctate staining becomes more diffuse and the
tip lacks a region of low actin staining.
The DIC images for hyphae A, B, D, and E show a low level of swelling compared to the
control with the apex and sub-apical region of the hyphae expanding compared to the
region of hypha further back, Hypha C does not show this swelling. Also the cytoplasm
of all Latrunculin B treated hyphae excepting C shows, more irregularities/roughness or
a possible accumulation of organelles and vesicles in the hyphae, compared to the
control.
For samples treated with 0.5ug/ml LatB and stained with Alexa Phalloidin around 30
hyphae were examined. Those shown in Figure 14 are a representative sample of those
observed and meet the criteria to be imaged (Page 41).
60
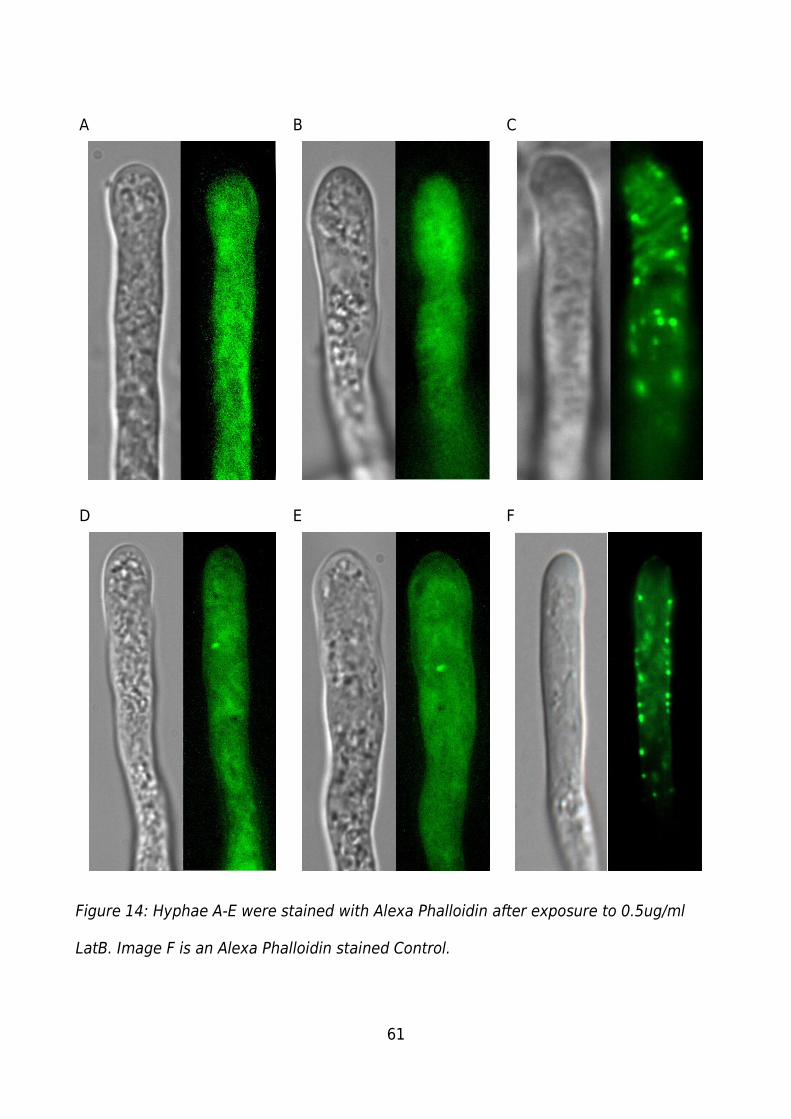
A B C
D E F
Figure 14: Hyphae A-E were stained with Alexa Phalloidin after exposure to 0.5ug/ml
LatB. Image F is an Alexa Phalloidin stained Control.
61
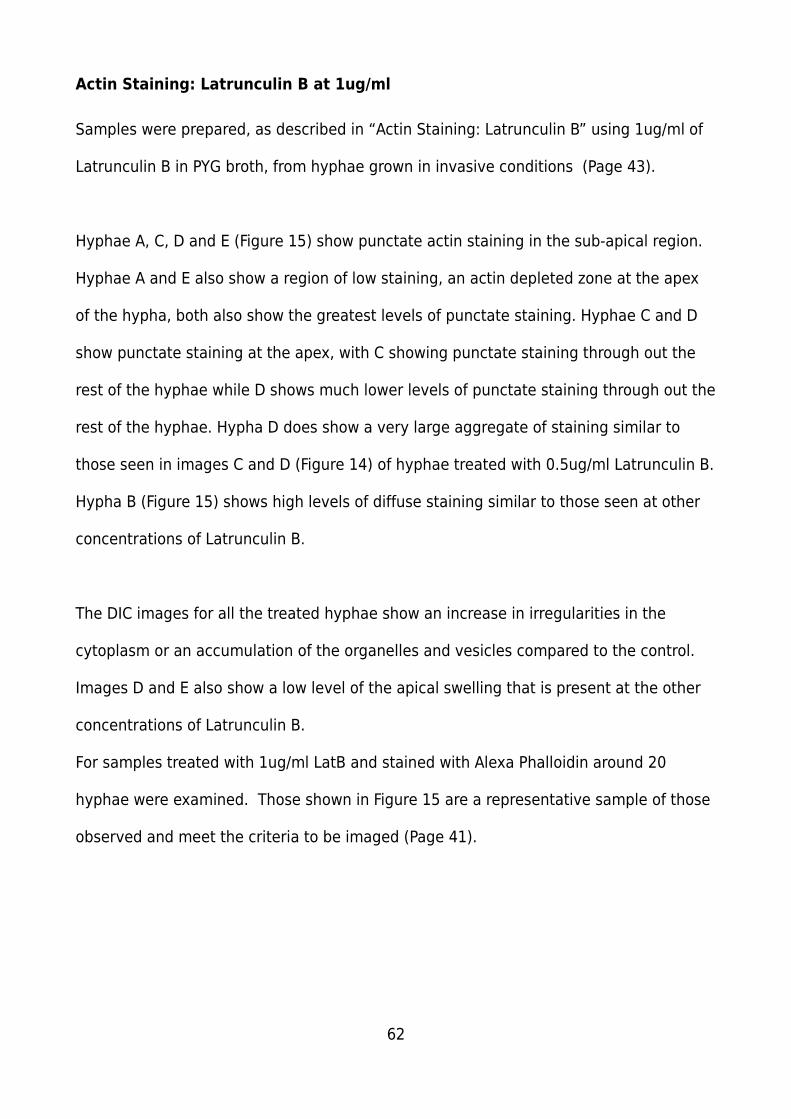
Actin Staining: Latrunculin B at 1ug/ml
Samples were prepared, as described in “Actin Staining: Latrunculin B” using 1ug/ml of
Latrunculin B in PYG broth, from hyphae grown in invasive conditions (Page 43).
Hyphae A, C, D and E (Figure 15) show punctate actin staining in the sub-apical region.
Hyphae A and E also show a region of low staining, an actin depleted zone at the apex
of the hypha, both also show the greatest levels of punctate staining. Hyphae C and D
show punctate staining at the apex, with C showing punctate staining through out the
rest of the hyphae while D shows much lower levels of punctate staining through out the
rest of the hyphae. Hypha D does show a very large aggregate of staining similar to
those seen in images C and D (Figure 14) of hyphae treated with 0.5ug/ml Latrunculin B.
Hypha B (Figure 15) shows high levels of diffuse staining similar to those seen at other
concentrations of Latrunculin B.
The DIC images for all the treated hyphae show an increase in irregularities in the
cytoplasm or an accumulation of the organelles and vesicles compared to the control.
Images D and E also show a low level of the apical swelling that is present at the other
concentrations of Latrunculin B.
For samples treated with 1ug/ml LatB and stained with Alexa Phalloidin around 20
hyphae were examined. Those shown in Figure 15 are a representative sample of those
observed and meet the criteria to be imaged (Page 41).
62
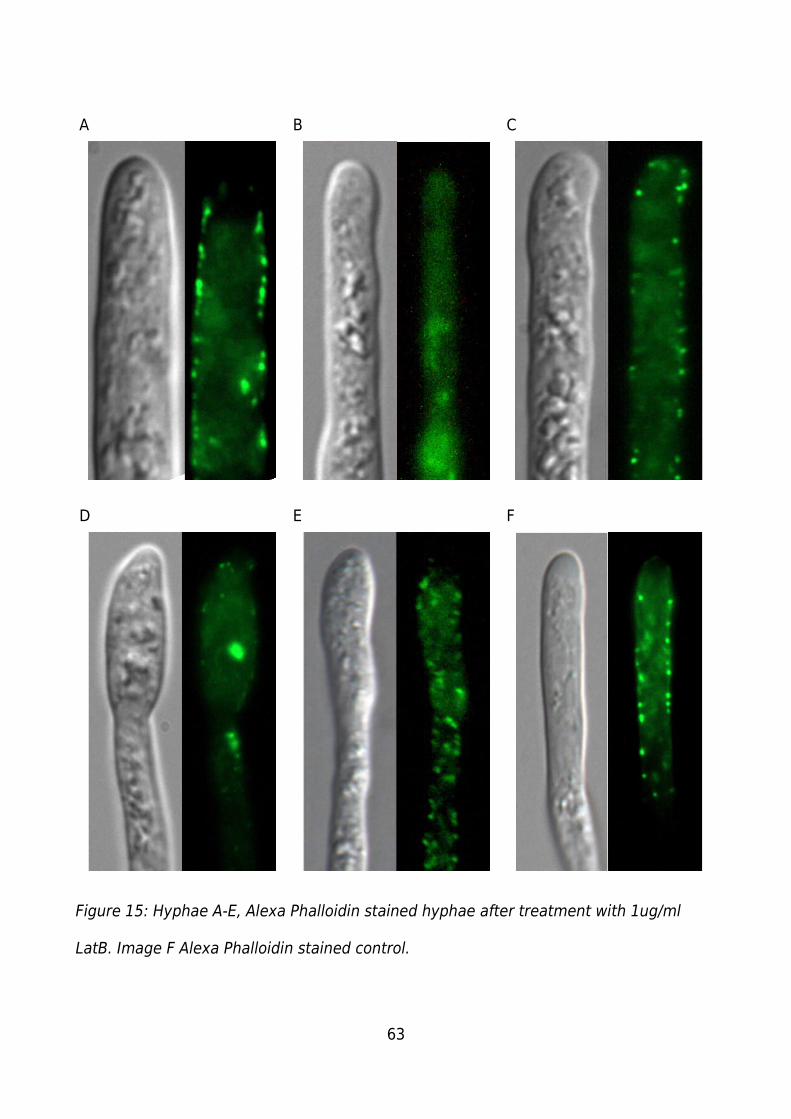
A B C
D E F
Figure 15: Hyphae A-E, Alexa Phalloidin stained hyphae after treatment with 1ug/ml
LatB. Image F Alexa Phalloidin stained control.
63
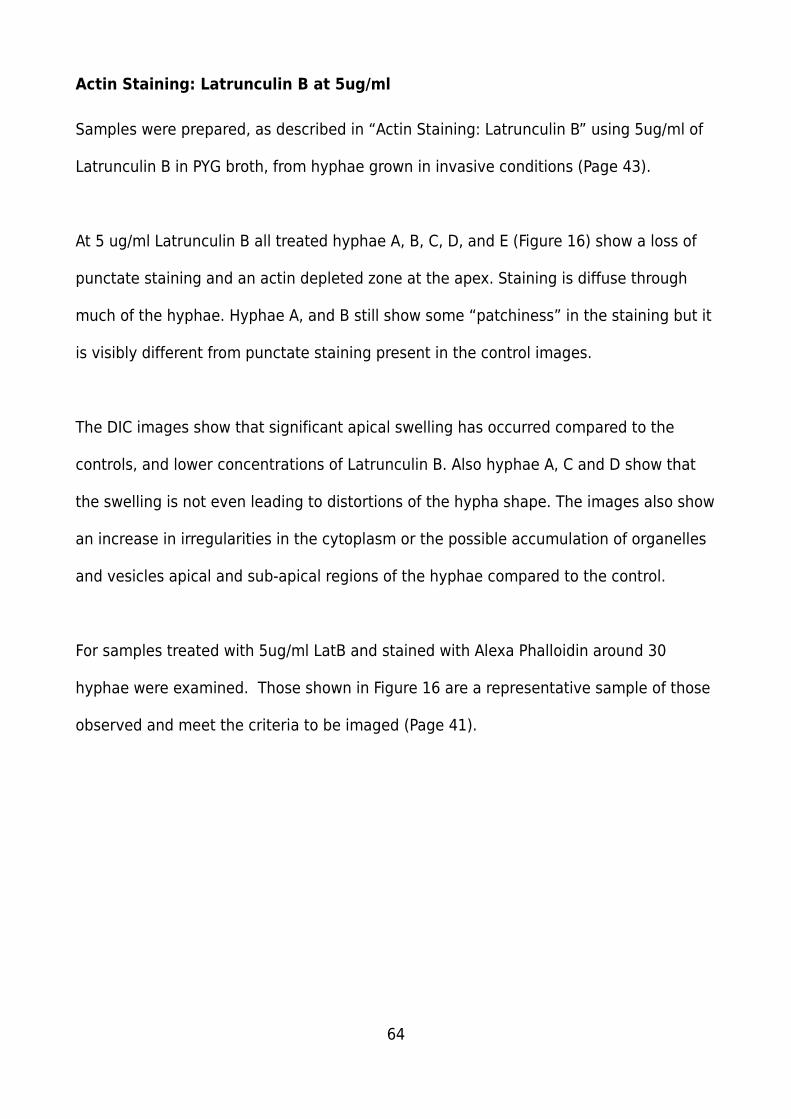
Actin Staining: Latrunculin B at 5ug/ml
Samples were prepared, as described in “Actin Staining: Latrunculin B” using 5ug/ml of
Latrunculin B in PYG broth, from hyphae grown in invasive conditions (Page 43).
At 5 ug/ml Latrunculin B all treated hyphae A, B, C, D, and E (Figure 16) show a loss of
punctate staining and an actin depleted zone at the apex. Staining is diffuse through
much of the hyphae. Hyphae A, and B still show some “patchiness” in the staining but it
is visibly different from punctate staining present in the control images.
The DIC images show that significant apical swelling has occurred compared to the
controls, and lower concentrations of Latrunculin B. Also hyphae A, C and D show that
the swelling is not even leading to distortions of the hypha shape. The images also show
an increase in irregularities in the cytoplasm or the possible accumulation of organelles
and vesicles apical and sub-apical regions of the hyphae compared to the control.
For samples treated with 5ug/ml LatB and stained with Alexa Phalloidin around 30
hyphae were examined. Those shown in Figure 16 are a representative sample of those
observed and meet the criteria to be imaged (Page 41).
64
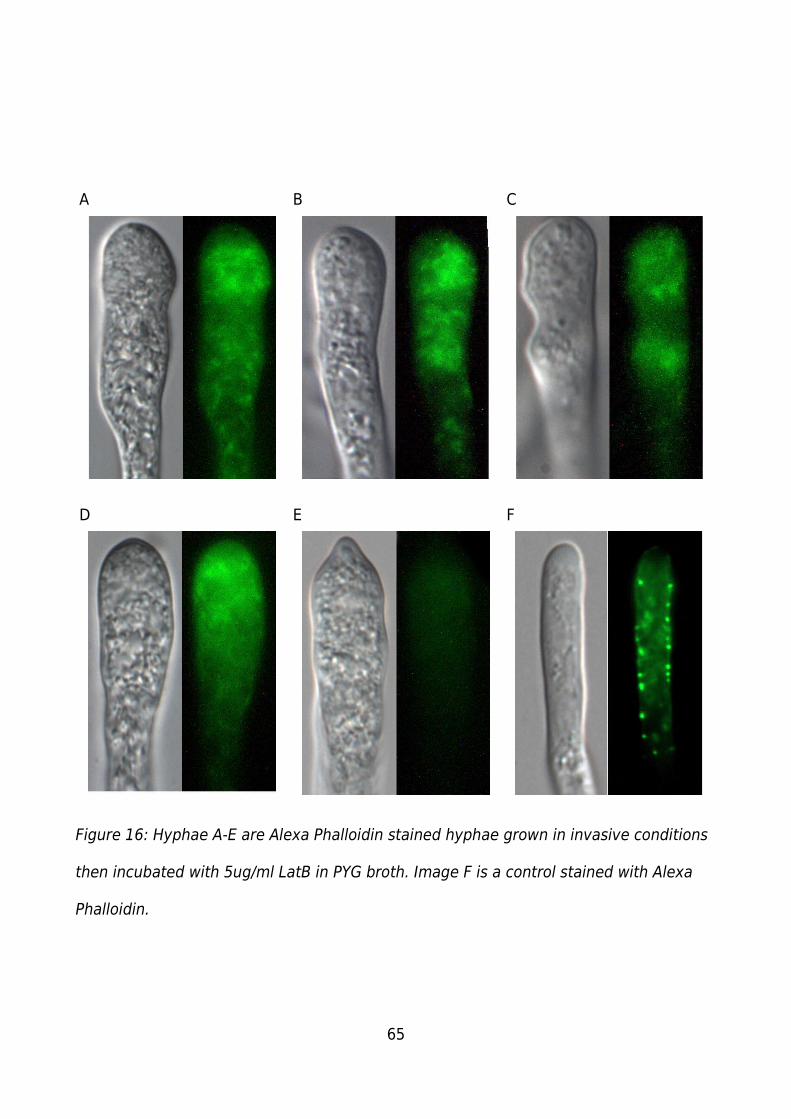
A B C
D E F
Figure 16: Hyphae A-E are Alexa Phalloidin stained hyphae grown in invasive conditions
then incubated with 5ug/ml LatB in PYG broth. Image F is a control stained with Alexa
Phalloidin.
65
Actin Staining: Latrunculin B at 10ug/ml
Samples were prepared, as described in “Actin Staining: Latrunculin B” using 10ug/ml of
Latrunculin B in PYG broth, from hyphae grown in invasive conditions (Page 43).
Samples treated with 10ug/ml Latrunculin B, as shown by hyphae A-E (Figure 9), show a
complete lack of punctate staining in any region of the hypha. Instead a low level of
diffuse staining, staining is present throughout the swollen region compared to the
control image F (Figure 9) and the actin controls in Figures 10 and 11. The diffuse stain
is also less “patchy” than that observed in hyphae treated with 5ug/ml Latrunculin B, as
seen in Figure 16 (images A, B, and C). The hyphae A-E (Figure 9) also lack any
distinctive region of low staining or actin depleted cap near the apex of the hyphae as
can be seen in the control example and in Figures 10 and 11.
Both the DIC images and the epi-fluorescent images of hyphae A-E (Figure 9) show
distinct irregular apical and sub-apical swelling compared to the controls. Hyphae A-D
show irregularities in the cytoplasm or an accumulation of organelles or vesicles in the
apical and sub-apical regions compared to the controls.
For samples treated with 5ug/ml LatB and stained with Alexa Phalloidin around 30
hyphae were examined. Those shown in Figure 9 are a representative sample of those
observed and meet the criteria to be imaged (Page 41).
66
A B C
D E F
Figure 17: Hyphae A-E are hyphae grown in invasive conditions, and exposed to
10ug/ml Latrunculin B before staining with Alexa Phalloidin. Image F is a control grown
invasive conditions, fixed, and then stained with Alexa Phalloidin.
67
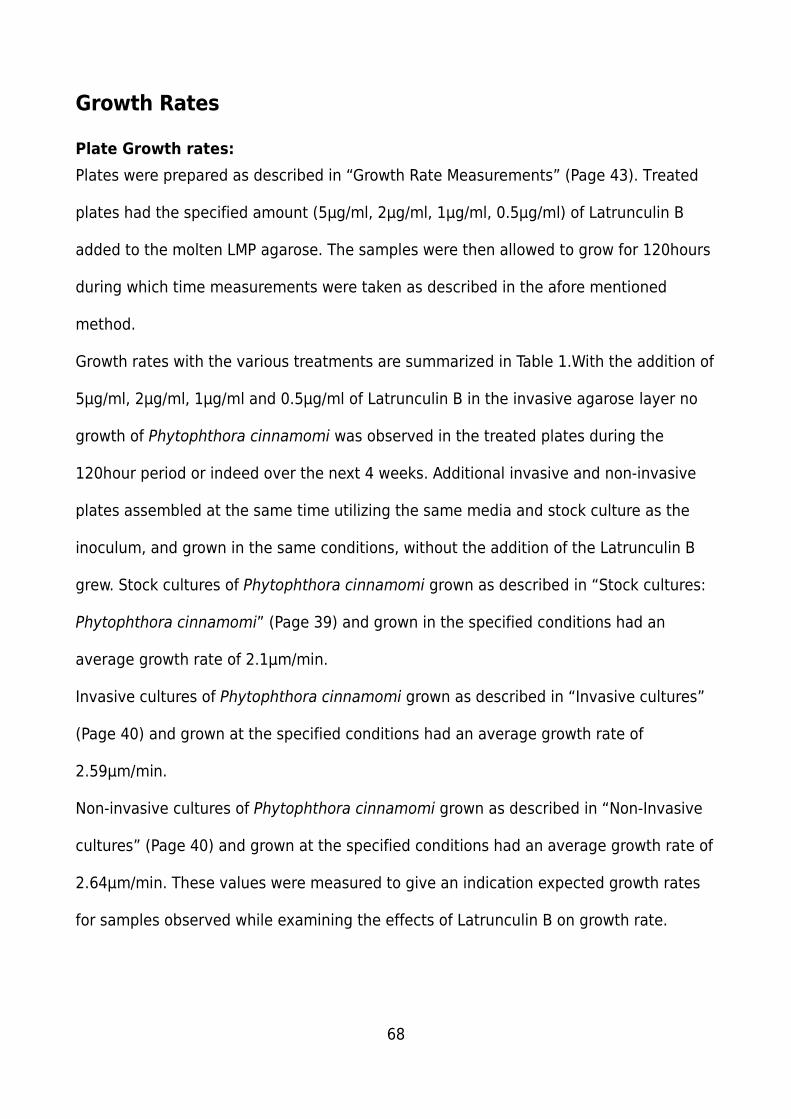
Growth Rates
Plate Growth rates:
Plates were prepared as described in “Growth Rate Measurements” (Page 43). Treated
plates had the specified amount (5μg/ml, 2μg/ml, 1μg/ml, 0.5μg/ml) of Latrunculin B
added to the molten LMP agarose. The samples were then allowed to grow for 120hours
during which time measurements were taken as described in the afore mentioned
method.
Growth rates with the various treatments are summarized in Table 1.With the addition of
5μg/ml, 2μg/ml, 1μg/ml and 0.5μg/ml of Latrunculin B in the invasive agarose layer no
growth of Phytophthora cinnamomi was observed in the treated plates during the
120hour period or indeed over the next 4 weeks. Additional invasive and non-invasive
plates assembled at the same time utilizing the same media and stock culture as the
inoculum, and grown in the same conditions, without the addition of the Latrunculin B
grew. Stock cultures of Phytophthora cinnamomi grown as described in “Stock cultures:
Phytophthora cinnamomi” (Page 39) and grown in the specified conditions had an
average growth rate of 2.1μm/min.
Invasive cultures of Phytophthora cinnamomi grown as described in “Invasive cultures”
(Page 40) and grown at the specified conditions had an average growth rate of
2.59μm/min.
Non-invasive cultures of Phytophthora cinnamomi grown as described in “Non-Invasive
cultures” (Page 40) and grown at the specified conditions had an average growth rate of
2.64μm/min. These values were measured to give an indication expected growth rates
for samples observed while examining the effects of Latrunculin B on growth rate.
68
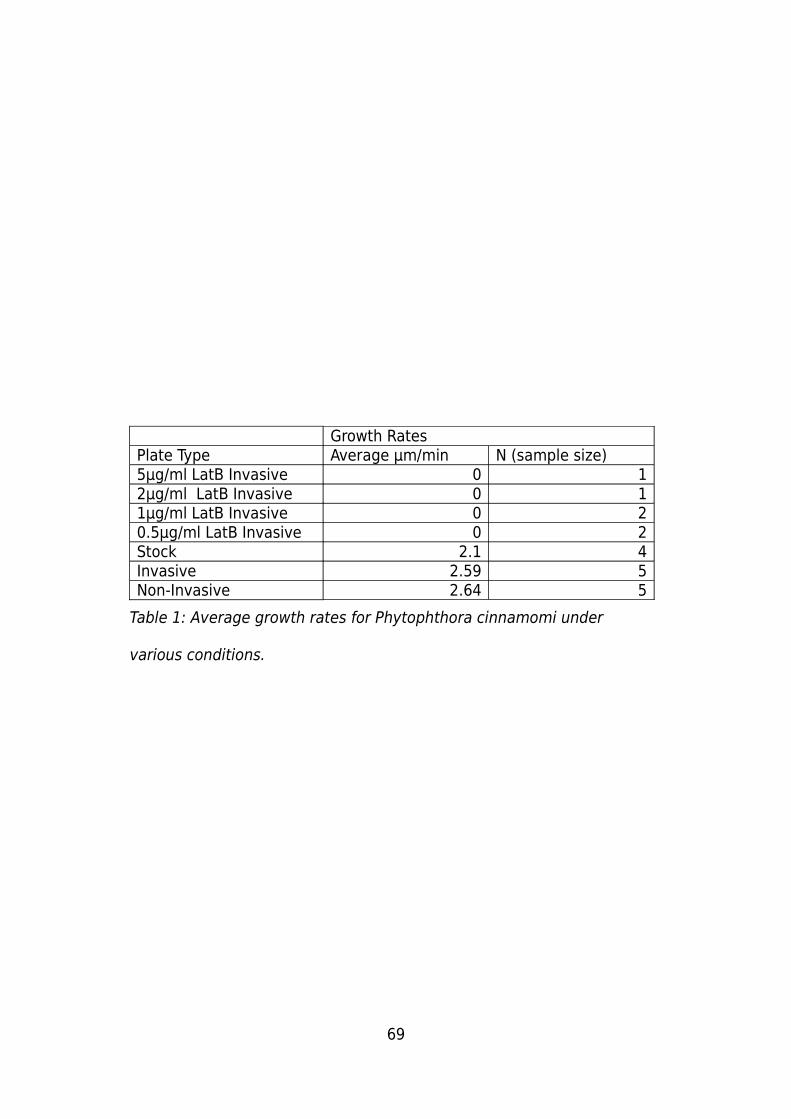
69
Growth RatesPlate Type Average μm/min N (sample size)5μg/ml LatB Invasive 0 12μg/ml LatB Invasive 0 11μg/ml LatB Invasive 0 20.5μg/ml LatB Invasive 0 2Stock 2.1 4Invasive 2.59 5Non-Invasive 2.64 5
Table 1: Average growth rates for Phytophthora cinnamomi under
various conditions.

Growth Rate Results: Invasive Conditions 5μg/ml Latrunculin B
Hypahe were prepared following the method detailed in the “Growth Rates Microscope”
method (Page 43) using the specified level of Latrunculin B (5μg/ml). Once the data was
collected it was processed in “The GIMP” (GNU Image Manipulation program) and
Photoshop then analyzed in Image Pro Plus 4.5 and the data exported to Excel where it
was graphed.
For invasively grown hyphae at 5μg/ml the initial growth rates varied between
2.8μm/min and 0.79μm/min. Growth rates for all hyphae (Figure 18) were variable
before the addition of Latrunculin B. With the addition of Latrunculin B hyphae 1, 2 and
4 showed a similar response with growth ceasing between 4-6minutes after it's addition.
Hyphae 1 continued to show some changes in growth rate after the initial cessation.
Hyphae 3 responded differently with an increase in growth rate after the addition of
Latrunculin B followed by a more gradual decrease in the rate of growth. With growth
ceasing at approximately 30minutes after the introduction of Latrunculin B.
For all hyphae once directional growth ceased it was replaced with swelling of the apical
and sub-apical regions of the hypha.
70
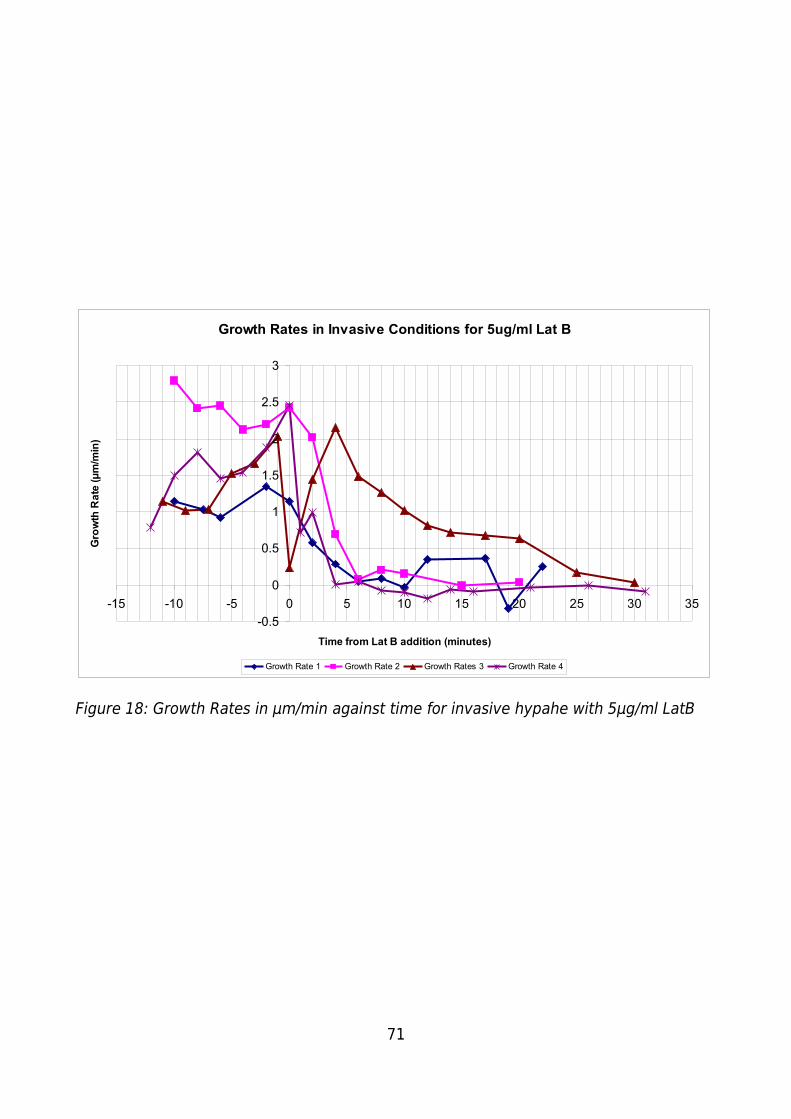
Figure 18: Growth Rates in μm/min against time for invasive hypahe with 5μg/ml LatB
71
Growth Rates in Invasive Conditions for 5ug/ml Lat B
-0.5
0
0.5
1
1.5
2
2.5
3
-15 -10 -5 0 5 10 15 20 25 30 35
Time from Lat B addition (minutes)
Gro
wth
Ra
te (
µm
/min
)
Growth Rate 1 Growth Rate 2 Growth Rates 3 Growth Rate 4
Non Invasive conditions 5μg
Hyphae were prepared following the method detailed in the “Growth Rates Microscope”
method (Page 43) using the specified level of Latrunculin B (5μg/ml). Once the data was
collected it was processed in “The GIMP” (GNU Image Manipulation program) and
Photoshop then analyzed in Image Pro Plus 4.5 and the data exported to Excel where it
was graphed.
For hyphae grown in non-invasive conditions before treatment with 5μg/ml LatB (Figure
19) the initial growth rates were between 1.3μm/min (sample 1) and 2μm/min (sample
4).
Growth rates for all hyphae, up until the addition of Latrunculin B were variable. With
the addition of 5μg/ml Latrunculin B all hyphae responded in a similar manner. Growth
rates immediately began to decline, in a nearly identically manner with directional
growth ceasing for all hyphae between 3 and 4minutes after the addition of the
Latrunculin B. For all hyphae once directional growth ceased it was replaced with
swelling of the apical and sub-apical regions of the hypha.
72
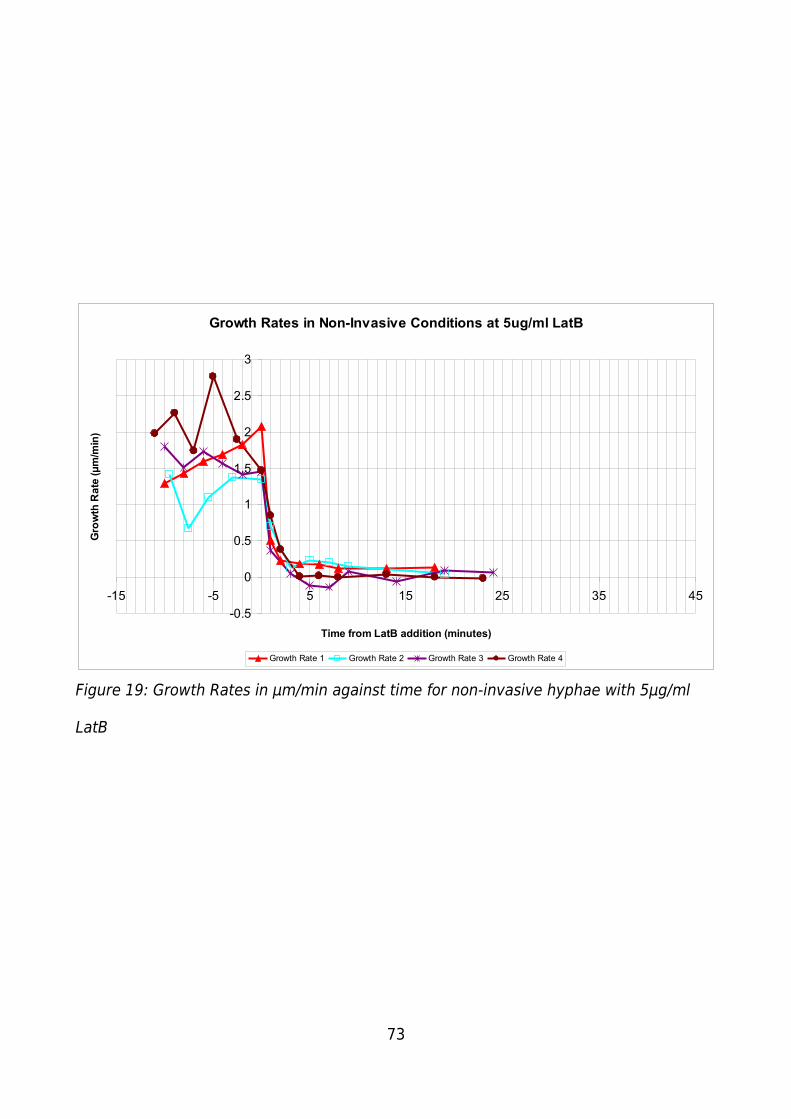
Growth Rates in Non-Invasive Conditions at 5ug/ml LatB
-0.5
0
0.5
1
1.5
2
2.5
3
-15 -5 5 15 25 35 45
Time from LatB addition (minutes)
Gro
wth
Ra
te (µ
m/m
in)
Growth Rate 1 Growth Rate 2 Growth Rate 3 Growth Rate 4
Figure 19: Growth Rates in μm/min against time for non-invasive hyphae with 5μg/ml
LatB
73

Invasive conditions 0.5μg
Hyphae were prepared following the method detailed in the “Growth Rates Microscope”
method (Page 43) using the specified level of Latrunculin B (0.5μg/ml). Once the data
was collected it was processed in “The GIMP” (GNU Image Manipulation program) and
Photoshop then analyzed in Image Pro Plus 4.5 and the data exported to Excel where it
was graphed.
For hyphae grown in invasive conditions (Figure 20) before treatment with 0.5μg/ml
Latrunculin B, the initial growth rates varied between 0.6μm/min and 2.6μm/min.
Growth rates for all hyphae, up until the addition of Latrunculin B were variable. After
the addition of 0.5μg/ml Latrunculin B all hyphae responded in a similar manner with a
gradual decrease in growth rates until cessation of directional growth occurred between
7 and 10minutes after Latrunculin B addition. For hyphae 3 and 4 the decrease in
growth rate was variable with short term increases and decreases in the growth rate.
For all hyphae once directional growth ceased it was replaced with swelling of the apical
and sub-apical regions of the hypha.
74
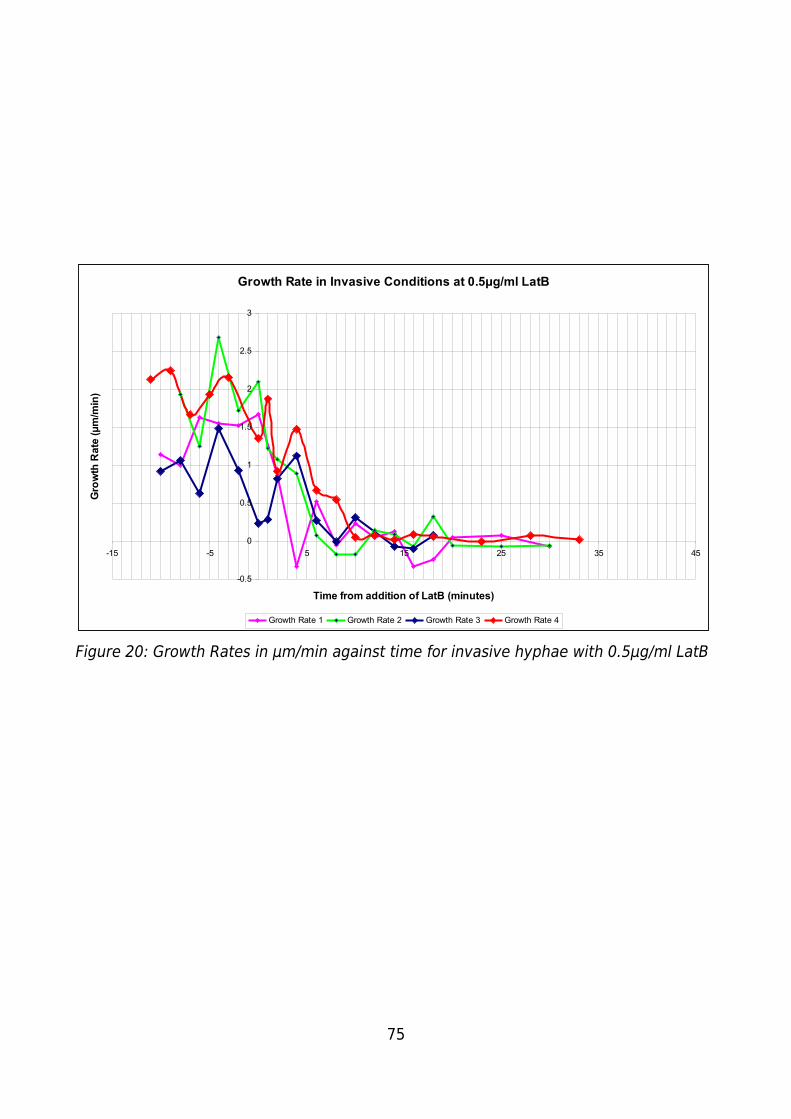
Growth Rate in Invasive Conditions at 0.5µg/ml LatB
-0.5
0
0.5
1
1.5
2
2.5
3
-15 -5 5 15 25 35 45
Time from addition of LatB (minutes)
Gro
wth
Rat
e (µ
m/m
in)
Growth Rate 1 Growth Rate 2 Growth Rate 3 Growth Rate 4
Figure 20: Growth Rates in μm/min against time for invasive hyphae with 0.5μg/ml LatB
75

Non-Invasive Conditions 0.5μg
Samples were prepared following the method detailed in the “Growth Rates Microscope”
method (Page 43) using the specified level of Latrunculin B (0.5μg/ml). Once the data
was collected it was processed in “The GIMP” (GNU Image Manipulation program) and
Photoshop then analyzed in Image Pro Plus 4.5 and the data exported to Excel where it
was graphed.
For hyphae grown in invasive conditions (Figure 21), growth rates before the addition of
Latrunculin B varied between 0.8μm/min and 2.8μm/min. Growth rates for all hyphae,
up until the addition of Latrunculin B were variable. With the addition of 0.5μg/ml
Latrunculin B growth rates followed one of two patterns. Growth rates for hyphae 2 and
3 immediately began to decrease with cessation of growth occurring at approximately
12minutes for hyphae 2 and 3minutes for hyphae 3 after the addition of Latrunculin B.
For hyphae 1 and 4 the growth rate initially increased abruptly reaching approximately
2.7μm/min before rapidly declining, with both hyphae ceasing directional growing
4minutes after the addition of Latrunculin B.
For all hyphae once directional growth ceased it was replaced with swelling of the apical
and sub-apical regions of the hypha.
76
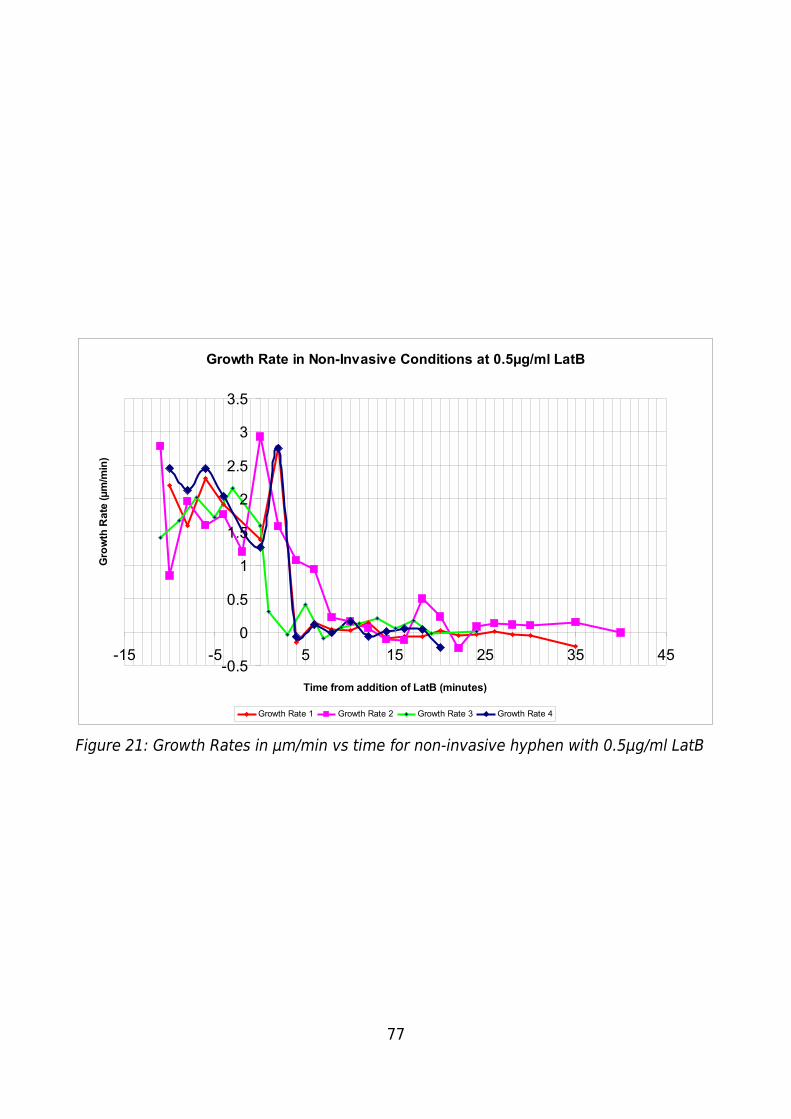
Growth Rate in Non-Invasive Conditions at 0.5µg/ml LatB
-0.5
0
0.5
1
1.5
2
2.5
3
3.5
-15 -5 5 15 25 35 45
Time from addition of LatB (minutes)
Gro
wth
Ra
te (µ
m/m
in)
Growth Rate 1 Growth Rate 2 Growth Rate 3 Growth Rate 4
Figure 21: Growth Rates in μm/min vs time for non-invasive hyphen with 0.5μg/ml LatB
77
Growth rates Invasive and Non-Invasive.
After merging the data sets into two sets Invasive and Non-invasive conditions it can be
seen that the non-invasive conditions (Figure 22) have significantly less variation after
the addition of Latrunculin B with 5 out of the 8 samples showing remarkably similar
profiles. All conditions show considerable variation occurring in growth rates before the
addition of Latrunculin B. Also for 7 out of the 8 samples directional growth ceased
between 3-4minutes after addition of LatB with out regard to the concentration used.
The exception occurring with a hyphae where directional growth ceases approximately
10minutes after the introduction of Latrunculin B.
For the invasive conditions (Figure 23) the profiles are a lot more varied with directional
growth ceasing for 6 out of the 8 samples between 6 and 10minutes after the
introduction of Latrunculin B. The remaining hyphae cease direction growth between
approximately 4 and 30minutes after introduction of Latrunculin B regardless of
concentration of Latrunculin B used.
78
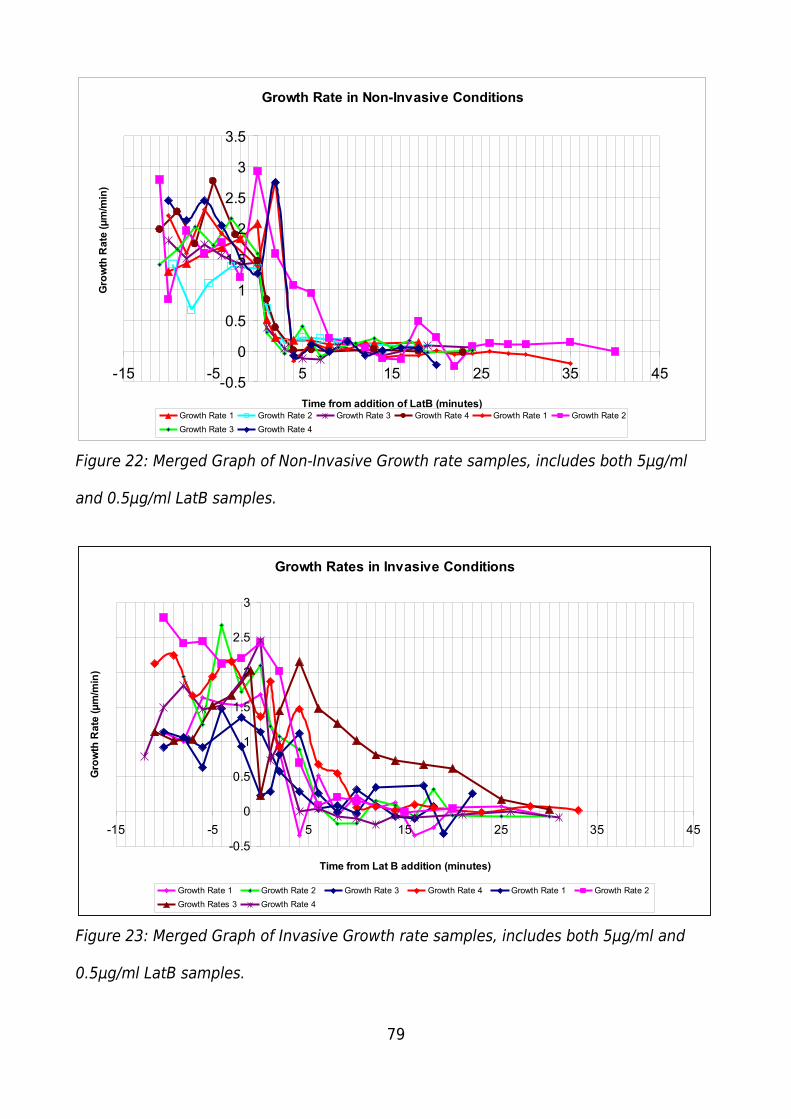
Growth Rate in Non-Invasive Conditions
-0.5
0
0.5
1
1.5
2
2.5
3
3.5
-15 -5 5 15 25 35 45
Time from addition of LatB (minutes)
Gro
wth
Rat
e (µ
m/m
in)
Growth Rate 1 Growth Rate 2 Growth Rate 3 Growth Rate 4 Growth Rate 1 Growth Rate 2
Growth Rate 3 Growth Rate 4
Figure 22: Merged Graph of Non-Invasive Growth rate samples, includes both 5μg/ml
and 0.5μg/ml LatB samples.
Growth Rates in Invasive Conditions
-0.5
0
0.5
1
1.5
2
2.5
3
-15 -5 5 15 25 35 45
Time from Lat B addition (minutes)
Gro
wth
Rat
e (µ
m/m
in)
Growth Rate 1 Growth Rate 2 Growth Rate 3 Growth Rate 4 Growth Rate 1 Growth Rate 2
Growth Rates 3 Growth Rate 4
Figure 23: Merged Graph of Invasive Growth rate samples, includes both 5μg/ml and
0.5μg/ml LatB samples.
79

Growth Rates: Growth
Figures 24and 8 are examples of the affect Latrunculin B has on hyphae in invasive and
non-invasive conditions. For both images the star marks the point at which Latrunculin B
is introduced to the system. After the introduction of Latrunculin B a rapid change in the
shape of the hyphae tip from slightly pointed to rounded, and the cessation of
directional growth can be seen. Followed by the apical and sub-apical swelling that
replaces directional growth, and the resulting change to the apical cytoplasm as
vacuoles, vesicles and organelles accumulate.
80
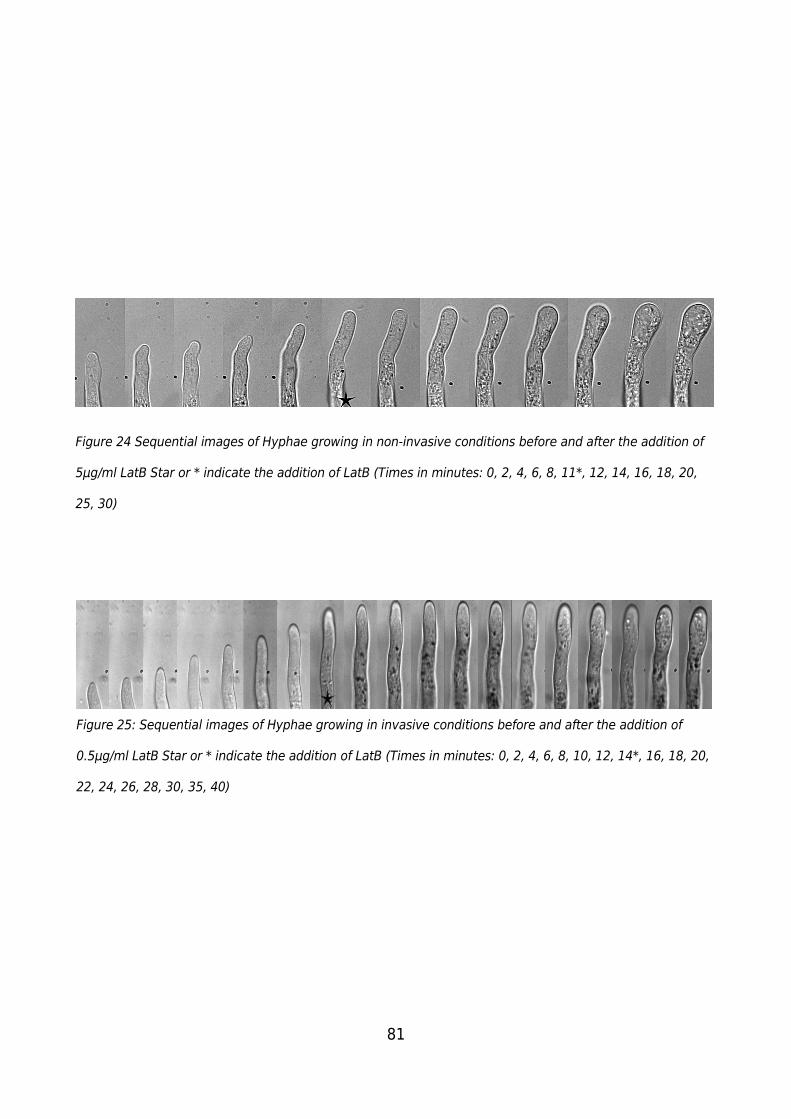
Figure 24 Sequential images of Hyphae growing in non-invasive conditions before and after the addition of
5μg/ml LatB Star or * indicate the addition of LatB (Times in minutes: 0, 2, 4, 6, 8, 11*, 12, 14, 16, 18, 20,
25, 30)
81
Figure 25: Sequential images of Hyphae growing in invasive conditions before and after the addition of
0.5μg/ml LatB Star or * indicate the addition of LatB (Times in minutes: 0, 2, 4, 6, 8, 10, 12, 14*, 16, 18, 20,
22, 24, 26, 28, 30, 35, 40)
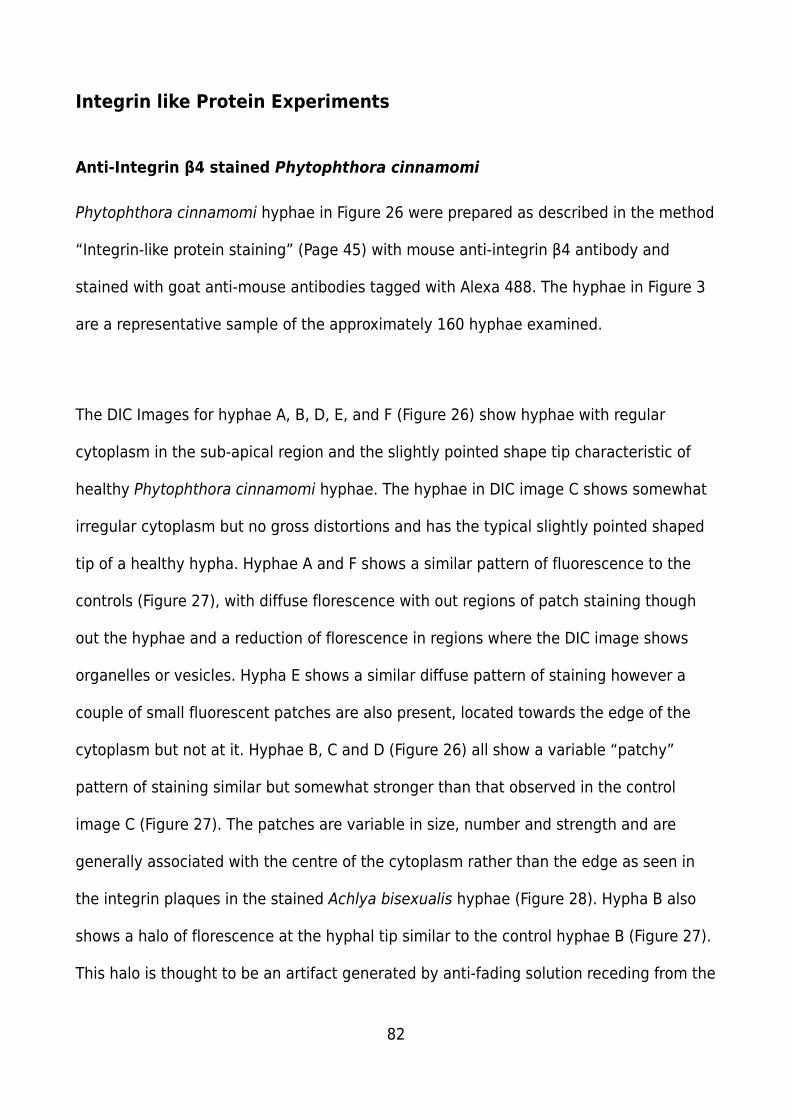
Integrin like Protein Experiments
Anti-Integrin β4 stained Phytophthora cinnamomi
Phytophthora cinnamomi hyphae in Figure 26 were prepared as described in the method
“Integrin-like protein staining” (Page 45) with mouse anti-integrin β4 antibody and
stained with goat anti-mouse antibodies tagged with Alexa 488. The hyphae in Figure 3
are a representative sample of the approximately 160 hyphae examined.
The DIC Images for hyphae A, B, D, E, and F (Figure 26) show hyphae with regular
cytoplasm in the sub-apical region and the slightly pointed shape tip characteristic of
healthy Phytophthora cinnamomi hyphae. The hyphae in DIC image C shows somewhat
irregular cytoplasm but no gross distortions and has the typical slightly pointed shaped
tip of a healthy hypha. Hyphae A and F shows a similar pattern of fluorescence to the
controls (Figure 27), with diffuse florescence with out regions of patch staining though
out the hyphae and a reduction of florescence in regions where the DIC image shows
organelles or vesicles. Hypha E shows a similar diffuse pattern of staining however a
couple of small fluorescent patches are also present, located towards the edge of the
cytoplasm but not at it. Hyphae B, C and D (Figure 26) all show a variable “patchy”
pattern of staining similar but somewhat stronger than that observed in the control
image C (Figure 27). The patches are variable in size, number and strength and are
generally associated with the centre of the cytoplasm rather than the edge as seen in
the integrin plaques in the stained Achlya bisexualis hyphae (Figure 28). Hypha B also
shows a halo of florescence at the hyphal tip similar to the control hyphae B (Figure 27).
This halo is thought to be an artifact generated by anti-fading solution receding from the
82

hyphae and leaving a halo of solution around it which “bends” or focuses the
background florescence at the tip of the hyphae generating the observed halo. In some
hyphae (data not shown) florescence seems to be associated with specific organelles or
potentially a contaminating organism, such florescence can be significantly brighter to
the point where it drowns out the florescence of the hyphae. Addition of kanamycin to
the solutions to prevent contamination simply decreased the quality of staining and had
no effect on the presence of the contaminate.
83
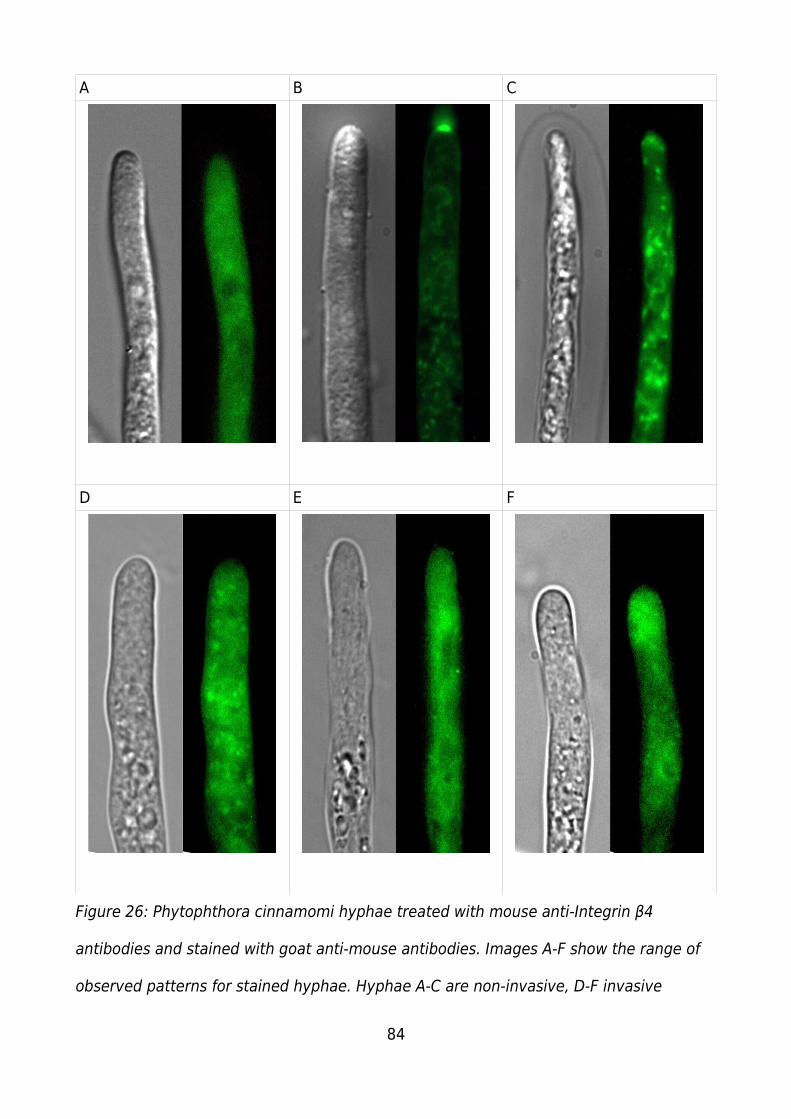
A B C
D E F
Figure 26: Phytophthora cinnamomi hyphae treated with mouse anti-Integrin β4
antibodies and stained with goat anti-mouse antibodies. Images A-F show the range of
observed patterns for stained hyphae. Hyphae A-C are non-invasive, D-F invasive
84
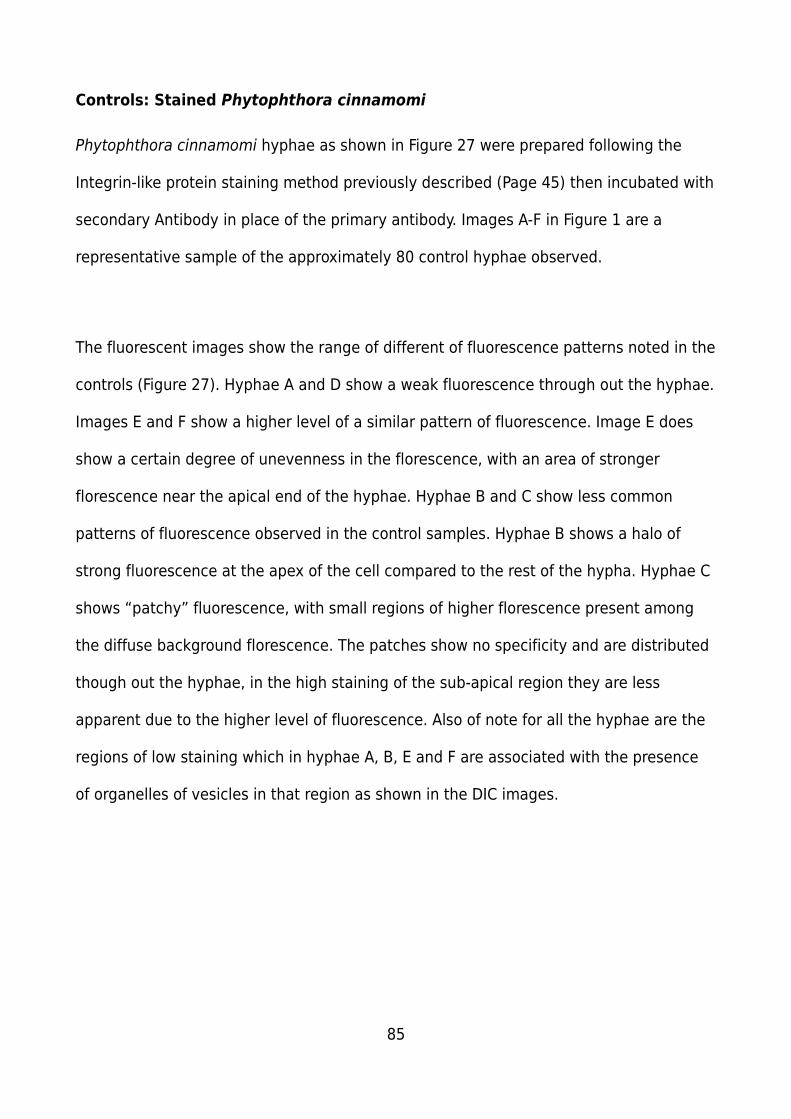
Controls: Stained Phytophthora cinnamomi
Phytophthora cinnamomi hyphae as shown in Figure 27 were prepared following the
Integrin-like protein staining method previously described (Page 45) then incubated with
secondary Antibody in place of the primary antibody. Images A-F in Figure 1 are a
representative sample of the approximately 80 control hyphae observed.
The fluorescent images show the range of different of fluorescence patterns noted in the
controls (Figure 27). Hyphae A and D show a weak fluorescence through out the hyphae.
Images E and F show a higher level of a similar pattern of fluorescence. Image E does
show a certain degree of unevenness in the florescence, with an area of stronger
florescence near the apical end of the hyphae. Hyphae B and C show less common
patterns of fluorescence observed in the control samples. Hyphae B shows a halo of
strong fluorescence at the apex of the cell compared to the rest of the hypha. Hyphae C
shows “patchy” fluorescence, with small regions of higher florescence present among
the diffuse background florescence. The patches show no specificity and are distributed
though out the hyphae, in the high staining of the sub-apical region they are less
apparent due to the higher level of fluorescence. Also of note for all the hyphae are the
regions of low staining which in hyphae A, B, E and F are associated with the presence
of organelles of vesicles in that region as shown in the DIC images.
85
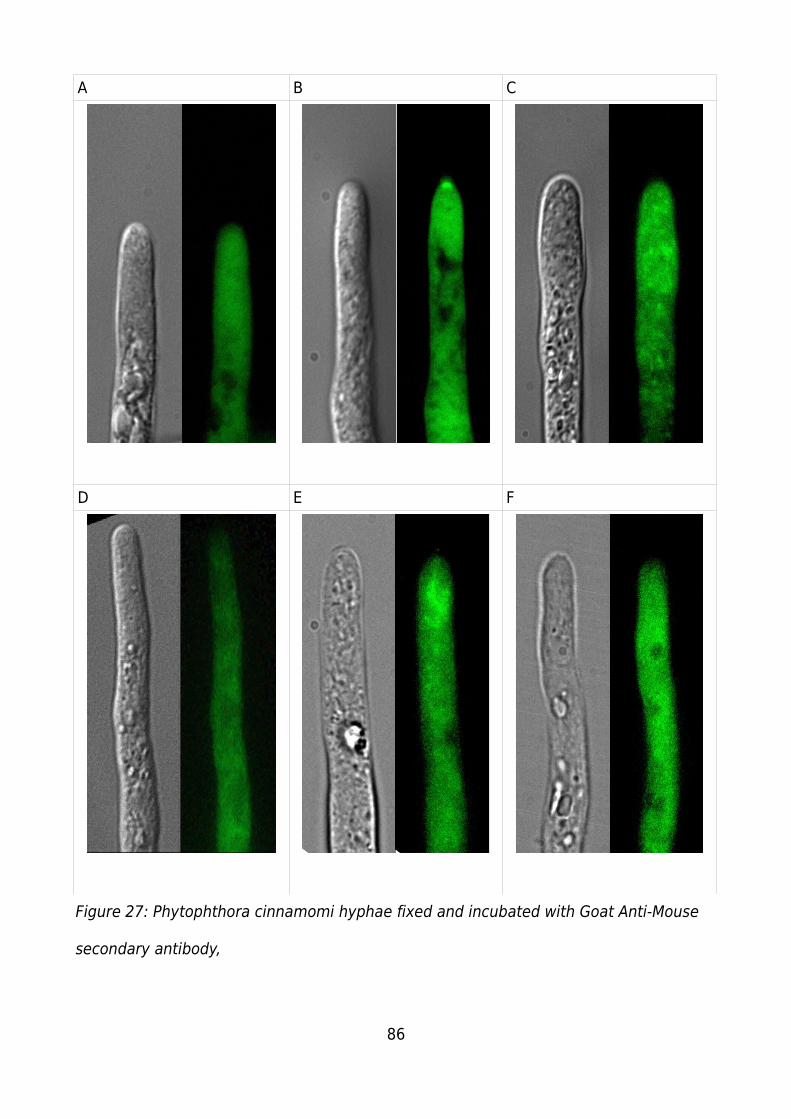
A B C
D E F
Figure 27: Phytophthora cinnamomi hyphae fixed and incubated with Goat Anti-Mouse
secondary antibody,
86
Controls: Anti-Integrin β4 Stained Achlya bisexualis
Achlya bisexualis Hyphae in Figure 28 were treated as described in the Integrin-like
protein staining method (Page 45), they are a representative sample of the
approximately 15 hyphae observed.
Images A-D (Figure 28) show hyphae treated with mouse anti-integrin β4 antibody and
stained with goat anti-mouse antibodies tagged with Alexa 488 florescent dye. Hyphae
A shows 2 small stained plaque, indicated by the white markers, one in the sub-apical
and one in the basal regions of the hyphae, both are associated with the edge of the
hyphae. A high level of diffuse staining is present throughout the sub-apical region of
the hyphae, then the diffuse staining decreases in the basal region. The DIC image
shows some irregularities in the cytoplasm which has receded from the cell wall at the
apex. Image B shows the same hyphae as A at a higher magnification. At the higher
magnification hyphae B shows additional plaques compared to A which are also
associated with the edge of the cytoskeleton or hyphae, also larger patches of staining
can be observed along the periphery of the cytoplasm, and appears to be separate from
the diffuse background florescence.
Hypahe C has a low level of diffuse fluorescence throughtout the hypha with small
plaques again associated with the edge of the cytoplasm. The DIC image for C shows
irregular cytoplasm. Hyphae D also shows the presence of plaques at the edge of the
hyphae cytoplasm, and irregularities in the shape and cytoplasm of the hyphae.
Image E shows the basal region of a hyphae with low levels of diffuse fluorescence in
the cytoplasm and high levels of clusters of plaques along the edge of the cytoplasm.
87
A B C
D E
Figure 28: Achlya bisexualis hyphae stained with mouse anti Integrin β4 antibody and
goat anti mouse antibody. Images A-D show the tips of stained hyphae. Image E shows
the basal region of a stained hyphae White pointers indicate stained integrin plaques
88
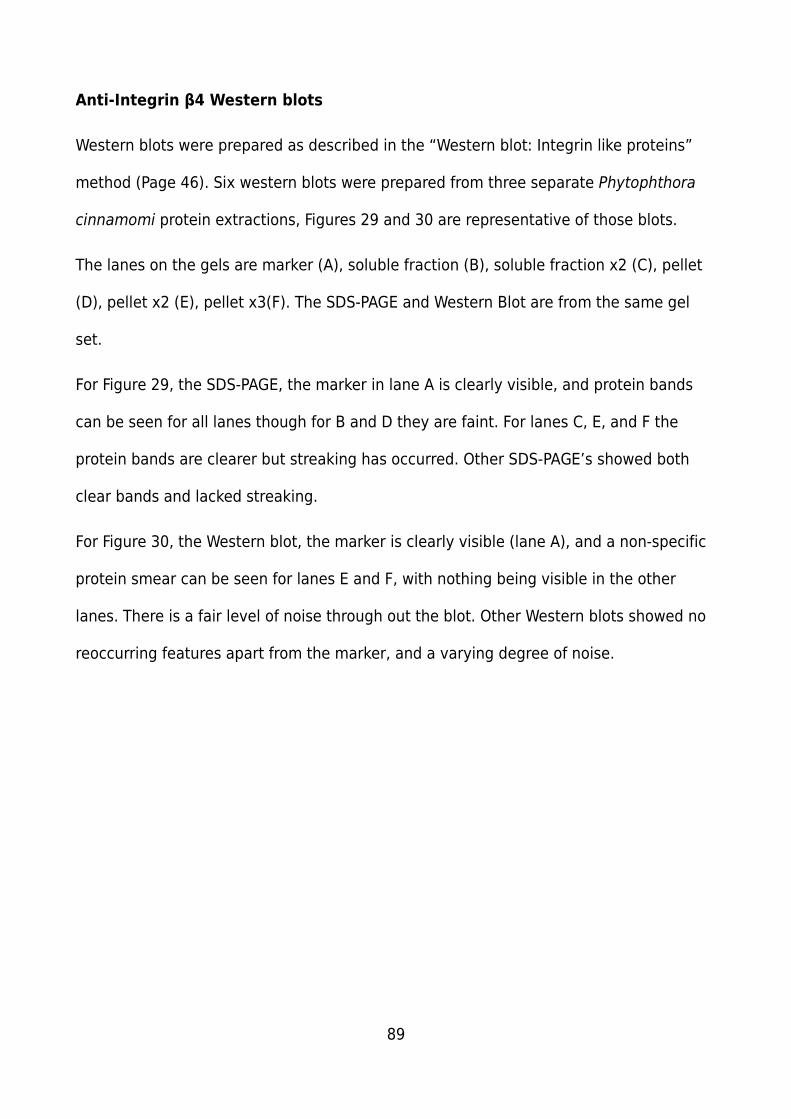
Anti-Integrin β4 Western blots
Western blots were prepared as described in the “Western blot: Integrin like proteins”
method (Page 46). Six western blots were prepared from three separate Phytophthora
cinnamomi protein extractions, Figures 29 and 30 are representative of those blots.
The lanes on the gels are marker (A), soluble fraction (B), soluble fraction x2 (C), pellet
(D), pellet x2 (E), pellet x3(F). The SDS-PAGE and Western Blot are from the same gel
set.
For Figure 29, the SDS-PAGE, the marker in lane A is clearly visible, and protein bands
can be seen for all lanes though for B and D they are faint. For lanes C, E, and F the
protein bands are clearer but streaking has occurred. Other SDS-PAGE’s showed both
clear bands and lacked streaking.
For Figure 30, the Western blot, the marker is clearly visible (lane A), and a non-specific
protein smear can be seen for lanes E and F, with nothing being visible in the other
lanes. There is a fair level of noise through out the blot. Other Western blots showed no
reoccurring features apart from the marker, and a varying degree of noise.
89
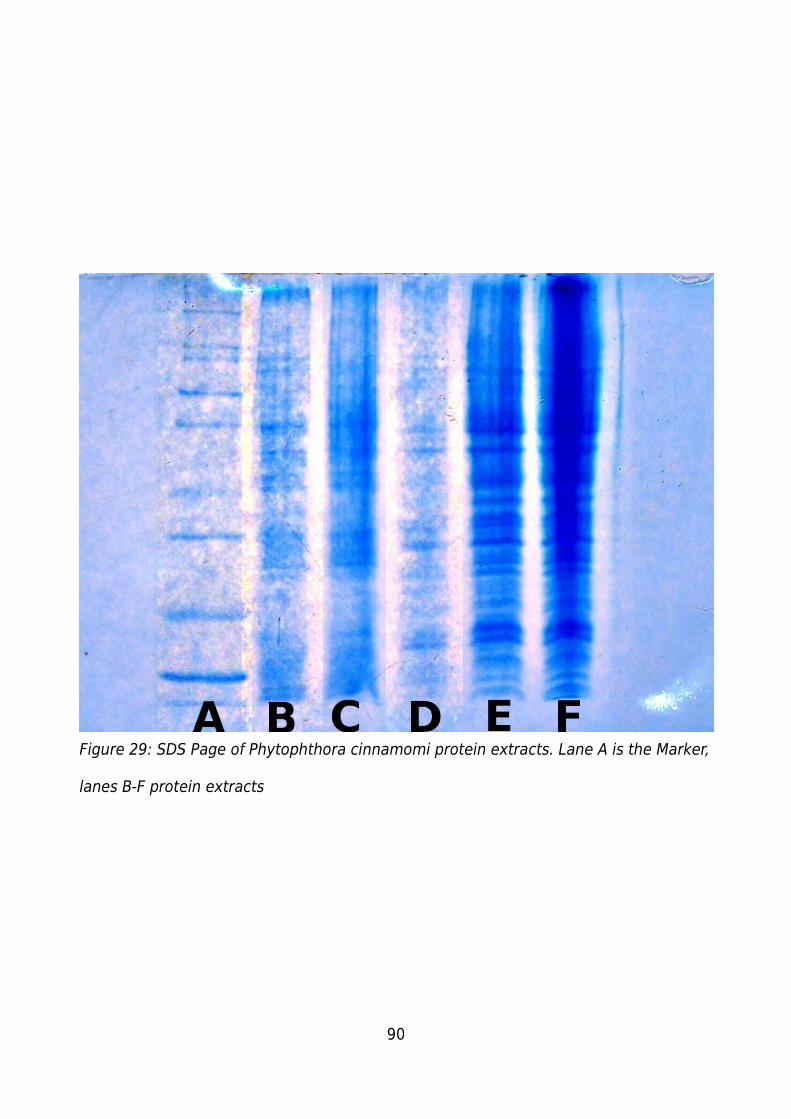
90
Figure 29: SDS Page of Phytophthora cinnamomi protein extracts. Lane A is the Marker,
lanes B-F protein extracts
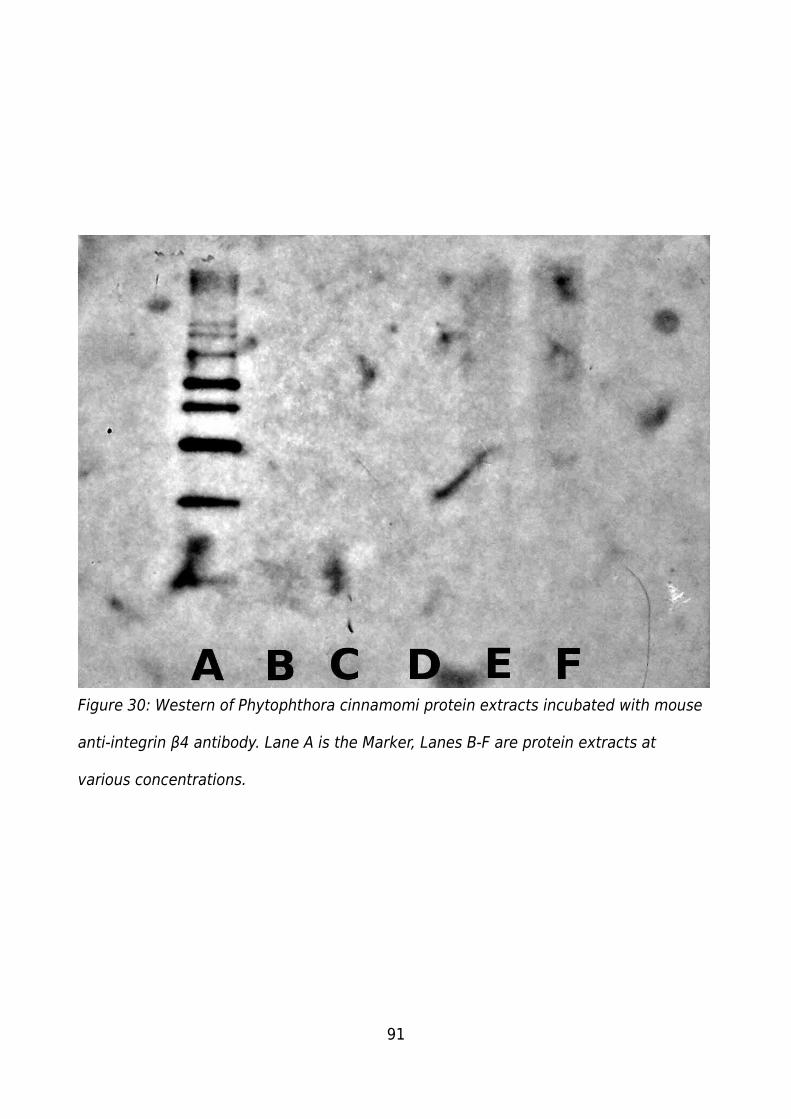
91
Figure 30: Western of Phytophthora cinnamomi protein extracts incubated with mouse
anti-integrin β4 antibody. Lane A is the Marker, Lanes B-F are protein extracts at
various concentrations.
Discussion
The effects of Latrunculin B on the actin cytoskeleton.
Interest in the role of actin in tip growth in hyphal organisms has lead to studies
examining it in a range of species including but not limited to oomycetes Saprolegnia
ferax (Gupta & Heath 1997; Heath and Harold 1992; Heath et al 2000; Jackson and
Heath 1990), Achlya bisexualis (Heath and Harold 1992; Yu et al 2004; Walker et al
2006), and Phytophthora cinnamomi (Walker et al 2006; Jackson and Hardman 1998);
eufungi Geotrichum candidum (Gupta & Heath 1997), Neurospora crassa (Heath et al
2000), Aspergillus nidulans (Torralba et al 1998); algae Fucus distichus (Kropf et al 1989)
and yeast Saccharomyces cerevisiae (Ayscough et al 1997). These studies and many
others have helped provide a solid basis for understanding the roles of F-actin in tip
growth, and furthered our understanding of the viability, of the various proposed models
of tip growth (Heath and Steinberg 1999; Money 1997).
Actin has been shown to be of critical importance in developing polarisation a critical
feature of tip growth. Kropf in 1989 showed that actin disruption by cytochalasin A
prevent the formation of the cell axis in the algae Fucus distichus (Kropf et al, 1989). In
the oomycetes that drug has been used to suggest that F-actin is involved in cleavage
of zoospores, as well as the contractile vacuole in Saprolegnia ferax and Achlya
bisexualis (Heath and Harold 1992) as well as Phytophthora cinnamomi (Jackson and
Hardham, 1998). F-actin has been shown to be required for the localisation of some
proteins involved in budding (an analogous process to tip growth) in Saccharomyces
cerevisiae (Ayscough et al, 1997). F-actin is essential in polarisation and hyphal tip
92
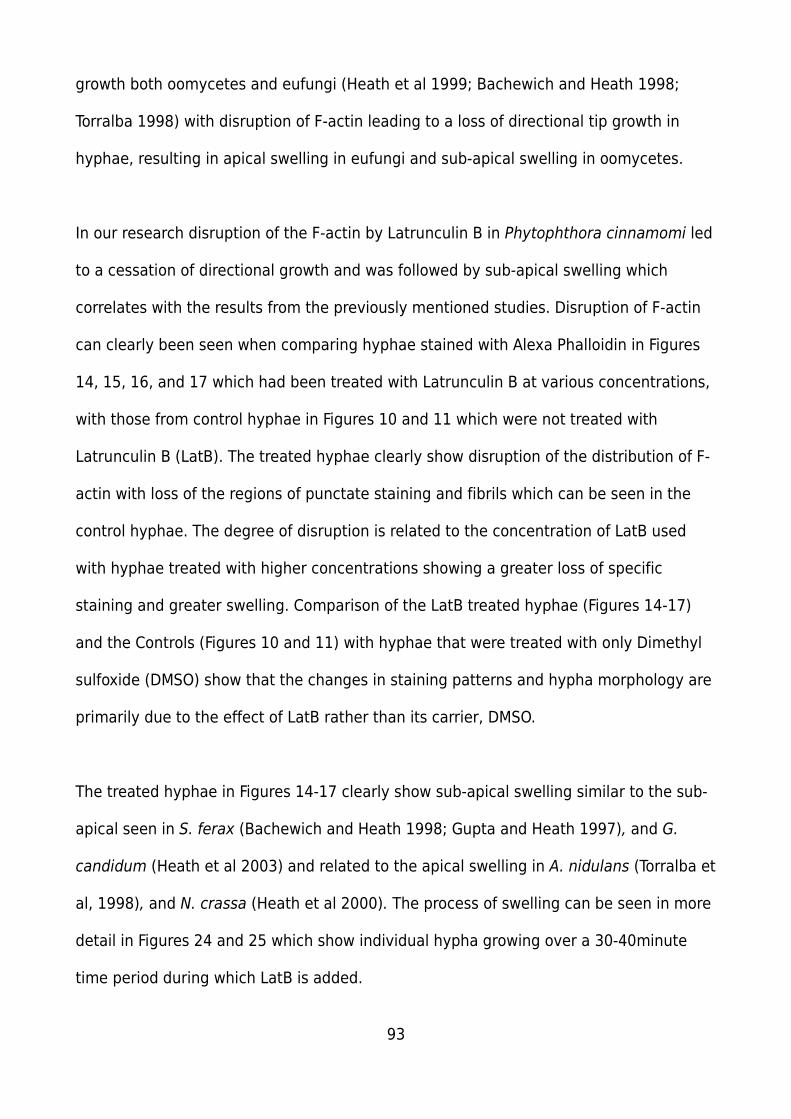
growth both oomycetes and eufungi (Heath et al 1999; Bachewich and Heath 1998;
Torralba 1998) with disruption of F-actin leading to a loss of directional tip growth in
hyphae, resulting in apical swelling in eufungi and sub-apical swelling in oomycetes.
In our research disruption of the F-actin by Latrunculin B in Phytophthora cinnamomi led
to a cessation of directional growth and was followed by sub-apical swelling which
correlates with the results from the previously mentioned studies. Disruption of F-actin
can clearly been seen when comparing hyphae stained with Alexa Phalloidin in Figures
14, 15, 16, and 17 which had been treated with Latrunculin B at various concentrations,
with those from control hyphae in Figures 10 and 11 which were not treated with
Latrunculin B (LatB). The treated hyphae clearly show disruption of the distribution of F-
actin with loss of the regions of punctate staining and fibrils which can be seen in the
control hyphae. The degree of disruption is related to the concentration of LatB used
with hyphae treated with higher concentrations showing a greater loss of specific
staining and greater swelling. Comparison of the LatB treated hyphae (Figures 14-17)
and the Controls (Figures 10 and 11) with hyphae that were treated with only Dimethyl
sulfoxide (DMSO) show that the changes in staining patterns and hypha morphology are
primarily due to the effect of LatB rather than its carrier, DMSO.
The treated hyphae in Figures 14-17 clearly show sub-apical swelling similar to the sub-
apical seen in S. ferax (Bachewich and Heath 1998; Gupta and Heath 1997), and G.
candidum (Heath et al 2003) and related to the apical swelling in A. nidulans (Torralba et
al, 1998), and N. crassa (Heath et al 2000). The process of swelling can be seen in more
detail in Figures 24 and 25 which show individual hypha growing over a 30-40minute
time period during which LatB is added.
93
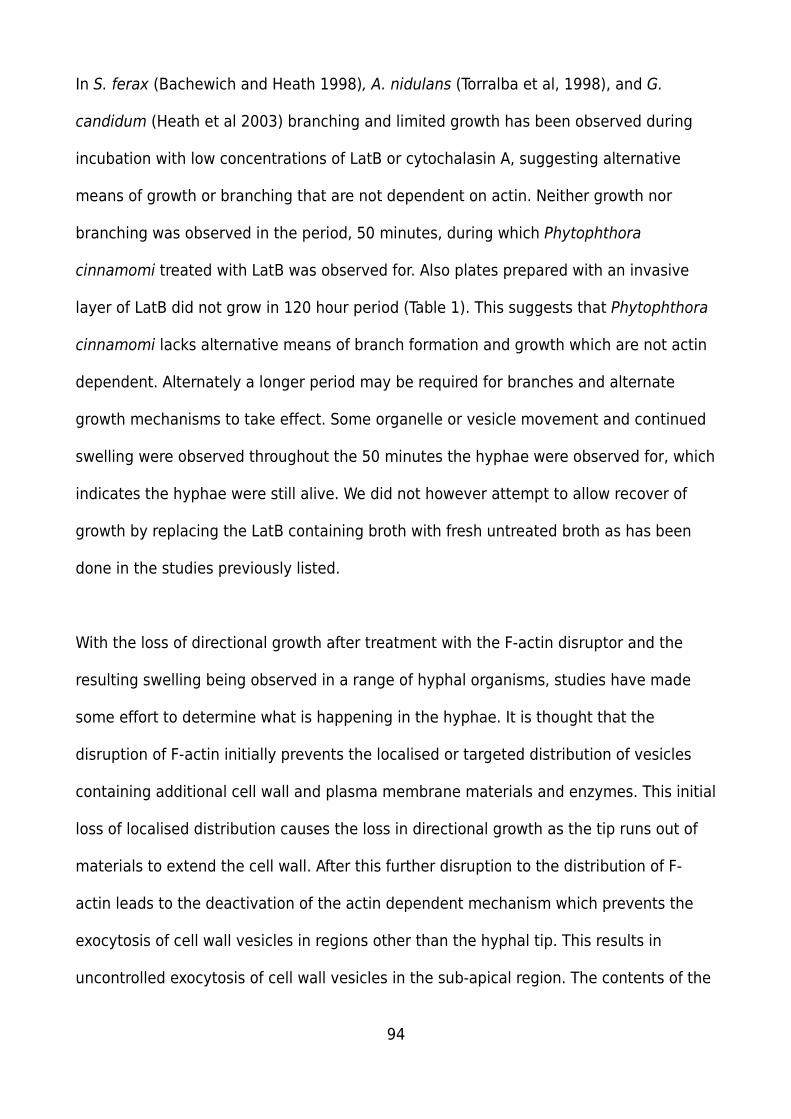
In S. ferax (Bachewich and Heath 1998), A. nidulans (Torralba et al, 1998), and G.
candidum (Heath et al 2003) branching and limited growth has been observed during
incubation with low concentrations of LatB or cytochalasin A, suggesting alternative
means of growth or branching that are not dependent on actin. Neither growth nor
branching was observed in the period, 50 minutes, during which Phytophthora
cinnamomi treated with LatB was observed for. Also plates prepared with an invasive
layer of LatB did not grow in 120 hour period (Table 1). This suggests that Phytophthora
cinnamomi lacks alternative means of branch formation and growth which are not actin
dependent. Alternately a longer period may be required for branches and alternate
growth mechanisms to take effect. Some organelle or vesicle movement and continued
swelling were observed throughout the 50 minutes the hyphae were observed for, which
indicates the hyphae were still alive. We did not however attempt to allow recover of
growth by replacing the LatB containing broth with fresh untreated broth as has been
done in the studies previously listed.
With the loss of directional growth after treatment with the F-actin disruptor and the
resulting swelling being observed in a range of hyphal organisms, studies have made
some effort to determine what is happening in the hyphae. It is thought that the
disruption of F-actin initially prevents the localised or targeted distribution of vesicles
containing additional cell wall and plasma membrane materials and enzymes. This initial
loss of localised distribution causes the loss in directional growth as the tip runs out of
materials to extend the cell wall. After this further disruption to the distribution of F-
actin leads to the deactivation of the actin dependent mechanism which prevents the
exocytosis of cell wall vesicles in regions other than the hyphal tip. This results in
uncontrolled exocytosis of cell wall vesicles in the sub-apical region. The contents of the
94
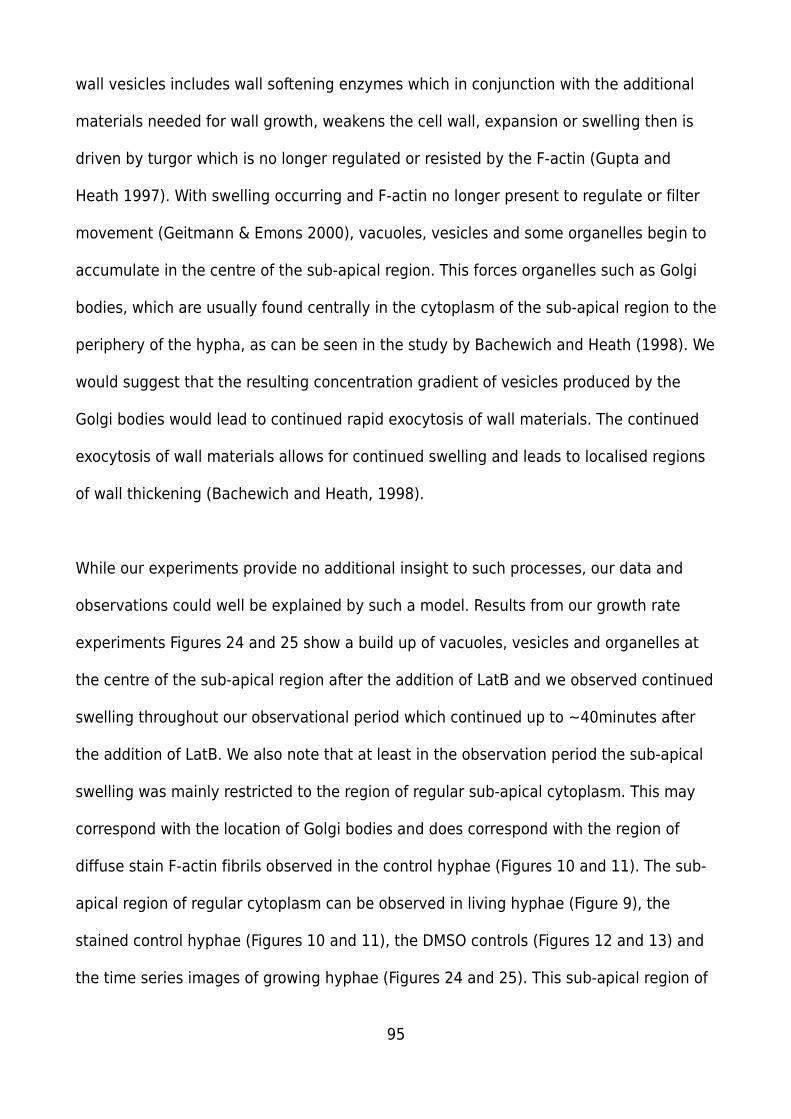
wall vesicles includes wall softening enzymes which in conjunction with the additional
materials needed for wall growth, weakens the cell wall, expansion or swelling then is
driven by turgor which is no longer regulated or resisted by the F-actin (Gupta and
Heath 1997). With swelling occurring and F-actin no longer present to regulate or filter
movement (Geitmann & Emons 2000), vacuoles, vesicles and some organelles begin to
accumulate in the centre of the sub-apical region. This forces organelles such as Golgi
bodies, which are usually found centrally in the cytoplasm of the sub-apical region to the
periphery of the hypha, as can be seen in the study by Bachewich and Heath (1998). We
would suggest that the resulting concentration gradient of vesicles produced by the
Golgi bodies would lead to continued rapid exocytosis of wall materials. The continued
exocytosis of wall materials allows for continued swelling and leads to localised regions
of wall thickening (Bachewich and Heath, 1998).
While our experiments provide no additional insight to such processes, our data and
observations could well be explained by such a model. Results from our growth rate
experiments Figures 24 and 25 show a build up of vacuoles, vesicles and organelles at
the centre of the sub-apical region after the addition of LatB and we observed continued
swelling throughout our observational period which continued up to ~40minutes after
the addition of LatB. We also note that at least in the observation period the sub-apical
swelling was mainly restricted to the region of regular sub-apical cytoplasm. This may
correspond with the location of Golgi bodies and does correspond with the region of
diffuse stain F-actin fibrils observed in the control hyphae (Figures 10 and 11). The sub-
apical region of regular cytoplasm can be observed in living hyphae (Figure 9), the
stained control hyphae (Figures 10 and 11), the DMSO controls (Figures 12 and 13) and
the time series images of growing hyphae (Figures 24 and 25). This sub-apical region of
95

cytoplasm is thought to migrate along behind the growing tip leaving behind it a thin
layer of cytoplasm and numerous vacuoles, and is considered to be supportive of
amebal growth (Heath and Steinberg, 1999).
While swelling in F-actin disrupted hyphae is thought to be driven by turgor pressure
and the exocytosis of wall vesicles, there is still debate over the exact role of turgor in
normal hyphal tip growth (Money 1997). An Amebae like growth model has been
suggested as an alternative (Heath and Steinberg 1999). In the amebae model instead
of turgor pressure providing the protrusive force needed to extend the cell wall the
extension of F-actin filaments provides the force, this may be supplemented by
additional force generated by actin binding proteins acting as motors and pushing the
microfilaments forward (Money 1997). Heath and Steinberg (1999) provide a detailed
review of the Amebae model while Money (1997) looks at the role of turgor and actin as
an alternative source of force.
Related to the amebae model of growth Gupta and Heath (1997) suggested that actin
may regulate the effect of turgor on tip extendibility in hyphae with normal turgor and in
hyphae with low turgor acts as the source of protrusive force. They proposed this could
be demonstrated by disrupting F-actin in a hypha with normal turgor, if F-actin regulated
the extendibility of the hyphae this should lead to a transient increase in the growth
rate, due to the unregulated turgor pressure driving growth, until it was constrained by
a lack of cell wall materials due to disruption of the F-actin. If the F-actin was disrupted
in a hyphae with low turgor growth would cease with out a transient increase in the
growth rate, as the F-actin would no longer be able to provide the protrusive force for tip
extension. This was then experimentally tested in Saprolegnia ferax and LatB with the
96
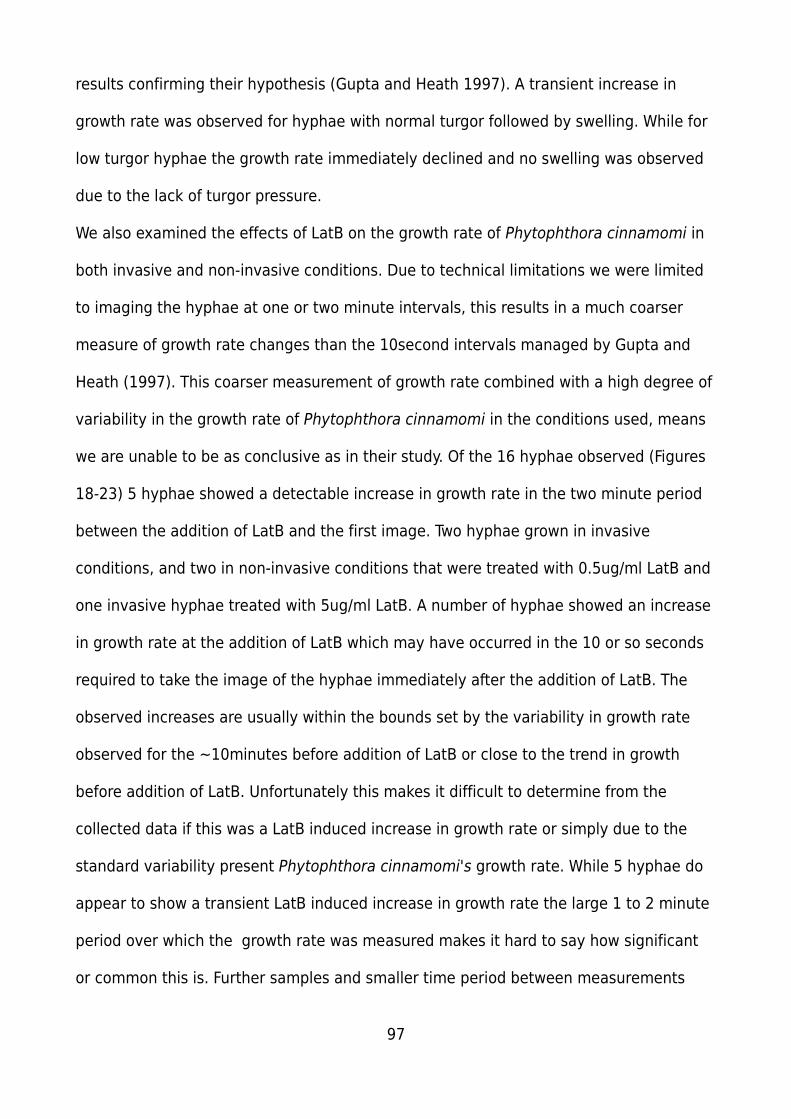
results confirming their hypothesis (Gupta and Heath 1997). A transient increase in
growth rate was observed for hyphae with normal turgor followed by swelling. While for
low turgor hyphae the growth rate immediately declined and no swelling was observed
due to the lack of turgor pressure.
We also examined the effects of LatB on the growth rate of Phytophthora cinnamomi in
both invasive and non-invasive conditions. Due to technical limitations we were limited
to imaging the hyphae at one or two minute intervals, this results in a much coarser
measure of growth rate changes than the 10second intervals managed by Gupta and
Heath (1997). This coarser measurement of growth rate combined with a high degree of
variability in the growth rate of Phytophthora cinnamomi in the conditions used, means
we are unable to be as conclusive as in their study. Of the 16 hyphae observed (Figures
18-23) 5 hyphae showed a detectable increase in growth rate in the two minute period
between the addition of LatB and the first image. Two hyphae grown in invasive
conditions, and two in non-invasive conditions that were treated with 0.5ug/ml LatB and
one invasive hyphae treated with 5ug/ml LatB. A number of hyphae showed an increase
in growth rate at the addition of LatB which may have occurred in the 10 or so seconds
required to take the image of the hyphae immediately after the addition of LatB. The
observed increases are usually within the bounds set by the variability in growth rate
observed for the ~10minutes before addition of LatB or close to the trend in growth
before addition of LatB. Unfortunately this makes it difficult to determine from the
collected data if this was a LatB induced increase in growth rate or simply due to the
standard variability present Phytophthora cinnamomi's growth rate. While 5 hyphae do
appear to show a transient LatB induced increase in growth rate the large 1 to 2 minute
period over which the growth rate was measured makes it hard to say how significant
or common this is. Further samples and smaller time period between measurements
97
would be needed to determine what exactly is occurring in Phytophthora cinnamomi tip
growth immediately after the addition of LatB.
Recent studies in this lab utilising and improved fixative (Yu et al 2004) have identified
an actin depleted zone in the F-actin cap present in oomycetes. This has been identified
in two oomycetes, initially in Achlya bisexualis (Yu et al 2004) and more recently in
Phytophthora cinnamomi (Walker et al 2006). An actin depleted zone had only been
observed prior to that in had primarily been observed in pollen tubes, and once in
oomycetes in a study where there was some concern that not all the F-actin had been
stained due a lack of F-actin plaques being stained (Jackson and Heath 1990). In the
study by Walker et al (2006) it was reported that the actin depleted zone was observed
in 74% of invasive hyphae and 20% of non-invasive hyphae. It was suggested that this
actin depleted zone may increase the protrusive force in the absence of an increase in
turgor. As well as allow non-invasive growth at very low levels of turgor (Walker et al
2006).
In this study we observed the actin depleted zone in both invasive and non-invasive
hyphae stained with Alexa Phalloidin (Figures 10 and 11). The actin depleted zone was
not affected by DMSO (Figures 12 and 13) but was disrupted by all concentrations of
LatB that were used (Figures 14-17). Based on our observations we would also suggest
that for healthy non-invasive hyphae, with a tapered point and no noticeable
cytoplasmic anomalies compared to living hyphae, the actin depleted zone was more
common than the 20% of hyphae previously suggested (Walker et al 2006).This
observed difference in the presence of the actin depleted zone in non-invasive hyphae,
is potentially a result of our larger sample size for non-invasive hyphae (n=30)
98
compared to (n=15) used in Walker et al (2006). It may also partly be the result of the
use of slightly different criteria for determining what healthy growing hyphae are and
the difference in recovery period for our experiments, we allowed 2 hours and 30
minutes for the hyphae to recover in broth, after being cut, compared to the 1 hour
recovery period used by Walker et al (2006).
Integrin like proteins in Phytophthora cinnamomi
In animal cells integrins are one of the most common and important classes of
transmembrane receptors. They are also one of the primary structures for connecting
the cytoplasmic skeleton to the external environment or extra cellular matrix. In the
plasma membrane they form focal adhesions complexing with a variety of proteins that
act to amplify transmembrane signals and provide anchorage for the cytoskeleton. The
focal adhesions they form are thought to be critical components of amebal movement,
by anchoring the cytoplasm to the external environment they allow force to be
generated against the cytoskeleton for movement with out the risk lysing the cell.
As previously mentioned an amebal like model has been suggested for tip growth in
plants and hyphal organisms (Heath and Steinberg 1999). If such a model is correct then
a protein or a protein complex would be required to fill the transmembrane connective
role of integrins in animals. Such a protein would need to provide a link between the
cytoskeleton and the external environment, which in the case of plant and hyphal cells
is the cell wall, to anchor the cytoskeleton. Anchor the cytoskeleton would allow the
force needed for tip growth to be generated against the cytoskeleton without risking cell
integrity.
99
Various studies utilising a number of integrin specific antibodies have shown that
proteins epitopically similar to animal integrins are present in a range of organisms
which utilise tip growth, including but not limited to the eufungi, Neurospora crassa
(Degousee et al 2000); plants Arabidopsis (Swatzell et al 1999), Lilium davidii, and
Nicotiana tabacum (Sun et al 2000); and oomycetes Saprolegnia ferax (Kaminskyj and
Heath 1995), and Achlya bisexualis (Chitcholtan & Garrill 2005). A range of antibodies
specific to various integrin subunits have been used targeting the subunits β1 (Kaminskyj
& Heath 1995; Degousee et al 2000; Sun et al 2000) αV and β3 (Sun et al, 2000), and β4
(Chitcholtan & Garrill 2005). The studies have generally shown that these integrin like
proteins (Ilps) are present at the apex of the cell and in some species also present in the
sub-apical region (Degousee et al 2000).
In this study we examined Phytophthora cinnamomi for the presence of a β4 integrin
like
protein utilising immunoflorescent microscopy and western blots. For Phytophthora
cinnamomi we observed a range of florescent patterns in both the treated hyphae
(Figure 26) and the control hyphae (Figure 27). Comparison of the control hyphae and
the stained hyphae reveal no unique patterns of florescence in the stained hyphae. The
most obvious pattern, the “patchy” staining visible in Figure 26 B, C, and D, is also
present in the control hyphae Figure 27. The pattern of florescence also varies
noticeable in appearance and location in the hypha compared to the staining pattern for
β4 stained Achlya bisexualis hyphae Figure 28 C), the β4 staining pattern for Achlya
bisexualis shown by Chitochalan and Garrill (2005), and those seen in the literature for
other integrin like proteins (Degousee et al 2000; Kaminskyj & Heath 1995).
Western blots for a β4 integrin like protein were also prepared. However while the SDS-
100
PAGE gels showed, reasonable to good separation of proteins (example, Figure 29), and
proteins were shown to have transferred to the membrane no response was observed
on the developed blots (Figure 30).
Based on our data we suggest that β4 integrin like proteins are not present in the
hyphae of Phytophthora cinnamomi although we advise caution as absence of evidence
does not mean evidence of absence. Also this does not rule out the presence of integrin
like proteins in Phytophthora cinnamomi. As is the case in animals a range of integrin
like proteins have been observed in plants and hyphal organisms as we have mentioned
previously. Also the exact range of integrin like proteins present in an organism has
been shown to vary in plants. Sun et al (2000) found that αV and β3 integrin like proteins
were strongly expressed in the tips of pollen tubes in Lilium davidii while αV and β1 were
strongly expressed in the pollen tubes of Nicotiana tabacum. Thus we think that it is
reasonable to suggest that differing integrin like proteins are likely to be present in
oomycetes and that it is likely which ones are present and expressed is likely to vary
especially between more distantly related oomycetes such as Phytophthora cinnamomi
and Achlya bisexualis (Cooke et al 2000) that target different niches in the ecosystem.
101
Conclusion
In conclusion our study of the role of F-actin in tip growth and the effects of Latrunculin
B on it in Phytophthora cinnamomi show that it is similar to that observed in other
hyphal organisms. With F-actin being critical to the maintenance of directional tip
growth in the organism and that the disruption of the F-actin elements, present in the
hypha, causes rapid cessation of growth and sub-apical swelling. We also note that in
the time we observed the treated hyphae they did not activate an alternative means of
growth or branching that isn't dependent on F-actin as had been seen in other hyphal
organisms. We have also shown that no β4 integrin like protein is present in
Phytophthora cinnamomi though the presence of some other integrin like protein is in
no way ruled out by these experiments.
Overall our study has help increase our understanding of tip growth in Phytophthora
cinnamomi.
102

Acknowledgements
I'd like to thank my supervisor Dr Ashely Garrill for his suggestions, help and continued
patience though out the project, Sandi Suei for thoughts and advice at when ever
needed, Craig Galilee for always being able to timely find and provide the materials
needed for experiments and the odd bit of humour, Dr Drusilla Mason for being willing
to help out when needed and Dr Juliet Gerrard for the odd bit of advice and
encouragement. I'd also like to thank Dr Kenny Chitcholtan, Jan McKenzie, Jackie Healy,
and Manfred Ingerfeld for technical help when needed.
103

References
Adams A, Pringle J; 1984; Relationship of actin and tubulin distribution to bud growth
in wild-type morphogenetic mutant Saccharomyces cerevisiae. Journal of Cell biology
98: 934-945
Ayscough K, Stryker J, Pokala N, Sanders M, Crews P, and Drubin D; 1997; High
Rates of Actin Filament Turnover in Budding Yeast and Roles for Actin in Establishment
and Maintenance of Cell Polarity Revealed Using the Actin Inhibitor Latrunculin-A; The
Journal of Cell Biology, Volume 137, 1997
Bachewich C and Heath I.B.; 1998; Radial F-actin arrays precede new hypha
formation in Saprolegnia: implications for establishing polar growth and regulating tip
morphogenesis Journal of Cell Science 111,
2005-2016 (1998)
Bastmeyer M, Deising H B., and Bechinger C; 2002; Force Exertion in Fungal
Infection; Annual Review of Biophysics and Biomolecular Structure; 31;
Bergot M., Cloppet E, Perarnaud V, Marcais B, and Desprez-Loustau M-L; 2004;
Simulation of potential threat range expansion of oak disease caused by Phytophthora
cinnamomi under climate change. Glob. Change Biol 10, 1539-1552
Scott D. Blystone; 2004; Integrating an integrin: a direct route to actin Biochimica et
Biophysica Acta (BBA) - Molecular Cell Research Volume 1692, Issues 2-3, 5 July
Brown MJ, Balmer J, and Podger FD; 2002; Vegetation change over 20 years at
Bathurst Harbour, Tasmania. Aust. J. Bot. 50, 499-510
CAVALIER-SMITH T; 1998; A revised six-kingdom system of life; Biol. Rev. (1998), 73,
104
pp. 203–266
Chakraborty, S., et al; 1998; Potential impact of climate change on plant diseases of
economic significance to Australia (1998) Australasian Plant Pathology, 27 (1), pp. 15-
35.
Chitcholtan K, Garrill A; 2005; A β4 integrin-like protein co-localises with a
phosphotyrosine containing protein in the oomycete Achlya bisexualis: Inhibition of
tyrosine phosphorylation slows tip growth; Fungal genetics and biology 2005,vol.42,
Cooke, D.E.L., Duncan, J.M.; 1997; Phylogenetic analysis of Phytophthora species
based on ITS1 and ITS2 sequences of the ribosomal RNA gene repeat
(1997) Mycological Research, 101 (6), pp. 667-677
Degousee N, Gupta G, Lew R, and Heath I; 2000; A Putative Spectrin-Containing
Membrane Skeleton in Hyphal Tips of Neurospora crassa. Fungal Genetics and Biology
30, 33– 44
Dominguez R; 2004; Actin-binding proteins – a unifying hypothesis. TRENDS in
Biochemical Sciences Vol.29 No.11 November
Engqvist-Goldstein A, Drubin D; 2003; Actin assembly and endocytosis: from yeast
to mammals. Annual Review of Cell and Developmental Biology 19: 287-332
Forster H, Coffey MD, Elwood H, & Sogin ML; 1990; Sequence analysis of the small
subunit in ribosomal RNAs of three zoosporic fungi and implications for fungal evolution.
Mycologia 82; 302-312
GEITMANN A. & EMONS A.M.C.; 2000; The cytoskeleton in plant and fungal cell tip
growth. Journal of Microscopy, Vol. 198, Pt 3, June 2000, pp. 218±245.
Giancotti F and Ruoslahti E; 1999; Integrin Signaling; Science 13 Aug 1999; 285:
105
1028-1033.
Gupta G and Heath IB.; 1997; Actin Disruption by Latrunculin B Causes Turgor-
Related Changes in Tip Growth of Saprolegnia ferax Hyphae Fungal Genetics and Biology
21, 64–75
Hardham A; 2005; Phytophthora cinnamomi. Molecular Plant Pathology Volume 6,
Issue 6, November 2005, Pages 589-604
Harold R, Money N, and Harold F; 1996 Growth and morphogenesis in Saprolegnia
ferax: Is turgor required?; Protoplasma Volume 191, Numbers 1-2 / March, 1996;
Heath IB and Harold RL; 1992; Actin has multiply roles in the formation and
architecture of zoospores of the oomycetes, Saprolegnia ferax and Achlya bisexualis. J.
Cell Sci. 102; 611-627
Heath I. B., Gupta Gagan, and Bai Suk; 2000; Plasma Membrane-Adjacent Actin
Filaments, but Not Microtubules, Are Essential for both Polarisation and Hyphal Tip
Morphogenesis in Saprolegnia ferax and Neurospora crassa; Fungal Genetics and
Biology, 30; 45-60;
Heath IB, Bonham M, Akram A, and Gupta G; 2003; The interrelationships of actin
and hyphal tip growth in the ascomycete Geotrichum candidum; Fungal Genetics and
Biology 38 (2003) 85–97
Heath I. B., and Steinberg G; 1999; Mechanisms of Hyphal Tip Growth: Tube
Dwelling Amebae Revisited; Fungal Genetics and Biology 28, 79–93
Humphries MJ, McEwan PA, Barton SJ, Buckley PA, Bella J, Paul Mould A; 2003;
Integrin structure: heady advances in ligand binding, but activation still makes the
knees wobble., Trends in biochemical sciences, 28(6), 313-20
106
Jackson, S.L. and Hardham, A.R.; 1998; Dynamic rearrangement of the filamentous
actin network occurs during zoosporogenesis and encystment in the oomycete
Phytophthora cinnamomi; Fungal Genetics and Biology Volume 24, Issue 1-2, June 1998,
Pages 24-33
Jackson and Heath; 1990; Evidence that actin reinforces the extensible hyphal apex
of the oomycete Saprolegnia ferax. Protoplasma Volume 157, Issue 1-3, February 1990,
Pages 144-15
Kaminskyj S, Heath IB; 1994; A comparison of techniques for localizing actin and
tubulin in hyphae of Saprolegnia ferax. Journal of Histochemistry and Cytochemistry
42:523-530
Kaminskyj S, Heath IB; 1995; Integrin and spectrin homologues, and cytoplasm-wall
adhesion in tip growth. Journal of Cell Science 108:849-856
(Kovar & Pollard) Kovar D, Pollard T; 2004; Insertional assembly of actin filament
barbed ends in association with formins produces piconewton forces; PNAS | October 12,
2004 | vol. 101 | no. 41 | 14725-14730
Kropf, Darryl L., Sonja K. Berge, and Ralph S. Quatrano (1989) Actin localization during
Fucus embryogenesis. Plant Cell 1:191-200.
Kropf D.,Bisgrove S., and Hable W.; 1998; Cytoskeletal control of polar growth in
plant cells; Current Opinion in Cell Biology 1998 10 p117-122
Lew R, Levina N, Walker S, Garrill A; 2004 Turgor regulation in hyphal organisms;
Fungal Genetics and Biology, 41, 2004, 1007-1015
23. Lin, S., and Spudich, J.A.; 1974; On The Molecular Basis of Action Of
Cytochalasin B. J. Supramol. Struct. 2:728-736.
107
Money Nicholas P.; 1997; Wishful thinking of Turgor Revisited: The Mechanics of
Fungal Growth; Fungal Genetics and Biology 21; 1997; 173-187
Podger F.D., Doepel R..F, and Zentmyer G.A.; 1965; Association of Phytophthora
cinnamomi with a disease of Eucalyptus marginata forest in Western Australia. Plant Dis.
Report, 49, 943-947
Podger F.D.; 1972; Phytophthora cinnamomi, a cause of lethal disease in indigenous
plant communities in Western Australia. Phytopathology, 62, 972-981
Randall T. A, et al; 2005; Large-scale gene discovery in the oomycete Phytophthora
infestans reveals likely components of phytopathogenicity shared with true fungi.;
Molecular Plant-Microbe Interactions, 2005 (Vol. 18) (No. 3) 229-243
dos Remedios, C. G., D. Chhabra, M. Kekic, I. V. Dedova, M. Tsubakihara, D. A.
Berry, and N. J. Nosworthy; 2003; Actin Binding Proteins: Regulation of Cytoskeletal
Microfilaments. Physiol Rev 83: 433– 473, 2003;
Shearer, B.L., Crane, C.E., Fairman, R.G.; 2004; Phosphite reduces disease
extension of a Phytophthora cinnamomi front in Banksia woodland, even after fire.
Australasian Plant Pathology Volume 33, Issue 2, 2004, Pages 249-254
Spector I, Shochet NR, Basberg D, & Kashman Y; 1989; Latrunculins – novel
marine macrolides that disrupt microfilament organisation and affect cell growth: I.
Comparison with cytochalasin D. Cell Motil. Cytoskel. 13. 127-144
Sun Y, Qian H, Xu X, Han Y, Yen L and Sun D; 2000; Integrin-Like Proteins in the
Pollen Tube: Detection, Localization and Function. Plant Cell Physiol. 41(10): 1136–1142
Swatzell, L.J., Edelmann, R.E., MakaroV, C.A., Kiss, J.Z.; 1999; Integrin like
proteins are localized to plasma membrane fractions, not plastids, in Arabidopsis. Plant
108
Cell Physiol. 40, 173–183.
Torralba S, Raudaskoski M, Pedregosa AM, and Laborda F; 1998; Effect of
cytochalasin A on apical growth, actin cytoskeleton organisation and enzyme secrection
in Aspergillus nidulans. Microbiology 144, 45-53
Treves S., Di Virgilio F., Vaselli G.M., and Pozzan T.; 1987; Effect of cytochalasins
in cytosolic-free calcium concentration and phosphoinositide metabolism in leukocytes.
Exp. Cell Res. 168, 285-298
Tyler B; 2001; Genetics and genomics of the oomycete–host interface. TRENDS in
Genetics Vol.17 No.11
Utsugi T, Minemura M, Hirata A, Abe M, Watanabe D, Ohya Y; 2002; Movement
of yeast 1,3-beta-glucan synthase is essential for uniform cell wall synthesise, Genes
Cells 7: 1-9
Vorobiev S., Strokopytov B.,Drubin† D., Frieden C., Ono S., Condeelis J.,
Rubenstein P., and Almo S.; 2003; The structure of nonvertebrate actin: Implications
for the ATP hydrolytic mechanism
Wakatsuki T., Schwab B.,Thompson N., and Elson E.; 2000; Effects of
cytochalasin D and latrunculin B on mechanical properties of cells. Journal of Cell
Science 114, 1025-1036
Walker S.K., Chitcholtan K., Yu T., Christenhusz G., Garrill A.; 2006; Invasive
hyphal growth: An F-actin depleted zone is associated with invasive hyphae of the
oomycetes Achlya bisexualis and Phytophthora cinnamomi
Walker S, Garrill A; 2006: Actin microfilaments in fungi. Mycologist 20, 26-31
Weste, G.; 2003; The dieback cycle in Victorian forests: A 30-year study of changes
109

caused by Phytophthora cinnamomi in Victorian open forests, woodlands and
heathlands. Australasian Plant Pathology, 32 (2), pp. 247-256.
Wills, R.T.; 1992; Stirling Range National Park, Western Australia. Aust. J. Ecol., 17, pp.
145-159.
Winter D, Podtelejnikov A, Mann M, Li R; 1997; The complex containing actin
related proteins Arp2 and Arp3 is required for the motility of yeast actin patches.
Current Biology 7: 519-529
Wozniak MA, Modzelewska K, Kwong L, and Keely PJ. ; 2004; Focal adhesion
regulation of cell behavior. Biochem Biophys Acta. 1692:103-119.
Xiong JP, Stehle T, Diefenbach B, Zhang R, Dunker R, Scott DL, Joachimiak A,
Goodman SL, Arnaout MA.; 2001; Crystal structure of the extracellular segment of
integrin alpha Vbeta3. Science. 2001 Oct 12;294(5541):339-45. Epub 2001 Sep 06.
Xiong JP, Stehle T, Zhang R, Joachimiak A, Frech M, Goodman SL, Arnaout MA.;
2002; Crystal structure of the extracellular segment of integrin alpha Vbeta3 in
complex with an Arg-Gly-Asp ligand. Science. 2002 Apr 5;296(5565):151-5.
Young M., Cooper J., and Bridgman P.; 2004; Yeast actin patches are networks of
branched actin filaments. The Journal of Cell Biology, Volume 166, Number 5,
Yu, Y.-P., Jackson, S.L., Garrill, A.; 2004; Two distinct distributions of F-actin are
present in the hyphal apex of the oomycete Achlya bisexualis. Plant Cell Physiol. 45,
275–280.
Zentmyer, G.A.; 1980; Phytophthora Cinnamomi and the Diseases It Causes. St Paul,
MN: The American Phytopathological Society
110