Embed Size (px)
Citation preview

1
ECONOMIC REPORT - 2019
EY Ford Rhodes

2
ECONOMIC REPORT - 2019
Parameter FY15A FY16A FY17A FY18A10MFY19
(Actual)FY19P FY20F
GDP* (US$ Bn) 271 279 305 313 NA 280 288
GDP Growth in PKR
terms (%)4.1 4.6 5.2 5.5 NA 3.3 2.7
GDP per capita
(US$)1,514 1,529 1,630 1,652 1,497 1,333 1341
CPI** (%) 4.5 2.9 4.2 3.9 6.8 7.0 7.0
Imports (US$ Bn) 41.2 41.3 48.7 56.6 44.0 NA NA
Exports (US$ Bn) 24.1 22.0 22.0 24.8 20.1 NA NA
Fiscal Deficit (% of
GDP)5.3 4.6 5.8 6.5 5.0 5.5 N/A
CAD (% of GDP) 1.0 1.7 4.1 6.3 4.03 5 3
SBP Forex (US$ Bn) 13.5 18.1 16.1 9.7 8.7 N/A N/A
PKR to USD parity 101.408 104.404 104.779 111.209 135.789 N/A N/A
Source: SBP, MoF, World Bank, ADB
*The forecasted figure for FY20 has been calculated assuming that the GDP in US$ terms would increase as per
world bank’s forecast of 2.7% and assuming that devaluation tracks inflation
**The forecast inflation rate for FY20 is from Asian Development Bank
A: Actual P: Provisional F: Forecast
Key Economic Indicators

3
ECONOMIC REPORT - 2019
FY19 will go down as a year
of missed targets
GDP growth, exports, fiscal deficit, revenue
generation, inflation and other key indicators
were all, well off the mark. The only respite
came due to a contraction of current deficit
due to higher remittances and lower imports.
GDP grew by 3.3% against an ambitious
target of 6.3%. Exports surprisingly
contracted by 1.3% YoY despite significant
currency devaluation. Critically, revenue
generation remained flat which aggravated
the fiscal deficit. During the (Jul-Mar) period
of FY19, total revenues of the government
were 9.3% of GDP compared to 10.3% in
the same period last fiscal year. This is
troubling despite the 18% boost to revenue
collection due to higher import duties and
currency devaluation. As a consequence,
fiscal deficit for FY19 is expected to be
approx. 7.0% VS a target of 5%.
FY19 was also a year of
uncertainty
An ambitious budget for the year was
announced by the previous government,
revised by the new government and
modified again. Concessions granted to the
export related sector in the form of
subsidized energy costs and tax breaks
failed to yield results. The incumbent
government also could not calm the markets
on the issues related to external sector
vulnerabilities. While the government was
able to stop the bleeding in the forex
reserves through mobilization of support
from friendly countries, delays in finalization
of an IMF program was seen as a major
contributing factor which adversely impacted
market sentiments. As a consequence the
benchmark PSX index touched a multi year
low of 33,166 points and the market
capitalization was down almost 50% in USD
terms from its peak.
FY19 was also a year of
stabilization measures which
yielded some success
The government adopted the traditional
tools (fiscal and monetary tightening) for
curbing aggregate demand. Discount rate
increased by 575 basis points during the
year. Combined with devaluation and a slew
of regulatory duties, the current account
deficit (CAD) contracted. FY19E CAD is
~4% of GDP compared to 6.1% in FY18. In
absolute terms CAD is expected to decline
to ~USD 12.5bn compared to USD 19bn in
FY18. While fiscal tightening failed to
achieve desired results, the Public Sector
Development Program (PSDP) expenditures
were curtailed significantly and registered a
negative growth of 34% YoY. PSDP in
absolute terms declined by PKR 337bn in
the nine month period and an annualized
level of PKR 450bn.
Our analysis
=- -
Looking at the crystal ball
The government is targeting an ambitious
GDP growth of 4% for FY20 which contrasts
with a more meager 2.7% forecasted by
IMF. The government forecast is predicated
on the PSDP target of PKR 1.3trn.
Historically, the PSDP allocation is used as
a balancing number to meet the fiscal deficit
targets. Any slippage on the rather difficult
PKR 5.5trn revenue target would impact
PSDP and consequently, growth.
Much will also depend on the IMF program
negotiated by the government. While details
of the staff level agreement are yet to
emerge, it appears that IMF has insisted on
front loading various measures. Additional
taxation of around PKR 700bn and increase
in tax to GDP by 3.5% over a three year
period, reduction in primary deficit, flexible
exchange rate mechanism appear to be
some of the key conditions. Comparisons of
the likely IMF program have been made with
Egypt as a benchmark. If that indeed proves
to be the case then currency devaluation will
become a regular feature during the tenure
of the IMF program. Electricity and gas
prices will also be raised to allow for full cost
recovery and elimination of circular debt.
Exchange rate depreciation and utility price
increases will lead to a further increase in
inflation in FY20. However, inflation is
expected to moderate in the medium term
due to base effect.
Solutions to Pakistan's problems and
frequent boom bust cycles have been
evident for a while. Bridging the savings-
investments gap, increase in exports,
curtailing non productive expenditures,
reducing the losses of PSEs or outright
divesting them etc. However, the will to
implement these reforms has been lacking.
Many successive governments have
undertaken stabilization measures half
heartedly at the start of their tenure and then
resorted to fiscal profligacy when the
situation permits and certainly before a new
election. IMF programs in the past have also
been more accommodative (Pakistan's geo-
strategic importance has led to waivers on
various KPIs and the external imbalances
were not as critical).

4
ECONOMIC REPORT - 2019
Silver linings
This time around, things just might be
different. IMF's insistence on prior actions
and unavailability of 'get out of jail cards'
would mean that the structural reforms are
implemented and seen through. Greater
data availability and data mining solutions
might result in an expansion of tax base.
The growing importance of Belt and Road
Initiative (BRI) and the key position occupied
by the CPEC component within the overall
BRI would mean that FDI inflows to Pakistan
will gradually become robust. The second
phase of CPEC will see greater cooperation
in the Industrial and Agricultural sector.
Various special economic zones are also
being developed where industries from
China will relocate to Pakistan. Given the
trade tensions between US and China this
provides an opportunity to Pakistan.
However, early mover advantage vests with
economies like Vietnam and Myanmar who
will likely capitalize on the already
established industrial base and customer
relationships.
Another CPEC component which will
assume increased importance going forward
is the transit trade potential due to
development of Gwadar port and free zone.
This process might accelerate given the
geopolitical tensions in the Persian Gulf.
Exports have remained subdued during the
year, however, discussions with textile and
rice sector players reveal that their order
books have swelled up and they are
undertaking BMR. Consistent policy focus
on re-industrialization and reduction of rent
seeking opportunities (Real estate) could set
the base for a strong industrial growth
rebound.
Realization that the business of the
Government is to stay out of business and
increasing awareness of the benefits of
Public Private Partnerships along with focus
on improving ease of doing business are
some of the other areas where a different
approach will improve competitiveness of
the economy.
Services sector is expected to receive a
further boost due to tourism related
activities. Pakistan’s ranking on various
tourism related measures/surveys has
improved and combined with government
focus and improved law & order situation,
the tourism industry is expected to add to
the GDP.
+
Our analysis
5
ECONOMIC REPORT - 2019
ECONOMIC SNAPSHOT
6.5%6.2%
7.2%8.2%
9.4%8.8%
Nov-18 Dec-18 Jan-19 Feb-19 Mar-19 Apr-19
Inflation (Year-on-Year)
7.0%Average
(Jul- Apr )
~23.9 bn ~11.6 bn
Trade deficit Current account deficit Policy rate
USD USD
12.25%
The State Bank of
Pakistan (SBP), has
further increased the
policy rate by
150bps to 12.25%
effective 21th May
2019.
Remittances Foreign Exchange Reserves
Jul-Apr FY19
~17.9 bnUSD
16.416.9
16.4
14.9
14.0 14.0 13.8
14.8 14.9
17.4
15.7
Jun-18 Jul-18 Aug-18 Sep-18 Oct-18 Nov-18 Dec-18 Jan-19 Feb-19 Mar-19 Apr-19
~15.7 bnUSDApr 2019
SOCIAL INDICATORS
212 MillionPopulation
Urban Rural
36%
64%
Life Expectancy66 years
Literacy rate(percentage of adult
population)
57%
PKR 14,000 to
15,000 per month(Minimum wage rate
24.3%Current poverty rate
GDP$ ~280bn
GDP per capita – USD1,333 p.a.
FY19
~8.7 bnUSDWith SBP
Jul-Apr FY19
Jul-Apr FY19

6
ECONOMIC REPORT - 2019
MACRO-ECONOMIC HIGHLIGHTS
► Pakistan’s GDP growth tapered off – Pakistan’s economy slowed down sharply in the current fiscal year,
hitting a nine-year low at 3.3% and missing the 6.2% target by a wide margin. IMF has forecasted that the
Country’s GDP growth will slow down to 2.7% in the following fiscal year.
► Contracting current account deficit – Pakistan’s current account deficit declined to US$ 11.586 billion in
July-April FY19 as compared to US$ 15.864 billion in the same period last year showing a contraction of
26.9%. This contraction can be attributed to reduced imports and growth in workers’ remittances during the
year.
► Slight decline in trade deficit - During July-April FY19, Pakistan’s trade deficit decreased by US$ 1.879
billion to US$ 23.934 billion in the current fiscal year compared to US$ 25.813 billion in FY18.
► Widening fiscal deficit – During first nine months of FY19, consolidated fiscal indicators performance
suggests that total revenue registered zero growth over same period last year, while total expenditures
increased by 8.7% for the same period. Therefore, fiscal deficit as percent of GDP reached 5.0% as
compared 4.3% in comparable period of last year.
► Average Highlight inflation – Average CPI for the period July-March FY19 was 6.79%, compared to an
average of 3.78% for the same period last year. Devaluation of PKR against the greenback and the relative
inelasticity of Pakistani imports are major contributors to the hike inflation rate during the year.
► Pakistan’s credit rating – S&P Global Ratings lowered its credit rating for Pakistan on 4th February 2019 to
B- from B, partly due to the slow negotiations between the cash-strapped government and the IMF on a
financial support deal.
1.0 GROSS DOMESTIC PRODUCT
Current situation:
► Previously, the country achieved a GDP growth of 5.5% in
FY18 – a 13 year high. However, this growth of 5.5% was
achieved at the cost of widening macroeconomic imbalances as
manifested in a five-year high fiscal deficit and a record high
current account deficit in FY18.
► The provisional GDP growth rate for FY19 is estimated at 3.3%
on the basis of 0.9%, 1.4% and 4.7% growth in agricultural,
industrial and services sectors respectively. Each sector is
discussed in more detail below:
• Agricultural sector: The agriculture sector grew by 0.85%
compared to 3.81% last year. The crops sector has
witnessed negative growth of 4.4% during FY19 against a
positive growth of 3.83% during FY18. This is mainly due to
negative growth (-6.6% in FY19 vs 3.57% in FY18) in
important crops due to decline in production of cotton, rice
and sugarcane.
• Industrial sector: During FY19, the provisional growth in
industrial sector has been estimated at 1.40% as compared
to 5.8% growth in FY18. This is mainly because of decline in
growth to 2.06% (6.13% growth in FY18) in large scale
manufacturing sector while mining and quarrying sector has
witnessed a negative growth of 1.96% (3.04% growth in
FY18).
• Services sector: Provisional estimates has shown that the
services sector posted a growth 4.71% during FY19 against
growth of 6.43% in FY18. Wholesale and Retail Trade sector
grew at a rate of 3.11% in FY19 versus a growth of 7.51% in
FY18. Transport, Storage and Communication sector has
registered a growth of 3.34% against growth of 3.58%
achieved in FY18.
4.6
5.25.5
3.3
2.7
FY16 FY17 FY18 FY19E FY20F
Pakistan’s economic growth will slow down to2.7% in FY20: World Bank
GDP growth:
Gro
ss D
om
esti
c P
rod
uc
t
Agricultural sector Industrial sector
Services sector
GDP composition:

7
ECONOMIC REPORT - 2019
Gro
ss D
om
esti
c P
rod
uc
t1.0 GROSS DOMESTIC PRODUCT (CONT’D)
Current situation (Cont’d):
► A graph showing the historical growth rates of the three sectors
is presented on the right.
► Low economic growth during the year is primarily owed to the
measures taken by the Govt. to mitigate the current account
deficit by slowing down domestic demand.
► As the Rupee weakened against the greenback by ~30% during
the 11 months of FY19, the size of the economy has shrunk in
Dollar terms.
Forecast:
► In the current and the coming financial year, growth prospects
of Pakistan seem subdued.
► Economic growth projections are further downgraded as the
global economic recovery loses momentum amid trade
tensions, Brexit and other factors.
► The World Bank has forecasted that Pakistan’s economic
growth will slow down to 2.7% in FY20, as fiscal and monetary
policies are tightened to address macroeconomic imbalances.
► The impact of tight fiscal and monetary policies in efforts to
attain macroeconomic stability have caused a decline in the
aggregate demand.
► Reforms are needed in order to achieve sustainable growth in
Pakistan, as currently the country’s inefficient tax collection
systems and underdeveloped export sector are insufficient
drivers of growth.
Ease of doing business index: Pakistan’s DB score for 2019
increased by 2.53% to 55.31 compared to 52.78 for 2018. The
country’s ranking improved by 11 notches to 136th position, for
the first time in 15 years.
0%
1%
2%
3%
4%
5%
6%
7%
FY12 FY13 FY14 FY15 FY16 FY17 FY18
Agricultural sector Industrial sector
Services sector
TopicsChange in score
(% points)
Overall +2.53
Starting a Business +5.29
Dealing with
construction permits+0.79
Getting electricity +0.24
Registering property +4.27
Getting Credit -
Protecting minority
investors-
Paying taxes +0.63
Trading across
Borders-
Enforcing Contracts -
Resolving insolvency +14.03
100
0
73.64: China (Rank 46)
67.23: India (Rank 77)
56.71: Regional average
55.31: Pakistan (Rank 136)
41.97: Bangladesh (Rank 176)

8
ECONOMIC REPORT - 2019
Deficit (USD billion):
Sources: PBS, SBP, World Bank
Imports by commodities (USD mn):
Pakistan’s exports decreased slightly to $20.1billion, while imports were recorded at $40billion during July to April 2018-19. A ~7.3%reduction in Trade deficit during the first tenmonths of the ongoing fiscal year 2018-19
Tw
in D
efi
cit
2.0 TWIN DEFICIT
Trade deficit:
► Pakistan’s trade deficit was recorded at $23.934bn with a
~7.3% reduction during the first ten months of FY19. Exports
decreased slightly to $20.01bn during 10MFY19 compared to
US$ 20.49bn in the corresponding period of FY18. Meanwhile,
imports were recorded at $44.03bn, a contraction by ~4.9%
compared to the same period last year.
► The trade balance has remained stable during 10MFY19 as
trade deficit decreased by US$ 1.879 billion to US$ 23.934
billion in the current fiscal year compared to US$ 25.813 billion
in FY18. Imports have decreased and more worryingly so has
exports. Pakistan should concentrate its efforts towards export
led growth to effectively tackle the crises of trade deficit.
Otherwise, this stability in balance of trade will be temporary
and is likely to reverse in the future.
► The key commodities contributing to the curtailment of the trade
deficit were Furnace Oil (Mineral Products), Base Metals,
and Machinery and mechanical appliances. These are
discussed in more detail below:
• The imposition of ban on import of furnace oil has yielded
positive results as imported mineral products shown a 17%
increase in the current fiscal year compared to a growth of
30% in the same period last year.
• During 8MFY19, Iron and Steel imports witnessed a ~10%
decline on the back of the Government imposed anti-
dumping Duty (ADD) on top of already imposed regulatory
duties on finished steel products.
• A significant increase in import last year was reported in
capital goods such as steam and gas-turbines, electric
transformers, parts of auxiliary power plants and other
equipment. During 8MFY19, Machinery and Mechanical
Appliances made up ~10% of the imports, saw a 23%
reduction in import payments as CPEC moves to Phase-II.
• During the period Jul-May 2019 PKR devalued by around
30% against USD. The currency has been devalued by
~25% against USD in 2018. The impact of recent Rupee
depreciation will be witnessed in more positive results in
exports in the following months.
Current Account Deficit:
► Pakistan’s Current Account Deficit for the ongoing fiscal year
shows mitigation of almost ~27% in 10MFY19 compared to the
first ten months of FY18.
► This contraction comes on the back of a reduction in trade
deficit coupled with a notable increase in the workers
remittances.
► Workers’ remittances saw an uptick of ~8.5% compared to the
same period last year, as a result of the increased vigilance on
money laundering, crackdown on hundi/hawala and currency
devaluation. Apart from these factors, workers’ remittances has
also seen organic growth during the year.
25
,81
3
23
,93
4
20
,48
9
20
,09
9
46
,30
2
44
,03
3
10M FY18 10M FY19
Exports Imports
Source: MoF
9,4
10
5,5
40
3,0
55
1,8
88
10
,99
9
4,2
66
2,6
95
1,6
77
MineralProducts
Machinery BaseMetals
VegetableProducts
8M FY18 8M FY19
+17%
-23%
-12%
-11%
9
ECONOMIC REPORT - 2019
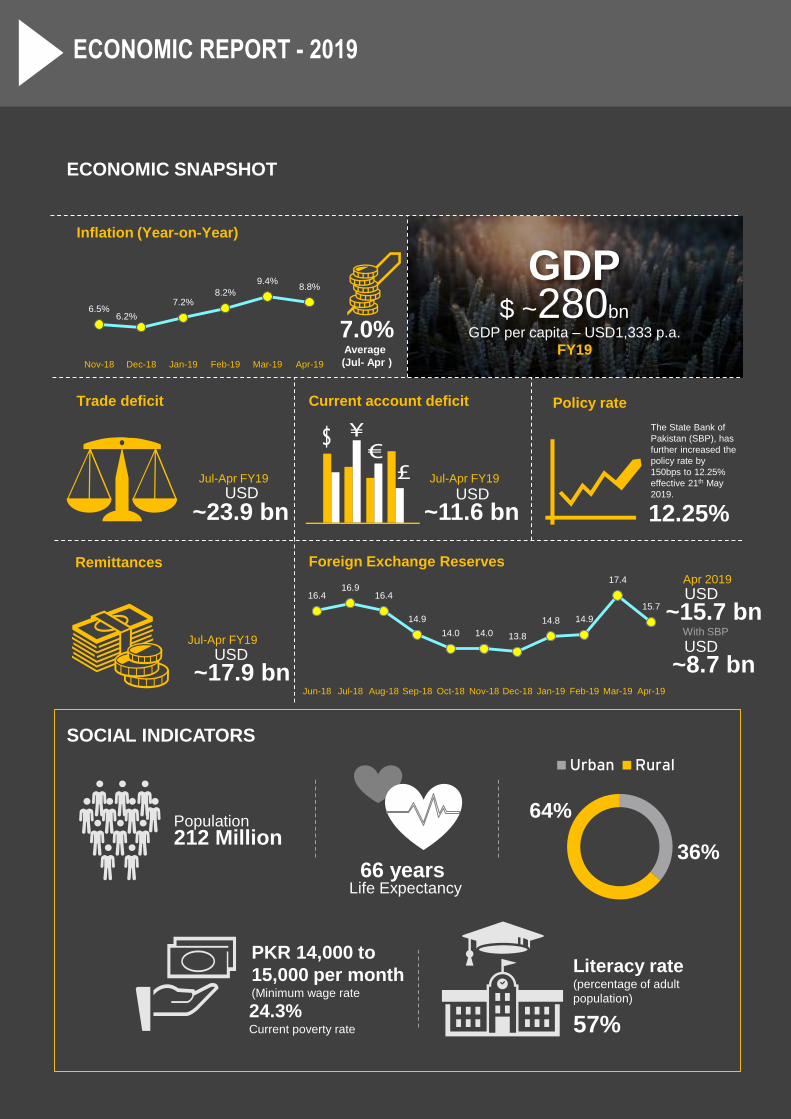
3.0 INFLATION & MONETARY POLICY
Inflationary pressure:
► Despite seeing one of the most aggressive monetary tightening
policies in Asia since 2018, the Country’s inflation rose to a five
year high of 8.8% on year-on-year basis in April 2019 as
compared to 9.4% in the previous month and 3.7% during
corresponding month of last year.
► Due to the Country’s import demand being relatively inelastic,
the recent price hike is driven by exchange-rate pass-through to
domestic prices.
► The persistence of inflation with tight monetary policy has had
sharp negative bearing on the Country’s economic growth.
Similarly, the hiking prices will have negative consequences for
employment and poverty levels.
► The economy is expected to suffer from stagflation; with
unemployment expected to rise following relatively weak
performance on the economic growth front.
Monetary Policy May 21, 2019:
► The current account deficit narrowed to US$ 9.6 billion in Jul-
Mar FY19 as compared to a deficit of US$ 13.6 billion during
the same period last year, a fall of 29%.
► Despite the improvement in the current account and a
noticeable increase in official bilateral inflows, the financing of
the current account deficit remained challenging. Consequently,
reserves declined to US$ 8.8 billion as of 10th May 2019 from
US$ 10.5 billion at end-March 2019.
► The overall fiscal deficit is likely to be considerably higher
during FY19 as compared to last year. From a monetary policy
perspective, a growing portion of the fiscal deficit has been
financed through borrowings from SBP. In absolute terms, the
government borrowed Rs 4.8 trillion from SBP during 1st Jul-
10th May FY19, which is 2.4 times the borrowing during the
same period last year.
► The consumer price index (CPI) rose 9.4% in March 2019 and
8.8% in April 2019, on a YOY basis.
► In this backdrop, the MPC had decided to increase the policy
rate to 12.25% effective 21st May 2019.
Infl
ati
on
& M
PS
Average CPI (June-July):
2.86%
4.16% 3.92%
7.00%
FY16 FY17 FY18 FY19F
The increase in prices will be driven byexchange-rate pass-through to domesticprices
Policy rate (Jul-Dec 2018):
7.50%8.50%
10%
10.25%
10.75%
12.25%
Jul-1
8
Au
g-1
8
Se
p-1
8
Oct-
18
Nov-1
8
Dec-1
8
Jan
-19
Fe
b-1
9
Ma
r-19
Ap
r-19
Ma
y-1
9
The State Bank of Pakistan has continued toincrease the policy rate; there was a 150basis points increase to 12.25% effective 21May 2019
Monthly Y-on-Y CPI:
0%
2%
4%
6%
8%
10%
12%
Jul-1
8
Au
g-1
8
Se
p-1
8
Oct-
18
Nov-1
8
Dec-1
8
Jan
-19
Fe
b-1
9
Ma
r-19
Ap
r-19
General Food Non-food
Late in May this year, the government had reached a staff-level agreement with the International Monetary Fund for a loan of $6 billion over a period of 39 months.
“
”State Bank of Pakistan
Source: SBP

10
ECONOMIC REPORT - 2019
4.0 CURRENCY
PKR/Dollar:
► During the period Jul-June 2018/2019 PKR devalued by around
~30% against USD. There came a point that the Rupee
dropped to an all-time low of 154 to the US dollar in the inter-
bank market.
► Earlier, the rupee had broken its record low against the US
dollar to reach Rs154 in the open market and Rs153.5 in the
interbank market on May 21. However, during the last week of
May, the PKR regained Rs1.42 in its value against the
greenback, bouncing back from State Bank of Pakistan’s mid-
rate of Rs150.90 to Rs149.53 in the interbank market.
► During the month of Ramadan, the USD dollar reached certain
stability. However, since the end of the festive season the USD
has risen again and it is speculated that it will increase even
further.
► Consensus of market participants is that PKR will continue to
depreciate till June 2019, leaving the exchange rate at 160-165
PKR/USD. The measure which most accurately tracks currency
over/under valuation is REER which indicates a stable level at
PKR/USD of 155.
Insight
► Currency devaluation was inevitable because of several
reasons including increased CAD, debt servicing, and lower
FDI which led to decreased foreign exchange reserves and an
artificial cap on the value of dollar. These policies lead to a
record high of twin deficits.
► In a bid to curtail imbalance in the external account and sustain
higher growth trajectory, SBP devalued the Rupee.
► As the artificial control was removed, PKR/USD exchange rate,
during the period, represented true value of the currency.
► Following this value, the exchange rate is expected to stabilize
as the high policy rate by the SBP is set to attract increased
foreign investment, therefore improving the demand for PKR.
However, to achieve this effect SBP has to introduce policies to
maintain a balance of rising inflation and the policy rate.
► The IMF wants a free float exchange rate with zero intervention
from SBP.
► Pakistan may face a J-curve effect, whereby the depreciating
currency will initially reduce the balance of trade, but will lead to
an upswing in the future as the country’s export capacity is not
being fully utilized. This, to an extent, is similar to the value of
exports during 2012-14 when it was around 14% higher than in
FY18.
PKR/Dollar:
The frequent depreciation in USD highly affects the business opportunities and cost of doing business
Sources: SBP, PBS, Brecorder, EY analysis
Cu
rre
ncy
1%
0%
0%
-1%
-1%
-2%
-2%
-2%
-4%
-5%
-6%
-9%
-15%
-16%
-18%
-21%
-28%
-51%
Currency performance:
Ke
nya
Th
aila
nd
UA
E
Eg
ypt
Nig
eria
Vie
tnam
ma
laysia
Mo
rocco
S.K
ore
a
Ph
ilippin
es
Indonesia
India
Bra
zil
Sri L
anka
Tu
nis
ia
Pa
kis
tan
Tu
rkey
Arg
entin
a
Rupee depreciated by 20%+ vs. the US$ in2018, one of the highest among peers. Withrebuilding of FX reserves underway, furtherPKR slippage is likely to be modest in ourview.
129
123
125
133
134
140
139
140
141
142
147
151.
7-5%
1%
7%
1%
4%
-1%
1% 1% 1%
4%3%
-6%
-4%
-2%
0%
2%
4%
6%
8%
0
20
40
60
80
100
120
140
160
Jul-1
8
Aug
-18
Sep
-18
Oct
-18
Nov
-18
Dec
-18
Jan-
19
Feb
-19
Mar
-19
Apr
-19
May
-19
Jun-
19
It is forecasted that the Rupee will furtherdepreciate in the coming days, due to macroeconomic factors and instability.

11
ECONOMIC REPORT - 2019
5.0 FOREIGN DIRECT INVESTMENT (FDI)
Current situation:
► Foreign investment is on a downward trajectory. It dropped by
51.7% in July-April FY19 to USD 1.376 billion as compared to
USD 2.849 billion in July-April FY18.
► FDI from China reduced to 31.2% of overall inflows as
compared to 60.5% in the preceding year. This is mainly due to
completion of early harvest project under the CPEC.
► However, China continued to dominate direct investment
followed by UK and Hongkong. A significant decline in
investment from Malaysia has been observed in this period.
► In terms of sectors, construction sector substituted the power
sector in attracting highest net FDI of US $ 386.8 million this
was followed by oil and gas exploration US $ 287.3 million and
financial business US $ 256.5 million.
Forecast:
► For the enhancement of FDI, the government has under taken
different initiatives at the international level. Few of these
initiatives have been listed below:
► Pakistan has recently signed offshore Gas Pipeline
deal with Russia.
► Saudi Arab has shown interest to invest in a new oil
refinery in Pakistan's growing deep-sea port of Gwadar.
► Pakistan has the potential for mineral mining which can
be leveraged to attract FDI.
► However to formalize the aforementioned, the Govt. needs to
formulate reforms to ease foreign investment in Pakistan.
Net FDI (USD/Million):
The lead route to attract investments is through construction of the Special Economic Zones (SEZs) and we are welcoming investments from multiple countries for these zones
“
”
Sources: SBP, PBS, Brecorder, EY analysis
Fo
reig
n D
ire
ct
Inve
stm
en
t
Non-Sino Net FDI (Jul-Dec FY19):
An inconsistent trend can be noted withrespect to the Net FDI in Pakistan.
132.9
113.2
72.0
16.2
1.8
15.1
116.0
54.0
49.2
3.9
Ma
laysia
UK
US
A
UA
E
KS
A
FY18 (Jul-Dec) FY19 (Jul-Dec)
- Haroon Sharif, Chairman of the Board of Investment (BoI)
321
179 198
182 161
280
319
132
168
0
50
100
150
200
250
300
350
2,832
1,977
2,496
5,681
0
1,000
2,000
3,000
4,000
5,000
6,000
2015 2016 2017 2018
Total foreign investments (USD m):

12
ECONOMIC REPORT - 2019
Worker’s remittances:
Sources: SBP, PBS, Brecorder, EY analysis
Annual remittance growth (%):
Re
mit
tan
ces
6.0 REMITTANCES
Current:
► Remittances have always been a significant source of balance
of payment support. Remittances registered a substantial
growth of 8.5% during July-April FY19 as compared to growth
of 5.36% during the same corresponding period last year.
► In dollar terms, remittances stood at US$ 17.875 billion during
first ten months of current fiscal year against US$ 16.482 billion
during the same period last year.
► Remittances during July-April FY19 declined by 9.28% from EU
countries and 5.40% from other GCC countries.
► However, a marginal increase in remittances has been
observed from Saudi Arabia, 2.08% as compared to 9.5%
decline in the same periods last year.
► A strong increase from USA and UK provided a major push to
inflows. Remittances increased by 21.82% and 16.59% from
USA and UK respectively.
► Malaysia has been facing workforce shortage in labor-intensive
sectors, such as manufacturing, construction an agriculture. To
address the problem, Malaysia raised the wages for both local
and foreign workers in its minimum wage policy of 2013.
Following this, the number of Pakistanis going to Malaysia for
work has been rising since 2014-15, leading to increase in
remittances from the country.
Forecast:
► Foreign remittances are likely to be stable in the coming years
on the back of rising interest rates and increased employment
opportunities in Qatar due to FIFA 2022, among others
contributing factors.
► The current Govt. is also making efforts to incentivize
channeling of remittances through legal means, and has
already allowed SBP and its authorized dealers to implement
B2C and C2B transactions through foreign correspondent
entities under their existing home remittance agency
agreements.
► Pakistan Post is partnering with National Bank to join Pakistan
Remittance Initiative (PRI) for the delivery of international
remittances through post offices. Under PRI, the oversees
workers will be able send their remittances free of services
charges.
► OPSCs has been designed as a product by CDNS to be
launched for Overseas Pakistanis only. This will provide an
investment avenue for foreign Pakistanis and also curb the
remittance of money through illegal channels. It will be
launched initially in the GCC market and then other countries.
► The Government is further taking measures to improve the
inflow of remittances via media awareness, M-Wallet scheme,
remittance summit, reduction in visa fee for GCC countries.
It is expected that the measures undertaken by the Government will help improve the inflow of remittance to a certain degree
Country-wise remittances (%):
23%
21%
16%
15%
10%
7%3%5%
KSA UAE
USA UK
Other GCC countries Malaysia
EU Other countries
6.40%
-2.80%
2.90%
8.70%
-4.00%
-2.00%
0.00%
2.00%
4.00%
6.00%
8.00%
10.00%
2015-2016 2016-2017 2017-2018 2018-2019
19,351 19,914
16,482
17,875
2016-2017 2017-2018 2017-2018 2018-19P
July-June July-April

13
ECONOMIC REPORT - 2019
KS
E-1
00
7.0 KSE-100 index
► The PSX index gained strength in July 2018, reaching 43,556 points, however there onwards a falling trend
has led the index reaching its lowest at 35,974 points on May 2019.
► This downfall is mainly because of withdrawal of foreign investors from the market due to the following
factors:
► Reduction in returns due to currency devaluation;
► Negative outlook of the economy which led to increase in risk associated with equity investment in
Pakistan.
► The turnover of shares on the Pakistan Stock Exchange during July-April 2018-19 was 42.9 billion,
compared to 46.5 billion shares in the twelve months of fiscal year 2017-18. Total paid-up capital with the
PSX increased from Rs 1,297.4 billion in June 2018 to Rs 1,336.7 billion in April 2019.
Fin
an
ce S
up
ple
me
nta
ry
Bil
l, 2
019
43,556
41,74240,999
41,716
40,496
37,067
40,799
39,05438,649
36,784
35,974
Jul 18 Aug 18 Sep 18 Oct 18 Nov 18 Dec 18 Jan 19 Feb 19 Mar 19 Apr 19 May 19
8.0 THIRD FINANCE BILL FY19
Salient features:
► Tax relief granted by PML-N revoked from salaried persons earning more than Rs200,000 per month; tax
rates still lower than last year.
► Tax rate in highest income tax slab raised from 15% to 30%.
► Increased federal excise duty on imports of luxury vehicles and duties on 'expensive' cell phones.
► Customs duty increased on more than 5,000 'luxury' items. Regulatory duty increased on import of more
than 900 items.
► Rate of withholding tax on banking transactions for non-tax filers increased to 0.6%.
► Doubled the federal excise duty on cars of 1800cc engine capacity or more from 10% to 20%.
► The maximum tax rate will be 25% for salaried persons and 30% for non-salaried persons.

14
ECONOMIC REPORT - 2019
Re
ce
nt
deve
lop
me
nts
DEVELOPMENTS SHAPING THE ECONOMY
Saudi Arabia in October stepped forward with a $6 billion
bailout package for Pakistan’s ailing economy.
“Saudi Arabia pledges $6bn package to
Pakistan”Oct2018
$
The IMF team have reached a staff level agreement on
economic policies that could be supported by a 39-month
Extended Fund Arrangement (EFF) for about US$6 billion
May2019
Saudi Arabia in October stepped forward with a $6 billion
bailout package for Pakistan’s ailing economy
“Saudi crown prince begins Asia tour with $20
billion Pakistan investment pledge”Feb2019
Interloop Limited raised Rs.5.032b at the PSX by selling
12.5% of its shareholding. This has been the largest ever
Equity raising activity in the private sector in the history of
PSX.
“Interloop raises Rs5.032b from investors at
Pakistan Stock Exchange”
Prime Minister Imran Khan on Wednesday launched Naya
Pakistan Housing Scheme to construct 141,000 houses
across the country for the uplift of the poor strata of the
society and to bring them into the national mainstream.
“Imran launches ‘Naya Pakistan Housing
Scheme’”
Mar2019
Apr2019
Deferred payments of $3.2 billion Saudi oil and gas facility
will become operational from July this year. This is expected
to relieve the pressure from on external payments..
“Saudi Arabia to give Pakistan $3.2b oil on
deferred payments from July”
“IMF Reaches Staff-Level Agreement on
Economic Policies with Pakistan”
May2019
15
EY Ford RhodesECONOMIC REPORT - 2019
“There can be economy only where there is
efficiency.”
- Benjamin Disraeli
EY | Assurance | Tax | Transactions | Advisory
About EY
EY is a global leader in assurance, tax, transaction and advisory services. The insights and
quality services we deliver help build trust and confidence in the capital markets and in
economies the world over. We develop outstanding leaders who team to deliver on our
promises to all of our stakeholders. In so doing, we play a critical role in building a better
working world for our people, for our clients and for our communities.
EY refers to the global organization, and may refer to one or more, of the member firms of
Ernst & Young Global Limited, each of which is a separate legal entity. Ernst & Young
Global Limited, a UK company limited by guarantee, does not provide services to clients.
For more information about our organization, please visit ey.com.
The Pakistan firm EY Ford Rhodes is legally an independent Partnership Firm, registered
under the Law of Partnership as applicable in Pakistan and is a member firm of Ernst &
Young Global Limited
© 2019 EYFR
All Rights Reserved.
ey.com