Embed Size (px)
Citation preview
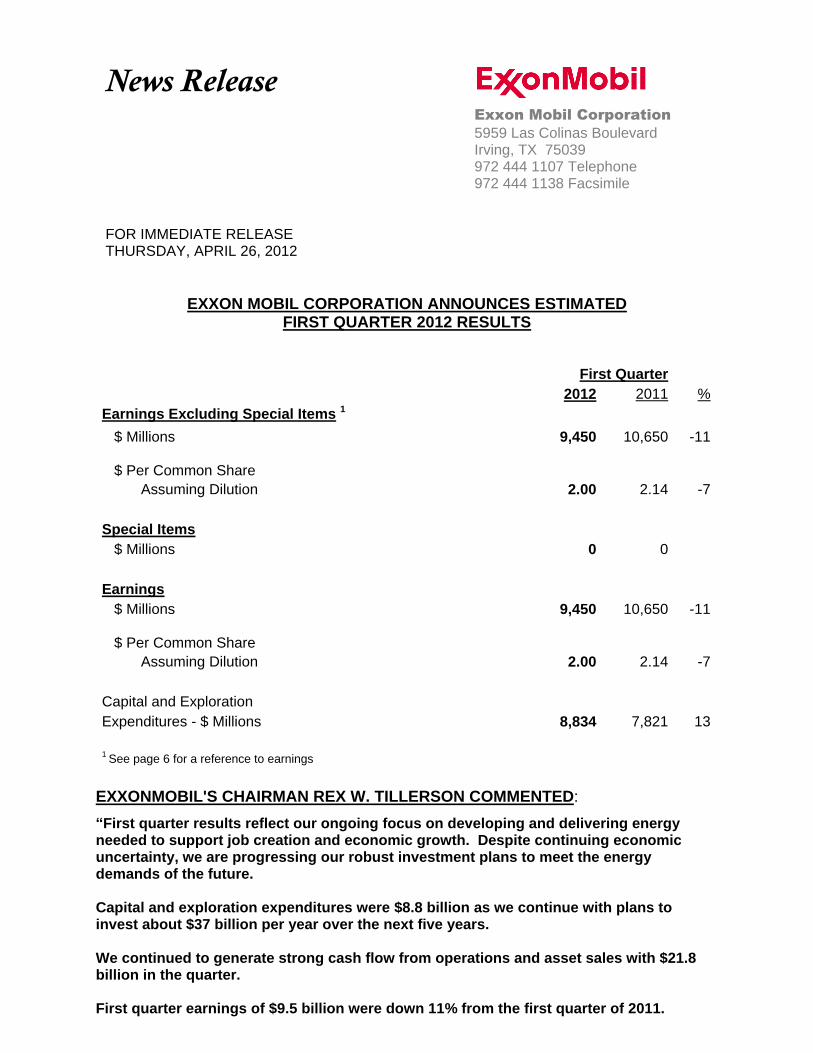
News Release Exxon Mobil Corporation
5959 Las Colinas Boulevard Irving, TX 75039 972 444 1107 Telephone 972 444 1138 Facsimile FOR IMMEDIATE RELEASE THURSDAY, APRIL 26, 2012
EXXON MOBIL CORPORATION ANNOUNCES ESTIMATED
FIRST QUARTER 2012 RESULTS
First Quarter
First Quarter
2012 2011 % 2012 2011 %
Earnings Excluding Special Items 1
$ Millions 9,450 10,650 -11
9,450 10,650 -11
$ Per Common Share
Assuming Dilution 2.00 2.14 -7 2.00 2.14 -7
Special Items
$ Millions 0 0 0 0
Earnings
$ Millions 9,450 10,650 -11
9,450 10,650 -11
$ Per Common Share
Assuming Dilution 2.00 2.14 -7 2.00 2.14 -7
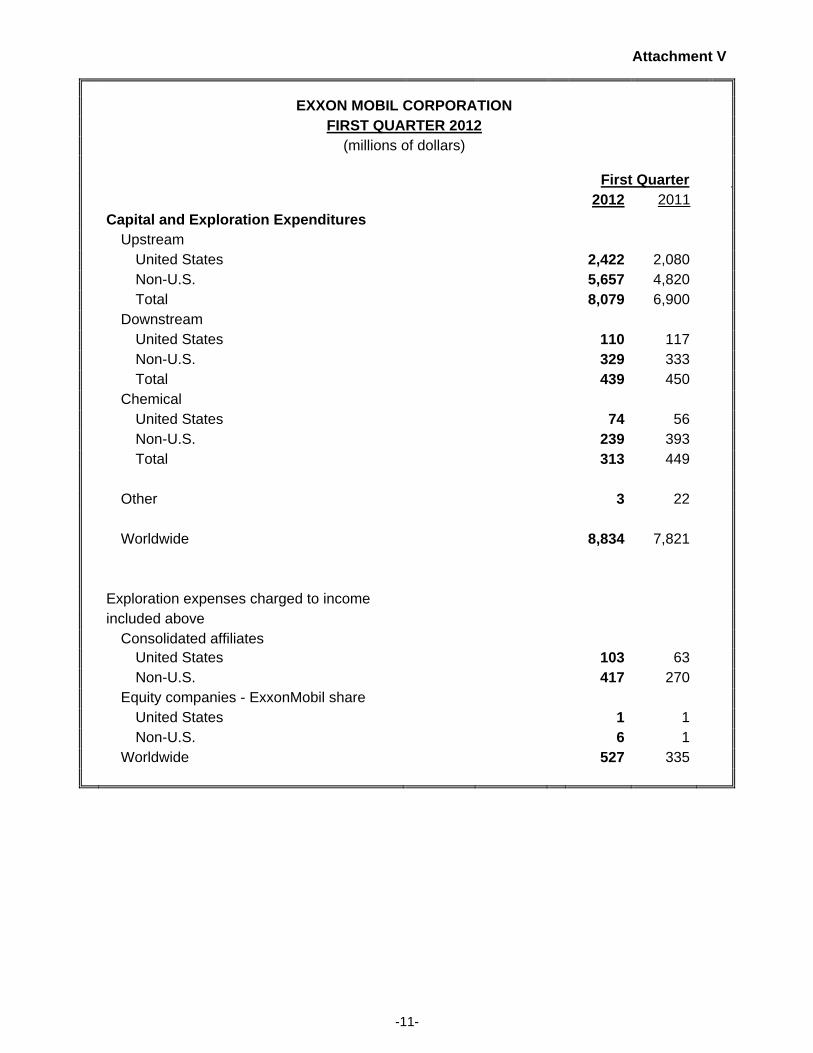
Capital and Exploration
Expenditures - $ Millions 8,834 7,821 13 8,834 7,821 13
1
See page 6 for a reference to earnings
EXXONMOBIL'S CHAIRMAN REX W. TILLERSON COMMENTED:
“First quarter results reflect our ongoing focus on developing and delivering energy needed to support job creation and economic growth. Despite continuing economic uncertainty, we are progressing our robust investment plans to meet the energy demands of the future. Capital and exploration expenditures were $8.8 billion as we continue with plans to invest about $37 billion per year over the next five years. We continued to generate strong cash flow from operations and asset sales with $21.8 billion in the quarter. First quarter earnings of $9.5 billion were down 11% from the first quarter of 2011.
-2-
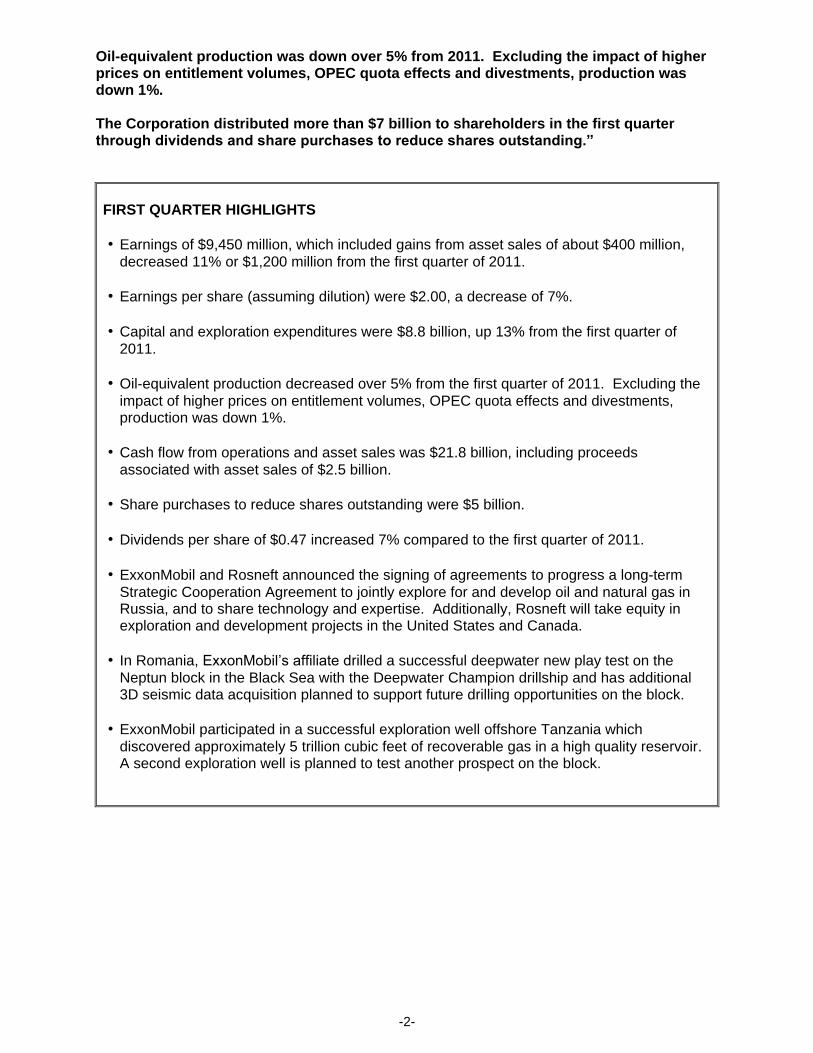
Oil-equivalent production was down over 5% from 2011. Excluding the impact of higher prices on entitlement volumes, OPEC quota effects and divestments, production was down 1%. The Corporation distributed more than $7 billion to shareholders in the first quarter through dividends and share purchases to reduce shares outstanding.”
FIRST QUARTER HIGHLIGHTS
• Earnings of $9,450 million, which included gains from asset sales of about $400 million,
decreased 11% or $1,200 million from the first quarter of 2011.
• Earnings per share (assuming dilution) were $2.00, a decrease of 7%.
• Capital and exploration expenditures were $8.8 billion, up 13% from the first quarter of
2011.
• Oil-equivalent production decreased over 5% from the first quarter of 2011. Excluding the
impact of higher prices on entitlement volumes, OPEC quota effects and divestments, production was down 1%.
• Cash flow from operations and asset sales was $21.8 billion, including proceeds
associated with asset sales of $2.5 billion.
• Share purchases to reduce shares outstanding were $5 billion.
• Dividends per share of $0.47 increased 7% compared to the first quarter of 2011.
• ExxonMobil and Rosneft announced the signing of agreements to progress a long-term
Strategic Cooperation Agreement to jointly explore for and develop oil and natural gas in Russia, and to share technology and expertise. Additionally, Rosneft will take equity in exploration and development projects in the United States and Canada.
• In Romania, ExxonMobil’s affiliate drilled a successful deepwater new play test on the
Neptun block in the Black Sea with the Deepwater Champion drillship and has additional 3D seismic data acquisition planned to support future drilling opportunities on the block.
• ExxonMobil participated in a successful exploration well offshore Tanzania which
discovered approximately 5 trillion cubic feet of recoverable gas in a high quality reservoir. A second exploration well is planned to test another prospect on the block.
-3-
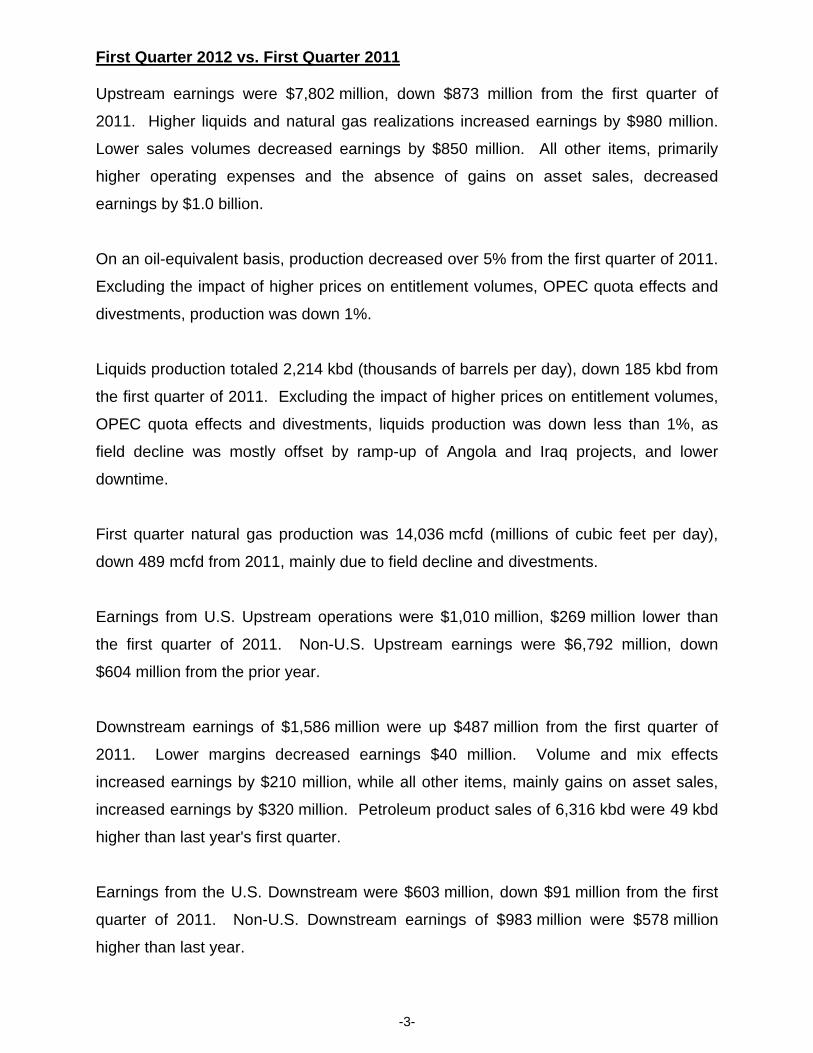
First Quarter 2012 vs. First Quarter 2011
Upstream earnings were $7,802 million, down $873 million from the first quarter of
2011. Higher liquids and natural gas realizations increased earnings by $980 million.
Lower sales volumes decreased earnings by $850 million. All other items, primarily
higher operating expenses and the absence of gains on asset sales, decreased
earnings by $1.0 billion.
On an oil-equivalent basis, production decreased over 5% from the first quarter of 2011.
Excluding the impact of higher prices on entitlement volumes, OPEC quota effects and
divestments, production was down 1%.
Liquids production totaled 2,214 kbd (thousands of barrels per day), down 185 kbd from
the first quarter of 2011. Excluding the impact of higher prices on entitlement volumes,
OPEC quota effects and divestments, liquids production was down less than 1%, as
field decline was mostly offset by ramp-up of Angola and Iraq projects, and lower
downtime.
First quarter natural gas production was 14,036 mcfd (millions of cubic feet per day),
down 489 mcfd from 2011, mainly due to field decline and divestments.
Earnings from U.S. Upstream operations were $1,010 million, $269 million lower than
the first quarter of 2011. Non-U.S. Upstream earnings were $6,792 million, down
$604 million from the prior year.
Downstream earnings of $1,586 million were up $487 million from the first quarter of
2011. Lower margins decreased earnings $40 million. Volume and mix effects
increased earnings by $210 million, while all other items, mainly gains on asset sales,
increased earnings by $320 million. Petroleum product sales of 6,316 kbd were 49 kbd
higher than last year's first quarter.
Earnings from the U.S. Downstream were $603 million, down $91 million from the first
quarter of 2011. Non-U.S. Downstream earnings of $983 million were $578 million
higher than last year.

-4-
Chemical earnings of $701 million were $815 million lower than the first quarter of 2011.
Weaker margins decreased earnings by $520 million. Other items, including higher
planned maintenance and the absence of favorable tax items, decreased earnings by
$300 million. First quarter prime product sales of 6,337 kt (thousands of metric tons)
were 15 kt higher than last year's first quarter.
Corporate and financing expenses were $639 million, consistent with the prior year.
During the first quarter of 2012, Exxon Mobil Corporation purchased 66 million shares of
its common stock for the treasury at a gross cost of $5.7 billion. These purchases
included $5 billion to reduce the number of shares outstanding, with the balance used to
acquire shares in conjunction with the company's benefit plans and programs. Share
purchases to reduce shares outstanding are currently anticipated to equal $5 billion in
the second quarter of 2012. Purchases may be made in both the open market and
through negotiated transactions, and may be increased, decreased or discontinued at
any time without prior notice.
Estimates of key financial and operating data follow.

-5-
ExxonMobil will discuss financial and operating results and other matters on a
webcast at 10 a.m. Central time on April 26, 2012. To listen to the event live or in
archive, go to our website at exxonmobil.com.
Cautionary statement
Statements relating to future plans, projections, events or conditions are forward-looking
statements. Actual results, including project plans, costs, timing, and capacities; capital and
exploration expenditures; resource recoveries; and share purchase levels, could differ materially
due to factors including: changes in oil or gas prices or other market or economic conditions
affecting the oil and gas industry, including the scope and duration of economic recessions; the
outcome of exploration and development efforts; changes in law or government regulation,
including tax and environmental requirements; the outcome of commercial negotiations;
changes in technical or operating conditions; and other factors discussed under the heading
"Factors Affecting Future Results" in the “Investors” section of our website and in Item 1A of
ExxonMobil's 2011 Form 10-K. We assume no duty to update these statements as of any
future date. References to quantities of oil or natural gas may include amounts that we believe
will ultimately be produced, but that are not yet classified as “proved reserves” under SEC
definitions.
Frequently used terms
Consistent with previous practice, this press release includes both earnings excluding special
items and earnings per share excluding special items. Both are non-GAAP financial measures
and are included to help facilitate comparisons of base business performance across periods.
Reconciliation to net income attributable to ExxonMobil is shown in Attachment II. The release
also includes cash flow from operations and asset sales. Because of the regular nature of our
asset management and divestment program, we believe it is useful for investors to consider
proceeds associated with the sales of subsidiaries, property, plant and equipment, and sales
and returns of investments together with cash provided by operating activities when evaluating
cash available for investment in the business and financing activities. A reconciliation to net
cash provided by operating activities is shown in Attachment II. Further information on
ExxonMobil's frequently used financial and operating measures and other terms is contained
under the heading "Frequently Used Terms" available through the “investors” section of our
website at exxonmobil.com.

-6-
Reference to Earnings
References to total corporate earnings mean net income attributable to ExxonMobil (U.S.
GAAP) from the income statement. Unless otherwise indicated, references to earnings, special
items, earnings excluding special items, Upstream, Downstream, Chemical and Corporate and
Financing segment earnings, and earnings per share are ExxonMobil's share after excluding
amounts attributable to noncontrolling interests.
-7-
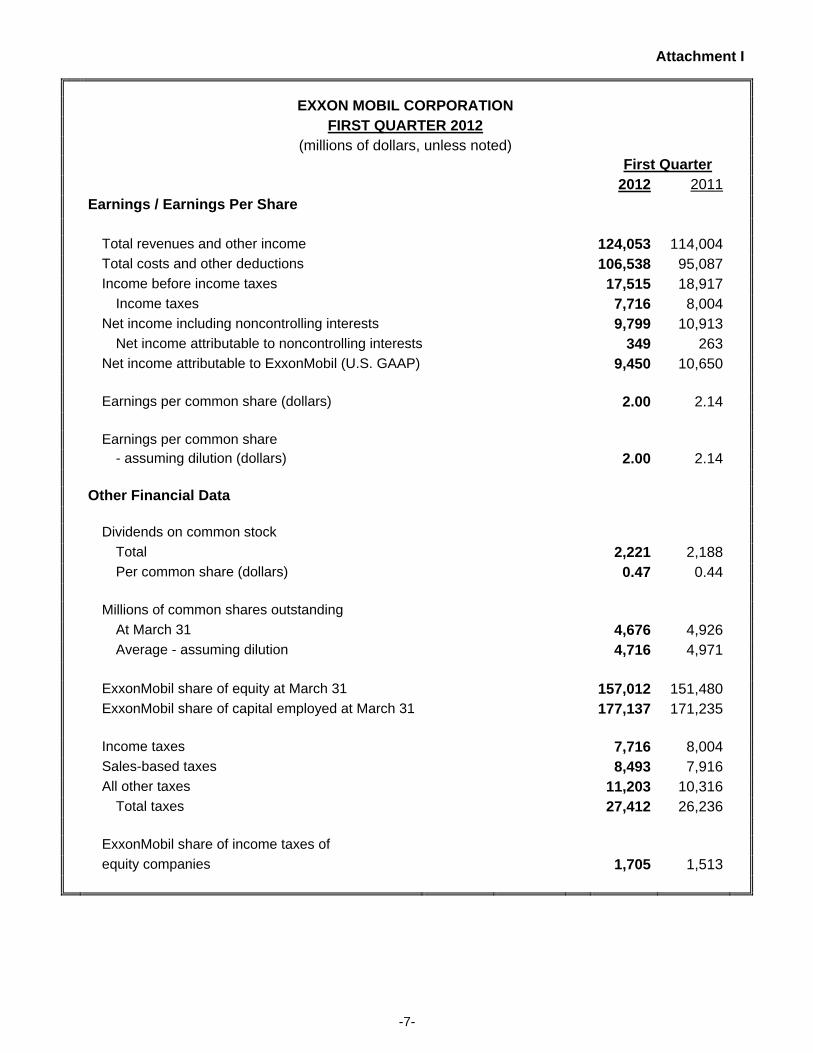
Attachment I
EXXON MOBIL CORPORATION
FIRST QUARTER 2012
(millions of dollars, unless noted)
First Quarter First Quarter
2012 2011 2012 2011
Earnings / Earnings Per Share
Total revenues and other income 124,053 114,004 124,053 114,004
Total costs and other deductions 106,538 95,087 106,538 95,087
Income before income taxes 17,515 18,917 17,515 18,917
Income taxes 7,716 8,004 7,716 8,004
Net income including noncontrolling interests 9,799 10,913 9,799 10,913
Net income attributable to noncontrolling interests 349 263 349 263
Net income attributable to ExxonMobil (U.S. GAAP) 9,450 10,650 9,450 10,650
Earnings per common share (dollars) 2.00 2.14 2.00 2.14
Earnings per common share
- assuming dilution (dollars) 2.00 2.14 2.00 2.14
Other Financial Data
Dividends on common stock
Total 2,221 2,188 2,221 2,188
Per common share (dollars) 0.47 0.44 0.47 0.44
Millions of common shares outstanding
At March 31 4,676 4,926
Average - assuming dilution
4,716 4,971 4,716 4,971
ExxonMobil share of equity at March 31 157,012 151,480
ExxonMobil share of capital employed at March 31 177,137 171,235
Income taxes 7,716 8,004 7,716 8,004
Sales-based taxes 8,493 7,916 8,493 7,916
All other taxes 11,203 10,316 11,203 10,316
Total taxes 27,412 26,236 27,412 26,236
ExxonMobil share of income taxes of
equity companies 1,705 1,513
1,705 1,513
-8-
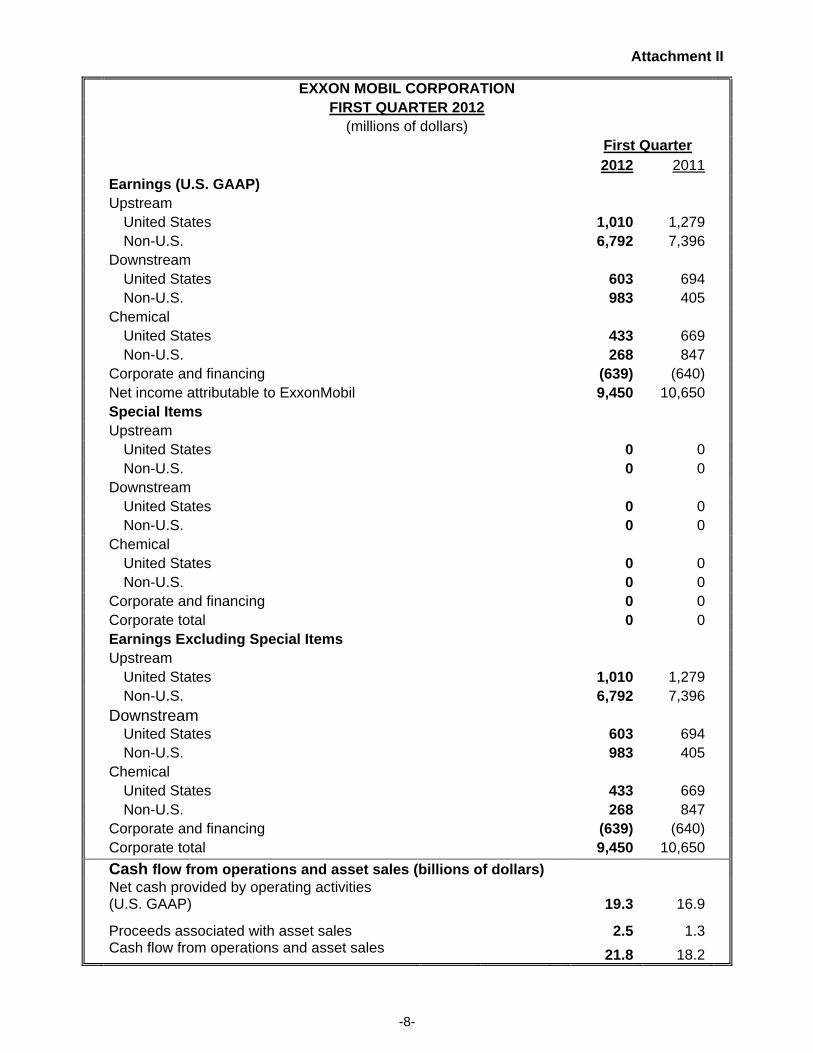
Attachment II
EXXON MOBIL CORPORATION
FIRST QUARTER 2012
(millions of dollars)
First Quarter First Quarter
2012 2011 2012 2011
Earnings (U.S. GAAP)
Upstream
United States 1,010 1,279 1,010 1,279
Non-U.S. 6,792 7,396 6,792 7,396
Downstream
United States 603 694 603 694
Non-U.S. 983 405 983 405
Chemical
United States 433 669 433 669
Non-U.S. 268 847 268 847
Corporate and financing (639) (640) (639) (640)
Net income attributable to ExxonMobil 9,450 10,650 9,450 10,650
Special Items
Upstream
United States 0 0 0 0
Non-U.S. 0 0 0 0
Downstream
United States 0 0 0 0
Non-U.S. 0 0 0 0
Chemical
United States 0 0 0 0
Non-U.S. 0 0 0 0
Corporate and financing 0 0 0 0
Corporate total 0 0 0 0
Earnings Excluding Special Items
Upstream
United States 1,010 1,279 1,010 1,279
Non-U.S. 6,792 7,396 6,792 7,396
Downstream
United States 603 694 603 694
Non-U.S. 983 405 983 405
Chemical
United States 433 669 433 669
Non-U.S. 268 847 268 847
Corporate and financing (639) (640) (639) (640)
Corporate total 9,450 10,650 9,450 10,650
Cash flow from operations and asset sales (billions of dollars)
Net cash provided by operating activities (U.S. GAAP) 19.3 16.9
19.3 16.9
Proceeds associated with asset sales 2.5 1.3
2.5 1.3
Cash flow from operations and asset sales
21.8 18.2
21.8 18.2

-9-
Attachment III
EXXON MOBIL CORPORATION
FIRST QUARTER 2012
First Quarter First Quarter
2012 2011 2012 2011
Net production of crude oil
and natural gas liquids,
thousands of barrels daily (kbd)
United States 426 428 426 428
Canada/South America 248 262 248 262
Europe 228 306 228 306
Africa 464 561 464 561
Asia 802 792 802 792
Australia/Oceania 46 50 46 50
Worldwide 2,214 2,399 2,214 2,399
Natural gas production available for sale,
millions of cubic feet daily (mcfd)
United States 3,932 3,904 3,932 3,904
Canada/South America 377 468 377 468
Europe 4,447 4,783 4,447 4,783
Africa 12 6 12 6
Asia 5,011 5,089 5,011 5,089
Australia/Oceania 257 275 257 275
Worldwide 14,036 14,525 14,036 14,525
Oil-equivalent production (koebd) 1 4,553 4,820 4,553 4,820
1 Gas converted to oil-equivalent at 6 million cubic feet = 1 thousand barrels

-10-
Attachment IV
EXXON MOBIL CORPORATION
FIRST QUARTER 2012
First Quarter First Quarter
2012 2011 2012 2011
Refinery throughput (kbd)
United States 1,825 1,771 1,825 1,771
Canada 438 452 438 452
Europe 1,481 1,446 1,481 1,446
Asia Pacific 1,296 1,223 1,296 1,223
Other 290 288 290 288
Worldwide 5,330 5,180 5,330 5,180
Petroleum product sales (kbd)
United States 2,473 2,475 2,473 2,475
Canada 423 447 423 447
Europe 1,564 1,533 1,564 1,533
Asia Pacific 1,232 1,218 1,232 1,218
Other 624 594 624 594
Worldwide 6,316 6,267 6,316 6,267
Gasolines, naphthas 2,522 2,470 2,522 2,470
Heating oils, kerosene, diesel 2,096 2,034 2,096 2,034
Aviation fuels 458 464 458 464
Heavy fuels 505 555 505 555
Specialty products 735 744 735 744
Worldwide 6,316 6,267 6,316 6,267
Chemical prime product sales,
thousands of metric tons (kt)
United States 2,365 2,275 2,365 2,275
Non-U.S. 3,972 4,047 3,972 4,047
Worldwide 6,337 6,322 6,337 6,322
-11-
Attachment V
EXXON MOBIL CORPORATION
FIRST QUARTER 2012
(millions of dollars)
First Quarter First Quarter
2012 2011 2012 2011
Capital and Exploration Expenditures
Upstream
United States 2,422 2,080 2,422 2,080
Non-U.S. 5,657 4,820 5,657 4,820
Total 8,079 6,900 8,079 6,900
Downstream
United States 110 117 110 117
Non-U.S. 329 333 329 333
Total 439 450 439 450
Chemical
United States 74 56 74 56
Non-U.S. 239 393 239 393
Total 313 449 313 449
Other 3 22 3 22
Worldwide 8,834 7,821 8,834 7,821
Exploration expenses charged to income
included above
Consolidated affiliates
United States 103 63 103 63
Non-U.S. 417 270 417 270
Equity companies - ExxonMobil share
United States 1 1 1 1
Non-U.S. 6 1 6 1
Worldwide 527 335 527 335
-12-
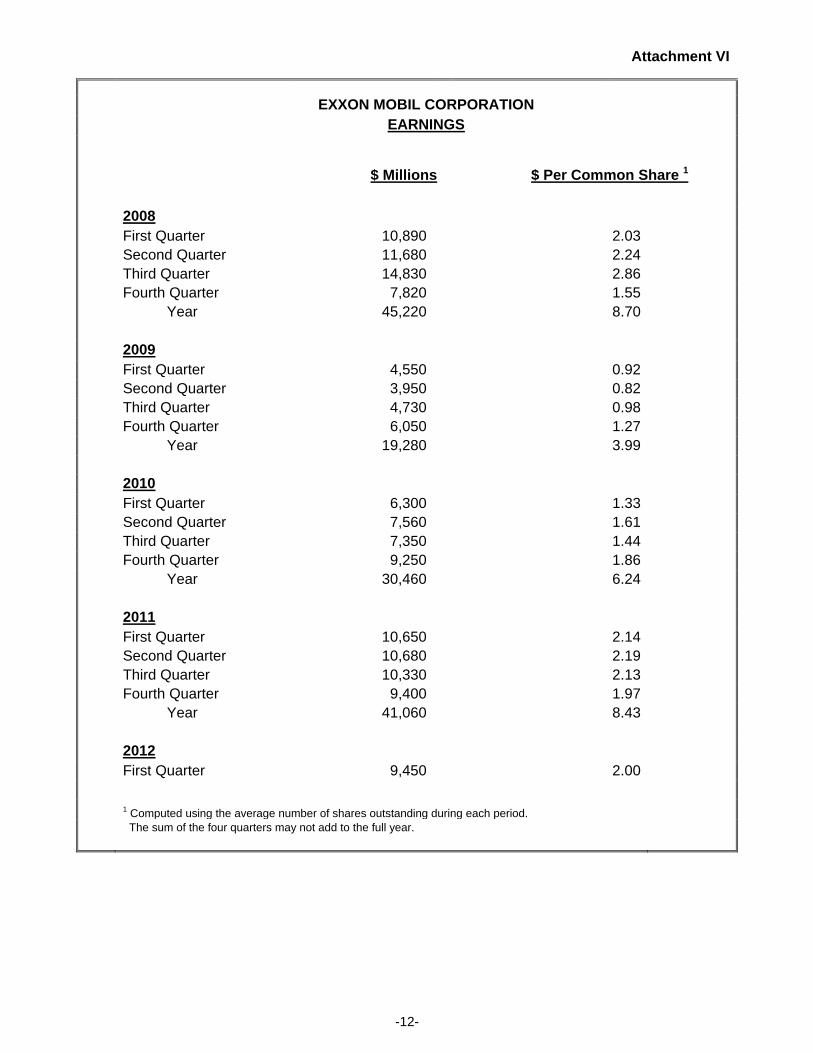
Attachment VI
EXXON MOBIL CORPORATION
EARNINGS
$ Millions $ Per Common Share 1
2008
First Quarter 10,890
2.03
Second Quarter 11,680
2.24
Third Quarter 14,830
2.86
Fourth Quarter 7,820
1.55
Year 45,220
8.70
2009
First Quarter 4,550
0.92
Second Quarter 3,950
0.82
Third Quarter 4,730
0.98
Fourth Quarter 6,050
1.27
Year 19,280
3.99
2010
First Quarter 6,300
1.33
Second Quarter 7,560
1.61
Third Quarter 7,350
1.44
Fourth Quarter 9,250
1.86
Year 30,460
6.24
2011
First Quarter 10,650
2.14
Second Quarter 10,680
2.19
Third Quarter 10,330
2.13
Fourth Quarter 9,400
1.97
Year 41,060
8.43
2012
First Quarter 9,450
2.00
Second Quarter 0
0.00
1 Computed using the average number of shares outstanding during each period.
The sum of the four quarters may not add to the full year.