Embed Size (px)
Citation preview
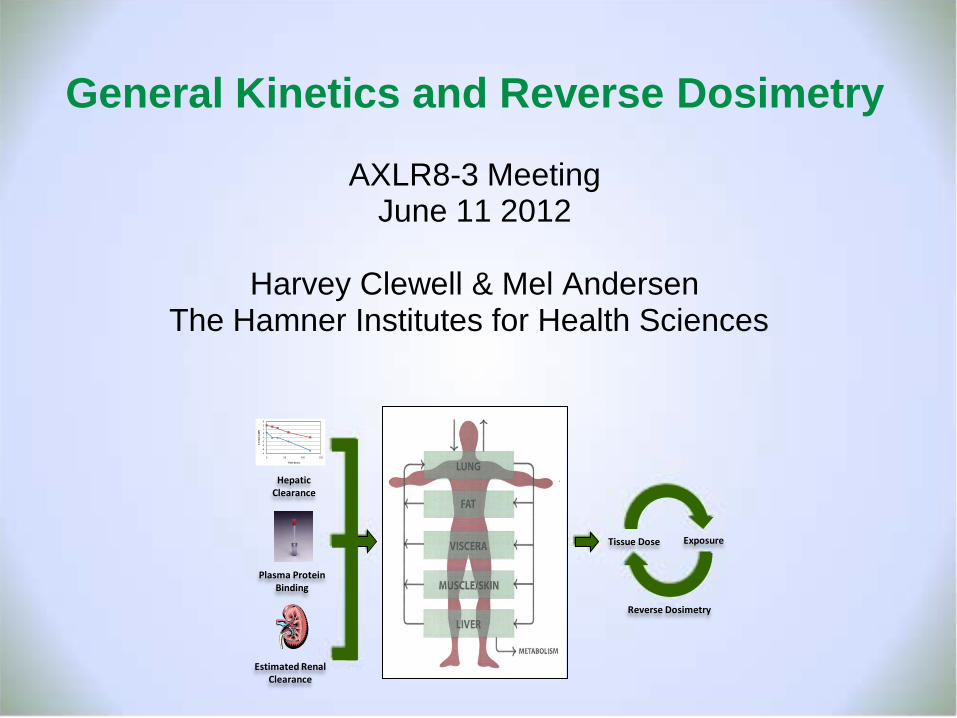
General Kinetics and Reverse Dosimetry
AXLR8-3 Meeting June 11 2012
Harvey Clewell & Mel Andersen
The Hamner Institutes for Health Sciences
-5-4-3-2-10123
0 50 100 150
Ln C
onc
(uM
)
Time (min)
Hepatic Clearance
Plasma Protein Binding
Estimated Renal Clearance
Reverse Dosimetry
Exposure Tissue Dose
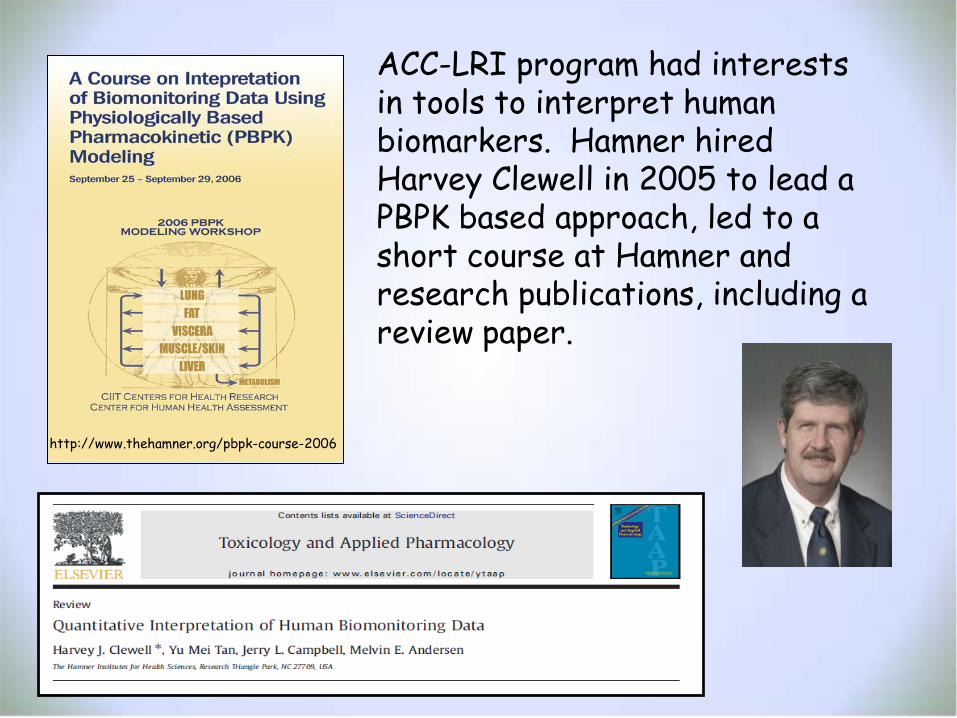
ACC-LRI program had interests in tools to interpret human biomarkers. Hamner hired Harvey Clewell in 2005 to lead a PBPK based approach, led to a short course at Hamner and research publications, including a review paper.
http://www.thehamner.org/pbpk-course-2006
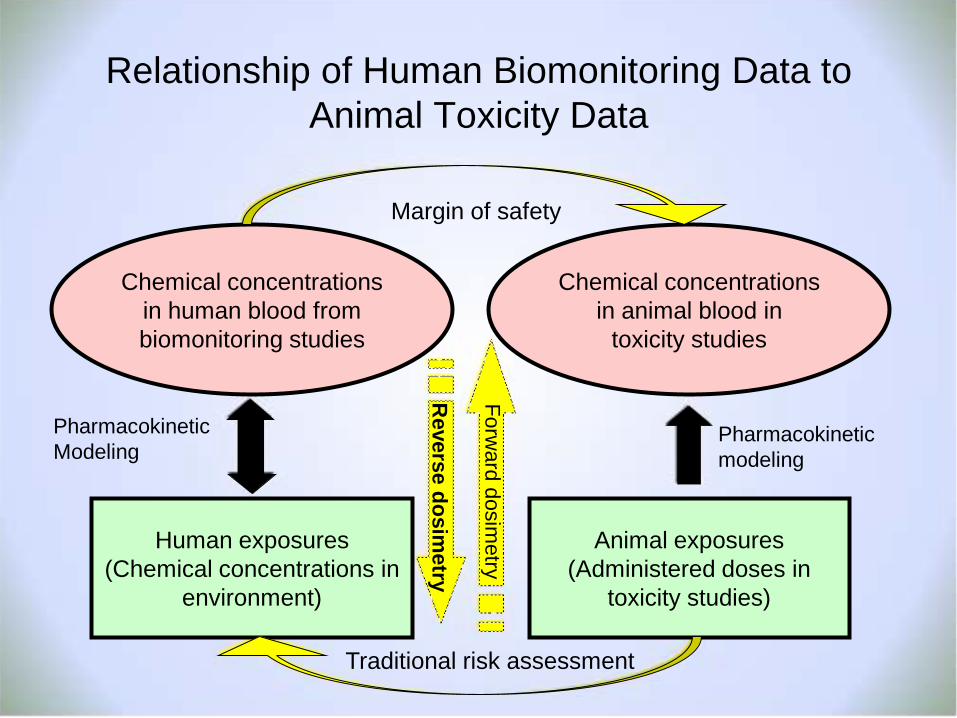
Relationship of Human Biomonitoring Data to Animal Toxicity Data
Chemical concentrations in human blood from biomonitoring studies
Human exposures (Chemical concentrations in
environment)
Chemical concentrations in animal blood in
toxicity studies
Animal exposures (Administered doses in
toxicity studies)
Pharmacokinetic modeling
Pharmacokinetic Modeling
Traditional risk assessment
Margin of safety
Forward dosim
etry
Reverse dosim
etry
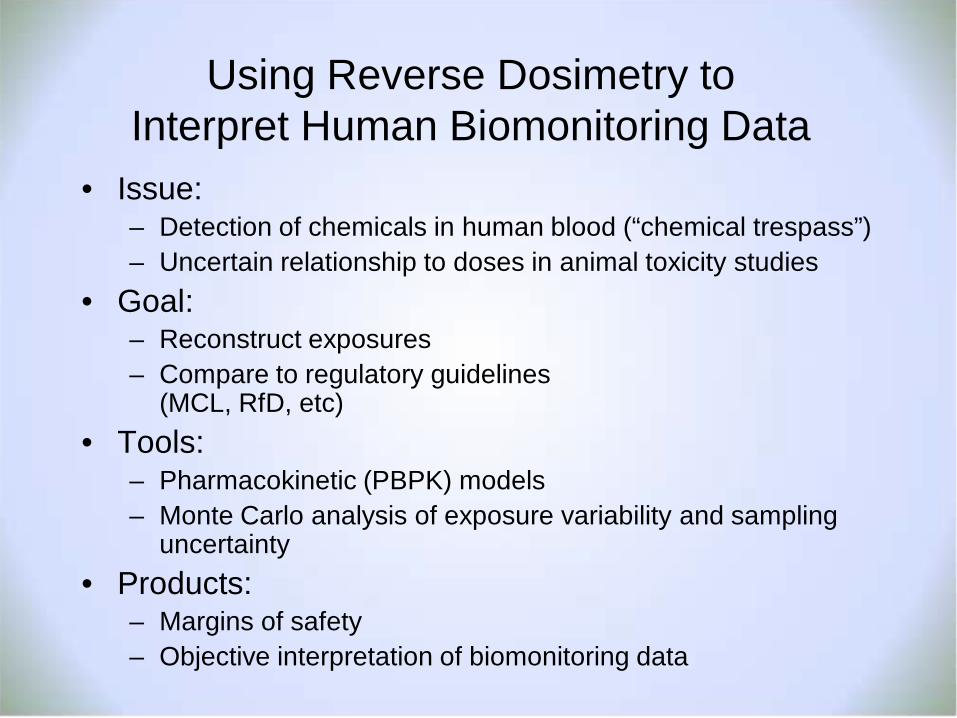
Using Reverse Dosimetry to Interpret Human Biomonitoring Data
• Issue: – Detection of chemicals in human blood (“chemical trespass”) – Uncertain relationship to doses in animal toxicity studies
• Goal: – Reconstruct exposures – Compare to regulatory guidelines
(MCL, RfD, etc) • Tools:
– Pharmacokinetic (PBPK) models – Monte Carlo analysis of exposure variability and sampling
uncertainty • Products:
– Margins of safety – Objective interpretation of biomonitoring data
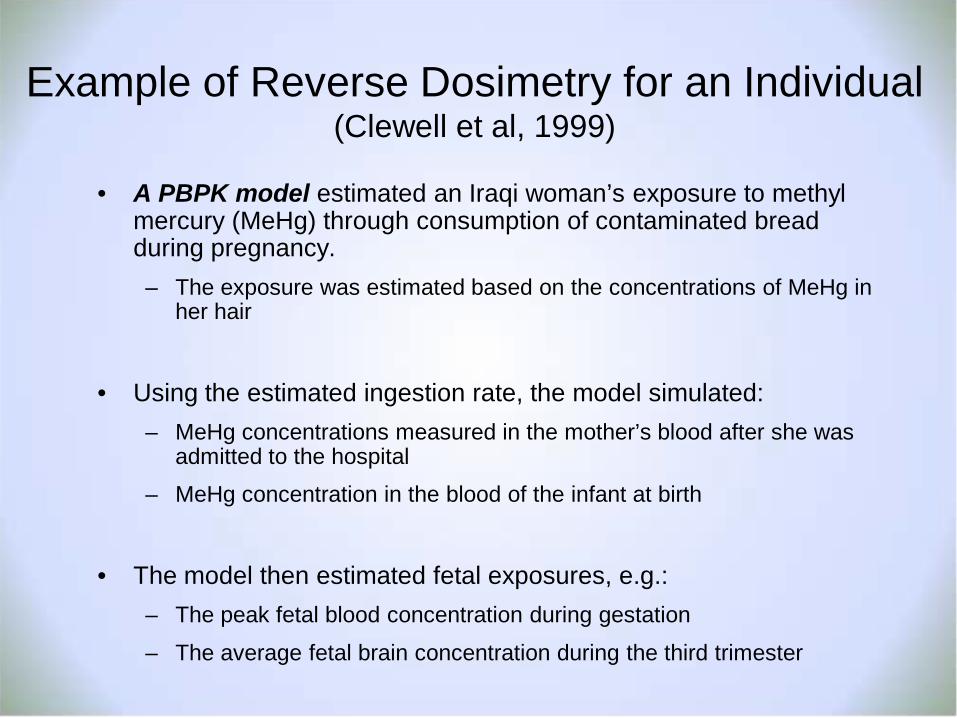
Example of Reverse Dosimetry for an Individual (Clewell et al, 1999)
• A PBPK model estimated an Iraqi woman’s exposure to methyl mercury (MeHg) through consumption of contaminated bread during pregnancy. – The exposure was estimated based on the concentrations of MeHg in
her hair
• Using the estimated ingestion rate, the model simulated:
– MeHg concentrations measured in the mother’s blood after she was admitted to the hospital
– MeHg concentration in the blood of the infant at birth
• The model then estimated fetal exposures, e.g.:
– The peak fetal blood concentration during gestation
– The average fetal brain concentration during the third trimester
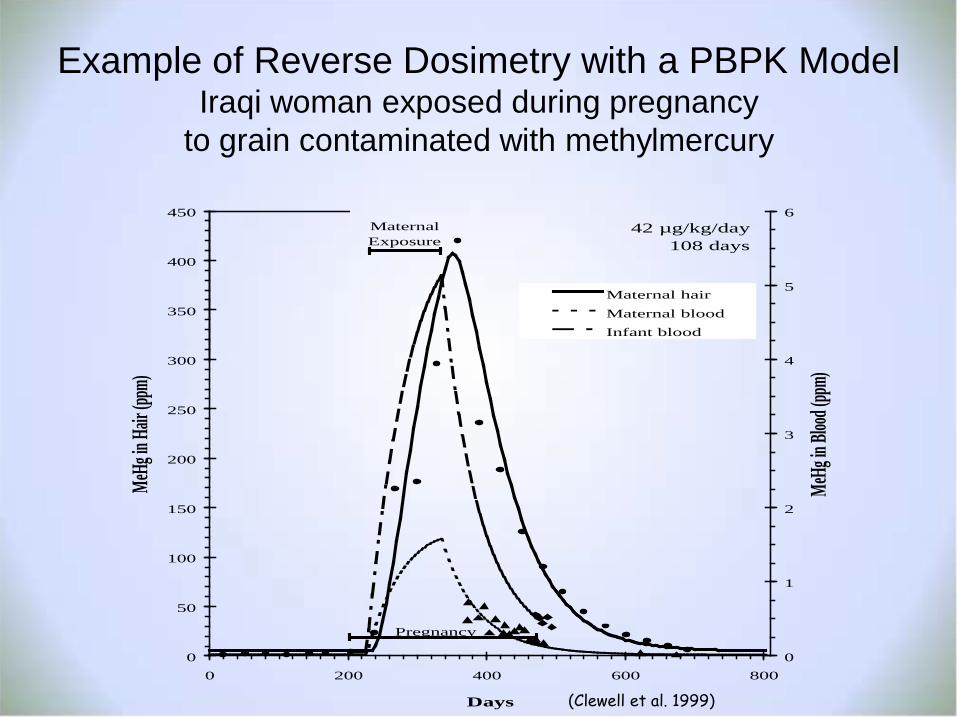
0
50
100
150
200
250
300
350
400
450
0 200 400 600 800
Days
MeHg
in Ha
ir (ppm
)
0
1
2
3
4
5
6
MeHg
in Blo
od (pp
m)
Maternal hairMaternal bloodInfant blood
MaternalExposure
Pregnancy
42 µg/kg/day108 days
Example of Reverse Dosimetry with a PBPK Model Iraqi woman exposed during pregnancy
to grain contaminated with methylmercury
(Clewell et al. 1999)
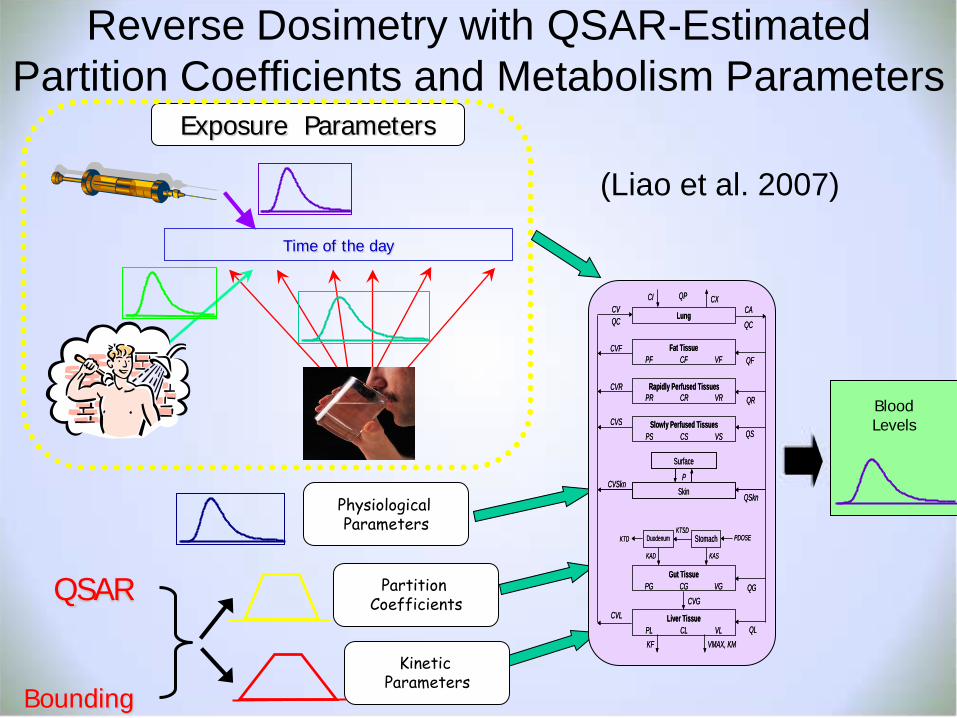
Reverse Dosimetry with QSAR-Estimated Partition Coefficients and Metabolism Parameters
Exposure Parameters
Partition Coefficients
Kinetic Parameters
Physiological Parameters KTSD
CI
Fat TissuePF CF VF
Rapidly Perfused TissuesPR CR VR
Slowly Perfused TissuesPS CS VS
Skin
Gut TissuePG CG VG
QCLung CAQP CX
QF
QR
QS
QSkn
Liver TissuePL CL VL
StomachDuodenum PDOSE
Surface
P
KTD
KASKAD
VMAX, KMKF
CVGCVL
CVSkn
CVS
CVR
CVF
CVQC
QG
QL
KTSD
CI
Fat TissuePF CF VF
Rapidly Perfused TissuesPR CR VR
Slowly Perfused TissuesPS CS VS
Skin
Gut TissuePG CG VG
QCLung CAQP CX
QF
QR
QS
QSkn
Liver TissuePL CL VL
StomachDuodenum PDOSE
Surface
P
KTD
KASKAD
VMAX, KMKF
CVGCVL
CVSkn
CVS
CVR
CVF
CVQC
QG
QL
Time of the day
Blood Levels
QSAR
Bounding
(Liao et al. 2007)
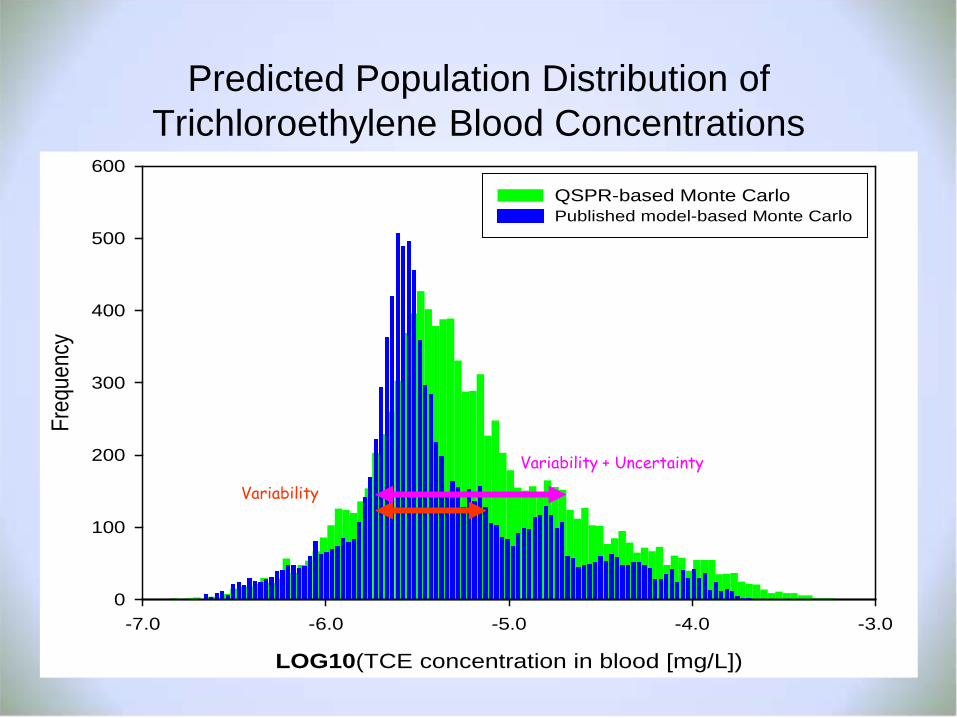
Predicted Population Distribution of Trichloroethylene Blood Concentrations
LOG10(TCE concentration in blood [mg/L])
-7.0 -6.0 -5.0 -4.0 -3.0
Freq
uenc
y
0
100
200
300
400
500
600
QSPR-based Monte CarloPublished model-based Monte Carlo
Variability
Variability + Uncertainty
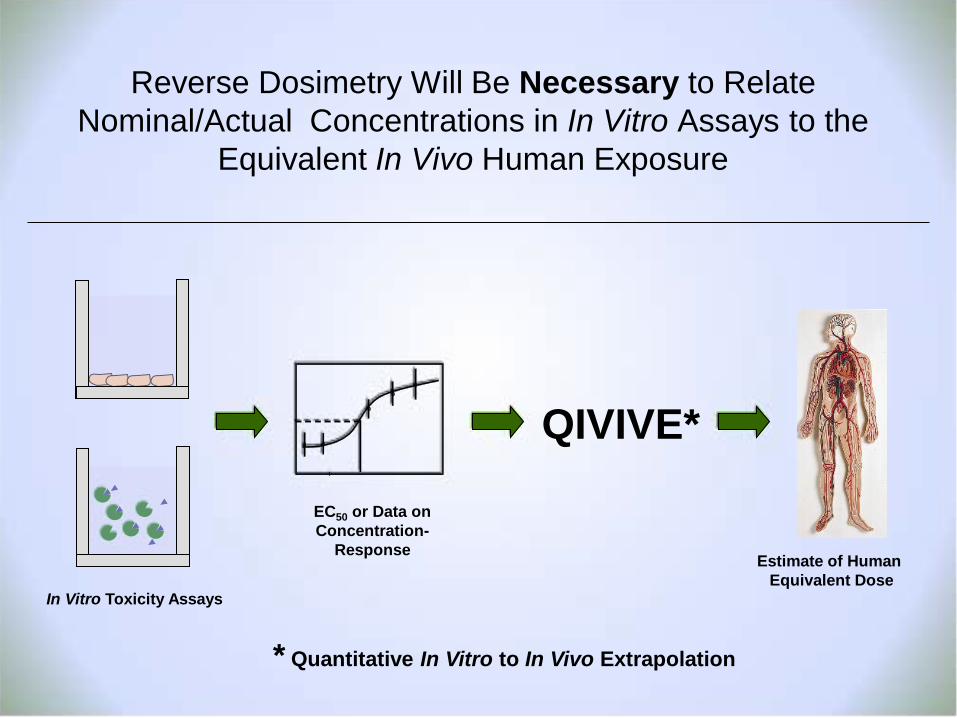
Reverse Dosimetry Will Be Necessary to Relate Nominal/Actual Concentrations in In Vitro Assays to the
Equivalent In Vivo Human Exposure
In Vitro Toxicity Assays
EC50 or Data on Concentration-
Response Estimate of Human
Equivalent Dose
QIVIVE*
* Quantitative In Vitro to In Vivo Extrapolation
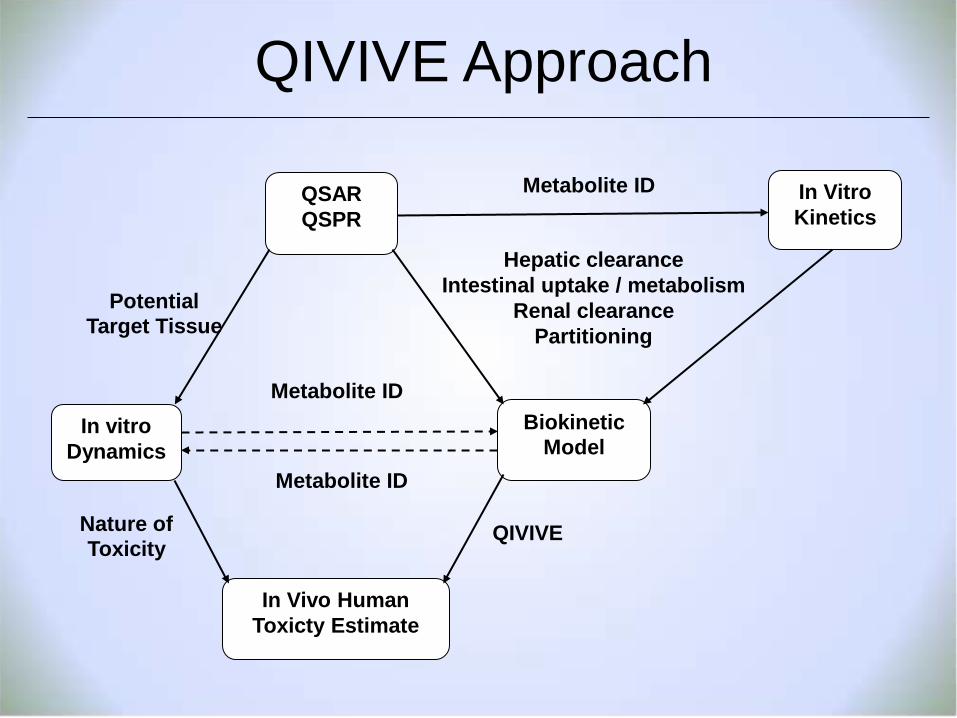
QIVIVE Approach
Potential Target Tissue
Biokinetic Model
In Vivo Human Toxicty Estimate
In vitro Dynamics
In Vitro Kinetics
QSAR QSPR
Metabolite ID
Metabolite ID
Metabolite ID
Nature of Toxicity
Hepatic clearance Intestinal uptake / metabolism
Renal clearance Partitioning
QIVIVE
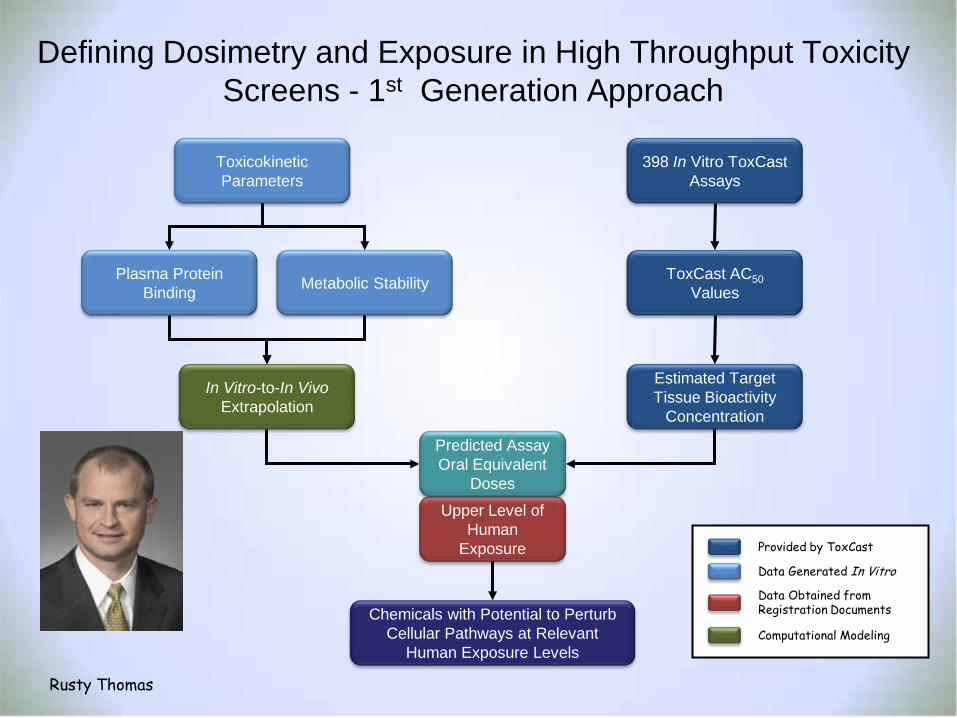
Defining Dosimetry and Exposure in High Throughput Toxicity Screens - 1st Generation Approach
Provided by ToxCast
Data Generated In Vitro
398 In Vitro ToxCast Assays
ToxCast AC50 Values
Estimated Target Tissue Bioactivity
Concentration
Metabolic Stability Plasma Protein Binding
Toxicokinetic Parameters
Upper Level of Human
Exposure
Predicted Assay Oral Equivalent
Doses
Data Obtained from Registration Documents
In Vitro-to-In Vivo Extrapolation
Chemicals with Potential to Perturb Cellular Pathways at Relevant
Human Exposure Levels Computational Modeling
Rusty Thomas
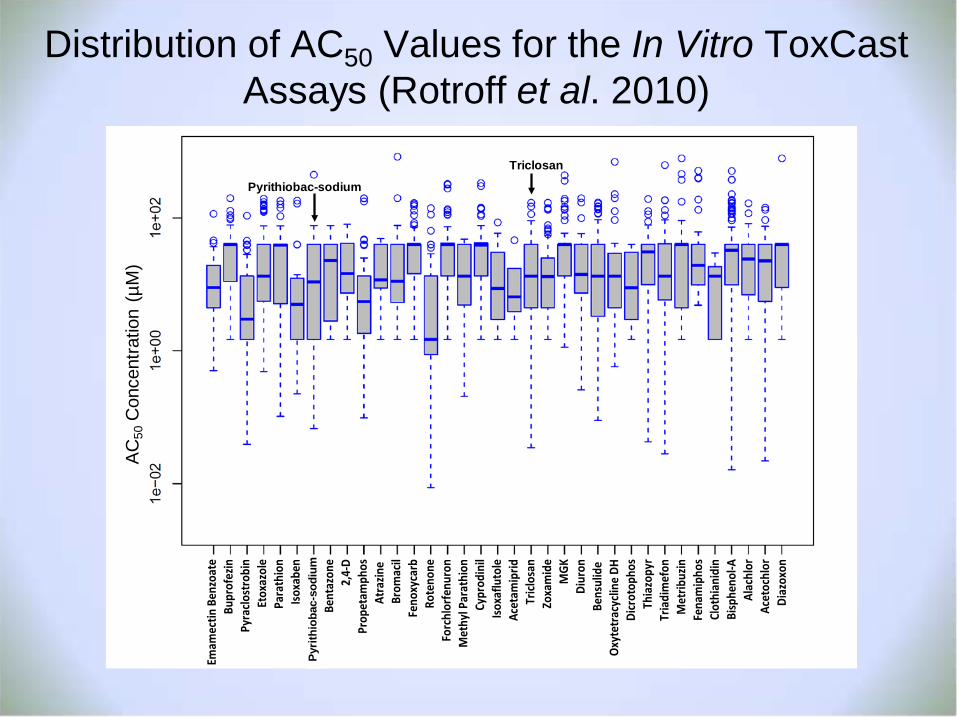
Distribution of AC50 Values for the In Vitro ToxCast Assays (Rotroff et al. 2010)
Triclosan
Pyrithiobac-sodium
AC
50C
once
ntra
tion
(µM
)
Emam
ectin
Ben
zoat
eBu
prof
ezin
Pyra
clost
robi
nEt
oxaz
ole
Para
thio
nIso
xabe
nPr
yrith
ioba
c-so
dium
Bent
azon
e2,
4-D
Prop
etam
phos
Atra
zine
Brom
acil
Feno
xyca
rbRo
teno
neFo
rchl
orfe
nuro
nM
ethy
l Par
athi
onCy
prod
inil
Isoxa
fluto
leAc
etam
iprid
Tricl
osan
Zoxa
mid
eM
GKDi
uron
Bens
ulid
e Ox
ytet
racy
cline
DH
Dicr
otop
hos
Thia
zopy
rTr
iadi
mef
onM
etrib
uzin
Fena
mip
hos
Clot
hian
idin
Bisp
heno
l-AAl
achl
orAc
etoc
hlor
Diaz
oxon
Pyrit
hiob
ac-s
odiu
m
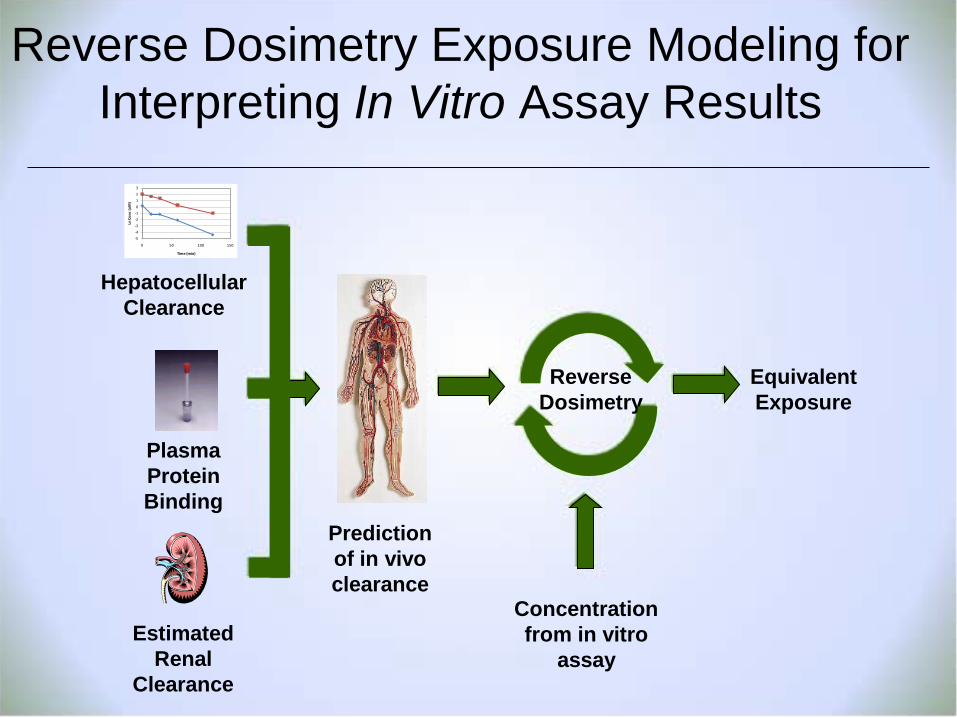
Reverse Dosimetry Exposure Modeling for Interpreting In Vitro Assay Results
-5-4-3-2-10123
0 50 100 150
Ln C
onc
(uM
)
Time (min)
Hepatocellular Clearance
Plasma Protein Binding
Estimated Renal
Clearance
Prediction of in vivo clearance
Reverse Dosimetry
Equivalent Exposure
Concentration from in vitro
assay
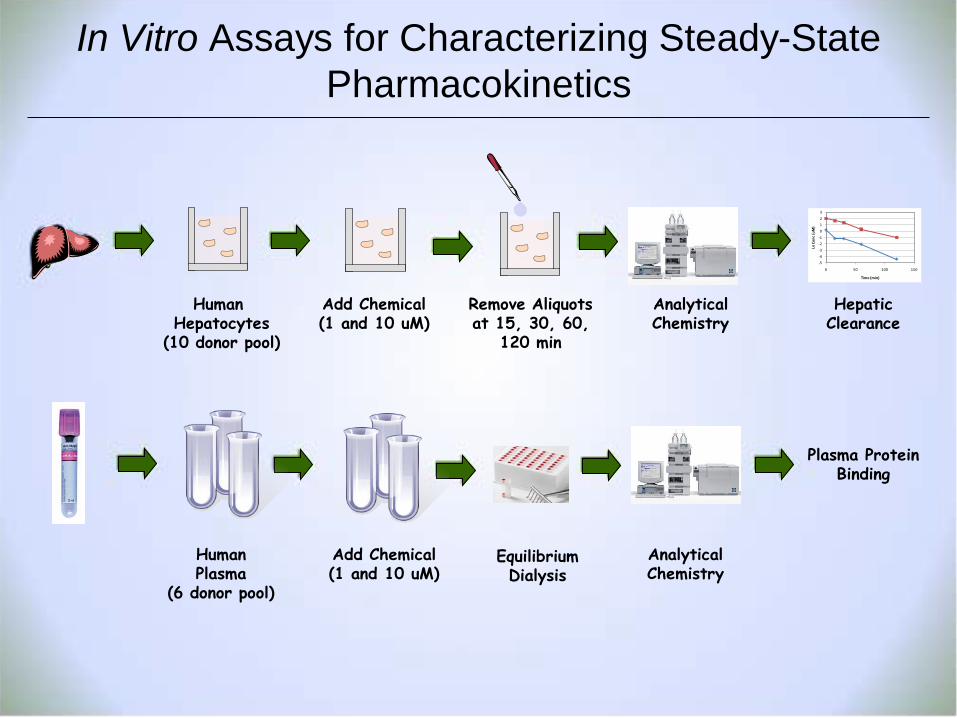
In Vitro Assays for Characterizing Steady-State Pharmacokinetics
Human Hepatocytes
(10 donor pool)
Human Plasma
(6 donor pool)
Add Chemical (1 and 10 uM)
Add Chemical (1 and 10 uM)
Remove Aliquots at 15, 30, 60,
120 min
Analytical Chemistry
Analytical Chemistry
-5-4-3-2-10123
0 50 100 150
Ln C
onc
(uM
)
Time (min)
Hepatic Clearance
Plasma Protein Binding
Equilibrium Dialysis
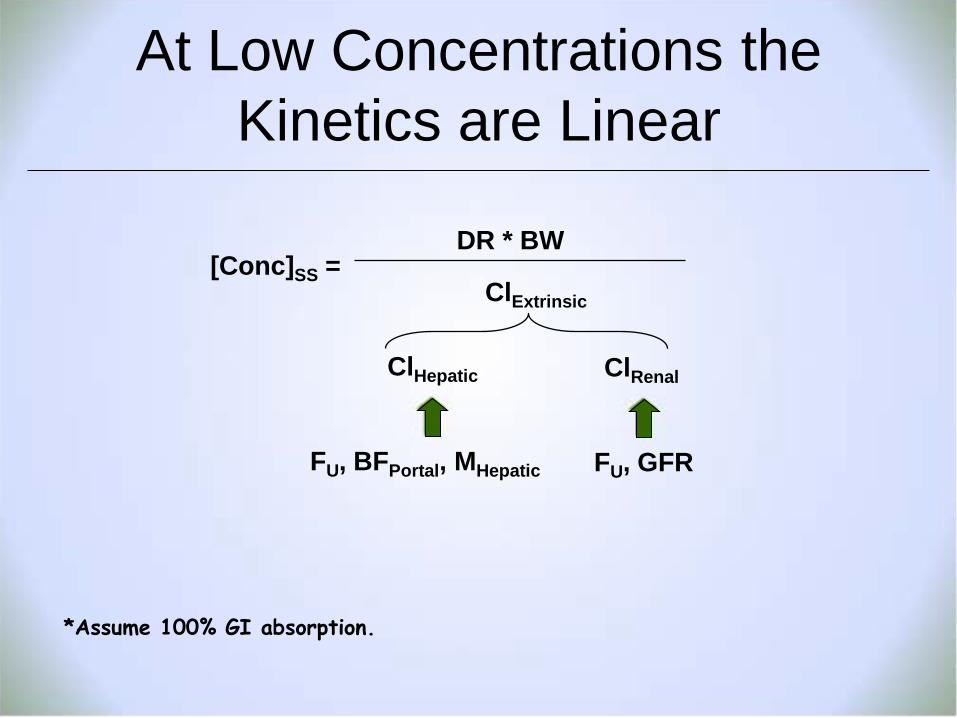
At Low Concentrations the Kinetics are Linear
[Conc]SS = DR * BW
ClExtrinsic
ClHepatic ClRenal
FU, BFPortal, MHepatic FU, GFR
*Assume 100% GI absorption.
Dis
trib
utio
n of
Ora
l Equ
ival
ent
Valu
es a
nd
Esti
mat
ed E
xpos
ures
(m
g/kg
/day
)
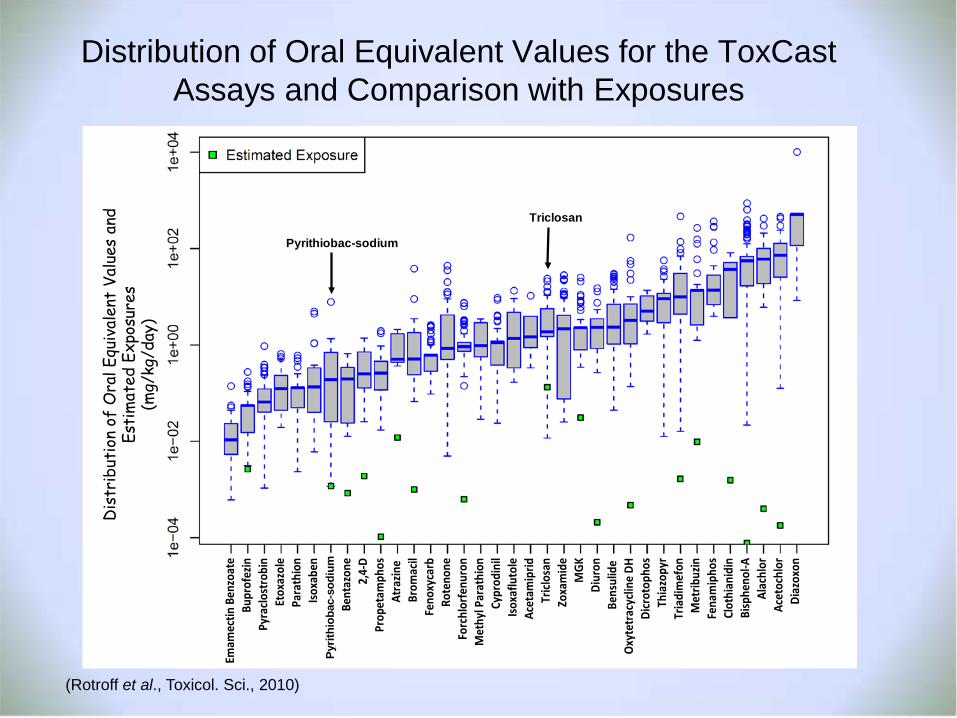
Distribution of Oral Equivalent Values for the ToxCast Assays and Comparison with Exposures
Triclosan
Pyrithiobac-sodiumEm
amec
tin B
enzo
ate
Bupr
ofez
inPy
raclo
stro
bin
Etox
azol
ePa
rath
ion
Isoxa
ben
Pryr
ithio
bac-
sodi
umBe
ntaz
one
2,4-
DPr
opet
amph
osAt
razin
e Br
omac
ilFe
noxy
carb
Rote
none
Forc
hlor
fenu
ron
Met
hyl P
arat
hion
Cypr
odin
ilIso
xaflu
tole
Acet
amip
ridTr
iclos
anZo
xam
ide
MGK
Diur
onBe
nsul
ide
Oxyt
etra
cycli
ne D
HDi
crot
opho
sTh
iazo
pyr
Tria
dim
efon
Met
ribuz
inFe
nam
ipho
sCl
othi
anid
inBi
sphe
nol-A
Alac
hlor
Acet
ochl
orDi
azox
on
Pyrit
hiob
ac-s
odiu
m
(Rotroff et al., Toxicol. Sci., 2010)
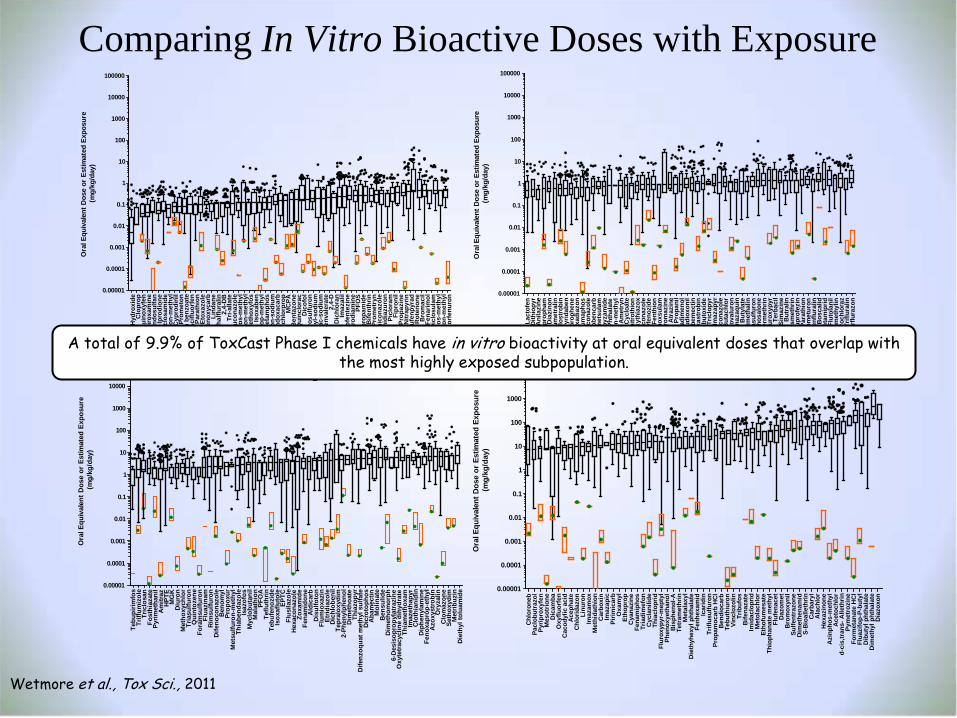
Comparing In Vitro Bioactive Doses with Exposure
Fent
in H
ydro
xide
Clo
prop
Qui
noxy
fen
Spiro
xam
ine
Endo
sulfa
nIp
rodi
one
Nic
losa
mid
eH
alos
ulfu
ron-
met
hyl
Cyp
rodi
nil
Prom
eton
Emam
ectin
ben
zoat
eA
ciflu
orfe
nPa
rath
ion
Etox
azol
eFe
noxy
carb
Lind
ane
Etha
lflur
alin
2,4-
DB
Tri-a
llate
Fenb
ucon
azol
eC
hlor
pyrif
os-m
ethy
lB
ensu
lfuro
n-m
ethy
lC
hlor
etho
xyfo
sIs
oxab
enD
iclo
fop-
met
hyl
Prop
etam
phos
Trifl
oxys
ulfu
ron-
sodi
umIn
doxa
carb
Dic
hlor
prop
MC
PAB
enta
zone
Qui
nclo
rac
Dic
ofol
Pros
ulfu
ron
Iodo
sulfu
ron-
met
hyl-s
odiu
mPy
rithi
obac
-sod
ium
Esfe
nval
erat
e2,
4-D
Dic
hlor
anIm
azal
ilC
lofe
ntez
ine
Prod
iam
ine
PFO
SN
apro
pam
ide
Bife
nthr
inPr
omet
ryn
Din
icon
azol
eTh
idia
zuro
nPi
clor
amFi
pron
ilPr
opaz
ine
Nitr
apyr
inTe
bufe
npyr
adR
oten
one
Bro
mac
ilFe
narim
olD
iclo
sula
mPi
rimip
hos-
met
hyl
Etha
met
sulfu
ron-
met
hyl
Forc
hlor
fenu
ron
0.00001
0.0001
0.001
0.01
0.1
1
10
100
1000
10000
100000O
ral E
quiv
alen
t Dos
e or
Est
imat
ed E
xpos
ure
(mg/
kg/d
ay)
Lact
ofen
Dith
iopy
rA
nila
zine
Chl
orpr
opha
mD
iazi
non
Flum
etra
linPy
racl
ostr
obin
Pyrid
aben
Clo
roph
ene
Oxa
diaz
onC
oum
apho
sTe
trac
onaz
ole
Thio
benc
arb
Flum
etsu
lam
Prop
yzam
ide
Mon
o-n-
buty
l Pht
hala
teM
esos
ulfu
ron-
met
hyl
Am
etry
nC
yclo
ate
Feni
trot
hion
Hex
ythi
azox
Triti
cona
zole
Met
hoxy
feno
zide
Fent
hion
Peno
xsul
amC
yrom
azin
eA
traz
ine
Prop
anil
Tria
dim
enol
Flud
ioxo
nil
Milb
emec
tinFl
uoxa
stro
bin
Pipe
rony
l but
oxid
eTr
iclo
pyr
Imaz
apyr
Cyp
roco
nazo
leB
utac
hlor
Nov
alur
onIm
azaq
uin
But
ylat
ePe
ndim
etha
linO
xasu
lfuro
nPh
osal
one
Perm
ethr
inFl
urox
ypyr
Terb
acil
Sim
azin
eB
utra
linR
esm
ethr
inB
upro
fezi
nM
ethy
l Par
athi
onFl
uom
etur
onB
enflu
ralin
Bos
calid
Ace
tam
iprid
Flut
olan
ilC
inm
ethy
linPr
ochl
oraz
Trifl
ural
inN
orflu
razo
n
0.00001
0.0001
0.001
0.01
0.1
1
10
100
1000
10000
100000
Ora
l Equ
ival
ent D
ose
or E
stim
ated
Exp
osur
e(m
g/kg
/day
)
Tebu
pirim
fos
Trifl
umiz
ole
Tric
losa
nFo
sthi
azat
ePy
rimet
hani
lA
mitr
azH
PTE
MG
KD
iuro
nM
etho
xych
lor
Tria
sulfu
ron
Qui
ntoz
ene
Fora
msu
lfuro
nFl
uazi
nam
Rim
sulfu
ron
Dife
noco
nazo
leB
enom
ylPr
opox
urM
etsu
lfuro
n-m
ethy
lTh
iabe
ndaz
ole
Isaz
ofos
Myc
lobu
tani
lM
alat
hion
PFO
ATe
fluth
rinTe
bufe
nozi
deIs
oxaf
luto
leEP
TCFl
usila
zole
Hex
acon
azol
eZo
xam
ide
Fena
mid
one
Ald
icar
bD
isul
foto
nFl
umio
xazi
nEt
ridia
zole
Dic
hlob
enil
Tepr
alox
ydim
2-Ph
enyl
phen
olD
imet
hoat
eTh
iazo
pyr
Dife
nzoq
uat m
ethy
l sul
fate
Dic
roto
phos
Aba
mec
tinM
olin
ate
Ben
sulid
eD
imet
hom
orph
6-D
esis
opro
pyla
traz
ine
Oxy
tetr
acyc
line
dihy
drat
eTh
iam
etho
xam
Imaz
etha
pyr
Clo
thia
nidi
nD
iphe
nyla
min
eFe
noxa
prop
-eth
ylA
zoxy
stro
bin
Ory
zalin
Clo
maz
one
Seth
oxyd
imM
etrib
uzin
Die
thyl
tolu
amid
e
0.00001
0.0001
0.001
0.01
0.1
1
10
100
1000
10000
100000
Ora
l Equ
ival
ent D
ose
or E
stim
ated
Exp
osur
e(m
g/kg
/day
)
Chl
oron
ebPa
clob
utra
zol
Pyrip
roxy
fen
Mes
otrio
neD
icam
baO
xyflu
orfe
nC
acod
ylic
aci
dA
ceph
ate
Chl
orid
azon
Linu
ron
Imaz
amox
Met
hida
thio
nC
arbo
xin
Imaz
apic
Pirim
icar
bO
xam
ylEt
hopr
opC
yana
zine
Fena
mip
hos
Tria
dim
efon
Cyc
lani
lide
Thia
clop
ridFl
urox
ypyr
-mep
tyl
Phen
oxye
than
olB
isph
enol
-ATe
tram
ethr
inM
etal
axyl
Die
thyh
exyl
pht
hala
teFe
nhex
amid
Icar
idin
Trifl
usul
furo
nPr
opam
ocar
b H
Cl
Ben
dioc
arb
Tebu
thiu
ron
Vinc
lozo
linTr
ibuf
osB
ifena
zate
Imid
aclo
prid
Met
olac
hlor
Etho
fum
esat
eTh
ioph
anat
e m
ethy
lFl
ufen
acet
Daz
omet
Bro
mox
ynil
Sulfe
ntra
zone
Dim
ethe
nam
idS-
Bio
alle
thrin
Car
bary
lA
lach
lor
Hex
azin
one
Azi
npho
s-m
ethy
lA
ceto
chlo
rd-
cis,
tran
s- A
lleth
rinPy
met
rozi
neFo
rmet
anat
e H
Cl
Flua
zifo
p-P-
buty
lD
ibut
yl p
htha
late
Dim
ethy
l pht
hala
teD
iazo
xon
0.00001
0.0001
0.001
0.01
0.1
1
10
100
1000
10000
100000
Ora
l Equ
ival
ent D
ose
or E
stim
ated
Exp
osur
e(m
g/kg
/day
)
Wetmore et al., Tox Sci., 2011
A total of 9.9% of ToxCast Phase I chemicals have in vitro bioactivity at oral equivalent doses that overlap with the most highly exposed subpopulation.
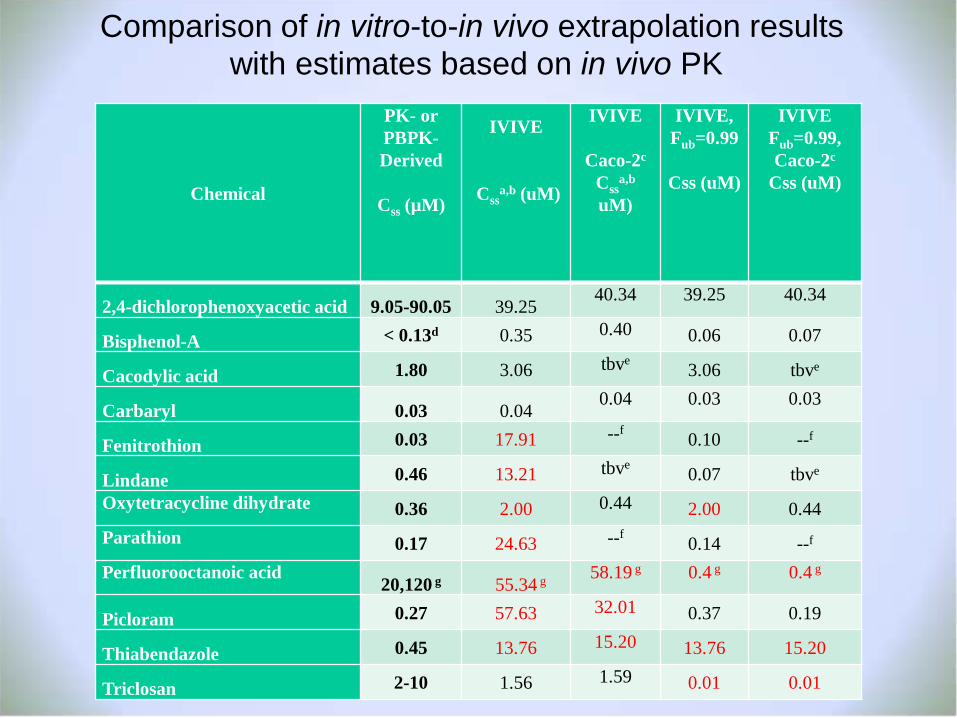
Comparison of in vitro-to-in vivo extrapolation results with estimates based on in vivo PK
Chemical
PK- or PBPK-Derived
Css (µM)
IVIVE
Cssa,b (uM)
IVIVE
Caco-2c Css
a,b uM)
IVIVE, Fub=0.99
Css (uM)
IVIVE Fub=0.99, Caco-2c
Css (uM)
2,4-dichlorophenoxyacetic acid 9.05-90.05 39.25 40.34 39.25 40.34
Bisphenol-A < 0.13d 0.35 0.40 0.06 0.07
Cacodylic acid 1.80 3.06 tbve 3.06 tbve
Carbaryl 0.03 0.04 0.04 0.03 0.03
Fenitrothion 0.03 17.91 --f 0.10 --f
Lindane 0.46 13.21 tbve 0.07 tbve Oxytetracycline dihydrate 0.36 2.00 0.44 2.00 0.44 Parathion 0.17 24.63 --f 0.14 --f Perfluorooctanoic acid
20,120 g 55.34 g 58.19 g 0.4 g 0.4 g
Picloram 0.27 57.63 32.01 0.37 0.19
Thiabendazole 0.45 13.76 15.20 13.76 15.20
Triclosan 2-10 1.56 1.59 0.01 0.01
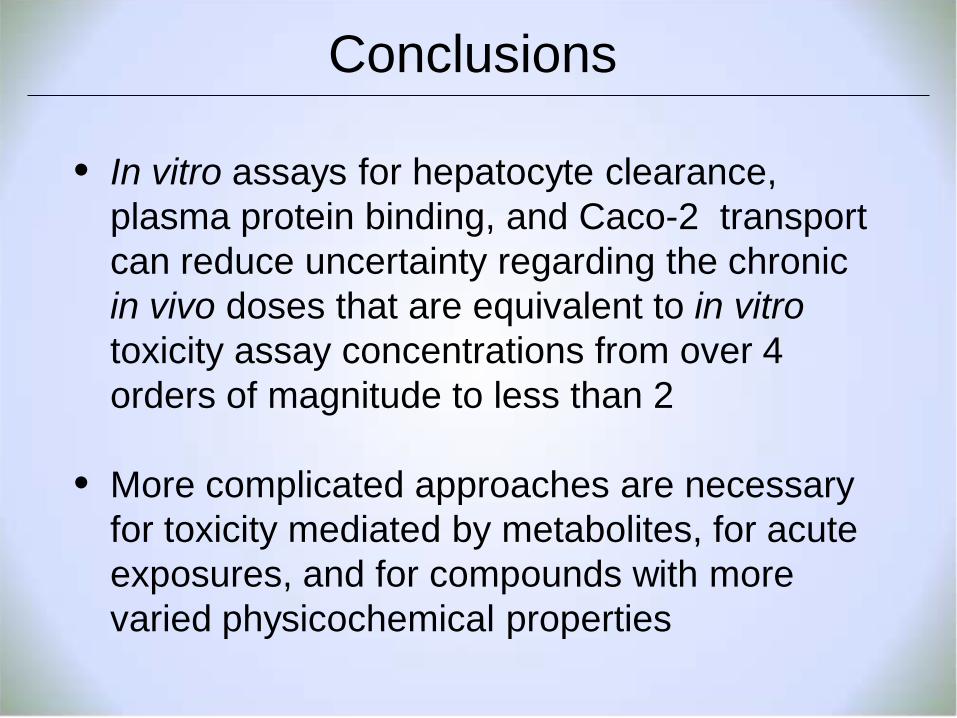
Conclusions
• In vitro assays for hepatocyte clearance, plasma protein binding, and Caco-2 transport can reduce uncertainty regarding the chronic in vivo doses that are equivalent to in vitro toxicity assay concentrations from over 4 orders of magnitude to less than 2
• More complicated approaches are necessary for toxicity mediated by metabolites, for acute exposures, and for compounds with more varied physicochemical properties
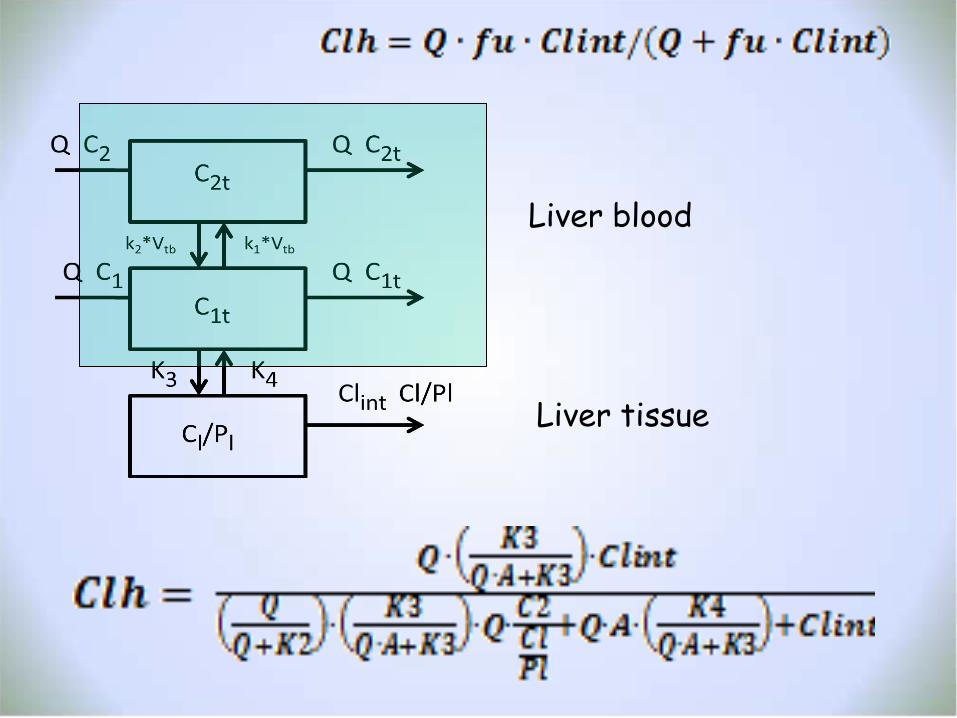
Liver blood
Liver tissue
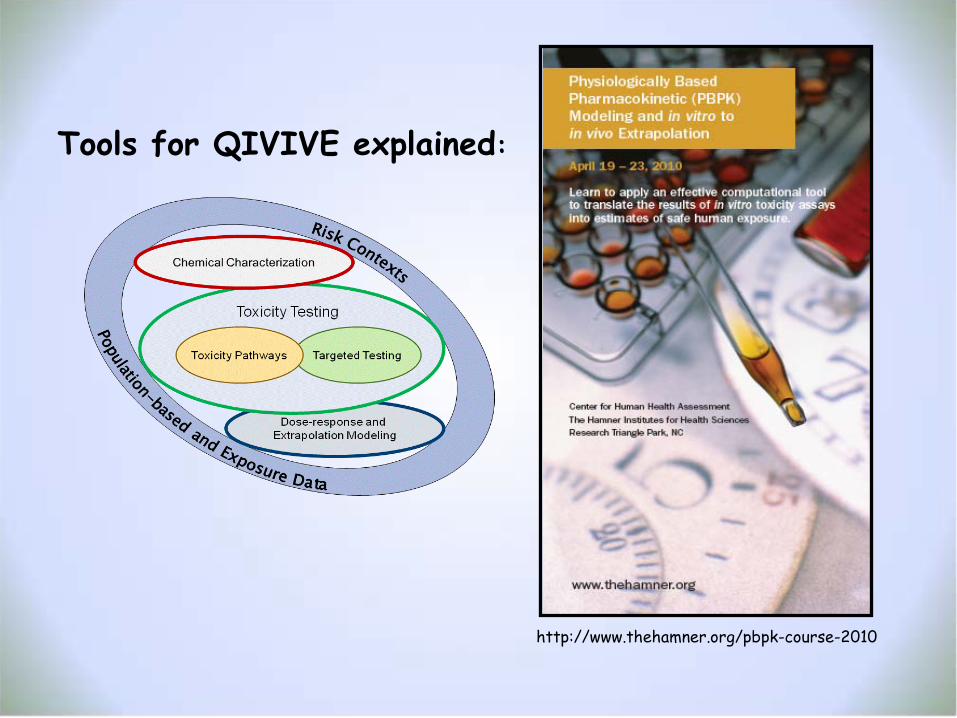
http://www.thehamner.org/pbpk-course-2010
Tools for QIVIVE explained:
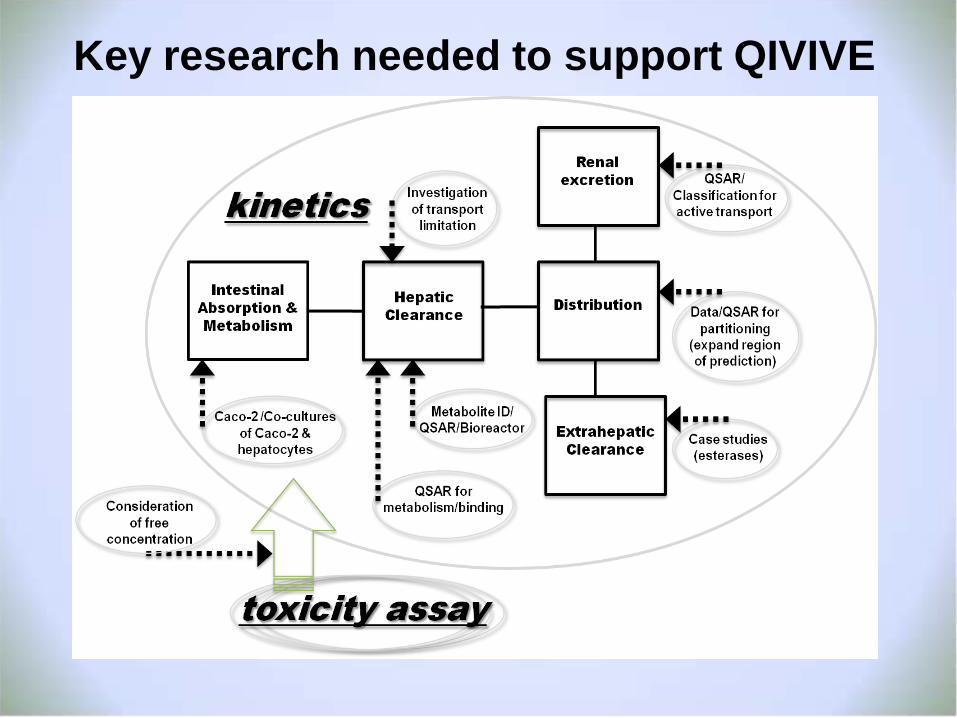
Key research needed to support QIVIVE
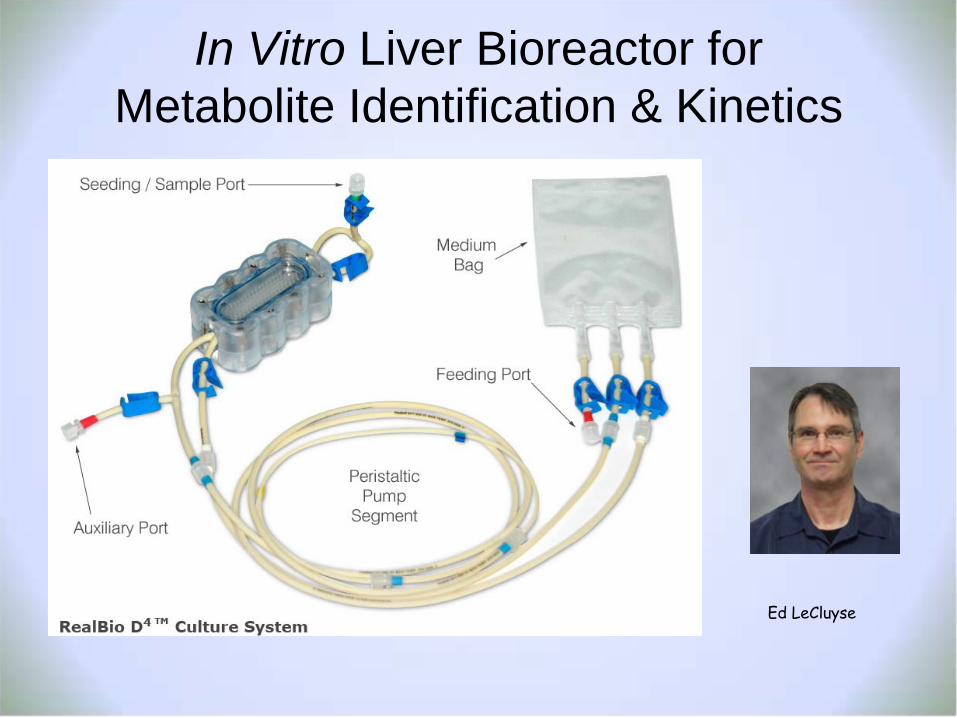
In Vitro Liver Bioreactor for Metabolite Identification & Kinetics
Ed LeCluyse
Other Bioreactor Applications
• Assessing liver toxicity on repeat dosing • Establishing factors affecting clearance for
chemicals with broad ranges of physical chemical properties
• Modeling the platform to identify and modify liver micorenvironments
• Create an in vitro ADME platform for assessing kinetics and tissue responses
• Support human on a chip approaches
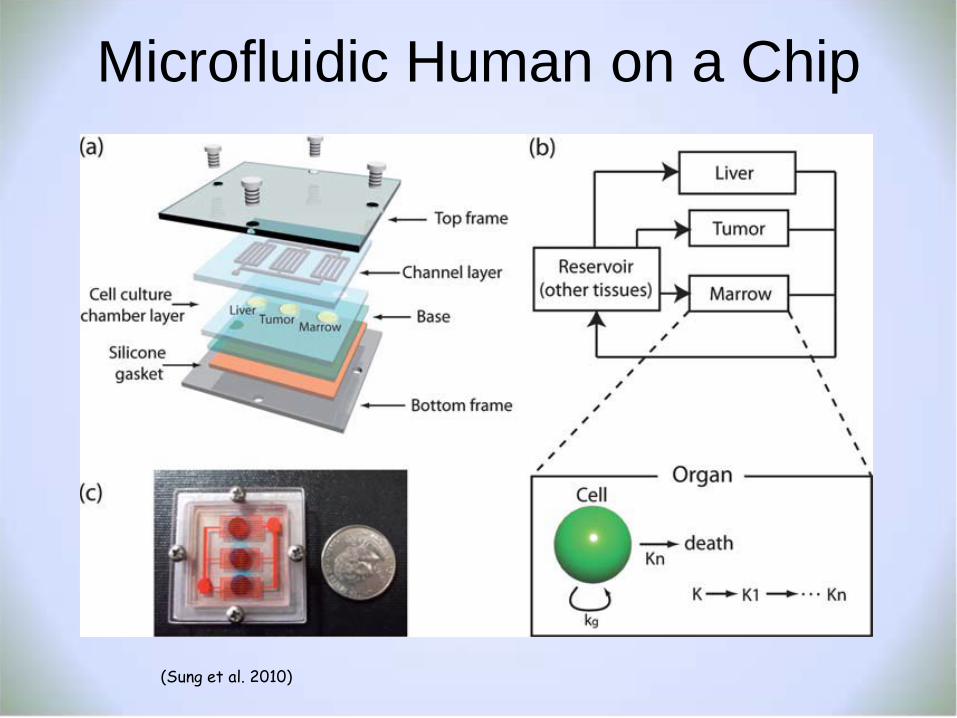
Microfluidic Human on a Chip
(Sung et al. 2010)
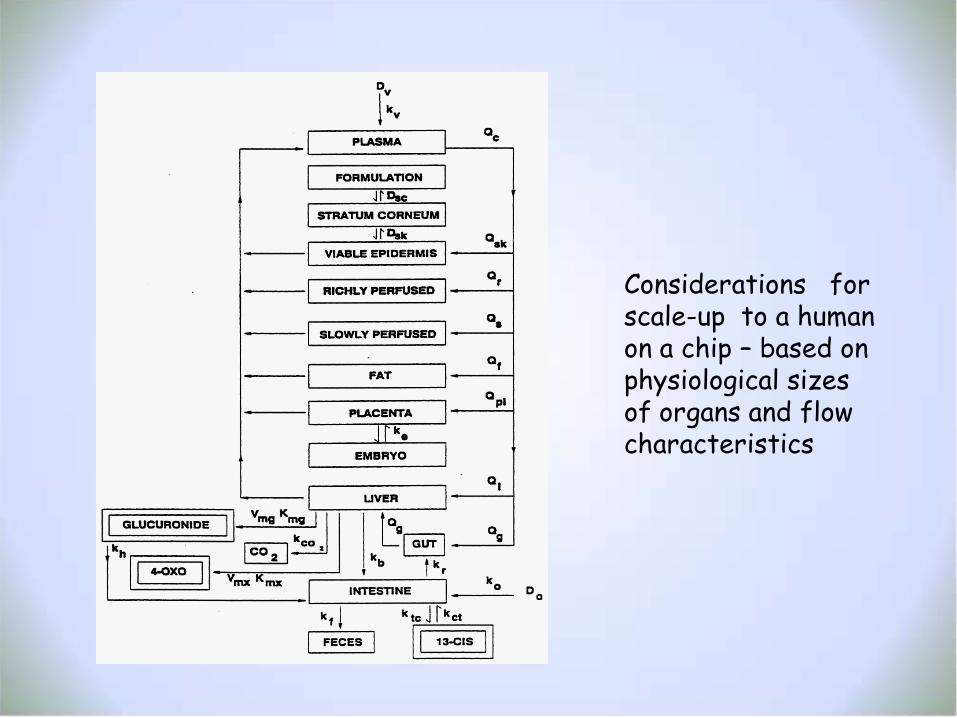
Considerations for scale-up to a human on a chip – based on physiological sizes of organs and flow characteristics
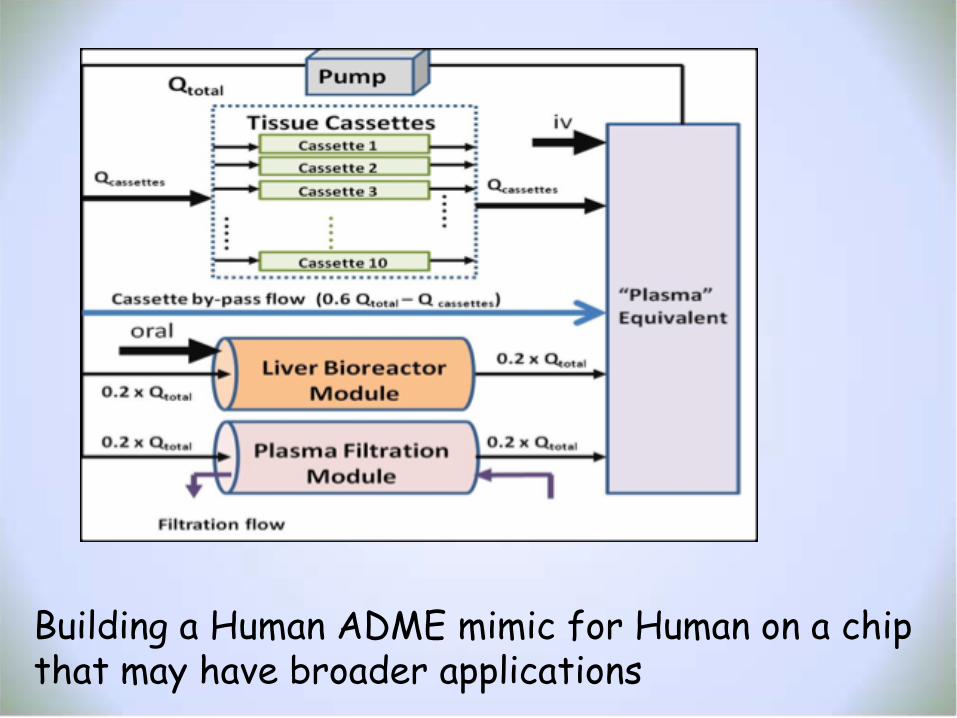
Building a Human ADME mimic for Human on a chip that may have broader applications
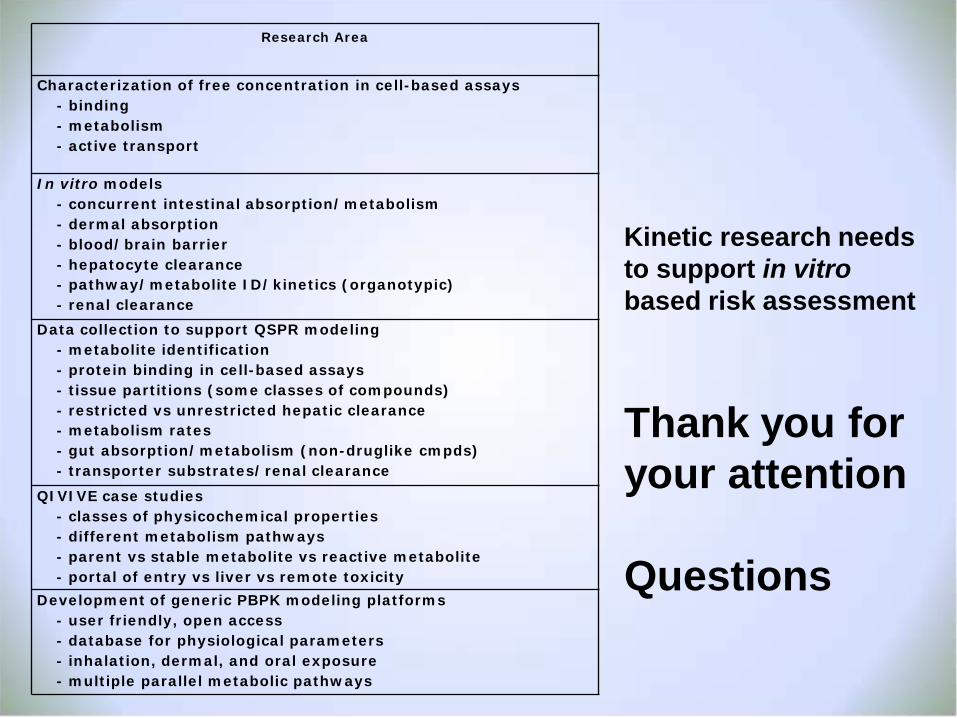
Research Area
Characterization of free concentration in cell-based assays - binding - metabolism - active transport
In vitro models - concurrent intestinal absorption/metabolism - dermal absorption - blood/brain barrier - hepatocyte clearance - pathway/metabolite ID/kinetics (organotypic) - renal clearance
Data collection to support QSPR modeling - metabolite identification - protein binding in cell-based assays - tissue partitions (some classes of compounds) - restricted vs unrestricted hepatic clearance - metabolism rates - gut absorption/metabolism (non-druglike cmpds) - transporter substrates/renal clearance
QIVIVE case studies - classes of physicochemical properties - different metabolism pathways - parent vs stable metabolite vs reactive metabolite - portal of entry vs liver vs remote toxicity
Development of generic PBPK modeling platforms - user friendly, open access - database for physiological parameters - inhalation, dermal, and oral exposure - multiple parallel metabolic pathways
Kinetic research needs to support in vitro based risk assessment
Thank you for your attention Questions