Embed Size (px)
Citation preview
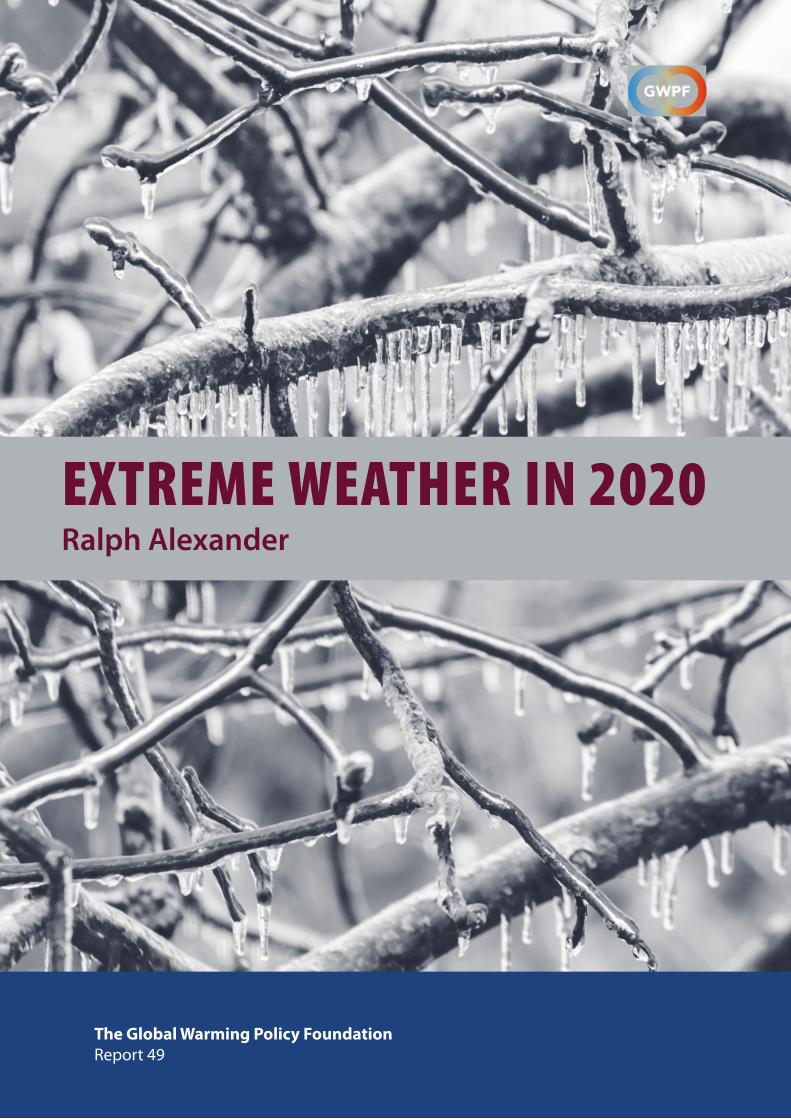
EXTREME WEATHER IN 2020Ralph Alexander
The Global Warming Policy FoundationReport 49
Extreme Weather in 2020Ralph AlexanderReport 49, The Global Warming Policy Foundation
© Copyright 2021, The Global Warming Policy Foundation
iii
About the authorRetired physicist Dr. Ralph B. Alexander is the author of Global Warming False Alarm and Science Un-der Attack: The Age of Unreason. With a PhD in physics from the University of Oxford, he is also the author of numerous scientific papers and reports on complex technical issues. His thesis research in the interdisciplinary area of ion-solid interactions reflected his interest in a wide range of scien-tific topics.Dr Alexander has been a researcher at major laboratories in Europe and Australia, a professor at Wayne State University in Detroit, the co-founder of an entrepreneurial materials company, and a market analyst in environmentally friendly materials for a small consulting firm.
Contents
About the author iii
Executive summary v
1. Introduction 1
2. Natural disaster analysis 2
3. Heatwave 6
4. Cold extremes 12
5. Drought 14
6. Precipitation and floods 16
7. Hurricanes 19
8. Tornadoes 23
9. Wildfires 26
10. Conclusions 31
Notes 33
Review process 38
About the Global Warming Policy Foundation 38

iv
v
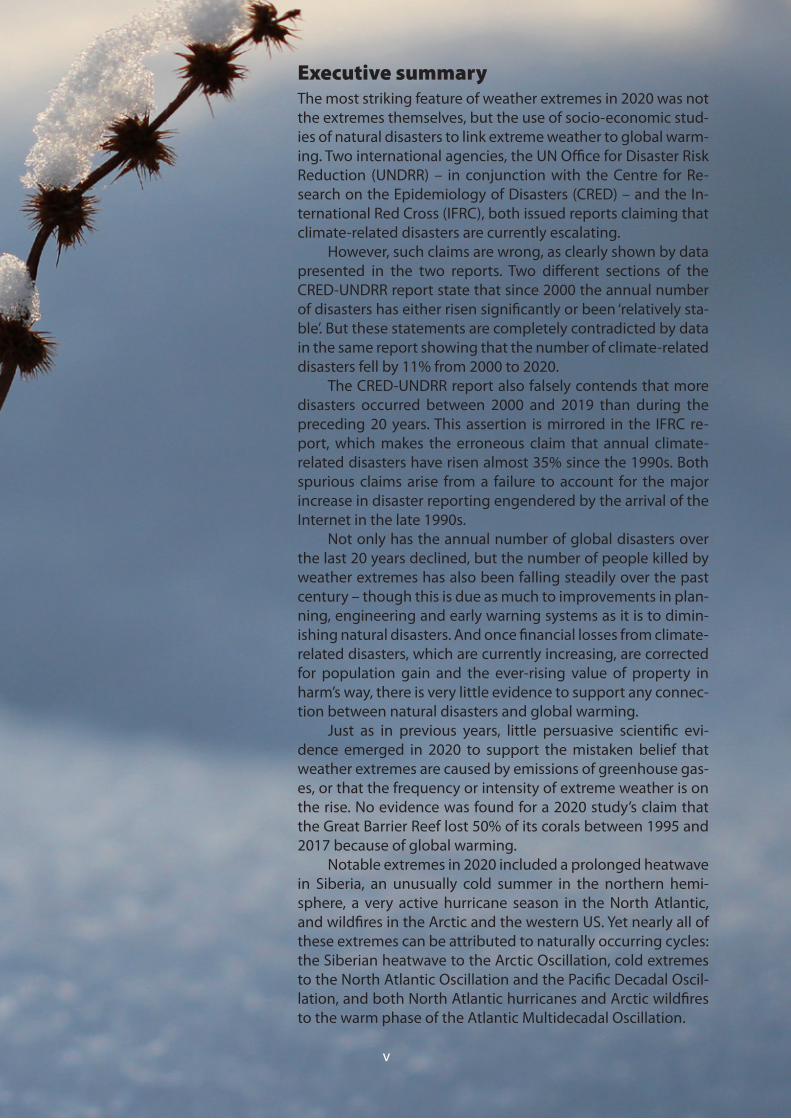
Executive summaryThe most striking feature of weather extremes in 2020 was not the extremes themselves, but the use of socio-economic stud-ies of natural disasters to link extreme weather to global warm-ing. Two international agencies, the UN Office for Disaster Risk Reduction (UNDRR) – in conjunction with the Centre for Re-search on the Epidemiology of Disasters (CRED) – and the In-ternational Red Cross (IFRC), both issued reports claiming that climate-related disasters are currently escalating.
However, such claims are wrong, as clearly shown by data presented in the two reports. Two different sections of the CRED-UNDRR report state that since 2000 the annual number of disasters has either risen significantly or been ‘relatively sta-ble’. But these statements are completely contradicted by data in the same report showing that the number of climate-related disasters fell by 11% from 2000 to 2020.
The CRED-UNDRR report also falsely contends that more disasters occurred between 2000 and 2019 than during the preceding 20 years. This assertion is mirrored in the IFRC re-port, which makes the erroneous claim that annual climate-related disasters have risen almost 35% since the 1990s. Both spurious claims arise from a failure to account for the major increase in disaster reporting engendered by the arrival of the Internet in the late 1990s.
Not only has the annual number of global disasters over the last 20 years declined, but the number of people killed by weather extremes has also been falling steadily over the past century – though this is due as much to improvements in plan-ning, engineering and early warning systems as it is to dimin-ishing natural disasters. And once financial losses from climate-related disasters, which are currently increasing, are corrected for population gain and the ever-rising value of property in harm’s way, there is very little evidence to support any connec-tion between natural disasters and global warming.
Just as in previous years, little persuasive scientific evi-dence emerged in 2020 to support the mistaken belief that weather extremes are caused by emissions of greenhouse gas-es, or that the frequency or intensity of extreme weather is on the rise. No evidence was found for a 2020 study’s claim that the Great Barrier Reef lost 50% of its corals between 1995 and 2017 because of global warming.
Notable extremes in 2020 included a prolonged heatwave in Siberia, an unusually cold summer in the northern hemi-sphere, a very active hurricane season in the North Atlantic, and wildfires in the Arctic and the western US. Yet nearly all of these extremes can be attributed to naturally occurring cycles: the Siberian heatwave to the Arctic Oscillation, cold extremes to the North Atlantic Oscillation and the Pacific Decadal Oscil-lation, and both North Atlantic hurricanes and Arctic wildfires to the warm phase of the Atlantic Multidecadal Oscillation.
1
1. IntroductionThe year 2020 saw continued hype in the mainstream media about the purported link between extreme weather and global warming, but with an added dimension: the widespread use of socio-economic studies of natural disasters, which assess both human and economic vulnerability to natural hazards, as sup-porting evidence. But, just as in previous years, no good scien-tific evidence emerged in 2020 to support claims that weather extremes are caused by emissions of greenhouse gases, or that the frequency or intensity of weather extremes are on the rise.
Section 2 examines two reports on natural disaster analysis issued in 2020 by major international institutions. Subsequent sections update last year’s GWPF report on global warming and extreme weather.1 As well as disaster analysis, the present re-port covers recent heatwaves, coral bleaching, cold extremes, droughts, major floods, hurricanes, tornadoes and wildfires.
2
2. Natural disaster analysisThe mistaken belief that global warming causes weather ex-tremes is often buttressed by studies of the socio-economic risk of natural disasters. In 2020, the Centre for Research on the Epi-demiology of Disasters (CRED) and the UN Office for Disaster Risk Reduction (UNDRR) issued a joint report, insisting that the im-pacts of a warming world ‘are being felt in the increased frequen-cy of extreme weather events including heatwaves, droughts, flooding, winter storms, hurricanes and wildfires’.2 The report draws a strong link between global warming and weather ex-tremes, the majority of which are floods and storms. Ironically, however, the same CRED-UNDRR report reveals that its claim of a ‘staggering rise’ in climate-induced disasters during the last 20 years is wrong.
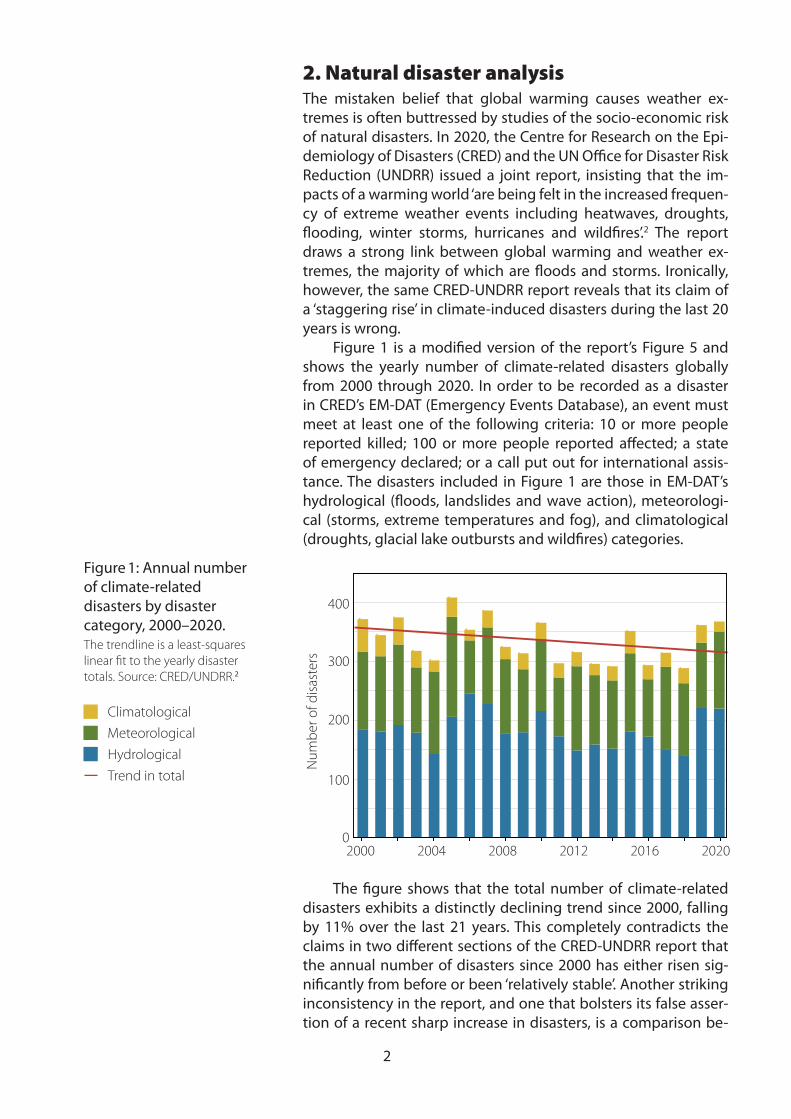
Figure 1 is a modified version of the report’s Figure 5 and shows the yearly number of climate-related disasters globally from 2000 through 2020. In order to be recorded as a disaster in CRED’s EM-DAT (Emergency Events Database), an event must meet at least one of the following criteria: 10 or more people reported killed; 100 or more people reported affected; a state of emergency declared; or a call put out for international assis-tance. The disasters included in Figure 1 are those in EM-DAT’s hydrological (floods, landslides and wave action), meteorologi-cal (storms, extreme temperatures and fog), and climatological (droughts, glacial lake outbursts and wildfires) categories.
The figure shows that the total number of climate-related disasters exhibits a distinctly declining trend since 2000, falling by 11% over the last 21 years. This completely contradicts the claims in two different sections of the CRED-UNDRR report that the annual number of disasters since 2000 has either risen sig-nificantly from before or been ‘relatively stable’. Another striking inconsistency in the report, and one that bolsters its false asser-tion of a recent sharp increase in disasters, is a comparison be-
050
100150200250300350400450
Series1 Series2 Series3
Figure 1: Annual number of climate-related disasters by disaster category, 2000–2020.The trendline is a least-squares linear fit to the yearly disaster totals. Source: CRED/UNDRR.2
HydrologicalTrend in total
MeteorologicalClimatological
2000
Num
ber o
f disa
ster
s
0
100
200
300
400
2004 2008 2012 2016 2020
3
tween the period from 2000 to 2019 and the preceding 20 years from 1980 to 1999. The report contends that the earlier 20 years saw only 4,212 disasters, compared with 7,348 during the later period.2
But the University of Colorado’s Roger Pielke Jr., who stud-ies natural disasters, says these numbers are flawed.3 Data from 20th-century disasters are unreliable because disasters were re-ported differently before the Internet existed, a fact implicitly conceded by CRED itself in its 2004 disaster report:
Over the past 30 years, development in telecommunications, me-dia and increased international cooperation has played a critical role in the number of disasters reported at an international level.4
Climate writer Paul Homewood has uncovered a sudden jump – a near doubling – in the annual number of disasters listed in EM-DAT in 1998 and the years thereafter.5 The abrupt change was acknowledged in the CRED 2006 disaster report:
Two periods can be distinguished: 1987–1997, with the number of disasters varying generally between 200 and 250; and 2000–2006, with the number of disasters increasing by nearly a multiple factor of two. An increase of this magnitude can be partially explained by increased reporting of disasters, particularly by press organizations and specialized agencies.6
So CRED’s claim that the number of disasters over 20 years jumped from 4,212 to 7,348 is meaningless.
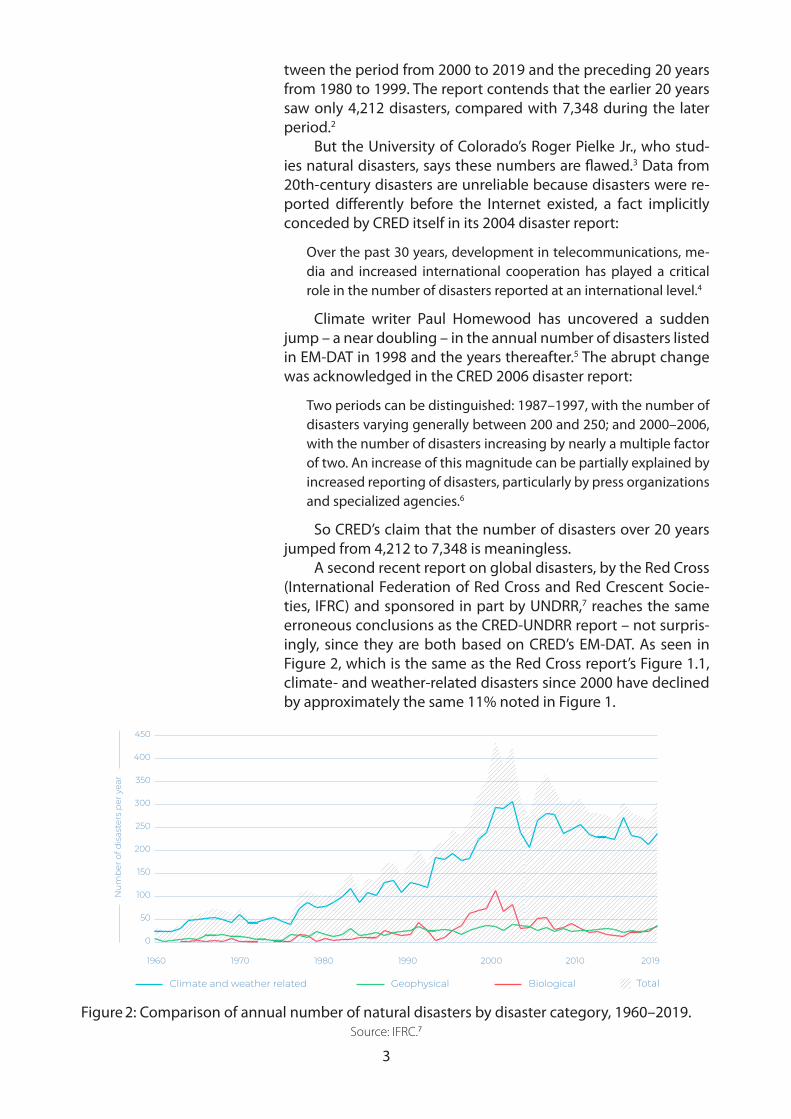
A second recent report on global disasters, by the Red Cross (International Federation of Red Cross and Red Crescent Socie-ties, IFRC) and sponsored in part by UNDRR,7 reaches the same erroneous conclusions as the CRED-UNDRR report – not surpris-ingly, since they are both based on CRED’s EM-DAT. As seen in Figure 2, which is the same as the Red Cross report’s Figure 1.1, climate- and weather-related disasters since 2000 have declined by approximately the same 11% noted in Figure 1.
22 | World Disasters Report 2020
Figure 1.1: Comparison of different types of disasters triggered by natural hazards, 1960–2019
0
50
100
150
200
250
300
350
400
450
2019201020001990198019701960
Climate and weather related Geophysical Biological Total
Nu
mb
er o
f dis
aste
rs p
er y
ear
Sources: The data has been compiled using EM-DAT, ReliefWeb, Dartmouth Flood Observatory and IFRC GO
Climate change is a risk magnifier: raising temperatures,2 negatively impacting ecosystems (Scholes, 2016), sea levels and storm surges, affecting rainfall patterns, but also amplifying the ferocity of extreme weather events, increasing volatility and unpredictability and exacerbating the vulnerabilities of affected communities. And it’s not a distant threat: it’s increasingly clear that these events are affecting people’s lives now.
People around the world are already experiencing these kinds of compounded shocks, and we can expect floods, storms, droughts, heatwaves and wildfires to get worse. As these hazards continue to combine with global heating, sea level rise and increased likelihood of epidemics, this combined with poverty, urbanization and other population trends means that millions of people across all types of countries will be affected.
Of those people affected globally by climate- and weather-related disasters, the IFRC conservatively estimates that some 108 million people needed international humanitarian assistance in 2018, while many more people were affected and needed to rebuild their lives using their own resources, often with support from family, communities and governments. If we couple the projected increases in the frequency and intensity of weather extremes with the growing number of people living in poverty, we could expect some 200 million people a year to need humanitarian assistance by 2050 (IFRC, 2019). And this figure does not include the millions of people around the world affected by conflict, which may well be further exacerbated by climate change.3
2 The global temperature is estimated to have risen 1.1°C since 1850, and by 2100 the temperature rise could well be 4°C or more above pre-industrial levels (1850–1900). 3 Countries in situations of armed conflict are disproportionately affected by climate variability and extremes. This is partly because of their geographical location, but mostly because conflicts and their consequences limit capacity of people, systems and institutions to adapt to hazards and changing climates (ICRC, 2020).
Climate change is increasing not just the number of potentially deadly weather
events but also their ferocity . . . existing weather records are being broken by
new extremes with every passing year, like the sweltering 42.6°C July 2019 heat
in Paris or the staggering 1.26 meters of rain that fell in 24 hours, in April 2018,
on the Hawaiian island of Kauai.Figure 2: Comparison of annual number of natural disasters by disaster category, 1960–2019.
Source: IFRC.7
4
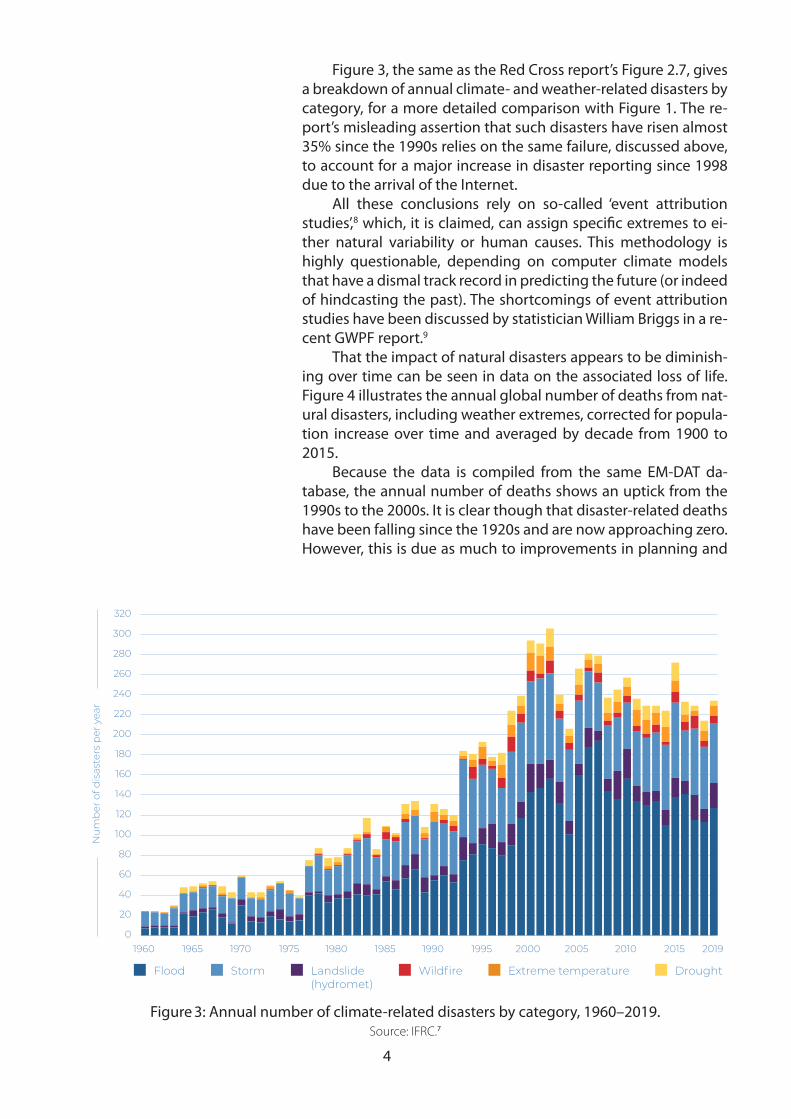
Figure 3, the same as the Red Cross report’s Figure 2.7, gives a breakdown of annual climate- and weather-related disasters by category, for a more detailed comparison with Figure 1. The re-port’s misleading assertion that such disasters have risen almost 35% since the 1990s relies on the same failure, discussed above, to account for a major increase in disaster reporting since 1998 due to the arrival of the Internet.
All these conclusions rely on so-called ‘event attribution studies’,8 which, it is claimed, can assign specific extremes to ei-ther natural variability or human causes. This methodology is highly questionable, depending on computer climate models that have a dismal track record in predicting the future (or indeed of hindcasting the past). The shortcomings of event attribution studies have been discussed by statistician William Briggs in a re-cent GWPF report.9
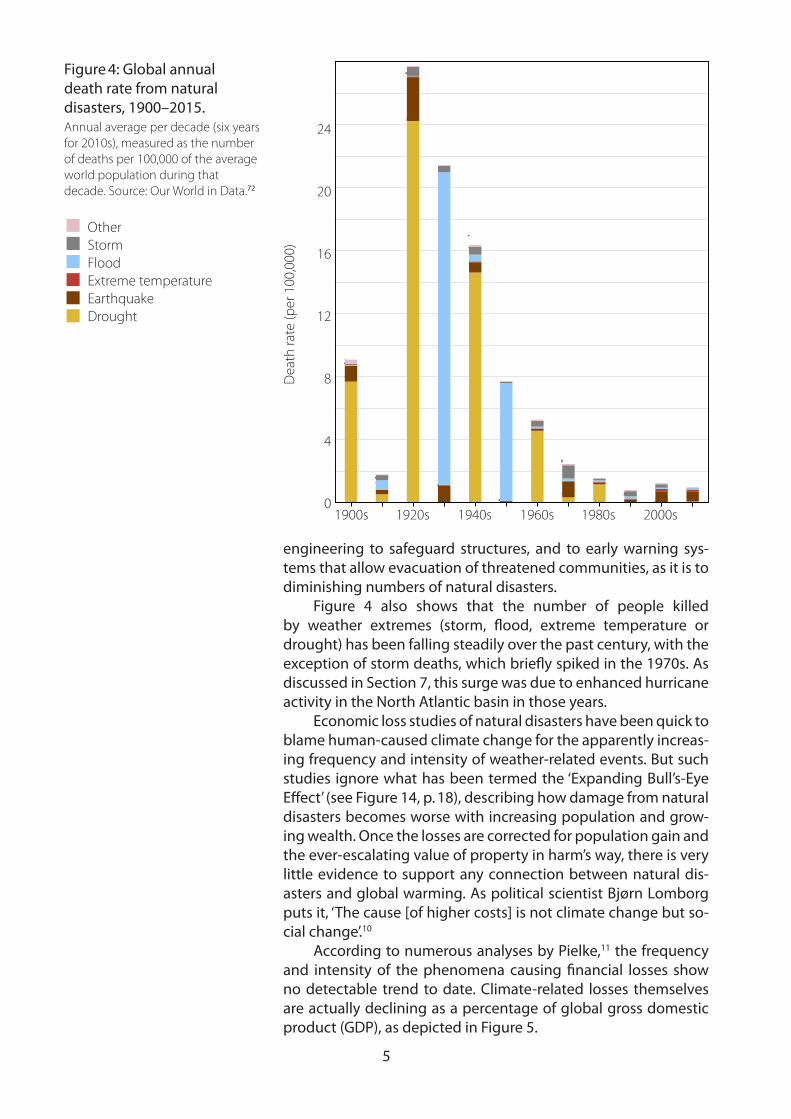
That the impact of natural disasters appears to be diminish-ing over time can be seen in data on the associated loss of life. Figure 4 illustrates the annual global number of deaths from nat-ural disasters, including weather extremes, corrected for popula-tion increase over time and averaged by decade from 1900 to 2015.
Because the data is compiled from the same EM-DAT da-tabase, the annual number of deaths shows an uptick from the 1990s to the 2000s. It is clear though that disaster-related deaths have been falling since the 1920s and are now approaching zero. However, this is due as much to improvements in planning and
52 | World Disasters Report 2020
that triggered disasters appears to have increased in the 2000s from the decades before, but has remained relatively stable since then.12
Global warming has already led to reduced glaciers, polar sea ice and snow cover, and increased permafrost thaw. This is projected to continue due to increases in the surface air temperature (IPCC, 2019a). Similarly, further acidification of the oceans and increased ocean temperatures are “virtually certain”. This will destroy coral reefs, reduce the global biomass of animals across marine ecosystems and diminish the productivity of fisheries, affecting the livelihoods, income and food security of communities that rely on the ocean (IPCC, 2019a).
On land, projected warming is expected to shift certain climate zones in the direction of the poles, and increase heat-related events, droughts, wildfires and pest outbreaks. This will also lead to increased water scarcity in dryland areas, reduced crop and livestock production in certain areas and unstable food supplies. It will also lead to increased land degradation due to a combination of more intense storms and sea level rise (IPCC, 2019b).
Hazards, such as storms, floods, heatwaves, droughts and wildfires, are projected to increase in number, intensity and variability. While some regions will face higher risks, others will face new risks that have not been experienced or anticipated before (IPCC, 2019b; 2019a). Section 2.4 outlines how these disasters will change.
Figure 2.7: Annual numbers of climate- and weather-related disasters by hazard, 1960–2019
Flood Landslide (hydromet)
Storm Wildfire Extreme temperature Drought
0
20
40
60
80
100
120
140
160
180
200
220
240
260
280
300
320
2019201520102005200019951990198519801975197019651960
Nu
mb
er o
f dis
aste
rs p
er y
ear
Sources: EM-DAT, FAO/FEWS NET, Dartmouth Flood Observatory, ReliefWeb and IFRC GO
12 These numbers do not reflect the severity of the extremes, numbers of people affected or the overall average temperatures, which have been increasing over time, with 2016 and 2019 described as the two hottest years on record (WMO, 2020). Further, the regions that are predicted to see the highest increase in extreme temperatures, such as Africa and the Americas (in particular certain countries in South America), are also those that are monitored the least and lack coping capacities (ESRI, no date).
Figure 3: Annual number of climate-related disasters by category, 1960–2019.Source: IFRC.7
5
engineering to safeguard structures, and to early warning sys-tems that allow evacuation of threatened communities, as it is to diminishing numbers of natural disasters.
Figure 4 also shows that the number of people killed by weather extremes (storm, flood, extreme temperature or drought) has been falling steadily over the past century, with the exception of storm deaths, which briefly spiked in the 1970s. As discussed in Section 7, this surge was due to enhanced hurricane activity in the North Atlantic basin in those years.
Economic loss studies of natural disasters have been quick to blame human-caused climate change for the apparently increas-ing frequency and intensity of weather-related events. But such studies ignore what has been termed the ‘Expanding Bull’s-Eye Effect’ (see Figure 14, p. 18), describing how damage from natural disasters becomes worse with increasing population and grow-ing wealth. Once the losses are corrected for population gain and the ever-escalating value of property in harm’s way, there is very little evidence to support any connection between natural dis-asters and global warming. As political scientist Bjørn Lomborg puts it, ‘The cause [of higher costs] is not climate change but so-cial change’.10
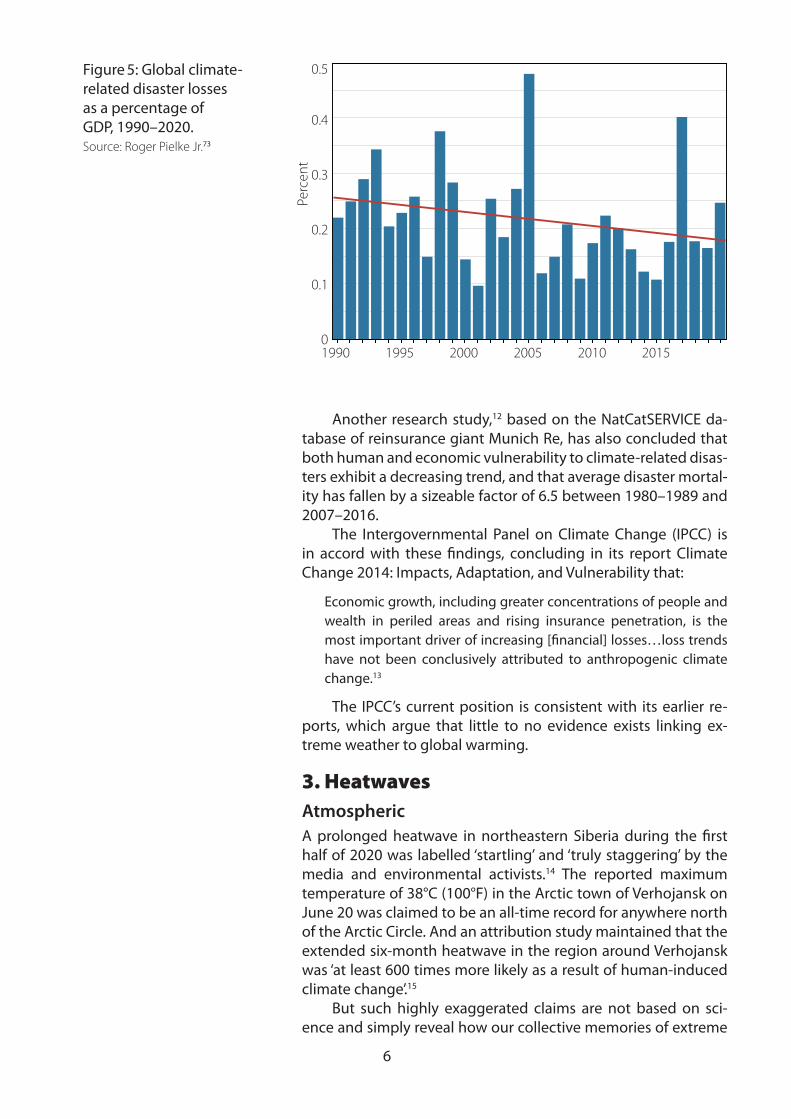
According to numerous analyses by Pielke,11 the frequency and intensity of the phenomena causing financial losses show no detectable trend to date. Climate-related losses themselves are actually declining as a percentage of global gross domestic product (GDP), as depicted in Figure 5.
Figure 4: Global annual death rate from natural disasters, 1900–2015.Annual average per decade (six years for 2010s), measured as the number of deaths per 100,000 of the average world population during that decade. Source: Our World in Data.72
DroughtEarthquakeExtreme temperatureFloodStormOther
Dea
th ra
te (p
er 1
00,0
00)
1900s0
4
8
12
16
24
20
1920s 1940s 1960s 1980s 2000s
6
Another research study,12 based on the NatCatSERVICE da-tabase of reinsurance giant Munich Re, has also concluded that both human and economic vulnerability to climate-related disas-ters exhibit a decreasing trend, and that average disaster mortal-ity has fallen by a sizeable factor of 6.5 between 1980–1989 and 2007–2016.
The Intergovernmental Panel on Climate Change (IPCC) is in accord with these findings, concluding in its report Climate Change 2014: Impacts, Adaptation, and Vulnerability that:
Economic growth, including greater concentrations of people and wealth in periled areas and rising insurance penetration, is the most important driver of increasing [financial] losses…loss trends have not been conclusively attributed to anthropogenic climate change.13
The IPCC’s current position is consistent with its earlier re-ports, which argue that little to no evidence exists linking ex-treme weather to global warming.
3. HeatwavesAtmosphericA prolonged heatwave in northeastern Siberia during the first half of 2020 was labelled ‘startling’ and ‘truly staggering’ by the media and environmental activists.14 The reported maximum temperature of 38°C (100°F) in the Arctic town of Verhojansk on June 20 was claimed to be an all-time record for anywhere north of the Arctic Circle. And an attribution study maintained that the extended six-month heatwave in the region around Verhojansk was ‘at least 600 times more likely as a result of human-induced climate change’.15
But such highly exaggerated claims are not based on sci-ence and simply reveal how our collective memories of extreme
Figure 5: Global climate-related disaster losses as a percentage of GDP, 1990–2020.Source: Roger Pielke Jr.73
1990
Perc
ent
0
0.1
0.2
0.3
0.4
0.5
1995 2000 2005 2010 2015

7
weather are short-lived. As illustrated in Figure 6, the hottest June in Verhojansk occurred way back in 1912; the hottest summer on record was in 1917.16 As the 1910s were well before atmospher-ic carbon dioxide surged, it is most unlikely that the 2020 heat spike had any connection to today’s higher carbon dioxide levels.
In fact, the Siberian heatwave has been attributed to an en-tirely natural atmospheric cycle known as the Arctic Oscillation, which describes Arctic wind circulation and is related to the polar vortex.17 The Arctic Oscillation was strongly positive in the first part of 2020, causing the polar jet stream to become locked in a holding or blocking pattern that brought hot air up from the south for an extended period.
On the east coast, the mercury in Sydney exceeded 40°C (104°F) on back-to-back days, well above the average daytime high for November of only 24°C (75°F). This was an unprecedent-ed event in 160 years of record keeping – and the city also expe-rienced its hottest November night on record. New state records for the spring were set in New South Wales and South Australia.18 Nevertheless, activists soon had to withdraw their claims about human-caused global warming when the highest Sydney tem-perature reached in December was only 30.8°C (87.4°F), and De-cember in the country as a whole was cooler than November for the first time in 70 years.19
In 2019, a brouhaha erupted over two consecutive heat-waves in western Europe. The World Meteorological Organization (WMO) alleged that during the second, which occurred toward the end of July, the temperature in Paris reached a new record high of 42.6°C (108.7°F), besting the previous record of 40.4°C (104.7°F) set back in July 1947.20 A month earlier, during the first heatwave, temperatures in southern France hit a purported re-cord 46.0°C (114.8°F) on 28 June.21
However, in August 1930, Australian22 and New Zealand23 (and presumably French) newspapers gave an account of an earlier French heatwave, in which the temperature soared to a staggering 50°C (122°F) in the Loire valley. And if 1930 saw tem-peratures in central France a full 4.0°C (7.2°F) above the so-called
Figure 6: Average June temperature at Verhojansk, Siberia, 1885–2020.Source: Paul Homewood.16
2010199019701950193019101890
Tem
pera
ture
(°C)
0
4
8
12
16
20
8
record just mentioned for a location in the south of France, it is likely that temperatures in 1930 in the south equaled or exceeded those in the Loire. The same newspaper articles reported a temperature in Paris that day of 37.8°C (100°F), stating that back in 1870 the thermometer had reached an even higher, unspecified level there – quite possibly above the July 2019 ‘record’ of 42.6°C (108.7°F).
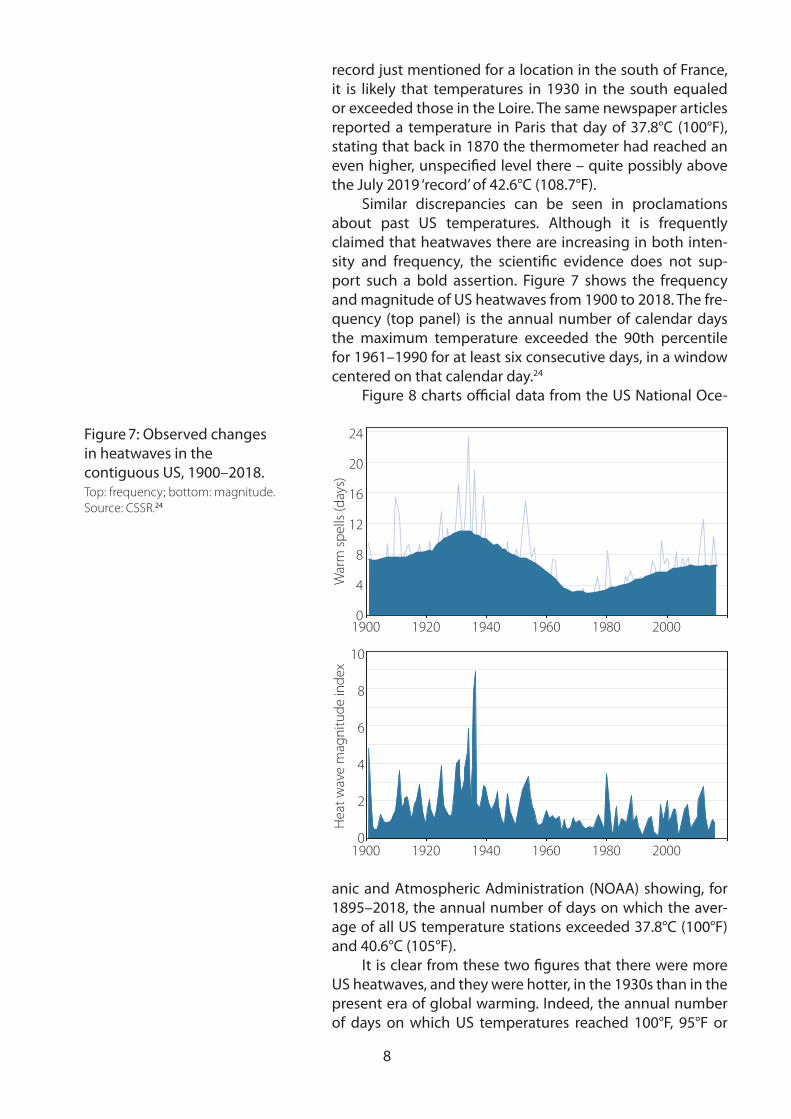
Similar discrepancies can be seen in proclamations about past US temperatures. Although it is frequently claimed that heatwaves there are increasing in both inten-sity and frequency, the scientific evidence does not sup-port such a bold assertion. Figure 7 shows the frequency and magnitude of US heatwaves from 1900 to 2018. The fre-quency (top panel) is the annual number of calendar days the maximum temperature exceeded the 90th percentile for 1961–1990 for at least six consecutive days, in a window centered on that calendar day.24
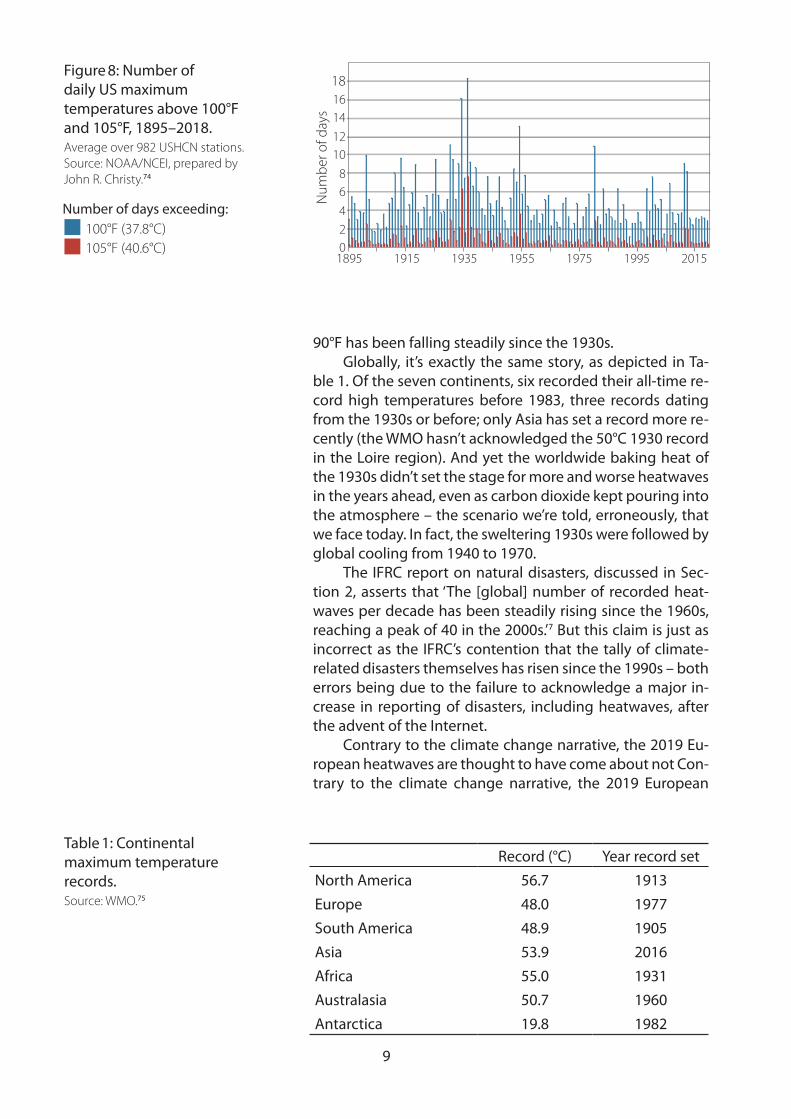
Figure 8 charts official data from the US National Oce-
anic and Atmospheric Administration (NOAA) showing, for 1895–2018, the annual number of days on which the aver-age of all US temperature stations exceeded 37.8°C (100°F) and 40.6°C (105°F).
It is clear from these two figures that there were more US heatwaves, and they were hotter, in the 1930s than in the present era of global warming. Indeed, the annual number of days on which US temperatures reached 100°F, 95°F or
Figure 7: Observed changes in heatwaves in the contiguous US, 1900–2018. Top: frequency; bottom: magnitude. Source: CSSR.24
0
4
8
12
16
20
24
1900
1900
1920
1920
1940
1940
1960
1960
1980
1980
2000
2000
War
m sp
ells
(day
s)H
eat w
ave
mag
nitu
de in
dex
0
4
2
6
8
10
9
90°F has been falling steadily since the 1930s. Globally, it’s exactly the same story, as depicted in Ta-
ble 1. Of the seven continents, six recorded their all-time re-cord high temperatures before 1983, three records dating from the 1930s or before; only Asia has set a record more re-cently (the WMO hasn’t acknowledged the 50°C 1930 record in the Loire region). And yet the worldwide baking heat of the 1930s didn’t set the stage for more and worse heatwaves in the years ahead, even as carbon dioxide kept pouring into the atmosphere – the scenario we’re told, erroneously, that we face today. In fact, the sweltering 1930s were followed by global cooling from 1940 to 1970.
The IFRC report on natural disasters, discussed in Sec-tion 2, asserts that ‘The [global] number of recorded heat-waves per decade has been steadily rising since the 1960s, reaching a peak of 40 in the 2000s.’7 But this claim is just as incorrect as the IFRC’s contention that the tally of climate-related disasters themselves has risen since the 1990s – both errors being due to the failure to acknowledge a major in-crease in reporting of disasters, including heatwaves, after the advent of the Internet.e
Contrary to the climate change narrative, the 2019 Eu-ropean heatwaves are thought to have come about not Con-trary to the climate change narrative, the 2019 European
Figure 8: Number of daily US maximum temperatures above 100°F and 105°F, 1895–2018.Average over 982 USHCN stations. Source: NOAA/NCEI, prepared by John R. Christy.74
Table 1: Continental maximum temperature records.Source: WMO.75
Record (°C) Year record setNorth America 56.7 1913Europe 48.0 1977South America 48.9 1905Asia 53.9 2016Africa 55.0 1931Australasia 50.7 1960Antarctica 19.8 1982
18
14
10
6
024
8
12
16
Num
ber o
f day
s
1895 1915 1935 1955 1975 1995 2015
100°F (37.8°C)105°F (40.6°C)
Number of days exceeding:
10
heatwaves are thought to have come about not because of global warming, but rather the phe-nomenon of jet-stream blocking mentioned ear-lier. As well as the Arctic Oscillation, blocking can also arise as a result of a weakening of the Sun’s output, as is occurring currently. A less active Sun generates less UV radiation, which in turn perturbs winds in the upper atmosphere and locks the polar jet stream in a blocking pattern. In 2019, blocking kept a surge of hot Saharan air in place over Europe for more than a month.25
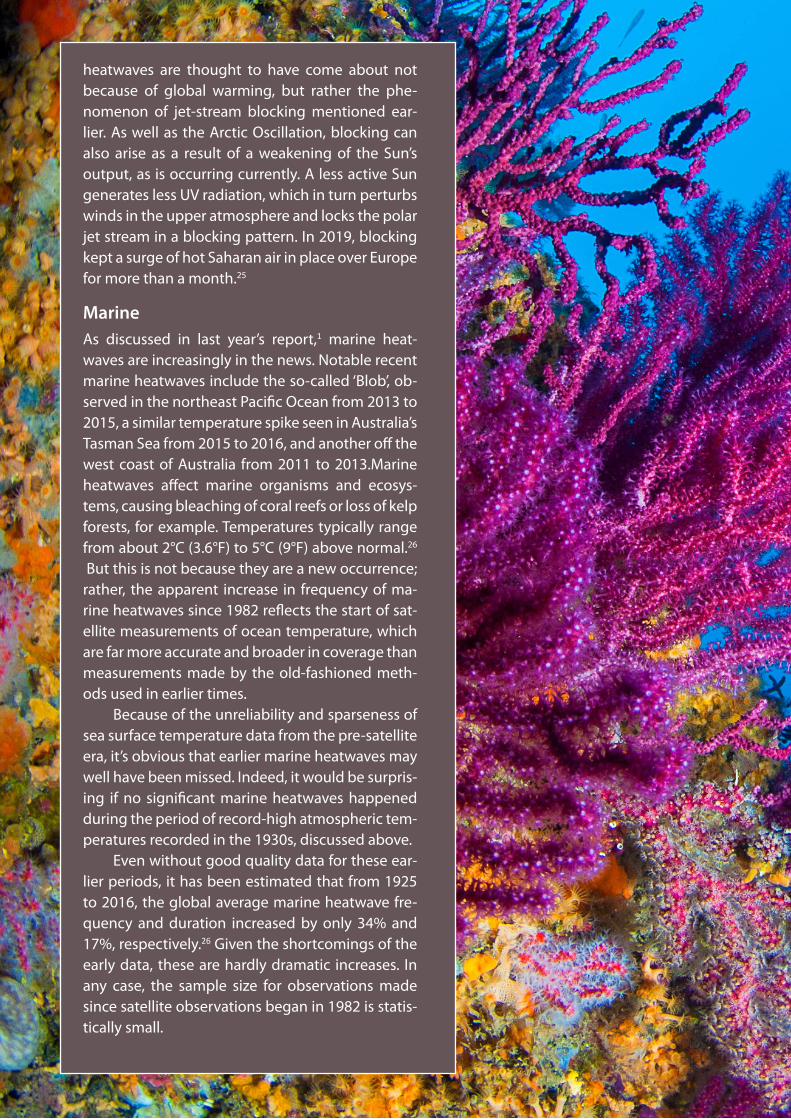
MarineAs discussed in last year’s report,1 marine heat-waves are increasingly in the news. Notable recent marine heatwaves include the so-called ‘Blob’, ob-served in the northeast Pacific Ocean from 2013 to 2015, a similar temperature spike seen in Australia’s Tasman Sea from 2015 to 2016, and another off the west coast of Australia from 2011 to 2013.Marine heatwaves affect marine organisms and ecosys-tems, causing bleaching of coral reefs or loss of kelp forests, for example. Temperatures typically range from about 2°C (3.6°F) to 5°C (9°F) above normal.26
But this is not because they are a new occurrence; rather, the apparent increase in frequency of ma-rine heatwaves since 1982 reflects the start of sat-ellite measurements of ocean temperature, which are far more accurate and broader in coverage than measurements made by the old-fashioned meth-ods used in earlier times.
Because of the unreliability and sparseness of sea surface temperature data from the pre-satellite era, it’s obvious that earlier marine heatwaves may well have been missed. Indeed, it would be surpris-ing if no significant marine heatwaves happened during the period of record-high atmospheric tem-peratures recorded in the 1930s, discussed above.
Even without good quality data for these ear-lier periods, it has been estimated that from 1925 to 2016, the global average marine heatwave fre-quency and duration increased by only 34% and 17%, respectively.26 Given the shortcomings of the early data, these are hardly dramatic increases. In any case, the sample size for observations made since satellite observations began in 1982 is statis-tically small.
11
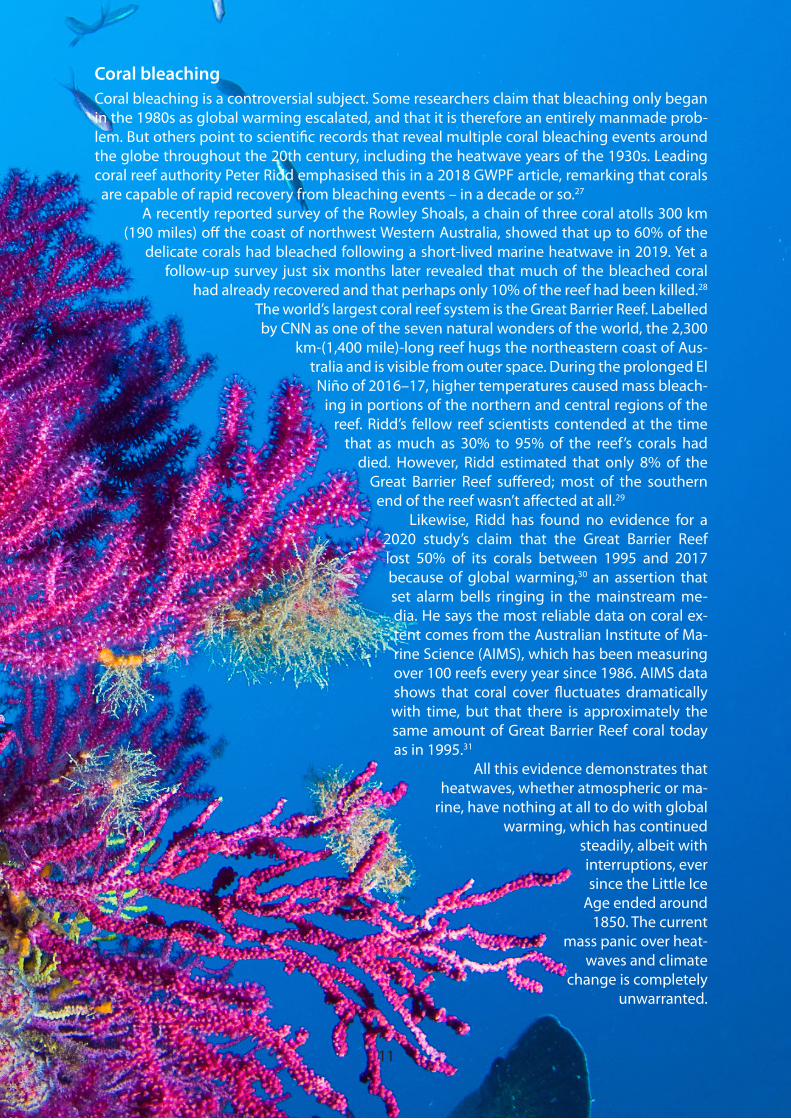
Coral bleachingCoral bleaching is a controversial subject. Some researchers claim that bleaching only began in the 1980s as global warming escalated, and that it is therefore an entirely manmade prob-lem. But others point to scientific records that reveal multiple coral bleaching events around the globe throughout the 20th century, including the heatwave years of the 1930s. Leading coral reef authority Peter Ridd emphasised this in a 2018 GWPF article, remarking that corals are capable of rapid recovery from bleaching events – in a decade or so.27
A recently reported survey of the Rowley Shoals, a chain of three coral atolls 300 km (190 miles) off the coast of northwest Western Australia, showed that up to 60% of the
delicate corals had bleached following a short-lived marine heatwave in 2019. Yet a follow-up survey just six months later revealed that much of the bleached coral
had already recovered and that perhaps only 10% of the reef had been killed.28
The world’s largest coral reef system is the Great Barrier Reef. Labelled by CNN as one of the seven natural wonders of the world, the 2,300
km-(1,400 mile)-long reef hugs the northeastern coast of Aus-tralia and is visible from outer space. During the prolonged El Niño of 2016–17, higher temperatures caused mass bleach-
ing in portions of the northern and central regions of the reef. Ridd’s fellow reef scientists contended at the time
that as much as 30% to 95% of the reef’s corals had died. However, Ridd estimated that only 8% of the
Great Barrier Reef suffered; most of the southern end of the reef wasn’t affected at all.29
Likewise, Ridd has found no evidence for a 2020 study’s claim that the Great Barrier Reef lost 50% of its corals between 1995 and 2017 because of global warming,30 an assertion that set alarm bells ringing in the mainstream me-dia. He says the most reliable data on coral ex-tent comes from the Australian Institute of Ma-rine Science (AIMS), which has been measuring over 100 reefs every year since 1986. AIMS data shows that coral cover fluctuates dramatically with time, but that there is approximately the same amount of Great Barrier Reef coral today as in 1995.31
All this evidence demonstrates that heatwaves, whether atmospheric or ma-
rine, have nothing at all to do with global warming, which has continued
steadily, albeit with interruptions, ever since the Little Ice
Age ended around 1850. The current
mass panic over heat-waves and climate
change is completely unwarranted.
12
4. Cold extremesEvidence for increasing cold extremes continued to accumulate in 2020, with cold temperature records being broken all over the globe. During the 2020 southern winter and northern summer, the Australian island state of Tasmania recorded its most frigid winter minimum ever, exceeding the previous low of −13.0°C (8.6°F) by 1.2°C (2.2°F); Norway endured its chilliest July in 50 years; neighbouring Sweden shivered through its coldest sum-mer since 1962; and Russia was also bone-chilling cold.32
In the northern autumn of 2020, bitterly cold temperatures afflicted many communities in the US and Canada. The north-ern US state of Minnesota experienced its largest early-season snowstorm in recorded history, going back about 140 years. The cities of Alexandria and St. Cloud, Minnesota saw their snowiest October on record, snow records also falling in towns and cities across Montana and South Dakota.33 And in late December, the subfreezing polar vortex began to expand out of the Arctic.
Earlier in the year, massive snowstorms covered much of Patagonia in more than 150 cm (60 inches) of snow, and buried alive at least 100,000 sheep and 5,000 cattle.34 Snowfalls not seen for decades occurred in other parts of South America, and in South Africa, southeastern Australia and New Zealand.
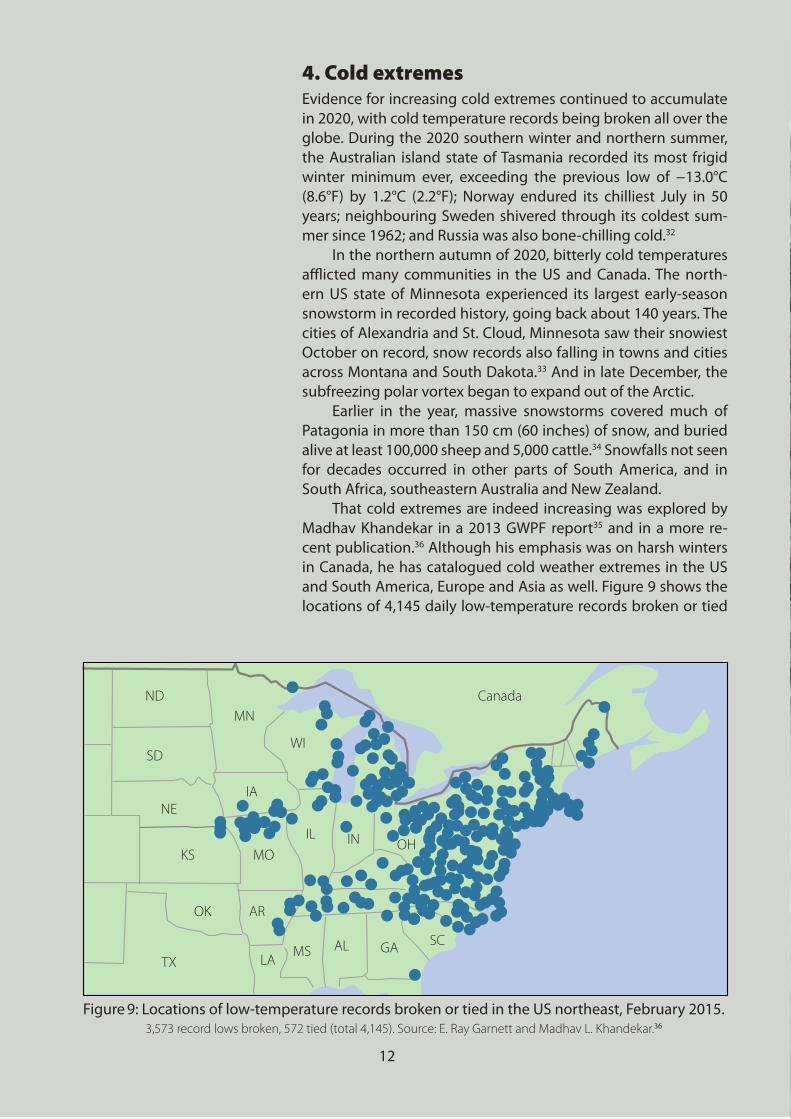
That cold extremes are indeed increasing was explored by Madhav Khandekar in a 2013 GWPF report35 and in a more re-cent publication.36 Although his emphasis was on harsh winters in Canada, he has catalogued cold weather extremes in the US and South America, Europe and Asia as well. Figure 9 shows the locations of 4,145 daily low-temperature records broken or tied
Figure 9: Locations of low-temperature records broken or tied in the US northeast, February 2015.3,573 record lows broken, 572 tied (total 4,145). Source: E. Ray Garnett and Madhav L. Khandekar.36
NDMN
WI
Canada
MOIL IN OH
AR
LAMS AL GA SC
IA
SD
NE
KS
OK
TX
13
in the northeastern US during an ice-cold February 2015; 2015 tied with 1904 for the coldest January to March period in the northeast, on records extending back to 1895.
In remarking recently that extreme weather – both hot and cold – is part of natural climate variability, Khandekar points out:
Even when the earth’s climate was cooling down during the 1945–77 period there were as many extreme weather events as there are now.37
Khandekar links colder and snowier-than-normal winters in North America not to climate change, but to the naturally occurring North At-lantic Oscillation and Pacific Decadal Oscillation, and those in Europe to the slowing down in solar activity mentioned in Section 3. Yet the WMO and similar organizations, who are convinced that climate change causes other weather extremes, have no explanation for the origin of cold ex-tremes nor their apparently rising frequency.
14
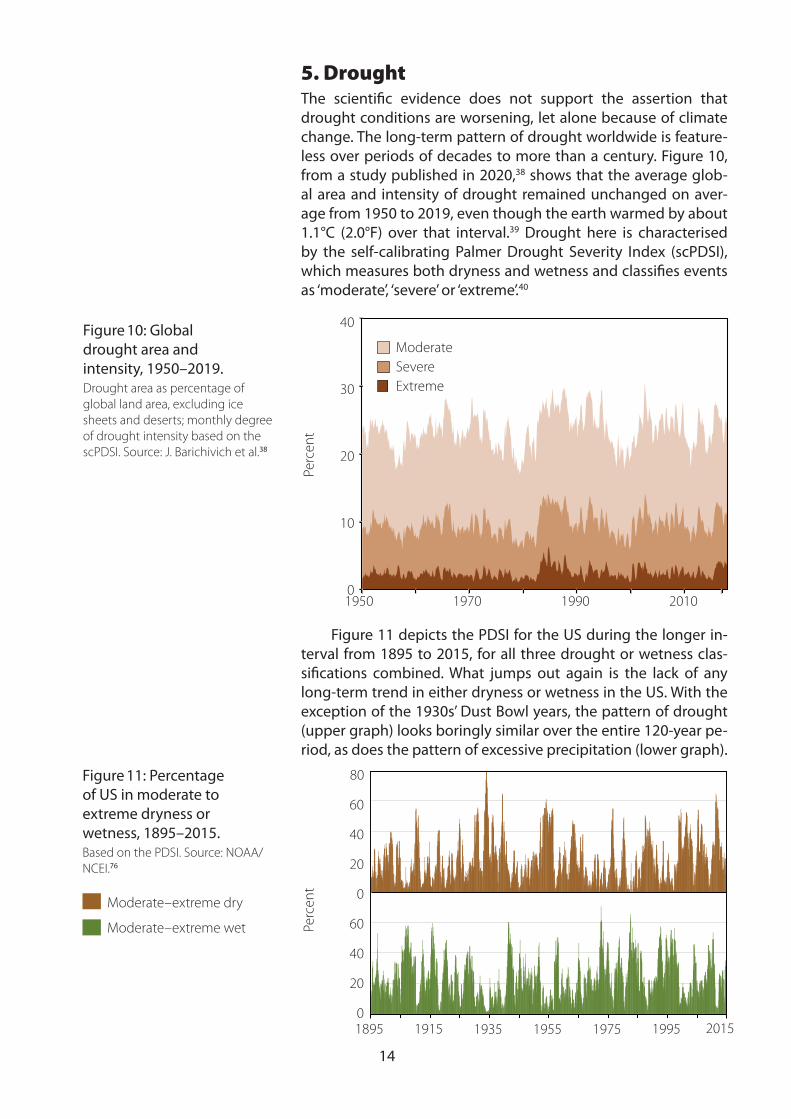
5. DroughtThe scientific evidence does not support the assertion that drought conditions are worsening, let alone because of climate change. The long-term pattern of drought worldwide is feature-less over periods of decades to more than a century. Figure 10, from a study published in 2020,38 shows that the average glob-al area and intensity of drought remained unchanged on aver-age from 1950 to 2019, even though the earth warmed by about 1.1°C (2.0°F) over that interval.39 Drought here is characterised by the self-calibrating Palmer Drought Severity Index (scPDSI), which measures both dryness and wetness and classifies events as ‘moderate’, ‘severe’ or ‘extreme’.40
Figure 11 depicts the PDSI for the US during the longer in-terval from 1895 to 2015, for all three drought or wetness clas-sifications combined. What jumps out again is the lack of any long-term trend in either dryness or wetness in the US. With the exception of the 1930s’ Dust Bowl years, the pattern of drought (upper graph) looks boringly similar over the entire 120-year pe-riod, as does the pattern of excessive precipitation (lower graph).
Moderate–extreme dry
Moderate–extreme wet
Figure 11: Percentage of US in moderate to extreme dryness or wetness, 1895–2015.Based on the PDSI. Source: NOAA/NCEI.76
Figure 10: Global drought area and intensity, 1950–2019.Drought area as percentage of global land area, excluding ice sheets and deserts; monthly degree of drought intensity based on the scPDSI. Source: J. Barichivich et al.38
1950 1970 1990 2010
Perc
ent
30
20
10
0
40
ModerateSevereExtreme
1895
Perc
ent
1915 1935 1955 1975 1995 2015
80
0
20
40
60
0
20
40
60
15
Droughts have been a continuing feature of the Earth’s cli-mate for millennia. Although generally caused by a severe fall-off in precipitation, and not by global warming as environmentalists sometimes claim, droughts can be aggravated by factors such as elevated temperatures, soil erosion and overuse of available groundwater. The consequences of drought, which can be disas-trous for human and animal life, include crop failure, starvation and mass migration.
Recently, the media created a false alarm over drought by thoughtlessly broadcasting the results of a new study, claiming to demonstrate that global warming will soon result in ‘unprece-dented drying’.41 By combining computer models with long-term observations, the study’s authors maintained they had defini-tively connected global warming to drought.
But this claim doesn’t hold up. Although the authors were able to match warming to drought conditions during the first half of the 20th century, their efforts were a total failure beyond that. From 1950 to 1980, the ‘fingerprint’ of human-caused glob-al warming completely disappeared, in spite of ever-increasing carbon dioxide in the atmosphere. And from 1981 onward, the fingerprint was so faint that it couldn’t be distinguished from background noise. So the assertion by the authors that global warming causes drought is merely a perverse kind of wishful thinking.
The scientific evidence simply does not support the idea that drought is being made worse by global warming. Ice cores from Antarctica reveal that much more dust – a sign of a dry cli-mate – was deposited during the ice ages than during warmer in-terglacial periods. The IPCC was right to express low confidence in any global-scale observed trend in drought.42
16
6. Precipitation and floodsWhile a deficiency in precipitation can result in drought, excess rain can cause severe flooding. Widespread flooding in the US Midwest during the spring of 2019 only served to amplify the voices of those who insist that climate change has intensified weather extremes. Like-minded voices in other countries have also fallen into the same trap of linking major floods to global warming.
But, just as for heatwaves and drought, there is no evidence that floods are becoming worse or more common. Precipitation tends to increase in a warmer world because of enhanced evap-oration from tropical oceans, resulting in more water vapour in the atmosphere. Yet floods caused by rain occur only under spe-cific weather conditions. There is no reason, says meteorologist William Kininmonth,43 to expect any change in the frequency or intensity of weather systems that produce rain flood events un-less it can be demonstrated that global warming changes the dy-namics of the atmosphere.
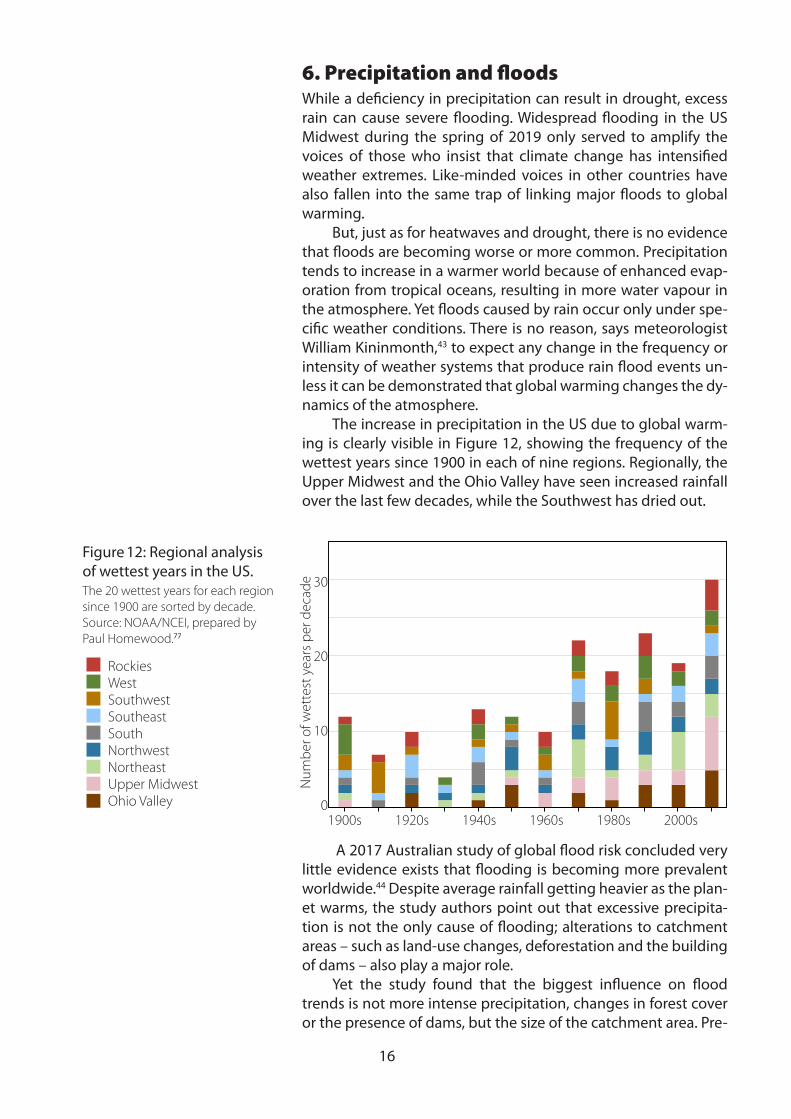
The increase in precipitation in the US due to global warm-ing is clearly visible in Figure 12, showing the frequency of the wettest years since 1900 in each of nine regions. Regionally, the Upper Midwest and the Ohio Valley have seen increased rainfall over the last few decades, while the Southwest has dried out.
A 2017 Australian study of global flood risk concluded very little evidence exists that flooding is becoming more prevalent worldwide.44 Despite average rainfall getting heavier as the plan-et warms, the study authors point out that excessive precipita-tion is not the only cause of flooding; alterations to catchment areas – such as land-use changes, deforestation and the building of dams – also play a major role.
Yet the study found that the biggest influence on flood trends is not more intense precipitation, changes in forest cover or the presence of dams, but the size of the catchment area. Pre-
0
5
10
15
20
25
30
35
1900s 1910s 1920s 1930s 1940s 1950s 1960s 1970s 1980s 1990s 2000s 2010s
Ohio Upper MW Northeast Northwest South
Southeast Southwest West Rockies
Figure 12: Regional analysis of wettest years in the US. The 20 wettest years for each region since 1900 are sorted by decade. Source: NOAA/NCEI, prepared by Paul Homewood.77
1900s
Num
ber o
f wet
test
yea
rs p
er d
ecad
e
0
10
20
30
1920s 1940s 1960s 1980s 2000s
0
5
10
15
20
25
30
35
1900s 1910s 1920s 1930s 1940s 1950s 1960s 1970s 1980s 1990s 2000s 2010s
Ohio Upper MW Northeast Northwest South
Southeast Southwest West Rockies
RockiesWestSouthwestSoutheastSouthNorthwestNortheastUpper MidwestOhio Valley
17
vious studies had emphasised small catchment areas, as these were thought less likely to have been extensively modified. How-ever, the new study discovered that, even though smaller catch-ments do show a trend in flood risk that is increasing over time, larger catchments exhibit a decreasing trend.
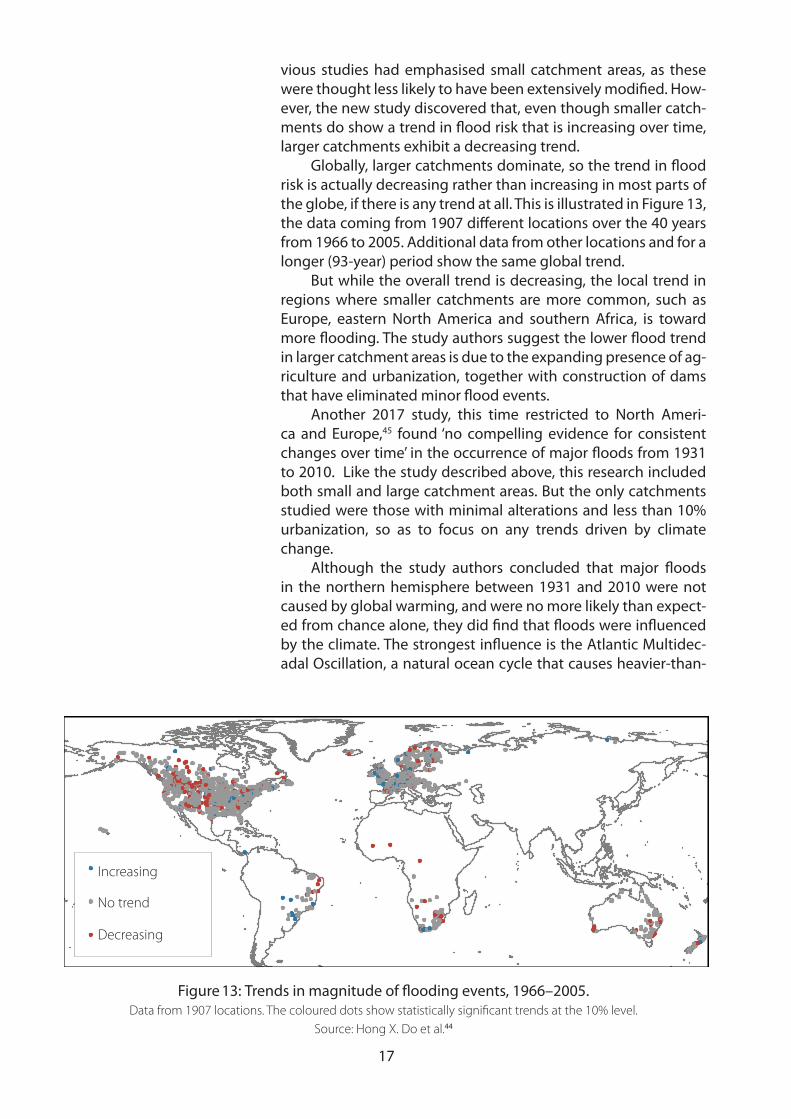
Globally, larger catchments dominate, so the trend in flood risk is actually decreasing rather than increasing in most parts of the globe, if there is any trend at all. This is illustrated in Figure 13, the data coming from 1907 different locations over the 40 years from 1966 to 2005. Additional data from other locations and for a longer (93-year) period show the same global trend.
But while the overall trend is decreasing, the local trend in regions where smaller catchments are more common, such as Europe, eastern North America and southern Africa, is toward more flooding. The study authors suggest the lower flood trend in larger catchment areas is due to the expanding presence of ag-riculture and urbanization, together with construction of dams that have eliminated minor flood events.
Another 2017 study, this time restricted to North Ameri-ca and Europe,45 found ‘no compelling evidence for consistent changes over time’ in the occurrence of major floods from 1931 to 2010. Like the study described above, this research included both small and large catchment areas. But the only catchments studied were those with minimal alterations and less than 10% urbanization, so as to focus on any trends driven by climate change.
Although the study authors concluded that major floods in the northern hemisphere between 1931 and 2010 were not caused by global warming, and were no more likely than expect-ed from chance alone, they did find that floods were influenced by the climate. The strongest influence is the Atlantic Multidec-adal Oscillation, a natural ocean cycle that causes heavier-than-
Figure 13: Trends in magnitude of flooding events, 1966–2005.Data from 1907 locations. The coloured dots show statistically significant trends at the 10% level.
Source: Hong X. Do et al.44
Increasing
No trend
Decreasing

18
normal rainfall in Europe and lighter rainfall in North America during its warm phase – leading to an increase in major Euro-pean floods and a decrease in North American ones.
The illusion that major floods are becoming more frequent is due in part to the world’s growing population and the appeal, in the more developed countries at least, of living near water. This has led to more people building their dream homes in vulner-able locations, on river or coastal floodplains, as shown in Fig-ure 14, which depicts the Expanding Bull’s-Eye Effect discussed in Section 2. A larger population exposes more individuals and property to the devastation wrought by intermittent flooding from rainfall-swollen rivers or storm surges. It is changing human wants rather than climate change that are responsible for disas-trous floods.
Figure 14: The Expanding Bull’s-Eye Effect for floods.A hypothetical flood impacting a growing city will cause much more destruction in 2040 than in 1950. Source: Bjørn
Lomborg.10
Rural
1950
2010
1980
2040
Exurban Suburban Urban Water Flood zone
19
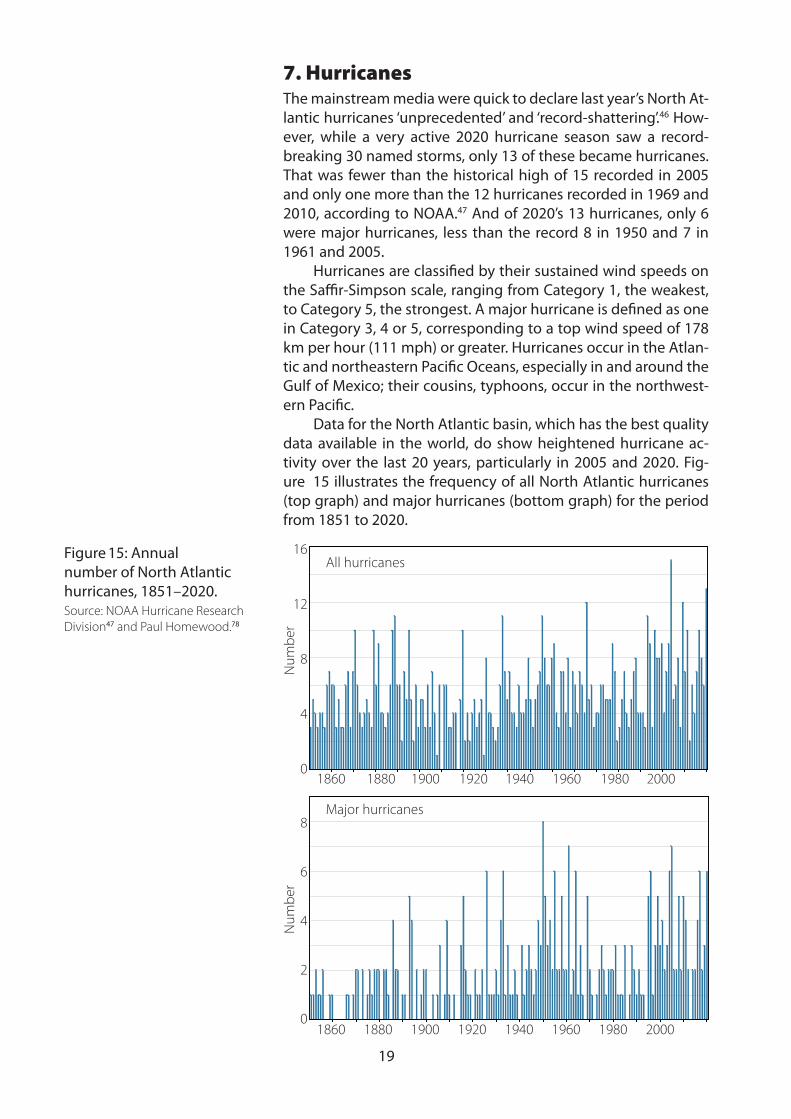
7. HurricanesThe mainstream media were quick to declare last year’s North At-lantic hurricanes ‘unprecedented’ and ‘record-shattering’.46 How-ever, while a very active 2020 hurricane season saw a record-breaking 30 named storms, only 13 of these became hurricanes. That was fewer than the historical high of 15 recorded in 2005 and only one more than the 12 hurricanes recorded in 1969 and 2010, according to NOAA.47 And of 2020’s 13 hurricanes, only 6 were major hurricanes, less than the record 8 in 1950 and 7 in 1961 and 2005.
Hurricanes are classified by their sustained wind speeds on the Saffir-Simpson scale, ranging from Category 1, the weakest, to Category 5, the strongest. A major hurricane is defined as one in Category 3, 4 or 5, corresponding to a top wind speed of 178 km per hour (111 mph) or greater. Hurricanes occur in the Atlan-tic and northeastern Pacific Oceans, especially in and around the Gulf of Mexico; their cousins, typhoons, occur in the northwest-ern Pacific.
Data for the North Atlantic basin, which has the best quality data available in the world, do show heightened hurricane ac-tivity over the last 20 years, particularly in 2005 and 2020. Fig-ure 15 illustrates the frequency of all North Atlantic hurricanes (top graph) and major hurricanes (bottom graph) for the period from 1851 to 2020.
Figure 15: Annual number of North Atlantic hurricanes, 1851–2020.Source: NOAA Hurricane Research Division47 and Paul Homewood.78
1860
Num
ber
0
4
8
12
16
1880
All hurricanes
Major hurricanes
1900 1920 1940 1960 1980 2000
Num
ber
0
2
4
6
8
1860 1880 1900 1920 1940 1960 1980 2000
20
Although it appears that major Atlantic hurricanes were less frequent before about 1940, the lower numbers reflect the rela-tive lack of observations in early years of the record. Aircraft re-connaissance flights to gather data on hurricanes only began in 1944, while satellite coverage dates only from the 1960s.
What the data reveals is that the frequency of major North Atlantic hurricanes in the 1950s and 1960s was at least compara-ble to that in the last two decades when, as can be seen, it took a sudden upward hike from the 1970s, 1980s and 1990s. But, be-cause the Earth was cooling during the increased activity in the 1950s and 1960s, global warming fails to offer a neat explanation for the present enhanced hurricane activity in the North Atlantic.
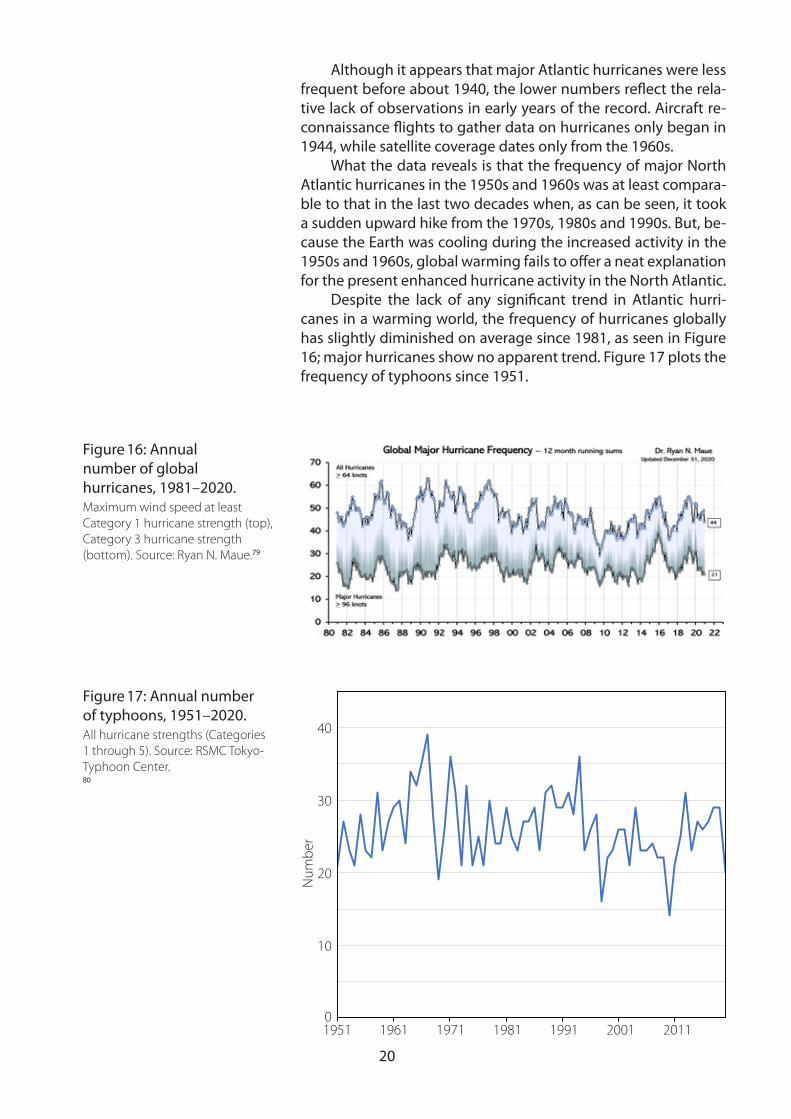
Despite the lack of any significant trend in Atlantic hurri-canes in a warming world, the frequency of hurricanes globally has slightly diminished on average since 1981, as seen in Figure 16; major hurricanes show no apparent trend. Figure 17 plots the frequency of typhoons since 1951.
Figure 16: Annual number of global hurricanes, 1981–2020.Maximum wind speed at least Category 1 hurricane strength (top), Category 3 hurricane strength (bottom). Source: Ryan N. Maue.79
Figure 17: Annual number of typhoons, 1951–2020.All hurricane strengths (Categories 1 through 5). Source: RSMC Tokyo-Typhoon Center. 80
1951
Num
ber
0
10
20
30
40
1961 1971 1981 1991 2001 2011
21
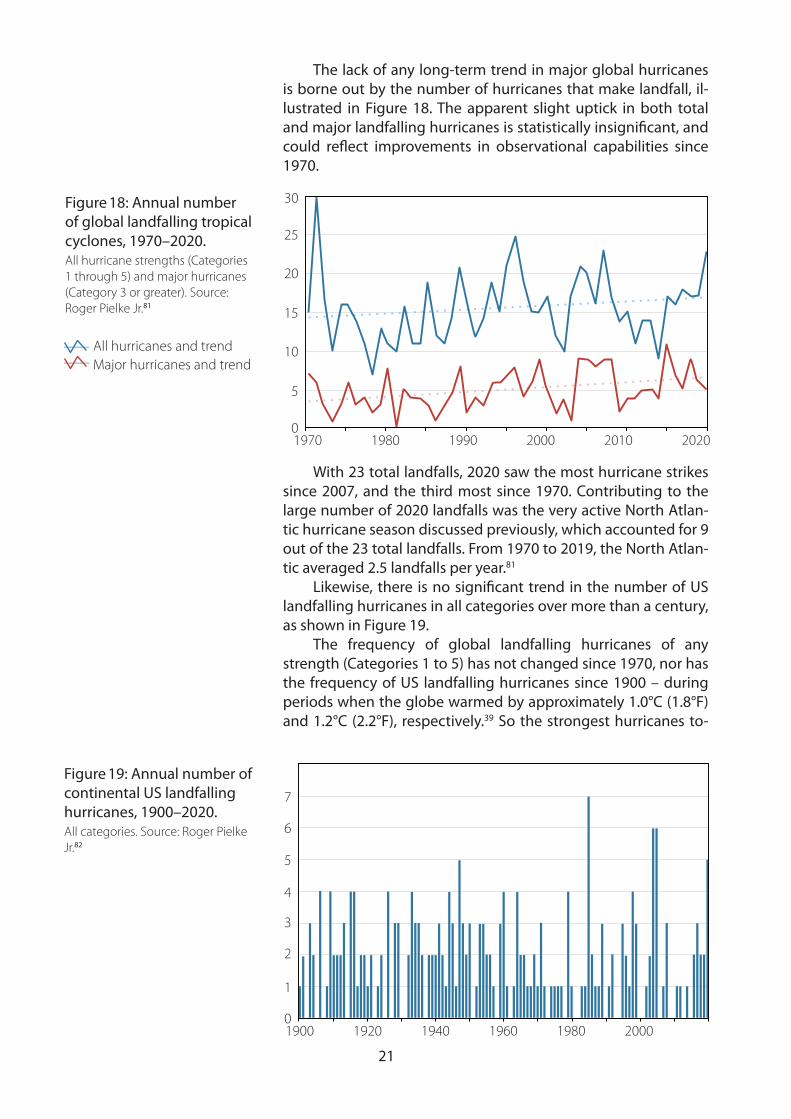
The lack of any long-term trend in major global hurricanes is borne out by the number of hurricanes that make landfall, il-lustrated in Figure 18. The apparent slight uptick in both total and major landfalling hurricanes is statistically insignificant, and could reflect improvements in observational capabilities since 1970.
With 23 total landfalls, 2020 saw the most hurricane strikes since 2007, and the third most since 1970. Contributing to the large number of 2020 landfalls was the very active North Atlan-tic hurricane season discussed previously, which accounted for 9 out of the 23 total landfalls. From 1970 to 2019, the North Atlan-tic averaged 2.5 landfalls per year.81
Likewise, there is no significant trend in the number of US landfalling hurricanes in all categories over more than a century, as shown in Figure 19.
The frequency of global landfalling hurricanes of any strength (Categories 1 to 5) has not changed since 1970, nor has the frequency of US landfalling hurricanes since 1900 – during periods when the globe warmed by approximately 1.0°C (1.8°F) and 1.2°C (2.2°F), respectively.39 So the strongest hurricanes to-
Figure 18: Annual number of global landfalling tropical cyclones, 1970–2020.All hurricane strengths (Categories 1 through 5) and major hurricanes (Category 3 or greater). Source: Roger Pielke Jr.81
Figure 19: Annual number of continental US landfalling hurricanes, 1900–2020.All categories. Source: Roger Pielke Jr.82
1970
Major hurricanes and trendAll hurricanes and trend
0
5
10
15
20
25
30
1980 1990 2000 2010 2020
19000
1
2
3
4
5
6
7
1920 1940 1960 1980 2000
22
day are no more extreme or devastating than those in the past. If anything, major landfalling hurricanes in the US are tied to La Niña cycles in the Pacific Ocean, not to global warming.
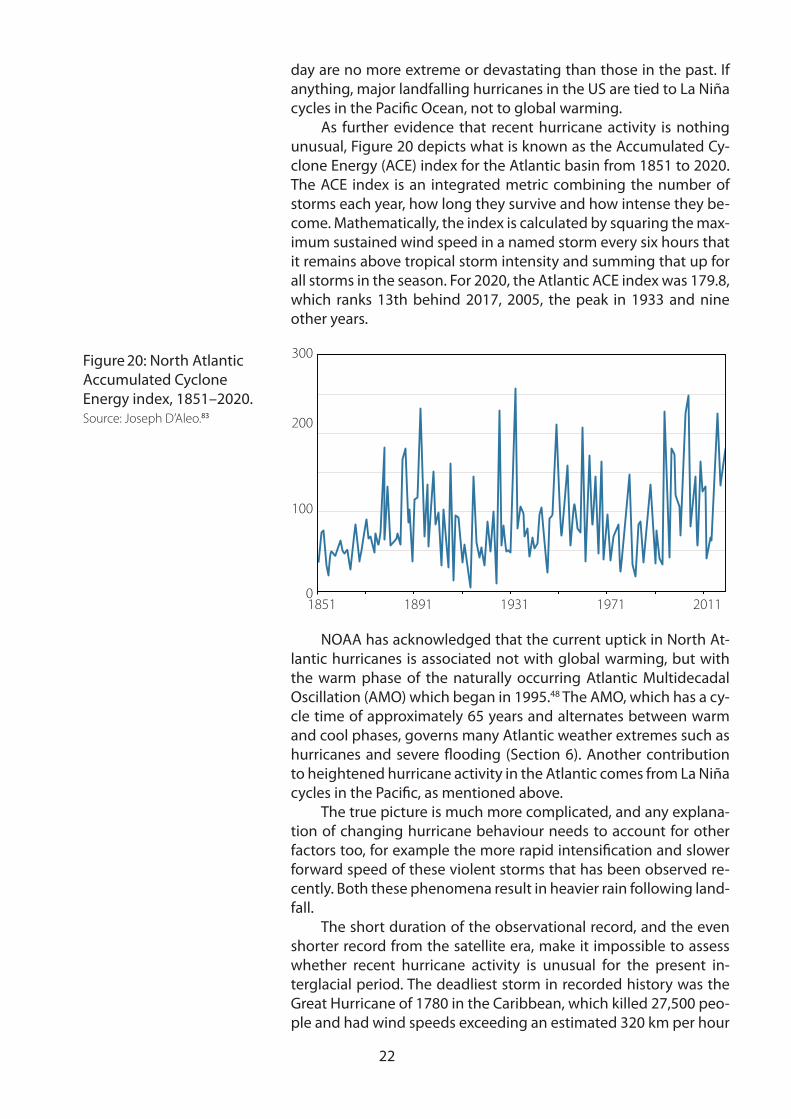
As further evidence that recent hurricane activity is nothing unusual, Figure 20 depicts what is known as the Accumulated Cy-clone Energy (ACE) index for the Atlantic basin from 1851 to 2020. The ACE index is an integrated metric combining the number of storms each year, how long they survive and how intense they be-come. Mathematically, the index is calculated by squaring the max-imum sustained wind speed in a named storm every six hours that it remains above tropical storm intensity and summing that up for all storms in the season. For 2020, the Atlantic ACE index was 179.8, which ranks 13th behind 2017, 2005, the peak in 1933 and nine other years.
NOAA has acknowledged that the current uptick in North At-lantic hurricanes is associated not with global warming, but with the warm phase of the naturally occurring Atlantic Multidecadal Oscillation (AMO) which began in 1995.48 The AMO, which has a cy-cle time of approximately 65 years and alternates between warm and cool phases, governs many Atlantic weather extremes such as hurricanes and severe flooding (Section 6). Another contribution to heightened hurricane activity in the Atlantic comes from La Niña cycles in the Pacific, as mentioned above.
The true picture is much more complicated, and any explana-tion of changing hurricane behaviour needs to account for other factors too, for example the more rapid intensification and slower forward speed of these violent storms that has been observed re-cently. Both these phenomena result in heavier rain following land-fall.
The short duration of the observational record, and the even shorter record from the satellite era, make it impossible to assess whether recent hurricane activity is unusual for the present in-terglacial period. The deadliest storm in recorded history was the Great Hurricane of 1780 in the Caribbean, which killed 27,500 peo-ple and had wind speeds exceeding an estimated 320 km per hour
Figure 20: North Atlantic Accumulated Cyclone Energy index, 1851–2020.Source: Joseph D’Aleo.83
18510
100
200
300
1891 1931 1971 2011
23
(200 mph). In summarising paleogeological studies of storms that raged prior to the historical record, climate scientist Judith Curry suggests that changes in hurricane activity, such as those seen re-cently, are not at all uncommon, with several periods of frequent intense hurricane strikes having occurred thousands of years ago.49
Yet there is almost no evidence for any current global trend in hurricane strength. Even the IPCC has found ‘no significant ob-served trends’ in the number of global hurricanes each year.50
8. TornadoesA tornado is a rapidly rotating column of air, usually visible as a fun-nel cloud, that extends like a dagger from a parent thunderstorm to the ground. While tornadoes are smaller and claim fewer lives than hurricanes, they form rapidly and frequently demolish homes and buildings in their often narrow path. Like hurricanes, tornadoes are categorised according to wind speed, using the Fujita Scale going from EF0 to EF5; EF5 tornadoes attain wind speeds up to 480 km per hour (300 mph).
Tornadoes, which occur predominantly in the US, did not dis-tinguish 2020 any more than hurricanes. The annual tornado count was just below the mean since 2005, and the US is currently in its second-longest period between observations of the strongest EF5 tornadoes, the last having been observed in 2013.51
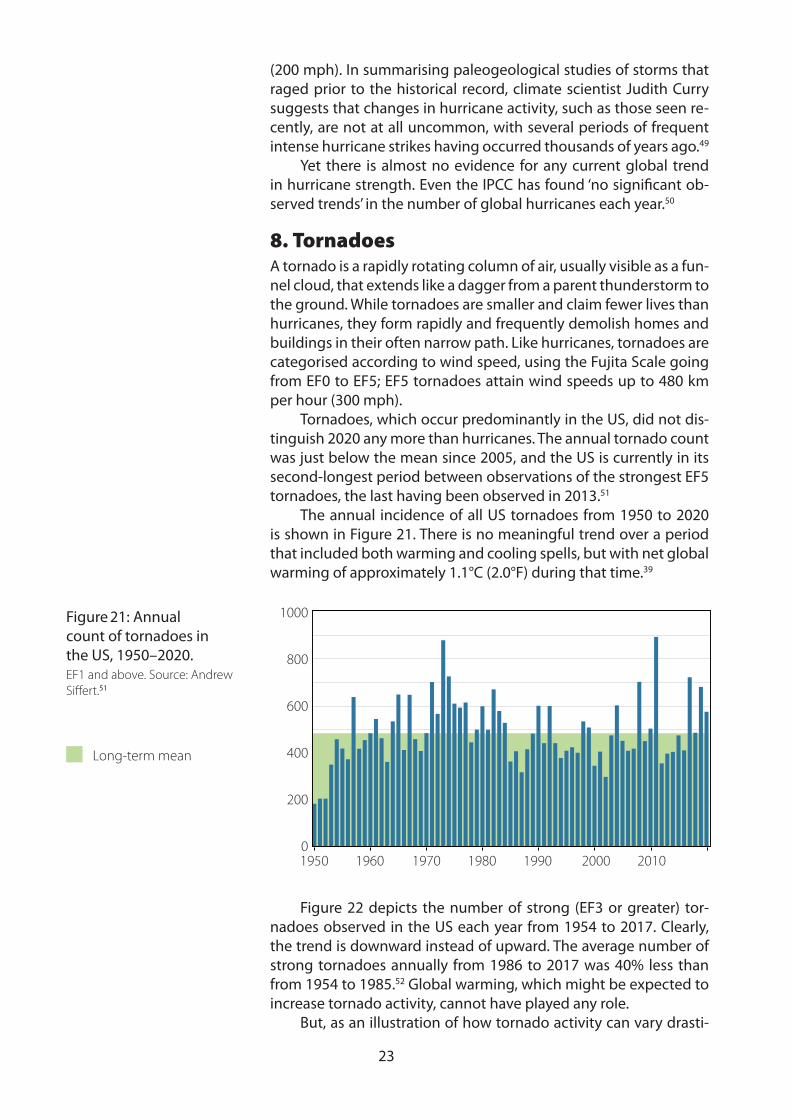
The annual incidence of all US tornadoes from 1950 to 2020 is shown in Figure 21. There is no meaningful trend over a period that included both warming and cooling spells, but with net global warming of approximately 1.1°C (2.0°F) during that time.39
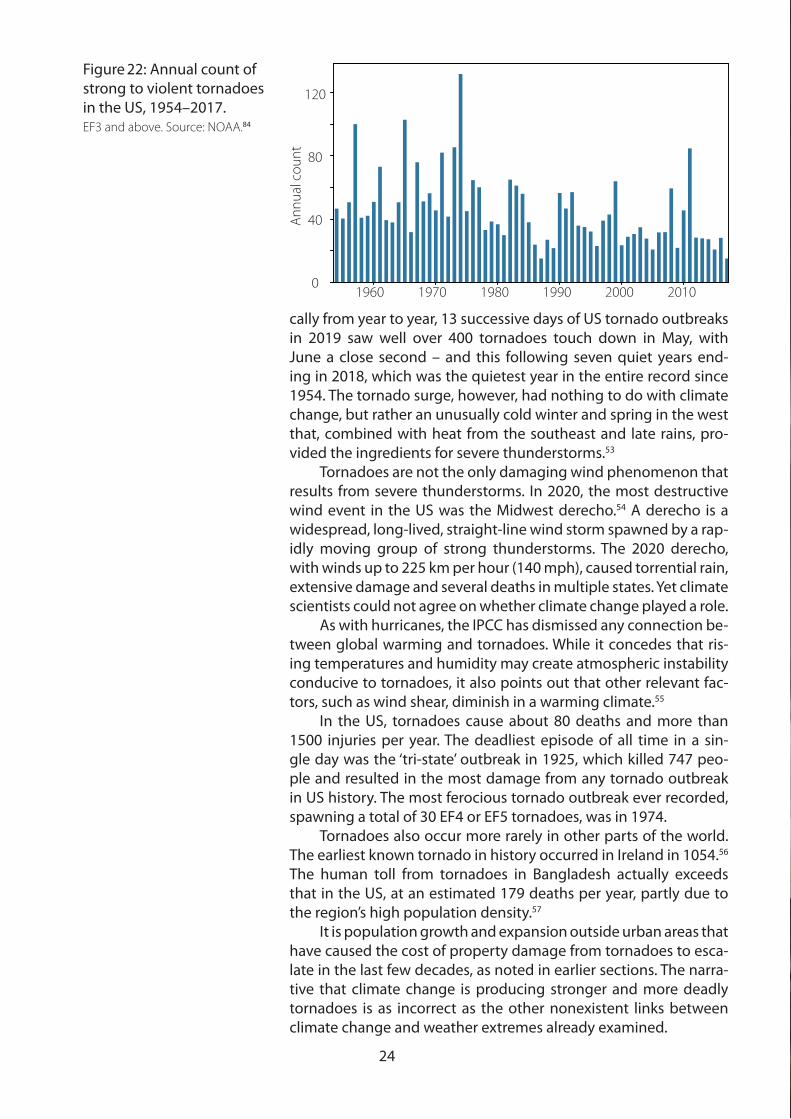
Figure 22 depicts the number of strong (EF3 or greater) tor-nadoes observed in the US each year from 1954 to 2017. Clearly, the trend is downward instead of upward. The average number of strong tornadoes annually from 1986 to 2017 was 40% less than from 1954 to 1985.52 Global warming, which might be expected to increase tornado activity, cannot have played any role.
But, as an illustration of how tornado activity can vary drasti-
Figure 21: Annual count of tornadoes in the US, 1950–2020.EF1 and above. Source: Andrew Siffert.51
1950
Long-term mean
0
200
400
600
800
1000
1960 1970 1980 1990 2000 2010
24
cally from year to year, 13 successive days of US tornado outbreaks in 2019 saw well over 400 tornadoes touch down in May, with June a close second – and this following seven quiet years end-ing in 2018, which was the quietest year in the entire record since 1954. The tornado surge, however, had nothing to do with climate change, but rather an unusually cold winter and spring in the west that, combined with heat from the southeast and late rains, pro-vided the ingredients for severe thunderstorms.53
Tornadoes are not the only damaging wind phenomenon that results from severe thunderstorms. In 2020, the most destructive wind event in the US was the Midwest derecho.54 A derecho is a widespread, long-lived, straight-line wind storm spawned by a rap-idly moving group of strong thunderstorms. The 2020 derecho, with winds up to 225 km per hour (140 mph), caused torrential rain, extensive damage and several deaths in multiple states. Yet climate scientists could not agree on whether climate change played a role.
As with hurricanes, the IPCC has dismissed any connection be-tween global warming and tornadoes. While it concedes that ris-ing temperatures and humidity may create atmospheric instability conducive to tornadoes, it also points out that other relevant fac-tors, such as wind shear, diminish in a warming climate.55
In the US, tornadoes cause about 80 deaths and more than 1500 injuries per year. The deadliest episode of all time in a sin-gle day was the ‘tri-state’ outbreak in 1925, which killed 747 peo-ple and resulted in the most damage from any tornado outbreak in US history. The most ferocious tornado outbreak ever recorded, spawning a total of 30 EF4 or EF5 tornadoes, was in 1974.
Tornadoes also occur more rarely in other parts of the world. The earliest known tornado in history occurred in Ireland in 1054.56 The human toll from tornadoes in Bangladesh actually exceeds that in the US, at an estimated 179 deaths per year, partly due to the region’s high population density.57
It is population growth and expansion outside urban areas that have caused the cost of property damage from tornadoes to esca-late in the last few decades, as noted in earlier sections. The narra-tive that climate change is producing stronger and more deadly tornadoes is as incorrect as the other nonexistent links between climate change and weather extremes already examined.
Figure 22: Annual count of strong to violent tornadoes in the US, 1954–2017. EF3 and above. Source: NOAA.84
1960An
nual
cou
nt1970 1980 2000 20101990
40
0
80
120
25
26
9. WildfiresWildfires are not a form of extreme weather, or indeed of weather at all, although they can produce their own weather. However, wildfires are included in this report because they are often made worse by weather extremes such as heatwaves or drought, as the WMO rightly points out,58 and because of the hysteria generated by the mainstream media almost every time a wildfire occurs, es-pecially in naturally dry climates such as those in Australia, Cali-fornia or Spain. In addition to drying out of vegetation, wildfires require sustained high temperatures and winds plus a source of ignition. A common form of ignition is lightning strikes during dry thunderstorms.
The media wasted no time attributing 2020’s Arctic heat-wave and associated wildfires to climate change, despite the lack of any evidence for connection between heatwaves and global warming (Section 3). Although the Arctic wildfires were caused in part by exceptionally high temperatures in northern Russia during the 2020 spring and summer, record high numbers of wildfires in both the Arctic and the US last year were more than counterbalanced by record low numbers of fires in Canada and Africa.59
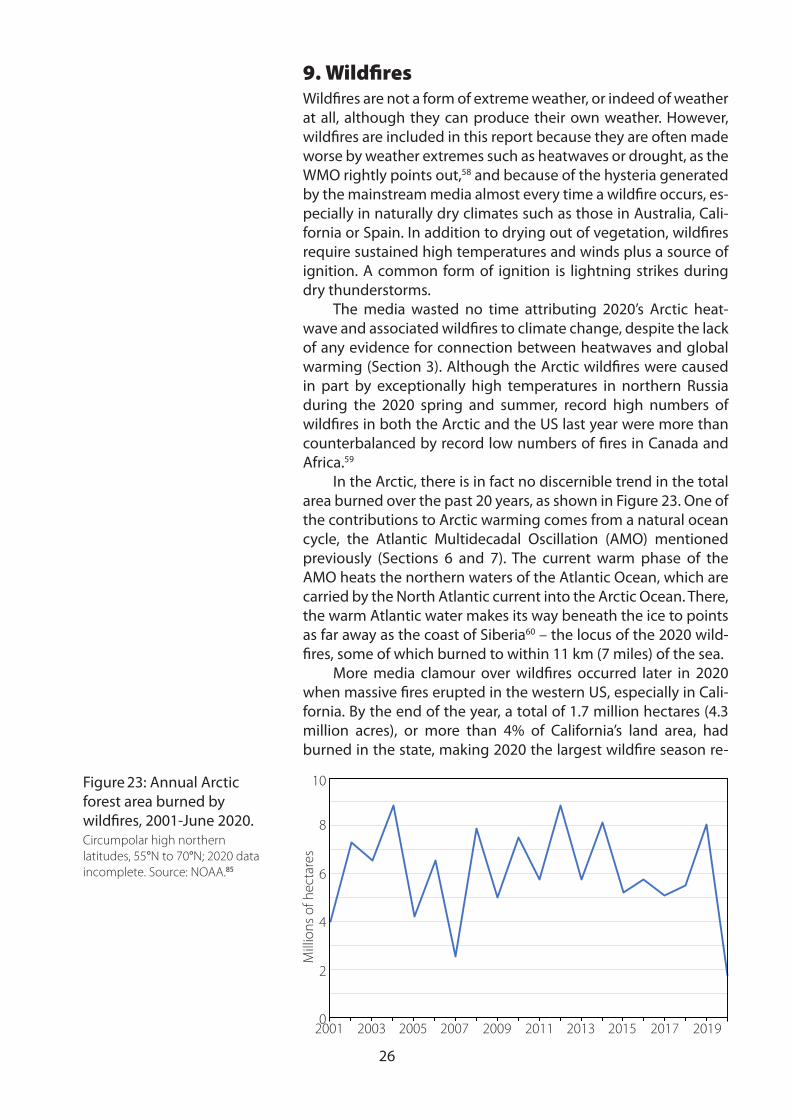
In the Arctic, there is in fact no discernible trend in the total area burned over the past 20 years, as shown in Figure 23. One of the contributions to Arctic warming comes from a natural ocean cycle, the Atlantic Multidecadal Oscillation (AMO) mentioned previously (Sections 6 and 7). The current warm phase of the AMO heats the northern waters of the Atlantic Ocean, which are carried by the North Atlantic current into the Arctic Ocean. There, the warm Atlantic water makes its way beneath the ice to points as far away as the coast of Siberia60 – the locus of the 2020 wild-fires, some of which burned to within 11 km (7 miles) of the sea.
More media clamour over wildfires occurred later in 2020 when massive fires erupted in the western US, especially in Cali-fornia. By the end of the year, a total of 1.7 million hectares (4.3 million acres), or more than 4% of California’s land area, had burned in the state, making 2020 the largest wildfire season re-
Figure 23: Annual Arctic forest area burned by wildfires, 2001-June 2020.Circumpolar high northern latitudes, 55°N to 70°N; 2020 data incomplete. Source: NOAA.85
2001
Mill
ions
of h
ecta
res
0
2
4
6
8
10
2003 2005 2009 2011 2013 2015 2017 20192007
27
corded in California’s modern history.61 However, the burned area was no more than the typical acreage torched annually in the 1700s before Europeans arrived, which averaged around 1.8 mil-lion hectares (4.4 million acres) yearly and up to 4.8 million hec-tares (12 million acres) in peak years.62
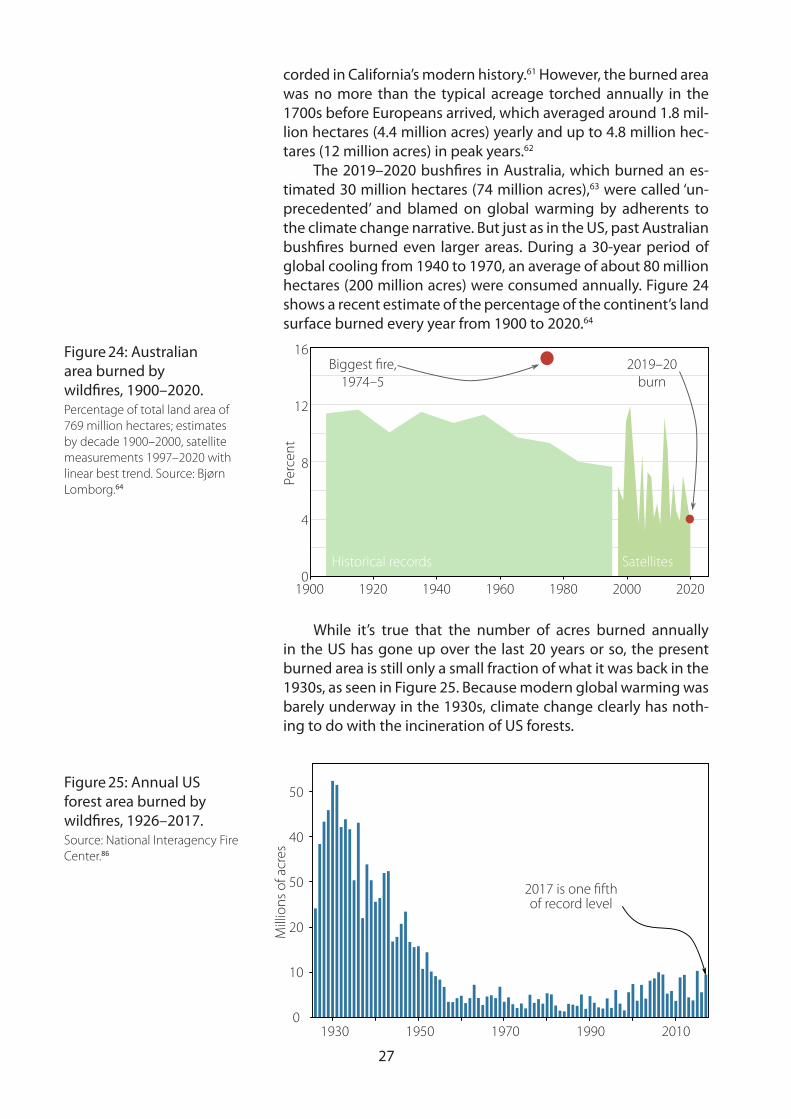
The 2019–2020 bushfires in Australia, which burned an es-timated 30 million hectares (74 million acres),63 were called ‘un-precedented’ and blamed on global warming by adherents to the climate change narrative. But just as in the US, past Australian bushfires burned even larger areas. During a 30-year period of global cooling from 1940 to 1970, an average of about 80 million hectares (200 million acres) were consumed annually. Figure 24 shows a recent estimate of the percentage of the continent’s land surface burned every year from 1900 to 2020.64
While it’s true that the number of acres burned annually in the US has gone up over the last 20 years or so, the present burned area is still only a small fraction of what it was back in the 1930s, as seen in Figure 25. Because modern global warming was barely underway in the 1930s, climate change clearly has noth-ing to do with the incineration of US forests.
Figure 24: Australian area burned by wildfires, 1900–2020.Percentage of total land area of 769 million hectares; estimates by decade 1900–2000, satellite measurements 1997–2020 with linear best trend. Source: Bjørn Lomborg.64
Figure 25: Annual US forest area burned by wildfires, 1926–2017.Source: National Interagency Fire Center.86
1900
Perc
ent
0
4
8
12
16
Historical records Satellites
Biggest fire, 1974–5
2019–20 burn
1920 1940 1960 1980 2000 2020
1930 1950 1970 1990 2010
2017 is one fifth of record level
50
40
50
20
10
0
Mill
ions
of a
cres
28
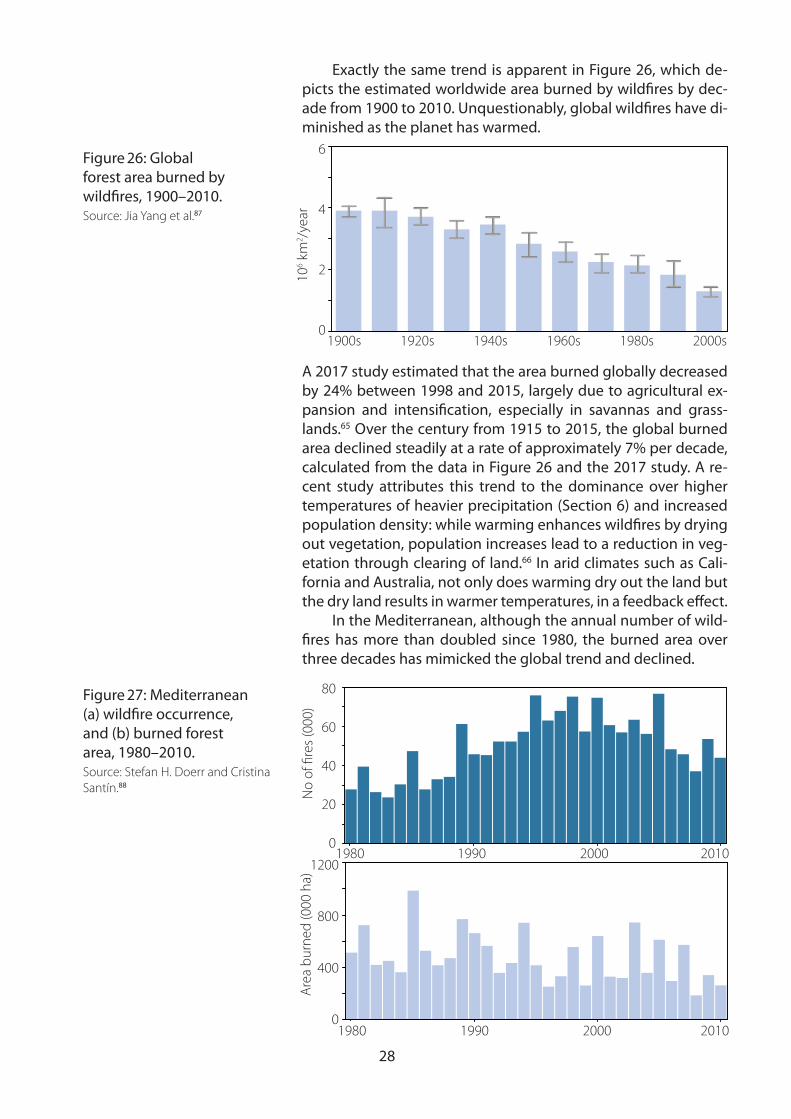
Exactly the same trend is apparent in Figure 26, which de-picts the estimated worldwide area burned by wildfires by dec-ade from 1900 to 2010. Unquestionably, global wildfires have di-minished as the planet has warmed.
A 2017 study estimated that the area burned globally decreased by 24% between 1998 and 2015, largely due to agricultural ex-pansion and intensification, especially in savannas and grass-lands.65 Over the century from 1915 to 2015, the global burned area declined steadily at a rate of approximately 7% per decade, calculated from the data in Figure 26 and the 2017 study. A re-cent study attributes this trend to the dominance over higher temperatures of heavier precipitation (Section 6) and increased population density: while warming enhances wildfires by drying out vegetation, population increases lead to a reduction in veg-etation through clearing of land.66 In arid climates such as Cali-fornia and Australia, not only does warming dry out the land but the dry land results in warmer temperatures, in a feedback effect.
In the Mediterranean, although the annual number of wild-fires has more than doubled since 1980, the burned area over three decades has mimicked the global trend and declined.
Figure 27: Mediterranean (a) wildfire occurrence, and (b) burned forest area, 1980–2010.Source: Stefan H. Doerr and Cristina Santín.88
Figure 26: Global forest area burned by wildfires, 1900–2010.Source: Jia Yang et al.87
1900s 1920s 1940s 1960s 1980s 2000s
106 k
m2 /y
ear
6
4
2
0
1980
1980
1990
1990
2000
2000
2010
2010
No
of fi
res (
000)
80
60
40
20
0
0
1200
800
400
Area
bur
ned
(000
ha)
29
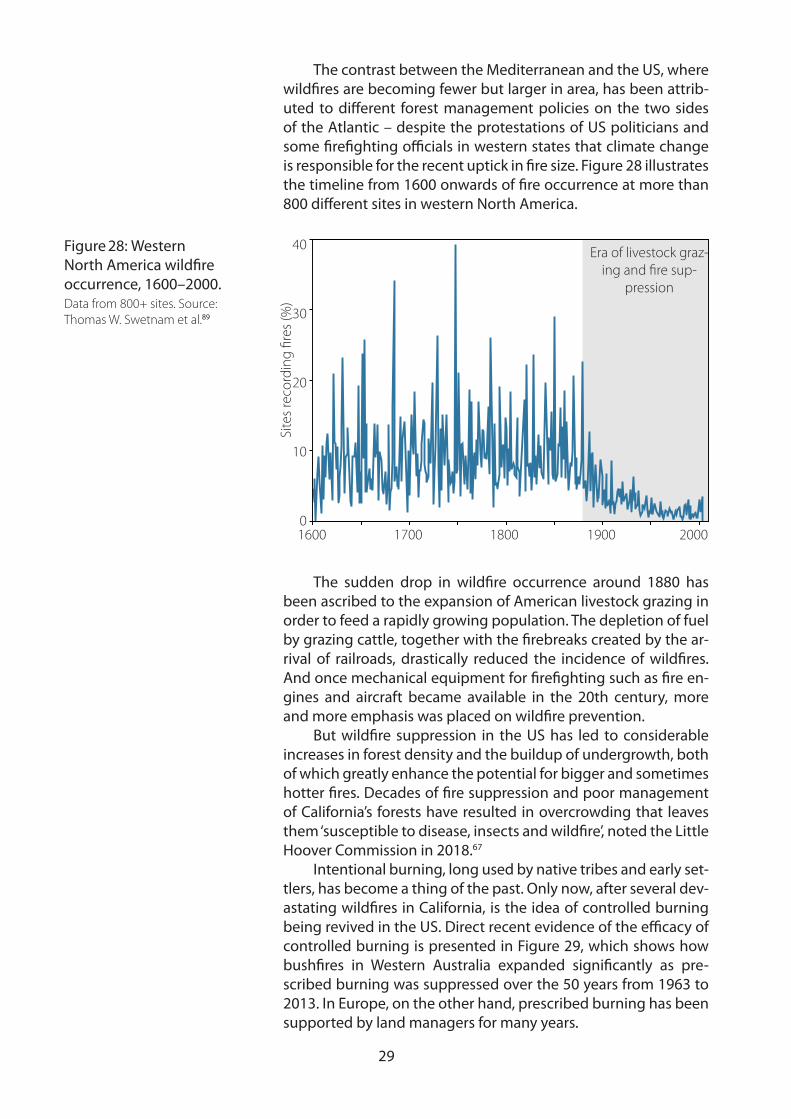
The contrast between the Mediterranean and the US, where wildfires are becoming fewer but larger in area, has been attrib-uted to different forest management policies on the two sides of the Atlantic – despite the protestations of US politicians and some firefighting officials in western states that climate change is responsible for the recent uptick in fire size. Figure 28 illustrates the timeline from 1600 onwards of fire occurrence at more than 800 different sites in western North America.
The sudden drop in wildfire occurrence around 1880 has been ascribed to the expansion of American livestock grazing in order to feed a rapidly growing population. The depletion of fuel by grazing cattle, together with the firebreaks created by the ar-rival of railroads, drastically reduced the incidence of wildfires. And once mechanical equipment for firefighting such as fire en-gines and aircraft became available in the 20th century, more and more emphasis was placed on wildfire prevention.
But wildfire suppression in the US has led to considerable increases in forest density and the buildup of undergrowth, both of which greatly enhance the potential for bigger and sometimes hotter fires. Decades of fire suppression and poor management of California’s forests have resulted in overcrowding that leaves them ‘susceptible to disease, insects and wildfire’, noted the Little Hoover Commission in 2018.67
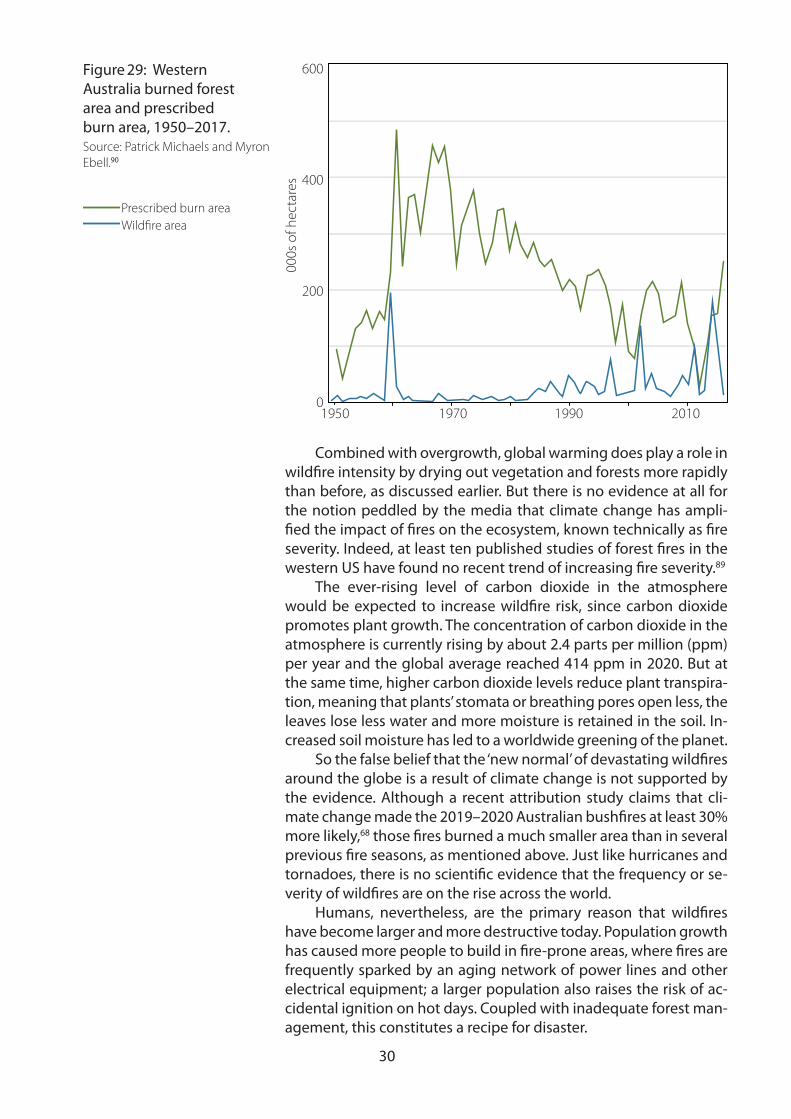
Intentional burning, long used by native tribes and early set-tlers, has become a thing of the past. Only now, after several dev-astating wildfires in California, is the idea of controlled burning being revived in the US. Direct recent evidence of the efficacy of controlled burning is presented in Figure 29, which shows how bushfires in Western Australia expanded significantly as pre-scribed burning was suppressed over the 50 years from 1963 to 2013. In Europe, on the other hand, prescribed burning has been supported by land managers for many years.
Figure 28: Western North America wildfire occurrence, 1600–2000.Data from 800+ sites. Source: Thomas W. Swetnam et al.89
Era of livestock graz-ing and fire sup-
pression
1600 1700 1800 1900 2000
Site
s rec
ordi
ng fi
res (
%)
40
30
20
10
0
30
Combined with overgrowth, global warming does play a role in wildfire intensity by drying out vegetation and forests more rapidly than before, as discussed earlier. But there is no evidence at all for the notion peddled by the media that climate change has ampli-fied the impact of fires on the ecosystem, known technically as fire severity. Indeed, at least ten published studies of forest fires in the western US have found no recent trend of increasing fire severity.89
The ever-rising level of carbon dioxide in the atmosphere would be expected to increase wildfire risk, since carbon dioxide promotes plant growth. The concentration of carbon dioxide in the atmosphere is currently rising by about 2.4 parts per million (ppm) per year and the global average reached 414 ppm in 2020. But at the same time, higher carbon dioxide levels reduce plant transpira-tion, meaning that plants’ stomata or breathing pores open less, the leaves lose less water and more moisture is retained in the soil. In-creased soil moisture has led to a worldwide greening of the planet.
So the false belief that the ‘new normal’ of devastating wildfires around the globe is a result of climate change is not supported by the evidence. Although a recent attribution study claims that cli-mate change made the 2019–2020 Australian bushfires at least 30% more likely,68 those fires burned a much smaller area than in several previous fire seasons, as mentioned above. Just like hurricanes and tornadoes, there is no scientific evidence that the frequency or se-verity of wildfires are on the rise across the world.
Humans, nevertheless, are the primary reason that wildfires have become larger and more destructive today. Population growth has caused more people to build in fire-prone areas, where fires are frequently sparked by an aging network of power lines and other electrical equipment; a larger population also raises the risk of ac-cidental ignition on hot days. Coupled with inadequate forest man-agement, this constitutes a recipe for disaster.
Figure 29: Western Australia burned forest area and prescribed burn area, 1950–2017.Source: Patrick Michaels and Myron Ebell.90
1950 1970 1990 2010
000s
of h
ecta
res
600
400
200
0
Prescribed burn areaWildfire area
31
10. ConclusionsThe solid scientific evidence presented in this report shows how the belief that weather extremes are worsening because of climate change is badly mistaken and more a perception, fostered by media coverage, than real-ity. Sociologist Frank Furedi, who has studied the exploitation of fear in modern culture, has argued that:
The term ‘extreme weather’ … works not so much as a scientific but as a cul-tural metaphor to capture the anxieties of our time. In contemporary culture, extreme weather is often interpreted through a moralistic narrative that pre-sents it as the inevitable threatening outcome of irresponsible human be-haviour.69
Careful examination of the actual data reveals that if there is any trend in weather extremes, it is downward rather than upward. In fact, a 2016 survey of extreme weather events since 1900 found strong evidence that the first half of the 20th century saw more weather extremes than the second half, when human emissions of greenhouse gases are alleged to have been mainly responsible for global warming70 And as well-known climate scientist Richard Lindzen has remarked:
Of course, even where trends exist, they are generally not unambiguously predicted, and hence don’t constitute evidence. Moreover, even evidence is not proof, because, among other things, there are always confounding vari-ables.71
Rather than global warming, it is natural patterns in the climate system that produce extreme weather conditions. The Atlantic Multidecadal Oscillation controls many extremes, including intense hurricanes in the North Atlantic basin as well as major floods in eastern North America and western Europe. The North Atlantic Oscillation and Pacific Decadal Oscil-lation have been linked to cold weather extremes in North America, while the Arctic Oscillation governs heatwaves in the Arctic.
Similarly, it is the familiar El Niño and La Niña cycles in the Pacific Ocean that often cause catastrophic flooding in the western Americas and flooding or severe drought in Australia. La Niña has also been con-nected to major landfalling hurricanes in both the US and the western Pacific. Moreover, as discussed in Section 3, recent Arctic and European heatwaves are thought to have resulted from jet stream blocking, which can arise from natural sources such as changes in the Sun or in upper at-mosphere winds.
Although extreme weather occurs regardless of human activity, we do play a big role in determining its consequences. Droughts are inten-sified by poor farming practices that lead to soil erosion or depletion of groundwater. The increasingly popular habit of building homes near wa-ter, either along rivers or on the sea coast, has greatly increased the prop-erty damage brought about by major floods and hurricanes. Population expansion beyond urban areas has worsened the death toll and property damage from tornadoes and wildfires; wildfires in the US and Australia have also been exacerbated by the trend away from controlled burning.
Hysteria over extreme weather, and the attempt to link it to global warming, are simply unwarranted.
32
33
Notes1. Ralph B. Alexander, ‘Weather Extremes: Are they caused by global warming?’, GWPF Report 43 (2020), https://www.thegwpf.org/content/uploads/2020/10/Alexander-Weather-Extremes.pdf.2. CRED and UNDRR, ‘Human cost of disasters: An overview of the last 20 years 2000–2019’ (2020), https://reliefweb.int/sites/reliefweb.int/files/resources/Human Cost of Disasters 2000–2019 Report - UN Office for Disaster Risk Reduction.pdf.3. Edwin Timmer, De Telegraaf (October 14, 2020), ‘New UN climate row: alarming report contra-dicts its own data’, https://www.thegwpf.com/new-un-climate-row-alarming-report-contradicted-by-its-own-data/.4. CRED, ‘Thirty Years of Natural Disasters 1974–2003: The numbers’ (2004), http://www.cred.be/sites/default/files/publication_2004_emdat.pdf.5. Paul Homewood, ‘UN claim “staggering rise in climate emergencies since 2000”’ (2020), https://notalotofpeopleknowthat.wordpress.com/2020/10/13/un-claimstaggering-rise-in-climate-emer-gencies-since-2000/.6. CRED, ‘Annual Disaster Statistical Review: Numbers and Trends 2006’ (2007), http://www.cred.be/sites/default/files/ADSR_2006.pdf.7. IFRC, ‘World Disasters Report 2020: Come Heat or High Water’ (2020), https://media.ifrc.org/ifrc/world-disaster-report-2020.8. Peter A. Stott, Nikolaos Christidis, Friederike E. L. Otto et al., ‘Attribution of extreme weather and climate-related events’, Wiley Interdiscip. Rev. Climate Change, 7, 23–41 (2016), https://www.ncbi.nlm.nih.gov/pmc/articles/PMC4739554/.9. William M. Briggs, ‘The Climate Blame Game: Are we really causing extreme weather?’. Note 25 (2021), The Global Warming Policy Foundation.10. Bjørn Lomborg, ‘Welfare in the 21st century: Increasing development, reducing inequality, the impact of climate change, and the cost of climate policies’, Technol. Forecast. Soc. Change, 156, 1–35 (2020), https://doi.org/10.1016/j.techfore.2020.119981. 11. Roger Pielke Jr., ‘Economic “normalisation” of disaster losses 1998–2020: a literature review and assessment’, Environ. Hazards, 18, 1–19 (2020), https://www.tandfonline.com/doi/full/10.1080/17477891.2020.1800440. 12. Giuseppe Formetta and Luc Feyen, ‘Empirical evidence of declining global vulnerability to cli-mate-related hazards’, Global Environ. Change, 57, 101920 (2019), https://www.sciencedirect.com/science/article/pii/S0959378019300378.13. IPCC, ‘Climate Change 2014: Impacts, Adaptation, and Vulnerability’, Chapter 10, Section 10.7.3 (2014), https://www.ipcc.ch/site/assets/uploads/2018/02/WGIIAR5-Chap10_FINAL.pdf.14. The New York Times (July 15, 2020), https://www.nytimes.com/2020/07/15/climate/siberia-heat-wave-climate-change.html. 15. World Weather Attribution, ‘Siberian heatwave of 2020 almost impossible without climate change’ (2020), https://www.worldweatherattribution.org/siberian-heatwave-of-2020-almost-im-possible-without-climate-change/.16. Paul Homewood, ‘Siberian heatwaves are fairly common: hottest summer on record was in 1917’, GWPF ‘The Climate Record’ (2020), https://www.thegwpf.com/siberian-heatwaves-are-fairly-common-hottest-summer-on-record-was-in-1917/.17. James E. Overland and Muyin Wang, ‘The 2020 Siberian heat wave’, Int. J. Climatol., 41, E2341–E2346 (2021), https://doi.org/10.1002/joc.6850. 18. The Washington Post (November 30, 2020), https://www.washingtonpost.com/weath-er/2020/11/30/australia-heat-wave-fire-risk/.
34
19. Yahoo News Australia (January 4, 2021), https://au.news.yahoo.com/incredible-weather-re-cord-broken-for-second-time-in-111-years-102837538.html.
20. WMO (August 1, 2019), https://public.wmo.int/en/media/news/july-matched-and-maybe-broke-record-hottest-month-analysis-began.
21. WMO (July 2, 2019), https://public.wmo.int/en/media/news/european-heat-wave-sets-new-temperature-records.
22. The Telegraph (August 30, 1930), https://trove.nla.gov.au/newspaper/page/20097453.
23. Horowhenua Chronicle (August 29, 1930), https://twitter.com/drwaheeduddin/sta-tus/1145070720101343426.
24. ‘Climate Science Special Report: Fourth National Climate Assessment (CSSR)’, Volume I, Chap-ter 6, 191 (2017), https://science2017.globalchange.gov/downloads/CSSR_Ch6_Temperature.pdf.
25. Joseph D’Aleo and Richard A. Keen (2019), https://alarmistclaimresearch.files.wordpress.com/2019/05/the-real-scoop-on-heat-1.pdf.
26. Eric C. J. Oliver, Markus G. Donat, Michael T. Burrows et el., ‘Longer and more frequent marine heatwaves over the past century’, Nat. Commun. 9, 1324, doi:10.1038/s41467-018-03732-9 (2018), https://www.nature.com/articles/s41467-018-03732-9.
27. Peter Ridd, ‘Crying wolf over the Great Barrier Reef’, GWPF ‘The Climate Record’ (2018), https://www.thegwpf.com/peter-ridd-crying-wolf-over-the-great-barrier-reef/.
28. ABC News, ‘Reefs at WA’s Rowley Shoals make surprise recovery from “significant” coral bleach-ing’ (November 5, 2020), https://www.abc.net.au/news/2020-11-06/coral-reef--at-rowley-shoals-recovers-from-bleaching/12840302.
29. Ralph B. Alexander, ‘No evidence for dramatic loss of Great Barrier Reef corals’ (2020), https://www.scienceunderattack.com/blog/2020/11/30/no-evidence-for-dramatic-loss-of-great-barrier-reef-corals-66.
30. Andreas Dietzel, Michael Bode, Sean R. Connolly and Terry P. Hughes, ‘Long-term shifts in the colony size structure of coral populations along the Great Barrier Reef’, Proc. R. Soc. B 287:20201432 (2020), https://royalsocietypublishing.org/doi/full/10.1098/rspb.2020.1432.
31. ‘Claims of dramatic loss of Great Barrier Reef corals are false’, GWPF Press Release (October 15, 2020), https://mailchi.mp/ac3f6e90b386/press-releaseclaims-of-dramatic-loss-of-great-barrier-reef-corals-are-false-178842.
32. Ralph B. Alexander, ‘It’s cold, not hot, extremes that are on the rise’ (2020), https://www.scien-ceunderattack.com/blog/2020/9/21/its-cold-not-hot-extremes-that-are-on-the-rise-61.
33. Ralph B. Alexander, ‘Evidence mounting for global cooling ahead: record snowfalls, less green-land ice loss’ (2020), https://www.scienceunderattack.com/blog/2020/11/16/evidence-mounting-for-global-cooling-ahead-record-snowfalls-less-greenland-ice-loss-65.
34. MercoPress (August 22, 2020), https://en.mercopress.com/2020/08/22/massive-losses-of-sheep-in-patagonia-highlands-because-of-intense-snowstorms.
35. Madhav L. Khandekar, ‘The Global Warming–Extreme Weather Link: A Review of the State of Sci-ence’, GWPF Report 11 (2013), https://www.thegwpf.org/content/uploads/2013/11/Khandekar-Ex-treme-Weather.pdf.
36. E. Ray Garnett and Madhav L. Khandekar, ‘Increasing cold weather extremes since the new millennium: an assessment with a focus on worldwide economic impacts’, Mod. Environ. Sci. Eng. 4, 427–438 (2018), https://blog.friendsofscience.org/wp-content/uploads/2018/09/A-Garnett-MLK-2018-Cold-extremes.pdf.
35
37. Madhav Khandekar and Ray Garnett, ‘Global warming (gw) & extreme weather (ew) link: are cold extremes on the rise?’, Earth & Environ. Sci. Res. & Rev. 3, 64–66 (2020), http://www.opastonline.com/wp-content/uploads/2020/04/global-warming-extreme-weather-link-are-cold-extremes-on-the-rise-eesrr-20-.pdf.38. J. Barichivich, T. J. Osborn, I. Harris et al., ‘Monitoring global drought using the self-calibrat-ing Palmer Drought Severity Index’ [in ‘State of the Climate in 2019’], Bull. Amer. Meteor., 101, S59-S60 (2020), https://journals.ametsoc.org/view/journals/bams/101/8/bamsD200104.xml?tab_body=pdf.39. NASA (2021), https://climate.nasa.gov/vital-signs/global-temperature/.40. Nathan Wells, Steve Goddard and Michael J. Hayes, ‘A Self-Calibrating Palmer Drought Se-verity Index’, J. Climate, 17, 2335–2351 (2004), https://journals.ametsoc.org/view/journals/clim/17/12/1520-0442_2004_017_2335_aspdsi_2.0.co_2.xml?tab_body=pdf.41. Kevin Krajick, ‘Scientists see fingerprint of warming climate on droughts going back to 1900’ (2019), https://blogs.ei.columbia.edu/2019/05/01/climate-change-drought-patterns-1900/.42. IPCC, ‘Fifth Assessment Report’, Summary for Policymakers, B.1 Atmosphere (2013), https://www.ipcc.ch/site/assets/uploads/2018/02/WG1AR5_SPM_FINAL.pdf.43. William Kininmonth, private communication (2021).44. Hong X. Do, Seth Westra and Michael Leonard, ‘A global-scale investigation of trends in annual maximum streamflow’, J. Hydrol., 552, 28–43 (2017), https://www.sciencedirect.com/science/arti-cle/pii/S0022169417304171.45. Glenn A. Hodgkins, Paul H. Whitfield, Donald H. Burn et al., ‘Climate-driven variability in the oc-currence of major floods across North America and Europe’, J. Hydrol., 552, 704–717 (2017), http://mural.maynoothuniversity.ie/11682/1/MurphyCo_Climate-driven_2017.pdf.46. CNBC (November 30, 2020), https://www.cnbc.com/2020/11/30/2020-atlantic-hurricane-sea-son-most-active-on-record-what-happened.html.47. NOAA (2019), https://www.aoml.noaa.gov/hrd/hurdat/comparison_table.html.48. NOAA (2020), https://www.noaa.gov/media-release/record-breaking-atlantic-hurricane-sea-son-draws-to-end.49. Judith Curry, ‘Hurricanes and climate change: detection’ (2019), https://judithcurry.com/2019/02/17/hurricanes-climate-change-detection/.50. IPCC, ‘Fifth Assessment Report’, Chapter 2, Section 2.6.3 (2013), https://www.ipcc.ch/site/as-sets/uploads/2017/09/WG1AR5_Chapter02_FINAL.pdf.51. Andrew Siffert, ‘2020 Catastrophes; Preview for 2021’ (2021), https://www.insurancethought-leadership.com/2020-catastrophe-summary-2021-preview/.52. Joseph D’Aleo and Anthony Lupo (2019), https://alarmistclaimresearch.files.wordpress.com/2019/05/ac-rebuttals-tornadoes-051919.pdf.53. Joseph D’Aleo and Anthony Lupo (2019), https://alarmistclaimresearch.files.wordpress.com/2019/05/ac-tornado-and-flooding-2019-claims-060219.pdf.54. https://en.wikipedia.org/wiki/August_2020_Midwest_derecho.55. IPCC, ‘Special Report on Managing the Risks of Extreme Events and Disasters to Advance Cli-mate Change Adaptation’, Chapter 3, Sections 3.2.1 and FAQ 3.2 (2012), https://www.ipcc.ch/site/assets/uploads/2018/03/SREX-Chap3_FINAL-1.pdf.56. http://www.torro.org.uk/whirlwind_info.php.57. https://en.wikipedia.org/wiki/Tornado.58. WMO, ‘The Global Climate in 2015–2019’, Key findings: Extreme events (2019), https://library.wmo.int/doc_num.php?explnum_id=9936.
36
59. Copernicus Atmosphere Monitoring Service, ‘How wildfires in the Americas and tropical Af-rica in 2020 compared to previous years’ (2020), https://atmosphere.copernicus.eu/how-wild-fires-americas-and-tropical-africa-2020-compared-previous-years?mc_cid=ef4659fc5d&mc_ei-d=5965e22311.
60. Joseph D’Aleo (2019), https://alarmistclaimresearch.files.wordpress.com/2019/02/amo-pdo-solar-and-arctic-v2.pdf.
61. Cal Fire (2021), https://www.fire.ca.gov/incidents/2020/.
62. Scott L. Stephens, Robert E. Martin and Nicholas E. Clinton, ‘Prehistoric fire area and emissions from California’s forests, woodlands, shrublands, and grasslands’, For. Ecol. Manage., 251, 205–216 (2007), https://www.sciencedirect.com/science/article/abs/pii/S0378112707004379.
63. David Bowman, Grant Williamson, Marta Yebra et al., ‘Wildfires: Australia needs national moni-toring agency’, Nature, 584, 188–191 (2020), https://www.nature.com/articles/d41586-020-02306-4.
64. Bjørn Lomborg, https://twitter.com/BjornLomborg/status/1368550005787787270.
65. N. Andela, D. C. Morton, L. Giglio et al., ‘A human-driven decline in global burned area’, Science, 356, 1356–1362 (2017), https://science.sciencemag.org/content/356/6345/1356.long.
66. Matthias Forkel, Wouter Dorigo, Gitta Lasslop et al., ‘Recent global and regional trends in burned area and their compensating environmental controls’, Environ. Res. Commun., 1: 051005 (2019), https://iopscience.iop.org/article/10.1088/2515-7620/ab25d2.
67. Little Hoover Commission, ‘Fire on the Mountain: Rethinking Forest Management in the Sierra Nevada’, Report #242 (2018), https://lhc.ca.gov/report/fire-mountain-rethinking-forest-manage-ment-sierra-nevada.
68. World Weather Attribution, ‘Attribution of the Australian bushfire risk to anthropogenic climate change’ (2020), https://www.worldweatherattribution.org/bushfires-in-australia-2019–2020/.
69. Frank Furedi, ‘Narratives of Existential Threats in the Climate and Covid Era’, 2020 Annual GWPF Lecture, https://www.thegwpf.org/frank-furedi-narratives-of-existential-threats-in-the-climate-and-covid-era/?mc_cid=4c0d863ee7&mc_eid=5965e22311.
70. M.J. Kelly, ‘Trends in Extreme Weather Events since 1900 – An Enduring Conundrum for Wise Policy Advice’, J. Geogr. Nat. Disast., 6, 1–7 (2016), https://www.longdom.org/open-access/trends-in-extreme-weather-events-since-1900--an-enduring-conundrum-for-wise-policy-ad-vice-2167-0587-1000155.pdf.
71. Richard Lindzen, private communication (2019).
72. Hannah Ritchie and Max Roser, ‘Natural Disasters’ (2019), Our World in Data, https://ourworld-indata.org/uploads/2018/04/Global-annual-death-rate-from-natural-disasters-01.png.
73. Roger Pielke Jr. in Andrew Siffert, ‘2020 Catastrophes; Preview for 2021’ (2021), https://www.insurancethoughtleadership.com/2020-catastrophe-summary-2021-preview/.
74. John R. Christy, Testimony to US House of Representatives Committee on Science, Space & Technology (February 2, 2016), https://docs.house.gov/meetings/SY/SY00/20160202/104399/HHRG-114-SY00-Wstate-ChristyJ-20160202.pdf.
75. WMO, ‘Continental Weather & Climate Extremes’, https://wmo.asu.edu/content/world-meteo-rological-organization-global-weather-climate-extremes-archive.
76. NOAA (2016), https://www.ncdc.noaa.gov/sotc/drought/201606.
77. Paul Homewood, ‘The US Climate in 2019’, GWPF Briefing 50 (2020), https://www.thegwpf.org/content/uploads/2021/02/US-Climate-2019.pdf.
78. Paul Homewood, private communication (2020).
37
79. Ryan N. Maue, ‘Global Tropical Cyclone Activity’ (updated December 31, 2020), http://www.policlimate.com/tropical/.80. Japan Meteorological Agency (2020), http://www.data.jma.go.jp/fcd/yoho/typhoon/statistics/generation/generation.html.81. Roger Pielke Jr., ‘A remarkable decline in landfalling hurricanes’ (2021), https://rogerpielkejr.sub-stack.com/p/a-remarkable-decline-in-landfalling?mc_cid=0396ba786a&mc_eid=5965e22311.82. Roger Pielke Jr., private communication (2020).83. Joseph D’Aleo (2020), https://alarmistclaimresearch.files.wordpress.com/2020/11/hurri-cane-season-2020-update-112920-1.pdf.84. NOAA, https://www.ncdc.noaa.gov/climate-information/extreme-events/us-tornado-clima-tology/trends.85. NOAA (2020), Arctic Report Card 2020, 108, https://arctic.noaa.gov/Portals/7/ArcticReport-Card/Documents/ArcticReportCard_full_report2020.pdf.86. National Interagency Fire Center (2017), https://www.nifc.gov/fireInfo/fireInfo_stats_total-Fires.html.87. Jia Yang, Hanqin Tian, Bo Tao et al., ‘Spatial and temporal patterns of global burned area in re-sponse to anthropogenic and environmental factors: reconstructing global fire history for the 20th and early 21st centuries’, J. Geophys. Res. Biogeosci., 119, 249–263 (2014), https://agupubs.onlineli-brary.wiley.com/doi/full/10.1002/2013JG002532.88. Stefan H. Doerr and Cristina Santín, ‘Global trends in wildfire and its impacts: perceptions ver-sus realities in a changing world’, Phil. Trans. R. Soc., B 371: 20150345 (2016), https://pubmed.ncbi.nlm.nih.gov/27216515/.89. Thomas W. Swetnam, Joshua Farella, Christopher I. Roos et al., ‘Multiscale perspectives of fire, climate and humans in western North America and the Jemez Mountains, USA’, Phil. Trans. R. Soc., B 371: 20150168 (2016), https://royalsocietypublishing.org/doi/pdf/10.1098/rstb.2015.0168.90. Patrick Michaels and Myron Ebell, ‘Australian wildfires were caused by humans, not climate change’, Washington Examiner (2020), https://www.washingtonexaminer.com/opinion/australian-wildfires-were-caused-by-humans-not-climate-change.
Review processGWPF publishes papers in a number of different formats, with a different review process pertaining to each.
• Our flagship long-form GWPF Reports, are all reviewed by our Academic Advisory Panel.
• GWPF Briefings and Notes are shorter documents and are reviewed internally and/or externally as required.
Part of the function of the review process is to ensure that any materials published by the GWPF are of a proper academic standard, and will serve the GWPF’s educational purpose. As a charity, we recognise that educational material should provide any reader the opportunity to understand, and ex-plore different perspectives on a subject.
This means that, for most publications, we also invite an external review from a party who we would expect to take a different view to the publication’s author. We offer to publish any substantive comments alongside the main paper, provided we are satisfied they will enhance the educational ex-perience of the reader. In this way, we hope to encourage open and active debate on the important areas in which we work.
This enhanced review process for GWPF papers is intended to take the content and analysis be-yond a typical review for an academic journal:
• More potential reviewers can be involved
• The number of substantive comments will typically exceeds journal peer review, and
• The identity of the author is known to the potential reviewers.
As an organisation whose publications are sometimes the subject of assertive or careless criti-cism, this review process is intended to enhance the educational experience for all readers, allowing points to be made and considered in context and observing the standards required for an informed and informative debate. We therefore expect all parties involved to treat the reviews with the utmost seriousness.
Final responsibility for publication rests with the Chairman of the Trustees and the GWPF Director. But In every case, the views expressed are those of the author. GWPF has never had any corporate posi-tion beyond that dictated by its educational objectives.
About the Global Warming Policy FoundationThe Global Warming Policy Foundation is an all-party and non-party think tank and a registered edu-cational charity which, while openminded on the contested science of global warming, is deeply con-cerned about the costs and other implications of many of the policies currently being advocated.
Our main focus is to analyse global warming policies and their economic and other implications. Our aim is to provide the most robust and reliable economic analysis and advice. Above all we seek to inform the media, politicians and the public, in a newsworthy way, on the subject in general and on the misinformation to which they are all too frequently being subjected at the present time.
The key to the success of the GWPF is the trust and credibility that we have earned in the eyes of a growing number of policy makers, journalists and the interested public. The GWPF is funded overwhelmingly by voluntary donations from a number of private individu-als and charitable trusts. In order to make clear its complete independence, it does not accept gifts from either energy companies or anyone with a significant interest in an energy company.
Views expressed in the publications of the Global Warming Policy Foundation are those of the authors, not those of the GWPF, its trustees, its Academic Advisory Council members or its directors.
THE GLOBAL WARMING POLICY FOUNDATIONDirector Honorary PresidentBenny Peiser Lord Lawson
BOARD OF TRUSTEES
ACADEMIC ADVISORY COUNCIL
Terence Mordaunt (Chairman)Dr Jerome BoothChris Gibson-SmithKathy Gyngell
Professor Michael KellyLord MooreGraham Stringer MPProfessor Fritz Vahrenholt
Professor Christopher Essex (Chairman)Sir Ian ByattDr John ConstableProfessor Vincent CourtillotChristian GerondeauProfessor Larry GouldProfessor Ole HumlumProfessor Gautam KalghatgiProfessor Terence KealeyBill KininmonthBrian LeylandProfessor Richard LindzenProfessor Ross McKitrick
Professor Robert MendelsohnProfessor Garth PaltridgeProfessor Ian PlimerProfessor Gwythian PrinsProfessor Paul ReiterProfessor Peter RiddDr Matt RidleySir Alan RudgeProfessor Nir ShavivProfessor Henrik SvensmarkDr David Whitehouse
RECENT GWPF REPORTS14 Montford, Shade Climate Control: Brainwashing in Schools15 De Lange, Carter Sea-level Change: Living with Uncertainty16 Montford Unintended Consequences of Climate Change Policy17 Lewin Hubert Lamb and the Transformation of Climate Science18 Goklany Carbon Dioxide: The Good News19 Adams The Truth About China20 Laframboise Peer Review: Why Scepticism is Essential21 Constable Energy Intensive Users: Climate Policy Casualties22 Lilley £300 Billion: The Cost of the Climate Change Act23 Humlum The State of the Climate in 201624 Curry et al. Assumptions, Policy Implications and the Scientific Method25 Hughes The Bottomless Pit: The Economics of CCS26 Tsonis The Little Boy: El Niño and Natural Climate Change27 Darwall The Anti-development Bank28 Booker Global Warming: A Case Study in Groupthink29 Crockford The State of the Polar Bear Report 201730 Humlum State of the Climate 201731 Darwall The Climate Change Act at Ten32 Crockford The State of the Polar Bear Report 201833 Svensmark Force Majeure: The Sun's Role in Climate Change34 Humlum State of the Climate 201835 Peiser (ed) The Impact of Wind Energy on Wildlife and the Environment36 Montford Green Killing Machines37 Livermore Burnt Offering: The Biomess of Biomass38 Kelly Decarbonising Housing: The Net Zero Fantasy39 Crockford The State of the Polar Bear Report 2019
40 Darwall The Climate Noose: Business, Net Zero and the IPCC's Anticapitalism41 Goklany The Lancet Countdown on Climate Change: The Need for Context42 Humlum The State of the Climate 201943 Alexander Weather Extremes: Are They Caused by Global Warming?44 Constable Hydrogen: The Once and Future Fuel?45 Kessides The Decline and Fall of Eskom: A South African Tragedy46 Goklany Impacts of Climate Change: Perception and Reality47 Constable A Little Nudge with a Big Stick48 Crockford The State of the Polar Bear Report 202049 Alexander Weather Extremes in 2020
The GWPF is a registered charity, number 1131448.
For further information about the Global Warming Policy Foundation, please visit our website at www.thegwpf.org.