Embed Size (px)
Citation preview

i
EXTRACTION OF OMEGA-3 FATTY ACIDS FROM ATLANTIC
HERRING (Clupea harengus)
by
Akila Bura Mohanarangan
Submitted in partial fulfilment of the requirements
for the degree of Master of Applied Science
at
Dalhousie University
Halifax, Nova Scotia
November 2012
© Copyright by Akila Bura Mohanarangan, 2012

ii
DALHOUSIE UNIVERSITY
DEPARTMENT OF PROCESS ENGINEERING AND APPLIED SCIENCE
The undersigned hereby certify that they have read and recommend to the Faculty of
Graduate Studies for acceptance a thesis entitled “EXTRACTION OF OMEGA-3
FATTY ACIDS FROM ATLANTIC HERRING (Clupea harengus)” by Akila Bura
Mohanarangan in partial fulfilment of the requirements for the degree of Master of
Applied Science.
Dated: November 22, 2012
Supervisors: _________________________________
_________________________________
Reader: _________________________________

iii
DALHOUSIE UNIVERSITY
DATE: November 22, 2012
AUTHOR: Akila Bura Mohanarangan
TITLE: EXTRACTION OF OMEGA-3 FATTY ACIDS FROM ATLANTIC
HERRING (Clupea harengus)
DEPARTMENT OR SCHOOL: Department of Process Engineering and Applied
Science
DEGREE: MASc CONVOCATION: May YEAR: 2013
Permission is herewith granted to Dalhousie University to circulate and to have
copied for non-commercial purposes, at its discretion, the above title upon the request
of individuals or institutions. I understand that my thesis will be electronically
available to the public.
The author reserves other publication rights and neither the thesis nor extensive
extracts from it may be printed or otherwise reproduced without the author’s written
permission.
The author attests that permission has been obtained for the use of any copyrighted
material appearing in the thesis (other than the brief excerpts requiring only proper
acknowledgement in scholarly writing), and that all such use is clearly acknowledged.
_______________________________
Signature of Author

iv
DEDICATION
TO:
My parents
Mohanarangan. B.V and Maduram. N

v
TABLE OF CONTENTS
Page
LIST OF TABLES ............................................................................................................... ix
LIST OF FIGURES ............................................................................................................. xii
ABSTRACT ....................................................................................................................... xiv
LIST OF ABBREVIATIONS AND SYMBOLS USED .................................................... xv
ACKNOWLEDGEMENTS .............................................................................................. xvii
CHAPTER 1. INTRODUCTION ......................................................................................... 1
CHAPTER 2. OBJECTIVES ................................................................................................ 4
CHAPTER 3. LITERATURE REVIEW .............................................................................. 5
3.1. Canadian Fish Production ........................................................................................ 5
3.1.1. Atlantic region ............................................................................................... 5
3.1.2. Pacific region ................................................................................................. 5
3.2. Fish Processing Waste .............................................................................................. 8
3.3. Utilization of Fish Processing Waste ..................................................................... 10
3.3.1. Animal feed .................................................................................................. 10
3.3.2. Fish meal ...................................................................................................... 11
3.3.3. Chitin/chitosan ............................................................................................. 11
3.3.4. Enzymes ....................................................................................................... 13
3.3.5. Biodiesel ...................................................................................................... 14
3.4. Fish Lipids .............................................................................................................. 15
3.5. Omega-3 Fatty Acids ............................................................................................. 17
3.5.1. Alpha-linolenic acid (ALA) ......................................................................... 17
3.5.2. Eicosapentaenoic acid (EPA) ....................................................................... 20
3.5.3. Docosahexaenoic acid (DHA) ..................................................................... 20
3.6. Dietary Sources of Polyunsaturated Fatty Acids.................................................... 22
3.6.1. Marine Sources ............................................................................................ 22
3.6.2. Plant sources ................................................................................................ 26
3.7. Medical uses of Omega-3 Oil................................................................................. 27
3.8. Extraction of Fish Oil ............................................................................................. 27
3.8.1. Cooking and pressing ................................................................................... 27
3.8.2. Solvent extraction ........................................................................................ 28

vi
3.8.3. Enzymatic extraction ................................................................................... 30
3.9. Refining Edible Oils ............................................................................................... 31
3.9.1. Degumming ................................................................................................. 32
3.9.2. Neutralization ............................................................................................... 32
3.9.3. Bleaching ..................................................................................................... 32
3.9.4. Deodorization ............................................................................................... 33
3.10. Lipid Oxidation .................................................................................................... 33
3.10.1. Auto oxidation ........................................................................................... 33
3.10.2. Photo oxidation .......................................................................................... 35
3.10.3. Enzymatic oxidation .................................................................................. 36
3.11. Use of Antioxidants .............................................................................................. 36
3.11.1. Natural antioxidants ................................................................................... 37
3.11.2. Synthetic antioxidants ................................................................................ 38
3.12. Quality Parameters of Fish Oil ............................................................................. 38
3.12.1. Acid value .................................................................................................. 40
3.12.2. p-Anisidine value ....................................................................................... 41
3.12.3. Peroxide value ............................................................................................ 42
3.13. Concentration and Composition of Omega-3 Fatty Acids ................................... 42
3.13.1. Enzymatic hydrolysis ................................................................................. 43
3.13.1.1. Enzyme load. ............................................................................... 46
3.13.1.2. Temperature. ................................................................................ 46
3.13.1.3. pH. ............................................................................................... 47
3.13.1.4. Reaction time. .............................................................................. 47
3.13.2. Urea complexation ..................................................................................... 47
3.13.2.1. Crystallisation temperature. ......................................................... 51
3.13.2.2. Crystallisation time. ..................................................................... 52
3.13.2.3. Urea:fatty acid ratio. .................................................................... 52
3.13.3. Supercritical fluids ..................................................................................... 52
3.13.4. Molecular distillation ................................................................................. 53
3.13.5. Comparison of extraction methods ............................................................ 55
CHAPTER 4. MATERIALS AND METHODS ................................................................. 59
4.1. Experimental Materials .......................................................................................... 59
4.1.1. Fish ............................................................................................................... 59
4.1.2. Glassware ..................................................................................................... 59

vii
4.1.3. Chemicals and enzymes ............................................................................... 59
4.1.4. Reagents ....................................................................................................... 59
4.1.5. Equipment .................................................................................................... 60
4.2. Experimental Design .............................................................................................. 60
4.3. Experimental Procedure ......................................................................................... 64
4.3.1. Sample preparation ...................................................................................... 64
4.3.2. Stabilization of fish oil with antioxidant ...................................................... 64
4.3.3. Solvent extraction of fish oil ........................................................................ 64
4.3.4. Enzymatic hydrolysis of fish oil .................................................................. 67
4.3.5. Enzymatic concentration of omega-3 fatty acids ......................................... 69
4.3.6. Preparation of fatty acid methyl esters (FAME) .......................................... 69
4.4. Experimental Analysis ........................................................................................... 71
4.4.1. Determination of acid value ......................................................................... 71
4.4.2. Determination of p-anisidine value .............................................................. 72
4.4.3. Determination of peroxide value ................................................................. 72
4.4.4. FAME analysis ............................................................................................ 73
4.4.5. Statistical analysis ........................................................................................ 75
CHAPTER 5. RESULTS .................................................................................................... 76
5.1. Fish Composition ................................................................................................... 76
5.2. Enzymatic Extraction of oil.................................................................................... 76
5.2.1. Oil recovery ................................................................................................. 76
5.2.2. Quality of oil ................................................................................................ 83
5.2.2.1. Peroxide value. .............................................................................. 83
5.2.2.2. Acid value. ..................................................................................... 88
5.2.2.3. p-Anisidine value. ......................................................................... 93
5.2.3. Fatty acid composition of oil ....................................................................... 97
5.3. Chemical Extraction of Oil .................................................................................. 109
5.4. Comparing Enzymatic and Chemical Extraction Methods of Fish Oil ................ 109
5.5. Concentration of Omega-3 Fatty Acids ............................................................... 116
CHAPTER 6. DISCUSSION ............................................................................................ 124
6.1. Oil Extraction ....................................................................................................... 124
6.1.1. Effect of temperature ................................................................................. 125
6.1.2. Effect of pH ............................................................................................... 125
6.1.3. Effect of enzyme load ................................................................................ 127

viii
6.2. Oil Quality Parameters ......................................................................................... 127
6.2.1. Peroxide value ............................................................................................ 127
6.2.2. Acid value .................................................................................................. 129
6.2.3. p-anisdine value ......................................................................................... 131
6.3. Fatty Acid Composition ....................................................................................... 133
6.3.1. Saturated fatty acids ................................................................................... 133
6.3.2. Monounsaturated fatty acids ...................................................................... 135
6.3.3. Polyunsaturated fatty acids ........................................................................ 136
6.4. Enzymatic Extraction vs Chemical Extraction..................................................... 138
6.5. Concentration of Omega-3 Fatty Acids ............................................................... 141
CHAPTER 7. CONCLUSIONS ........................................................................................ 143
7.1. Future Work ......................................................................................................... 146
REFERENCES .................................................................................................................. 148
APPENDIX A: Enzymatic Hydrolysis Data ..................................................................... 172
APPENDIX B: Chemical Extraction Data ........................................................................ 183
APPENDIX C: Enzymatic Extraction of Omega-3 Fatty Acid Data ................................ 186

ix
LIST OF TABLES
Page
Table 3.1. Canadian commercial sea fisheries landings by species groups and
region, 2008 and 2009 (DFO, 2009; DFO, 2010). ...................................... 7
Table 3.2. Amount of fish waste produced in Atlantic Provinces in 2001 (AMEC,
2003). .......................................................................................................... 9
Table 3.3. Comparison of different fish species and their lipid content. ..................... 16
Table 3.4. Omega-3 polyunsaturated fatty acids content from various sources. ......... 23
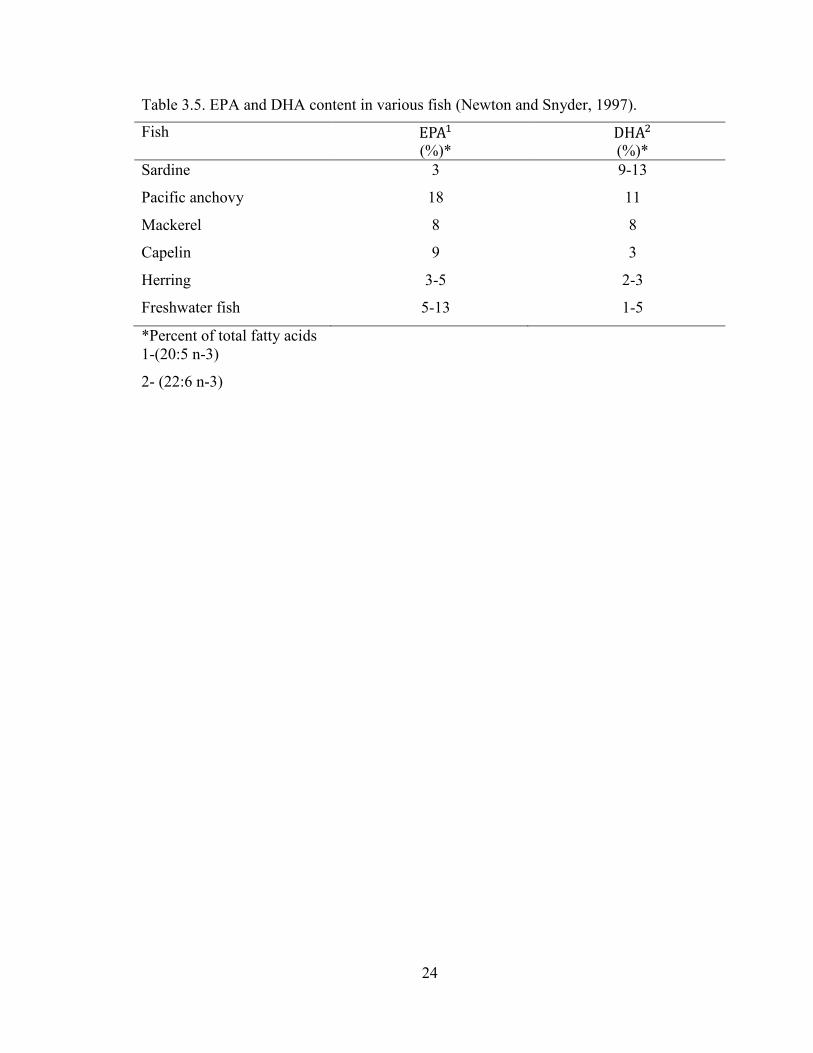
Table 3.5. EPA and DHA content in various fish (Newton and Snyder, 1997). ......... 24
Table 3.6. Omega 3 fatty acid content in various fish species (Piccolo, 2008). .......... 25
Table 3.7. Recommended quality parameters for crude fish oil. ................................. 39
Table 3.8. Comparison of immobilized lipase used in enzymatic hydrolysis. ............ 45
Table 3.9. Comparison of extraction methods of omega-3 fatty acids ........................ 56
Table 4.1. Fish oil extraction by enzymatic hydrolysis. .............................................. 61
Table 4.2. Recovery of omega-3 fatty acids using enzymatic hydrolysis. .................. 62
Table 4.3. Protocol for fatty acid analysis by gas chromatography. ............................ 74
Table 5.1. Composition of whole herring (Nova West Laboratory). ........................... 77
Table 5.2. Extracted fish oil using enzymatic hydrolysis. ........................................... 78
Table 5.3. ANOVA for oil recovery yield ................................................................... 79
Table 5.4. Tukey’s grouping for oil recovery yield. .................................................... 80
Table 5.5. Chemical analysis of fish oil. ...................................................................... 84
Table 5.6. ANOVA for peroxide value. ....................................................................... 85
Table 5.7. Tukey’s grouping for peroxide value.......................................................... 86
Table 5.8. ANOVA for acid value. .............................................................................. 89
Table 5.9. Tukey’s grouping for acid value ................................................................. 90
Table 5.10. ANOVA for p-anisidine value. ................................................................. 94
Table 5.11. Tukey’s grouping for p-anisidine. ............................................................ 95
Table 5.12. Fatty acid composition of fish oil obtained using enzymatic hydrolysis
at 55°C. ..................................................................................................... 98
Table 5.13. Fatty acid composition of fish oil obtained using enzymatic hydrolysis
at 70°C. ..................................................................................................... 99
Table 5.14. ANOVA for saturated fatty acids (myristic, palmitic and stearic) ......... 101
x
Table 5.15. Tukey’s grouping for saturated fatty acids (myristic, palmitic and
stearic) ..................................................................................................... 102
Table 5.16. ANOVA for monounsaturated fatty acids (palmitoleic, oleic and
vaccenic) ................................................................................................. 103
Table 5.17. Tukey’s grouping for monounsaturated fatty acids (palmitoleic, oleic
and vaccenic) ........................................................................................... 104
Table 5.18. ANOVA for polyunsaturated fatty acids (linoleic, alpha-linolenic and
arachidonic) ............................................................................................. 105
Table 5.19. Tukey’s grouping for polyunsaturated fatty acids (linoleic, alpha-
linolenic and arachidonic) ....................................................................... 106
Table 5.20. ANOVA for polyunsaturated fatty acids (eicosapentaenoic,
docosapentaenoic and docosahexaenoic) ................................................ 107
Table 5.21. Tukey’s grouping for polyunsaturated fatty acids (eicosapentaenoic,
docosapentaenoic and docosahexaenoic) ................................................ 108
Table 5.22. Recovery and chemical analysis of fish oil extracted using the Bligh
and Dyer method. .................................................................................... 110
Table 5.23. Fatty acid composition of fish oil obtained using the Bligh and Dyer
method. .................................................................................................... 111
Table 5.24. Comparison of chemical and enzymatic method with respect to yield,
peroxide value, acid value and p-anisidine value ................................... 112
Table 5.25. Comparison of fatty acid composition by chemical and enzymatic
methods ................................................................................................... 113
Table 5.26. Fatty acid composition of omega-3 fatty acids. ...................................... 117
Table 5.27. ANOVA for EPA and DHA. .................................................................. 119
Table 5.28. Tukey’s grouping for stirring levels. ...................................................... 120
Table 5.29. Fatty acid composition of omega-6, omega-7 and omega-9 fatty acids. 122
Table 5.30. Comparison of fatty acids composition of fish oil and omega-3
enriched oil. ............................................................................................. 123
Table A1. Recovery of fish oil extracted using enzymatic hydrolysis at 55°C. ........ 173
Table A2. Recovery of fish oil extracted using enzymatic hydrolysis at 70°C. ........ 174
Table A3. Chemical analysis of fish oil obtained using enzymatic hydrolysis at
55°C. ....................................................................................................... 175
Table A4. Chemical analysis of fish oil obtained using enzymatic hydrolysis at
70°C. ....................................................................................................... 176

xi
Table A5. Fatty acid composition of fish oil obtained using enzymatic hydrolysis
at 55°C and pH 7.0. ................................................................................. 177
Table A6. Fatty acid composition of fish oil obtained using enzymatic hydrolysis
at 55°C and pH 7.5. ................................................................................. 178
Table A7. Fatty acid composition of fish oil obtained using enzymatic hydrolysis
at 55°C and pH 8.0. ................................................................................. 179
Table A8. Fatty acid composition of fish oil obtained using enzymatic hydrolysis
at 70°C and pH 7.0. ................................................................................. 180
Table A9. Fatty acid composition of fish oil obtained using enzymatic hydrolysis
at 70°C and pH 7.5. ................................................................................. 181
Table A10. Fatty acid composition of fish oil obtained using enzymatic hydrolysis
at 70°C and pH 8.0. ................................................................................. 182
Table B1. Recovery and chemical analysis of fish oil extracted using the Bligh
and Dyer method. .................................................................................... 184
Table B2. Fatty acid composition of fish oil obtained using the Bligh and Dyer
method. .................................................................................................... 185
Table C1. Fatty acid composition of omega-3 fatty acids recovered using
enzymatic hydrolysis (wt %)................................................................... 187

xii
LIST OF FIGURES
Page
Figure 1.1. Structure of EPA and DHA (Darren and Bruce, 2004). .............................. 3
Figure 3.1. Total Canadian landed fish value by species groups 2009. ......................... 6
Figure 3.2. PUFA formation pathway (Holub and Holub, 2004). ............................... 18
Figure 3.3. Structure of eicosapentaenoic ethyl ester (Pettinello et al., 2000) ............ 21
Figure 3.4. Formation of urea crystals in the absence and presence of long chain
fatty acids (Wanasundara and Shahidi, 1998). .......................................... 48
Figure 3.5. Schematic representation of free fatty acids from fish oil
(Wanasundara, 1996). ............................................................................... 49
Figure 3.6. Preparation of omega-3 fatty acids concentrates by urea complexation
(Wanasundara, 1996). ............................................................................... 50
Figure 3.7. Schematic diagram of the supercritical fluid process (Kang et al., 2005). 54
Figure 4.1. Schematic representation of experiment for the recovery of fish oil and
comparison of fish oil extraction methods. ............................................... 63
Figure 4.2. Schematic representation of experiment for recovery of omega-3 fatty
acid from fish oil. ...................................................................................... 65
Figure 4.3. Schematic representation of the Bligh and Dyer method for extraction
of fish oil. .................................................................................................. 66
Figure 4.4. Schematic representation of enzymatic hydrolysis for extraction of fish
oil. ............................................................................................................. 68
Figure 4.5. Schematic representation of enzymatic hydrolysis for extraction of
omega-3 fatty acids from fish oil. ............................................................. 70
Figure 5.1. Effects of pH, enzyme load and temperature on oil recovery yield
obtained by enzymatic hydrolysis. ............................................................ 82
Figure 5.2. Effects of pH, enzyme load and temperature on peroxide value of fish
oil obtained by enzymatic hydrolysis. ....................................................... 87
Figure 5.3. Effects of pH, enzyme load and temperature on acid value of fish oil
obtained by enzymatic hydrolysis. ............................................................ 92
Figure 5.4. Effects of pH, enzyme load and temperature on p-anisidine value of fish
oil obtained by enzymatic hydrolysis. ....................................................... 96

xiii
Figure 5.5. Comparison of oil recovery yield of chemical and enzymatic
extraction methods. ................................................................................. 113
Figure 5.6. Comparison of the oil quality parameters for the enzymatic and
chemical extraction methods. .................................................................. 114
Figure 5.7. Effect of stirring level (CFS= constant fast stirring, CSS= constant
slow stirring, IS= intermediate stirring, NS= no stirring) on omega-3
fatty acids content ................................................................................... 118
xiv
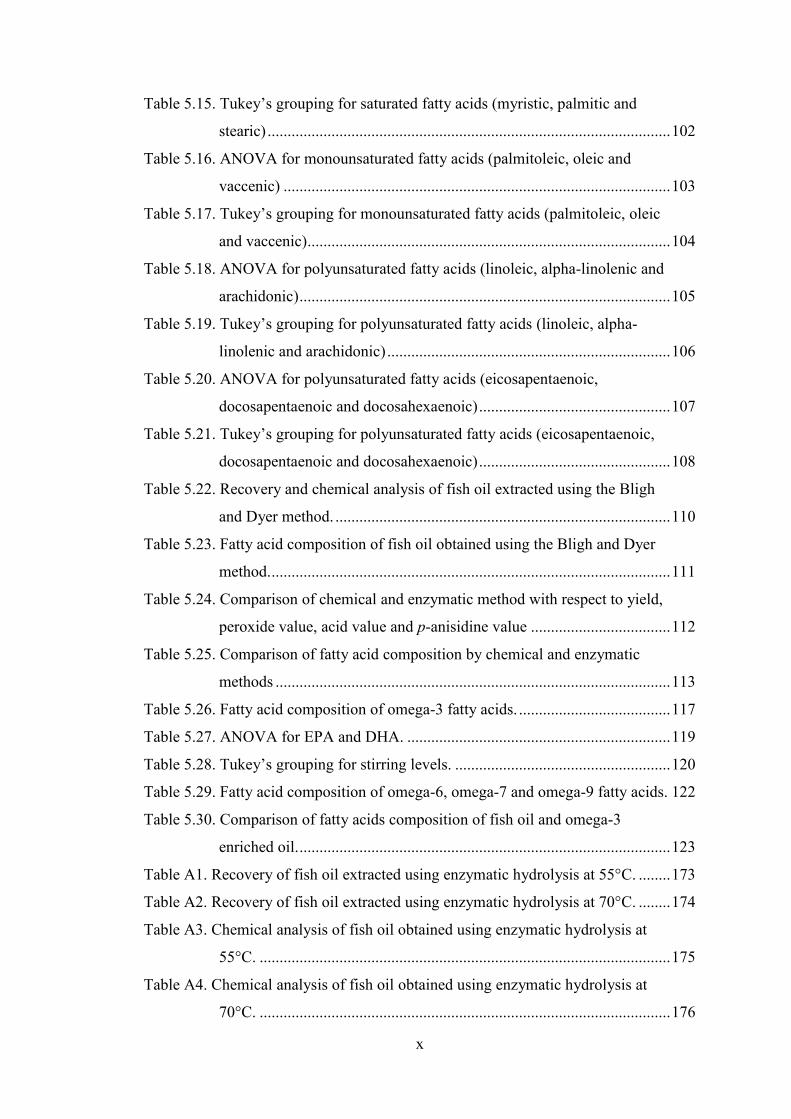
ABSTRACT
The fish processing industry faces problems due to the negative environmental impact
of its wastes. Fish wastes can be used to produce oil, protein, calcium, bio-diesel and
numerous bioactive compounds. In particular, fish oil is rich in omega-3 fatty acids
which can aid prevention and treatment of various diseases. The challenge is to
develop environmentally friendly and economically feasible techniques for extracting
omega-3 fatty acids. In this study, extraction of fish oil and omega-3 fatty acids from
Atlantic herring (Clupea harengus) by enzymatic hydrolysis was studied. The effects
of temperature, pH and enzyme loads on the extraction of fish oil using enzyme
alcalase were evaluated; the effect of mixing on the extraction of omega-3 fatty acids
was also investigated. Fatty acids were categorized into three groups: saturated (SFA),
monounsaturated (MUFA) and polyunsaturated fatty acids (PUFA). Increasing the
reaction temperature decreased the recovery yield (RY), and increased peroxide value
(PV), acid value (AV), p-anisidine value (p-AV), SFA, PUFA and MUFA. Increasing
the pH up to 7.5 decreased PV and increased AV, p-AV, RY, SFA, MUFA and
PUFA. Generally, increasing enzyme load increased RY, PV, AV, p-AV. However,
few samples showed increased SFA, MUFA and PUFA with increased enzyme load.
The optimum conditions of enzymatic extraction were at 55°C, pH of 7.5 and enzyme
load of 2.0%. Concentration of omega-3 fatty acid should be carried out with
immobilized enzymes and a higher centrifugal speed should be used to separate the
oil after hydrolysis. Also, antioxidants should be used to avoid oil oxidation. A
constant fast stirring (200 rpm) gave the highest omega-3 fatty acid content. The
results showed that solvent extraction was better (RY of 97.5%, PV of 12.04 Meq/g,
AV of 5.11 mg KOH/g and p-AV of 9.33) compared to enzymatic extraction (RY of
20.2%, PV of 31.44 Meq/g, AV of 11.13 mg KOH/g and p-AV of 58.27). Extraction
of fish oil using solvent system can be used but choloroform-methanol should be
replaced with hexane-isopropanol.

xv
LIST OF ABBREVIATIONS AND SYMBOLS USED
Ab Absorbance
ALA Alpha-linolenic acid
AOCS American oil chemists’ society
ARA Arachidonoic acid
AV Acid value
BHT Butylated hydroxytoluene
CC Candida cylindracea
Carbon dioxide
CR Candida rugosa
DHA Docosahexaenoic acid
DPA Docosapentaenoic acid
EPA Eicosapentaenoic acid
FA Fatty acid
FAME Fatty acid methyl ester
FFA Free fatty acid
FID Flame ionization detector
FM Fish meal
FWM Fish waste meal
GC Gas chromatography
HDL High density lipoprotein
HPLC High performance liquid chromatography
IBD Inflammatory bowel disease
LFW Liquid fish waste
MHO Menhaden oil
PUFA Polyunsaturated fatty acid
PV peroxide value
RA Rheumatoid Arthritis
SBO Seal blubber oil
SFW Solid fish waste
Spp Species

xvi
TAG Triacylglycerol
TOTOX Total oxidation value
VLDL Very low density lipoprotein
WHO World health organization

xvii
ACKNOWLEDGEMENTS
I wish to thank my supervisor Dr. Abdel Ghaly (Professor of Biological
Engineering, Department of Process Engineering and Applied Science) for his
tremendous help and support throughout the course of my study and for providing me
with the opportunity to work under his supervision I wish to express my sincere
gratitude for his help, patience and advice. I will forever be grateful to him for all the
kindness he showed me.
I would also like to thank my co-supervisor Dr. Su-Ling Brooks (Associate
Professor of Biological Engineering, Department of Process Engineering and Applied
Science) for her guidance, assistance and kindness.
I am grateful to Dr. Suzanne M. Budge (Associate Professor of Food Science,
Department of Process Engineering and Applied Science) for her immense
contribution to this study with her comments, advice and for giving me the
opportunity to work in her Food Science Laboratory.
I would like to give special thanks to Ms. Anne Timmins (Food Science
Technician) for her excellent technical assistance and immense help with my
laboratory work and Ms. Carrie Greene (Food Science Technician) for her technical
assistance and laboratory training. The assistance given by Dr. Deepika Dave
(Postdoctoral Fellow) for the project is appreciated. Thanks are also extended to all
the friends in Food Science and Biological Engineering Programs for their support
and friendship.
This work was supported by the National Science Engineering Research Council
(NSERC) of Canada.
Finally, special thanks to my wonderful parents for being there for me at all times
and for their prayers, advice, love and financial support during my studies.

1
CHAPTER 1. INTRODUCTION
Fish is considered to be one of the most perishable human foods throughout the world. It
has an excellent nutritional value, providing high quality protein and a wide variety of
vitamins (including vitamins A and D) and minerals including phosphorus, magnesium,
selenium, as well as iodine in marine fish (FAO, 2005).
Canada has the world’s most important commercial fishing and the capture industries
which operate in three broad regions namely the Atlantic Ocean, Pacific Ocean, and
freshwater bodies (CFS, 2006). Canada was ranked 19th
in terms of total volume of fish
landings in 2005 (FAO, 2005). Freshwater commercial fishing in Canada includes the
Lakes of Winnipeg, Cedar, Manitoba and Winnipegosis in the Province of Manitoba as
well as the Great Slave Lake in the Northwest Territories (FAO, 2005). In the year 2001,
the fisheries capture in Atlantic and Pacific coasts reached 958,744 tones (AMEC, 2003).
Fish processing generates wastes of up to 50% of the body weight of the processed fish
(Babbit, 1990). Fish processing involves scaling, cutting, filleting, cooking, salting and
canning. Large amounts of processing waste are discarded every year, including the fins,
frames, trimmings, heads, skin and viscera. The waste produced from fish processing can
be utilized for the production of fish meal and fish oil (Babbit, 1990).
Herring is the most widely processed fish species of which there are two types: Atlantic
herring (Clupea harengus) with 9%-18% fat and Pacific herring (Clupea harengus pallasi
valenciennes) with 14%-17% fat (Hilakivi-Clarke et al., 2002; Foodlexicon, 2008). In the
year 2007, the total Canadian catch (by volume) of Atlantic herring was about 55%
(James, 2009). According to British Columbia seafood production (2010), the harvest of
herring for the years 2008, 2009 and 2010 were 11.4, 12.3 and 10.1 thousand tonnes,
respectively. Herring waste from roe harvesting is about 95% of the total landings and it
is particularly oily (Mathur, 1994). Fish lipids have gained great importance because of
the presence of health beneficial omega-3 fatty acids (polyunsaturated fatty acids) in them
which include eicosapentaenoic acid (EPA) and docosahexaenoic acid (DHA) (Holub and

2
Holub, 2004). The importance of polyunsaturated fatty acids in the prevention of disease
and in human nutrition was scientifically recognized three decades ago (Bang et al.,
1976).
Omega-3 fatty acids are long-chain polyunsaturated FA commonly having 18, 20, or 22
carbon atoms in chain length with the first of the 3-6 double bonds adjacent to the third
carbon atom when counting from the methyl carbon end of the fatty acid molecule
(Darren and Bruce, 2004). Figure 1.1 represents the structure of EPA and DHA. Long
chain omega-3 fatty acids are mostly obtained from seafood or dietary alpha-linolenic
acid, whereas EPA and DHA are synthesized in marine plants such as phytoplankton and
micro algae. These are transferred through the food web into lipids in aquatic species like
fish and marine mammals (Cho et al., 1987). Increased intake of marine lipid will in turn
increase omega-3 fatty acids in the human diet. The health benefits of the omega-3 fatty
acids include a major role in the prevention of atherosclerosis, heart attack, depression,
stroke, diabetes, obesity, premature aging, hyper tension and cancer as well as improving
vision and memory (Chin and Dart, 1995; Connor, 2000).
Concentration of omega-3 polyunsaturated FA from fish oil has been carried out by urea
complexation (Gamez et al., 2003; Tor and Yi, 2001), supercritical fluid extraction
(Letisse et al., 2006; Mishra et al., 1993) and enzymatic hydrolysis (Zuta, 2003;
Wanasundara and Shahidi, 1998; Hoshino et al., 1990). Gas chromatography has been
used to analyze and quantify FA composition (Razak et al., 2001). The aim of this study
was to investigate the potential of developing environmentally friendly and cost effective
enzymatic techniques for the extraction of fish oil from Atlantic herring and separation of
omega-3 FA from fish oil.

3
(a) EPA
(b) DHA
Figure 1.1. Structure of EPA and DHA (Darren and Bruce, 2004).

4
CHAPTER 2. OBJECTIVES
The aim of this study was to extract fish oil with high omega-3 content from Atlantic
herring (Clupea harengus) by enzymatic hydrolysis and to concentrate omega-3 fatty
acids from the fish oil by enzymatic hydrolysis. The specific objectives of this study
were:
1. To optimize the recovery process of fish oil from Atlantic herring with enzyme
alcalase and to study the effects of the following parameters on the oil yield
(a) pH (7.0, 7.5 and 8.0)
(b) Enzyme load (0.5, 1 and 2% by weight)
(c) Temperature (55 and 70°C)
2. To determine the quality of oil by measuring the acid value, p-anisidine value,
peroxide value, fatty acid composition and lipid yield.
3. To compare the effectiveness of the optimized enzymatic hydrolysis method with the
the solvent extraction method with respect to oil yield and quality.
4. To determine the effect of stirring of oil samples (extracted by chemical method) with
the enzyme Candida rugosa (constant-fast stirring, constant-slow stirring, intermediate
stirring, and no stirring) on the enrichment of omega-3 fatty acids in the oil at the
optimum condition (20 h, 35°C and enzyme load of 800 Units).

5
CHAPTER 3. LITERATURE REVIEW
3.1. Canadian Fish Production
The total freshwater fishery landing in Canada for the year 2007 was 32,000 tonnes
valued at $63M. In the year 2009, commercial sea fisheries had total landings 924,756
tonnes which include top four species: herring 166, shrimp 141, snow crab 97 and hake
69 thousand tonnes which was valued at $1.7 billion. Figure 3.1 shows the total Canadian
value by species groups in 2009. Aquaculture production was 155 thousand tonnes,
representing 14% of total marine production. The salmon aquaculture represents 65% of
the total aquaculture production and 75% of the total aquaculture value. In 2010,
Canada’s fish and seafood exports were valued at $3.9 billion (Fisheries and Ocean
Canada, 2011). Table 3.1 describes the commercial sea fisheries landings by species
groups and region in 2008 and 2009.
3.1.1. Atlantic region
There was a decline in the catch of fish in northwest Atlantic during the past few years
due to environmental variations, fishing pressure and predation. Herring stocks, the most
important pelagic fisheries in northwest Atlantic, showed a decline in the recent years but
mackerel stocks remained abundant. The Canadian fishing efforts were dependent on
market conditions. The most important species in Atlantic Canada is Atlantic salmon.
Bluefin tuna was highly migratory species that is managed by International Commission
for the Conservation of Atlantic Tunas (FRBSS, 1996).
3.1.2. Pacific region
The major fisheries in Pacific Canada are divided in groups of 12 species that represent
about 80–90% of the total catch. The population dynamics of these species, climate and
ocean environment had a major impact on their productivity (Beamish et al., 2004). The
Pacific salmons have five major species in Canada’s Pacific coast (sockeye,

6
Figure 3.1. Total Canadian landed fish value by species groups 2009.
shellfish, 51% aquaculture, 33%
groundfish, 10%
pelagic, 5% other, 1%

7
Table 3.1. Canadian commercial sea fisheries landings by species groups and region,
2008 and 2009 (DFO, 2009; DFO, 2010).
Landings
(tonnes)
Atlantic Pacific Canada
2008
2009
2008
2009
2008
2009
Total
772,574
767,573
148,799
157,183
921,373
924,756
Ground fish 111,811 105,459 109,940 98,189 221,751 203,648
Pelagic 213,219 238,472 25,457 45,648 238,676 284,120
Shellfish 432,478 407,029 13,395 13,185 445,873 420,214
Other 15,065 16,613 6 161 15,071 16,774

8
pink, chum, chinook and coho) which were fished commercially (Groot & Margolis,
1991). The Pacific halibut fishery is the oldest and successful fisheries in Canada’s
pacific coast used for commercial purposes (Clark and Hare, 2002). The Pacific cod are a
relatively fast growing species that reaches maturity by age 2–3 years (DFO, 1999). The
Canadian fishery for albacore tuna started in the north Pacific with troll vessel in mid
1930s. By mid 1980s albacore tuna fishery began in the south Pacific (Shaw, 2001).
According to Benson et al. (2002) it was found that there were inverse relationship
between Pacific hake distribution and upwelling. The link between upwelling and Pacific
hake was the biomass of euphausiids, the key prey item. Ware (1991) showed that climate
related changes in the ocean environment strongly affected the trends in abundance of
Pacific herring off Canada’s west coast and these species were also strongly affected by
predators.
3.2. Fish Processing Waste
The fish processing industry is wide spread worldwide and varies in its operations, scale
of production and outputs. The industry produces fresh fish, frozen fish, marinated fillets
and canned fish (UNEP, 2000). The wastes obtained from filleting operations include
heads, tails, bones, skin and viscera which are rich in omega-3 fatty acids (Junker et al.,
2006). Fish processing wastes are of two types: (a) solid fish waste (SFW) which consists
mainly of scales, bones, fins and tails and (b) liquid waste which contains soluble
proteins, enzymes, pigments, blood and lipids. Varying amounts of solid matter including
offal, skin, and bone are present in untreated effluents from fish processing plants
(AMEC, 2003).
Table 3.2 describes the maximum possible waste produced by different Atlantic Province
in Canada. The by-products from filleting, gutting and other fish processing operations
serve as good raw materials for fish meal and fish oil production. These by-products are
rich in valuable minerals, enzymes, pigments and flavors that are required by many

9
Table 3.2. Amount of fish waste produced in Atlantic Provinces in 2001 (AMEC, 2003).
Province
Total Landing
(Metric Tonnes)
Product Weight
(Metric Tonnes)
Possible Waste
(Metric Tonnes)
NewBrunswick 113588 89012 24576
New Foundland 267959 120999 146960
Nova Scotia 366381 146708 219673
PrinceEdward Island 66046 39000 27046
TOTAL 813974 395719 418255

10
industries including food, agriculture, aquaculture and pharmaceuticals (Archer et al.,
2001).
3.3. Utilization of Fish Processing Waste
The utilization of by-products is considered an important clean production opportunity for
the fish processing industry as it potentially generates additional revenue, reduces
disposal costs of these materials and eliminates or reduces the environmental and health
impacts of waste disposal (Ioannis and Aikaterini, 2008). Utilization of fish processing
waste includes animal feed, fish meal, chitin/chitosan, enzymes and biodiesel.
3.3.1. Animal feed
Offal from the fish processing industry is used as an animal feed ingredient, as a good
source of high-quality protein and energy (New, 1996; Gabrielsen and Austreng, 1998).
Carotenoids which are extracted from shrimp waste (head and body covering) are used in
the formulation of aquaculture feed (Sachindra et al., 2001; Sachindra et al., 2006).
Faid et al. (1997) evaluated chopped pilchard waste (heads, tails and viscera), combined
with 25% molasses and inoculated with bacteria (Saccharomyces sp. and Lactobacillus
plantarum) for their nutritional quality and biochemical properties (pH, dry matter, ash,
total and volatile nitrogen, lipids and trimethylamine) during 15 days of fermentation
period at 22°C. The results indicated that the pH and the total nitrogen decreased whereas
non-protein nitrogen and volatile nitrogen increased significantly.
Rahmi et al. (2008) fermented fish waste (viscera, heads, tails and skins) that was
grounded with 10% molasses and inoculated with culture (Lactobacillus plantarum) at
25°C for 10 days. The results showed that pH and total nitrogen decreased but non-
protein nitrogen and volatile nitrogen increased. The trial feeding of fish silage to young
sheep showed increases in weight above controls and good improvements of meat
characteristics and carcass shape.

11
3.3.2. Fish meal
Fish meal has been used as livestock feed for many years and has high nutritional value as
it is a good source of vitamin, phosphorous, calcium, iron and other trace minerals, but is
low in fiber (Hall, 1992). Vannuccini (2004) reported that the production of fish meal
from fish processing waste is a better utilization because it reduces waste and the fish
meal price is high based on the protein content. However, the meal produced from waste
with high lipid content and low protein is rated low quality. Large scale productions of
fish meal from fish processing wastes are available (FAO, 1986).
Composition of the raw material is expressed in terms of fat, dry matter and protein. The
recovered dry matter has 20% higher yield of protein which depends upon the freshness
and nature of the raw material. Generally, wet pressing methods (physical method) are
adapted to produce fish meal and oil. The pressing method yields two different phases:
the solid phase (press cake) which contains 60-80% of the oil-free dry matter (protein,
bones) and oil; the liquid phase (press liquor) which contains water and the rest of the
solids like oil, dissolved and suspended protein, vitamins and minerals.
Olomu and Nwachukwu (1977) reported on the production of fish meal which includes
result from anchovy, herring, menhaden and white fish. Sotolu (2009) compared dietary
fish waste meal (FWM) and imported fishmeal (FM) at 10 and 15% inclusion level of
catfish and found no significant difference between FWM and FM based diets. Honczaryk
and Maeda (1998) studied the fish meal production of arapaima (Arapaima gigas), a very
important freshwater carnivorous fish from the Amazon area, and concluded that they
presented a higher level of ingestion. Abiola and Onunkwor (2004) compared the
hatchery waste meal (HWM) with fish meal in layer diets at 0, 33, 66 and 100% levels
and found the protein content of HWM diets to be superior.
3.3.3. Chitin/chitosan
One of the most abundant natural polysaccharides produced by many living organisms is
chitin. It is usually found as a component of crustacean shell and this polymer consists of

12
linear chains (Rinaudo, 2006). Chitin is a nitrogen containing polysaccharide, related
chemically to cellulose (Patil and Satam, 2002). Chitin and chitosan are nontoxic and
biodegradable (Rashidova et al., 2004). Three different polymers of chitin are found in
nature: alpha chitin, beta chitin and gamma chitin. Alpha-chitin, the most abundant in
nature with anti-parallel chains structure, is found in crabs, shrimp and lobsters. Beta-
chitin found in squid has intrasheet hydrogen bonding by parallel chains. Gamma-chitin is
a combination of alpha and beta chitin which has a mixture of parallel and antiparallel
chains (Jang et al., 2004).
Abdou et al. (2008) studied the extraction of chitin from six different local sources in
Egypt. The chitin obtained was converted to useful soluble chitosan by steeping into
solutions of NaOH (various concentrations) for long time. The obtained alkali chitin was
heated in an auto clave which significantly reduced the time of deacetylation. The chitin
and chitosan were characterized by X-ray diffraction, spectral analysis and thermo
gravimetric analysis.
Manni et al. (2010) used protease from Bacillus cereus SV1 for chitin extraction from
shrimp waste material. Using crude protease from B. cereus, chitin was converted to
chitosan by N-deacetylation, and the antibacterial activity of chitosan solution against
different bacteria was investigated. Results showed that chitosan obtained inhibited the
growth of most Gram-negative and Gram-positive bacteria tested.
Chitin and chitosan are used in biomedical applications including drug delivery systems,
implantable and injectable systems (Berger et al., 2004). The positive charge of chitosan
allows it to interact with negative molecules (DNA). This phenomenon allowed for
chitosan to be used in preparing a non-viral vector for a gene delivery system (Mumper et
al., 1995). Studies on regenerative tissue engineering recommend the use of chitosan
scaffolds to support damaged tissue. Chitosan scaffolds are promising materials for the
design of tissue engineered systems due to their low immunogenic activity, porous
structure and controlled biodegradability (Ho et al., 2005). Diabetic ulcers showed
immediate response to chitosan (Batista et al., 2006). Chitosan has also been used in the

13
food industry as preservatives, for the formation of biodegradable films and recovery of
material from food processing waste (Aranaz et al., 2009). According to Chien and Chou
(2006), chitin and chitosan were used as supports for enzyme and cell immobilization due
to their characteristics (density, rigidity and mechanical stability).
3.3.4. Enzymes
Fish processing waste can be used to produce enzymes such as pepsin and chymotrypsin.
Pepsin is an enzyme secreted in the gastric juice of the stomach lumen and it helps in the
digestion of proteins in animals (Haard and Simpson, 2000; Effront et al., 2007).
Pepsinogen is a proenzyme of pepsin. The major role of pepsin in protein proteolysis is to
cleave aromatic amino acids (phenylalanine and tyrosine) from the N-terminus of proteins
(Raufman, 2004). Chymotrypsin is a digestive enzyme found in pancreatic tissues of
vertebrates and inverbrates which is secreted into the duodenum (Geiger, 1985).
Chymotrypsin was classified into three types: chymotrypsin (A, B, C) found in mammals
but only two types of chymotrypsin (A and B) have been found in fish (Yang et al.,
2009).
Benhabiles et al. (2012) studied the optimizationof fish protein hydrolysate (FPH)
production by enzymatic hydrolysis of sardine solid waste using crude pepsin. The crude
pepsin prepared by autolysis of the mucous membranes of a sheep stomach at optimal
conditions (i.e. pH = 1.5–2 and incubation time of 6 h) was satisfactory and used for the
enzymatic hydrolysis of fish solid waste. The optimal conditions for enzymatic reaction
were: temperature 48°C and pH 1.5.
Hinsui et al. (2006) studied the extraction of tryptic and chymotryptic activities from
spleen, liver, stomach, intestine and mixed viscera of Nile tilapia (Oreochromis niloticus
Linneaus). The results showed that the intestine was the best source for trypsin and
chymotrypsin and they extracted using 30-70% saturated ammonium sulfate precipitation,
followed by dialyzed, acetone precipitation and separated by SBTI affinity
chromatography column. The obtained specific activities of trypsin and chymotrypsin
14
were 0.529 and 0.380 unit/mg protein, respectively. Also it was noted that trypsin fraction
was stable at 0-60°C and chymotrypsin was stable at 0-50°C for 30 min at pH 8.0.
sp sito et al. (2010) studied the purification of trypsin from the viscera of lane snapper
(Lutjanus synagris) by heat treatment, fractionation with ammonium sulfate and affinity
chromatography. The maximal activity was exhibited by the enzyme at pH 9.0 and 45 °C.
After incubation at the optimal temperature for 30 min, 100% of the activity was retained.
With the presence of different surfactants (Tween 20, Tween 80 and sodium choleate), the
enzyme retained more than 80% activity after 60 min. They also showed the compatibility
with commercial detergents (7 mg/mL), such as Bem-te-vi, Surf and Ala, which retained
more than 50% of initial activity after 60 min at 25 °C and 30 min at 40 °C.
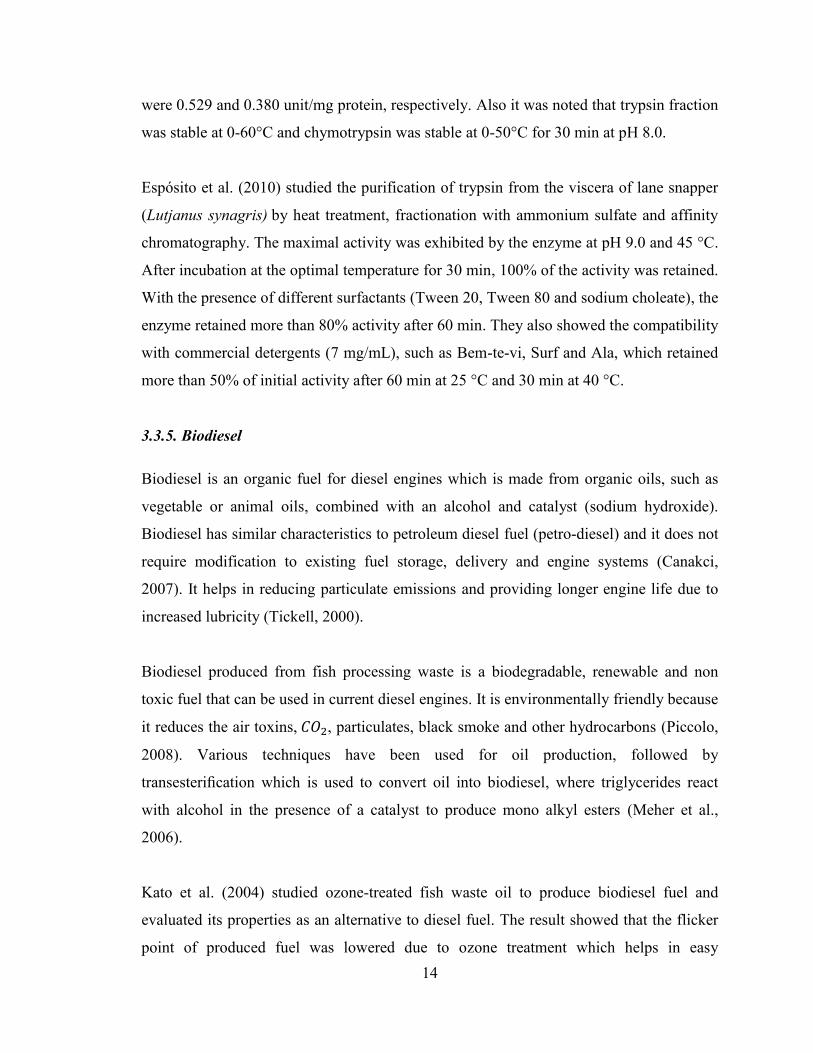
3.3.5. Biodiesel
Biodiesel is an organic fuel for diesel engines which is made from organic oils, such as
vegetable or animal oils, combined with an alcohol and catalyst (sodium hydroxide).
Biodiesel has similar characteristics to petroleum diesel fuel (petro-diesel) and it does not
require modification to existing fuel storage, delivery and engine systems (Canakci,
2007). It helps in reducing particulate emissions and providing longer engine life due to
increased lubricity (Tickell, 2000).
Biodiesel produced from fish processing waste is a biodegradable, renewable and non
toxic fuel that can be used in current diesel engines. It is environmentally friendly because
it reduces the air toxins, , particulates, black smoke and other hydrocarbons (Piccolo,
2008). Various techniques have been used for oil production, followed by
transesterification which is used to convert oil into biodiesel, where triglycerides react
with alcohol in the presence of a catalyst to produce mono alkyl esters (Meher et al.,
2006).
Kato et al. (2004) studied ozone-treated fish waste oil to produce biodiesel fuel and
evaluated its properties as an alternative to diesel fuel. The result showed that the flicker
point of produced fuel was lowered due to ozone treatment which helps in easy

15
combustibility. Also, the ion chromatograms obtained from gas chromatography showed
that the fatty acids in the fish waste oil decomposed to produce hydrocarbons. Lin and Li
(2009) obtained crude oil from soap-stock of the fish which was then refined and
transesterified to produce biodiesel. El-Mashad et al. (2008) studied the production of
biodiesel by transesterification in a two step process (sulphuric acid-catalysed and KOH-
catalysed) using by-product of salmon processing. Fukuda et al. (2001) reported the
transesterification of oils for the production of biodiesel.
Recently, enzymatic transesterification using lipase has become more attractive for
biodiesel fuel production. By-products such as glycerol produced can be recovered easily.
Cost of lipase makes the production difficult to commercialize and by means of reducing
the cost, the use of whole cell immobilized biocatalysts has significant advantage.
Immobilization can be achieved spontaneously during batch cultivation, and does not
require purification.
3.4. Fish Lipids
Marine lipids from the flesh of fatty fish (herring, capelin, sardine, mackerel, anchovy,
sand eel, menhaden, sprat and blue whiting), blubber from marine mammals and livers of
lean fish (haddock, halibut, perch, sole, cod, flounder, pike and red snapper) contain
triacylglycerols (TAG). Lean fish are those that are low in fat and fatty fish are those
which are high in fat. Both fish oil and marine mammal oil are rich in eicosapentaenoic
acid (EPA) and docosahexaenoic acid (DHA). The amount of docosapentaenoic acid
(DPA) is higher in marine mammal oil than in fish oil (Shahidi and Miraliakbari, 2006).
Lipids are primarily located in subcutaneous tissues such as belly flaps, livers, muscle
tissues and heads (Ackman, 1994). The amounts of lipid in dark muscles are greater than
that of white muscles (Zhou and Ackman, 1995). Fish skin contains more lipids than the
muscle tissues. In the skin of lean fish, the lipid content averages 0.2-3.9% w/w whereas
the lipid content of fatty fish are higher than 50% w/w. In cod, the average lipid content in
roe is 0.3-1.5% w/w and is up to 70% w/w in liver. Lipid content of non-edible offal is
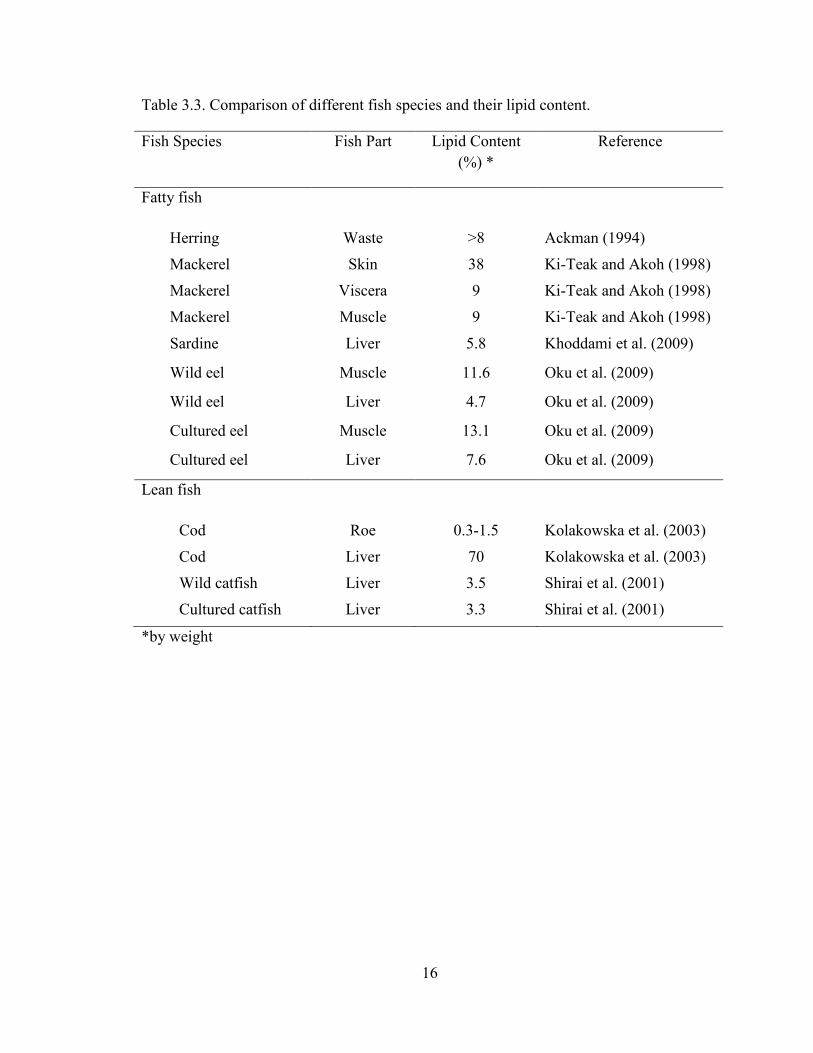
higher than in fillet (Kolakowska et al., 2003). Table 3.3 shows different fish species and
their lipid contents.
16
Table 3.3. Comparison of different fish species and their lipid content.
Fish Species Fish Part Lipid Content
(%) *
Reference
Fatty fish
Herring Waste >8 Ackman (1994)
Mackerel Skin 38 Ki-Teak and Akoh (1998)
Mackerel Viscera 9 Ki-Teak and Akoh (1998)
Mackerel Muscle 9 Ki-Teak and Akoh (1998)
Sardine Liver 5.8 Khoddami et al. (2009)
Wild eel Muscle 11.6 Oku et al. (2009)
Wild eel Liver 4.7 Oku et al. (2009)
Cultured eel Muscle 13.1 Oku et al. (2009)
Cultured eel Liver 7.6 Oku et al. (2009)
Lean fish
Cod Roe 0.3-1.5 Kolakowska et al. (2003)
Cod Liver 70 Kolakowska et al. (2003)
Wild catfish Liver 3.5 Shirai et al. (2001)
Cultured catfish Liver 3.3 Shirai et al. (2001)
*by weight
17
The oils from lean fish are of high quality and are used as medicinal fish oil (Hjaltason,
1992). Fatty fish have small livers and the bulk of fatty oil is present in their fatty flesh
(Bimbo, 1998; Haraldsson and Hjaltason, 2001). Pink salmon heads have high lipid
content but the viscera have the lowest oil content (Wanasundara et al., 1998; Aidos et al.,
2002). Catfish processing by-products consist of heads, frames, skin and viscera.
Extraction of oil from viscera added value to the catfish viscera and increased the total
unsaturated fatty acids. However, the combined n-3 fatty acids of purified catfish viscera
oil were only 4.6 mg/g of oil (Sathivel et al., 2003).
3.5. Omega-3 Fatty Acids
Naturally occurring polyunsaturated fatty acids (PUFA) are divided in four major
families: omega-3 (alpha-linolenic acid, eicosapentaenoic acid and docosahexaenoic
acid), omega-6 (arachidonic acid and linoleic acid), omega-7 (palmitoleic
acid and vaccenic acid) and omega-9 (oleic acid and erucic acid). Figure 3.2 shows PUFA
formation pathway. The designation Omega (ω) is related to the position of the first
double bond from the methyl end of fatty acid. Omega-3 fatty acids have been known as
an essential nutrient to normal growth in human being. However, there is a solid evidence
that they may also favorably modulate many diseases (Connor, 2000; Covington, 2004).
Omega 3 fatty acids are essential nutrients for human body but cannot be manufactured in
the body and must be obtained from the external source (Cunnane et al., 2007). Alpha-
linolenic acid (ALA) is the primary omega 3 fatty acids and is converted into the fatty
acids eicosapentaenoic acid (EPA) and docosahexaenoic acid (DHA) in the body.
Unfortunately, the percent of the conversion (less than 1%) of ALA into EPA and DHA
in human body is inefficient (McKeigue and Sevak, 1994; Covington, 2004).
3.5.1. Alpha-linolenic acid (ALA)
Alpha-linolenic acid (ALA 18:3n-3) is a polyunsaturated fatty acid which has 18 carbon
atoms and 3 double bonds (Holub and Holub, 2004). Only this omega-3 fatty acid is
found in vegetable products. It is produced de vivo in plants by the Delta 12 and Delta 15

18
Figure 3.2. PUFA formation pathway (Holub and Holub, 2004).

19
desaturation of oleic acid in plants. This fatty acid is a metabolic precursor for the
production of omega-3 fatty acids in animals (Charles, 2009). According to Simopoulos
(2004) edible wild plants provide ALA and higher amounts of vitamin E and C than
cultivated plants. ALA intake is related to the inhibitory effects on the clotting activity of
platelets. In clinical studies, ALA was used in lowering blood pressure and an
epidemiological study showed that ALA was inversely related to the risk of coronary
heart disease in men (Simopoulos, 2004). The advantage of consuming ALA over ω-3
fatty acids from fish is that the problem of insufficient vitamin E intake does not exist
with high intake of ALA from plant source.
Jager et al. (2008) studied the isolation of linoleic and alpha-linolenic acids as COX-1 and
2-inhibitors in rose hip. It was carried out by extraction with petroleum ether fractioned
by VLC on silica, on C-18 column and by HPLC. Every step was COX-1/2 activity-
guided. The results showed that the COX-2/COX-1 ratio was 0.007 for linoleic acid and
0.2 for alpha-linolenic acid.
Ghafoorunissa and Pangrekar (1993) studied the vegetable sources of alpha-linolenic acid
in Indian diet. Total lipids were extracted from vegetable, dry beans and fenugreek seeds
and their fatty acid compositions were determined. From the results, it was observed that
fenugreek seeds contained 2% alpha-linolenic acid and green leafy vegetables provided
about seven times more alpha-linolenic acid than fresh beans and other vegetables. Cereal
pulse-based a lacto vegetarian diets which are rich in alpha-linolenic acid made important
contributions to the intake of n-3 fatty acids.
Vijaimohan et al. (2006) investigated the effect of flaxseed oil (FO) rich in alpha-
linolenic acid on growth parameters and lipid metabolism of rats fed with high fat diet. A
high fat diet increased the body weight and had a negative effect on lipoprotein
metabolism. But FO supplementation lowered the body weight gain, liver weight, plasma
cholesterol, free fatty acid, HDL, LDL in the high fat diet fed rat and also reduced the
hepatic and plasma lipid level. There was no adverse effect of FO on growth parameters
and plasma lipids in rats fed with the fat free diet.
20
3.5.2. Eicosapentaenoic acid (EPA)
Eicosapentaenoic acids (EPA: 20:5n-3) are derived from long-chain fatty acids with a
long un-branched aliphatic tail (chain) of saturated or unsaturated carboxylic acid
(Bruinsma and Taren, 2000). The differences in geometry among the various types of
unsaturated fatty acids and between saturated and unsaturated fatty acids play an
important role in biological processes (Harrison, 2007). EPA is found in fish oil, sea
weeds, algae and sea food.
Pettinello et al. (2000) studied the preparative supercritical fluid chromatography process
to extract fractions of eicosapentaenoic ethyl ester (EPA-EE). EPA-EE is a stabilized
ethyl ester form of ω-3 C20:5 PUFA and is shown in Figure 3.3. The starting mixture
with 68% of EPA-EE was fractionated by a silica adsorption column ( was used as
the supercritical solvent). Samples eluted were collected and analyzed by capillary and
packed column gas chromatography. The results showed that the bench scale equipment
gave 95% EPA-EE fraction and the pilot plant gave maximum purity of 93%.
3.5.3. Docosahexaenoic acid (DHA)
Docosahexaenoic acids (DHA: 22:6n-3) are long-chain fatty acids with a long unbranched
aliphatic tail (chain) of saturated or unsaturated carboxylic acid (Bruinsma and Taren,
2000). DHA are found in fish oil, sea weeds, algae and sea food.
Tang et al. (2011) studied the isolation of the lipids from microalgae by supercritical
CO2 (SC-CO2) extraction followed by a further enrichment of crude lipids to produce
high-purity docosahexaenoic acid (DHA) by the urea complexation method. It was
observed that 33.9% of lipid yield and 27.5% of DHA content were achieved. The urea
complexation method for DHA enrichment considerably increased the DHA purity from
29.7% to 60.4% with an enrichment ratio of 60.6%.
Mendes et al. (2007) studied a simple procedure involving saponification and methylation
in wet biomass. Winterization and urea complexation was used to concentrate

21
Figure 3.3. Structure of eicosapentaenoic ethyl ester (Pettinello et al., 2000)
22
docosahexaenoic acid (DHA) from Crypthecodinium cohnii CCMP 316 biomass. The
results showed that the temperature had the most significant effect on the DHA
concentration. The highest DHA fraction (99.2% of total fatty acids) was found at the
urea/fatty acid ratio of 3.5 at the crystallization temperatures of 4-8 °C. The highest DHA
recovery (49.9 %) was observed at 24°C at the urea/fatty acid ratio of 4.0, corresponding
to 89.4 % DHA of total fatty acids.
3.6. Dietary Sources of Polyunsaturated Fatty Acids
Daily dose of EPA and DHA combination per day is 0.3-0.5 grams and 0.8-1.1 grams for
alpha-linolenic acid (FAO, 1994). Omega-3 fatty acids can be obtained in human diets
through marine or plant sources. The marine source (fatty fish) provides EPA and DHA
and the plant sources (flax, walnuts, canola oil) provide ALA (Eckert et al., 2010).
3.6.1. Marine Sources
Primary sources of the omega 3 fatty acids are of marine origin: algae, fungi and
phytoplankton. They are integrated into phospholipids and fat deposits in fish and other
marine animals (seal and whale) via bioaccumulation. Higher levels of EPA are found in
the algae Nitzschia spp., Nannochloropsis spp., Navicula spp., Phaeodactylum spp.,
Porphyridium spp., Crypthecodinium cohnii and Schizochytrium spp. were known for
their higher level of DHA (Ward and Singh, 2005). Fungi species like Mucor
circinelloides. Mortierella, Pythium, Thraustochytrium, and Entomophthora were used
for the production of arachidonic acid (ARA) and eicosapentaenoic acid (EPA) (Sneha,
2008).
Table 3.4 shows omega-3 polyunsaturated fatty acids content from various sources. Table
3.5 shows the content of omega-3 fatty acids, EPA and DHA in various fish. Table 3.6
shows omega-3 fatty acid content in various fish species. Cold water fatty fish including
salmon, tuna (bluefin tuna has five times more DHA than other types of tuna), menhaden
mackerel, sardines, shellfish and herring are rich sources of omega-3 fatty acids (Singh,

23
Table 3.4. Omega-3 polyunsaturated fatty acids content from various sources.
Source (%)*
(%)*
Reference
Algae
Ceramiaceae
Ceramium boydenii Gepp 16.8 - Li et al. (2002)
Ceramium kondoi Yendo 20.1 - Li et al. (2002)
Rhodomelaceae
Laurencia okamuraiOkam. 23.4 - Li et al. (2002)
Polysiphonia urceolata
(Lightf.) Grev.
37.5 - Li et al. (2002)
Rhodomela confervoides
(Huds.) Silva
24.8 - Li et al. (2002)
Corallinaceae
Corallina pilulifera Post. et
Rupr.
31.5 - Li et al. (2002)
Dumontiaceae
Hyalosiphonia caespitosa
Okam.
12.5 - Li et al. (2002)
Gloiosiphoniaceae
Gloiosiphonia capillaris
(Huds.) Carm
3.6 - Li et al. (2002)
Gelidiaceae
Gelidium amansii Lamour 13.3 - Li et al. (2002)
Soil microorganism
Trichoderma sp. 0.298 7.47 Gayathri et al. (2010)
* Percent of total fatty acids
1- (20:5 n-3)
2- (22:6 n-3)
24
Table 3.5. EPA and DHA content in various fish (Newton and Snyder, 1997).
Fish (%)*
(%)*
Sardine 3 9-13
Pacific anchovy 18 11
Mackerel 8 8
Capelin 9 3
Herring 3-5 2-3
Freshwater fish 5-13 1-5
*Percent of total fatty acids
1-(20:5 n-3)
2- (22:6 n-3)

25
Table 3.6. Omega 3 fatty acid content in various fish species (Piccolo, 2008).
Fish Species Omega-3 (EPA+DHA)
(g/100g of fish)
Tuna (fresh) 0.28-1.51
Atlantic salmon 1.28-2.15
Mackerel 0.4-1.85
Atlantic herring 2.01
Rainbow trout 1.15
Sardines 1.15-2
Halibut 0.47-1.18
Tuna (canned) 0.31
Cod 0.28
Haddock 0.24
Catfish 0.18
Flounder or sole 0.4
Oyster 0.44
Shrimp 0.32
Scallop 0.20
Cod liver oil capsule 0.19
Omacor (Pronova) 0.85

26
2005). The blubber oil of marine mammals such as seal, whale and walrus are rich
sources of omega-3 fatty acids (Wanasundara, 1996).
3.6.2. Plant sources
The essential alpha-linolenic acid is found in plant sources such as flax seeds, walnuts,
butternuts, pumpkin seeds, red and black currant seeds, wheat germ, soy and canola oil
and leafy green plants like purslane. Perilla frutescens seed oil (PFSO) is rich source of
unsaturated fatty acid particularly in omega-3 linolenic acid (Eckert et al., 2010).
Increased intake of ALA, similar to the intake of EPA and DHA, may possess favorable
effects in health (Simopoulos, 1991).
Inuwa et al. (2012) isolated long chain n-3 unsaturated fatty acids from Telfairia
Occidentalis using an arginated silica gel column. The dry weight of Telfairia
Occidentalis leaves had highest percentage of long chain fatty acid. Type n-3 was noted
using GC-MS as palmitoleic acid and elaidic acid.
Siriamornpun et al. (2006) studied the extraction of lipid and fatty acid composition of
Thai Perilla frutescens obtained from different regions (Maehongsorn and Chiang Mai).
The lipid content was between 34-36% and triglycerides were the predominant lipid in
perilla seed. The main fatty acid was alpha-linolenic acid (50-60% of total fatty acid) and
it was also shown that the compositions of lipids and fatty acids in Thai perilla seeds
varied considerably with samples from different locations.
Eckert et al. (2010) studied the effect of Perilla frutescens seed oil (PFSO) on central
nervous system (CNS) and protection of unsaturated fatty acids within the CNS. The
results showed that the identified PFSO was a promising nutraceutical which can be used
as alternative to fish oil supplement and it has provided mechanisms for neuroprotective
actions of unsaturated fatty acids.

27
3.7. Medical uses of Omega-3 Oil
Omega 3 fatty acids are vital for conception through pregnancy and infancy, essential for
normal growth and development and maintaining good health (Connor, 2000). DHA has
beneficial effect in the development of retina and brain in human being while EPA has
been related to anti-inflammatory properties, reduction of obesity related disorders,
shrinking of tumors and reduction of human depression levels (Mitsuyoshi et al., 1991).
They are also used in prevention and treatment of coronary artery disease, cancer,
diabetes, hypertension, rheumatoid arthritis (Shahidi, 2008; Shahidi and Miraliakbari,
2006). Fish oil and blubbers oil of marine mammals including seal, whale and walrus are
the rich source of omega-3 fatty acids and a low dose of seal oil can reduce the risk of
atherogenic disease. However, seal oil contains high level of DPA, which is the most
important fatty acid that keeps artery walls plaque free (Hu et al., 2002).
3.8. Extraction of Fish Oil
Huss (1988) stated that the amount of fish oil that can be extracted depends on the fish
species, age, gender, location, species-origin characteristics (spawning and migration
seasons), environmental conditions (temperature) and extraction method. Fish oils are
classified into their lipid fractions such as triacylglycerol (TAG), diacylglycerol (DAG),
monoacylglycerol (MAG), sterylesters, phospholipids, free fatty acids and sterols. Lipids
differ between various tissues, organs and species. The kind of fatty acids present as free
acid or as neutral lipid depends upon the species and environments (McGill and Moffat,
1992). Currently, fish oil is extracted by cooking and pressing at the commercial scale.
However, solvent and enzymatic extractions are performed at the laboratory scale.
3.8.1. Cooking and pressing
Commercially, fish oil is extracted by cooking and pressing. In large scale, the raw
material is cooked and the cooked products are transferred to a screw press where most of
the liquid is squeezed out to form a press-cake. The press liquid contain sludge (water,

28
most of oil, salt, protein and fine particles) that is removed in a decanter. The liquid from
the decanter is fed to separators and the oil is recovered (SR-MJOL HF, 2011).
3.8.2. Solvent extraction
Solvent extraction is only carried out at the laboratory scale. Based on interactions
between the solvents and hydrophobic or hydrophilic regions of the molecule, pure lipids
dissolve in variety of solvents. Lipids which have a low polarity functional group such as
triacylglycerols or cholesterol are soluble in hydrocarbon solvents and partially soluble in
higher polarity solvents, but are insoluble in polar solvents (Christie, 2003). For
extraction of lipids from tissues, it is necessary to find the solvent which not only readily
dissolves the lipids but also overcomes the interaction between the lipids and tissue
matrix. The principle behind the solvent extraction process involves the addition of
solvent to the sample mixture in which one or more constituents are removed.
In the extraction process, the solvent added to the mixture may not be miscible, but is
capable of selectively dissolving one of its constituents in the mixture. The substances are
separated based on the difference in their solubility in appropriate solvent (Alders, 1955).
Binary solvent systems are generally used in the extraction of fish oil. In the extraction
process, the solvent with higher polarity is called extraction solvent which in the process
forms the extract phase. The solvent with less or no polarity is called wash solvent, which
forms the residue phase during the process.
There is growing health and environmental concerns with the use of chlorinated solvents
such as chloroform that is suspected to be a carcinogenic agent (Reuber, 1979; Radin,
1981). Chloroform-methanol may be the best lipid extractant, but it is definitely not the
safest from environmental and health concerns. According to Hara and Radin (1978),
extraction of lipids from tissues using hexane:isopropanol had a number of advantage
over the commonly used chloroform:methanol method. Hexane has been used extensively
as a solvent for oil extraction and has a lower vaporization temperature, higher stability,
lower cost, lower corrosiveness and lower toxicity (Akoh et al., 2002).

29
The most recommended method for total lipid extraction from biological tissues is the
Bligh and Dyer method (Smedes and Askland, 1999). The major advantage of Bligh and
Dyer method is the reduction of solvent:sample ratio (Bligh and Dyer, 1959). Most of the
data published on total lipid content have been derived from Bligh and Dyer method
(Iverson et al., 2001). Ozogul et al. (2011) evaluated the efficiency of Bligh and Dyer and
Soxhlet methods and noted that Bligh and Dyer extraction method was more efficient in
extracting polar and non-polar lipids from fish than Soxhlet method. Norziah et al. (2009)
evaluated the yield of fish oil using Bligh and Dyer method in fish leaching waste with
different ratios of mixture of chloroform:methanol:water (2:4:1, 4:2:1, 2:2:1, 2:1:2) as
extracting solvent. A high yield of fish oil was obtained with chloroform:methanol:water
ratio of 2:4:1.
Zuta (2003) studied two extraction methods of oil from mackerel fish using
chloroform:methanol (Bligh and Dyer) and hexane:isopropanol. It was reported that the
extraction method using chloroform:methanol was discontinued after preliminary analysis
as it did not have any advantage over hexane:isopropanol to justify the risk of toxicity
associated with exposure of chloroform and methanol. Radin (1981) stated that there is
growing health and environmental concerns due use of chlorinated solvents such as
chloroform which is suspected to be a carcinogenic agent. In addition, the chlorinated
solvents will add to solvent disposal costs. Studies have been made to adapt the Bligh and
Dyer method with non-chlorinated solvents (Smedes, 1999).
Saify et al. (2003) studied the fatty acid composition of liver oil obtained from two
different sharks (winghead snark and sandbar shark). The isolation, identification and
characterization were carried out using gas-liquid chromatography and thin layer
chromatography. It was noted that there was a large variation between the two shark oils.
Saturated fatty acid e.g. palmitic acid (C16:0), in unsaturated monoenoic fatty acids e.g.
oleic and palmitoleic acids were major constituents. Additional polyunsaturated fatty
acids e.g. eicosapentaenoic and docosahexaenoic acids, were also found.

30
Zhong et al. (2007) studied the fatty acid composition of steelhead trout muscle and
visceral lipid. It was noted that steelhead trout muscle and viscera had similar fatty acid
patterns with monounsaturated fatty acid, polyunsaturated fatty acids (PUFA) and
saturated fatty acids. Oleic acid (C18:1) was predominant in both muscle and viscera and
the PUFA content was slightly higher in muscle than in viscera. The major n-3 PUFAs
were DHA and EPA with 9.70% and 3.28% of total fatty acids respectively in muscle and
7.98% and 3.35%, respectively in viscera.
3.8.3. Enzymatic extraction
Enzymatic extraction is also carried out at the laboratory scale. Extraction using enzymes
has increasing importance in the production of food supplements, fine chemicals,
medicines as a minimum amount of energy is required for the large-scale production
(Katsivela et al., 1995). Fish oil produced from an enzymatic process with proteases
provides a good alternative as reactions can be carried out under mild conditions for short
periods of time (Linder et al., 2005). Commercial proteases used to extract oil from
marine by-products have resulted in improved yields and in addition the hydrolysate
provides fish protein (Gbogouri et al., 2006).
Enzymatic hydrolysis of fish sample is mainly performed to extract fish oil and fish
protein. The main advantage of lipase is that lipase specificity which differentiates the
enzymatic reaction from chemical reaction, molecular properties of enzyme and structures
of substrate. Factors affecting binding the enzyme and substrate will control the lipase
specificity (Öztürk, 2001). The commercial enzymes used in the enzymatic hydrolysis
include Alcalase, Neutrase, Protamex and Lecitase. Alcalase is one of the best enzymes
used in hydrolysis process for fish oil and protein hydrolysates (Slizyte et al., 2005).
Alcalase is a proteolytic enzyme produced from Bacillus licheniformis. The optimal
working conditions for Alcalase are temperatures in the range of 55-70°C and pH values
of 6.5-8.5.
Batista et al. (2009) studied the extraction of oil from sardines (raw and cooked sample)
using commercial enzymes (Alcalase, Neutrase and Protamex). The results showed that

31
the highest oil was released from raw sardine with the enzymes Alcalase and Protamex.
Also the oil obtained was dark with high peroxide value. Liaset et al. (2002) reported on
the extraction of fish oil and nitrogen recovery from frames of Atlantic salmon using
Protamex protease in which hydrolysing parameters were varied (pH, temperature,
enzyme-substrate ratio and frame-water ratio) between low and high levels. It resulted in
highest level of enzyme-substrate ratio, temperature, pH and lowest levels of frame-water
ratio gave highest nitrogen recovery (76%).
Slizyte et al. (2005) studied the effect of initial heat inactivation of enzyme, addition of
water prior to the process and use of different combinations of enzymes on the yield and
purity of oil and protein fractions of cod by-product. The results showed that it was not
possible to obtain all desired qualities using only one hydrolysis process but the
hydrolysis of unheated raw material with Alcalase and addition of water was better when
compared to other mentioned quality indicators.
Mbatia et al. (2010) recovered oil from Nile perch and salmon head using protease
(bromelain and Protex) and found that increases in water content during the hydrolysis
resulted in a decrease in oil yield and the maximum oil yield was obtained with Protex at
55°C. Also fatty acid composition of crude oil was evaluated in which nile perch had
higher amount saturated fatty acid (36.8 mol %) than salmon head (19 mol %). The total
amount of palmitic acid, EPA and DHA were 50, 13 and 48 mol% respectively. Gbogouri
et al. (2006) described the fatty acid composition of salmon head oil obtained using
proteolytic enzymes. The fish oil contained saturated fatty acids (24.7-27.3%),
monounsaturated fatty acids (39.9-40.8%) and PUFA (32.3-35.4%).
3.9. Refining Edible Oils
Most edible oils are refined before final use. The main purpose of the refining process is
to remove impurities such as phosphatides, trace metals, pigments and oxidation products.
The processes involved in the chemical refining of fats and oils include degumming,
neutralization, bleaching and deodorizing (Johnson, 1998).

32
3.9.1. Degumming
The crude fish oil is degummed to remove phosphatides and ill-defined mucilaginous
materials. Degumming is a process in which the oil is treated with water/steam or with an
aqueous solution of boric acid or salt such as sodium chloride at 30-50°C to remove the
phospholipids and other mucilaginous materials from the crude oil (Zuta, 2003).
Deposited hydrated phospholipid is referred to as gums which can be separated from oil
by centrifugation. Air should be excluded in the process as it may lead to oxidation. For
the effective degumming process, water should be minimized to prevent hydrolysis
(Wanasundara, 1996).
3.9.2. Neutralization
Neutralization or alkali refining of fish oil removes free fatty acids as sodium salts which
is also refered to as soaps (Zuta, 2003). The process involves reaction of free fatty acids
with sodium hydroxides which forms soapstock. Addition of alkali to the oil along with
slight heating breaks the emulsion and the soapstock is removed by centrifugation (Carr,
1978). Higher amount of sodium hydroxide could cause saponification of the triglycerides
(Chang, 1967). The refined oil is washed with warm water to remove any trace amount of
soap (Kwon et al., 1984).
3.9.3. Bleaching
After refining process the oil is bleached which removes coloured material, pigments and
any trace amount of soap (Zuta, 2003). Bleaching materials commonly used are natural
clay, activated clay and activated carbon. Activated carbon is used at 5-10% in
combination with clay. Natural clay is used if the oil is readily bleachable (Wanasundara,
1996). Also bleaching removes secondary oxidation products and peroxides from the oil
(Zehnder and McMicheal, 1967).

33
3.9.4. Deodorization
The deodorization process involves removal of volatile components which are responsible
for odor or taste and also reduce free fatty acids content (Zuta, 2003). Deodorizing
involves steam distillation at high temperatures (180-270°C) under high vacuum. Cmolik
and Porkorny (2000) reported that the drawback of high temperature conditions lead to
isomerization of PUFA. Lin et al. (1990) reported that this process also destroys
peroxides and removes secondary oxidation products (aldehyde) which lead to
autoxidation. Dinamarca et al. (1990) developed a pilot scale method for deodorization by
high vacuum distillation with temperature below 150°C to produce fish oil without
destroying long chain PUFA.
3.10. Lipid Oxidation
Lipid oxidation is a process that deteriorates the nutritive value and quality of lipids. The
fundamental substrates involved in lipid oxidation reactions are unsaturated fatty acids.
Different oxidation processes take place including: autoxidation, photooxidation and
enzymatic oxidation (Frankel, 1991).
3.10.1. Auto oxidation
Autoxidation is a spontaneous reaction of free radical with oxygen. It is divided into three
main stages: initiation, propagation and termination. Hydroperoxide (LOOH) in the
presence of metal ions undergoes initiation to give peroxyl radical (LOO•). The peroxyl
radical (LOO•) attacks the weak C-H bonds on fat to generate fatty acid radical (L•). The
L• reacts with oxygen to form another peroxyl radical (LOO•). The LOO• forms reaction
cycle again to form more LOOH and L•. Termination is the reaction between radicals to
form non-radical products and the end products of oxidation are aldehydes, ketones, acids
and alcohols which affect the overall quality of food (Simic et al., 1988).
Initiation:
energy
LOOH LOO• (3.1)
catalyst

34
Propagation:
LOO• + LH LOOH + L• (3.2)
L•+ O2 LOO• (3.3)
Termination:
L•+ L• L-L (non radical monomer products) (3.4)
LOO•+ LOO• LOOL + O2 (3.5)
LOO• + L• LOOL (3.6)
Higher quantities of n-3 PUFAs containing marine lipids are susceptible to auto oxidation
which also leads to successive degradation (Gardner, 1983). EPA and DHA are subjected
to oxidation reaction due to the presence of five and six double bonds in their molecular
structure. Due to high number of double bonds, the oxidation process forms a complex
mixture of hydroperoxide and secondary oxidation product. This reaction readily occurs
at room temperature (Frankel, 1998).
Pasoz et al. (2005) stated that auto oxidation degrades PUFAs during the storage and
processing of fish oils and fatty fish which leads to the formation of volatiles associated
with rancidity. Strlič et al. (2009) studied the autoxidation of lipids in parchment.
Experimental evidence on the production of volatile aldehydes (product of lipid
autoxidation) was provided through gas chromatographic analysis. Parchment oxidation
with different aldehyde emissions was followed in situ using chemiluminometry and the
same technique was used for oxidation of different delipidised parchment evaluation. The
results showed that the lipid content decreased with the production of peroxides and
emission of aldehydes from the material.
Marion and Forsythe (1964) studied the autoxidation of raw, ground turkey tissue with
thiobarbituric acid (TBA) method. The samples stored at 4°C showed differences between
the rates of autoxidation in one week. The results also showed that there was a delay in
autoxidation by addition of 1% egg albumen solid (w/w) and 0.04% butylated
hyldroxyanisole to the ground tissue. However, 1% gelatin exhibited no beneficial effect.

35
3.10.2. Photo oxidation
Photooxidation occurs due to exposure of substrate to light. Lipid photooxidation takes
place in fatty fish species during processing and storage. The fish fat is prone to
photooxidation both in situ (in the tissue) and when extracted out from the tissue
(Undeland, 1998). According to Frankel (1998), photooxidation is a major form of
deterioration of food quality and is much faster than autooxidation. However, the light
induced oxidation of lipid in food is not only due to absorption by chromophoric groups
in lipids but also by consequence of photosensitized oxidation.
Chingmin et al. (1989) studied the extent of oxidation of fish oil with added antioxidants
after storage under nitrogen at 1 or -16°C and after exposure to room temperature with
direct or indirect sunlight. The thiobarbituric acid value showed that the fish oil was
stable for two weeks when stored under dark at 1 or -16°C and was immediately oxidized
when exposed to light at room temperature. However, the fish oil exposed to light at room
temperature remained stable for at least 8 days.
Sang and Jin (2004) studied the effect of photo-oxidative stress on the stability of oils
(crude and refined mackerel liver oil). Oils were stored in artificial light or darkness and
with or without antioxidants. The results showed that visible light exposure had a critical
role in the acceleration of fish liver oil oxidation.
Akhtar et al. (2010) tested edible films of hydroxypropyl methylcellulose containing
different edible colors (blue, green, yellow, red and white) for its ability to avoid
photooxidation in salmon oil. The results showed that hydroxypropyl methylcellulose
film with edible colors acts as a satisfactory light barrier to avoid photooxidation during
extended storage of salmon oil. The white, red and yellow edible colors showed good
control over oil photooxidation. Blue and green edible colors showed increased oxidation
as time of light exposure increased.
36
3.10.3. Enzymatic oxidation
Enzymatic oxidation is important in plants and animal system (Gutteridge and Halliwell,
1990). The by-products of enzymatic oxidation affect sensory properties of the oil
adversely. Sharp pungent odors along with stale and musty odors confirm rancidity.
Factors that contribute to the formation of off-flavors are temperature, light, oxygen,
moisture and metals (O’Brien, 2009). Endogenous enzymes liberated from the fish tissue
itself can be a source responsible for the initiation of the peroxidation (Kanner and
Kinsella, 1983).
Medina et al. (1999) studied the effect of enzymatic oxidative activity of two fatty fish
(sardine and herring) during chilled storage. The lipoxygenase enzyme activity was
isolated and tested by measuring the hydroperoxide. The lipoxygenase were concentrated
in the skin tissue of fish and were active for up to 48 h of chilled storage and the pro-
oxidative activity due to haem proteins continued longer than that due to the
lipoxygenase.
Saeed and Howell (2002) studied the effect of storage of lipid and protein in Atlantic
mackerel for up to 24 months at -20 and -30°C and found an increase in lipid oxidation
with storage time and higher storage temperature of -20°C than -30°C. Ke et al. (1977)
studied the kinetic variations in lipid oxidation in various parts of mackerel stored at -15,
-30 and -40 °C with respect to peroxide value and thiobarbituric acid value. Oxidation of
skin was eight times faster than that of white and dark muscles from mackerel at -15°C in
two months.
3.11. Use of Antioxidants
To stabilize fish oil against oxidation, exogenous antioxidants are required (Zuta, 2003).
Antioxidants are classified as either primary or secondary. The primary antioxidants
include hindered phenols such as synthetic antioxidant or as naturally occurring
compounds (Gray et al., 1996).

37
3.11.1. Natural antioxidants
The need for natural antioxidant continues to grow because they are safe since they occur
in foods and have been used for centuries (Frankel, 1998). In general, natural antioxidants
are plant phenolic compounds derived from different parts of the plants such as fruits,
vegetables, seeds, nuts, leaves, bark and roots (Pratt and Hudson, 1990). These plant
phenols can also act as free radical terminators, metal chelators, reducing agents and
singlet oxygen quenchers (Mathew and Abraham, 2006).
Several studies have been carried out for isolation of natural antioxidant from oilseeds,
cereal crop, spices and herbs (Wettasinghe and Shahidi, 1999). The most important
natural antioxidants today are: tocopherols, ascorbic and citric acids and their salts
(Tsimidou et al., 1995). The most abundant and biologically active tocopherol in food is α
– tocopherol.
Zuta (2003) reported that a low level of alpha-tocopherol such as 50 and 100 ppm was
found to reduce the oxidation in the fish oil. He also stated that 50 ppm of alpha-
tocopherol in combination with storage at low temperature (-40°C) was considered as best
level of antioxidant in protecting the fish oil from auto-oxidation.
Jayathilakan et al. (2007) studied the role of natural antioxidants (Maillard reaction
products/MRPs, ascorbic acid, cloves and cinnamon) at 0.02% level each in controlling
warmed-over-flavour in cooked and refrigerated meat (sheep, pork and beef). The results
showed that the susceptibility of these species to lipid oxidation was in order,
pork>beef>sheep, and order of natural antioxidants was MRPs>cloves>ascorbic acid>
cinnamon.
Adios et al. (2002) noted that during the oil storage, no photo-oxidation was detected;
storage at room temperature led to significant auto-oxidation over time from primary to
tertiary oxidation products and storage at 50°C had significant increases in secondary and
tertiary oxidation products. Free fatty acid (FFA) content remained low at all storage
conditions and the one with alpha-tocopherol content remained constant.

38
3.11.2. Synthetic antioxidants
Synthetic antioxidants such as butylated hydroyanisole (BHA) and butylated
hydroxytoluene (BHT) are used as food additives to prevent rancidification (Iqbal and
Bhanger, 2005). They are effective and less expensive than natural antioxidants (Suja et
al., 2004). However, these compounds may cause many health risks including: cancer and
carcinogenesis (Iqbal and Bhanger, 2005). Propyl gallate (PG) and butylated
hydroxyanisole (BHA) are synthetic phenolic antioxidants that show high chemical
activities in arresting chain initiation or breaking chain propagation of peroxidation.
Ascorbyl palmitate, a lipid soluble ester of vitamin C, is an approved synthetic
antioxidant that helps delaying rancidity (Beddows et al., 2001).
Jayathilakan et al. (2007) studied the role of synthetic antioxidants (TBHQ, BHA and
propyl gallate/PG) at 0.02% level each in controlling warmed-over-flavour in cooked and
refrigerated meat (sheep, pork and beef). The results showed that the susceptibility of
these species to lipid oxidation in synthetic antioxidants was TBHQ>BHA>PG.
Raza et al. (2009) studied the effect of BHA on the storage stability of freshly prepared
butter. After 5 weeks of storage at 45°C, freshly prepared butter containing 200 ppm
BHA showed lower values of FFA (0.586%) and peroxide value (7.33 meq/kg). From the
results it was noted that the shelf life of butter can be extended for 5 weeks by the
addition of an antioxidant like BHA.
3.12. Quality Parameters of Fish Oil
Fish oils are commercially sold and priced according to the level of free fatty acids,
impurities, moisture content, unsaponifiable matter, color, p-anisidine value, and peroxide
value (European Commission, 2006). Some oil properties such as color and fatty acid
profile are reported to be similar, regardless of the extraction method used. Thus,
comparison of other properties such as oil acidity, total oxidation value (TOTOX) of
different methods has been recommended (Rubio-Rodríguez et al., 2008). Table 3.7
shows recommended values of quality parameters for crude fish oil.

39
Table 3.7. Recommended quality parameters for crude fish oil.
Quality Parameter Recommended Value Reference
Moisture
Impurities
0.5%
(1% maximum)
Bimbo (1998)
Bimbo (1998)
Free fatty acids 1-7% Bimbo (1998)
Peroxide value (PV) 3-20 meq/kg Bimbo (1998)
p-Anisidine value 4-60 Bimbo (1998)
Total oxidation value 10-60 Bimbo (1998)
Unsaponifiable matter <2 (wt%) Scrimgeour (2005)
Color (Gardner scale) 10.5-12.5 Omega protein (2010)

40
3.12.1. Acid value
According to the Lipid Library (2012), free fatty acids (FFA) are unesterified fatty acids.
In animals, dietary lipids are hydrolysed to free acids before they get absorbed and
utilized for animal lipid synthesis. A variety of lipolytic enzymes (e.g. lipoprotein lipase,
phospholipase A, hormone-sensitive lipase) helps the intact lipid in tissue to hydrolyse to
free acids before oxidation, desaturation, elongation or re-esterification.
According to Rubio-Rodríguez et al. (2008), oil acidity is an important quality parameter
determining the presence of FFA and other non-lipid acid compounds. FFA is mostly
generated by a hydrolysis reaction of triacylglycerides. Oil acidity depends on several
factors such as oil composition, the extraction procedure and the raw material freshness.
The acid value quantifies the amount of acid present. It is the mass of potassium
hydroxide in mg that is required to neutralize 1g of chemical substance (Wrolstad et al.,
2005). As oil go rancid, triacylglyceride (TAG) coverts to fatty acid (FA) and glycerol
which increases acid number.
Memon et al. (2010) studied the effect of refrigerated storage on the acid value of Jarko
fish oil for up to 120 days. The results showed that the Jarko fish oil remained edible for
consumption for 60 days but eventually exceeded the recommended acid value after 60
days of refrigerated storage. Domiszewski et al. (2011) evaluated the acid value of catfish
fillet and observed that the raw catfish fillet had an acid value of 6.45±0.06 mg KOH/g
lipid.
It is important to determine free fatty acids (FFA) content as it is used for quality criteria
of fats and oils. Also, FFA has employed to assess fish deterioration during frozen storage
(de Koning and Mol, 1991) and FFA content increases with increase in storage time.
According to Miyashita and Takagi (1986), FFA has shown catalytic effect on lipid
oxidation development on marine lipids.

41
Adeniyi and Bawa (2006) extracted mackerel oil and found that the crude oil had an acid
value of 2.5 mg/KOH, whereas the refined oil had 2.27 mg/KOH. Aberoumand (2010)
studied the quality of different fish oils and reported acid values of 4.12, 1.21, 3.21, 4.28
and 6.72 for Cyprinodon aphanius dispar, Chirocenterous dorab, Cybium
scomberomorus guttatum, Cybium guttatum and Hilsa macrura ilisha, respectively.
3.12.2. p-Anisidine value
The p-anisidine value is used to measure the secondary product of oxidation and
determines the aldehyde in the lipid. Aldehyde present in the oil and the p-anisidine
reagent react under acidic condition (IUPAC, 1987; O’Brien, 2009). The color obtained
not only depends on the aldehyde present, but also their structure. Further degradation of
lipids generates off-flavours and off-odours (St. Angelo, 1996).
Hung and Slinger (1981) evaluated the peroxide, anisidine, free fatty acid and
thiobarbituric acid value as methods of measuring oxidation in herring oil and found that
oxidation occurred when herring oil passed the induction period (792 h).
Pak (2005) studied the stability and quality of fish oil and found the anisidine value to be
19.8. Boonchouy et al. (2009) studied that quality analysis of fish oil using near-infrared
spectroscopy. The optimized calibration was developed near 1100-2500 nm. From the
result it was observed that the root mean square of p-anisidine value was 6.88 with a
correlation coefficient of 0.88.
Klaypradit et al. (2010) studied the oxidation of menhaden fish oil using fourier transform
infrared spectroscopy (FTIR) method. Anisidine value was determined each day during 3
weeks of storage. The result showed an anisidine value of 1,746-1,736 with wave number
of 2.58. Che Man and Setiowaty (1999) studied the anisidine value of oxidized palm olein
by FTIR and an anisidine value was 8.684.

42
3.12.3. Peroxide value
The peroxide value is the measurement of primary oxidation product hydroperoxide
(Adios et al., 2001). The most widely used chemical test for the determination of fats and
oil quality is peroxide value test (O’Brien, 2009). The number of peroxides present in the
oil is an index of their primary oxidative level and its tendency to go rancid. The lower
the peroxide value the better the oil quality and its state of preservation (CDR, 2008).
Aidos et al. (2002) studied the effect of temperature on lipid oxidation of crude herring oil
stored at 0, 20, and 50°C using peroxide value (PV) and reported a secondary oxidation
stage of oil at all temperatures during storage. The oxidation products exhibited
temperature dependency.
Fritsche and Johnston (1988) reported that peroxide value of the diet (containing
menhaden oil without antioxidant) had elevated 5-6 folds within 24 h and 12 fold within
48 h when exposed to air at room temperature.
Boran et al. (2006) studied the effect of storage temperature (4 and -18°C) on oil quality
of various fish (horse mackerel, shad, garfish and golden mullet) and observed increases
in peroxide values at both the temperatures.
Boonchouy et al. (2009) evaluated the quality of fish oil using near-infrared spectroscopy.
The optimized calibration was developed near 1100-2200 nm and the result obtained for
peroxide value was 1.44 meq/kg. Pak (2005) studied the stability and quality of fish oil
which had 0.6 meq/kg peroxide value.
3.13. Concentration and Composition of Omega-3 Fatty Acids
There are various methods to concentrate omega-3 fatty acid including: enzymatic
hydrolysis, urea complexation, supercritical fluid extraction and molecular distillation.
The challenge is to develop cost-effective procedures to produce omega-3-PUFA
concentrates (Wanasundara and Shahidi, 1998).

43
3.13.1. Enzymatic hydrolysis
Enzymatic extraction is carried out at the laboratory scale. Hydrolysis of edible fats and
oils result in the formation of free fatty acids, di- and monoglyceride and glycerol
(O’Brien, 2009). Acylglycerols (glycerides) are acyl esters of glycerols known as
monoacylglycerols, diacylglycerols and triacylglycerols. Natural oils and fats are mostly
triacylglycerols which are known to be the most important class of storage lipids in most
animals and plants, but not necessarily in marine organisms (Gurr and James, 1980).
According to Lee and Akoh (1998) and Soumanou et al. (1998), enzymatic processes
(selective hydrolysis, hydrolysis and selective esterification and transesterification) using
lipases are ideal techniques for the production of omega-3 fatty acids (EPA and DHA)
that is nutritionally valuable because of their specificity and high activity at low
temperatures.
Wanasundara and Shahidi (1998) studied the production of omega-3 fatty acid in small
scale from seal blubber oil (SBO) and menhaden oil (MHO) in the form of acylglycerols
using various microbial lipases including Aspergillus niger, Candida cylindracea (now
known as Candida rugosa), Chromobacterium viscosum, Geotrichum candidum,
Mucormiehei, Pseudomonas sp., Rhizopus oryzae, and Rhizopusniveus. The result
indicated that all lipases effectively increased the n-3 PUFA content of the acylglycerols
of both SBO and MHO. However, the highest concentration of n-3 PUFA was provided
by Candida cylindracea lipase. After 40 h of hydrolysis, 43.5% of ω-3 in SBO [9.75%
eicosapentaenoic acid (EPA), 8.61% docosapentaenoic acid (DPA), and 24.0%
docosahexaenoic acid (DHA)] and 44.1% in MHO (18.5% EPA, 3.62% DPA, and 17.3%
DHA) were obtained. It was concluded that Candida cylindracea lipase was most suitable
for preparation of n-3 PUFA in the acylglycerol form from marine oils.
Carvalho et al. (2002) attempted to concentrate the omega-3 fatty acid in small scale
using four different lipases (Candida cylindracea lipase, Rhizopus delemar lipase,
Aspergillus oryzae lipase and Chromobacterium viscosum) and found Candida
cylindracea lipase to be the most effective compared to other lipases.

44
Okada and Morrissey (2007) studied enzymatic hydrolysis of sardine oil for concentrating
omega-3 fatty acid in small scale with Candida rugosa, Mucor javanicus, and Aspergillus
niger and found Candida rugosa to be more effective compared to other lipases. Moore
and McNeill (1996) studied triglycerides enriched in long chain polyunsaturated fatty acid
(PUFA) from fish oil and obtained 51% of total omega-3 fatty acid using Candida
rugosa. Sun et al. (2002) studied enzymatic hydrolysis for concentrated n-3 PUFA in
which Candida rugosa and Pseudomonas cepacia were found to be most effective. Table
3.8 describes the comparison of different lipase used in enzymatic hydrolysis. Candida
rugosa gave better yield in limited time.
Zuta (2003) used lipase enzyme to concentrate long chain omega-3 in small scale from
natural sources due to the reason that most lipase had low reactivity towards this fatty
acid because of their geometric configuration. Concentration of EPA and DHA beyond
300 mg/g was possible only after splitting the lipid followed by non-enzymatic method.
Levels above 80% was prepared by the combining lipase catalyzed selective hydrolysis
and esterification with various fractionation techniques such as HPLC and molecular
distillation.
Mbatia et al. (2010) studied the enzymatic enrichment of omega-3 fatty acid (small scale)
with Nile perch viscera oil and reported that the temperature can affect the reaction rate of
lipase whichin turn affected the enrichment. Higher enrichment level was linked with
more EPA and DHA losses. Chen and Ju (2000) stated that using immobilized enzymes is
time consuming and to avoid the PUFA oxidation (with relatively low temperature)
additional time is required.
The major factors that affect the economy of producing ω-3 fatty acids concentrates via
lipase-assisted hydrolysis are enzyme concentration, reaction time, temperature and pH.
Also, the temperature of the reaction medium and the reaction time are considered
important because they influence the oxidative state of the prepared ω-3 concentrates
(Sun et al., 2002).
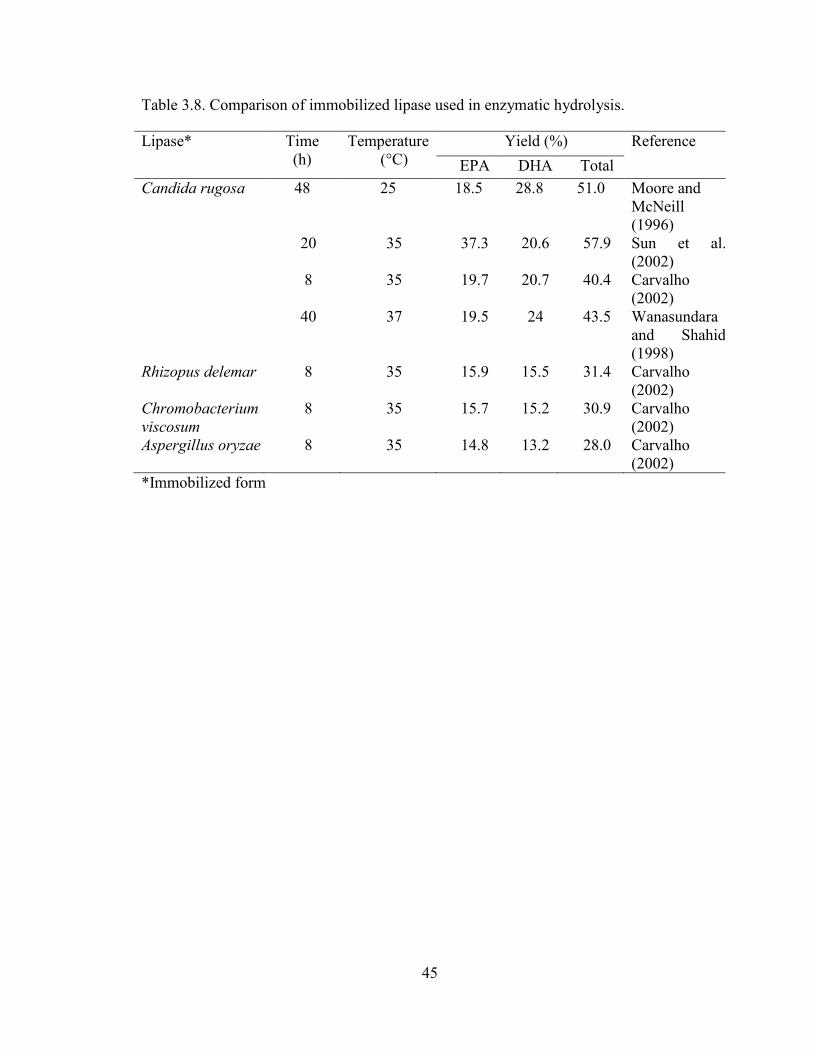
45
Table 3.8. Comparison of immobilized lipase used in enzymatic hydrolysis.
Lipase* Time
(h)
Temperature
(°C)
Yield (%) Reference
EPA DHA Total
Candida rugosa 48 25 18.5 28.8 51.0 Moore and
McNeill
(1996)
20 35 37.3 20.6 57.9 Sun et al..
(2002)
8 35 19.7 20.7 40.4 Carvalho
(2002)
40 37 19.5 24 43.5 Wanasundara
and Shahidi
(1998)
Rhizopus delemar 8 35 15.9 15.5 31.4 Carvalho
(2002)
Chromobacterium
viscosum
8 35 15.7 15.2 30.9 Carvalho
(2002)
Aspergillus oryzae 8 35 14.8 13.2 28.0 Carvalho
(2002)
*Immobilized form

46
3.13.1.1. Enzyme load. According to Shuang et al. (2009), adding more lipase than
necessary would result in a waste and increase reaction cost. The appropriate amount of
enzyme depends on the enzyme activity. However, using smaller amounts of enzyme is
simply not possible due to difficulties in handling. Mussatto et al. (2008) studied the
effect of enzyme load in enzymatic hydrolysis of BSG cellulose. It was noted that the
increase from 5-45 FPU/g of enzyme load increased the glucose yield and cellulose
conversion. The enzyme load increase also favored the enzymatic hydrolysis of cellulose
from hardwood (Gan et al., 2003), rice husk (Yanez et al., 2006), and dairy manure fibers
(Liao et al., 2005).
Wanasundara and Shahidi (1998) studied the effects of enzyme concentration; reaction
time and reaction temperature on omega-3 fatty acids from SBO and MHO using three-
factor central composite rotatable design. The maximum yield obtained after hydrolysis
was 54.3% of total ω-3 fatty acids from SBO at an enzyme (Candida cylindracea)
concentration of 308 U/g oil, reaction time of 40 h, and reaction temperature of 37°C.
Similarly, maximum of 54.5% of total ω-3 fatty acids was obtained from MHO at an
enzyme concentration of 340 U/g oil, reaction time of 45 h, and reaction temperature of
38°C.
3.13.1.2. Temperature. As temperature increases, the enzyme activity increases until it
reaches its maximum. Senanayake and Shahidi (1999) stated that the temperature increase
caused the kinetic energy of the enzyme to increase, which in turn increased the amount
of molecules colliding with the enzyme. This increased the rate of reaction but with
sufficiently high temperatures the reaction rate began to decrease as the enzyme was
denatured and the bonds holding the three-dimensional shape of the enzyme became
weak. Akoh et al. (2002) found that as temperature was increased, the rate at which the
long-chain fatty acids were released was faster than the rate at which short chain fatty
acids were released. Shuang et al. (2009) stated that too high a temperature can affect the
enzyme stability and reactivity. Sun et al. (2012) stated that high temperature changes the
specific structure and inhibits the enzyme activity.

47
3.13.1.3. pH. Utsun et al. (1997) reported that variation in the pH for most enzymes
within a range of two or three pH units each side of iso-electric points is a reversible
process and the extreme pH will cause irreversible denaturation of the enzymes. Also, the
pH used depends on the enzyme. The C. cylindracea (CC) lipase possessed a wide range
of optimal pH activity (5.0-8.0). However, pH 7.0 was found to be most suitable (Hoshino
et al., 1990). Eisenberg and Field (1956) studied the enzymatic hydrolysis of
glucuronolactone and noticed that at lower pH the enzymatic hydrolysis of
glucuronolactone was completely inhibited.
3.13.1.4. Reaction time. Determining the reaction time is important as it is related to
energy necessary for shaking and maintaining constant temperature (Ruiz et al., 2009).
Also, reaction time can affect the scale-up process. Shuang et al. (2009) reported that
longer reaction times resulted in higher infusing of caprylic acid into soybean oil using
immobilized enzyme derived from Rhizopus miehei.
3.13.2. Urea complexation
Urea complexation is the simplest and most efficient technique to obtain polyunsaturated
fatty acid (PUFA) concentrates in the form of free fatty acids on laboratory scale. It is a
well-established technique for elimination of saturatedand monounsaturated fatty acids
(Gamez et al., 2003; Tor and Yi, 2001). Figure 3.4 shows the formation of urea crystals in
the absence and presence of long chain fatty acids. Detailed procedures for recovery of
fatty acids and preparation of omega-3 fatty acids concentration as given by Wanasundara
and Shahidi (1999) are shown in Figure 3.5 and 3.6. Also, several researchers used
similar procedure (Zuta, 2003; Ratnayake et al., 1988, Liu et al., 2006 and Bharadwaj,
2011).
Ratnayake et al. (1988) demonstrated the use of urea complexation in pilot scale for the
concentration of omega-3 fatty acid. Wanasundara and Shahidi (1999) optimized the
production of omega-3 fatty acid from seal blubber using urea complexation and obtained
a maximum production of omega-3 fatty acid (88.2%) at a urea:fatty acid ratio of 4.5:1, a
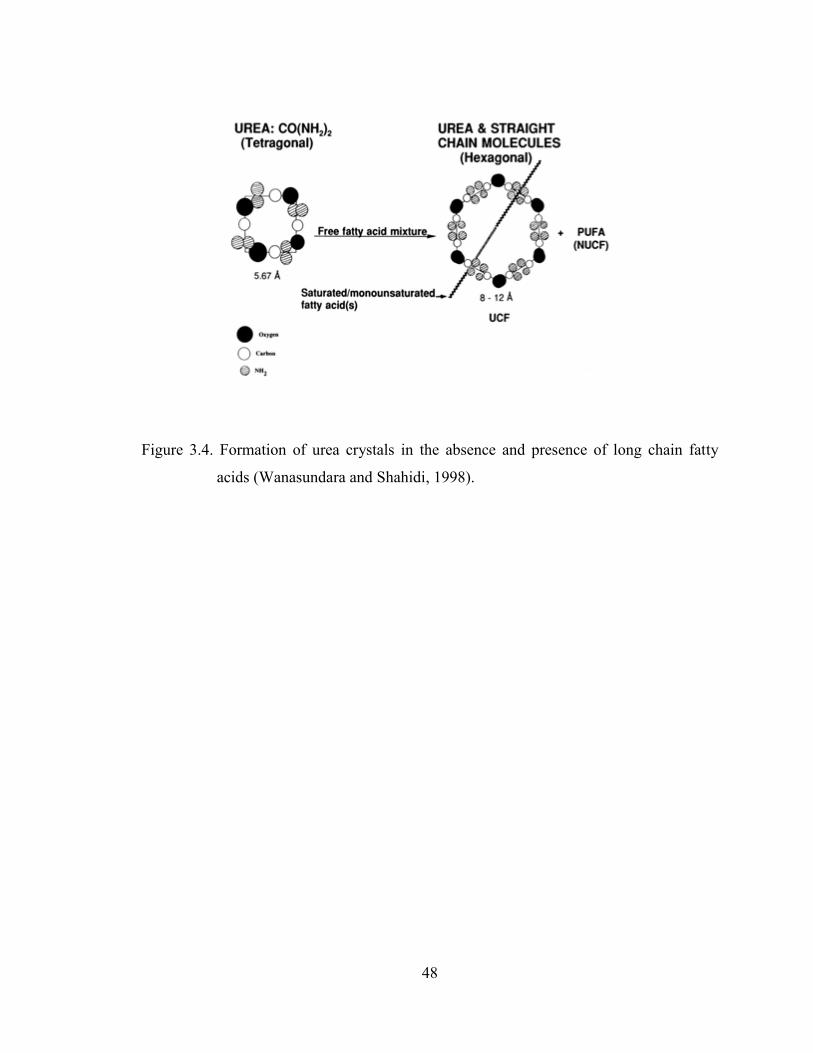
48
Figure 3.4. Formation of urea crystals in the absence and presence of long chain fatty
acids (Wanasundara and Shahidi, 1998).

49
Figure 3.5. Schematic representation of free fatty acids from fish oil (Wanasundara,
1996).
Fish oil
Refluxing (under nitrogen)
Mixing
Extraction (x2) in
separatory funnel
Aqueous layer
Acidification (pH=1.0)
Liquid liquid separation in
separatory funnel
Hexane
Filtration
Filtrate
Evaporation
Free fatty acid
Aq KOH + 95% ethanol
Distilled water
Hexane
Discard hexane layer
HCL solution
Hexane
Discard aqueous layer
Hexane
Anhydrous sodium
sulfate
Hydrous sodium sulfate

50
Figure 3.6. Preparation of omega-3 fatty acids concentrates by urea complexation
(Wanasundara, 1996).
Free fatty acid
Mixing
Crystallization
Filtration
Crystals
Mixing
Liquid liquid separation
using separatory funnel
Hexane layer
Filtration
Filtrate
Evaporation
Urea complexed
fraction
Filtrate
Mixing
Liquid liquid separation
using separatory funnel
Hexane layer
Filtration
Filtrate
Evaporation
Non urea complexed
fraction
Urea+95% ethanol
HCL + water HCL + water
Hexane Hexane
Anhydrous sodium
sulfate
Anhydrous sodium
sulfate
Hexane Hexane
Hydrous sodium
sulfate
Hydrous sodium
sulfate
Aqueous layer Hexane

51
crystallization time of 24 h, and a crystallization temperature of -10°C under optimum
conditions.
According to Strocchi and Bonaga (1975), TAG in the oil splits into their constituent fatty
acid by alkaline hydrolysis with alcoholic KOH or NaOH. The obtained free fatty acid
again mixed with ethanolic solution of urea for complex formation. Saturated and
monosaturated fatty acid complexes with urea were crystallized easily by cooling and
were removed by filtration.
Liu et al. (2006) studied the extraction of omega-3 fatty acid from tuna oil using
optimized urea complexation procedure. The total DHA and EPA (85.02%) were obtained
at a urea-to-fatty acid ratio of 15 (mole/mole), a crystallization temperature of -5 °C and a
crystallization time of 20 h. Bharadwaj (2011) reported that on the production of EPA and
DHA enriched PUFA from cod liver fish oil using urea complexation and obtained 77.7%
PUFA.
In urea complexation method, the important factors are temperatures (-6.9 to 6.9°C), time
(14 to 34 h), and ratio of urea to fatty acid (0.9:1 – 6.1:1) (Zuta, 2003).
3.13.2.1. Crystallisation temperature. Temperature has significant effect on the urea
complexation (Liu et al., 2006). Temperature should be controlled carefully to achieve a
maximum extraction of omega-3 fatty acid in the concentrate with a reasonable recovery.
Fei et al. (2010) reported that recovery of polyunsaturated fatty acid varied inversely with
increases in urea to fatty acid ratio as well as decreases in crystallisation temperature.
At lower the crystallisation temperature, there is formation of more stable urea complex
which in turn reduces the saturated fatty acid. Ratnayake et al. (1988) used the urea
complexation method to extract omega-3 PUFA concentrates from fish oils and observed
that even at low temperature (-5°C) it was difficult to completely remove the short chain
lengths particularly C14:0, C16:0 and C16:1.

52
3.13.2.2. Crystallisation time. A longer crystallisation time allows for further stabilisation
of crystals (Fei et al., 2010). Liu et al. (2006) studied the extraction of EPA and DHA of
tuna oil by urea complexation by optimizing the process parameters (crystallisation time,
crystallisation temperature, urea to fatty acid ratio). The results indicated that the
crystallisation time was insignificant. Similar results were reported by Wanasundar and
Shahidi (1999); Abdullah and Salimon (2010); Ratnayake et al. (1988). Zuta (2003)
reported that crystallization time was mostly not significant with the range of values used.
3.13.2.3. Urea:fatty acid ratio. Urea:fatty acid ratio affects the urea complexation (Liu et
al., 2006). Enrichment of polyunsaturated fatty acid and recovery yield in concentrate
vary inversely with increasing urea-to-fatty acid ratio. Lower urea to FA ratio prevents
indiscriminate FFA complexation (Hayes et al., 1998). Senanayake and Shahidi (2000)
studied the effect of urea:FA ratio (w/w) on the yield of DHA. By keeping the weight of
fatty acids constant and varying the weight of urea, the urea complex was allowed to
crystallize at 4°C for 24 h. The results showed that the concentration of DHA was
maximum at 3:1 urea:fatty acid ratio. Haagsma et al. (1982) reported that the urea
complex formation reached its maximum when the urea:FA ratio was 3:1 for cod liver oil
fatty acid methyl esters.
3.13.3. Supercritical fluids
Supercritical fluid extraction is a new separation process that is used to avoid the
problems associated with conventional separation techniques. Various gases possess
selective solvent properties under pressure. Properties that are given importance are
viscosity and diffusivity of the supercritical fluid (generally more gas-like than those of
typical liquids). is used because it has moderate critical temperature and pressure and
is inert, inexpensive, non-flammable, environmentally acceptable, readily available and
safe. The extraction involved in the separation of polyunsaturated fatty acid (PUFA)
depends on the molecular size of the components rather than their degree of un-saturation
(Mishra et al., 1993).

53
In the separation of omega-3 fatty acid by supercritical fluid extraction, the oil used
requires preparation steps such as extraction, hydrolysis and esterification by
conventional methods as shown in Figure 3.7. Mishra et al. (1993) and Stout and Spinelli
(1987) used supercritical fluid extraction to extract omega-3 fatty acid from fish oil and
noted that supercritical fluid extraction was effective in refining fish oil and removing
cholesterol, vitamin E, polychlorinated biphenyls and other components. Nearly 60-65%
of DHA was obtained from fish oil esters that were fractionated by supercritical fluid
extraction.
Letisse et al. (2006) used supercritical fluid extraction for the extraction and fractionation
of EPA and DHA from sardine fish waste (fish heads produced for canning). They
optimized various conditions including temperature, pressure, time and carbon dioxide
rate in order to obtain the highest yield of oil and the highest amount of EPA and DHA in
the extracted product. The yield of extracted oil was 10.36% and the concentration of
EPA and DHA were 10.95 and 13.01%, respectively.
Rubio-Rodriguez et al. (2008) extracted omega-3 rich oil from by-products of the fish
industry (off cuts obtained from peeling hake) by supercritical fluid extraction. The
extraction process was carried out at different pressures and flow rates. The result
obtained indicated that the internal mass transfer controlled the rate of the experiment and
the oil obtained contained high omega-3 and high EPA and DHA content.
The main disadvantage of the supercritical fluid extraction process was the high
production cost, because of the use of high pressure equipment and the raw material
which should be freeze-dried in order to reduce its moisture to values below 20% and
keep the omega-3 PUFA unaltered (Rubio-Rodríguez et al., 2008).
3.13.4. Molecular distillation
The molecular distillation method is used for partial separation of FA mixtures of esters.
Molecular distillation (MD) is a short path distillation which uses lower temperatures and
short heating intervals (Brown and Kolb, 1955). Molecular distillation is industrially used

54
Figure 3.7. Schematic diagram of the supercritical fluid process (Kang et al., 2005).

55
in the purification of unstable fats and oils and consists of wiped film molecular
distillation unit and centrifugal molecular distillation unit (Cermak et al., 2007).
According to Lembke (1997), the free fatty acids and fatty acid ethyl esters have
relatively low evaporation temperatures when placed in a strong vacuum. Good
separation of C-18 fatty acids can be achieved by maintaining oil under vacuum and
temperatures of 140°C and 160°C. The procedure resulted in the concentration of initial
EPA and DHA content with increases of 25%. The advantage of molecular distillation is
that it is an excellent technology to decontaminate and remove cholesterol from fish oils
triglycerides (Lembke, 2011).
Liang and Hwang (2000) studied fractionation of squid visceral oil ethyl esters by short-
path distillation. The elimination temperatures of squid visceral oil ethyl esters (SVOEE)
ranged from 50 to 140°C, increasing with the carbon number of ethyl esters. It was
observed that at 130°C distillate gave 15.5% EPA and 34.7% DHA with 99 mg/100 g of
cholesterol and the yield was 21.8%.
Stout et al. (1990) studied molecular distillation of menhaden oil and observed that oil in
its ethyl esters form increased the EPA content from 15.9 to 28.4%. However, DHA
content increased from 9.0 to 43.9% when oil was in the simple alkyl esters form.
Wijesundara et al. (1989) reported that during distillation, exposure of long-chain PUFA
to high temperatures may encourage hydrolysis, polymerization, thermal oxidation and
isomerisation. Shahidi and Wanasundara (1998) reported that the process for preparation
of omega-3 PUFA concentrates should involve low temperature and short time to
minimize thermal damage.
3.13.5. Comparison of extraction methods
There are several methods to concentrate omega-3 FA but only few are suitable in large
scale production. These extraction methods include enzymatic hydrolysis, urea
complexation, supercritical fluids and molecular distillation. A comparative analysis of
the extraction methods is presented in Table 3.9.

56
Table 3.9. Comparison of extraction methods of omega-3 fatty acids
Criteria Enzymatic
Hydrolysis
Urea
Complexation
Supercritical
Fluid
Molecular
Distillation
Capital cost Moderate Low High Moderate
Total cost Low Moderate Moderate Low
Recovery yield 43.5-57.9% 69-85% 10.95 -EPA
and 13.01%-
DHA
65-75%
Final product
form Acylglycerol free acid or
simple ester
Ethyl ester Ethyl ester
Environmental
friendly
Yes Yes Yes Yes
Time 20-24 h 30- 35 h <5 h Depends on
the condition
used
Reusability Reusable Not reusable Not reusable Not reusable
Temperature 35-40 °C 55-70 °C <50 °C 140-160 °C
Mode of
operation
Easy Moderate Moderate Moderate

57
The advantage of the enzymatic hydrolysis method is enzymes are environmentally
friendly and safe and the process requires low temperature (Ferna´ndez-Lorente et al.,
2005), the concentration of PUFA is straightforward (Bottino et al., 1967). The use of
immobilized lipases has additional technological and economical advantages as it can be
reused (Ferna´ndez-Lorente et al., 2005). Recovery of omega-3 PUFA in glyceride form
makes it more nutritionally favorable than methyl or ethyl esters of these fatty acids (FAs)
due to improved absorption of glyceride form (Sun et al., 2002). The disadvantage of this
method is the initial cost and need for downstream processing (Kahveci and Xu, 2012).
The urea complexation method has advantage of having higher yield and it is cost
effective as urea is inexpensive. It is also environmentally friendly as less toxic solvents
and uses simple equipment are used for concentration of PUFA of larger sample size
(Zuta, 2003). The disadvantages of this method are: the final product (simple ester) is not
easily incorporated in human plasma, high temperature and longer time and the need for
downstream processing step (Boustani et al., 1987).
In supercritical fluid extraction (SFE) a number of gases can be used. However, carbon
dioxide is chosen as it has moderate critical temperature and pressure (31.1°C, 1070 psig)
and it is inert, inexpensive, non-inflammable, environmentally friendly and safe (Mishra
et al., 1993). The disadvantage of this method is that the final product is in the form of
ethyl ester which is not easily absorbed well by humans (Lawson and Hughes, 1988). The
use of extremely high pressure and high capital costs limit the widespread use of this
method in large processing industries (Pinton, 1998).
The molecular distillation (MD) operates at a temperature in the range of 140-160°C. Due
to increased thermal stress, the shelf-life and stability of the unsaturated fatty acids may
be impacted (Lembke, 2011). According to Lembke (1997), fish oil passing through the
molecular distillation method suffers up to 350% higher thermal stress when compared to
a product passing through the supercritical extraction method. However, when comparing
molecular distillation and supercritical fluid extraction, the investment for the molecular

58
distillation is considerably lower than the investment for an industrial supercritical fluid
extraction plant. And molecular distillation is the standard process in the fish oil industry.

59
CHAPTER 4. MATERIALS AND METHODS
4.1. Experimental Materials
4.1.1. Fish
Atlantic Herring (Clupea harengus) was obtained from Clearwater, Halifax, Nova Scotia.
The samples were homogenized and kept in sealed plastic bags in a freezer at -20°C.
4.1.2. Glassware
The glassware used in the experiments includes test tubes, beakers, conical flasks,
pipettes and funnels. They were obtained from Fisher Scientific, Montreal, Quebec,
Canada. The glassware were washed with soap, rinsed first with tap water and then rinsed
with acetone, dried in the oven. And then a final rinse with methylene chloride was
performed before use.
4.1.3. Chemicals and enzymes
Chloroform, hexane, isopropyl alcohol, alpha-tocopherol, starch indicator, sodium
thiosulphate, potassium hydroxide, potassium iodide, 1% phenolphthalein indicator, were
purchased from Fisher Scientific Limited, Ottawa, Ontario, Canada. Methanol, anhydrous
sodium sulphate, butylated hydroxytoluene (BHT), sodium hydroxide, sodium chloride,
sulphuric acid, iodine solution, sodium thiosulfate, toluene, isooctane, glacial acetic acid
and p-anisidine, Alcalase (Liquid enzyme) and Candida rugosa (previously known as
Candida cylindracea) Type VII lipase were purchased from Sigma Aldrich, Oakville,
Ontario, Canada.
4.1.4. Reagents
Hilditch reagent (100 ml dry methanol + 1.5 ml sulphuric acid), methylene chloride
w/0.01% BHT, 3:2 v/v acetic acid-chloroform (3 volumes of reagent-grade glacial acetic
acid with 2 volumes of reagent-grade chloroform), p-Anisidine reagent (0.25g/100 ml

60
solution in glacial acetic acid), 3M sodium hydroxide (Molecular weight of NaOH is
multiplied by three which is dissolved in 1 L of distilled water) were prepared.
4.1.5. Equipment
The equipment used in this study were a rotary evaporator (RE540- Yamato Scientific
America Inc, Orangeburg, NewYork, USA), water-bath shaker (Thermo Model 2870,
Thermo Scientific, Ottawa, Ontario, Canada), water bath (Microprocessor Controlled 280
Series, Precision, Ottawa, Ontario, Canada), centrifuge (Sorvall RT1, Thermo Scientific,
Ottawa, Ontario, Canada), gas chromatograph (PerkinElmer Auto-system,LAS Canada
Inc, Woodbridge, Ontario, Canada), spectrophotometer (Model No. 4001/4, Thermo
Scientific, Ottawa, Ontario, Canada), nitrogen evaporator (N-EVAP112, OA-SYS heating
system, Organomation associates Inc, Berlin, Massachusetts, USA) and pH meter (Orion
5 Star 1119001, Thermo Scientific, Ottawa, Ontario, Canada).
4.2. Experimental Design
The experimental work was performed on two steps: (a) extraction of fish oil from fish
and (b) recovery of omega-3 fatty acid from fish oil and determination of omega-3 fatty
acid composition. Table 4.1 and 4.2 represent the optimization conditions for recovery of
fish oil and omega-3 fatty acid using enzymatic hydrolysis, respectively.
In step 1, fish oil was extracted from fish sample by enzymatic hydrolysis using the
enzyme alcalase. The effects of temperature (55°C and 70°C), pH (7.0, 7.5 and 8.0) and
enzyme load (0.5%, 1.0% and 2.0% - by weight of raw material) on the oil yield and
quality were investigated. Oil extraction was also performed using the Bligh and Dyer
(Chloroform:methanol) solvent extraction method. Three triplicates were carried out. The
chemical properties of extracted fish oil (acid value, p-anisidine value, and peroxide
value), fatty acid composition, and lipid yield were determined. The oils obtained from
enzymatic hydrolysis and the Bligh and Dyer (solvent extraction) method were compared
with respect to yield, properties and fatty acid composition. Figure 4.1 shows the
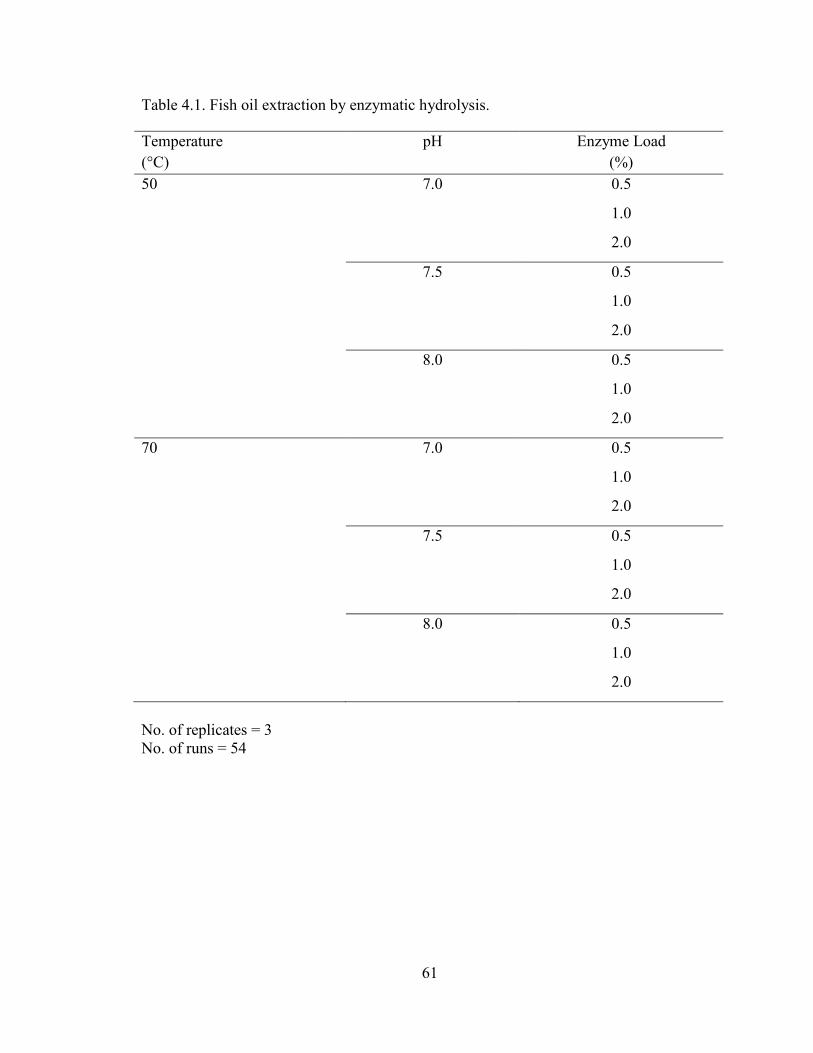
61
Table 4.1. Fish oil extraction by enzymatic hydrolysis.
Temperature
(°C)
pH Enzyme Load
(%)
50 7.0 0.5
1.0
2.0
7.5 0.5
1.0
2.0
8.0 0.5
1.0
2.0
70 7.0 0.5
1.0
2.0
7.5 0.5
1.0
2.0
8.0 0.5
1.0
2.0
No. of replicates = 3
No. of runs = 54

62
Table 4.2. Recovery of omega-3 fatty acids using enzymatic hydrolysis.
Stirring Level Value
Stirring level-1 No stirring
Stirring level-2 Intermediate stirring (100 rpm with 4 h interval)
Stirring level-3 Constant-slow stirring (50 rpm)
Stirring level-4 Constant-fast stirring (200 rpm)
No. of replicates = 3
No. of runs = 12

63
Figure 4.1. Schematic representation of experiment for the recovery of fish oil and
comparison of fish oil extraction methods.
Fish sample
55 C 70 C
pH
7.0
pH
7.0
pH
7.5
pH
8.0
pH
7.5
pH
8.0
1.00.5 2.0
Enzyme load (%) Enzyme load (%)
1.00.5 2.01.00.5 2.0 1.00.5 2.0 1.00.5 2.0 1.00.5 2.0
Enzyme load (%) Enzyme load (%) Enzyme load (%) Enzyme load (%)
Fish oil
Comparison with respect to
yield and quality
Enzymatic extractionSolvent extraction
Fish oil
Solvent ratio
:MeOH:d- 1:2:0.8

64
schematic representation of the experiments for the recovery of fish oil and comparison of
fish oil extraction methods.
In step 2, omega-3 fatty acid was extracted from the fish oil obtained by enzymatic
hydrolysis using Candida rugosa lipase. After the addition of enzyme, four stirring
methods (no stirring, intermediate stirring, constant-slow stirring and constant-fast
stirring) were evaluated (Figure 4.2) at optimum environment conditions (20 hr,
temperature of 35ºC and enzyme load of 800 Units). The recovery yield and composition
of omega-3 fatty acid was determined. Three replicates were carried out.
4.3. Experimental Procedure
4.3.1. Sample preparation
Atlantic herring (Clupea harengus) was used in this experiment. 10 kg of fish was thawed
and homogenized by directly feeding (no solvent or water added) into a homogenizer
(Model No.4532s/s, Hobart Manufacturing Co. Ltd, Ontario, Canada) which gives
homogenized sample by leaving bones behind. It was then weighted, packed in plastic
bags, sealed and stored at -20°C for later use.
4.3.2. Stabilization of fish oil with antioxidant
Due to the high degree of unsaturation of fatty acids, fish oil was susceptible to auto-
oxidation. To stabilize the oil against oxidation, exogenous antioxidants were required.
100 ppm of alpha-tocopherol was prepared in 2-3 ml hexane as recommended by Zuta
(2003). The solvent was evaporated under nitrogen and then fish oil was added and mixed
thoroughly while still under nitrogen. The sample was then stored at -20°C.
4.3.3. Solvent extraction of fish oil
The solvent extraction was performed according to the procedure described by Bligh and
Dyer (1959) as shown in Figure 4.3. A sample of 100 g of homogenized fish, 200 ml

65
Figure 4.2. Schematic representation of experiment for recovery of omega-3 fatty acid
from fish oil.
Constant-fast
Stirring values
Constant-slow
Stirring values
Intermediate
Stirring
values
No
Stirring
Fish oil
Stirring for 20 h at 35 C and enzyme load of 800 Units
Determination of fatty acid composition
Omega-3 fatty acid

66
Figure 4.3. Schematic representation of the Bligh and Dyer method for extraction of fish
oil.
Evaporate the filtrate in
rotary evaporator at 60 C
100 g Fish sample
Homogenization for 2 min
200 ml methanol
Homogenization for 30 s
100 ml chloroform
Homogenization for 30 s
100 ml distilled water
Centrifugation at 4000 rpm,
and 5 C for 15 min
Filtration
20 ml methanol +chloroform
Centrifugation at 4000
rpm, 5 C for 15 min
Transfer the filtrates in to
separatory funnel
Collect the lower layer
100 ml chloroform
Solids
Filtrate
Discard solid
Filtrate
Discard upper layer
pass through anhydrous
sodium sulfate
Filtrate
Discard hydrous sodium
sulfate
Fish oil

67
methanol and 100 ml chloroform were blended for 2 min in a food blender (Model-
53257C, Hamilton Beach, Halifax, Canada). Additional 100 ml of chloroform were added
and blending continued for 30 s. Finally, 100 ml distilled water were added and blending
continued for another 30 s. The homogenate was centrifuged at 4000 rpm (Sorvall RT1
centrifuge, Thermo Scientific, Ontario, Canada) and 5°C for 15 min. The liquid was
filtered and the filtrate was kept aside. 20 ml of solvent (Chloroform:methanol) were
added to solids and centrifugation was repeated again. The liquid was filtered and solids
were discarded. The two filtrates were combined and transferred into separatory funnel.
The chloroform layer (lower layer) was collected and filtered by passing it through bed of
anhydrous sodium sulfate. The filtrate was evaporated in rotary evaporator at 60°C
(RE540, Yamato Scientific America Inc, Orangeburg, NY).
4.3.4. Enzymatic hydrolysis of fish oil
The enzymatic hydrolysis of fish oil described by Liaset et al. (2000) was followed.
Figure 4.4 shows enzymatic hydrolysis of fish oil using Alcalase. About 100 g of fish
sample was weighed in 250 ml Erlenmeyer flask. The sample was heated at 95°C for 5
min to aid in the inactivation of endogenous enzymes. 100 ml of distilled water was
added and the pH was adjusted to the desired level (7.0, 7.5 or 8.0) with 3M NaOH. The
flask was transferred to preheated water bath shaker (Model-2870, Precision, Thermo
Scientific, Ontario, Canada) at the desired temperature (55°C or 70°C). Enzymatic
hydrolysis was started by adding Alcalase (0.5, 1.0, and 2.0 % by weight of raw material).
The process was carried out for 2 h at 120 rpm. After hydrolysis, the enzyme was
inactivated in the water bath shaker at 90°C for 5 min (Slizyte et al., 2005). It was then
cooled at room temperature and centrifuged at 4000 rpm (Sorvall RT1 centrifuge, Thermo
Scientific, Ontario, Canada) for 50 min. The top two layers (oil and emulsion) were
collected in another centrifuge tube. 2 ml of 0.9% of NaCl solution was added and
centrifuged for 5 min at 4000 rpm. The top layer (oil layer) was again transferred to
another centrifuge tube with 0.5-1.0 g anhydrous sodium sulfate, mixed gently and
allowed to settle. The oil was collected and stored at -20°C. This process was repeated
several times to collect the needed amount of fish oil for further use.

68
Figure 4.4. Schematic representation of enzymatic hydrolysis for extraction of fish oil.
Centrifuge at 4000 rpm for 5 min
Add anhydrous
sodium sulfate
Add 100 ml of distilled
water
Adjust the pH with
3M NaOH
Transfer the flask to preheated
water bath shaker (55 C or 70 C)Add Alcalase (0.5, 1.0
or 2.0 %)
Start hydrolysis process in water
bath shaker at 120 rpm for 2 hours
Stop hydrolysis by heating the
sample at 90 C for 5 min
Cool to room temperature
Weigh 100 g of fish sample in 250
ml flask
Heat the sample at 95 C for 5 min
Centrifuge at 4000 rpm for 50 min
Discard lower layer
Collect the top two layers (oil and
emulsion)Add 2 ml NaCl
Collect the oil layer (top layer)
Shake and settle
Collect the oil
Discard hydrous
sodium sulfate
Discard residue
(lower layer)

69
4.3.5. Enzymatic concentration of omega-3 fatty acids
The procedure for enzymatic hydrolysis of omega-3 fatty acids described by
Wanasundara and Shahidi (1998) was followed. Figure 4.5 shows enzymatic process of
omega-3 fatty acid extraction using Candida rugosa lipase. 4 g oil (herring oil obtained
from chemical extraction), 6 ml of 1M phosphate buffer to maintain pH of 7.5 and 800
Units (200 U/g) of lipase were added into a 50 ml conical flask. The flask was flushed
with nitrogen and then sealed with a rubber cap and parafilm as recommended by Gamez
et al. (2003). The flask was transferred to preheated water bath shaker (Model-2870,
Precision, Thermo Scientific, Ontario, Canada) which was maintained at 35°C. The
hydrolysis was started with the desired stirring level (Constant- fast, constant-slow,
intermediate or no stirring) for 20 hours. The hydrolysis process was stopped by adding 2
ml methanol to the mixture as recommended by Carvalho et al. (2002). An amount of
0.5N KOH was added to neutralize the fatty acids released during hydrolysis. The mixture
was transferred into a separatory funnel (Kimble Kimax, Fisher Scientific, Ontario,
Canada) and thoroughly mixed with 100 ml hexane and 50 ml distilled water as
recommended by Gamez et al. (2003). The lower aqueous layer was separated and
discarded. The upper layer (hexane), which containing acylglycerols, was washed two
times with 50 ml distilled water and then passed through a bed of anhydrous sodium
sulfate. The acylglycerols were recovered after hexane removal at 45°C in a rotary
evaporator (RE540, Yamato Scientific America Inc, Orangeburg, NY) as recommended
by Carvalho et al. (2002) and Wanasundara and Shahidi (1998).
4.3.6. Preparation of fatty acid methyl esters (FAME)
100 mg lipids were placed in heavy duty centrifuge tube. 1.5 ml of methylene chloride,
0.01% BHT and 3.0 ml Hilditch reagent were added and the tube was flushed with
nitrogen, capped and vortexed for 30 s. The centrifuge tubes were placed in the heating
block (VWR Analog heat block, S.N 061024002, USA) for 1 hour. The tubes were then
cooled at room temperature. 1.5 ml of hexane and 1 ml of distilled water were added and
the tube was capped, and vortexed for 30 s. The top layer was removed to new tube (#2)
without disturbing the interface. The hexane extraction was repeated twice with original

70
Figure 4.5. Schematic representation of enzymatic hydrolysis for extraction of omega-3
fatty acids from fish oil.
Weigh 4 g fish oil
Add 6 ml of 1M phosphate buffer Add 800 Units of lipase
Candida rugosa
Hydrolysis process maintained
at 35 C in water bath shaker
with desired stirring for 20 hours
Enzyme was inactivated with
2 ml methanol
transfer to separatory funnel
Mix thoroughly
Add 100 ml hexane
Collect the upper phase
Pass it through bed of anhydrous
sodium sulfate
Wash twice with 50 ml distilled
water
Discard lower phase
Evaporate in rotary evaporator
at 45 C
Add of 2 ml of methanol
Add 0.5N KOH to
neutralize fatty acids
50 ml distilled water
Omega-3 enriched oil
Hexane evaporated
Flush flask with nitrogen and
seal with parafilm

71
tube (#1). The top layer was removed to tube #2 every time. 2 ml of distilled water was
added to the tube #2. The tube was capped, vortexed for 30 s and then centrifuged for 2
min. The top layer from tube #2 was removed and transferred to tube #3, to which few
scoops of anhydrous sodium sulfate was added. Tube #3 was mixed gently and allowed
to settle. The solvent from tube #3 was transferred to pre-weighed tube #4 and was
evaporated under nitrogen. The outside of the tube was wiped with kimwipe, weighed and
subtracted from the pre-weighed tube weight to get the total FAME. Hexane was added to
a final concentration of 50 mg FAME/ml hexane. 5 and 0.5 dilutions was made for split
and splitless injection into the GC and transferred to GC vials as recommended by Budge
et al. (2006).
4.4. Experimental Analysis
4.4.1. Determination of acid value
The acid value of the oil sample was determined according to the procedure described in
the AOCS official methods (AOCS, 1989). 125 ml of 1:1 toluene-isopropyl alcohol and 2
ml of phenolphthalein indicator were added into 250 ml glass Erlenmeyer flask and
neutralized with 0.1N potassium hydroxide to a faint but permanent pink color. In another
Erlenmeyer flask, 0.5-2.5 g of oil sample was weighed and 125 ml of neutralized solvent
mixture were added to the sample and mixed thoroughly. Titration was then carried out
with 0.1N potassium hydroxide to permanent pink color. The acid value (mg KOH/g of
sample) was given by the following formula:
Acid value = (A-B) x N X 56.1 (4.1)
W
Where:
A= ml of standard alkali used in the titrating the sample
B= ml of standard alkali used in the titrating the blank
N= normality of standard alkali
W= grams of sample
56.1= molecular weight of KOH in grams

72
4.4.2. Determination of p-anisidine value
The p-Anisidine value of oil sample was determined using the procedure described in the
AOCS official method (AOCS, 1989). 0.7 g of oil was placed into a 25 ml volumetric
flask. It was dissolved and diluted to 25 ml with iso-octane. The absorbance was
measured at 350 nm with spectrophotometer (Genesys 20, Thermo Scientific, Ottawa,
Ontario, Canada). In a test tube, 5 ml of iso-octane and 1 ml of p-anisidine reagent were
added and used as blank. To another test tube, 5 ml of oil was transferred, and exactly 1
ml of p-anisidine reagent was added to the test tube. After 10 minutes, the absorbance was
measured at 350 nm. The p-anisidine value was given by the following formula:
p-anisidine value = 25 x (1.2 AS-AB) (4.2)
W
Where:
AS= absorbance of the oil solution after reaction with the p-anisidine reagent
AB= absorbance of the oil solution
W= grams of sample
25= size of volumetric flask used
1.2= correction factor
4.4.3. Determination of peroxide value
The peroxide value of oil sample was determined using the procedure described in the
AOCS official method (AOCS, 1989). 5 g of oil sample were added into a 250 ml
Erlenmeyer flask. Then, 30 ml of 3:2 acetic acid-chloroform were added and the flask
was swirled to dissolve the sample. 0.5 ml potassium iodide solution was added and the
solution was allowed to stand with occasional shaking for exactly 1 min. Then, 30 ml of
distilled water were added. This mixture was titrated against 0.1N sodium thio-sulfate
until the yellow color disappeared. About 0.5 ml of starch indicator solution was added
and the titration continued with constant agitation till the blue color disappeared. A blank
was prepared without adding the oil sample. The peroxide value (milliequivalents
peroxide/1000g sample) was given by the following formula:

73
Peroxide value = (S-B) x N x 1000 (4.3)
W
Where:
B= ml of standard potassium thiosulfate used for titration of blank
S= ml of standard potassium thiosulfate used for titration of sample
N= normality of sodium thiosulfate solution
1000= per 1000g of sample
W= gram of sample
4.4.4. FAME analysis
The split injection procedure described by Budge et al. (2006) was followed. Using
syringe, 1 μl of a sample was delivered with a concentration of 50 mg/mL to an injector
of gas chromatography (GC-FID, Perkin Elmer Autosystem, Ontario, Canada) held at a
constant temperature of 250°C. To generate a split ratio of approximately 1:100, the
helium split flow was set at a rate of 100 mL/min. The carrier gas flow rate (He) was 1
mL/min. To the detector, the flow rates of air and hydrogen were 450 and 45 mL/min
respectively. The detector was held at 250°C and the temperature program for oven began
at 153°C. The temperature was held at 153°C for 2 min and then ramped at a rate of
2.3°C/min to 174°C. The temperature of 174°C was maintained for 0.2 min and then
ramped at 2.5°C to 210°C. This final temperature was held for 2 min. The runtime of the
program was approximately 32 min. The gas chromatography protocol for FAME
analysis is shown in Table 4.3.
The splitless injection was also carried out as described by Budge et al. (2006). Quantity
of the sample for injection was the same except a sample concentration of 0.5 mg/mL was
used. The temperatures of the injector and detector, flow rates of gases to the column and
detector also remained the same. The split flow rate was set at 30 mL/min. The
temperature program was modified, where the initial temperature was set at 50°C and
held for 1 min. Then the temperature was rapidly ramped at 45°C/min to 153°C. The
program described above was then followed.

74
Table 4.3. Protocol for fatty acid analysis by gas chromatography.
Instrumental Parts Particulars
Detector Flame ionization detector
Column polar capillary column (30 m × 0.25 mm ×
0.25 μm) flexible fused silica column coated
with 50% cyanopropyl polysiloxane.
Carrier gas helium
Carrier gas flow rate 1ml/min
Temperature (°C)
Oven
Detector
Injector
250°C
153°C held for 2 min and then ramped at a
rate of 2.3°C/min to 174°C. That temperature
was maintained for 0.2 min and then ramped
at 2.5°C to 210°C. This final temperature was
held for 2 min
250°C
250°C

75
4.4.5. Statistical analysis
The experiments were carried out in triplicates. The results were presented as average and
standard deviation. Analysis of variance and Tukey grouping were performed on the data
using MINITAB (Okada and Morrissey, 2007).

76
CHAPTER 5. RESULTS
5.1. Fish Composition
Fish sample was given to Nova West Laboratory to determine the composition of herring
fish (whole). The analysis (Table 5.1) showed that the fish had a moisture content of
70.36% and the fat, protein, ash and carbohydrate were 8.82%, 18.46%, 2.12% and
0.24%, respectively.
5.2. Enzymatic Extraction of oil
5.2.1. Oil recovery
Crude fish oil was extracted from whole herring fish (100g) using enzymatic hydrolysis.
During the hydrolysis optimization process, three factors were studied: temperature (55°C
and 70°C), pH (7.0, 7.5 and 8.0) and enzyme load (0.5%, 1.0% and 2.0%). The amount of
recovered oil and recovery yield are presented in Table 5.2.
Analysis of variance (ANOVA) and Tukey’s grouping were performed on the recovery
yield data using MINITAB (General linear model, Minitab Inc. State College,
Pennsylvania, USA). The ANOVA results (Table 5.3) showed that the effects of
temperature (T), pH and enzyme load (EL) were highly significant at the 0.001 level.
There were also significant two way interactions between T and pH (at the 0.006 level), T
and EL (at the 0.05 level) and pH and EL (at the 0.001 level). The three way interaction
between the temperature, pH and enzyme load was also highly significant at the 0.001
level.
The Tukey’s grouping results (Table 5.4) showed that the two temperatures were
significantly different from one another at the 0.05 level with the temperature of 55°C
achieving the highest average oil recovery yield of 14.99%. The three levels of pH were
significantly different from one another at the 0.05 level with the pH 7.5 achieving the

77
Table 5.1. Composition of whole herring (Nova West Laboratory).
Parameter Value
Fat (%) 8.82
Protein (%) 18.46
Moisture (%) 70.36
Ash (%) 2.12
Carbohydrate (%) 0.24

78
Table 5.2. Extracted fish oil using enzymatic hydrolysis.
Temperature
(°C)
pH Enzyme Load
(%)
Oil Recovered
(g)
Recovery Yield*
(%)
55 7 0.5 0.96 10.9±0.62
1.0 1.11 12.6±0.39
2.0 1.44 16.3±0.51
7.5 0.5 1.19 13.5±0.64
1.0 1.60 18.1±0.51
2.0 1.78 20.2±0.42
8.0 0.5 1.00 11.4±0.23
1.0 1.33 15.1±0.47
2.0 1.46 16.6±0.45
70 7 0.5 0.40 4.5±0.36
1.0 0.58 6.7±0.39
2.0 0.67 7.6±0.17
7.5 0.5 0.64 7.3±0.75
1.0 0.81 9.2±0.51
2.0 1.38 15.6±0.88
8.0 0.5 0.51 5.8±0.53
1.0 0.82 9.3±0.28
2.0 0.92 10.5±0.59
Total oil content of herring – 8.82g/100g (Nova West lab)
Results are mean±SD of three replicates
* = (oil recovered/total oil content) x 100

79
Table 5.3. ANOVA for oil recovery yield.
Source DF SS MS F P
Total 53 1063.68
Model
T 1 563.83 563.83 2096.04 0.001
pH 2 161.29 80.65 299.80 0.001
EL 2 278.63 139.31 517.90 0.001
T*pH 2 3.22 1.61 5.99 0.006
T*EL 2 1.70 0.85 3.16 0.050
pH*EL 4 25.29 6.32 23.50 0.001
T* pH *EL 4 20.03 5.01 18.62 0.001
Error 36 9.68 0.27
T: Temperature
EL: Enzyme load
DF: Degree of freedom
SS: Sum of squares
MS: Mean of squares
: 99.09%

80
Table 5.4. Tukey’s grouping for oil recovery yield.
Parameter Number of Observations Mean Recovery Yield
(%)
Grouping
Temperature (°C)
55 27 14.99 A
70 27 8.53 B
pH
7.0 18 9.81 A
7.5 18 14.01 B
8.0 18 11.46 C
Enzyme load (%)
0.5 18 8.94 A
1.0 18 11.85 B
2.0 18 14.50 C

81
highest average oil recovery yield of 14.01%. The three levels of enzyme load were
significantly different from one another at the 0.05 level with the enzyme load of 2.0%
achieving the highest average oil recovery yield of 14.5%.
Figure 5.1 shows the effects of pH, enzyme load (EL) and temperature on the oil recovery
yield. The pH 7.5 appeared to produce the highest oil recovery yield at all temperatures
and enzyme loads. When the pH was increased from 7.0 to 7.5, the oil recovery yield
increased from 10.9 to 13.5% (24%), from 12.6 to 18.1% (44%), from 16.3 to 20.2%
(24%), from 4.5 to 7.3% (62%), from 6.7 to 9.3% (39%) and 7.6 to 15.6% (105%) and
then decreased from 13.5 to 11.4% (16%), from 18.1 to 15.1% (17%), from 20.2 to 16.6%
(18%), from 7.3 to 5.8% (21%) and from 15.6 to 10.5% (33%) when the pH was further
increased to 8.0 for the combinations 55°C-0.5%EL, 55°C-1.0%EL, 55°C-2.0%EL, 70°C-
0.5%EL and 70°C-2.0%EL, respectively. However, for the combination 70°C-1%EL, the
oil recovery yield slightly increased from 9.2 to 9.3% (1.1%) when the pH was increased
from 7.5 to 8.0.
Increasing the enzyme load increased the oil recovery yield at all temperatures and pH
levels. When enzyme load was increased from 0.5% to 2.0%, the oil recovery yield
increased from 10.9 to 16.3% (50%), from 13.5 to 20.2% (50%), from 11.4 to 16.6%
(46%), from 4.5 to 7.6% (69%), from 7.3 to 15.6% (114%) and from 5.8 to 10.5% (81%)
for the combinations 55°C-7.0pH, 55°C-7.5pH, 55°C-8.0pH, 70°C-7.0pH, 70°C-7.5pH
and 70°C-8.0pH, respectively.
Higher oil recovery yields were obtained with the lower temperature for all enzyme loads
and pH levels. When temperature was increased from 55°C to 70°C, the recovery yield
decreased from 10.9 to 4.5% (59%), from 12.6 to 6.7% (47%), from 16.3 to 7.6% (53%),
from 13.5 to 7.3% (46%), from 18.1 to 9.3% (49%), from 20.2 to 15.6% (23%), from 11.4
to 5.8% (49%), from 15.1 to 9.3% (38%) and from 16.6 to 10.5% (37%) for the
combinations 7.0pH-0.5%EL, 7.0pH-1.0%EL, 7.0pH-2.0%EL, 7.5pH-0.5%EL, 7.5pH-
1.0%EL, 7.5pH-2.0%EL, 8.0pH-0.5%EL, 8.0pH-1.0%EL and 8.0pH-2.0%EL,
respectively.

82
(a) effect of pH
(b) effect of enzyme load
(c) effect of temperature
Figure 5.1. Effects of pH, enzyme load and temperature on oil recovery yield obtained by
enzymatic hydrolysis.
0 2 4 6 8
10 12 14 16 18 20 22
6.8 7.0 7.2 7.4 7.6 7.8 8.0 8.2
Re
cove
ry y
ield
(%
)
pH
55°C -0.5% EL 55°C-1.0% EL
55°C -2.0% EL 70°C-0.5% EL
70°C -1.0% EL 70°C -2.0% EL
0 2 4 6 8
10 12 14 16 18 20 22
0.0 0.5 1.0 1.5 2.0 2.5
Re
cove
ry y
ield
(%
)
enzyme load ml/g
55°C -7.0 pH 55°C -7.5 pH
55°C -8.0 pH 70°C -7.0 pH
70°C -7.5 pH 70°C -8.0 pH
0
2
4
6
8
10
12
14
16
18
20
22
50 55 60 65 70 75
Re
cove
ry y
ield
(%
)
Temperature (°C)
7.0 pH-0.5% EL 7.0 pH-1.0% EL 7.0 pH-2.0% EL 7.5 pH-0.5% EL 7.5 pH-1.0% EL 7.5 pH-2.0% EL 8.0 pH-0.5% EL 8.0 pH-1.0% EL 8.0 pH-2.0% EL

83
The highest recovery yield of 20.2% was obtained at a temperature of 55°C, a pH of 7.5
and an enzyme load of 2.0%.
5.2.2. Quality of oil
Chemical analyses were performed on the extracted crude fish oil to determine its quality.
These were: peroxide value, acid value and p-anisidine value. The results are presented in
Table 5.5.
5.2.2.1. Peroxide value. The results of ANOVA and Tukey grouping performed on the
peroxide value data are presented in Tables 5.6 and 5.7, respectively. The effects of
temperature, pH and enzyme load were highly significant at the 0.001 level. Also, the two
way and three way interactions among these parameters were highly significant at the
0.001 level. The Tukey’s grouping showed that all the levels of each parameter were
significantly different from one another at the 0.05 level.
Figure 5.2 shows the effects of pH, enzyme load and temperature on peroxide value of
crude fish oil obtained by enzymatic hydrolysis. The effect of pH on the peroxide value
was influenced by the enzyme load and temperature. When the pH was increased from
7.0 to 7.5, the peroxide value decrease from 32.20 to 31.44 Meq/g (2%), from 37.16 to
36.66 Meq/g (1%) and from 40.70 to 38.95 Meq/g (4%) and then increased from 31.44 to
38.96 Meq/g (24%), from 36.66 to 40.82 Meq/g (11%) and from 38.95 to 41.79 Meq/g
(7%) when pH was further increase to pH 8.0 for the combinations 55°C-2.0%EL, 70°C-
0.5%EL and 70°C-2.0%EL, respectively. However, when the pH was increased from 7.0
to 8.0, the peroxide value increased from 28.14 to 35.37 Meq/g (26%) and from 26.78 to
37.58 Meq/g (40%) for the combinations 55°C-1.0%EL and 55°C-0.5%EL and decreased
from 39.13 to 37.32 Meq/g (5%) for the combination 70°C-1.0%EL.
The results also showed that the effect of enzyme load on the peroxide value was
influenced by pH and temperature. When enzyme load increased from 0.5 to 2.0%, the
peroxide value increased slightly from 26.78 to 32.20 Meq/g (20%), from 37.16 to 40.70

84
Table 5.5. Chemical analysis of fish oil.
Temperature
(°C)
pH Enzyme Load
(%)
Peroxide Value
(Meq/g)
Acid Value
(mgKOH/g)
p-Anisidine
Value
55 7 0.5 26.78±0.48 7.76±0.38 56.93±0.63
1.0 28.14±0.44 9.27±0.23 59.96±0.60
2.0 32.20±0.43 10.01±0.16 64.01±0.46
7.5 0.5 36.12±0.44 8.39±0.36 58.85±0.42
1.0 28.14±0.68 10.11±0.06 59.36±0.35
2.0 31.44±0.33 11.13±0.46 58.27±0.19
8.0 0.5 37.58±0.44 8.27±0.56 64.30±0.42
1.0 35.37±0.34 8.43±0.66 60.02±0.40
2.0 38.96±0.07 8.64±0.53 62.33±0.21
70 7 0.5 37.16±0.21 9.22±0.59 61.09±0.75
1.0 39.13±0.42 12.53±0.18 64.39±0.10
2.0 40.70±0.21 15.28±0.43 66.14±0.32
7.5 0.5 36.66±0.54 12.92±0.26 62.29±0.40
1.0 38.56±0.23 14.73±0.84 65.20±0.26
2.0 38.95±0.64 17.17±0.47 67.20±0.43
8.0 0.5 40.82±0.48 16.26±0.21 68.73±0.86
1.0 37.32±0.54 18.05±0.33 65.25±0.37
2.0 41.79±0.32 19.81±0.28 69.83±0.21
Results are mean ± SD of three replicates

85
Table 5.6. ANOVA for peroxide value.
Source DF SS MS F P
Total 53 1094.55
Model
T 1 529.47 529.47 2798.39 0.001
pH 2 214.14 107.07 565.88 0.001
EL 2 75.36 37.68 199.15 0.001
T*pH 2 119.32 59.66 315.32 0.001
T*EL 2 21.18 10.59 55.97 0.001
pH*EL 4 65.75 16.44 86.88 0.001
T* pH *EL 4 62.51 15.63 82.60 0.001
Error 36 6.81 0.19
T: Temperature
EL: Enzyme load
DF: Degree of freedom
SS: Sum of squares
MS: Mean of squares
: 99.38%

86
Table 5.7. Tukey’s grouping for peroxide value.
Parameter Number of Observations Mean Peroxide Value
(Meq/g)
Grouping
Temperature (°C)
55 27 32.75 A
70 27 39.01 B
pH
7.0 18 34.02 A
7.5 18 34.98 B
8.0 18 38.64 C
Enzyme load (%)
0.5 18 34.45 A
1.0 18 35.86 B
2.0 18 37.34 C
Groups with the same letter are not significantly different from each other at the 0.05
level.

87
(a) effect of pH
(b) effect of enzyme load
(c) effect of temperature
Figure 5.2. Effects of pH, enzyme load and temperature on peroxide value of fish oil
obtained by enzymatic hydrolysis.
20
25
30
35
40
45
6.8 7.0 7.2 7.4 7.6 7.8 8.0 8.2
Pe
roxi
de
val
ue
(M
eq
/g)
pH
55°C-0.5% EL
55°C-1.0% EL
55°C-2.0% EL
70°C-0.5% EL
70°C-1.0% EL
70°C-2.0% EL
20
25
30
35
40
45
0.0 0.5 1.0 1.5 2.0 2.5
Pe
roxi
de
val
ue
(M
eq
/g)
Enzyme load (%)
55°C-7.0 pH
55°C-7.5 pH
55°C-8.0 pH
70°C-7.0 pH
70°C-7.5 pH
70°C-8.0 pH
20
25
30
35
40
45
50 55 60 65 70 75
Pe
roxi
de
val
ue
(M
eq
/g)
Temperature (°C)
7.0 pH-0.5% EL 7.0 pH-1.0% EL 7.0pH-2.0% EL 7.5pH-0.5% EL 7.5 pH-1.0% EL 7.5 pH-2.0% EL 8.0 pH-0.5% EL 8.0 pH-1.0% EL 8.0 pH-2.0% EL

88
Meq/g (10%) and from 36.66 to 38.95 Meq/g (6%) for the combinations 55°C-7.0pH,
70°C-7.0pH and 70°C-7.5pH, respectively. However, when the enzyme load was
increased from 0.5 to 1.0%, the peroxide value decreased from 36.12 to 28.14 Meq/g
(22%), from 37.58 to 35.37 Meq/g (6%) and from 40.82 to 37.32 Meq/g (9%) and then
increased from 28.14 to 31.44 Meq/g (12%), from 35.37 to 38.96 Meq/g (10%) and from
37.32 to 41.79 Meq/g (12%) when the enzyme load was further increase to 2.0% for the
combinations 55°C-7.5pH, 55°C-8.0pH and 70°C-8.0pH, respectively.
Higher peroxide values were recorded with the higher temperature at all enzyme loads
and pH levels. When temperature was increased from 55°C to 70°C, the peroxide value
increased from 26.78 to 37.16 Meq/g (39%), from 28.14 to 39.13 Meq/g (39%), from
32.20 to 40.70 Meq/g (26%), from 36.12 to 36.66 Meq/g (2%), from 28.14 to 38.56
Meq/g (37%), from 31.44 to 38.95 Meq/g (24%), from 37.58 to 40.82 Meq/g (9%), from
35.37 to 37.32 Meq/g (6%) and 38.96 to 41.79 Meq/g (7%) for the combinations 7.0pH-
0.5%EL, 7.0pH-1.0% EL, 7.0pH-2.0% EL, 7.5pH-0.5% EL, 7.5pH-1.0%EL, 7.5pH-2.0%
EL, 8.0pH-0.5% EL, 8.0pH-1.0% EL and 8.0pH-2.0% EL, respectively.
The lower peroxide value the better the quality. The lowest peroxide value of 26.78
Meq/g was obtained with a temperature of 55°C, an enzyme load of 0.5% and pH of 7.0
and the highest value of 41.79 Meq/g were obtained with a temperature of 70°C, an
enzyme load of 2.0% and a pH of 8.0. All peroxide values were higher than the
recommended range of 3-20 meq/kg indicating that the fish oil was oxidized.
5.2.2.2. Acid value. Table 5.8 shows the ANOVA results of acid value. The effects of pH,
temperature and enzyme load on the acid value were highly significant at the 0.001 level.
All the two way interactions among these factors were highly significant at the 0.001
level. However, the three way interactions among these parameter was significant at the
0.02 level. The results of Tukey’s grouping are presented in Table 5.9. All the levels of
each of these parameters were significantly different from one another at the 0.05 level.

89
Table 5.8. ANOVA for acid value.
Source DF SS MS F P
Total 53 768.62
Model
T 1 485.04 485.04 2522.02 0.001
pH 2 61.57 30.78 160.07 0.001
EL 2 92.47 46.24 240.41 0.001
T*pH 2 94.04 47.02 244.50 0.001
T*EL 2 18.28 9.14 47.53 0.001
pH*EL 4 7.88 1.97 10.24 0.001
T* pH *EL 4 2.41 0.60 3.13 0.020
Error 36 6.92 0.19
T: Temperature
EL: Enzyme load
DF: Degree of freedom
SS: Sum of squares
MS: Mean of squares
: 99.10%

90
Table 5.9. Tukey’s grouping for acid value.
Parameter Number of Observations Mean Acid Value
(mg KOH/g)
Grouping
Temperature (°C)
55 27 9.11 A
70 27 15.11 B
pH
7.0 18 10.68 A
7.5 18 12.41 B
8.0 18 13.25 C
Enzyme load (%)
0.5 18 10.47 A
1.0 18 12.19 B
2.0 18 13.68 C
Groups with the same letter are not significantly different from each other at the 0.05
level.
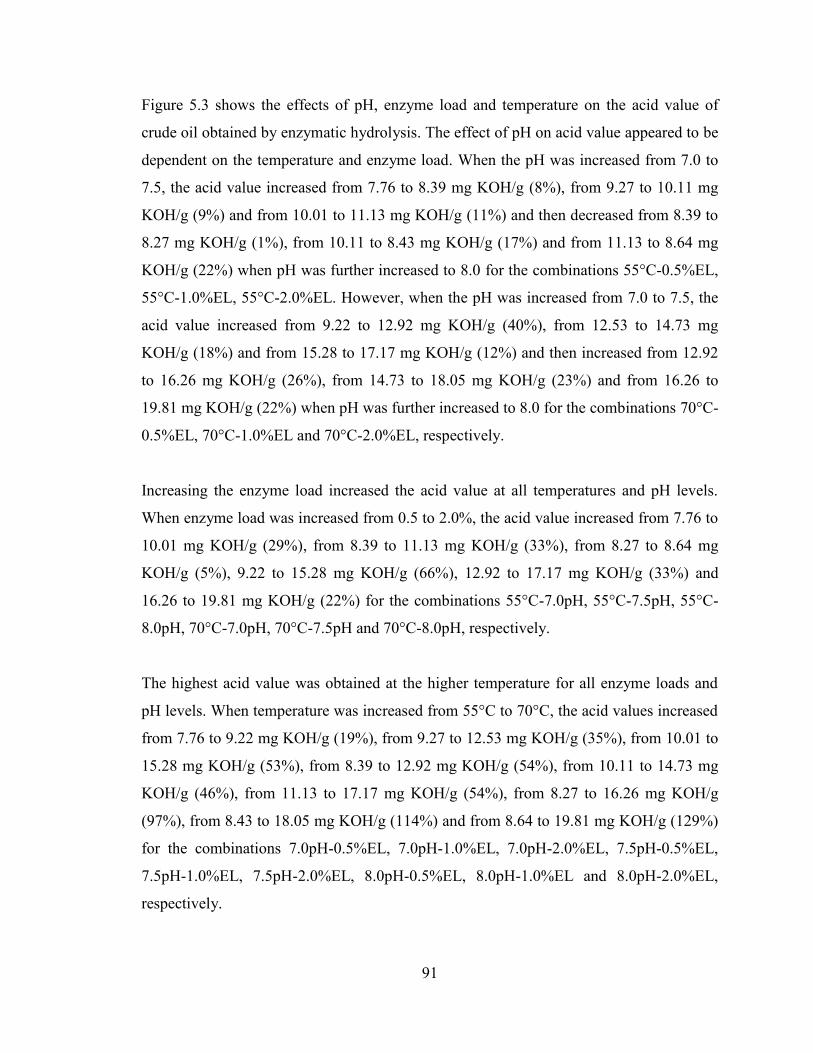
91
Figure 5.3 shows the effects of pH, enzyme load and temperature on the acid value of
crude oil obtained by enzymatic hydrolysis. The effect of pH on acid value appeared to be
dependent on the temperature and enzyme load. When the pH was increased from 7.0 to
7.5, the acid value increased from 7.76 to 8.39 mg KOH/g (8%), from 9.27 to 10.11 mg
KOH/g (9%) and from 10.01 to 11.13 mg KOH/g (11%) and then decreased from 8.39 to
8.27 mg KOH/g (1%), from 10.11 to 8.43 mg KOH/g (17%) and from 11.13 to 8.64 mg
KOH/g (22%) when pH was further increased to 8.0 for the combinations 55°C-0.5%EL,
55°C-1.0%EL, 55°C-2.0%EL. However, when the pH was increased from 7.0 to 7.5, the
acid value increased from 9.22 to 12.92 mg KOH/g (40%), from 12.53 to 14.73 mg
KOH/g (18%) and from 15.28 to 17.17 mg KOH/g (12%) and then increased from 12.92
to 16.26 mg KOH/g (26%), from 14.73 to 18.05 mg KOH/g (23%) and from 16.26 to
19.81 mg KOH/g (22%) when pH was further increased to 8.0 for the combinations 70°C-
0.5%EL, 70°C-1.0%EL and 70°C-2.0%EL, respectively.
Increasing the enzyme load increased the acid value at all temperatures and pH levels.
When enzyme load was increased from 0.5 to 2.0%, the acid value increased from 7.76 to
10.01 mg KOH/g (29%), from 8.39 to 11.13 mg KOH/g (33%), from 8.27 to 8.64 mg
KOH/g (5%), 9.22 to 15.28 mg KOH/g (66%), 12.92 to 17.17 mg KOH/g (33%) and
16.26 to 19.81 mg KOH/g (22%) for the combinations 55°C-7.0pH, 55°C-7.5pH, 55°C-
8.0pH, 70°C-7.0pH, 70°C-7.5pH and 70°C-8.0pH, respectively.
The highest acid value was obtained at the higher temperature for all enzyme loads and
pH levels. When temperature was increased from 55°C to 70°C, the acid values increased
from 7.76 to 9.22 mg KOH/g (19%), from 9.27 to 12.53 mg KOH/g (35%), from 10.01 to
15.28 mg KOH/g (53%), from 8.39 to 12.92 mg KOH/g (54%), from 10.11 to 14.73 mg
KOH/g (46%), from 11.13 to 17.17 mg KOH/g (54%), from 8.27 to 16.26 mg KOH/g
(97%), from 8.43 to 18.05 mg KOH/g (114%) and from 8.64 to 19.81 mg KOH/g (129%)
for the combinations 7.0pH-0.5%EL, 7.0pH-1.0%EL, 7.0pH-2.0%EL, 7.5pH-0.5%EL,
7.5pH-1.0%EL, 7.5pH-2.0%EL, 8.0pH-0.5%EL, 8.0pH-1.0%EL and 8.0pH-2.0%EL,
respectively.
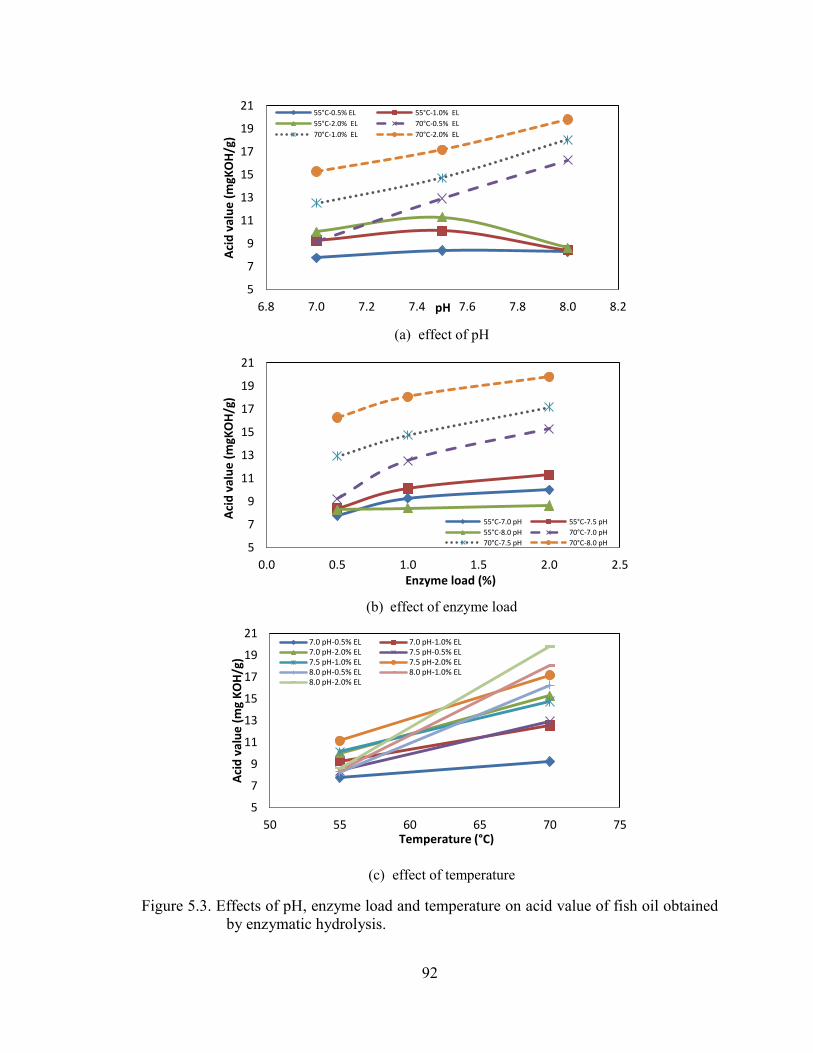
92
(a) effect of pH
(b) effect of enzyme load
(c) effect of temperature
Figure 5.3. Effects of pH, enzyme load and temperature on acid value of fish oil obtained
by enzymatic hydrolysis.
5
7
9
11
13
15
17
19
21
6.8 7.0 7.2 7.4 7.6 7.8 8.0 8.2
Aci
d v
alu
e (
mgK
OH
/g)
pH
55°C-0.5% EL 55°C-1.0% EL
55°C-2.0% EL 70°C-0.5% EL
70°C-1.0% EL 70°C-2.0% EL
5
7
9
11
13
15
17
19
21
0.0 0.5 1.0 1.5 2.0 2.5
Aci
d v
alu
e (
mgK
OH
/g)
Enzyme load (%)
55°C-7.0 pH 55°C-7.5 pH
55°C-8.0 pH 70°C-7.0 pH
70°C-7.5 pH 70°C-8.0 pH
5
7
9
11
13
15
17
19
21
50 55 60 65 70 75
Aci
d v
alu
e (
mg
KO
H/g
)
Temperature (°C)
7.0 pH-0.5% EL 7.0 pH-1.0% EL 7.0 pH-2.0% EL 7.5 pH-0.5% EL 7.5 pH-1.0% EL 7.5 pH-2.0% EL 8.0 pH-0.5% EL 8.0 pH-1.0% EL 8.0 pH-2.0% EL

93
The lower the acid value the better the quality of oil. The recommended range of acid
value is <5 mg KOH/g. All the acid values were above the recommended level. The
highest value of 19.81 mg KOH/g was obtained with a temperature of 70°C, an enzyme
load of 2.0% and a pH of 8.0 whereas the lowest acid value of 7.76 mg KOH/g was
observed with a temperature of 55°C, an enzyme load of 0.5% and a pH of 7.0.
5.2.2.3. p-Anisidine value. Tables 5.10 and 5.11 showthe results of ANOVA and Tukey’s
grouping of p-anisidine value, respectively. The effects of temperature, pH and enzyme
load were highly significant at the 0.001 level. Also the two way and three way
interactions among these factors were highly significant at the 0.001 level. The Tukey’s
grouping showed that the levels of each factor were significantly different from one
another at the 0.05 level.
Figure 5.4 shows the effects of pH, enzyme load and temperature on p-anisidine value of
crude fish oil obtained using enzymatic hydrolysis. The effect of pH on the p-anisidine
value seemed to be dependent on the enzyme load and temperature. When the pH was
increased from 7.0 to 8.0, the p-anisidine increased slightly from 56.93 to 64.30 (13%),
from 61.09 to 68.73 (13%), from 64.39 to 65.25 (1%) and from 66.14 to 69.83 (6%) for
the combinations 55°C-0.5%EL, 70°C-0.5%EL, 70°C-1.0%EL and 70°C-2.0%EL,
respectively. However, when pH was increased from 7.0 to 7.5, the p-anisidine value
decreased from 59.96 to 59.36 (1%) and then increased from 58.27 to 62.33 (7%) with
further increase in pH to 8.0 for the combination 55°C-1.0%EL. On the other hand, when
pH was increased from 7.0 to 7.5, the p-anisidine value increased from 59.36 to 60.02
(1%) and then decreased from 64.01 to 58.27 (9%) with further increase in pH to 8.0 for
the combination 55°C-2.0%EL.
The effect of enzyme load on the p-anisidine value also appeared to be influenced by
temperature and pH level. When enzyme load was increased from 0.5 to 2.0%, the p-
anisidine value increased from 56.93 to 64.01 (12%), from 61.09 to 66.14 (8%) and from
62.29 to 67.20 (8%) for the combinations 55°C-7.0pH, 70°C-7.0pH and 70°C-7.5pH,
respectively. However, when the enzyme load was increased from 0.5 to 1.0%, the

94
Table 5.10. ANOVA for p-anisidine value.
Source DF SS MS F P
Total 53 709.13
Model
T 1 354.15 354.15 1690.78 0.001
pH 2 115.83 57.91 276.51 0.001
EL 2 71.90 35.95 171.64 0.001
T*pH 2 16.46 8.23 39.29 0.001
T*EL 2 10.63 5.31 25.37 0.001
pH*EL 4 108.36 27.09 129.33 0.001
T* pH *EL 4 24.26 6.06 28.96 0.001
Error 36 7.54 0.21
T: Temperature
EL: Enzyme load
DF: Degree of freedom
SS: Sum of squares
MS: Mean of squares
: 98.94%

95
Table 5.11. Tukey’s grouping for p-anisidine.
Parameter Number of Observations Mean p-anisidine Value Grouping
Temperature(°C)
55 27 60.45 A
70 27 65.57 B
pH
7.0 18 61.87 A
7.5 18 62.09 A
8.0 18 65.08 B
Enzyme load (%)
0.5 18 62.03 A
1.0 18 62.37 A
2.0 18 64.63 B
Groups with the same letter are not significantly different from each other at the 0.05
level.
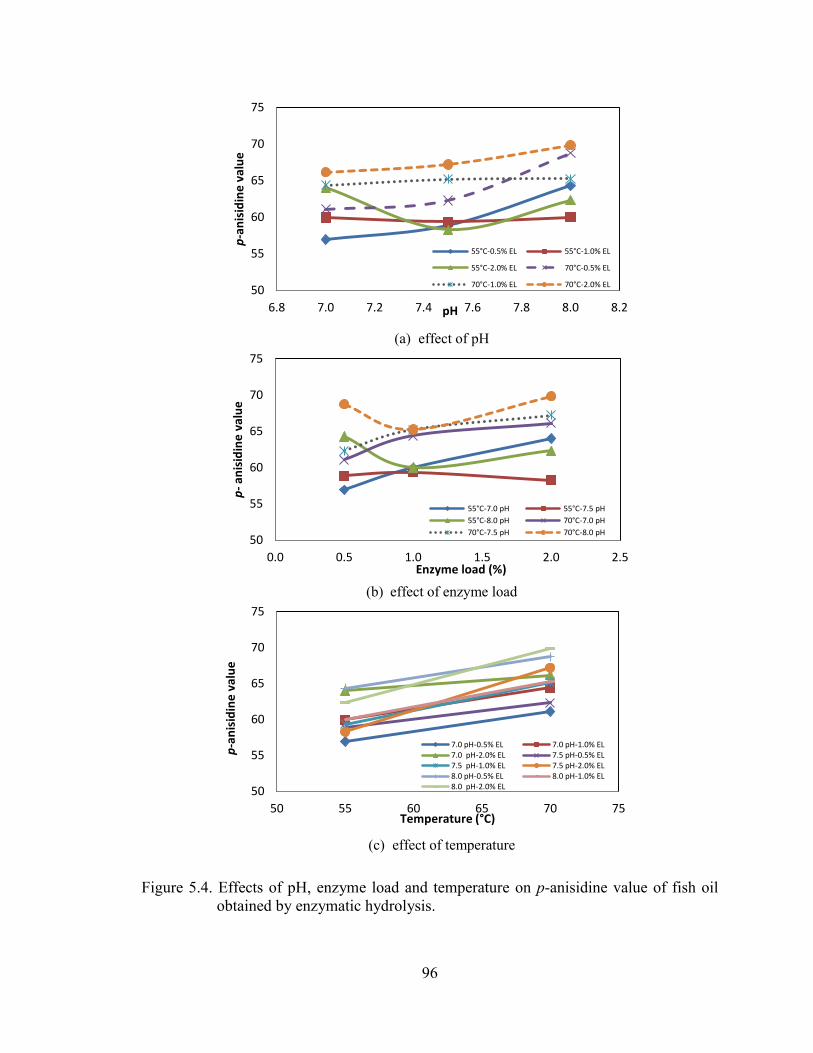
96
(a) effect of pH
(b) effect of enzyme load
(c) effect of temperature
Figure 5.4. Effects of pH, enzyme load and temperature on p-anisidine value of fish oil
obtained by enzymatic hydrolysis.
50
55
60
65
70
75
6.8 7.0 7.2 7.4 7.6 7.8 8.0 8.2
p-a
nis
idin
e v
alu
e
pH
55°C-0.5% EL 55°C-1.0% EL
55°C-2.0% EL 70°C-0.5% EL
70°C-1.0% EL 70°C-2.0% EL
50
55
60
65
70
75
0.0 0.5 1.0 1.5 2.0 2.5
p-
anis
idin
e v
alu
e
Enzyme load (%)
55°C-7.0 pH 55°C-7.5 pH
55°C-8.0 pH 70°C-7.0 pH
70°C-7.5 pH 70°C-8.0 pH
50
55
60
65
70
75
50 55 60 65 70 75
p-a
nis
idin
e v
alu
e
Temperature (°C)
7.0 pH-0.5% EL 7.0 pH-1.0% EL 7.0 pH-2.0% EL 7.5 pH-0.5% EL 7.5 pH-1.0% EL 7.5 pH-2.0% EL 8.0 pH-0.5% EL 8.0 pH-1.0% EL 8.0 pH-2.0% EL

97
p-anisidine value decreased from 64.30 to 60.02 (7%) and 68.73 to 65.25 (5%) and then
increased from 60.02 to 62.33 (4%) and from 65.25 to 69.83 (7%) when enzyme load
increased further to 2.0% for the combinations 55°C-8.0pH and 70°C-8.0pH,
respectively. For the combination 55°C-7.5pH, when enzyme load increased from 0.5 to
1.0% the p-anisidine value first increased slightly from 58.85 to 59.36 (1%) and then
slightly decreased from 59.36 to 58.27 (2%) with further increase in enzyme load to
2.0%.
The highest p-anisidine value was obtained with the higher temperature at all enzyme
loads and pH levels. When temperature was increased from 55°C to 70°C, the p-anisidine
value increased from 56.93 to 61.09 (7%), from 59.96 to 64.39 (7%), from 64.01 to 66.14
(3%), from 58.85 to 62.29 (6%), from 59.36 to 65.20 (10%), from 58.27 to 67.20 (15%),
from 64.30 to 68.73 (7%), from 60.02 to 65.25 (9%) and from 62.33 to 69.83 (12%) for
the combinations 7.0pH-0.5%EL, 7.0pH-1.0%EL, 7.0pH-2.0%EL, 7.5pH-0.5%EL,
7.5pH-1.0%EL, 7.5pH-2.0%EL, 8.0pH-0.5%EL, 8.0pH-1.0%EL and 8.0pH-2.0%EL,
respectively.
The lowest p-anisidine value of 56.93 was obtained at a temperature of 55°C, a pH of 7.0
and an enzyme load of 0.5% whereas the highest value of 69.83 was obtained with a
temperature of 70°C, pH of 8.0 and an enzyme load of 2.0%. The recommended range for
p-anisidine value for crude fish oil is 4-60. The combinations of 55°C-7.0 pH-2% EL,
55°C-8.0 pH-0.5% EL, 55°C-8.0 pH-2% EL and all samples at 70°C had p-anisidine
values outside the recommended range.
5.2.3. Fatty acid composition of oil
There were about 78 fatty acids identified in crude herring oil using the gas
chromatography analysis but only 12 fatty acids had values >0.5%. Fatty acid
composition (saturated, monounsaturated and polyunsaturated fatty acids) of crude oil
obtained by enzymatic hydrolysis are shown in Table 5.12 and 5.13, respectively. Oleic
acid (18:1 n-9) had the highest concentration followed by palmitic acid (16:0).

98
Table 5.12. Fatty acid composition of fish oil obtained using enzymatic hydrolysis at 55°C.
pH EL
(%) Saturated Fatty Acid Monounsaturated Fatty Acid Polyunsaturated Fatty Acid
Myristic
acid
(14:0)
Palmitic
acid
(16:0)
Stearic
acid
(18:0)
Palmitoleic
acid
(16:1n-7)
Oleic
acid
(18:1n-9)
Vaccenic
acid
(18:1n-7)
Linoleic
acid
(18:2n-6)
Alpha-
linolenic
acid (18:3n-3)
Arachidonic
(20:4n-6)
EPA
(20:5n-3)
DPA
(22:5n-3)
DHA
(22:6n-3)
7.0 0.5 6.11
(±0.2)
14.85
(±0.5)
1.69
(±0.1)
7.41
(±0.2)
22.28
(±1.0)
3.53
(±0.1)
1.41
(±0.1)
0.53
(±0.1)
0.38
(±0.0)
4.90
(±0.1)
0.52
(±0.0)
5.56
(±0.2)
1.0 6.30
(±0.9)
14.92
(±2.1)
0.86
(±1.1)
7.51
(±1.1)
18.77
(±1.1)
3.62
(±0.5)
1.49
(±0.2)
0.54
(±0.1)
0.44
(±0.0)
6.24
(±0.8)
0.64
(±0.1)
7.45
(±0.9)
2.0 5.39
(±0.0)
12.85
(±0.2)
1.58
(±0.1)
6.87
(±0.1)
19.98
(±0.1)
3.28
(±0.0)
1.36
(±0.0)
0.50
(±0.0)
0.42
(±0.0)
5.84
(±0.0)
0.59
(±0.0)
7.20
(±0.0)
7.5 0.5 6.60
(±0.0)
15.12
(±0.0)
1.68
(±0.0)
7.76
(±0.0)
22.71
(±0.5)
3.64
(±0.0)
1.54
(±0.0)
0.60
(±0.0)
0.42
(±0.0)
5.97
(±0.0)
0.71
(±0.0)
6.84
(±0.1)
1.0 6.22
(±0.6)
14.11
(±1.4)
0.74
(±0.9)
7.46
(±0.7)
21.61
(±2.1)
3.51
(±0.3)
1.46
(±0.1)
0.57
(±0.0)
0.39
(±0.0)
5.75
(±0.5)
0.64
(±0.1)
6.60
(±0.6)
2.0 5.81
(±0.1)
13.10
(±0.2)
0.73
(±0.9)
6.88
(±0.1)
19.84
(±0.3)
3.23
(±0.1)
1.38
(±0.0)
0.36
(±0.1)
0.38
(±0.0)
5.50
(±0.1)
0.58
(±0.0)
6.41
(±0.1)
8.0 0.5 6.29
(±0.1)
15.12
(±0.2)
0.86
(±1.1)
7.89
(±0.1)
23.72
(±0.3)
3.81
(±0.0)
1.55
(±0.0)
0.56
(±0.1)
0.44
(±0.0)
6.15
(±0.0)
0.57
(±0.1)
7.11
(±0.1)
1.0 6.20
(±0.0)
15.13
(±0.0)
1.69
(±0.0)
7.84
(±0.0)
23.64
(±0.0)
3.82
(±0.0)
1.51
(±0.0)
0.60
(±0.0)
0.43
(±0.0)
6.08
(±0.0)
0.63
(±0.0)
7.11
(±0.0)
2.0 6.30
(±0.1)
15.42
(±0.1)
1.67
(±0.0)
7.88
(±0.1)
23.82
(±0.1)
3.81
(±0.0)
1.51
(±0.0)
0.59
(±0.0)
0.42
(±0.0)
6.11
(±0.0)
0.63
(±0.0)
7.14
(±0.1) Value in () are ± SD
T- Temperature
EL- Enzyme load
EPA- Eicosapentaenoic acid
DPA- Docosapentaenoic acid
DHA- Docosahexaenoic acid
98

99
Table 5.13. Fatty acid composition of fish oil obtained using enzymatic hydrolysis at 70°C.
pH EL
(%) Saturated Fatty Acid Monounsaturated Fatty Acid Polyunsaturated Fatty Acid
Myristic
acid
(14:0)
Palmitic
acid
(16:0)
Stearic
acid
(18:0)
Palmitoleic
acid
(16:1n-7)
Oleic
acid
(18:1n-9)
Vaccenic
acid
(18:1n-7)
Linoleic
acid
(18:2n-6)
Alpha-
linolenic
acid (18:3n-3)
Arachidonic
(20:4n-6)
EPA
(20:5n-3)
DPA
(22:5n-3)
DHA
(22:6n-3)
7.0 0.5 6.28
(±1.0)
14.98
(±2.4)
1.73
(±0.3)
8.02
(±1.3)
20.69
(±0.0)
4.04
(±0.6)
1.53
(±0.2)
0.62
(±0.1)
0.47
(±0.0)
6.07
(±0.9)
0.59
(±0.1)
7.66
(±1.2)
1.0 5.68
(±0.1)
13.42
(±0.2)
1.53
(±0.0)
7.13
(±0.1)
21.65
(±0.3)
3.47
(±0.1)
1.38
(±0.0)
0.58
(±0.0)
0.39
(±0.0)
5.46
(±0.1)
0.56
(±0.0)
6.53
(±0.1)
2.0 6.91
(±0.0)
16.21
(±0.0)
1.85
(±0.0)
8.06
(±0.0)
21.69
(±0.1)
4.45
(±0.0)
1.76
(±0.0)
0.73
(±0.0)
0.51
(±0.0)
7.02
(±0.0)
0.72
(±0.0)
8.39
(±0.0)
7.5 0.5 7.39
(±0.7)
15.63
(±1.5)
1.74
(±0.2)
8.00
(±0.7)
20.30
(±1.5)
3.73
(±0.4)
1.58
(±0.1)
0.75
(±0.1)
0.46
(±0.0)
6.41
(±0.6)
0.71
(±0.1)
7.45
(±0.7)
1.0 7.16
(±0.4)
14.87
(±1.0)
1.62
(±0.1)
7.67
(±0.4)
22.13
(±1.4)
3.50
(±0.2)
1.54
(±0.1)
0.75
(±0.0)
0.45
(±0.0)
6.48
(±0.5)
0.71
(±0.1)
7.55
(±0.5)
2.0 7.62
(±0.2)
17.03
(±0.6)
1.91
(±0.1)
6.41
(±0.8)
19.96
(±0.5)
4.05
(±0.1)
1.63
(±0.1)
0.77
(±0.0)
0.47
(±0.0)
6.57
(±0.2)
0.72
(±0.0)
5.15
(±1.2)
8.0 0.5 6.63
(±0.5)
14.93
(±1.2)
1.34
(±0.3)
7.34
(±0.7)
18.89
(±4.6)
3.68
(±0.3)
1.53
(±0.1)
0.74
(±0.1)
0.46
(±0.0)
6.22
(±0.4)
0.69
(±0.1)
6.03
(±0.5)
1.0 6.69
(±0.1)
14.85
(±0.2)
1.70
(±0.0)
8.06
(±0.2)
19.30
(±2.1)
3.90
(±0.1)
1.43
(±0.0)
0.59
(±0.0)
0.40
(±0.0)
5.10
(±0.1)
0.57
(±0.0)
6.00
(±0.1)
2.0 7.65
(±0.2)
16.81
(±0.4)
1.91
(±0.0)
8.86
(±0.1)
14.18
(±3.5)
4.23
(±0.2)
1.67
(±0.0)
0.80
(±0.0)
0.51
(±0.0)
6.49
(±0.1)
0.74
(±0.0)
7.69
(±0.1) Value in () are ± SD
T- Temperature
EL- Enzyme load
EPA- Eicosapentaenoic acid
DPA- Docosapentaenoic acid
DHA- Docosahexaenoic acid
99

100
Tables 5.14 and 5.15 show the ANOVA and Tukey’s grouping of saturated fatty acids
(myristic, palmitic and stearic acids), respectively. The ANOVA results indicated that the
effect of temperature on the three saturated fatty acids was significant at 0.05 level.
However, the pH and enzyme load did not seen to have any significant effect on the three
saturated fatty acids. The Tukey’s grouping results showed that the differences among the
temperature levels were significant for the three saturated fatty acids at the 0.05 level.
However, the differences among the levels of pH and enzyme load were not significant
for the three saturated fatty acids at the 0.05 level.
Tables 5.16 and 5.17 show the ANOVA and Tukey’s grouping of monounsaturated fatty
acids (palmitoleic, oleic and vaccenic acids), respectively. The temperature had a
significant effect on the three monounsaturated fatty acids at the 0.05 level. However, the
pH and enzyme load did not have any significant effect on the three monounsaturated
fatty acids at the 0.05 level. The Tukey’s grouping showed that the differences among the
levels of temperature were significant for the three monounsaturated fatty acids at the
0.05 level. However, the differences among the levels of pH and enzyme load were not
significant for the three monounsaturated fatty acids at the 0.05 level.
Tables 5.18 and 5.19 show the ANOVA and Tukey’s grouping of polyunsaturated fatty
acids (linoleic, alpha-linolenic and arachidonic acids), respectively. The effect of
temperature on the three polyunsaturated fatty acids was significant at the 0.01 level.
However, the effects of pH and enzyme loads on the three polyunsaturated fatty acids
were not significant at the 0.05 level. The Tukey’s grouping showed that differences
among the levels of temperature were significant for the three polyunsaturated fatty acids
at the 0.05 level. However, the differences among the levels of pH and enzyme load were
insignificant for the three polyunsaturated fatty acids at the 0.05 level.
Tables 5.20 and 5.21 show the ANOVA and Tukey’s grouping of polyunsaturated fatty
acids (eicosapentaenoic, docosapentaenoic and docosahexaenoic acids), respectively. The
effect of temperature on the three polyunsaturated fatty acids was significant at the 0.05

101
Table 5.14. ANOVA for saturated fatty acids (myristic, palmitic and stearic)
Source DF SS MS F P
Myristic Acid
Total 35 17.22
Model
T 1 5.07 5.07 25.79 0.001
pH 2 3.05 1.52 7.78 0.104
EL 2 0.36 0.18 0.92 0.415
T*pH 2 1.00 0.50 2.56 0.015
T*EL 2 2.91
1.45
7.41
0.004
pH*EL 4 0.69 0.17 0.88 0.496
T* pH *EL 4 0.58 0.14 0.74 0.577
Error 18 3.54 0.19
Palmitic Acid
Total 35 60.54
Model
T 1 7.20 7.21 6.91 0.017
pH 2 4.18 2.09 2.01 0.164
EL 2 3.15 1.58 1.51 0.247
T*pH 2 3.27 1.64 1.57 0.235
T*EL 2 18.07 9.04
8.66
0.220
pH*EL 4 2.78 0.69 0.67 0.623
T* pH *EL 4 3.05 0.76 0.73 0.582
Error 18 18.78 1.04
Stearic Acid
Total 35 10.27
Model
T 1 1.60 1.60 6.14 0.023
pH 2 0.13 0.06 0.26 0.770
EL 2 0.38 0.19 0.74 0.492
T*pH 2 0.36 0.18 0.69 0.512
T*EL 2 0.24
0.12
0.48
0.628
pH*EL 4 2.07 0.51 1.98 0.141
T* pH *EL 4 0.75 0.18 0.72 0.588
Error 18 4.70 0.26
T: Temperature
EL: Enzyme load
DF: Degree of freedom
SS: Sum of squares
MS: Mean of squares
:79.46%, 68.97% and 54.20%.

102
Table 5.15. Tukey’s grouping for saturated fatty acids (myristic, palmitic and stearic)
Parameter Number of Observations Mean
(wt%)
Grouping
Myristic Acid
Temperature (°C) 55 18 6.14 A 70 18 6.89 B
pH 7.0 12 6.11 A
7.5 12 6.79 A
8.0 12 6.62 A
Enzyme load (%) 0.5 12 6.55 A
1.0 12 6.37 A
2.0 12 6.61 A
Palmitic Acid
Temperature (°C) 55 18 15.41 A 70 18 14.51 B
pH 7.0 12 14.54 A
7.5 12 14.97 A
8.0 12 15.37 A
Enzyme load (%) 0.5 12 15.10 A
1.0 12 14.55 A
2.0 12 15.23 A
Stearic Acid
Temperature (°C) 55 18 1.27 A
70 18 1.70 B
pH 7.0 12 1.53 A
7.5 12 1.40 A
8.0 12 1.53 A
Enzyme load (%) 0.5 12 1.50 A
1.0 12 1.35 A
2.0 12 1.60 A
Groups with the same letter are not significantly different from each other at the 0.05
level.

103
Table 5.16. ANOVA for monounsaturated fatty acids (palmitoleic, oleic and vaccenic)
Source DF SS MS F P
Palmitoleic Acid
Total 35 20.15
Model
T 1 1.01 1.01 3.22 0.040
pH 2 2.25 1.12 3.57 0.099
EL 2 0.09 0.04 0.15 0.864
T*pH 2 1.07 0.53 1.71 0.208
T*EL 2 1.42
0.71
2.27
0.132
pH*EL 4 5.16 1.29 4.10 0.160
T* pH *EL 4 3.45 0.86 2.74 0.061
Error 18 5.66 0.31
Oleic Acid
Total 35 235.55
Model
T 1 34.57 34.57 12.16 0.003
pH 2 1.52 0.76 0.27 0.768
EL 2 15.97 7.98 2.81 0.087
T*pH 2 88.02 44.01 15.48 0.300
T*EL 2 12.30
6.15
2.16
0.144
pH*EL 4 11.28 2.81 0.99 0.437
T* pH *EL 4 20.71 5.18 1.82 0.169
Error 18 51.17 2.84
Vaccenic Acid
Total 35 4.61
Model
T 1 0.86 0.86 13.00 0.002
pH 2 0.42 0.21 3.16 0.067
EL 2 0.26 0.12 1.93 0.173
T*pH 2 0.22 0.11 1.67 0.216
T*EL 2 1.14
0.57
8.57
0.200
pH*EL 4 0.19 0.04 0.72 0.591
T* pH *EL 4 0.30 0.07 1.14 0.371
Error 18 1.20 0.06
T: Temperature
EL: Enzyme load
DF: Degree of freedom
SS: Sum of squares
MS: Mean of squares
:71.88%, 78.27% and73.95%.

104
Table 5.17. Tukey’s grouping for monounsaturated fatty acids (palmitoleic, oleic and
vaccenic)
Parameter Number of Observations Mean
(wt%)
Grouping
Palmitoleic Acid
Temperature (°C) 55 18 7.49 A
70 18 7.83 B
pH 7.0 12 7.67 A
7.5 12 7.36 A 8.0 12 7.97 A
Enzyme load (%) 0.5 12 7.73 A
1.0 12 7.61 A
2.0 12 7.65 A
Oleic Acid
Temperature (°C) 55 18 21.82 A
70 18 19.86 B
pH 7.0 12 20.84 A
7.5 12 21.08 A
8.0 12 20.58 A
Enzyme load (%) 0.5 12 21.42 A
1.0 12 21.18 A
2.0 12 19.91 A
Vaccenic Acid
Temperature (°C) 55 18 3.58 A
70 18 3.89 B
pH 7.0 12 3.73 A
7.5 12 3.61 A
8.0 12 3.87 A
Enzyme load (%) 0.5 12 3.74 A
1.0 12 3.63 A
2.0 12 3.84 A
Groups with the same letter are not significantly different from each other at the 0.05
level.

105
Table 5.18. ANOVA for polyunsaturated fatty acids (linoleic, alpha-linolenic and
arachidonic)
Source DF SS MS F P
Linoleic Acid
Total 35 0.57
Model
T 1 0.07 0.07 7.28 0.015
pH 2 0.01 0.01 0.60 0.561
EL 2 0.04 0.02 1.92 0.175
T*pH 2 0.02 0.01 1.20 0.325
T*EL 2 0.15
0.07
7.23
0.050
pH*EL 4 0.02 0.01 0.64 0.642
T* pH *EL 4 0.03 0.01 0.82 0.527
Error 18 0.19 0.01
Alpha-linolenic Acid
Total 35 0.50
Model
T 1 0.24 0.24 77.49 0.001
pH 2 0.02 0.01 3.59 0.149
EL 2 0.01 0.02 0.79 0.470
T*pH 2 0.03 0.01 5.05 0.018
T*EL 2 0.07
0.03
11.19
0.010
pH*EL 4 0.05 0.01 4.04 0.116
T* pH *EL 4 0.01 0.03 1.24 0.330
Error 18 0.05 0.03
Arachidonic Acid
Total 35 0.07
Model
T 1 0.01 0.01 17.71 0.001
pH 2 0.01 0.01 0.56 0.582
EL 2 0.06 0.03 3.13 0.068
T*pH 2 0.01 0.01 0.85 0.444
T*EL 2 0.01
0.01
7.91
0.030
pH*EL 4 0.04 0.01 1.09 0.389
T* pH *EL 4 0.06 0.01 1.61 0.215
Error 18 0.01 0.01
T: Temperature
EL: Enzyme load
DF: Degree of freedom
SS: Sum of squares
MS: Mean of squares
:66.05%, 88.60% and 74.79%

106
Table 5.19. Tukey’s grouping for polyunsaturated fatty acids (linoleic, alpha-linolenic
and arachidonic)
Parameter Number of Observations Mean
(wt %)
Grouping
Linoleic Acid
Temperature (°C) 55 18 1.47 A 70 18 1.56 B
pH 7.0 12 1.49 A
7.5 12 1.52 A
8.0 12 1.53 A
Enzyme load (%) 0.5 12 1.52 A
1.0 12 1.47 A
2.0 12 1.55 A
alpha-linolenic Acid
Temperature (°C) 55 18 0.53 A 70 18 0.70 B
pH 7.0 12 0.58 A
7.5 12 0.63 A
8.0 12 0.64 A
Enzyme load (%) 0.5 12 0.63 A
1.0 12 0.60 A
2.0 12 0.62 A
Arachidonic Acid
Temperature (°C) 55 18 0.41 A
70 18 0.46 B
pH 7.0 12 0.43 A
7.5 12 0.43 A
8.0 12 0.44 A
Enzyme load (%) 0.5 12 0.44 A
1.0 12 0.42 A
2.0 12 0.45 A
Groups with the same letter are not significantly different from each other at the 0.05
level.

107
Table 5.20. ANOVA for polyunsaturated fatty acids (eicosapentaenoic, docosapentaenoic
and docosahexaenoic)
Source DF SS MS F P
Eicosapentaenoic Acid
Total 35 12.72
Model
T 1 1.17 1.17 6.80 0.018
pH 2 0.21 0.11 0.62 0.549
EL 2 1.05 0.53 3.07 0.071
T*pH 2 1.42 0.71 4.12 0.054
T*EL 2 2.40
1.20
6.98
0.060
pH*EL 4 1.98 0.49 2.88 0.153
T* pH *EL 4 1.35 0.34 1.97 0.143
Error 18 3.10 0.17
Docosapentaenoic Acid
Total 35 0.21
Model
T 1 0.02 0.02 9.53 0.006
pH 2 0.03 0.01 6.03 0.110
EL 2 0.01 0.01 1.88 0.181
T*pH 2 0.02 0.01 0.36 0.700
T*EL 2 0.03
0.01
6.20
0.009
pH*EL 4 0.03 0.07 2.78 0.058
T* pH *EL 4 0.01 0.04 1.58 0.223
Error 18 0.05 0.02
Docosahexaenoic Acid
Total 35 22.69
Model
T 1 1.12 1.12 3.53 0.016
pH 2 0.64 0.32 1.02 0.381
EL 2 0.43 0.21 0.69 0.515
T*pH 2 1.27 0.63 2.01 0.164
T*EL 2 2.70
1.35
4.25
0.310
pH*EL 4 6.18 1.54 4.87 0.800
T* pH *EL 4 4.59 1.14 3.61 0.250
Error 18 5.72 0.31
T: Temperature
EL: Enzyme load
DF: Degree of freedom
SS: Sum of squares
MS: Mean of squares
:75.59%, 75.65% and74.78%.
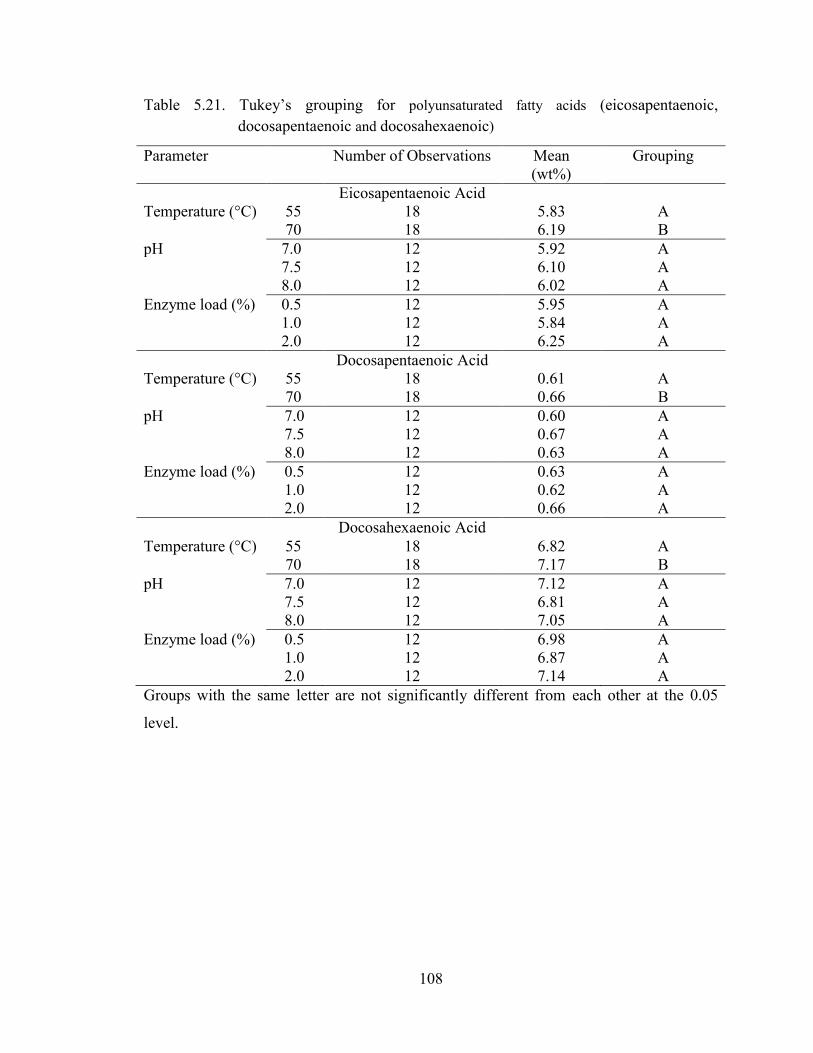
108
Table 5.21. Tukey’s grouping for polyunsaturated fatty acids (eicosapentaenoic,
docosapentaenoic and docosahexaenoic)
Parameter Number of Observations Mean
(wt%)
Grouping
Eicosapentaenoic Acid
Temperature (°C) 55 18 5.83 A 70 18 6.19 B
pH 7.0 12 5.92 A
7.5 12 6.10 A
8.0 12 6.02 A
Enzyme load (%) 0.5 12 5.95 A
1.0 12 5.84 A
2.0 12 6.25 A
Docosapentaenoic Acid
Temperature (°C) 55 18 0.61 A 70 18 0.66 B
pH 7.0 12 0.60 A
7.5 12 0.67 A
8.0 12 0.63 A
Enzyme load (%) 0.5 12 0.63 A
1.0 12 0.62 A
2.0 12 0.66 A
Docosahexaenoic Acid
Temperature (°C) 55 18 6.82 A
70 18 7.17 B
pH 7.0 12 7.12 A
7.5 12 6.81 A
8.0 12 7.05 A
Enzyme load (%) 0.5 12 6.98 A
1.0 12 6.87 A
2.0 12 7.14 A
Groups with the same letter are not significantly different from each other at the 0.05
level.

109
level. However, the effects of pH and enzyme load on the three polyunsaturated fatty
acids were not significant at the 0.05 level. The Tukey’s grouping showed that the
differences among the levels of temperature were significant for the three
polyunsaturated fatty acids at the 0.05 level. However, the differences among the levels
of pH and enzyme load were not significant for the three polyunsaturated fatty acids.
5.3. Chemical Extraction of Oil
Crude fish oil was extracted according to Bligh and Dyer method. The recovery yield and
values of quality parameters are shown in Table 5.22 and the compositions of fatty acids
are shown in Table 5.23. The recovery oil yield of crude fish oil was 97.5 %. About 90.5
% of the solvent was recovered, the remaining was evaporated in the process. The
peroxide value, acid value and p-anisidine value were 12.04 Meq/g, 5.11 mg KOH/g and
9.33, respectively. The peroxide and p-anisidine value were within the recommended
range but acid value was slightly higher (due to exposure of sample to air) than the
recommended range. Among the 12 fatty acids shown in Table 5.23, oleic acid (18:1n-9)
and palmitic acid (16:0) showed the highest fatty acid contents of 19.76 and 14.64,
respectively.
5.4. Comparing Enzymatic and Chemical Extraction Methods of Fish Oil
Table 5.24 shows the yield and quality parameters of oils obtained by enzymatic and
chemical extraction methods. The combination of enzymatic hydrolysis 55°C-7.5 pH-
2.0% enzyme load that produced the highest oil recovery yield was choosen for the
comparison with the chemical extraction method. The results showed that the chemical
extraction method gave much higher yield and better quality. Figure 5.5 and 5.6 shows a
comparison of both methods based on yield and peroxide value, acid value and p-
anisidine value, respectively.
Table 5.25 shows the fatty acids composition of oils obtained by enzymatic and chemical
extraction methods. Only 12 FAs were tabulated under three groups: saturated,

110
Table 5.22. Recovery and chemical analysis of fish oil extracted using the Bligh and Dyer
method.
Parameter Values
Recovered oil (g) 8.60 ± 0.30
Recovery oil yield (%) 97.16 ± 3.40
Solvent recovery (%) 90.50 ± 1.30
Peroxide value (Meq/g) 12.04 ± 0.01
Acid value (mg KOH/g) 5.11 ± 0.06
p-Anisidine value 9.33 ± 0.33
Oil content of herring - 8.82g/100g
Results are mean ± SD of three replicates

111
Table 5.23. Fatty acid composition of fish oil obtained using the Bligh and Dyer method.
Fatty Acid Amount
(%)*
Saturated fatty acid
Myristic acid (14:0) 5.46 ± 0.01
Palmitic acid (16:0) 14.64 ± 0.33
Stearic acid (18:0) 1.76 ± 0.001
Monounsaturated fatty acid
Palmitoleic acid (16:1 n-7) 6.69 ± 0.09
Oleic acid (18:1n-9) 19.76 ± 0.19
Vaccenic acid (18:1n-7) 3.41 ± 0.0
Polyunsaturated fatty acid
Linoleic acid (18:2n-6) 1.17 ± 0.0
Αlpha-Linolenic acid (18:3n-3) 0.47 ± 0.01
Arachidonic (20:4n-6) 0.38 ± 0.0
Eicosapentaenoic acid (20:5n-3) 4.46 ± 0.0
Docosapentaenoic acid (22:5n-3) 0.44 ± 0.0
Docosahexaenoic acid (22:6n-3) 5.92 ± 0.01
*by weight
Results are mean ± SD of three replicates

112
Table 5.24. Comparison of chemical and enzymatic method with respect to yield,
peroxide value, acid value and p-anisidine value
Parameter Recommended
Value*
Chemical
Method
Enzymatic
Method**
Recovery oil yield (%) - 97.16±3.4 20.2 ± 0.42
Peroxide value (Meq/g) 3-20 12.04 ± 0.01 31.44±0.33
Acid value (mg KOH/g) <5.0 5.11 ± 0.06 11.13±0.46
p-Anisidine value 4-60 9.33 ± 0.33 58.27±0.19
Results are mean ± SD of three replicates
*Source: Jensen et al. (1990)
**At the optimum condition of 7.5 pH, 55°C and 2.0% enzyme load.

113
Figure 5.5. Comparison of oil recovery yield of chemical and enzymatic extraction
methods.
0
20
40
60
80
100
120
chem
ical
enzy
mat
ic
Re
cove
ry y
ield
(%
)
Extraction method

114
(a) peroxide value of oil
(b) acid value of oil
(c) p-anisidine value of oil
Figure 5.6. Comparison of the oil quality parameters for the enzymatic and chemical
extraction methods.
0
5
10
15
20
25
30
35
recommend chemical enzymatic
Pe
roxi
de
val
ue
(M
eq
/g)
Extraction method
0
2
4
6
8
10
12
recommend chemical enzymatic
Aci
d v
alu
e (
mg
KO
H/g
)
Extraction method
0
10
20
30
40
50
60
70
recommend chemical enzymatic
p-A
nis
idin
e v
alu
e
Extraction method

115
Table 5.25. Comparison of fatty acid composition by chemical and enzymatic methods
Fatty Acid
Weight (%)
Chemical Method Enzymatic Method
Saturated fatty acids
Myristic acid (14:0) 5.46 ± 0.01 5.81 ± 0.10
Palmitic acid (16:0) 14.64 ± 0.33 13.10 ± 0.23
Stearic acid (18:0) 1.76 ± 0.001 0.73 ± 0.98
Subtotal 21.86 19.64
Monounsaturated fatty acids
Palmitoleic acid (16:1 n-7) 6.69 ± 0.09 6.88 ± 0.12
Oleic acid (18:1n-9) 19.76 ± 0.19 19.84 ± 0.36
Vaccenic acid (18:1n-7) 3.41 ± 0.0 3.23 ± 0.03
Subtotal 29.86 29.95
Polyunsaturated fatty acids
Linoleic acid (18:2n-6) 1.17 ± 0.0 1.38 ± 0.02
Αlpha-Linolenic acid (18:3n-3) 0.47 ± 0.01 0.36 ± 0.07
Arachidonic (20:4n-6) 0.38 ± 0.0 0.38 ± 0.00
Eicosapentaenoic acid (20:5n-3) 4.46 ± 0.0 5.50 ± 0.09
Docosapentaenoic acid (22:5n-3) 0.44 ± 0.0 0.58 ± 0.00
Docosahexaenoic acid (22:6n-3) 5.92 ± 0.01 6.41 ± 0.13
Subtotal 12.84 14.61
Other FAs 35.44 35.80
Total 100 100

116
monounsaturated and polyunsaturated fatty acids. The saturated FAs of chemical method
were higher than those of the enzymatic method. However, the monounsaturated and
polyunsaturated FAs of the enzymatic method were higher than those of the chemical
method. By comparing the two methods on the basis of entire fatty acid composition, the
enzymatic method produced slightly higher fatty acids compared to the chemical method.
5.5. Concentration of Omega-3 Fatty Acids
Table 5.26 and Figure 5.7 show the fatty acid composition of omega-3 fatty acid (EPA,
DPA and DHA) at four stirring levels (constant fast stirring at 200 rpm, constant slow
stirring at 50 rpm, intermediate stirring at 100 rpm every 4 hrs and no stirring). Among
the four stirring levels ‘no stirring’ showed the least value of PA, DPA and DHA and
‘constant fast stirring’ showed higher values of PA, DPA and DHA of 6.49, 0.91 and
11.17%, repectively. Constant slow stirring and intermediate stirring showed lower
values of EPA, DPA and DHA than those of constant fast stirring. No stirring showed the
least omega-3 FA content as enzymes are not oil soluble. Enzymes possess small
functional regions known as the active sites. The substrate molecule is held within the
active site and the enzyme breaks the bonds holding the substrate molecules into smaller
molecules known as products. This structure is known as the enzyme-substrate complex.
Mixing allows good contact between the enzyme and substrate and speeds up the
enzymatic reaction rate.
Tables 5.27 and 5.28 show the ANOVA and Tukey’s grouping results performed on the
data. The effect of mixing was significant at the 0.001 and 0.029 levels for EPA and
DHA, respectively. However, there appeared to be no effect of stirring on the DPA. This
may be due to the fact that DPA has one less double bond and less bent structure. The
results obtained from Tukey’s grouping indicated that the three levels of mixing were
significantly different from no mixing but were not significantly different from one
another at the 0.05 level for all three omega-3 fatty acids.

117
Table 5.26. Fatty acid composition of omega-3 fatty acids.
Sample EPA
(wt%)
DPA
(wt%)
DHA
(wt %)
CFS 6.49±0.35 0.91±0.39 11.17±0.14
CSS 6.20±0.09 0.63±0.08 10.69±0.74
IS 5.70±0.43 0.69±0.07 10.43±0.94
NS 4.64±0.32 0.44±0.10 8.91±0.88
Results are mean ± SD of three replicates
CFS= Constant fast stirring
CSS= Constant slow stirring
NS= No stirring
IS= Intermediate stirring
EPA- Eicosapentaenoic acid
DHA- Docosahexaenoic acid
DPA- Docosapentaenoic acid
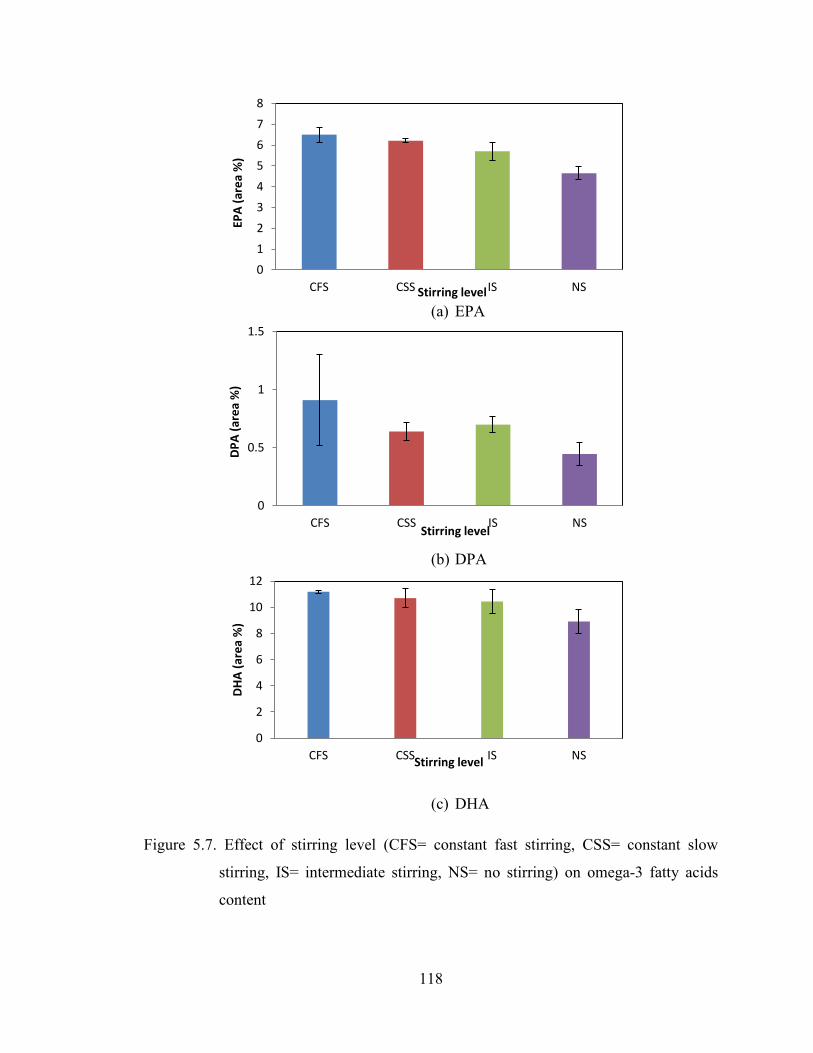
118
(a) EPA
(b) DPA
(c) DHA
Figure 5.7. Effect of stirring level (CFS= constant fast stirring, CSS= constant slow
stirring, IS= intermediate stirring, NS= no stirring) on omega-3 fatty acids
content
0
1
2
3
4
5
6
7
8
CFS CSS IS NS
EPA
(ar
ea
%)
Stirring level
0
0.5
1
1.5
CFS CSS IS NS
DP
A (
are
a %
)
Stirring level
0
2
4
6
8
10
12
CFS CSS IS NS
DH
A (
are
a %
)
Stirring level

119
Table 5.27. ANOVA for EPA and DHA.
Source DF SS MS F P
EPA
Total 11 6.837
Stirring level 3 5.970 1.990 18.37 0.001
Error 8 0.866 0.108
DHA
Total 11 13.127
Stirring level 3 8.614 2.871 5.09 0.029
Error 8 4.513 0.564
DPA
Total 11 0.6849
Stirring level 3 0.3296 0.1099 2.47 0.136
Error 8 0.3553 0.0444
DF: Degree of freedom,
SS: Sum of squares,
MS: Mean of squares,
R2: 87.33, 65.62, 48.12 %

120
Table 5.28. Tukey’s grouping for stirring levels.
Factor Number of Observations Mean
(wt %)
Grouping
Stirring level
EPA
CFS 3 6.49 A
CSS 3 6.20 A
IS 3 5.70 A
NS 3 4.64 B
DHA
CFS 3 11.17 A
CSS 3 10.69 A
IS 3 10.43 A
NS 3 8.91 B
DPA
CFS 3 0.9107 A
CSS 3 0.6393 A
IS 3 0.6997 A
NS 3 0.4460 A
Groups with the same letter are not significantly different from each other at the 0.05
level.
CFS= Constant fast stirring
CSS= Constant slow stirring
NS= No stirring
IS= Intermediate stirring

121
Table 5.29 shows the composition of omega-6, omega-7 and omega-9 fatty acids. The
value of omega-6 FAs (arachidonic and linoleic acid) was higher with constant fast
stirring and lower with no stirring. Similar results were observed with omega-7 FAs
(palmitoleic acid and vaccenic acid). However, the value of omega-9 FAs (oleic acid)
was higher with constant slow stirring and lower with no stirring. Many lipases are
specific toward particular fatty acid substrates and the lipases that are specific to fatty
acids hydrolyse the glyceride bonds formed by cis-9 unsaturated fatty acids (Oleic and
linoleic acid). Also the chain specificity of Candida rugosa lipase is in the order of oleic
> palmitic > DHA > EPA > myristic.
Table 5.30 shows the composition of omega-3 fatty acids before and after enrichment of
fish oil. Composition of FAs obtained by constant fast stirring was compared with the
composition of fish oil obtained by chemical extraction method. The contents of omega-3
FAs increase when mixing was applied. The EPA increased from 4.46% to 6.46% (45%),
the DPA increased from 0.44% to 0.82% (86%) and DHA from 5.92% to 11.17% (89%).
Also, there was an enrichment of omega-6 and omega-7 FAs whereas omega-9 FAs
decrease. Decrease in omega-9 FAs is due to the fact that oleic acids possess higher
molecular weight thereby strongly inhibited the lipase activity.

122
Table 5.29. Fatty acid composition of omega-6, omega-7 and omega-9 fatty acids.
Sample Omega-6 FA Omega-7 FA Omega-9 FA
Oleic
acid
Arachidonic acid Linoleic
acid
Palmitoleic
acid
Vaccenic acid
CFS 0.63 ± 0.19 1.19 ± 0.07 7.17 ± 0.66 3.74 ± 0.59 17.52 ± 0.30
CSS 0.60 ± 0.09 1.15 ± 0.03 7.07 ± 0.42 3.49 ± 0.08 18.87 ± 0.20
IS 0.54 ± 0.20 1.09 ± 0.11 6.92 ± 0.10 3.37 ± 0.41 16.73 ± 0.12
NS 0.40 ± 0.14 1.05 ± 0.35 6.70 ± 0.21 3.06 ± 0.05 14.90 ± 0.08
Results are mean ± SD of three replicates
CFS= Constant fast stirring
CSS= Constant slow stirring
NS= No stirring
IS= Intermediate stirring
122

123
Table 5.30. Comparison of fatty acids composition of fish oil and omega-3 enriched oil.
Fatty Acids
Fish Oil
Wt (%)
Omega-3 Enriched Oil*
Wt (%)
Saturated fatty acids
Myristic acid (14:0) 5.46 ± 0.01 5.42 ± 0.25
Palmitic acid (16:0) 14.64 ± 0.33 15.88 ± 0.06
Stearic acid (18:0) 1.76 ± 0.001 1.75 ± 0.02
Monounsaturated fatty acids
Palmitoleic acid (16:1 n-7) 6.69 ± 0.09 7.17 ± 0.66
Oleic acid (18:1n-9) 19.76 ± 0.19 17.21 ± 0.30
Vaccenic acid (18:1n-7) 3.41 ± 0.0 3.74 ± 0.59
Polyunsaturated fatty acids
Linoleic acid (18:2n-6) 1.17 ± 0.0 1.19 ± 0.07
Αlpha-Linolenic acid (18:3n-3) 0.47 ± 0.01 0.43 ± 0.32
Arachidonic (20:4n-6) 0.38 ± 0.0 0.63 ± 0.19
Eicosapentaenoic acid (20:5n-3) 4.46 ± 0.0 6.49 ± 0.35
Docosapentaenoic acid (22:5n-3) 0.44 ± 0.0 0.82 ± 0.39
Docosahexaenoic acid (22:6n-3) 5.92 ± 0.01 11.17 ± 0.14
*Omega-3 enriched oil obtained by constant fast stirring

124
CHAPTER 6. DISCUSSION
6.1. Oil Extraction
Gbogouri et al. (2006) stated that during enzymatic hydrolysis the enzyme breaks down
the protein networks which lead to the release of lipid in the fish slurry. Slizyte et al.
(2005) reported that when the fish slurry is desludged by centrifugation, four phases are
observed: oil on top layer, emulsion, fish protein hydrolysate and sludge at the bottom
of centrifuge tube. In this study, the four phases were observed and the upper phase
(first phase) was pipetted and the emulsion phase was scooped to extract the remaining
trapped oil.
The recovered lipid yield using alcalase enzyme under different conditions of
temperature, pH and enzyme load was 20.2%. This may be due to low centrifugal force
(low centrifugation speed) applied during the centrifugation step. Sun et al. (2002)
stated that in centrifugation step, some lipids are lost in the aqueous layer. Therefore, in
order to achieve a higher separation of oil, a centrifugal force >9000 g is recommended
for removing the oil from the slurry. In this study, a centrifugal speed of 4000 rpm
(2683 g) was used. The results showed that the efficiency of enzymatic hydrolysis in
extracting lipid is low. This could be due to the higher amount of emulsion giving a
lower amount of separated oil and vice versa. However, Slizyte et al. (2005) stated that
the amount of lipids in the oil and emulsion fractions were dependent on each other.
The lowest emulsion and greatest amount of separated oil can be obtained by using
alcalase without added water. However, in this study water and NaOH was added in
order to have desired pH.
In this study frozen homogenate was used to extract fish oil which might be reason for
deterioration of oil quality. The characteristics and properties of crude fish oil are
strongly influenced by the process and raw material (EFSA, 2010). According to
Aubourg and Medina (1999) the free fatty acids (FFA) have been produced during the
frozen storage of fish as a result of enzyme catalysis. This effect was increased with

125
time and temperature of the reaction mixture and with the FFA content (Miyashita and
Takagi, 1986) and leading to a high proportion of polyunsaturated FFA (Aubourg et al.,
1996). Due to the catalytic effect of the carboxyl group there is a formation of free
radicals which decompose hydroperoxides by deteriorating the quality of oil. To avoid
the extensive release of FFA, freshly prepared sample should be used.
6.1.1. Effect of temperature
In this study, two different temperatures (55°C and 70°C) were investigated in order to
determine the effect of temperature on the oil recovery yield. The higher oil recovery
yield (20.2%) was obtained at 55°C compared to 70°C (15.6%). There was a significant
effect of temperature on oil recovery yield.
Linder et al. (2005) extracted lipids from salmon heads with neutrase at a temperature of
55°C and obtained a yield of 17.2%. Gbogouri et al. (2006) extracted lipids from
salmon heads with neutrase at a temperature 55°C and reported a recovery yield of
14.4%. In general, the rate of an enzyme-catalyzed reaction increases as the temperature
rises. Small variation in reaction temperature (1-2°C) may change the results by 10-
20%. However, many enzymes have unfavorable response to high temperatures. An
increase in the temperature may increase the reaction rate up to a maximum level after
which the reaction rate is decreased suddenly with a further increase in the temperature
(WBC, 2012). Amy (2008) investigated the effect of temperature on alcalase and found
that alcalase to be high temperature protease. The activity of alcalase increased with
increased temperature up to optimum temperature of 50-60°C. In this study,
temperatures of up to 70°C were investigated as the enzyme alcalase has a temperature
range of 50°C-70°C.
6.1.2. Effect of pH
In this study, three different pH levels (7.0, 7.5 and 8.0) were studied in order to
determine the optimum pH for enzymatic extraction of fish oil. The recovery yield of oil
increased from 16.3 to 20.2% when the pH was increased from 7.0 to 7.5 and then

126
decreased from 20.2 to 16.6% when the pH was further increased to 8.0. This is due to
the reasons that, at the optimum pH enzymes are most active. Dominguez et al. (1994)
reported that increasing the pH beyond its optimum level decreases the enzyme activity
and yield.
In general, the enzymes and their activity are affected by the change in pH. Increasing
or decreasing the pH value results in a complete loss of enzyme activity. Stability of
enzymes also depends on the pH. However, the optimum pH value will vary greatly
from one enzyme to another (WBC, 2012). Dominguez et al. (1994) stated that effect of
pH on the enzyme stability and activity depends on the type of enzyme. In this study,
the pH range of alcalase tested was 6.5 to 8.5. The optimum pH for extracting oil from
herring was 7.5
In this study, the recovery yield obtained at the optimum pH of 7.5 was 13.5-20.2% and
7.3-15.6% for lower and higher temperature, respectively. Gbogouri et al. (2006)
studied the hydrolysis of salmon head with alcalase at a pH of 8.0 and reported a
recovery yield of 19.6%. Kechaou et al. (2009) studied the enzymatic hydrolysis of
cuttlefish and sardine viscera using alcalase and protamex at a pH of 8.0 and reported
12% total lipids. Nilsang et al. (2005) reported that the enzymatic hydrolysis of fish
soluble concentrate (by-product of canned fish industry) using flavourzyme at a pH of
6.0 resulted in 12.9% of oil recovery yield. Batista et al. (2009) extracted lipid from
sardine by-products using enzyme alcalase at a pH of 8.0 and reported a recovery yield
of 40%. See et al. (2011) reported that enzymatic hydrolysis of salmon skin at a pH of
8.39 yielded 1.65% of fat. These studies indicated that the effect of pH on enzymatic
extraction of lipids may depend on the type of fish/fish waste and the extraction
technique used. The higher yield reported by Batista et al. (2009) is probably due to
sardine containing high amount of lipid whereas the low yield reported by See et al.
(2011) was probably due to high pH (higher than the optimum pH), sample size and the
total oil in fish sample.

127
6.1.3. Effect of enzyme load
In this study, three different enzyme loads (0.5, 1.0 and 2.0%) were investigated. The
0.5% (w/w) alcalase load was chosen according to the procedure used by Batista et al.
(2009) and 1.0 and 2.0% enzyme loads were selected to determine the effect of
increasing the enzyme load on the oil yield. It was observed that increasing the enzyme
load showed a steady increase (from 10.9 to 16.3%) in the oil recovery yield. Mbatia et
al. (2010) reported maximum oil yield (11.2%) with 0.5% (w/w) bromelain with Nile
perch. Batista et al. (2009) extracted lipid from sardine by-products and obtained a
higher recovery yield (40%) with 0.5% (w/w) alcalase. Chua et al. (2012) stated that
increase of enzyme concentration would proportionally increase the reaction rate but
increasing the enzyme load beyond the critical value would not increase the reaction
rate. These studies indicated that the effect of enzyme and its concentration vary for
different fish samples.
Kulkarni and Pandit (2005) and Ghodsvali et al. (2008) reported that increasing enzyme
concentration increased the extent of hydrolysis and oil yield. Dominguez et al. (1994)
stated that increasing enzyme concentration made the emulsion more unstable.
According to WBC (2012), the rate of reaction is dependent on substrate concentration.
Therefore, enzyme assay should be designed so that the observed activity is
proportional to the amount of substrate present.
6.2. Oil Quality Parameters
6.2.1. Peroxide value
The peroxide value is the number that expresses in milliequivalents of active oxygen the
quantity of peroxide contained in 1000 g of the substance (European Pharmacopoeia,
2005). The number of peroxides present in the oil is an index of their primary oxidative
level and its tendency to go rancid. The lower the peroxide value the better the oil
quality and its state of preservation (CDR, 2008). Eyo (1993) stated that pH is an

128
indicator of the extent of microbial spoilage in fish. In this study, the effects of pH,
enzyme load and temperature on peroxide value of crude fish oils were investigated.
All peroxide values first slightly decreased when the pH was increased from 7.0 to pH
7.5 and then increased when the pH was increased to pH 8.0. Mancuso et al. (1999)
reported that low pH decreased lipid oxidation rates. Srinivasan et al. (1996) stated the
lipid oxidation can be lowered by lowering the pH. Sang et al. (2012) reported that
lower range of pH decreased the peroxide value and higher range of pH increased the
peroxide value. This is explained by the collision theory which states that chemical
reactions takes place during particles of reactants colliding which requires certain
minimum energy called activation energy.
Most of the samples showed that the peroxide value increased slightly when enzyme
load was increased from 0.5 to 2.0% while some showed an initial decrease in the
peroxide value when the enzyme load was increased from 0.5 to 1.0% and then an
increase with further increases in the enzyme load to 2.0%. DeRouchey et al. (2004)
reported that the reaction rate initially increased as enzyme concentration increased and
then leveled off. Kareska (2010) reported that doubling the enzyme concentration
increased the peroxide value. Ghodsvali et al. (2008) stated that the change in peroxide
value depends upon the enzyme type and its concentration. They also stated that for
certain enzymes, it was observed that at lower enzyme concentration the peroxide value
increased and at higher enzyme concentration the value decreased. To obtained lower
peroxide value minimum amount of enzyme load should be used.
There was a steady increase of peroxide value at temperature of 70°C. Saeed and
Howell (2002) reported that higher temperatures accelerated oxidation which initially
increased the peroxide value to its maximum but it rapidly declined indicating the
instability of product. Rabiei et al. (2011) and Capitani et al. (2011) reported that the
peroxide value increased with increases in temperature. This is due to the initial
propagation stage of lipid autooxidation phenomenon with chain reaction leading to

129
increases in peroxide formation. Inorder to obtain lower peroxide value, experiments
should be carried out at lower temperature.
The recommended range of peroxide value is 3-20 Meq peroxide per kg. The peroxide
values obtained in this study (26.78-41.79 Meq/g) were higher than the recommend
range which could be due to oil oxidation. Batista et al. (2009) reported that the oil from
raw sardine by-products had a high peroxide value in the range of 45.3-68.3 meq
peroxide/kg oil and the oil appeared very dark in color indicating that the oil was
oxidized. Swapna et al. (2011) obtained fish oil from fish viscera waste from catla and
rohu (Indian major carps) using enzymatic hydrolysis and reported a peroxide value of
40.48 meq peroxide/kg oil which is also higher than the recommended range (3-20 Meq
peroxide/ kg).
Peroxide value is a measure of oxidation or rancidity and can reduce the quality of food.
Connell (1995) reported that peroxide values above 10-20 Meq/kg develop rancid tastes
and smells. Mukherjee and Mitra (2009) reported that using the oxidized oil leads to
potential dangers to the physiological and biochemical functions of the body. Ahmed
and Mahendrakar (1996) stated that the change in PV is indicator of lipid oxidation
(oxidation increases the peroxide value). However, lower value can still be achieved
due to the breakdown of oxidized products. Wannahari and Nordin (2012) reported 21%
reduction in the peroxide value in oils using bagasse as absorbent. Palanisamy et al.
(2011) reported that bleaching can be used to remove certain minor constituents (colour
pigments, free fatty acid, peroxides, odour and non-fatty materials) from crude fats and
oils.
6.2.2. Acid value
Determining the acid value is important because it is still a reliable parameter for oil
quality (FAO, 1986). The pH value is a reliable indicator of the degree of freshness or
spoilage in fish (Eyo, 1993). The effects of pH, enzyme load and temperature on acid
value were studied.

130
The measured acid value showed a steady increase when the pH was increased from 7.0
to 8.0 with the higher temperature (70°C). However, with the lower temperature (55°C),
there was an increase in acid value when the pH was increased from 7.0 to 7.5 which
then decreased when the pH was increased from 7.5 to 8.0. Ivanovic et al. (2012)
observed higher acid values with higher pHs and lower acid values with lower pHs.
Buckley and Fan (2005) reported that the acid value decreased with increasing pH. Sang
et al. (2012) reported that effect of pH on the acid value increased when the pH was
above 8.0. It was also stated that with the change in pH, the weak bonds holding the
enzyme together break leading to deactivation of active site.
All samples showed increased acid values when the temperature was increased from 55
to 70°C. Xiangjin and Yali (2011) stated that at higher temperatures, the acid value
increases without delay. Khan et al. (2001) and Zhang et al. (2005) reported that the
acid value increased as the temperature was increased. Lee (2010) reported that at high
temperature, the enzyme may be denatured and loses its activity whereas at low
temperature it may be inactive. Nonetheless, varing the temperature may lead to
increase or decrease of rate of reaction depending on the optimum temperature. Inorder
to obtain lower acid value, lower tempearature should be used.
Increasing the enzyme load from 0.5 to 2.0% resulted in a steady increase in acid value.
DeRouchey et al. (2004) reported that the acid value increased with increased addition
of lipase. Sang et al. (2012) reported that the enzyme load increased along with the
increase of acid value. Liman et al. (2010) reported that the lipase concentration
increased with increased acid value. They also noticed that the lipase activity increased
with increases in the substrate concentration for oil til an optimum substrate
concentration. Lower acid value can be obtained by using minimum amount of enzyme
load (0.5%).
The recommended range of acid value is <5 mg KOH/g. The obtained acid values were
higher than the recommended range. The acid value quantifies the amount of acid
present. It is the mass of potassium hydroxide in mg that is required to neutralize 1g of

131
chemical substance (Wrolstad et al., 2005). Swapna et al. (2011) reported that the acids
value of oil obtained from fish viscera waste from catla and rohu (major Indian
oily freshwater fish of the family Cyprinidae) using nutrease and alcalase were 22 and
20.4 mg KOH/g, respectively. Gbogouri et al. (2006) obtained acid values of 0.7 and
1.2 mg KOH/g of oil from salmon head and fillets, respectively. Swapna et al. (2011)
obtained high acid value of fish oil using enzymatic hydrolysis and stated that there was
no significant difference in acid value with or without the addition of anitioxidant.
As oil goes rancid, triacylglyceride (TAG) are converted to fatty acid (FA) and glycerol
which increases acid number (Memon et al., 2010). Rancidity in fats and oils causes
undesirable chemical changes in flavour, colour, odour and nutritional value of oil.
Palanisamy et al. (2011) suggested that the nitrogen trap technique was as effective as
the continuous nitrogen flow technique and is recommended due to its cost
effectiveness. Turner et al. (2006) reported that fish oil is easily oxidized and some fish
oils contain higher than recommended levels of oxidised products. In recent
investigation it was observed that dietary oxidised fats developed atherosclerosis and
thrombosis (Turner et al., 2006).
6.2.3. p-anisdine value
The non-volatile secondary oxidation end-products are measured by p-anisidine value.
The p-anisidine value is usually associated with the term oxidative rancidity which is an
indicator of the level of off-flavour and off-odours (St. Angelo, 1996). Megahed (2011)
stated that p-anisidine is an indicator of secondary oxidation of unsaturated compounds.
p-Anisidine is a reagent that reacts with aldehydes to give products that can be
measured at an absorbance of 350 nm (Crapiste et al., 1999). The effects of pH, enzyme
load and temperature on p-anisidine value of crude fish oil were investigated.
The results showed a slight increase in the p-anisidine value with increases in the pH.
Bangash et al. (2004), Kumar and Kabra (2008) and Dayana and Hayati (2012) stated
that an increase in pH increases the secondary oxidation products thereby increasing p-
anisidine value. Arnoldi (2004) reported that at low pH values, metal ions are more

132
soluble than at higher pH values and this explains why lipid oxidation is slow at high
pH values. Shelbaya et al. (2011) reported that when pH was increased the p-anisidine
values increased. Baiano et al. (2005) reported that the hydroperoxides break down into
aldehyde and ketone which are responsible for off-flavors (secondary oxidation).
There was a slight increase in the p-anisidine value with increases in the enzyme load.
DeRouchey et al. (2004) reported that as lipase concentration was increased, the p-
anisidine value remained unchanged. However, Abdulkarim et al. (2006) reported
minimal increases of p-anisidine values with increases in enzyme concentration. In this
study, the colour of the oils became darker with increases in the enzyme load. Similar
results were observed by Zuniga et al. (2003) in which the oil appeared to be dark
brown in colour with increased enzyme concentration. It was observed that at lower
enzyme concentrations (up to 1.0%), a marked effect on the oil extractability was
observed. The quality parameters improved slightly when the enzyme concentration was
raised above 1.0%. However, the enzyme concentration to be used should be a
compromise between the upgrading of the oil quality and the cost of the enzyme (Zhang
et al., 2007).
In this study, there was a slight increase in the p-anisidine value with increased
temperature. Labrinea et al. (2001) stated that the baseline absorbance increased rapidly
as the temperature increased. Crapiste et al. (1999) and Kosoko et al. (2009) observed
higher p-anisidine value as the temperature was increased. Crapiste et al. (1999)
reported that the p-anisidine value, as an indicator of the aldehyde content, remained
constant at the earlier stages of oxidation but then increased sharply following the
decomposition of primary oxidation products.
The recommended range for p-anisidine value for crude fish oil is 4-60. The obtained p-
anisidine values were in the range of 56.93-69.83. Anisidine value is an empirical test
which determines the advanced oxidative rancidity of oils and fats (Rossell, 1994).

133
Crapiste et al. (1999) observed no significant oxidation, as measured by p-anisidine
value, in samples stored under nitrogen atmosphere or with low oxygen concentration.
Harald and Irene (2003) reported a method for reducing the p-anisidine value of oils
which involved treating the oil with urea. Bleaching the oil is another way to reduce the
p-anisidine value of oils (Palanisamy et al., 2011). EFSA (2010) reported that lipid
oxidation in fish oil can be prevented by cold storage in darkness, without exposure to
oxygen. Esterbauer (1993) observed that heavily oxidized oils given orally are not
extremely toxic to humans. However, low molecular aldehydes are readily absorbed and
can create pathological effects (damage to liver, thymus and kidney).
6.3. Fatty Acid Composition
6.3.1. Saturated fatty acids
Saturated fatty acids (SFA) are fatty acids which do not possess double bond (EFSA,
2010). The most important saturated fatty acids are myristic, palmitic and stearic acid
which can be synthesized by body in low amount. In this study, the total saturated fatty
acid percentage was 24-25%. The saturated fatty acids with values above 1% were
tabulated and they are: myristic acid (14:0) which ranged between 6.11 and 7.65%,
palmitic acid (16:0) which ranged between 14.85 and 16.81% and stearic acid (18:0)
which ranged between 1.69 and 1.91%. The effects of temperature, pH and enzyme load
on saturated fatty acids were investigated.
In this study, there was slight increase of saturated fatty acid from 6.11 to 6.28% with
increased temperature (from 55 to 70°C). Kleinschmidt and Mcmahon (1970) reported
that the saturated fatty acids content decreased at a temperature >55°C. Lanna et al.
(2005) reported that palmitic and stearic acid were not affected by the temperature.
Kates and Baxter (1962) reported decreased saturated fatty acids such as palmitate and
stearate at lower temperatures. This was due to increased polyunsaturated fatty acids
like linoleic and linolenic acids.

134
The results showed an increase in the saturated fatty acids content when the pH was
increased from 7.0 to 7.5 which then decreased when the pH was increased from 7.5 to
8.0. Similar results were observed by Bodnaruk and Golden (1996) where the saturated
fatty acids content increased at lower pH values and then decreased as pH was
increased. Nikkila et al. (1995) also reported an increase in saturated fatty acid at low
pHs which then decreased at higher pH values. Beal et al. (2001) reported that a
decrease in the pH lowered the palmitic acid.
The results showed that the saturated fatty acids content increased as the enzyme load
increased from 0.5 to 1.0% and then decreased with further increases in enzyme load
(from 1.0 to 2.0%) at the low temperature. However, there was a decrease in the
saturated fatty acids content with initial increases in the enzyme load (from 0.5 to 1.0%)
followed by increases with a further increase of enzyme load from 1.0 to 2.0% at the
higher temperature. Kempka (2011) stated that a higher enzyme concentration does not
lead to increased fatty acid content. Pawar and Tidwell (1968) reported that initial
increases in the enzyme concentration increased the saturated fatty acid content. Hari
Krishna et al. (2001) reported that increases in the enzyme beyond optimum level
reduced the amount of fatty acids.
In this study, the highest saturated fatty acid obtained was palmitic acid. Swapna et al.
(2011) evaluated the composition of fatty acids in fish oil from fish viscera waste of
catla and rohu and found palmitic acid (16:0) to be the major fatty acid among all the
saturated fatty acids. Sathivel et al. (2002) reported on the fatty acid (FA) composition
of catfish viscera in which palmitic acid had the highest amount. Wu and Bechtel (2008)
obtained saturated fatty acids from salmon by-product in which palmitic acid had the
highest concentration (13.9-14.8). Mozaffarian et al. (2010) reported that it is
recommended to reduced saturated fat (SFA) consumption in order to reduce coronary
heart disease (CHD).

135
6.3.2. Monounsaturated fatty acids
Monounsaturated fatty acids (MUFA) are fatty acids which possess only one double
bond (EFSA, 2010). In this study, the total monounsaturated fatty acids percentage was
39-40%. The monounsaturated fatty acids with values above 1% were tabulated which
included palmitoleic acid (16:1n-7) in the range of 7.41-8.86%, oleic acid (18:1n-9) in
the range of 22.28-14.18% and vaccenic acid (18:1n-7) in the range of 3.53-4.23%. The
effects of temperature, pH and enzyme load on the monounsaturated fatty acids were
investigated.
In this study, half of the samples showed increased MUFA as the temperature increased
from 55 to 70°C whereas the other half of the samples showed decreased MUFA
content as temperature increased from 55 to 70°C, especially oleic acid. Farkas and
Herodek (1964) reported that an increase in temperature decreased the amount of
unsaturated fatty acids. Olson and Ingram (1975) also reported that monounsaturated
fatty acids decreased with increases in temperature. Fulco (1974) stated that in variety
samples, environmental conditions especially temperatures have altered the fatty acid
composition. Lanna et al. (2005) reported that the oleic acid content decreased at low
temperature.
The results obtained from this study showed that the monounsaturated fatty acid content
increased with increases in the pH (from 7.0 to 8.0) with lower temperature whereas
with the higher temperature the monounsaturated fatty acids decreased with increases in
the pH (from 7.0 to 8.0). Rosa et al. (1974) stated that temperature and pH are
interdependent and it is difficult to explain the effect of variation of pH. They reported
that lower pH gave rise to unsaturated fatty acid content. Bodnaruk and Golden (1996)
reported that as the pH increased, the unsaturated fatty acids content decreased. Nikkila
et al. (1995) reported that vaccenic acid was much higher at higer pH.
It is difficult to explain the effect of enzyme load/concentration on MUFA. Most of the
monounsaturated fatty acids decreased with increased enzyme load at the lower
temperature. However, at the higher temperature, few monounsaturated fatty acids

136
increased with increased enzyme load whereas few other monounsaturated fatty acids
decreased when the enzyme load increased from 0.5 to 1.0% and then increased when
the enzyme load increased from 1.0 to 2.0%. Chopra et al. (2011) reported that
increases in enzyme concentration decreased the monounsaturated fatty acids and the
highest yield for MUFA was obtained with enzyme concentration of 1.0%. Brenes et al.
(2008) and Bharadwaj (2011) reported that monounsaturated fatty acids especially oleic
acid decreased with increased in enzyme concentration.
Swapna et al. (2010) reported that mixed visceral waste oil of catla, rohu, mrigal (Indian
oily freshwater fish of the family Cyprinidae) and tilapia was a good source of
unsaturated fatty acids. Swapna et al. (2011) reported that among the unsaturated fatty
acids in fish viscera waste from catla and rohu, oleic acid was the dominant. Sathivel et
al. (2002) observed higher oleic acid among monounsaturated fatty acid in catfish
viscera. Pontes-Arruda (2009) reported that oleic acid was the major content in
monounsaturated fatty acids which has an importance in cell and heart function, anti-
inflammatory effects in the body, treat arthritis, asthma, allergies and skin conditions.
EFSA (2010) reported that consuming diets comprising of trans-monounsaturated fatty
acids results in reduced blood HDL cholesterol concentrations and increases the total
cholesterol to HDL cholesterol ratio. However, MUFA can be synthesized by human
body and hence there is no need for MUFA as such in the diet.
6.3.3. Polyunsaturated fatty acids
Polyunsaturated fatty acids (PUFA) possess two or more double bonds (EFSA, 2010).
n-3 PUFA are polyunsaturated fatty acids with one of the double bonds located at the
third carbon atoms from the methyl end. The important n-3 PUFA are: alpha-linolenic
acid, eicosapentaenoic acid, docosapentaenoic acid and docosahexaenoic acid (Kinsella
et al., 1990). In this study, it was observed that the total polyunsaturated fatty acids
percentage was 32-35%. The polyunsaturated fatty acids with values above 1% were
tabulated which included linoleic acid (18:2 n-6), alpha-linolenic acid (18:3 n-3),
arachidonic (20:4n-6), eicosapentaenoic acid (20:5 n-3), docosapentaenoic acid (22:5 n-
3) and docosahexaenoic acid (22:6 n-3) in the ranges of 1.41-1.67, 0.53-0.80, 0.38-0.51,

137
4.90-6.49, 0.52-0.74 and 5.56-7.69%, respectively. Also, it was observed that increases
in PUFA decreased saturated and monounsaturated fatty acids. The effects of
temperature, pH and enzyme load on the polyunsaturated fatty acids were investigated.
The results showed that when the temperature was increased from 55 to 70°C, the
polyunsaturated fatty acids content increased. Similar results were observed by Olson
and Ingram (1975) who reported increases in the polyunsaturated fatty acids content
with increased temperature. Canvin (1965) and Lanna et al. (2005) reported that at low
temperature, linoleic and linolenic acid contents increased whereas at higher
temperature, linoleic and linolenic acid contents decreased. The increased PUFA
content was due to the reduced amount of saturated fatty acids that were produced.
In this study, the polyunsaturated fatty acids content increased with increases in the pH
(from 7.0 to 8.0) at the lower temperature whereas the polyunsaturated fatty acids
content increased with initial increases in the pH (from 7.0 to 7.5) and then decreased as
the pH was increased from 7.5 to 8.0 at the higher temperature. AbuGhazaleh and
Jacobson (2007) and Sackman et al. (2003) reported that increases in the pH increased
the polyunsaturated fatty acids content. Sang et al. (2012) reported that the pH had
greater effect on EPA and the highest amounts of PUFA were observed at medium pH.
The results showed that most of the polyunsaturated fatty acids decreased as enzyme
load increased from 0.5 to 2.0% at the lower temperature whereas some polyunsaturated
fatty acids decreased when the enzyme load was increased from 0.5 to 1.0% and then
increased when the enzyme load was further increased from 1.0 to 2.0% at the higher
temperature. Chopra et al. (2011) stated that an increase in value of enzyme
concentration will decrease PUFA. Lucas (2000) stated that an increase in enzyme
concentration will increase the rate of reaction at which lipids are hydrolysed to fatty
acids and glycerol. Hamam et al. (2005) reported that increasing the enzyme
concentration from 2 to 4% increased the EPA content gradually, reaching its maximum
at 4%.

138
Swapna et al. (2011) reported that among the polyunsaturated fatty acids from fish
viscera waste from catla and rohu, EPA and DHA were 1.5% and 0.8%, respectively.
Aidos et al. (2002) reported that high value of polyunsaturated fatty acid was obtained
from herring by-product in which EPA and DHA ranged from 57 to 73 g/kg. Wu and
Bechtel (2008) stated that abundant PUFAs of crude oil of salmon by-product include
the long-chain omega-3 EPA with 9.3-11.3%, docosapentaenoic acid with 2.6% and
DHA (the most abundant omega-3 PUFA in the salmon by-product) with 12.3-13.1%.
EFSA (2010) reported that arachidonic acid can be synthesised by the body from
linoleic acid and is, therefore, not an essential fatty acid. Also human body can
synthesise eicosapentaenoic acid (EPA) and docosahexaenoic acid (DHA) from alpha-
linolenic acid. However, it was suggested that the use of oily fish or dietary n-3 long-
chain polyunsaturated fatty acids supplements decreases the risk of coronary heart
disease (CHD) and sudden cardiac death (Kinsella et al., 1990).
6.4. Enzymatic Extraction vs Chemical Extraction
In this study, enzymatic and chemical extractions were compared. The chemical
extraction method gave much higher oil recovery yield (97.16%) than the enzymatic
extraction method (20.2%). The Bligh and Dyer method was carried out under mild
conditions (neither heat nor high pressures was applied) which makes it a better method
as it did not cause any alterations of the extracted oil (Aryee and Simpson, 2009). The
Bligh and Dyer is a commonly used method for comparison with other methods as it
gives maximum attainable oil yield. In this study, the Bligh and Dyer method was used
in order to compare the yield and quality of crude fish oil from the same material.
Oliveira (2009) obtained commercial Pollock oil and observed the POV, FFA to be 3.5
meq/Kg and 7.8%, respectively.
According to EFSA (2010), quality analysis is carried out in two groups: firstly to check
the fundamental parameters which includes the moisture, impurities, appearance
(namely colour), FFA, soap and iodine value (IV). And secondly, to determine refining
procedures which usually focuses on the evaluation of peroxide value and p-anisidine
value. The peroxide and p-anisidine value are the most reliable chemical methods for

139
rancidity measurements of fish oils. Miller (2010) observed that there was decrease in
peroxide value as secondary oxidation product appeared. The refined oil had an acid
value of <1.0 %, peroxide value of <2.5 meq O2/kg and p-anisidine value of <20 (FDA
GRAS, 2002).
In this study, the quality parameters (peroxide, acid and p-anisidine value) showed that
the chemical extraction was better than enzymatic extraction. The obtained peroxide,
acid and p-anisidine value were 12.04 Meq/g, 5.11 mg KOH/g and 9.33, for chemical
extraction and 31.44 Meq/g, 11.13 mg KOH/g and 58.27 for enzymatic extraction,
respectively. The values were higher than the recommended values (3-20 Meq/g, <5.0
mg KOH/g, 4-60 for peroxide, acid and p-anisidine values, respectively) showing that
the oil was oxidized and apperared to be dark in color. The dark color may be due to the
presence of products resulting from hemoglobin degradation as reported by Batista
(2009). The differences in the quality could be due to agitation/stirring and initial
heating of sample (above 90°C) in enzymatic extraction. In the solvent extraction
procedure, the samples were not subjected to high temperature. Riaz and Shaheen
(1994) reported that agitation is a stimulatory factor in the formation of lipid peroxides.
Tian et al. (2010) reported that stirring speed can enhance the oxidation rate. Slizyte et
al. (2005) reported that initial heating of raw material had a significant effect on yield
and quality of oil. Mishra and Singhai (1992) reported that subjecting lipids to high
temperature was found to induce lipid peroxidation.
In present study, the conditions used in enzymatic method which gave higher yield did
not give better quality. The enzymatic oil obtained from all the experimental conditions
was oxidized. According to Badr and Sitohy (1992), the cell wall degradation increases
with increases in the amount of enzyme, leading to the extraction of higher amounts of
oil. It may also be due to the higher quantity of oxidized fish oil producing more
oxidation products. For commercial purposes, the fish oil with nutraceutical properties
should be of a good quality and have low peroxide value, free fatty acids and p-
anisidine value. Refining the crude oil would help in removing the impurities and
reduce the oxidation product, however it would add to the cost of production.

140
In this study, it was observed that the amount of PUFA obtained by enzymatic method
was higher than the chemical extraction method. This is probably due to the use of
lipase-catalyzed enzymatic hydrolysis reactions, which are more productive, compared
to other concentration methods: esterification and interesterification (Xuebing, 2000).
However, in this process, the utilization of lipases was based on the fatty acids-specific
selectivity. According to Wanasundara and Shahidi (1998) the lipases exhibit toward
SFAs and MUFAs, leaving n-3 PUFAs intact on the glyceride moiety. Also in the
present study, the enzymatic method gave very low total oil yield (in g) but produced a
very high omega-3 percentage. The problem of low yield could be overcome by using a
conventional method for extracting fish oil to obtain higher oil yield and followed by
enzymatic hydrolysis for concentration of omega-3 fatty acids. The FAs data were
generated by using a blank sample - another way to express FAs data by GC is by using
an internal standard as a reference. An internal standard is a compound added to the
sample in a known amount and helps to increase the accuracy and precision of
analytical methods that have large inherent variability.
Gunnlaugsdottir and Ackman (1993) extracted lipid from menhaden using Bligh and
Dyer method (Bligh and Dyer, 1959) and a method proposed by Hara and Radin (1978)
using hexane/isopropanol and found Bligh and Dyer to be better method in extraction of
lipid. Gbogouri et al. (2004) stated that the difference of the extraction rates between
enzymatic hydrolysis and the Bligh and Dyer method did not exceed 2% for the
triacylglycerides (TAG) content. Chantachum et al. (2000) reported that among the
methods used for extracting lipids, Bligh and Dyer allows the best recovery of lipids.
According to Christie (1992), solvents or solvent mixture used for extraction should be
sufficiently polar to remove lipids from cell constituents, but not too polar so that the
solvents do not readily dissolve all the TAGs and other non-polar lipids. Norziah et al.
(2009) stated that penetration of polar solvents into the cells is necessary to extract the
lipid from the cell membrane and muscle fibres that includes the phospholipids
materials. In this study, chloroform:methanol solvent system was used. Bligh and Dyer
(1959) stated that the major advantage of Bligh and Dyer method is the reduction of

141
solvent:sample ratio. However, Zuta (2003) reported that there is risk of toxicity related
with exposure of chloroform and methanol and should be replaced with less toxic
solvent system.
6.5. Concentration of Omega-3 Fatty Acids
In this study, the optimum conditions for extractions were a temperature of 35°C, a
hydrolysis time of 20 h and an enzyme concentration of 800 Units which as
recommended by Wanasundara and Shahidi (1998). The fish oil used for enrichment of
omega-3 FAs was chemically extracted oil (Bligh and Dyer method). Optimization was
carried out with four different stirring levels: constant fast stirring (200 rpm), constant
slow stirring (50 rpm), intermediate stirring (100 rpm with 4 h interval) and no stirring.
The constant fast stirring gave the best yield of 17.6%. The lipase Candida rugosa
helped in the enrichment of DHA compared to EPA. Tanaka et al. (1992) stated that
high speed shaking will help mix oil and enzymatic solution well which in turn
increases the reaction rate. Ingesson et al. (2001) reported that in enzymatic hydrolysis,
the effect of shaking speed is minimum compared to other factors (enzyme
concentration, hydrolysis time).
Alonso et al. (2005) reported that the optimum stirring speed to be 200 rpm. Kahveci
and Xu (2011) studied enzymatic hydrolysis of salmon oil using candida rugosa with
stirring speed of 300 rpm and found that the total omega-3 PUFA was 38.7%.
Wanasundara and Shahidi (1998) used different enzymes (Aspergillus niger, Candida
cylindracea (CC), Chromobacterium viscosum, Geotrichum candidum, Mucor miehei,
Pseudomonas sp., Rhizopus oryzae, and Rhizopus niveus) with stirring speed of 200
rpm and found Candida cylindracea lipase to be the most active in increasing the
contents of total n-3 fatty acids SBO by 43% and MHO by 44%. Carvalho et al. (2002)
reported on the enzymatic hydrolysis of sardine oil with stirring speed of 200 rpm using
four microbial lipases (Candida cylindracea, Rhizopus delemar, Aspergillus oryzae,
Chromobacterium viscosum) among which Candida cylindracea was the most effective
for the production of oil with high concentration of DHA. It was however, less effective
in the enrichment of EPA of unhydrolysed acylglycerol.

142
The effect of lipase in concentrating EPA and DHA varies for different oils. For
example lipase from A. niger increased DHA concentration in cod liver oil (Hoshino et
al., 1990) whereas similar lipase did not show increase of DHA in menhaden oil
(Wanasundara and Shahidi, 1998) or tuna oil (Tanaka et al., 1992). Candida rugosa
increased the EPA+DHA concentration in salmon viscera oil in the first 12h and then
decreased (Sun et al., 2002).
Sirin et al. (2005) studied the enrichment of DHA using Candida rugosa from cod liver
oil and observed that the optimum condition (a pH of 5.0, a temperature of 35°C and a
hydrolysis time of 12 h with 2000 U/g enzyme concentration) gave a yield of 17.6%
whereas 1000 U/g enzyme concentration with a pH of 5.0, a temperature of 35°C and a
hydrolysis time of 24 h resulted in 1.45 fold increase in the amount of DHA in cod liver
oil. Sun et al. (2002) reported that the highest concentration of EPA was obtained at a
temperature of 50°C and the highest DHA concentration was obtained at a temperature
of 35°C. Mbatia et al. (2010) stated that temperature change did not significantly affect
substrate specificity for Candida rugosa.
In this study, the fish oil obtained from chemical extraction method had initial EPA and
DHA content as 4.46 and 5.92%, respectively. However, after enzymatic hydrolysis of
fish oil by Candida rugosa, the EPA and DHA content were increased to 6.49 and
11.17%, respectively. Kahveci et al. (2010) reported that the initial EPA and DHA
content of salmon oil to be 4.8 and 6.93%. However, after hydrolysis of salmon oil by
lipase Candida rugosa the amount of enrichment of EPA and DHA increased to 5.9 and
19.39%. Wanasundara and Shahidi (1998) observed that the initial DHA content of
menhaden oil to be 10.06% and after the hydrolysis by Candida rugosa the DHA
content increased to 17.3%. In present study, the amount of omega-3 enriched oil
obtained was too small to carry out the quality analysis (FFA, POV, pAV).

143
CHAPTER 7. CONCLUSIONS
The effects of pH (7.0, 7.5 and 8.0), enzyme load (0.5, 1.0 and 2.0%) and temperature (55
and 70°C) on the enzymatic hydrolysis of fish oil were studied using the enzyme alcalase.
A comparison between solvent extraction and enzymatic extraction for fish oil was
carried out. The effect of stirring level (constant fast stirring, constant slow stirring,
intermediate stirring and no stirring) on the concentration of omega-3 fatty acids from
herring fish was studied. The following are the conclusions drawn from the study.
1. The temperature, pH and enzyme load had significant effects on the oil recovery yield
at the 0.001 level. There appeared to be significant interaction between the three
parameters.
(a) Increasing the temperature from 55°C to 70°C decreased the oil recovery yield.
(b) For most of the combinations the oil recovery yield increased when the pH was
increased from 7.0 to 7.5 and then decreased with further increased in pH to 8.0.
(c) Increasing the enzyme load from 0.5% to 2.0% showed increase in the oil recovery
yield.
(d) The highest oil recovery yield was achieved at a temperature of 55°C, a pH of 7.5
and an enzyme load of 2.0%
2. The temperature, pH and enzyme load had significant effects on the peroxide value at
the 0.001 level. Also, the two way and three way interactions among these parameters
were highly significant.
(a) Increasing the temperature from 55°C to 70°C increased the peroxide value.
(b) Most of the peroxide values first slightly decreased when the pH was increased
from 7.0 to pH 7.5 and then increased when the pH was further increased to pH
8.0.
(c) The peroxide values of some samples increased slightly when the enzyme load was
increased from 0.5% to 2.0%. Other samples showed an initial decrease in the

144
peroxide value when the enzyme load was increased from 0.5% to 1.0% followed
by an increase with further increases in the enzyme load up to 2.0%.
(d) The lowest peroxide value was achieved at a temperature of 55°C, a pH of 7.0 and
an enzyme load of 0.5%.
(e) The proxide value obtained in this study was above the recommended range (3-20
Meq/kg) due to lipid autoxidation in the initial propagation stage which led to
increases in peroxide formation.
3. The temperature, pH and enzyme load had significant effects on the acid value at the
0.001 level. All the interactions among these factors were also highly significant.
(a) The acid values increased when the temperature was increased from 55°C to 70°C.
(b) The acid value increased when the pH was increased from 7.0 to 8.0 with the
higher temperature. However, with the lower temperature, there was an increase
in acid value when the pH was increased from 7.0 to 7.5 which then decreased
when the pH was further increased to 8.0.
(c) Increasing the enzyme load from 0.5% to 2.0% increased in acid value.
(d) The lowest acid value was achieved at a temperature of 55°C, a pH of 7.0 and an
enzyme load of 0.5%.
(e) The acid value obtained in this study was higher than the recommended range (<5
mg KOH/g) due to lipid oxidation as triacylglyceride (TAG) were converted to
fatty acid (FA) and glycerol which increased the acid number.
4. The temperature, pH and enzyme load had significant effects on the p-anisidine value
at the 0.001 level. The interactions among these factors were also highly significant.
(a) Increasing the temperature from 55°C to 70°C slightly increased the p-anisidine
value.
(b) For most of the combinations, increasing the pH (from 7.0 to 8.0) resulted in a
slight increase in the p-anisidine value.
(c) For most of the combinations, increasing the enzyme load (from 0.5% to 2.0%)
resulted in a slight increase in the p-anisidine value.

145
(d) The lowest p-anisidine value was achieved at a temperature of 55°C, a pH of 7.0
and an enzyme load of 0.5%.
(e) The p-anisidine value obtained in this study at the optimum condition was within
the recommended range (4-60).
5. The temperature had significant effect on the saturated fatty acids at the 0.001 level
whereas the effects of pH and enzyme load were insignificant. There were no
significant interactions among the parameters.
(a) The highest saturated fatty acids were achieved at a temperature of 70°C, a pH of
7.5 and an enzyme load of 2.0%.
(b) The fatty acid with highest concentration was palmitic acid (17.03%) followed by
myristic acid (7.65%) and stearic acid (1.91%).
6. The effects of temperature, pH and enzyme load on the monounsaturated fatty acids
(MUFA) were insignificant at the 0.001 level. The interactions among these
parameters were also insignificant.
(a) The highest monounsaturated fatty acids were achieved at a temperature of 55°C, a
pH of 8.0 and an enzyme load of 2.0%.
(b) The fatty acid with highest concentration was oleic acid (23.82%) followed by
palmitoleic acid (8.86%) and vaccenic acid (4.45%).
7. The effect of temperature on most of the polyunsaturated fatty acids (PUFA) was
insignificant at the 0.001 level. The pH and enzyme load had no significant effects on
the PUFA. There were no interactions among these parameters.
(a) The highest PUFA were achieved at a temperature of 70°C, a pH of 7.0 and an
enzyme load of 2.0%.
(b) The fatty acid with highest concentration was docosahexaenoic acid (8.39%)
followed by eicosapentaenoic acid (7.02%), linoleic acid (1.67%), alpha-linolenic
acid (0.80%), docosapentaenoic acid (0.74%) and arachidonic (0.51%).

146
8. The chemical extraction method was superior to the enzymatic extraction method for
fish oil.
(a) The chemical extraction method gave higher oil recovery yield than that of the
enzymatic extraction method.
(b) The chemical extraction method gave lower peroxide value (12.04 Meq/g) than
that of the enzymatic extraction method (31.44 Meq/g).
(c) The chemical extraction method gave lower acid value (5.11 mg KOH/g) than
that of the enzymatic extraction method (11.13 mg KOH/g).
(d) The chemical extraction method gave lower p-anisidine value (9.33) than that of
the enzymatic extraction method (58.27).
(e) The difference in oil quality between the two methods was due to initial heating
of raw material in enzymatic hydrolysis which had a significant effect on yield
and quality.
9. Stirring had a significant effect on EPA and DHA.
(a) There was an increase in the amount of fatty acids composition with increase in the
stirring speed.
(b) The concentration of omega-3 FAs by Candida rugosa showed enrichment of
EPA from 4.46% to 6.46%, DPA from 0.44% to 0.82% and DHA from 5.92% to
11.17%. Also there was an enrichment of omega-6 and omega-7 FAs.
(c) The highest EPA, DPA and DHA were achieved with constant fast stirring (200
rpm).
(d) The higher FAs composition is due to mixing allow good contact between enzyme
and substrate and speeds up the enzymatic reaction rate.
7.1. Future Work
1. Fish processing waste should be used for extracting fish oil and omega-3 fatty acids to
enhance the economics of fish processing industry and to minimize problems
associated with disposal of fish waste.

147
2. Extraction of fish oil using solvent system can be used but choloroform:methanol
should be replaced with hexane:isopropanol and the optimum level of solvent ratio
should be determined.
3. Higher centrifugal speed should be used to separate the oil after enzymatic hydrolysis
and the optimum centrifugal force should be determined.
4. Concentration of omega-3 fatty acid should be carried out with immobilized enzymes
and the efficiency of the immobilized process and optimum extraction conditions
should be investigated.
5. The discarded lower phase in the extraction of omega-3 fatty acid should be
investigated for fatty acid content.

148
REFERENCES
Abdou, E.S., K.S.A. Nagy and M.Z. Elsabee. 2008. Extraction and characterization of
chitin and chitosan from local sources. Bioresource Technology, 99(5), 1359-1367.
Abdulkarim, S.M., O.M. Lai, S.K.S. Muhammad, K. Long and H.M. Ghazal. 2006. Use
of enzymes to enhance oil recovery during aqueous extraction of Moringa oleifera
seed oil. Journal of Food Lipids, 13, 113-117.
Abdullah and J. Salimon. 2010. Optimization of process variables using D-optimal design
for separating linoleic acid in Jatropha curcas seed oil by urea complex
fractionation. Biotechnology, 9(3), 362-367.
Aberoumand, A. 2010. Studies on quality of fatty acids and properties of skin and
digestive fat content oils from some Iranian fishes. Advance Journal of Food
Science and Technology, 2(1), 28-30.
Abiola, S.S. and E.K. Onunkwor. 2004. Replacement value of hatchery waste meal for
fish meal in layer diets. Bioresource Technology, 95(1), 103-6.
AbuGhazaleh, A.A. and B.N. Jacobson. 2007. The effect of pH and polyunsaturated fatty
acid source on the production of vaccenic acid and conjugated linoleic acids in
ruminal cultures incubated with DHA. Animal Feed Science and Technology, 136,
11-22.
Ackman, R.G. 1994. Seafood lipids, in seafood: Chemistry, processing technology and
quality. Shahidi, F.; Botta, J.R (ed) Chapman and Hall, London, p. 34.
Adeniyi, O.D. and A.A. Bawa. 2006. Mackerel (Scomber Scrombrus) Oil extraction and
evaluation as raw materials for industrial utilization, Leonardo Journal of Sciences,
8, 33-42.
Ahmed, J. and N.S. Mahendrakar. 1996. Autolysis and rancidity development in fish
viscera during fermentation. Bioresource Technology, 58, 247-251.
Aidos, I., J.B. Luten, R.M. Boom and A.V. Padt. 2001. Upgrading of Maatjes herring by-
products: Production of crude fish oil. Journal of Agricultural Food Chemistry, 49,
3697-3704.
Aidos, I., S. Masbernat-Martinez, J.B. Luten, R.M. Boom and A.V. Padt. 2002.
Composition and stability of herring oil recovered from sorted by-products as
compared to oil from mixed by-products. Journal of Agricultural Food Chemistry,
50, 2818-2824.
Akhtar, M.J., M. Jacquot, E. Arab-Tehrany, C. Gaiani, M. Linder and S. Desobry. 2010.
Control of salmon oil photooxidation during storage in HPMC packaging film:
Influence of film color. Food Chemistry, 120(2), 395-401.
Akoh, C.C., S. Sellappan, L.B. Fomuso and V.V. Yankah. 2002. Enzymatic synthesis of
structured lipids. Lipid Biotechnology. New York, NY: Marcel Dekker, Inc., 433-
460.

149
Alders, L. 1955. Liquid-liquid extraction. Elsevier, New York, 26.
Alonso, F.O.M., E.B.L. Oliveira, G.M.D. Ortiz and F.V.P. Meirelles. 2005. Improvement
of lipase production at different stirring speeds and oxygen levels. Brazilian Journal
of Chemical Engineering, 22(01), 9-18.
AMEC Earth & Environmental Limited. 2003. Management of waste from Atlantic
seafood processing operations. National programme of action, Atlantic regional
team, Environment Canada Atlantic Region, 1-77.
Amy. 2008. Effect of temperature on activity of alcalase and savinase. StudyMode.com.
(Retrieved on september/20/2012) http://www.studymode.com/essays/Effect-
Temperature-Activity-Alcalase-Savinase-161021.html.
AOCS (American oil chemists’ society). 1989. Official methods and recommended
practices of the American oil chemists’ society, 4th
ed.
Aranaz, I., M. Mengíbar, R. Harris, I. Paños, B. Miralles, N. Acosta, G. Galed and A.
Heras. 2009. Functional characterization of chitin and chitosan. Current Chemical
Biology, 3, 203-230.
Archer, M., R. Watson and J.W. Denton. 2001. Fish waste production in the United
Kingdom- The quantities produced and opportunities for better utilisation. The sea
fish industry authority seafish technology, 1-57.
Arnoldi, A. 2004. Functional foods, Cardiovascular disease and diabetes. CRC Press
LLC, FL, USA.
Aryee, A.N.A. and B.K. Simpson. 2009. Comparative studies on the yield and quality of
solvent-extracted oil from salmon skin. Journal of Food Engineering, 92(3), 353-
358.
Aubourg, S. and I. Medina. 1999. Influence of storage time and temperature on lipid
deterioration during cod (Gadus morhua) and haddock (Melanogramus aeglefinus)
frozen storage. Journal of the Science of Food and Agriculture, 79:1943-1948.
Aubourg, S., I. Medina and R. Pérez-Martín. 1996. Polyunsaturated fatty acids in tuna
phospholipids: Distribution in the sn-2 location and changes during cooking.
Journal of Agricutural and Food Chemistry, 44:585-589.
Babbit, J.K. 1990. Intrinsic quality and species of North specific fish. In: Making profits
out of seafood by-products.Keller, S (ed). Proceeding of the International
conference on fish by-products, Alaska, 39-43.
Badr, F. and M.Z. Sitohy. 1992. Grasas y Aceites, 43, 281-283.
Baiano, A., T. Gomes and F. Caponio. 2005. A comparison between olive oil and extra-
virgin olive oil used as covering liquids in canned dried tomatoes: hydrolytic and
oxidative degradation during storage. International Journal of Food Science and
Technology, 40, 829-834.
Bang, H.O., J. Dyerberg and N. Hjorne. 1976. The composition of food consumed by
Greenland Eskimos. Acta Medica Scandinavica, 200, 59-73.

150
Bangash, F.H., T. Ahmad, S. Attab and A. Zeba. 2004. Effects of irradiation on the
storage stability of red palm oil. Journal of the Chinese Chemical Society, 51, 991-
995.
Batista, B.S., L. Hernandez, A.N. Velasquez-del, V.M.G. Hernandez, L.M. Ait, B.E.
Bosquez, E. Molina and C.L. Wilson. 2006. Chitosan as a potentialnatural
compound to control pre and post harvest diseases of horticulture commodities.
Crop Protect, 25, 108- 118.
Batista, I., C. Ramos, R. Mendonça and M. Leonor Nunes. 2009. Enzymatic hydrolysis of
sardine (Sardina pilchardus) by-products and lipid recovery. Journal of Aquatic
Food Product Technology, 18, 120–134.
Beal, C., F. Fonseca and G. Corrieu. 2001. Resistance to freezing and frozen storage
of Streptococcus thermophilus is related to membrane fatty acid composition.
Journal of Dairy Science, 84, 2347-2356.
Beamish, R.J., A.J. Benson, R.M. Sweeting and C.M. Neville. 2004. Regimes and the
history of the major fisheries off Canada’s west coast. Fisheries and Oceans
Canada, Pacific Biological Station. Progress in Oceanography, 60, 355-385.
Beddows, C.G., C. Jagait and M.J. Kelly. 2001. Effect of ascorbyl palmitate on the
preservation of α-tocopherol in sunflower oil, alone and with herbs and spices.
Food Chemistry, 73, 255-261.
Benhabiles, M.S., N. Abdi, N. Drouiche, H. Lounici, A. Pauss, M.F.A. Goosen and N.
Mameri. 2012. Fish protein hydrolysate production from sardine solid waste by
crude pepsin enzymatic hydrolysis in a bioreactor coupled to an ultrafiltration unit.
Materials Science and Engineering: C, 32(4), 922–928.
Benson, A.J., G.A. McFarlane, S.E. Allen and J.F. Dower. 2002. Change in Pacific hake
(Merluccius productus) migration patterns and juvenile growth related to the 1989
regime shift. Canadian Journal of Fisheries and Aquatic Sciences, 59, 1969-1979.
Berger, J., M. Reist, J.M. Mayer, O. Felt and R. Gurny. 2004. Structure and interactions
in chitosan hydrogels formed by complexation or aggregation for biomedical
applications. European Journal of Pharmaceutics and Biopharmaceutics, 57(1), 35-
52.
Bharadwaj. 2011. Synthesis of DHA rich PUFA from cod liver fish oil.
http://www.scribd.com/doc/70347867/Synthesis-of-DHA-Rich-PUFA-From-Cod-
Liver-Fish-Oil (Retrived on April 10. 2012).
Bimbo, A.P. 1998. Guidelines for characterizing food-grade fish oil. Inform, 9, 473-483.
Bligh, E.G. and W.J. Dyer. 1959. A rapid method for total lipid extraction and
purification. Canadian Journal Biochemistry and Physiology, 37, 911-917.
Bodnaruk, P.W. and D.A. Golden. 1996. Influence of pH and incubation temperature on
fatty acid composition and virulence factor of Yersinia enterocolitica. Food
Microbiology, 13(1), 17-22.
Boonchouy, S., S. Kasemsumran, W. Thanapase, W. Worawattanamateekul, S.
Boonbumrung and J. Mookdasanit. 2009. Determination of peroxide value, acid

151
value and anisidine value in fish oil using nearinfrared spectroscopy. Proceedings
of the 47th Kasetsart University Annual Conference, Kasetsart, Subject: Fisheries,
354-363.
Boran, G., H. Karacam and M. Boran. 2006. Changes in the quality of fish oils due to
storage temperature and time. Food Chemistry, 98, 693-698.
Bottino, N.R., G.A. Vandenburg and R. Reiser. 1967. Lipids. 2, 489-93.
Boustani, S.E., C. Colette, L. Monnier, B. Descomps, A. Crastes de Paulet and F. Mendy.
1987. Enteral absorption in man of eicosapentaenoic acid in different chemical
forms. Lipids, 22, (10), 711-714.
Brenes, A. C. Centeno, A. Viveros and I. Arija. 2008. Effect of enzyme addition on the
nutritive value of high oleic acid sunflower Seeds in chicken diets. Poultry Science
87, 2300-2310.
British Columbia seafood production. 2010. A statistical summary of British Columbia’s
seafood production and export- review.
Brown, J.B. and D.K. Kolb. 1955. Application of low temperature crystallization in
separation of the fatty acids and their compounds. Prog chem. Fats lipids, 3:57-94.
Bruinsma, K.A. and D.L. Taren. 2000. Dieting, essential fatty acid intake, and
depression, 58(4), 98-108.
Buckley, J.S. and T. Fan. 2005. Crude oil/brine interfacial tensions. SCA2005-01, 1-12.
Budge, S.M., S.J. Iverson and H.N. Koopman. 2006. Studying trophic ecology in marine
ecosystems using fatty acids: a primer on analysis and interpretation. Marine
Mammal Science, 22, 759-801.
Canakci, M. 2007. The potential of restaurant waste lipids as biodiesel feedstocks.
Bioresource Technology, 98, 183-190.
Canvin, D.T. 1965. The effect of temperature on the oil content and fatty acid
composition of the oils from several oil seed crops. Canadian Journal of Botony,
43, 63-69.
Capitani, M., C.M. Mateo and S.M. Nolasco. 2011. Effect of temperature and storage
time of wheat germ on the oil tocopherol concentration. Brazilian Journal of
Chemical Engineering, 28(2), 1-3.
Carr, R.A. 1978. Refining and degumming systems for edible fats and oils. Journal of the
American Oil Chemists’ Society, 55:765-771.
Carvalho, P.O., P.R.B. Campos, M.D. Noffs, D.H.M. Bastos and J.G.D. Oliveira. 2002.
nzymic enhancement of ω3 polyunsaturated fatty acids content in Brazilian
sardine oil. Acta Farmaceutica Bonaerense, 21(2), 85-8.
CDR. Determination of peroxide value in oils & fats. 2008 (Retrieved on Feb 13th
2011)
http://www.cdr-mediared.com/food-diagnostics/chemical-test-food/peroxides-oils-
fats.
Cermak, S.C., A.L. John and R.L. Evangelista. 2007. Enrichment of decanoic acid in
cuphea fatty acids by molecular distillation. Ind. Crops Prod. 26, 93-99.

152
CFS (Canadian Fisheries Statistics). 2006. Economic analysis and statistics, policy sector,
Ottawa. (Retrieved on August 4th
2009) http://www.dfo-
mpo.gc.ca/communic/statistics/publications/commercial/index_e.htm.
Chang, S.S. 1967. Processing of fish oils. In fish oils, ed. M.E . Stansby, AVI Publishing
Co., West port, CT, 206-221.
Chantachum, S., S. Benjakul and N. Sriwirat. 2000. Separation and quality of fish oil
from precooked and non-precooked tunaheads. Food Chemistry, 69, 289-294.
Charles, E.O. 2009. Virtual Chembook, Elmhurst College, (retrieved 4th May, 2010)
http://www.elmhurst.edu/~chm/vchembook/index.html.
Che Man, Y.B. and G. Setiowaty. 1999. Determination of anisidine value in thermally
oxidized palm olein by fourier transform infrared spectroscopy. Journal of
American Oil Chemists’ Society, 76(2).
Chen, T.C. and Y.H. Ju. 2000. Enrichment of eicosapentaenoic acid and docosahexaenoic
acid in saponified menhaden oil. Journal of American Oil Chemists’ Society, 77.4,
425-428.
Chien, P. and C. Chou. 2006. Antifungal activity of chitosan and its application to control
post-harvest quality and fungal rotting of Tankan citrus fruit (Citrus tankan
Hayata). Journal of the Science of Food and Agriculture, 86, 1964-9.
Chin, J.P.F. and A.M. Dart. 1995. How does fish oil affect vascular function? Clinical
and Experimental Pharmacology and Physiology, 22, 71-81.
Chingmin, Ph.D., E. Tsai, T. Joseph, Wooten, Ph.D and D.A. Otto. 1989. Stability of fish
oil in a purified diet with added antioxidants: Effects of temperature and light.
Nutrition Research, 9(6), 673-678.
Cho, S.Y., K. Miyashita, T. Miyazawa, J. Fujimoto and T. Kaneda. 1987. Autoxidation
of ethyl EPA and DHA. Journal of American Oil Chemists’ Society, 64, 876-879.
Chopra, R., N.K. Rastogi and K. Sambaiah. 2011. nrichment of rice bran oil with α-
linolenic acid by enzymatic acidolysis: Optimization of parameters by response
surface methodology. Food and Bioprocess Technology, 4(7), 1.
Christie, W.W. 1992. Solid-phase extraction columns in the analysis of lipids, In
advances in lipid methodology, Ed. W.W. Christie, Oily Press, Ayr, 1-17.
Christie, W.W. 2003. Lipid extraction, storage and sample handling. In: Lipid analysis-
isolation, separation, identification and structural analysis of lipids (3rd
edition),
Christie (ed). Oily Press, England, 97-102.
Chua, L.S., M. Alitabarimansor, C.T. Lee and R. Mat. 2012. Hydrolysis of virgin coconut
oil using immobilized lipase in a batch reactor. Enzyme Research, 1-5.
Clark, W.G. and S.R. Hare. 2002. Effects of climate and stock size on recruitment and
growth of Pacific halibut. North American Journal of Fisheries Management, 22,
852-862.
Cmolik, J. and J. Pokorny. 2000. Eur. Physical refining of edible oils. Journal of Lipid
Science and Technology, 102: 472-486.

153
Connell, J.J. 1995. Control of fish quality. 4th Edition. Fishing News Books, Farnham.
England.
Connor, W.E. 2000. Importance of n-3 fatty acids in health and disease. American
Journal of Clinical Nutrition, 71(1), 171S-175S.
Covington, M.B. 2004. Omega-3 fatty acid. University of Maryland School of Medicine,
Baltimore, Maryland Ameican Family Physician, 1, 70(1), 133-140.
Crapiste, G.H., M.I.V. Brevedan and A.A. Carelli. 1999. Oxidation of sunflower oil
during storage. Journal of the American Oil Chemists’ Society, 76(12).
Cunnane, S.C., M. Plourde, K. Stewart and M.A. Crawford. 2007. Docosahexaenoic acid
and shore-based diets in hominin encephalization: A rebuttal. American Journal of
Human Biology, 19, 578-581.
Darren, J.H. and J.H. Bruce. 2004. Omega-3 fatty acids from fish oils and cardiovascular
disease. In: molecular and cellular biochemistry. Kluwer Academic Publishers,
Netherlands, 263, 217-225.
Dayana, T.Z.T.N., and I.N. Hayati. 2012. Properties and stability of model beverage
emulsion as affected by okra mucilage. UMT 11th International Annual
Symposium on Sustainability Science and Management.
de Koning, A. and T. Mol. 1991. Quantitative quality tests for frozen fish: Soluble
protein and free fatty acid content as quality criteria for hake (Merluccius
merluccius) stored at -18°C. Journal of the Science of Food and Agriculture,
54:449-458.
DeRouchey, J.M., J.D. Hancock, R.H. Hines, C.A. Maloney, D.J. Lee, H. Cao, D.W.
Dean and J.S. Park. 2004. Effects of rancidity and free fatty acids in choice white
grease on growth performance and nutrient digestibility in weanling pigs. American
Society of Animal Science, 82, 2937-2944.
DFO, Canadian’s fisheries - fast facts. 2009. (Retrieved May 25, 2012) http://www.dfo-
mpo.gc.ca/stats/FastFacts_09-eng.pdf.
DFO, Canadian’s fisheries- fast facts. 2010. (Retrieved May 25, 2012) http://www.dfo-
mpo.gc.ca/stats/facts-Info-10-eng.htm.
DFO. 1999. Pacific cod in hecate strait. Department of Fisheries and Oceans Science
Stock Status Report, A6-01.
Dinamarca, E., F. Garrido and A. Valenzuela. 1990. A simple high vaccum distillation
equipments for deodorizing fish oil for human consumption. Lipids, 25:170-171.
Dominguez, H., M.J. Nunez and J.M. Lema, 1994. Enzymatic pretreatment to enhance oil
extraction from fruits and oilseeds: A review. Food Chemistry, 49, 271-286.
Domiszewski, Z., G. Bienkiewicz and D. Plust. 2011. Effects of different heat treatments
on lipid quality of striped catfish (pangasius hypophthalmus). Acta Scientiarum
Polonorum, Technologia Alimentaria, 10(3), 359-373.

154
Eckert, G.P., C. Franke, M. Nöldner, O. Rau, M. Wurglics, M. Schubert-Zsilavecz and
W.E. Müller. 2010. Plant derived omega-3-fatty acids protect mitochondrial
function in the brain. Pharmacological Research, 61(3), 234-41.
Effront, J., S.C. Prescott and C.S. Venable. 2007. Biochemical catalysts in life and
industry: proteolytic enzymes (1917). Kessinger Publishing, New York, 151-289.
EFSA (European food safety authority). 2010. Scientific opinion on fish oil for human
consumption. Food hygiene, including rancidity. EFSA Journal, 8(10):1874.
Eisenberg, F. and J.B. Field. 1956. The enzymatic hydrolysis of glucuronolactone. 293-
300.
El-Mashad, H.M., R. Zhang and R.J. Avena-Bustillos. 2008. A two-step process for
biodiesel production from salmon oil. Biosysytems Engineering, 99(2), 220-227.
sp sito, T.S., M.M. Ian, P.G. Amaral, L.B. Carvalho and R.S. Bezerra. 2010. Trypsin
from the processing waste of the lane snapper (Lutjanus synagris) and its
compatibility with oxidants, surfactants and commercial detergents. Journal of
Agricultural and Food Chemistry, 58(10), 6433–6439.
Esterbauer, H. 1993. Cytotoxicity and genotoxicity of lipid-oxidation products. American
Journal of Clinical Nutrition, 57, 779S-785S.
European Commission. 2006. Commission regulation (EC) No 1199/2006 amending
regulation (EC) No 466/2001 setting maximum levels for certain contaminants in
food stuffs as regards dioxins and dioxin-like PCBs. Off. J. EU, L32/34.
European Pharmacopoeia. 2005. Peroxide value. (Retrived on September 28/2012).
http://lib.njutcm.edu.cn/yaodian/ep/EP5.0/02_methods_of_analysis/2.5.__assays/2.
5.5.%20Peroxide%20value.pdf.
Eyo, A.A. 1993. Traditional and improved fish handling, preservation and processing
Techniques. Paper presented at National workshop on fish processing storage,
marketing and utilization.
Faid, M., A. Zouiten, A. Elmarrakchi and A. Achkari-Begdouri. 1997. Biotransformation
of fish waste into a stable feed ingredient, 60(1), 13-18.
FAO, 1994. The state of food and agriculture. Agriculture Series, 27.
FAO. 1986. The production of fish meal and oil. Fisheries Technical Paper-T142.
Fisheries Industries Division. 63.
FAO. 2005. Post-harvest changes in fish. In: FAO fisheries and aquaculture department,
Food and Agriculture Organization, Rome, Italy, (Retrieved on 2nd
March, 2010)
http://www.fao.org/fishery/topic/12320/en.
Farkas, T. and S. Herodek. 1964. The effect of environmental temperature on the fatty
acid composition of crustacean plankton. Journal of Lipid Research, 5, 369-373.
Fei, C.Y., J. Salimon and M. Said. 2010. Optimisation of urea complexation by box-
behnken design. Sains Malaysiana, 39(5), 795-803.
Ferna´ndez-Lorente, G., C. Ortiz, R.L. Segura, R. Ferna´ndez-Lafuente and J.M. Guisa´n.
2005. Purification of different lipases from Aspergillus niger by using a highly

155
selective adsorption on hydrophobic supports. Biotechnology and Bioengineering,
92, 773-779.
Fisheries and Ocean Canada. 2011. Canadian fishing industry overview. (Retrieved on
September 19/ 2012) http://www.apcfnc.ca/en/fisheries/resources/Aboriginal
%20Fisheries%20in%20Canada%20%20Overview%20Canadian%20Market%20Tr
ends%20%20David%20Millette.pdf.
Foodlexicon. 2008. Retrieved on Dec3/2012. http://en.foodlexicon.org/.
Frankel, E.N. 1991. Recent advances in lipid oxidation. Review. Journal of the Science of
Food and Agriculture, 54, 495-511.
Frankel, E.N. 1998. Lipid oxidation. Chapter 10 foods. The oily press, In: Frankel EN
(ed). Dundee, UK, 187-225.
FRBSS (Fisheries Research Branch Science Sector). 1996. Overview of canadian marine
fisheries resources. Department of Fisheries and Oceans Government of Canada.
Fritsche, K.L. and P.V. Johnston. 1988. Rapid autoxidation of fish oil in diets without
added antioxidants. Journal of Nutrition, 118, 425-426.
Fukuda, H., A. Kondo and H. Noda. 2001. Biodiesel fuel production by
transesterification of oils. Journal of Bioscience and Bioengineering, 92(5), 405-
416.
Fulco, A.J. 1974. Metabolic alterations of fatty acids. Annual Review of Biochemistry,
43, 215-241.
Gabrielsen, B.O. and E. Austreng. 1998. Growth, product quality and immune status of
Atlantic salmon, Salmo salar L. fed wet feed with alginate. Aquaculture Research,
29, 397-401.
Gamez-Meza, N., J.A. Noriega-Rodrı, L.A. Medina-Juareza, J. Ortega-Garcaa, J.
Monroy-Riverab, F.J. Toro-Vazquezc, H.S. Garcıa and O. Angulo-Guerrerob.
2003. Concentration of eicosapentaenoic acid and docosahexaenoic acid from fish
oil by hydrolysis and urea complexation. Food Research International, 36, 721-727.
Gan, Q., S.J. Allen and G. Taylor. 2003. Kinetics dynamics in heterogeneous enzymatic
hydrolysis of cellulose: an overview, an experimental study and mathecal
modeling. Process Biochemistry, 38, 1003-1018.
Gardner, H.W. 1983. Effect of lipid hydroperoxides on food components. In xenobiotics
in foods and feeds; Finley, J.W. Eds., American Chemical Society: Washington,
DC, 63-84.
Gayathri, S., S. Prabhu, A. Mitra, V. Kumar, J.S. Sheela, G. Rajani, N. Sundar and S.N.
Sivvaswamy. 2010. Soil microorganisms produce omega-3 fatty acids. Indian
Journal of Science and Technology, 3(5), 499-503.
Gbogouri, G.A., M. Linder, J. Fanni and M. Parmentier. 2004. Influence of hydrolysis
degree on the functional properties of salmon byproduct hydrolysates. Journal of
Food Science, 69, C615-C622.

156
Gbogouri, G.A., M. Linder, J. Fanni and M. Parmentier. 2006. Analysis of lipids
extracted from salmon (Salmo salar) heads by commercial proteolytic enzymes.
European Journal of Lipid Science and Technology, 108, 766-775.
Geiger, R. 1985. Chymotrypsin: In methods of enzymatic analysis, 3rd, Bergmeyer, H.U.
Ed.; Vch Pub: Deerfield, 5(2), 99-118.
Ghafoorunissa, J. and J. Pangrekar. 1993. Vegetables as sources of alpha-linolenic acid in
Indian diets. Food Chemistry, 47(2), 121-124.
Ghodsvali, A., M.H. Khodaparast and L.L. Diosady. 2008. Aqueous extraction of virgin
olive oil using industrial enzymes. National Congress on Food Technology, 1-6.
Gray, J.I., E.A. Gomaa and D.J. Buckley. 1996. Oxidative quality and shelf life of meats.
Meat Science, 43, S111-S123.
Groot, C. and L. Margolis. 1991. Pacific salmon life histories. Vancouver: UBC Press,
564.
Gunnlaugsdottir, H. and R.G. Ackman. 1993. Three extraction methodsfor determination
of lipids in fish meal: Evaluation of a hexane/isopropanol method as an alternative
to chloroform based methods. Journal of Science and Agriculture, 61, 235-240.
Gurr, M.I. and A.T. James. 1980. Lipid biochemistry: An introduction, 3rd
ed., Chapman
& Hall, London, 18.
Gutteridge, J.M.C. and B. Halliwell. 1990. The measurement and mechanism of lipid
peroxidation in biological systems. Trends in Biochemical Sciences, 15, 129-135.
Haagsma, N., C.M. Gent, J.B. Luten, R.W. Jong and E. Doorn. 1982. Preparation of an
omega-3 fatty acid concentrates from cod liver oil. Journal of American Oil
Chemists’ Society, 59, 117-118.
Haard, H.F. and B.K. Simpson. 2000. Seafood enzymes: utilization and influence on
postharvest seafood quality. Marcel Dekker, Inc., New York.
Hall, G.M. 1992. Fish processing technology. In Ockerman, H.W. ed. Fishery by-
products. VCH Publishers, New York, 155-192.
Hamam, F., J. Daun and F. Shahidi. 2005. Lipase-assisted acidolysis of high-laurate
canola oil with eicosapentaenoic acid. Journal of the American Oil Chemists’
Society, 82(12), 875-879.
Hara, A. and N.S. Radin. 1978. Lipid extraction of tissues with a low-toxicity
solvent. Analytical Biochemistry, 90, 420-426.
Harald, B. and S.L. Irene. 2003. Stabilization of pigments and polyunsaturated oils.
United States Patent 6630188.
Haraldsson, G.G. and B. Hjaltason. 2001. Fish oils as sources of polyunsaturated fatty
acids. In: structured and modified lipids, Gunstone, F.D (ed). Marcel Dekker. Inc.,
New York, 313-350.
Hari Krishna, S., S. Divakar, S.G. Prapulla, N.G. Karanth. 2001. Enzymatic synthesis of
isoamyl acetate using immobilized lipase from Rhizomucor miehei. Journal of
Biotechnology, 87, 193-201.

157
Harrison, K. 2007. EPA, Icosapentaenoic acid, Timnodonic acid, unsaturated fatty acid.
(Retrieved on July 8/ 2009) http://www.3dchem.com/molecules.asp?ID=380.
Hayes, D.G., Y.C. Bengtsson, J.M. Van Alstine and F. Setterwall. 1998. Urea
complexation for the rapid, ecologically responsible fractionation of fatty acids
from seed oil. Journal of the American Oil Chemists’ Society, 75, 1403-1409.
Hilakivi-Clarke, L., E. Cho, A. Cabanes, S. DeAssis, S. Olivo, W. Helferich, M.E.
Lippman and R. Clarke. 2002. Dietary modulation of pregnancy estrogen levels and
breast cancer risk among female rat offspring. Clinical Cancer Research, 8, 3601-
3610.
Hinsui, J., W. Worawattanamateekul, N. Raksakulthai and J. Runglerdkriangkrai. 2006.
Characterization of partial purified trypsin and chymotrypsin from viscera of nile
tilapia (Oreochromis niloticus Linneaus). Kasetsart Journal (Natural Science) 40,
242 - 248.
Hjaltason, B. 1992. Fish oils as vitamin sources, AOCS short course manual on modern
applications of marine oils. In: the lipid hand book (3rd
Edition). Gunstone, F.D.;
Harwood, J.L.; Dijkstra, A.J (ed). CRC Press, US, 143-154.
Ho, M.H., D.M. Wang and H.J. Hsieh. 2005. Preparation and characterization of RGD-
immobilized chitosan scaffolds. Biomaterials, 26(16), 3197-206.
Holub, D.J. and B.J. Holub. 2004. Omega-3 fatty acids from fish oils and cardiovascular
disease. Molecular and cellular biochemistry, Kluwer academic publishers,
Netherlands. 263, 217-225.
Honczaryk, A. and L.S. Maeda. 1998. Crescimento do pirarucu, arapaima gigas,
utilizando dieta à base de ensilado biológico de pescado. In: Simpósio Brasileiro de
Aqüicultura, 10, Anais. Recife: Persona, 2, 93-100.
Hoshino, T., T. Yamane and S. Shimuzu. 1990. Selective hydrolysis of fish oils by lipase
to concentrate ω3 polyunsaturated fatty acids. Agricultural Biological Chemistry,
54, 1459-1467.
Hu, F.B., L. Bronner, W.C. Willet, M.J. Stampfer, K.M. Rexrode, C.M. Albert, D. Hunter
and J.E. Manson. 2002. Fish and omega-3 fatty acid intake and risk of coronary
heart disease in women. Journal of American Medical Association, 287, 1815-
1821.
Hung, S.S.O. and S.J. Slinger. 1981. Studies of chemical methods for assessing oxidative
quality and storage stability of feeding oils. Journal of the American Oil Chemists'
Society, 58 (7), A785-A788.
Huss, H.H. 1988. Fresh fish quality and quality changes. Rome, Italy: FAO.
Ingesson, H., G. Zacchi, B. Yang, A.R. Esteghlalian and J.N. Saddler. 2001. The effect of
shaking regime on the rate and extent of enzymatic hydrolysis of cellulose. Journal
of Biotechnology, 88, 177-182.
Inuwa, H.M., I.A. Aimola, A. Muhammad, N. Habila, P. Okibe, M. Latayo and Z.
Ahmed. 2012. Isolation and determination of omega-9 fatty acids from Telfairia
Occidentalis. International Journal of Food Nutrition and Safety, 1(1), 9-14.

158
Ioannis S.A. and K. Aikaterini. 2008. Fish industry waste: treatments, environmental
impacts, current and potential uses. International Journal of Food Science and
Technology, 43, 726-745.
Iqbal S. and M.I. Bhanger. 2005. Stabilization of sunflower oil by garlic extract during
accelerated storage. Food Chemistry.
IUPAC. 1987. Standard Method, Preparation of fatty acid methyl ester, In standard
methods for the analysis of oils, fats and derivatives. Oxford, Blackwell, 7.
Ivanovic, S., B. Pisinov, D. Maslic-Strizak, B. Savic and Z. Stojanovic. 2012. Influence
of probiotics on quality of chicken meat. African Journal of Agricultural Research,
7(14), 2191-2196.
Iverson, S.J., S.L.C. Lang and M.H. Cooper. 2001. Comparison of the Bligh and Dyer
and Folch methods for total lipid determination in a broad range of marine tissue.
Lipids, 36, 11.
Jager, A.K., K.N. Petersen, G. Thomasen and S.B. Christenen. 2008. Isolation of linoleic
and alpha-linolenic acids as COX-1 and -2 inhibitors in rose hip. Phytotherapy
Research, 22(7), 982-984.
James, J. 2009. HAR- Herring Assessment Report.
Jang, M.K., B.G. Kong, Y.I. Jeong, C.H. Lee and J.W. Nah. 2004. Physicochemical
characterization of alpha – chitin, beta- chitin andgama – chitin separated from
natural resources. Journal of Polymer Science PartA: Polymer Chemistry, 42, 3423-
3432.
Jayathilakan, K., G.K. Sharma, K. Radhakrishna and A.S. Bawa. 2007. Antioxidant
potential of synthetic and natural antioxidants and its effect on warmed-over-
flavour in different species of meat. Food Chemistry, 105, 908-916.
Jensen, N.C., E. Fiskeindustri and E. Denmark. 1990. Quality fish meal: specifications
and use in aquaculture and fur farming. International By-products Conference.
Johnson, L.A. 1998. Recovery, refining, converting, and stabilizing edible fats and oils.
In: Akoh cc and min db (Eds), Food Lipids. New York: Marcel Dekker.
Junker, B., M. Lester, T. Brix, D. Wong and J.A. Nuechterlein. 2006. Next generation,
pilot-scale continuous sterilization system for fermentation media. Bioprocess
Biosystem Engineering, 28, 351-378.
Kahveci, D. and X. Xu. 2011. Enhancement of activity and selectivity of Candida rugosa
lipase and Candida antartica lipase A by bioimprinting and/or immobilization for
application in the selective ethanolysis of fish oil. Biotechnol Lett, 33(10):2065-71.
Kahveci, D. and X. Xu. 2012. Bioimprinted Immobilization of Candida antarctica Lipase
a for concentration of omega-3 polyunsaturated fatty acids. Journal of the American
Oil Chemists' Society, 89(10), 1839-1845.
Kang, K.Y., D.H. Ahn, S.M. Jung, D.H. Kim and B.S. Chun. 2005. Separation of protein
and fatty acids from tuna viscera using supercritical carbon dioxide. Biotechnology
and Bioprocess Engineering, 10, 315-321.

159
Kanner, J. and J.E. Kinsella. 1983. Journal of Agriculture and Food Chemistry, 31, 370-
379.
Kareska, S. 2010. Factors affecting hydrogen peroxidase activity. Essai, 7(27), 82-84.
Kates, M. and R.M. Baxter. 1962. Lipid composition of mesophilic and psychrophilic
yeasts (Candida species) as influenced by environmental temperature. Canadian
Journal of Biochemistry and Phvsiology, 40, 1213-1227.
Kato, S., N. Kunisawa and T. Kojima. 2004. Murakami, S. Evaluation of ozone treated
fish waste oil as a fuel for transportation. Journal of Chemical Engineering of
Japan, 37, 863-870.
Katsivela, E., F. Kleppe, S. Lang and S. Wagner. 1995. Ustilago maydis lipase I.
Hydrolysis and ester-synthesis activities of crude enzyme preparation. Enzyme and
Microbial Technology, 17, 739-745.
Ke, P.J., R.G. Ackman, B.A. Linke and D.A. Nash. 1977. Differential lipid oxidation in
various parts of frozen mackerel. Journal of Food Technology, 12, 37-47.
Kechaou, E.S., J. Dumay, C. Donnay-Moreno, P. Jaouen, J.P. Gouygou and Berg. 2009.
Enzymatic hydrolysis of cuttlefish (Sepia officinalis) and sardine (Sardina
pilchardus) viscera using commercial proteases: Effects on lipid distribution and
amino acid composition. Journal of Bioscience and Bioengineering, 107(2), 158-
164.
Kempka, A.P. 2011. Optimization of lipids enzymatic hydrolysis present in swine
slaughterhouse effluents. http://www.icef11.org/content/papers/few/FEW253.pdf.
(Retrived on September 29/2012).
Khan, S.H., B.M. Bhatti and R. Sardar. 2001. Acid value of vegetable oils and poultry
feed as affected by storage period and antioxidants. Pakistan Veterinary Journal,
21(4).
Khoddami, A., A.A. Ariffin, J. Bakar and H.M. Ghazali. 2009. Fatty acid profile of the
oil extracted from fish waste (head, intestine and liver) (Sardinella lemuru). World
Applied Sciences Journal, 7(1), 127-131.
Kinsella, J.E., B. Lokesh, S. Broughton and J. Whelan. 1990. Dietary polyunsaturated
fatty acids and eicosanoids: potential effects on the modulation of inflammatory
and immune cells: an overview. Nutrition, 6, 24-44.
Ki-Teak, L. and C. Akoh. 1998. Characterization of enzymatically synthesized structured
lipids containing eicosapentaenoic, docosahexaenoic, and caprylic acids. Journal of
the American Oil Chemists' Society, 75(4), 495-499.
Klaypradit, W., S. Kerdpiboon and R.K. Singh. 2010. Application of artificial neural
networks to predict the oxidation of menhaden fish oil obtained from fourier
transform infrared spectroscopy method. Food Bioprocess Technology,1-6.
Kleinschmidt M.G. and V.A. McMahon. 1970. Effect of growth temperature on the lipid
composition of Cyanidium caldarium. II Glycolipid and phospholipid
components. Plant Physiology, 46, 290-3.

160
Kolakowska, A., J. Olley and A.D. Graeme. 2003. Fish lipids-In: chemical and functional
properties of food lipids. CRC press, US, 221-264.
Kosoko, S.B., L.O. Sanni, A.A. Adebowale, A.O. Daramola and M.O. Oyelakin. 2009.
Effect of period of steaming and drying temperature on chemical properties of
cashew nut. African Journal of Food Science, 3(6), 156-164.
Kulkarni, S.R. and A.B. Pandit. 2005. Enzymatic hydrolysis of castor oil: An approach
for rate enhancement and enzyme economy. Indian Journal of Biotechnology. 4,
241-245.
Kumar, D. and B.V. Kabra. 2008. Photo-assisted oxidation of p-anisidine by fenton
reagent. International Journal of Chemical Science, 6(1), 36-44.
Kwon, T.W., H.E. Snyder and H.G. Brown. 1984. Oxidative stability of soybean oil at
different stages of refining. Journal of the American Oil Chemists’ Society,
61:1843-1846.
Labrinea, E.P., N.S. Thomaidis and C.A. Georgiou. 2001. Direct olive oil anisidine value
determination by flow injection. Analytica Chimica Acta, 448, 201-206.
Lanna, A.C., I.C. José, M.G. de Almeida-liveira, E.G. Barros and M.A. Moreira. 2005.
Effect of temperature on polyunsaturated fatty acid accumulation in soybean seeds.
Brazilian Journal of Plant Physiology, 17(2).
Lawson, L.D. and B.G. Hughes. 1988. Human absorption of fish oil fatty acids as
triacylglycerols, free fatty acids or ethyl esters, Biochemical and Biophysical
Research Communications, 152, 328-335.
Lee, K. and C.C. Akoh. 1998. Journal of American Oil Chemists’ Society, 75, 495-499.
Lee, Y. 2010. Effect on changing the temperature of pancreatic lipases on lipid digestion.
http://www.slideshare.net/wkkok1957/effect-of-ph-on-lipase-activity-measured-
using-ph-sensor. (Retrived on October 9/2012).
Lembke, P. 1997. Production of High Purity n-3 Fatty Acid Ethyl Esters by Process Scale
Supercritical Fluid Chromatography” in Supercritical Fluid Chromatography with
Packed Columns, Anton K., Berger C. Eds; Chromatographic Science Series
Vol.75; Marcel Dekker Inc.,429-43.
Lembke, P. 2011. Concentrating omega-3 oils –Supercritical fluid technology versus
molecular distillation. Retrieved on Dec 2/2012.
http://trophicproducts.com/CMS/MediaFree/file/Lembke2012.pdf.
Letisse, M., M. Rozieres, A. Hiol, M. Sergent and L. Comeau. 2006. Enrichment of EPA
and DHA from sardine by supercritical fluid extraction without organic modifier.I
optimization of extraction conditions. Journal of Supercritical Fluids, 38, 27-36.
Li, X., X. Fan, L. Han and Q. Lou. 2002. Fatty acids of some algae from the Bohai sea.
phytochemistry, 59, 157-161.
Liang, J.H. and L.S. Hwang. 2000. Fractionation of Squid Visceral Oil Ethyl Esters by
Short-Path Distillation. Journal American Oil Chemistry Society, 77(7): 773-775.

161
Liao, W., Z. Wen, S. Hurley, Y. Liu, C. Liu and S. Chen. 2005. Effect of hemicelluloses
and lignin on enzymatic hydrolysis of cellulose from dairy manure. Applied
Biochemistry and Biotechnology, 121/124, 1017-1029.
Liaset, B., E. Lied and M. Espe. 2000. Enzymatic hydrolysis of by-products from the
fish-filleting industry; chemical characterization and nutritional evaluation. Journal
of the Science of Food and Agriculture, 80, 581-589.
Liaset, B., R. Nortvedt, E. Lied and M. Espe. 2002. Studies on the nitrogen recovery in
enzymic hydrolysis of Atlanticsalmon (Salmo salar, L.) frames by Protamex™
protease. Process Biochemistry, 37, 1263-1269.
Liman, A.A., P. Egwin, M.A. Vunchi and C. Ayansi. 2010. Lipase activity in fermented
oil seeds of Africa locust bean, (Parkia Biglobosa), castor seeds (Ricinu
Communis) and African oil bean (Pentaclethra Macrophylla). Nigerian Journal of
Basic and Applied Science, 18(1), 136-140.
Lin, C.F., T.C.Y. Hsieh, J.B. Crowther and A.P. Bimbo. 1990. Efficiency of removing
volatiles from menhaden oils by refining, bleaching and deodorizing. Journal of
food science, 55:1669-1672.
Lin, C.Y. and R.J. Li. 2009. Fuel properties of biodiesel produced from the crude fish oil
from the soapstock of marine fish. Fuel Processing Technology, 90(1), 130-136.
Linder, M., J. Fanni and M. Parmentier. 2005. Proteolytic extraction of salmon oil and
PUFA concentration by lipases. Marine Biotechnology, 7, 70-76.
Lipid Library. 2012. Lipid chemistry, biology, technology & analysis. (Retrived on April
25/ 2012) http://lipidlibrary.aocs.org/index.html.
Liu, S., C. Zhang, P. Hong and H. Ji. 2006. Concentration of docosahexaenoic acid
(DHA) and eicosapentaenoic acid (EPA) of tuna oil by urea complexation:
optimization of process parameters. Journal of Food Engineering, 73(3), 203-209.
Lucas, S. 2000. An investigation into how the volume of lipase affects the rate of the
hydrolysis of lipids. Biology coursework.
Mancuso, J.R., D.J. McClements and E.A. Decker. 1999. The effects of surfactant type,
pH, and chelators on the oxidation of salmon oil-in-water emulsions. Journal of
Agricultural and Food Chemistry, 47(10), 4112-4116.
Manni, L., O. Ghorbel-Bellaaj, K. Jellouli, I. Younes and M. Nasri. 2010. Extraction and
characterization of chitin, chitosan, and protein hydrolysates prepared from shrimp
waste by treatment with crude protease from Bacillus cereus SV1. Applied
Biochemistry and Biotechnology, 162 (2), 345-357.
Marion, W.W. and R.H. Forsythe. 1964. Autoxidation of Turkey lipids. Journal paper
No.J-4755 of the Iowa agricultural and home economics experiment station, Ames,
Iowa. Project No. 1400.
Mathew, S. and E.T. Abraham. 2006. Studies on the antioxidant activities of cinnamon
bank extracts, through various in vitro models. Food Chemistry, 94, 520-528.

162
Mathur, S.P. 1994. Compost symposium. Economic viability of commercial composting
of fisheries waste by passive aeration. The compost council of Canada symposium.
Montreal, Canada.
Mbatia, B., D. Adlercreutza, P. Adlercreutza, A. Mahadhya, F. Mulaab and B.
Mattiassona. 2010. Enzymatic oil extraction and positional analysis of n-3 fatty
acids in Nile perch and salmon heads. Process Biochemistry, 45, 815-819.
McGill, A.S. and C.F. Moffat. 1992. Lipids, 27, 360.
Mckeigue, P. and L. Sevak. 1994. Coronary heart disease in South Asian communities.
London: Health education authority.
Medina, A.R., L.E. Cerdan, A.G. Gim´enez, B.C. Pa´ez, M.J.I. Gonz´alez and E.M.
Grima. 1999. Lipase-catalyzed esterification of glycerol and polyunsaturated fatty
acids from fish and microalgae oils. Journal of Biotechnology, 70, 379-391.
Megahed, M.G. 2011. Effect of microwave heating of linseed oil on the formation of
primary and secondary oxidation products. Agriculture and Biology Journal of
North America, 2(4), 673-679.
Meher, L.C., D. Vidya Sagar and S.N. Naik. 2006. Technical aspects of biodiesel
production by transesterification: a review. Renewable and sustainable energy
reviews, 10(3), 248-268.
Memon, N.N., F.N. Talpur and M.I. Bhanger. 2010. A comparison of proximate
composition and fatty acid profile of Indus river fish species. International Journal
of Food Properties, 13, 328-337.
Mendes, A., T.L. da Silva and A. Reis. 2007. DHA concentration and purification from
the marine heterotrophic microalga Crypthecodinium cohnii CCMP 316 by
winterization and urea complexation. Food Technology and Biotechnology, 45(1),
38-44.
Miller, M. 2010. Oxidation of food grade oils. www.plantandfood.com.
Mishra, R.K. and G.S. Singhai. 1992. Function of photosynthetic apparatus of intact
wheat leaves under high light and heat stress and its relationship with peroxidation
of thylakoid lipids. Plant Physiology, 98,1-6.
Mishra, V.K., F. Temelli and B. Ooraikul. 1993. Extraction and purification of omega-3
fatty acids with an emphasis on supercritical fluid extraction, a review. In food
research international, 26, 217-226.
Mitsuyoshi, K., Y. Hiramatsu, Y. Kawaguchi, M. Nakagawa, K. Hioki, M. Yamamoto,
T. Takata and M. Yamamura. 1991. Effects of eicosapentaenoic acid on lipid
metabolism in obesity treatment obseity surgery, 1, 165-169.
Miyashita, K. and T. Takagi. 1986. Study on the oxidative rate and prooxidant activity of
free fatty acids. Journal of the American Oil Chemists’ Society, 63:1380-1384.
Moore, S.R. and G.P. McNeill. 1996. Production of triglycerides enriched in long-chain
n-3 polyunsaturated fatty acids from fish oil. Journal of American Oil Chemists’
Society, 73, 1409-1414.

163
Mozaffarian, D., M.F. Jacobson and J.S. Greenstein. 2010. Food reformulations to reduce
trans fatty acids. New England Journal of Medicine, 362, 2037-2039.
Mukherjee, S. and A. Mitra. 2009. Health effects of palm oil. Journal of Human Ecology,
26(3), 197-203.
Mumper, R., J. Wang, J. Claspell and A.P. Rolland. 1995. Novel polymeric condensing
carriers for gene delivery. Proceedings International symposium controlled release
bioactive materials, 178-9.
Mussatto, S.I., G. Dragone, M. Fernandes, A.M.F. Milagres and I.C. Roberto. 2008. The
effect of agitation speed, enzyme loading and substrate concentration on enzymatic
hydrolysis of cellulose from brewer’s spent grain. Cellulose, 15, 711-721.
New, M. 1996. Responsible use of aquaculture feeds. Aquaculture Asia, 1, 3-15.
Newton, I. and D. Snyder. 1997. Nutritional aspects of long chain omega-3 fatty acids
and their use in bread enrichment. Cereal Foods World, 3, 126-131.
Nikkila, P. T. Johnsson, H. Rosenqvist and L. Toivonen. 1995. Effect of pH on growth
and fatty acid composition of Lactobacius bichneri and Lactobacius fermentum.
Humana press Inc.
Nilsang, S., S. Lertsiri, M. Suphantharika and A. Assavanig. 2005. Optimization of
enzymatic hydrolysis of fish soluble concentrate by commercial protease. Journal
of Food Engineering, 70, 571-578.
Norziah, M.H., J. Nuraini and K.Y. Lee. 2009. Studies on the extraction and
characterization of fish oil from wastes of seafood processing industry. Journal of
the Science of Food and Agriculture, 2(4), 959-973.
O’Brien, R.D. 2009. Fats and oils. Formulating and processing for applications, 3rd
ed.,
CRC press, London, 213-300.
Okada, T. and M.T. Morrissey. 2007. Production of n-3 polyunsaturated fatty acid
concentrates from sardine oil by lipase-catalyzed hydrolysis. Food Chemistry, 103,
1411-1419.
Oku, T., A. Sugawara, M. Choudhury, M. Komatsu, S. Yamada and S. Ando. 2009. Lipid
and fatty acid compositions differentiate between wild and cultured Japanese eel
(Anguilla japonica). Food Chemistry, 115, 436-440.
Oliveira, A. 2009. Purification of Pollock oil using short path distillation. Progress report,
Pollock conservation cooperative research center.
Olomu, J.M. and D.A. Nwachukwu. 1977. Nutritive value of locally prepared fishmeals
for broiler chickens. Nigerian Journal of Animal Production, 4(2), 24-30.
Olson, G.J. and L.O. Ingram. 1975. Effects of temperature and nutritional changes on the
fatty acids of agmenellum quadruplicatum. Journal of Bacteriology, 124(1), 373-
379.
Omega Protein. 2010. Animal nutrition products for crustaceans: Menhaden fish oil.
http://www.omeganutrient.com/products/aquaculture/20_menhaden-fish-
oil.aspx?Type=Crustaceans. (Retrieved on July 1/ 2012).

164
Ozogul, Y., A. Simşek, . Balikçi and M. Kenar. 2011. The effects of extraction
methods on the contents of fatty acids, especially EPA and DHA in marine lipids.
International Journal of Food Sciences and Nutrition.
Öztürk, B. 2001. Immobilization of lipase from Candida rugosa on hydrophobic and
hydrophilic supports. Master of Science thesis, İzmir institute of technology İzmir,
Turkey.
Pak, C.S. 2005. Stability and quality of fish oil during typical domestic application. Final
Project.Wonsan University of fisheries Kangwon Province, D.P.R. of Korea.
Palanisamy, U.D., M. Sivanathan, A.K. Radhakrishnan, N. Haleagrahara, T.
Subramaniam and G.S. Chiew. 2011. An effective ostrich oil bleaching technique
using peroxide value as an indicator. Molecules, 16, 5709-5719.
Pasoz, M., J.M. Gallardo, J.L. Torres and I. Medina. 2005. Activity of grape polyphones
as inhibitors of the oxidation of fish lipids and frozen fish muscle. Food Chemistry,
92, 547-557.
Patil, Y.T. and S.B. Satam. 2002. Chitin and chitosan. Treasure from crustacean shell
waste. Sea food Export Journal, 7, 31- 38.
Pawar, S.S. and H.C. Tidwell. 1968. Effect of ingestion of unsaturated fat on lipolytic
activity of rat tissues. Journal of Lipid Research, 9, 334.
Pettinello, G., A. Bertucco, P. Pallado and A. Stassi. 2000. Production of EPA enriched
mixtures by supercritical fluid chromatography: from the laboratory scale to the
pilot plant. Journal of Supercritical Fluids, 19, 51–60.
Piccolo, T. 2008. Frame work analysis of fish waste to bio-diesel production – Aquafinca
– case study, (Retrieved on September 12th
, 2009) www.aquaticbiofuel.com.
Pinton, M. 1998. Propane and Super critical extraction. Practical short course on
processing of nutraceuticals functional foods. Chapter 16.
Pontes-Arruda, A. 2009. Biological benefits of an oleic acid rich lipid emulsion for
parenteral nutrition. Clinical Nutrition Supplements, 4(1), 19-23.
Pratt, D.E. and B.J.F. Hudson. 1990. Natural antioxidants not exploited commercially. In
B.J.F. Hudson (Eds.), Amsterdam: Elsevier. Food antioxidants commercially. 171-
192.
Rabiei, V., S. Ghorbani and H. Hajnajari. 2011. Effect of temperature and storage period
of olive (Olea europaea cv. Zard) fruit on olive oil quality. Journal of Food,
Agriculture & Environment, 9(1), 74-77.
Radin, N.S. 1981. Extraction of tissue lipid with a solvent of low-toxicity. Methods in
Enzymology, 72, 5-9.
Rahmi, M., M. Faid, M. ElYachioui, B. El Hassan, M. Fakir and M. Ouhssine. 2008.
Protein rich ingredients from fish waste for sheep feeding. African Journal of
Microbiology Research, 2, 73-77.
Rashidova, S.S.H., R.Y. Milusheva, N.L. Voropaeva, S.R. Pulatova, G.V. Nikonovich
and I.N. Ruban. 2004. Isolation of chitin from a variety ofraw materials,

165
modification of the material, and interaction its derivativeswith metal ions.
Chromatographia, 59, 783-786.
Ratanyake, W.M.N., B. Olsson, D. Matthews and R.G. Ackman. 1988. Preparation of
omega-3 PUFA concentrates from fish oil via urea complexation. Fat Science
Technology, 90, 386-391.
Raufman, J. 2004. Pepsin. In: Encyclopedia of gastroenterology (Volume 3). L.R.
Johnson (ed.). Academic press, Amsterdam, Netherland, 147-148.
Raza, S.A., A. Rashid, J. William, S. Najaf and M. Arshad. 2009. Effect of synthetic
antioxidant on shelf life of locally manufactured butter known as Makhan in
Pakistan. Biharean Biologist, 3(2), 161-162.
Razak, Z.K.A., M. Basri, K. Dzulkefly, C.N.A. Razak and A.B. Salleh. 2001. Extraction
and characterization of fish oil from monopterus albus. Malaysian Journal of
Analytical Sciences, 7(1), 217-220.
Reuber, M.D. 1979. Carcinogenicity of chloroform. Environ. Health Perspect. 31, 171-
182.
Riaz, R.A. and M. Shaheen. 1994. Some factors affecting lipid-peroxidation in raw-milk
during bulk handling and storage. Journal of the Chemical Society of Pakistan,
16(2).
Rinaudo, H. 2006. Chitin and chitosan: properties and applications. Progress Polymer
Science, 31, 603- 632.
Rosa, M.D., A. Gambacorta and J.D. Bu'lock. 1974. Effects of pH and temperature on
the fatty acid composition of Bacillus acidocaldarius. Journal of Bacteriology,
117(1), 212-214.
Rossell, J.B. 1994. Rancidity in foods, in: J.C. Allen, R.J. Hamilton (Eds.), 3rd Edition,
Applied Science, Barking, London, (Chapter 2).
Rubio-Rodríguez, N., S.M. de Diego, S. Beltrán, I. Jaime, M.T. Sanz and J. Rovira. 2008.
Supercritical fluid extraction of the omega-3 rich oil contained in hake (Merluccius
capensis–Merluccius paradoxus) by-products: study of the influence of process
parameters on the extraction yield and oil quality. Journal of Supercritical Fluids,
47, 215-226.
Ruiz, F., S. Bolado, G. Gonzalez-Benito and M.T. Garcia-Cubero. 2009. Influence of
process parameters on the enzymatic hydrolysis of steam exploded wheat straw.
Chemical Engineering Transactions, 17, 1131-1136.
Sachindra, N.M., N. Bhaskar and N.S. Mahendrakar. 2006. Recovery of carotenoids from
shrimp waste in organic solvents. Waste Management, 26, 1092-1098.
Sachindra, N.M., N. Bhaskar, P.Z. Sakhare, N.S. Mahendrakar and D. Narasimha Rao.
2001. An improved process for recovery of carotenoids from crustacean waste.
Indian Patent 95/DEL/2001.
Sackman, J.R., S.K. Duckett, M.H. Gillis, C.E. Realimi, A.H. Parks, R.B. Eggelston.
2003. Effects of forage and sunflower oil levels on ruminal biohydrogenation of

166
fatty acids and conjugated linoleic acid formation in beef steers and finishing diets.
Jounal of Animal Science, 81, 3174-3181.
Saeed, S. and N.K. Howell. 2002. Effect of lipid oxidation and frozen storage on muscle
proteins of Atlantic mackerel. Journal of the Science of Food and Agriculture, 82,
579-586.
Saify, Z.S., S. Akhtar, K.M. Khan, S. Perveen, S.A.M. Ayattollahi, S. Hassan, M. Arif,
S.M. Haider, F. Ahmad, S. Siddiqui and M.Z. Khan. 2003. A Study on the fatty
acid composition of fish liver oil from two marine fish Eusphyra blochii and
Carcharhinus bleekeri. Turkish Journal of Chemistry, 27, 251-258.
Sang, M., M. Wang, L. Jianhui, Z. Chengwu and L. Aifen. 2012. Effects of temperature,
salinity, light intensity, and pH on the eicosapentaenoic acid production of
Pinguiococcus pyrenoidosus.
Sang, W. and Z.T. Jin. 2004. Lipid oxidation of fish liver oil as affected by light,
antioxidants and temperature. Journal of Food Processing and Preservation, 28(1),
1-10.
Sathivel, S., P.J. Bechtel, J. Babbitt, S. Smiley, C. Crapo, K.D. Reppond and W.
Prinyawiwatkul. 2003. Biochemical and functional properties of Herring (Clupea
harengus) by-product hydrolysates. Journal of Food Science, 68(7), 2196-2200.
Sathivel, S., W. Prinyawiwatkul, C.C. Grimm, J.M. King and S. Lloyd. 2002. FA
composition of crude oil recovered from catfish viscera. Journal of the American
Oil Chemist’s Society, 78, 989-992.
Sathivel, S., W. Priyanwiwatkul, J.M. King, C.C. Grimm and S. Lloyd. 2003. Oil
production from catfish viscera. Journal of American Oil Chemists’ Society, 80,
377-382.
Scrimgeour, C. 2005. Chemistry of fatty acids. Bailey's Industrial Oil and Fat Products.
See, S.F., L.L. Hoo and A.S. Babji. 2011. Optimiztion of enzymatic hydrolysis of Salmon
(Salmon salar) skin by Alcalase. International Food Research Journal, 18(4), 1359-
1365.
Senanayake, S.P.J.N. and F. Shahidi. 1999. Enzymatic incorporation of docosahexaenoic
acid into borage oil. Journal of American Oil Chemists’ Society, 76.9, 1009-1015.
Senanayake, S.P.J.N. and F. Shahidi. 2000. Concentration of DHA from algal oil via urea
complexation. Journal of Food Lipids, 7, 51-61.
Shahidi, F. 2008. Omega-3 oils: sources, applications, and health effects. In: Marine
nutraceuticals and functional foods. Barrow, C.; Shahidi, F (ed). CRC press,
Novascotia, Canada, 23-47.
Shahidi, F. and H. Miraliakbari. 2006. Marine oils: compositional characteristics and
health effects. In: Nutraceuticals and specialty lipids and their co-products. CRC
press, US, 227-247.

167
Shaw, W. 2001. An update for Canadian tuna fisheries in the North and South Pacific
Ocean through 2000. Fisheries and Oceans Canada Fisheries Management Branch
Nanaimo, B.C., Canada V9T 1K3, 1-9.
Shelbaya, L.A.M., A.A.A. Sello and M.A. Kotp. 2011. Anti-oxidative effect of some
malva sylvestris extracts on oxidation of cotton oil during heating. Mansoura
University – Egypt.
Shirai, N., H. Suzuki, S. Toukairin and S. Wada. 2001. Spawning and season affect lipid
content and fatty acid composition of ovary and liver in Japanese catfish.
Comparative Biochemistry and Physiology Part B, 129, 185 -195.
Shuang, D., Y. Jiang-Ke and Y. Yun-Jun. 2009. Optimization of lipase-catalyzed
acidolysis of soybean oil to produce structured lipids. Journal of Food
Biochemistry, 33, 442-452.
Simic, M.G., K.A. Taylor, J.F. Ward and C. Von Sonntag. 1988. Oxygen radicals in
biology and medicine, Plenum Press, New York, NY.
Simopoulos, A.P. 1991. Omega-3 fatty acids in health and disease and in growth and
development. American Journal Clinical Nutrition, 54, 438-463.
Simopoulos, A.P. 2004. Omega-3 fatty acids and antioxidants in edible wild plants.
Biology Research, 37, 263-277.
Singh, M. 2005. Essential fatty acids, DHA and human brain. Indian Journal of Pediatrics
Mar, 72(3), 239-42.
Siriamornpun, S., D. Li, L. Yang, S. Suttajit and M. Suttajit. 2006. Variation of lipid and
fatty acid compositions in Thai Perilla seeds grown at different locations.
Songklanakarin Journal of Science and Technology, 28(1), 17-21.
Sirin, O., T.Y. Didem Omay and Y. Guvenilir. 2005. Effect of different parameters on the
enrichment of DHA by enzymatic hydrolysis from cod liver oil. Poster
presentation, Deptment of chemical engineering, Istanbul Technical University,
Istanbul, Turkey.
Slizyte, R., T. Rustad and I. Storro. 2005. Enzymatic hydrolysis of cod (Gadus morhua)
by-products optimization of yield and properties of lipid and protein fractions.
Process Biochemistry, 40, 3680-3692.
Smedes, F. 1999. Determination of total lipid using non-chlorinated solvents. Analyst,
124, 1711-1718.
Smedes, F. and T.K. Askland. 1999. Revisiting the Development of the Bligh and Dyer
total lipid determination method, Marine Pollution Bulletin, 38, 193-201.
Sneha, K.A. 2008. Production of eicosapentaenoic acid from biodiesel derived crude
glycerol using fungal culture. Master of Science, Thesis.
Sotolu, A.O. 2009. Comparative utilizations of fish waste meal with imported fishmeal
by African catfish (Clarias gariepinus). American-Eurasian Journal of Scientific
Research, 4 (4), 285-289.
Soumanou, M.M., U.T. Bornscheuer and R.D. Schmid. 1998. Ibid., 75, 703–710.

168
Srinivasan, S., Y.L. Xiong and E.A. Decker. 1996. Inhibition of protein and lipid
oxidation in beef heart surimi-like material by antioxidants and combinations of
pH, NaCl, and buffer type in the washing media. Journal of Agricultural and Food
Chemistry, 44 (1), 119-125.
SR-MJOL HF. 2011. The production process, (Retrieved on Feb 15th
2011)
http://www.srmjol.is/srmjol/content/view/19/34/.
St. Angelo, A.J. 1996. Lipid oxidation in foods. Critical reviews. Food Science and
Nutrition, 36, 175-224.
Stout, V.F. and J. Spinelli. 1987. US patent. 4.675,132.
Stout, V.F., W.B. Nilsson, J. Krzynowek and H. Schlenk. 1990. Fractionation of fish oils
and their fatty acids. In fish oils in nutrition. ed. M.E. Standby, Van Nostrand
Reinhold, New York, NY, 73-119.
Strlič, M., I.K. Cigić, I. Rabin, J. Kolar, B. Pihlar and M. Cassar. 2009. Autoxidation of
lipids in parchment, polymer degradation stability, 94, 886-890.
Strocchi, A. and G. Bonaga. 1975. Correlation between urea inclusion compounds and
comformational structure of unsaturated C-18 fatty acid methyl esters. Chemical
Physical Lipids, 15, 87-94.
Suja, K.P., J.T. Abraham, S.N. Thamizh, A. Jayalekshmy and C. Arumughan. 2004.
Antioxidant efficacy of sesame cake extract in vegetable oil protection. Food
Chemistry, 84, 393-400.
Sun, H., Z. Chen, P. Wen, H. Lei, J. Shi, M. Huang and J. Wang. 2012. Optimization of
enzymatic hydrolysis conditions for preparation of gingko pepides from ginkgo
nuts. International Journal of Food Engineering, 8(1), 1-17.
Sun, T., G.M. Pigott and R.P. Herwig. 2002. Lipase-assisted concentration of n-3
polyunsaturated fatty acids from viscera of farmed Atlantic salmon (Salmo salar
L). Journal of Food Science, 67, 1.
Swapna C.H., B. Bijinu, K.R. Amit and N. Bhaskar. 2011. Simultaneous recovery of
lipids and proteins by enzymatic hydrolysis of fish industry waste using different
commercial proteases. Applied Biochemistry and Biotechnology, 164, 115–124.
Swapna, H.C., K.R. Amit, N. Bhaskar and N.M. Sachindra. 2010. Lipid classes and fatty
acid profile of selected Indian fresh water fishes. Journal of Food Science and
Technology, 47, 394-400.
Tanaka, Y., J. Hirano and T. Tunada. 1992. Concentartion of docohexaenoic acid in
glyceride by hydrolysis of fish oil with Candida cylindracea lipase. Journal of
American Oil Chemists’ Soceity, 69(12), 1210-1214.
Tang, S., C. Qin, H. Wang, S. Li and S. Tian. 2011. Study on supercritical extraction of
lipids and enrichment of DHA from oil-rich microalgae. The Journal of
Supercritical Fluids, 57(1), 44-49.

169
Tian, Q.H., X.Y. Guo, Y. Xue, Y. YI and Z.H. Li. 2010. Kinetics of oxidation-
precipitation of cobalt from solution by ozone. Transations of Nonferrous Metals
Society of China, 20, s42-s45.
Tickell, J. 2000. From the fryer to the fuel tank: complete guide to using vegetable oil as
an alternative fuel. 3rd Edition. Tickell Energy Consulting, Tallahassee, FL. 162.
Tor, C. and H. Yi. 2001. Polyunsaturated fatty acid concentrates from borage and linseed
oil fatty acid. Journal of America Oil Chemists’ Society, 78(5), 485-488.
Tsimidou, M., E. Papavergou and D. Boskou. 1995. Evaluation of oregano antioxidant
activity in mackerel oil. Food Research International, 28, 431-433.
Turner, R., C.H. McLean and K.M. Silvers. 2006. Are the health benefits of fish oils
limited by products of oxidation? Nutrition Research Reviews, 19(1), 53-62.
Undeland, I. 1998. Lipid oxidation in fillets of herring (Clupea harengus) during
processing and storage. Ph.D.Thesis, Chalmers University of Technology,
Goteborg, Sweden.
UNEP. 2000. Cleaner production assessment in fish processing. Danish environmental
protection agency. COWI consulting engineers and planners AS, Denmark, 7-14.
Ustun, G., S. Goner, G. Arer, S. Torkay and A.T. Erciyes. 1997. Enzymatic hydrolysis of
anchovy oil: production of glycerides enriched in polyunsaturated fatty acids.
Applied Biochemistry and Biotechnology, 68, 171-186.
Vannuccini, S. 2004. Fish utilization. In:Wijkstorm, U., Gumy, A., Graigner, R. (Eds.),
The state of World fisheries and aquaculture. Food and Agriculture Organization of
the United Nations, Rome, Italy, 56–58.
Vijaimohan, K., M. Jainu, K.E. Sabitha, S. Subramaniyam, C. Anandhan, Shyamala and
C. Devi. 2006. Beneficial effects of alpha linolenic acid rich flaxseed oil on growth
performance and hepatic cholesterol metabolism in high fat diet fed rats. Life
Science, 79, 448-454.
Wanasundara, U.N. 1996. Stabilization, structural characterization and omega-3 fatty
acid concentration. PhD thesis submitted to Memorial University of Newfoundland,
Canada. 36-337.
Wanasundara, U.N. and F. Shahidi. 1998. Lipase-assisted concentration of omega-3
polyunsaturated fatty acids in acylglycerol form from marine oils. Journal
American Oil Chemists’ Society, 75, 945-951.
Wanasundara, U.N. and F. Shahidi. 1999. Concentration of omega 3-polyunsaturated
fatty acids of seal blubber oil by urea complexation: optimization of reaction
conditions. Food Chemistry, 65, 41-49.
Wanasundara, U.N., F. Shahidi and R. Amarowicz. 1998. Effect of processing on
constituents and oxidative stability of marine oils. Journal of Food Lipids, 5, 29-41.
Wannahari, R. and M.F.N. Nordin. 2012. Reduction of peroxide value in used palm
cooking oil using bagasse adsorbent. American International Journal of
Contemporary Research, 2(1), 185.

170
Ward, O.P. and A. Singh. 2005. Omega-3/6 fatty acids: alternative sources of production.
Process Biochemistry, 40, 3627-3652.
Ware, D.M. 1991. Climate, predators and prey: Behaviour of a linked oscillating system.
In T. Kawasaki, S. Tanaka, Y. Toba, and A. Taniguch (Eds.), Proceedings of the
international symposium on long-term variability of pelagic fish populations and
their environment, November 1989. Tokyo: Pergamon Press, 279-291.
WBC (Worthington Biochemical Corporation). 2012. Introduction to enzyme
http://www.worthington-biochem.com/introbiochem/default.html. (Retrived on
september 25/ 2012).
Wettasinghe, M. and F. Shahidi. 1999. Antioxidant and free radical scavenging properties
of ethanolic extracts of defatted borage seeds. Food Chemistry, 67, 399-414.
Wijesundara, R.C., W.M.N. Ratnayake and R.G. Ackman. 1989. EPA geometrical isomer
artifacts in heated fish oil esters. Journal of the American Oil Chemists’ Society,
66: 1822:1830.
Wrolstad, R.E., E.A. Decker and S.J. Schwartz. 2005. Handbook of food analytical
chemistry, water, proteins, enzymes, lipids, and carbohydrates. Science, 606.
Wu, T.H. and P.J. Bechtel. 2008. Salmon by-product storage and oil extraction. Food
Chemistry, 111, 868–871.
Xiangjin, F. and D. Yali. 2011. The Effect of Temperature on the Lipid Oxidation of
Coix Seed. http://ieeexplore.ieee.org/stamp/stamp.jsp?tp=&arnumber=5943932
(Retrived on September 26/2012).
Xuebing, X. 2000. Production of specific-structured triacylglycerols by lipase-catalyzed
reactions: a review. European Journal of Pharmaceutics and Biopharmaceutics,
102:287-303.
Yanez, R., J.L. Alonso and J.C. Parajo. 2006. Enzymatic saccharification of hydrogen-
peroxide treated solids from hydro thermal processing of rice husks. Process
Biochemistry, 41, 1244-1252.
Yang, F., W.J. Su, B.J. Lu, T. Wu, L.C. Sun, K. Hara and M.J. Cao. 2009. Purification
and characterization of chymotrypsins from the hepatopancreas of crucian carp
(Carassius auratus). Food Chemistry, 116 (4), 860-866.
Zehnder, C.T. and C.E. McMichael. 1967. Deodorization, principles and practices.
Journal American Oil Chemistry Society, 44(10): 478A-512A.
Zhang, P., T. Austad and S.U. College. 2005. The relative effects of acid number and
temperature on chalk wettability. Society of Petroleum Engineers.
Zhang, S.B., Z. Wang and S.Y. Xu. 2007. Optimization of the aqueous extraction of
rapeseed oil and protein hydrolysates. Journal of the American Oil Chemists’
Society, 84, 97-105.
Zhong, Y., T. Madhujith, N. Mahfouz and F. Shahidi. 2007. Compositional
characteristics of muscle and visceral oil from steelhead trout and their oxidative
stability. Food Chemistry, 104, 602-608.

171
Zhou, S. and R.G. Ackman. 1995. Storage of lipids in the myosepta of Atlantic salmon
(Salmo salar). Fish Physiology Biochemistry, 14, 171.
Zuñiga, M.E., C. Soto, A. Mora, R. Chamy and J.M. Lema. 2003. Enzymatic pre-
treatment of Gevuina avellana mol oil extraction by pressing. Process
Biochemistry, 39(1), 51-57.
Zuta, C.P. 2003. Synthesis of novel triglycerides from mackerel by-products and
vegetable oils. PhD thesis submitted to McGill University, Montreal, Canada, 20-
200.

172
APPENDIX A: Enzymatic Hydrolysis Data

173
Table A1. Recovery of fish oil extracted using enzymatic hydrolysis at 55°C.
pH Replicates Enzyme load (%) Oil recovered (g)
7.0 1 0.5 0.97
2 0.91
3 1.02
Average 0.96
1 1.0 1.12
2 1.15
3 1.08
Average 1.11
1 2.0 1.45
2 1.39
3 1.48
Average 1.44
7.5 1 0.5 1.13
2 1.21
3 1.24
Average 1.19
1 1.0 1.65
2 1.59
3 1.56
Average 1.60
1 2.0 1.80
2 1.74
3 1.81
Average 1.78
8.0 1 0.5 0.98
2 1.02
3 1.01
Average 1.003
1 1.0 1.38
2 1.30
3 1.32
Average 1.33
1 2.0 1.43
2 1.46
3 1.51
Average 1.46

174
Table A2. Recovery of fish oil extracted using enzymatic hydrolysis at 70°C.
pH Replicates Enzyme load (%) Oil recovered (g)
7.0 1 0.5 0.42
2 0.37
3 0.43
Average 0.40
1 1.0 0.55
2 0.62
3 0.59
Average 0.58
1 2.0 0.69
2 0.68
3 0.66
Average 0.67
7.5 1 0.5 0.72
2 0.61
3 0.60
Average 0.64
1 1.0 0.76
2 0.82
3 0.85
Average 0.81
1 2.0 1.41
2 1.45
3 1.30
Average 1.38
8.0 1 0.5 0.48
2 0.50
3 0.57
Average 0.51
1 1.0 0.83
2 0.85
3 0.80
Average 0.82
1 2.0 0.98
2 0.90
3 0.88
Average 0.92

175
Table A3. Chemical analysis of fish oil obtained using enzymatic hydrolysis at 55°C.
pH Replicates Enzyme load
(%)
Peroxide value
(Meq/g)
Acid value
(mg KOH/g)
p-Anisidine
value
7.0 1 0.5 26.98 7.33 56.21
2 26.23 8.05 57.22
3 27.14 7.92 57.37
Average 26.78 7.76 56.93
1 1.0 27.75 9.26 60.65
2 28.07 9.04 59.49
3 28.62 9.51 59.76
Average 28.14 9.27 59.96
1 2.0 32.33 9.89 63.51
2 31.71 9.95 64.44
3 32.56 10.20 64.08
Average 32.20 10.01 64.01
7.5 1 0.5 36.63 8.45 58.48
2 35.80 8.73 59.32
3 35.95 8.01 58.75
Average 36.12 8.39 58.85
1 1.0 28.02 10.18 58.96
2 27.53 10.11 59.53
3 28.88 10.06 59.61
Average 28.14 10.11 59.36
1 2.0 31.11 11.39 58.40
2 31.78 11.42 58.05
3 31.44 10.60 58.38
Average 31.44 11.13 58.27
8.0 1 0.5 37.16 7.72 64.26
2 38.05 8.85 64.74
3 37.53 8.26 63.90
Average 37.58 8.27 64.30
1 1.0 35.24 8.90 59.81
2 35.77 7.67 60.49
3 35.12 8.73 59.77
Average 35.37 8.43 60.02
1 2.0 39.01 8.10 62.10
2 39.00 9.17 62.53
3 38.87 8.66 62.36
Average 38.96 8.64 62.33

176
Table A4. Chemical analysis of fish oil obtained using enzymatic hydrolysis at 70°C.
pH Replicates Enzyme load
(%)
Peroxide value
(Meq/g)
Acid value
(mg KOH/g)
p-anisidine
value
7.0 1 0.5 37.25 9.21 61.36
2 37.31 8.64 61.68
3 36.92 9.83 60.24
Average 37.16 9.22 61.09
1 1.0 38.76 12.34 64.30
2 39.04 12.70 64.51
3 39.60 12.56 64.36
Average 39.13 12.53 64.39
1 2.0 40.48 15.75 65.93
2 40.91 15.22 66.52
3 40.72 14.89 65.99
Average 40.70 15.28 66.14
7.5 1 0.5 36.55 13.11 62.76
2 37.26 13.04 62.04
3 36.19 12.62 62.09
Average 36.66 12.92 62.29
1 1.0 38.80 15.66 64.94
2 38.33 14.00 65.21
3 38.57 14.53 65.47
Average 38.56 14.73 65.20
1 2.0 39.45 17.59 66.72
2 38.22 16.65 67.58
3 39.18 17.28 67.30
Average 38.95 17.17 67.20
8.0 1 0.5 40.27 16.02 68.44
2 40.99 16.41 68.06
3 41.20 16.35 69.71
Average 40.82 16.26 68.73
1 1.0 37.88 18.38 65.68
2 37.31 17.71 64.97
3 36.79 18.07 65.11
Average 37.32 18.05 65.25
1 2.0 41.50 19.50 69.61
2 42.14 20.05 70.04
3 41.75 19.89 69.84
Average 41.79 19.81 69.83
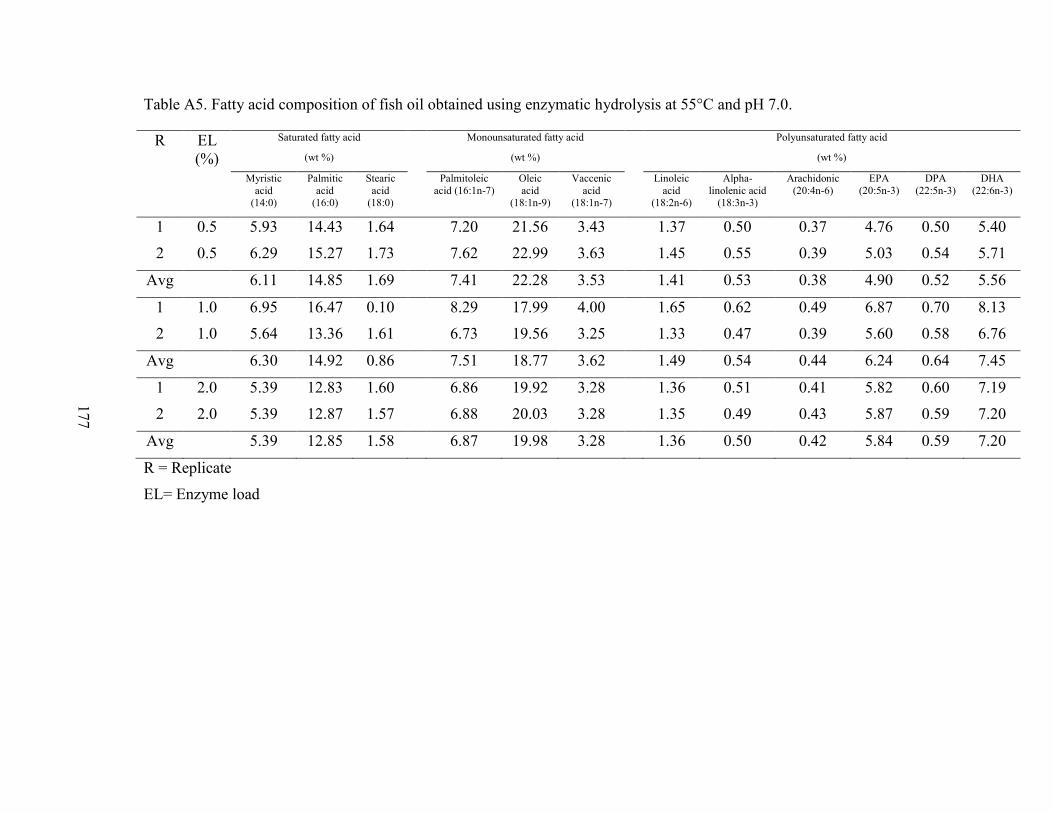
177
Table A5. Fatty acid composition of fish oil obtained using enzymatic hydrolysis at 55°C and pH 7.0.
R EL
(%)
Saturated fatty acid
(wt %)
Monounsaturated fatty acid
(wt %)
Polyunsaturated fatty acid
(wt %)
Myristic
acid (14:0)
Palmitic
acid (16:0)
Stearic
acid (18:0)
Palmitoleic
acid (16:1n-7)
Oleic
acid (18:1n-9)
Vaccenic
acid (18:1n-7)
Linoleic
acid (18:2n-6)
Αlpha-
linolenic acid (18:3n-3)
Arachidonic
(20:4n-6)
EPA
(20:5n-3)
DPA
(22:5n-3)
DHA
(22:6n-3)
1 0.5 5.93 14.43 1.64 7.20 21.56 3.43 1.37 0.50 0.37 4.76 0.50 5.40
2 0.5 6.29 15.27 1.73 7.62 22.99 3.63 1.45 0.55 0.39 5.03 0.54 5.71
Avg 6.11 14.85 1.69 7.41 22.28 3.53 1.41 0.53 0.38 4.90 0.52 5.56
1 1.0 6.95 16.47 0.10 8.29 17.99 4.00 1.65 0.62 0.49 6.87 0.70 8.13
2 1.0 5.64 13.36 1.61 6.73 19.56 3.25 1.33 0.47 0.39 5.60 0.58 6.76
Avg 6.30 14.92 0.86 7.51 18.77 3.62 1.49 0.54 0.44 6.24 0.64 7.45
1 2.0 5.39 12.83 1.60 6.86 19.92 3.28 1.36 0.51 0.41 5.82 0.60 7.19
2 2.0 5.39 12.87 1.57 6.88 20.03 3.28 1.35 0.49 0.43 5.87 0.59 7.20
Avg 5.39 12.85 1.58 6.87 19.98 3.28 1.36 0.50 0.42 5.84 0.59 7.20
R = Replicate
EL= Enzyme load
177

178
Table A6. Fatty acid composition of fish oil obtained using enzymatic hydrolysis at 55°C and pH 7.5.
R EL
(%)
Saturated fatty acid
(wt %)
Monounsaturated fatty acid
(wt %)
Polyunsaturated fatty acid
(wt %)
Myristic
acid (14:0)
Palmitic
acid (16:0)
Stearic
acid (18:0)
Palmitoleic
acid (16:1n-7)
Oleic
acid (18:1n-9)
Vaccenic
acid (18:1n-7)
Linoleic
acid (18:2n-6)
Αlpha-
linolenic acid (18:3n-3)
Arachidonic
(20:4n-6)
EPA
(20:5n-3)
DPA
(22:5n-3)
DHA
(22:6n-3)
1 0.5 6.58 15.13 1.70 7.76 22.35 3.65 1.54 0.59 0.43 6.00 0.72 6.89
2 0.5 6.62 15.11 1.67 7.75 23.07 3.63 1.54 0.60 0.42 5.93 0.69 6.80
Avg 6.60 15.12 1.68 7.76 22.71 3.64 1.54 0.60 0.42 5.97 0.71 6.84
1 1.0 6.66 15.14 0.04 8.00 23.16 3.76 1.57 0.57 0.43 6.17 0.72 7.03
2 1.0 5.77 13.09 1.45 6.92 20.05 3.25 1.36 0.56 0.36 5.33 0.56 6.17
Avg 6.22 14.11 0.74 7.46 21.61 3.51 1.46 0.57 0.39 5.75 0.64 6.60
1 2.0 5.74 12.94 1.42 6.80 19.58 3.21 1.36 0.41 0.37 5.43 0.58 6.32
2 2.0 5.89 13.27 0.03 6.97 20.09 3.26 1.40 0.30 0.38 5.56 0.58 6.51
Avg 5.81 13.10 0.73 6.88 19.84 3.23 1.38 0.36 0.38 5.50 0.58 6.41
R = Replicate
EL= Enzyme load
178

179
Table A7. Fatty acid composition of fish oil obtained using enzymatic hydrolysis at 55°C and pH 8.0.
R EL
(%)
Saturated fatty acid
(wt %)
Monounsaturated fatty acid
(wt %)
Polyunsaturated fatty acid
(wt %)
Myristic
acid (14:0)
Palmitic
acid (16:0)
Stearic
acid (18:0)
Palmitoleic
acid (16:1n-7)
Oleic
acid (18:1n-9)
Vaccenic
acid (18:1n-7)
Linoleic
acid (18:2n-6)
Αlpha-
linolenic acid (18:3n-3)
Arachidonic
(20:4n-6)
EPA
(20:5n-3)
DPA
(22:5n-3)
DHA
(22:6n-3)
1 0.5 6.39 15.31 0.05 7.99 23.96 3.84 1.57 0.49 0.43 6.17 0.52 7.17
2 0.5 6.19 14.94 1.67 7.79 23.47 3.78 1.52 0.62 0.45 6.14 0.63 7.04
Avg 6.29 15.12 0.86 7.89 23.72 3.81 1.55 0.56 0.44 6.15 057 7.11
1 1.0 6.22 15.13 1.70 7.83 23.67 3.83 1.52 0.57 0.43 6.11 0.63 7.12
2 1.0 6.19 15.12 1.69 7.85 23.60 3.81 1.51 0.62 0.44 6.06 0.63 7.10
Avg 6.20 15.13 1.69 7.84 23.64 3.82 1.51 0.60 0.43 6.08 0.63 7.11
1 2.0 6.36 15.55 1.65 7.94 23.91 3.80 1.51 0.55 0.41 6.12 0.63 7.10
2 2.0 6.25 15.29 1.70 7.81 23.73 3.82 1.51 0.62 0.42 6.11 0.62 7.18
Avg 6.30 15.42 1.67 7.88 23.82 3.81 1.51 0.59 0.42 6.11 0.63 7.14
R = Replicate
EL= Enzyme load
179

180
Table A8. Fatty acid composition of fish oil obtained using enzymatic hydrolysis at 70°C and pH 7.0.
R = Replicate
EL= Enzyme load
R EL
(%)
Saturated fatty acid
(wt %)
Monounsaturated fatty acid
(wt %)
Polyunsaturated fatty acid
(wt %)
Myristic
acid
(14:0)
Palmitic
acid
(16:0)
Stearic
acid
(18:0)
Palmitoleic
acid
(16:1n-7)
Oleic
acid
(18:1n-9)
Vaccenic
acid
(18:1n-7)
Linoleic
acid
(18:2n-6)
Αlpha-
linolenic acid
(18:3n-3)
Arachidonic
(20:4n-6)
EPA
(20:5n-3)
DPA
(22:5n-3)
DHA
(22:6n-3)
1 0.5 5.56 13.26 1.50 7.10 20.67 3.57 1.35 0.53 0.42 5.37 0.52 6.76
2 0.5 7.00 16.70 1.95 8.94 20.71 4.51 1.72 0.71 0.52 6.78 0.66 8.57
Avg 6.28 14.98 1.73 8.02 20.69 4.04 1.53 0.62 0.47 6.07 0.59 7.66
1 1.0 5.62 13.27 1.51 7.05 21.40 3.42 1.36 0.57 0.39 5.39 0.55 6.47
2 1.0 5.75 13.58 1.55 7.21 21.91 3.51 1.40 0.59 0.40 5.52 0.56 6.59
Avg 5.68 13.42 1.53 7.13 21.65 3.47 1.38 0.58 0.39 5.46 0.56 6.53
1 2.0 6.91 16.22 1.85 9.06 21.75 4.44 1.76 0.73 0.51 7.02 0.72 8.38
2 2.0 6.91 16.19 1.85 9.07 21.63 4.47 1.76 0.73 0.52 7.02 0.71 8.39
Avg 6.91 16.21 1.85 9.06 21.69 4.45 1.76 0.73 0.51 7.02 0.72 8.39
180

181
Table A9. Fatty acid composition of fish oil obtained using enzymatic hydrolysis at 70°C and pH 7.5.
R EL
(%)
Saturated fatty acid
(wt %)
Monounsaturated fatty acid
(wt %)
Polyunsaturated fatty acid
(wt %)
Myristic
acid (14:0)
Palmitic
acid (16:0)
Stearic
acid (18:0)
Palmitoleic
acid (16:1n-7)
Oleic
acid (18:1n-9)
Vaccenic
acid (18:1n-7)
Linoleic
acid (18:2n-6)
Αlpha-
linolenic acid (18:3n-3)
Arachidonic
(20:4n-6)
EPA
(20:5n-3)
DPA
(22:5n-3)
DHA
(22:6n-3)
1 0.5 6.88 14.53 1.62 7.47 21.35 3.47 1.48 0.71 0.45 5.96 0.67 6.94
2 0.5 7.90 16.72 1.85 8.52 19.22 3.99 1.68 0.80 0.47 6.86 0.75 7.96
Avg 7.39 15.63 1.74 8.00 20.30 3.73 1.58 0.75 0.46 6.41 0.71 7.45
1 1.0 6.84 14.21 1.54 7.39 21.10 3.34 1.47 0.71 0.43 6.15 0.66 7.17
2 1.0 7.48 15.51 1.70 7.94 23.14 3.66 1.61 0.78 0.47 6.80 0.76 7.93
Avg 7.16 14.87 1.62 7.67 22.13 3.50 1.54 0.75 0.45 6.48 0.71 7.55
1 2.0 7.78 17.41 1.95 6.98 19.63 4.12 1.67 0.78 0.48 6.71 0.72 6.91
2 2.0 7.44 16.63 1.86 5.83 20.27 3.98 1.59 0.75 0.47 6.41 0.72 5.15
Avg 7.61 17.03 1.91 6.41 19.96 4.05 1.63 0.77 0.47 6.57 0.72 6.03
R = Replicate
EL= Enzyme load
181

182
Table A10. Fatty acid composition of fish oil obtained using enzymatic hydrolysis at 70°C and pH 8.0.
R EL
(%)
Saturated fatty acid
(wt %)
Monounsaturated fatty acid
(wt %)
Polyunsaturated fatty acid
(wt %)
Myristic
acid (14:0)
Palmitic
acid (16:0)
Stearic
acid (18:0)
Palmitoleic
acid (16:1n-7)
Oleic
acid (18:1n-9)
Vaccenic
acid (18:1n-7)
Linoleic
acid (18:2n-6)
Αlpha-
linolenic acid (18:3n-3)
Arachidonic
(20:4n-6)
EPA
(20:5n-3)
DPA
(22:5n-3)
DHA
(22:6n-3)
1 0.5 7.01 15.81 1.07 7.87 15.58 3.88 1.61 0.77 0.47 6.54 0.72 7.69
2 0.5 6.23 14.03 1.60 6.79 22.16 3.48 1.45 0.70 0.45 5.89 0.65 6.92
Avg 6.63 14.93 1.34 7.34 18.89 3.68 1.53 0.74 0.46 6.22 0.69 7.31
1 1.0 6.60 14.70 1.68 7.89 17.75 3.80 1.42 0.60 0.42 5.04 0.57 5.91
2 1.0 6.77 15.01 1.71 8.22 20.82 4.00 1.43 0.57 0.38 5.15 0.57 6.08
Avg 6.69 14.85 1.70 8.06 19.30 3.90 1.43 0.59 0.40 5.10 0.57 6.00
1 2.0 7.51 16.48 1.90 8.73 16.66 4.12 1.66 0.80 0.56 6.40 0.78 7.58
2 2.0 7.77 17.10 1.93 8.97 11.66 4.34 1.68 0.79 0.47 6.57 0.71 7.78
Avg 7.65 16.81 1.91 8.86 14.18 4.23 1.67 0.80 0.51 6.49 0.74 7.69
R = Replicate
EL= Enzyme load
182

183
APPENDIX B: Chemical Extraction Data

184
Table B1. Recovery and chemical analysis of fish oil extracted using the Bligh and Dyer method.
Replicates Oil recovered
(g/100g)
Recovery oil yield
(%)
Solvent recovery
(%)
Peroxide value
(Meq/g)
Acid value
(mg KOH/g)
p-anisidine
value
1 8.80 99.77 91.0 12.054 5.149 9.066
2 8.23 93.31 89.0 12.041 5.033 9.704
3 8.68 98.41 91.5 12.034 5.142 9.227
Average 8.57 97.16 90.5 12.043 5.108 9.332
184

185
Table B2. Fatty acid composition of fish oil obtained using the Bligh and Dyer method.
R= Replicate
A= Average
R Saturated fatty acid
(wt %)
Monounsaturated fatty acid
(wt %)
Polyunsaturated fatty acid
(wt %)
Myristic
acid (14:0)
Palmitic
acid (16:0)
Stearic
acid (18:0)
Palmitoleic
acid (16:1n-7)
Oleic acid
(18:1n-9)
Vaccenic
acid (18:1n-7)
Linoleic
acid (18:2n-6)
Αlpha-
linolenic acid (18:3n-3)
Arachidonic
(20:4n-6)
EPA
(20:5n-3)
DPA
(22:5n-3)
DHA
(22:6n-3)
1 5.446 14.979 1.760 6.780 19.564 3.407 1.170 0.485 0.383 4.458 0.438 5.910
2 5.481 14.307 1.762 6.590 19.955 3.407 1.171 0.463 0.370 4.453 0.447 5.933
A 5.464 14.643 1.761 6.685 19.760 3.407 1.171 0.474 0.377 4.456 0.443 5.922
185

186
APPENDIX C: Enzymatic Extraction of Omega-3 Fatty Acid Data

187
Table C1. Fatty acid composition of omega-3 fatty acids recovered using enzymatic
hydrolysis (wt %).
Sample Replicates EPA DPA
DHA
CFS 1 6.226 1.361 11.012
2 6.907 0.720 11.297
3 6.365 0.651 11.222
Average 6.499 0.910 11.177
NS 1 5.008 0.567 9.927
2 4.565 0.397 8.510
3 4.367 0.374 8.296
Average 4.646 0.446 8.911
CSS 1 6.213 0.740 10.958
2 6.305 0.606 11.273
3 6.107 0.572 9.849
Average 6.208 0.639 10.693
IS 1 5.483 0.783 9.994
2 6.202 0.670 9.793
3 5.429 0.646 11.518
Average 5.704 0.699 10.435
CFS= Constant fast stirring
NS= No stirring
CSS= Constant fast stirring
IS= Intermediate stirring