Embed Size (px)
Citation preview
DEVELOPMENT OF A SUPERCRITICAL CARBON DIOXIDE REACTOR WITH ONLINE SAMPLING BY MASS SPECTROMETRY FOR OBSERVATION OF PREBIOTIC CHEMICAL REACTION PRODUCTS
Daniel Thomas†, Jenny Fan†, Scott Virgil‡, and J. L. Beauchamp†
†Noyes Laboratory of Chemical Physics, Caltech‡Center for Catalysis and Chemical Synthesis, Caltech
Overview
• Supercritical carbon dioxide – what do we know? Why is it interesting
• Experimental apparatus for studying reactions in scCO2
• Diagnostic testing of experimental apparatus
• Synthesis of biomolecules in scCO2
• Discussion of future work
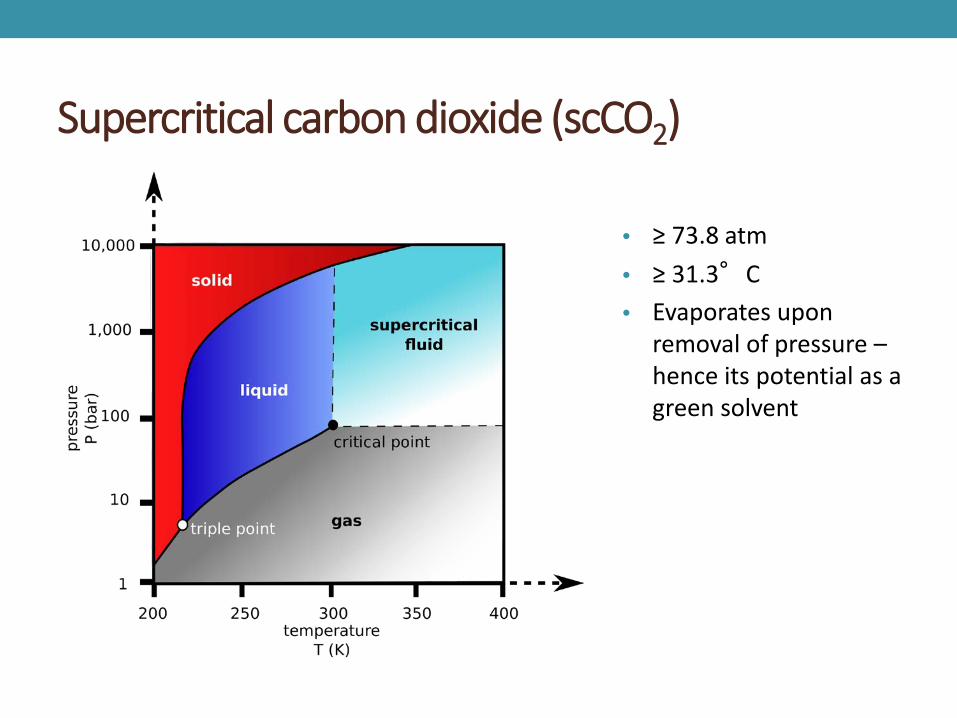
Supercritical carbon dioxide (scCO2)
• ≥ 73.8 atm• ≥ 31.3°C• Evaporates upon
removal of pressure –hence its potential as a green solvent
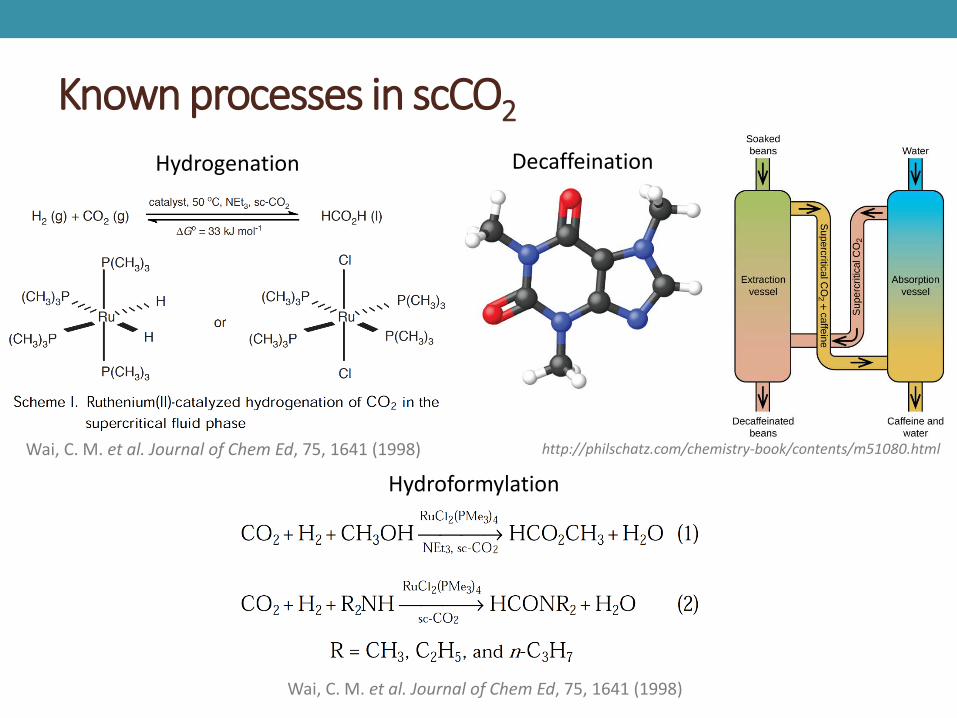
Known processes in scCO2
http://philschatz.com/chemistry-book/contents/m51080.html
DecaffeinationHydrogenation
Wai, C. M. et al. Journal of Chem Ed, 75, 1641 (1998)
HydroformylationWai, C. M. et al. Journal of Chem Ed, 75, 1641 (1998)
• CO2 a common compound present in planetary atmospheres, and supercritical conditions may exist on exoplanets
• Hypothesis that life on earth may have formed in scCO2 in thermal vents in oceans and at the scCO2-H2O interface
• Exoplanets: life forming in supercritical or liquid CO2
• scCO2 may comprise a unique medium in which prebiotic molecules can be formed
scCO2 a possible pre-biotic solvent?
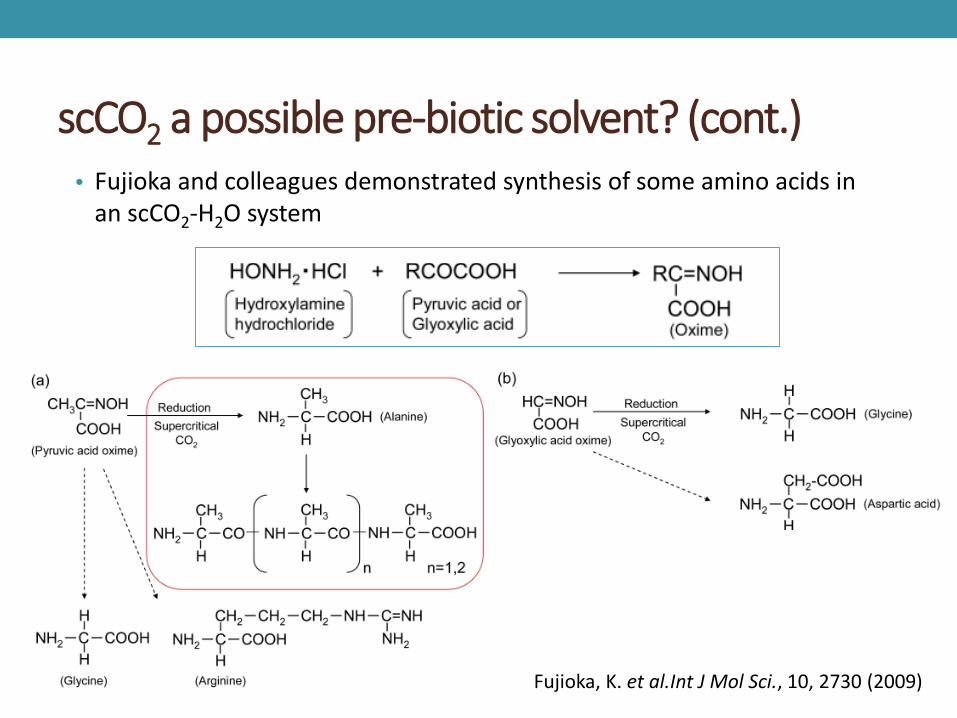
scCO2 a possible pre-biotic solvent? (cont.)• Fujioka and colleagues demonstrated synthesis of some amino acids in
an scCO2-H2O system
Fujioka, K. et al.Int J Mol Sci., 10, 2730 (2009)
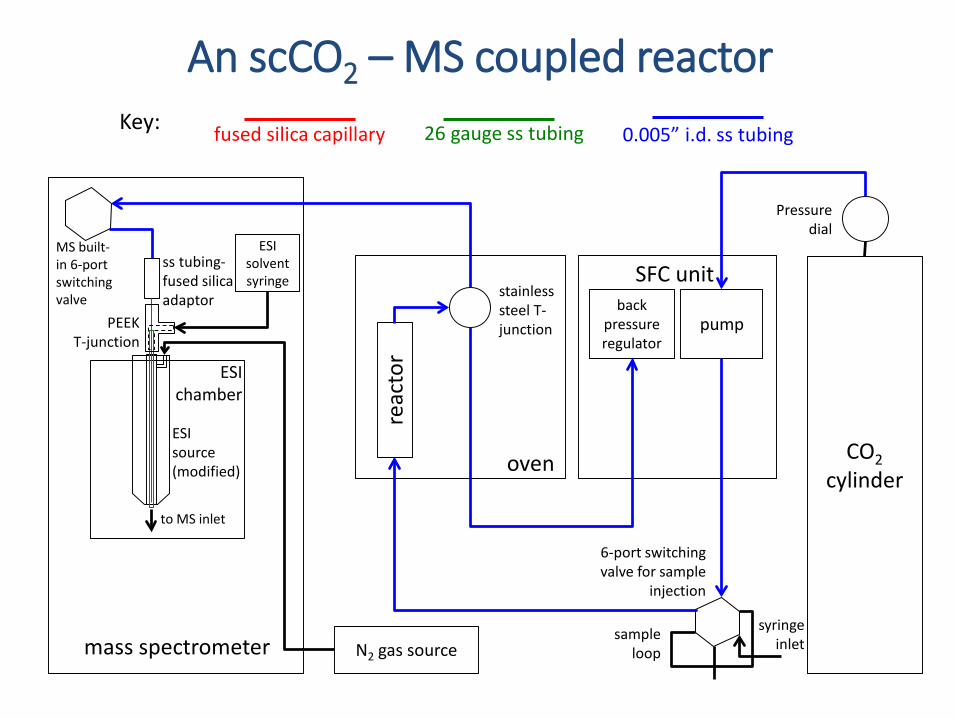
CO2cylinder
pumpback
pressure regulator
reac
tor
N2 gas source
ESI solvent syringe
MS built-in 6-port switching valve
ss tubing-fused silica adaptor
PEEK T-junction
ESI chamber
ESI source (modified)
to MS inlet
stainless steel T-junction
SFC unit
oven
6-port switching valve for sample
injection
Pressure dial
mass spectrometersample
loop
syringe inlet
An scCO2 – MS coupled reactorKey: fused silica capillary 26 gauge ss tubing 0.005” i.d. ss tubing
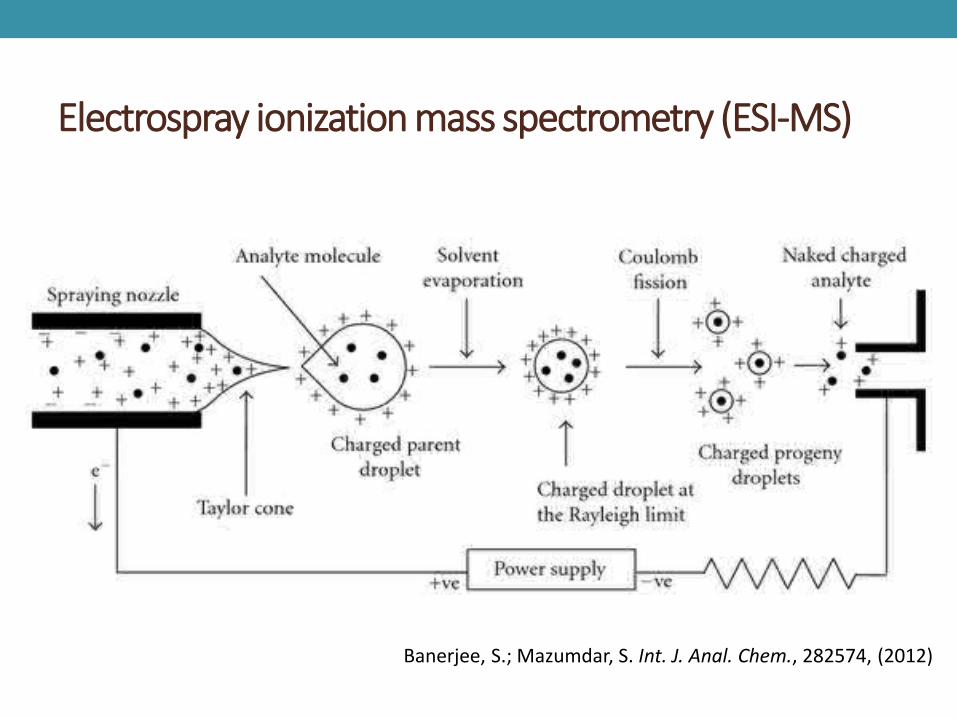
Electrospray ionization mass spectrometry (ESI-MS)
Banerjee, S.; Mazumdar, S. Int. J. Anal. Chem., 282574, (2012)
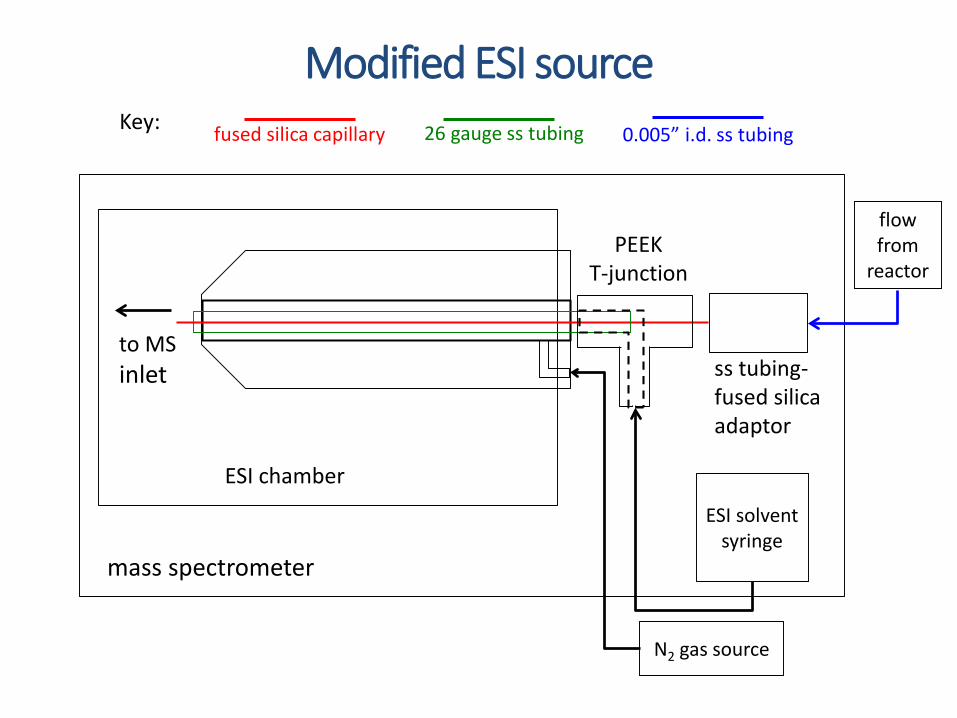
mass spectrometer
ESI solvent syringe
ss tubing-fused silica adaptor
PEEK T-junction
ESI chamber
to MS inlet
Modified ESI source
N2 gas source
flow from
reactor
Key: fused silica capillary 26 gauge ss tubing 0.005” i.d. ss tubing
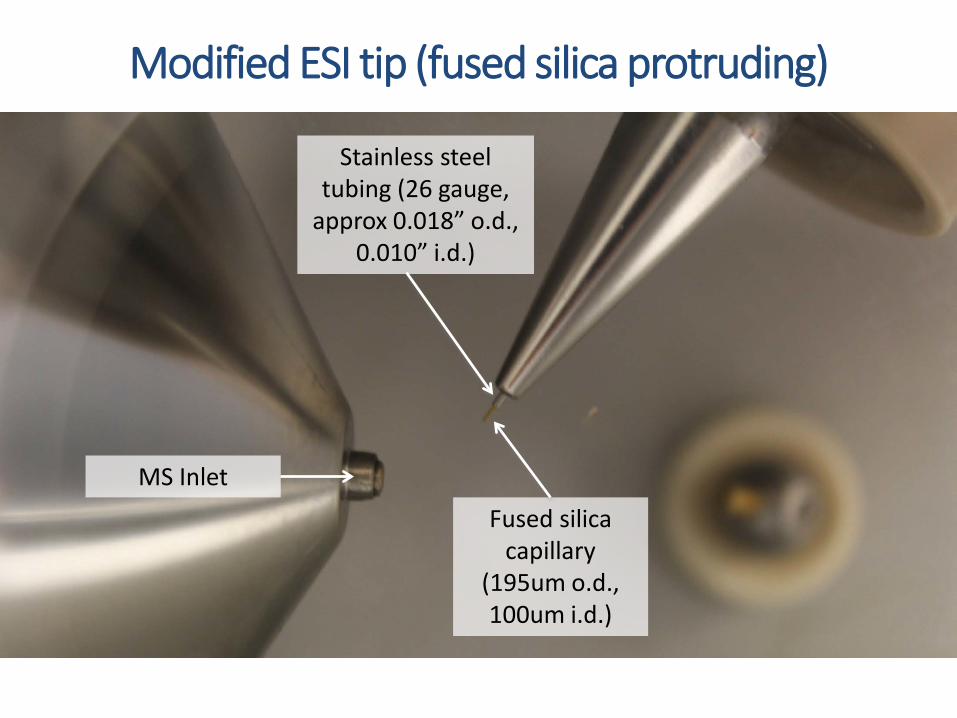
Fused silica capillary
(195um o.d., 100um i.d.)
Stainless steel tubing (26 gauge,
approx 0.018” o.d., 0.010” i.d.)
Modified ESI tip (fused silica protruding)
MS Inlet
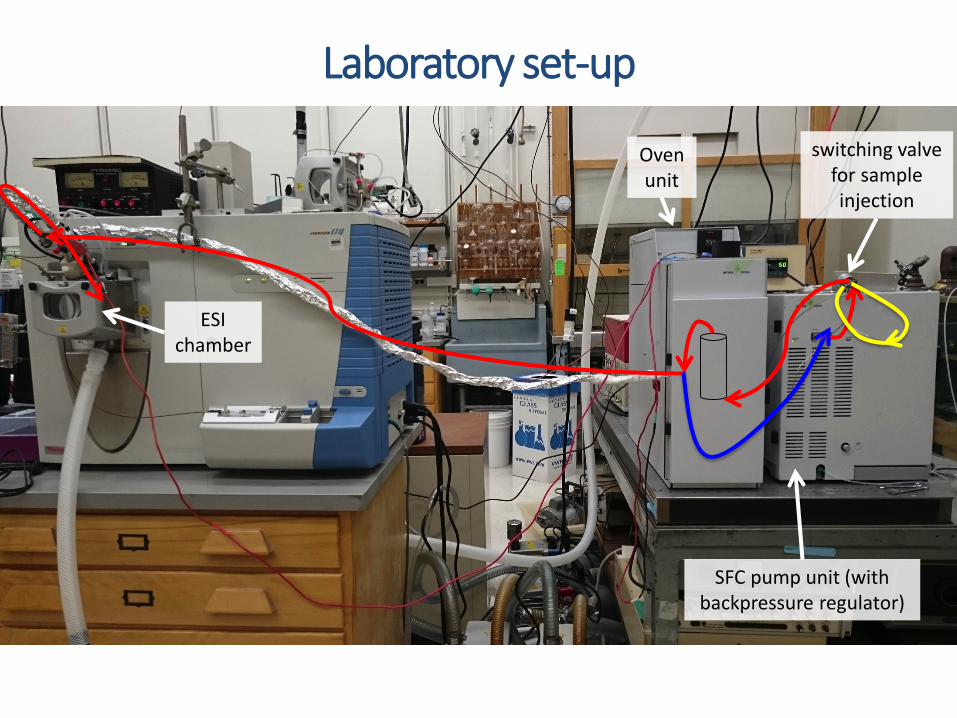
Oven unit
SFC pump unit (with backpressure regulator)
ESI chamber
switching valve for sample injection
Laboratory set-up
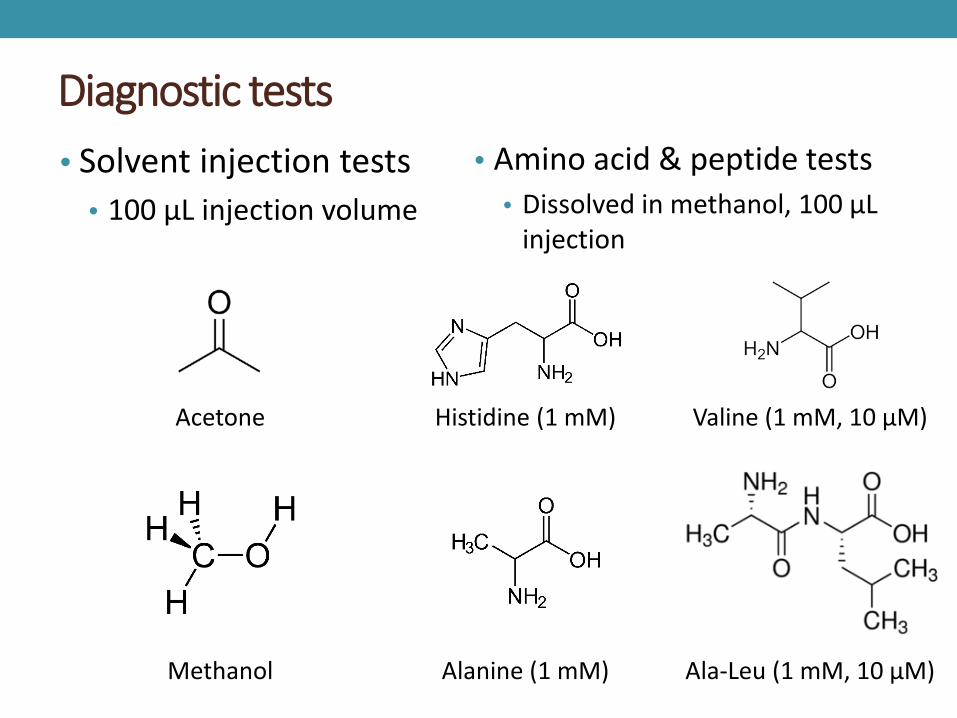
• Solvent injection tests• 100 μL injection volume
• Amino acid & peptide tests• Dissolved in methanol, 100 μL
injection
Diagnostic tests
Methanol
Acetone Histidine (1 mM) Valine (1 mM, 10 μM)
Alanine (1 mM) Ala-Leu (1 mM, 10 μM)
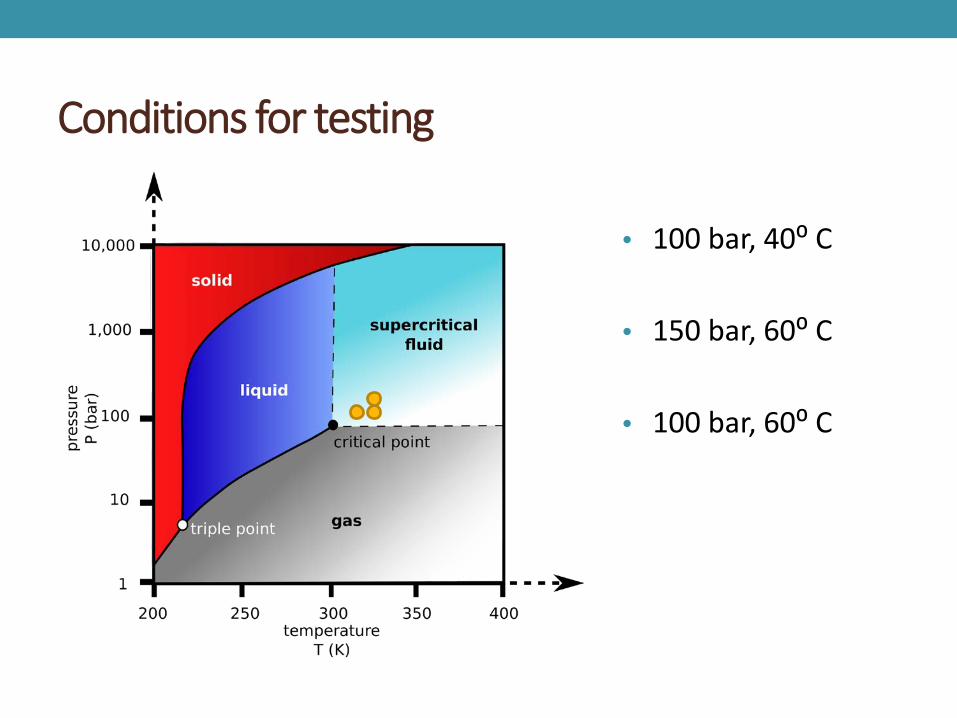
Conditions for testing
• 100 bar, 40⁰ C
• 150 bar, 60⁰ C
• 100 bar, 60⁰ C
50 100 150 200 250 300m/z
0
20
40
60
80
1000
20
40
60
80
100
Rel
ativ
e Ab
unda
nce
117.5 165.2
59.3
273.0
65.4
33.5195.3
Acetone Monomer
Acetone Dimer
MeOH Monomer
MeOH Dimer
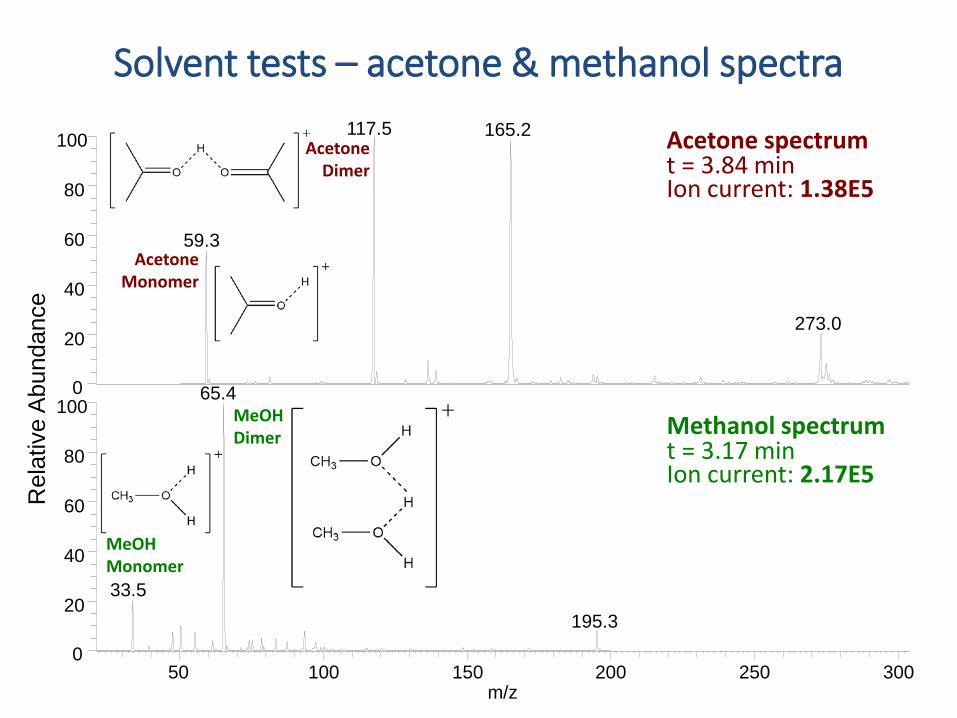
Solvent tests – acetone & methanol spectra
Ion current: 1.38E5
Acetone spectrumt = 3.84 min
Ion current: 2.17E5
Methanol spectrumt = 3.17 min
0 1 2 3 4 5 6 7 8 9Time (min)
0
20
40
60
80
1000
20
40
60
80
100
Rela
tive
Abun
danc
e
3.493.81
4.034.21
3.31 4.943.27 5.60
6.42
6.813.02 7.20
5.45
5.30
5.774.03 6.334.893.883.21
7.30
8.217.60
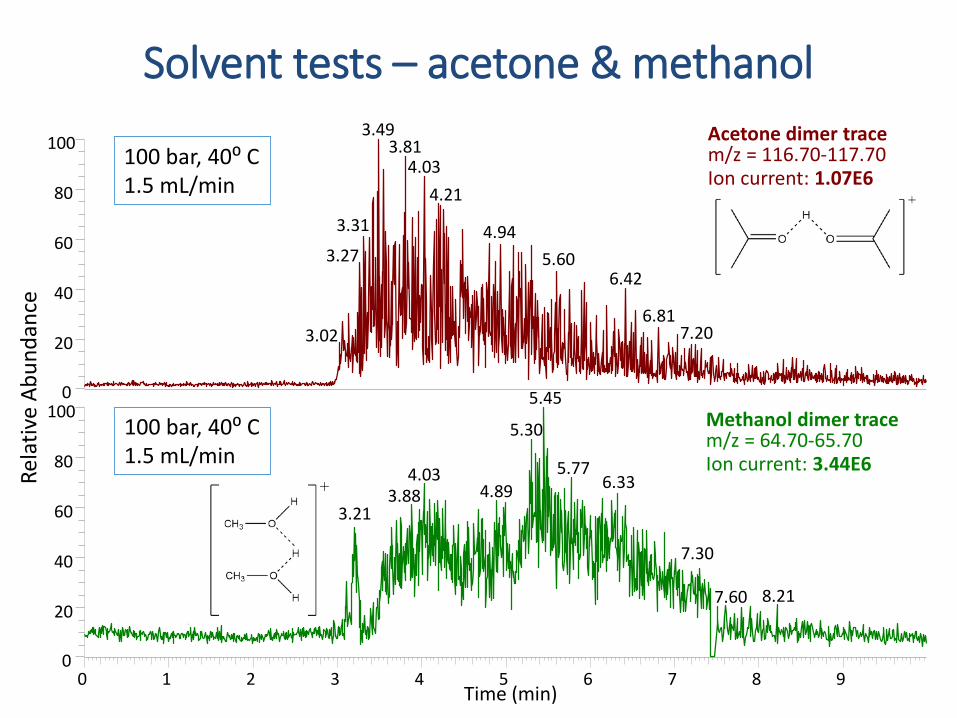
Ion current: 3.44E6
Methanol dimer tracem/z = 64.70-65.70
Ion current: 1.07E6
Acetone dimer tracem/z = 116.70-117.70
Solvent tests – acetone & methanol
100 bar, 40⁰ C1.5 mL/min
100 bar, 40⁰ C1.5 mL/min
0.0 0.5 1.0 1.5 2.0 2.5 3.0 3.5 4.0 4.5 5.0 5.5 6.0Time (min)
0
20
40
60
80
1000
20
40
60
80
100
Rela
tive
Abun
danc
e
2.95
3.102.90
3.22
2.843.46
3.69
4.061.83
1.99
2.08
2.281.72
2.692.97
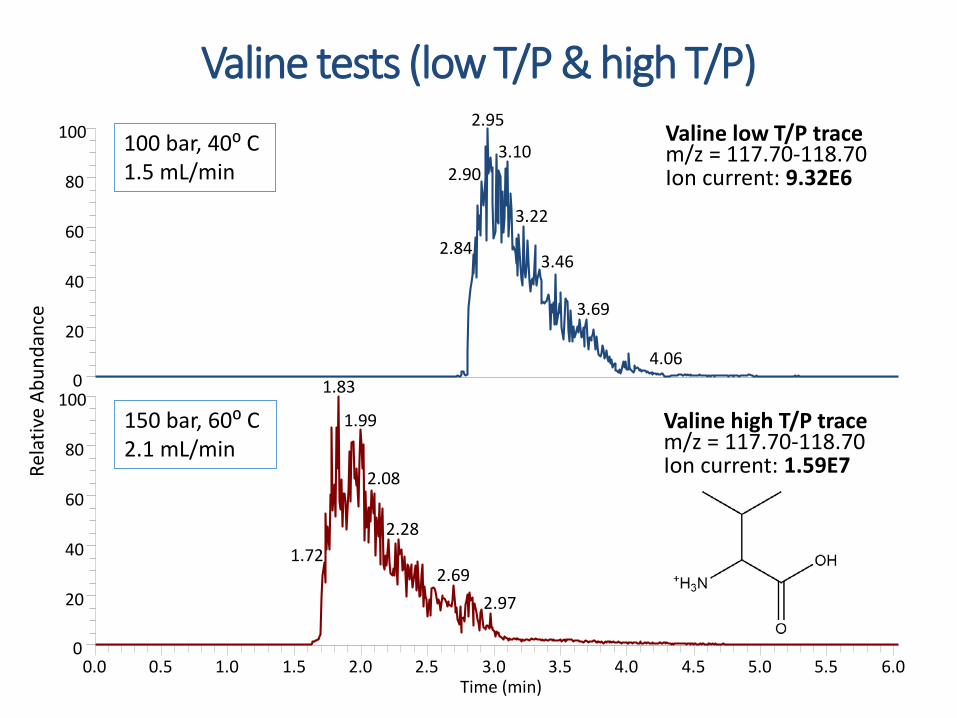
Ion current: 1.59E7
Valine high T/P tracem/z = 117.70-118.70
Ion current: 9.32E6
Valine low T/P tracem/z = 117.70-118.70100 bar, 40⁰ C
1.5 mL/min
150 bar, 60⁰ C2.1 mL/min
Valine tests (low T/P & high T/P)
0.0 0.5 1.0 1.5 2.0 2.5 3.0 3.5 4.0 4.5 5.0 5.5 6.0Time (min)
0
20
40
60
80
1000
20
40
60
80
100
Rela
tive
Abun
danc
e
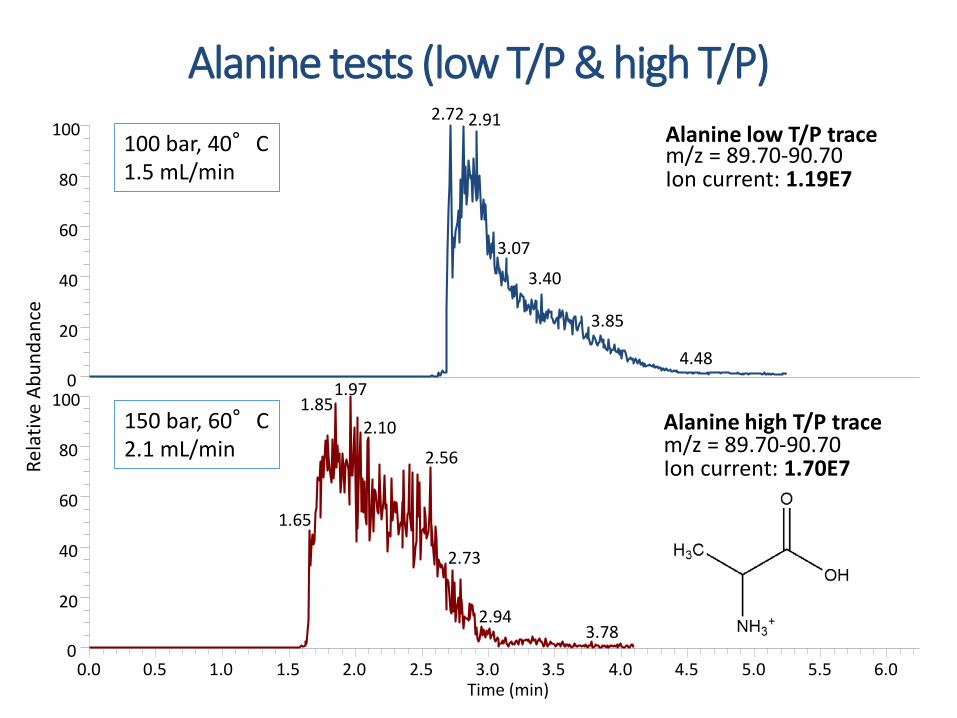
2.72 2.91
3.07
3.40
3.85
4.48
1.971.85
2.10
2.56
1.65
2.73
2.943.78
Ion current: 1.70E7
Alanine high T/P tracem/z = 89.70-90.70
Ion current: 1.19E7
Alanine low T/P tracem/z = 89.70-90.70100 bar, 40°C
1.5 mL/min
150 bar, 60°C2.1 mL/min
Alanine tests (low T/P & high T/P)
0.0 0.5 1.0 1.5 2.0 2.5 3.0 3.5 4.0 4.5 5.0 5.5 6.0 6.5Time (min)
0
20
40
60
80
1000
20
40
60
80
100
Rela
tive
Abun
danc
e
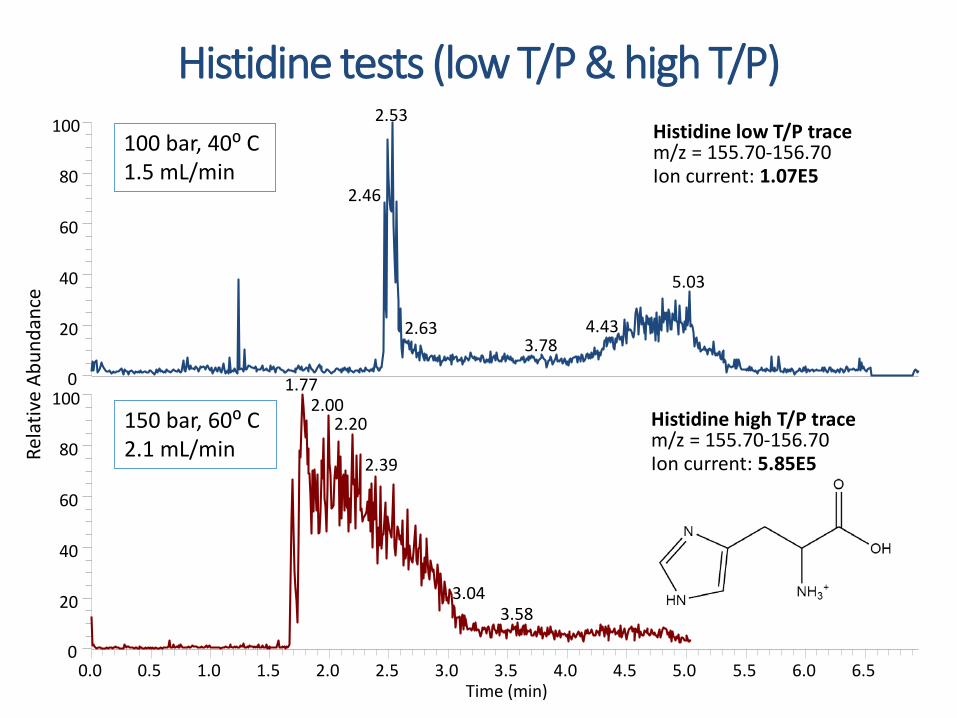
2.53
2.46
5.03
4.432.633.78
1.772.00
2.20
2.39
3.043.58
Ion current: 5.85E5
Histidine high T/P tracem/z = 155.70-156.70
Ion current: 1.07E5
Histidine low T/P tracem/z = 155.70-156.70100 bar, 40⁰ C
1.5 mL/min
150 bar, 60⁰ C2.1 mL/min
Histidine tests (low T/P & high T/P)
0.0 0.5 1.0 1.5 2.0 2.5 3.0 3.5 4.0 4.5Time (min)
0
20
40
60
80
1000
20
40
60
80
100
Rela
tive
Abun
danc
e
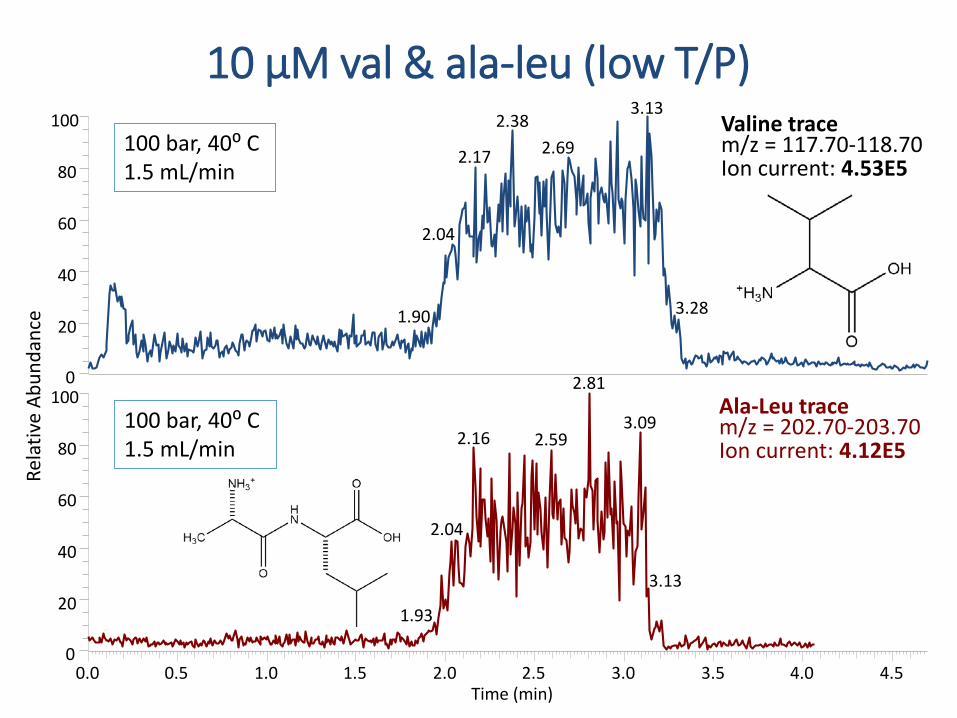
3.132.38
2.692.17
2.04
3.281.90
2.81
3.092.16 2.59
2.04
3.13
1.93
Ion current: 4.12E5
Ala-Leu tracem/z = 202.70-203.70
Ion current: 4.53E5
Valine tracem/z = 117.70-118.70100 bar, 40⁰ C
1.5 mL/min
100 bar, 40⁰ C1.5 mL/min
10 μM val & ala-leu (low T/P)
50 100 150 200 250 300 350 400 450 500m/z
0
10
20
30
40
50
60
70
80
90
100
Rela
tive
Abun
danc
e
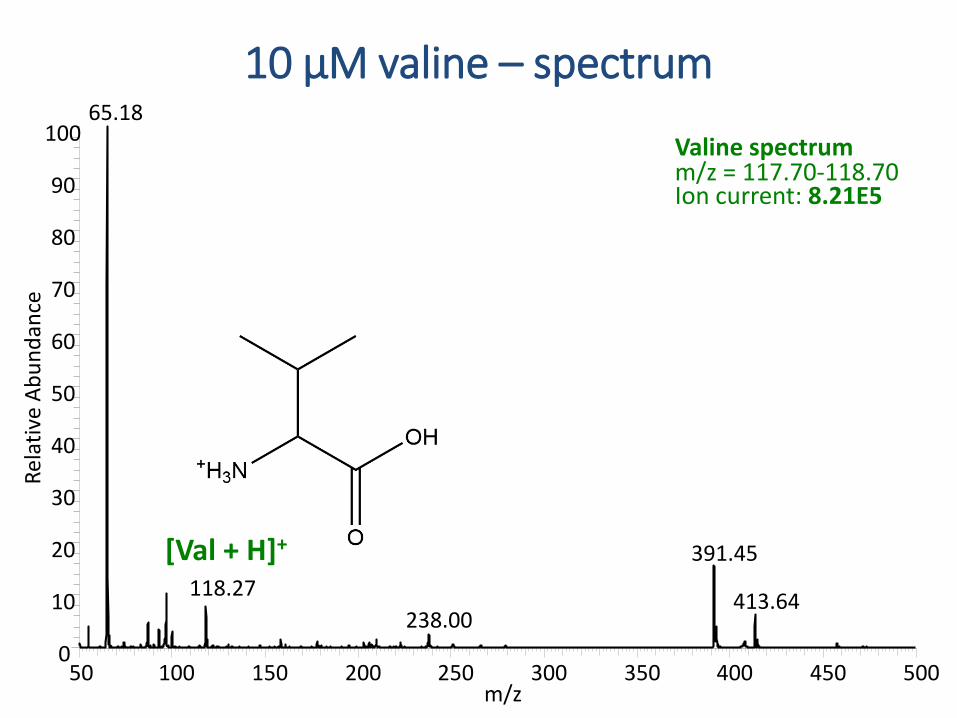
65.18
391.45118.27 413.64
238.00
[Val + H]+
Ion current: 8.21E5
Valine spectrumm/z = 117.70-118.70
10 μM valine – spectrum
50 100 150 200 250 300 350 400 450 500m/z
0
10
20
30
40
50
60
70
80
90
100
Rela
tive
Abun
danc
e
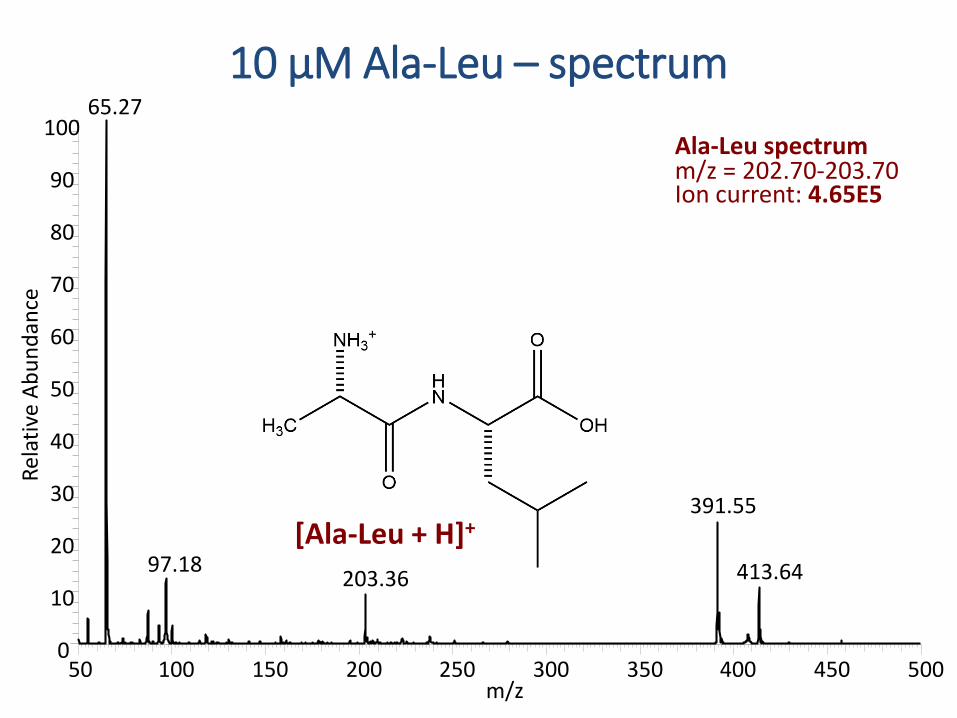
65.27
391.55
97.18 413.64203.36
[Ala-Leu + H]+
Ion current: 4.65E5
Ala-Leu spectrumm/z = 202.70-203.70
10 μM Ala-Leu – spectrum
Fujioka, K. et al.Int J Mol Sci., 10, 2730 (2009)
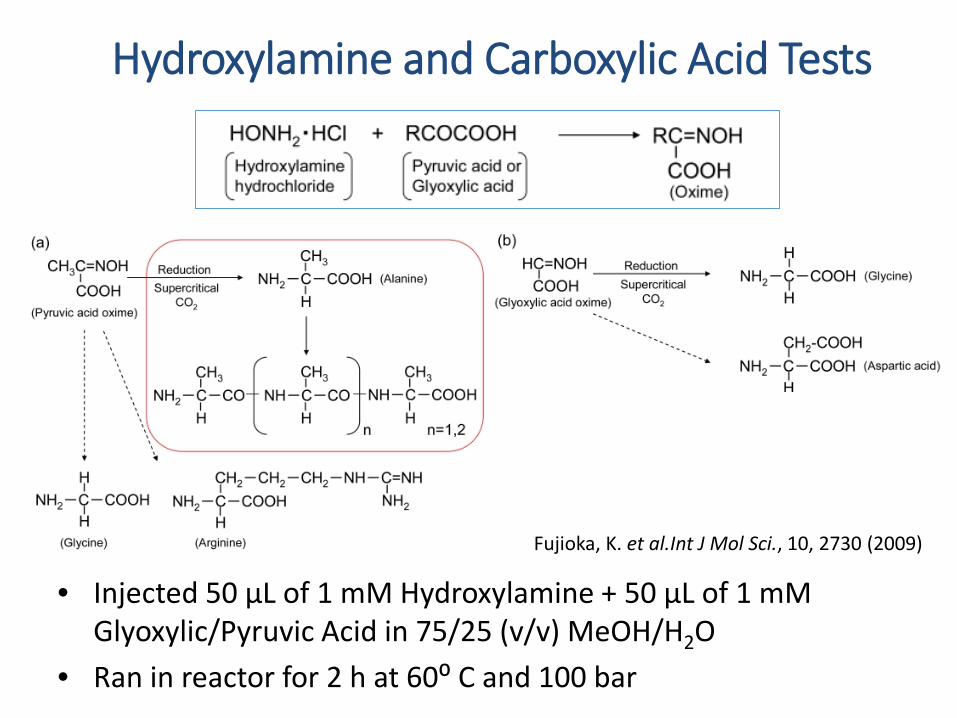
Hydroxylamine and Carboxylic Acid Tests
• Injected 50 μL of 1 mM Hydroxylamine + 50 μL of 1 mM Glyoxylic/Pyruvic Acid in 75/25 (v/v) MeOH/H2O
• Ran in reactor for 2 h at 60⁰ C and 100 bar
0 1 2 3 4 5 6 7 8 9 10Time (min)
0
20
40
60
80
1000
20
40
60
80
100
Rel
ativ
e Ab
unda
nce
7.7
7.67.6
8.0 8.1
1.21.1 8.7
6.2
6.1
6.1
6.36.4 6.5
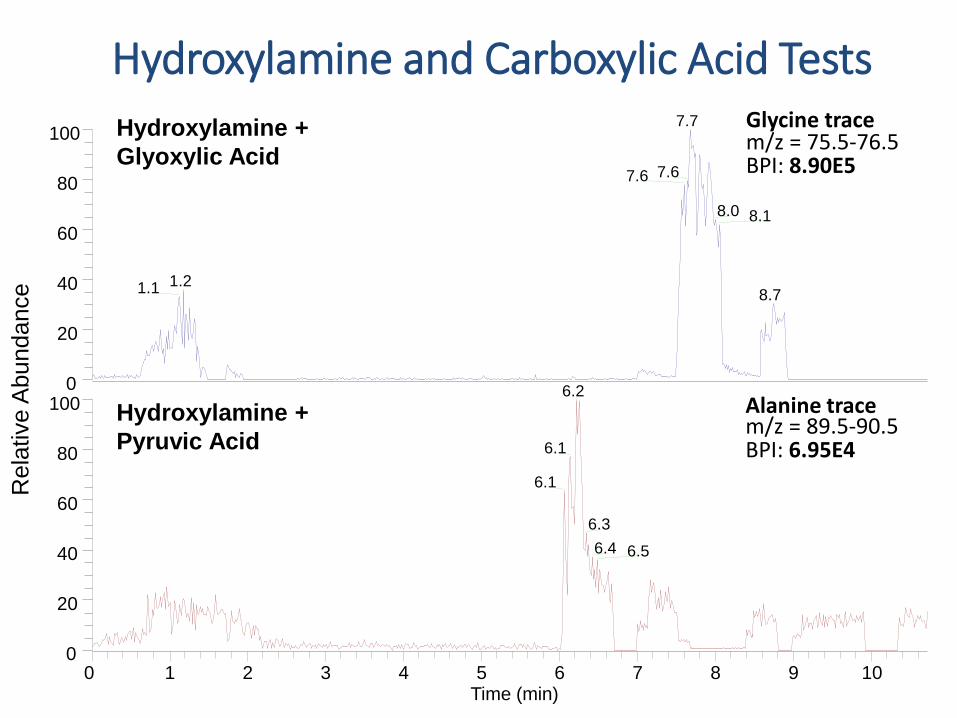
BPI: 8.90E5
Glycine tracem/z = 75.5-76.5
BPI: 6.95E4
Alanine tracem/z = 89.5-90.5
Hydroxylamine + Glyoxylic Acid
Hydroxylamine + Pyruvic Acid
Hydroxylamine and Carboxylic Acid Tests
50 100 150 200 250m/z0
20
40
60
80
1000
20
40
60
80
100
Rel
ativ
e Ab
unda
nce
65.2
207.076.1 238.797.1 179.0 210.7
65.2
76.2 97.1
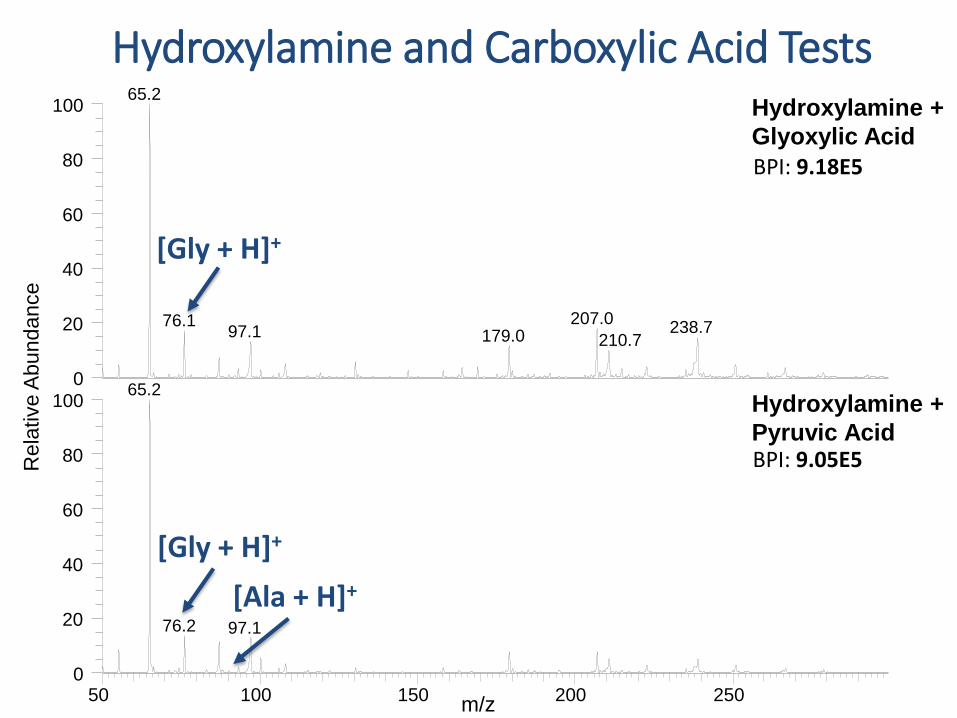
BPI: 9.18E5
BPI: 9.05E5
Hydroxylamine + Glyoxylic Acid
Hydroxylamine + Pyruvic Acid
[Gly + H]+
[Gly + H]+
[Ala + H]+
Hydroxylamine and Carboxylic Acid Tests
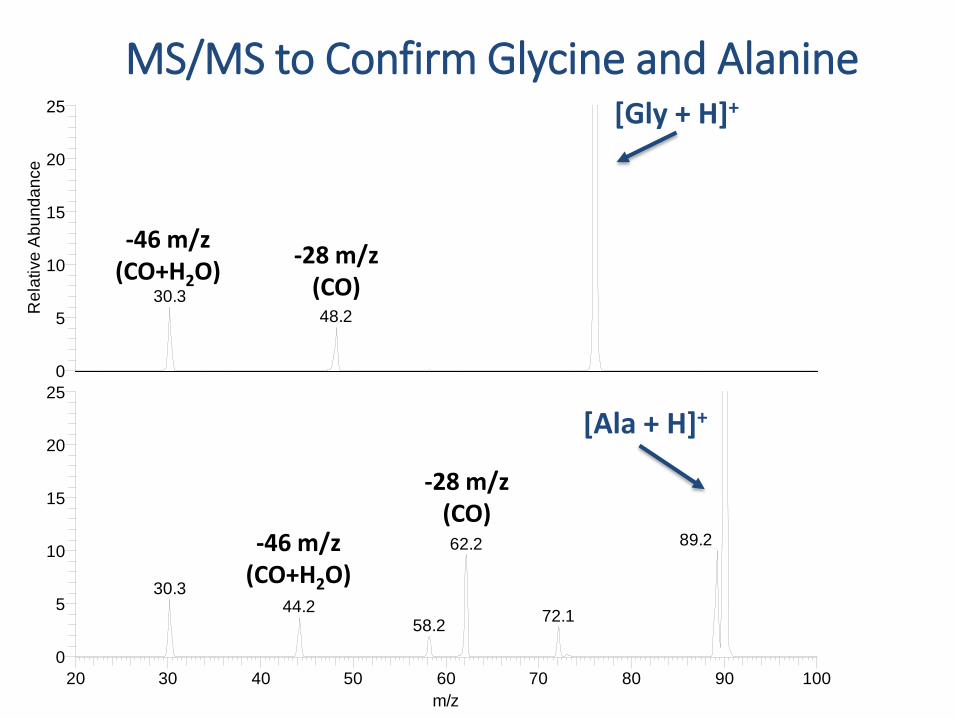
20 30 40 50 60 70 80 90 100m/z
0
5
10
15
20
250
5
10
15
20
25
Rel
ativ
e A
bund
ance
30.348.2
89.262.2
30.344.2 72.158.2
NL: 4.42E31mM hydroxylam acid#540-551 R AV: 12 T: ITMS ms2 76.10@cid [20.00-200.00]
NL: 1.72E21mm hydroxylam acid#480-494 R AV: 15 T: ITMS ms2 90.00@cid [20.00-200.00]
MS/MS to Confirm Glycine and Alanine[Gly + H]+
[Ala + H]+
-28 m/z(CO)
-46 m/z(CO+H2O)
-28 m/z(CO)
-46 m/z(CO+H2O)
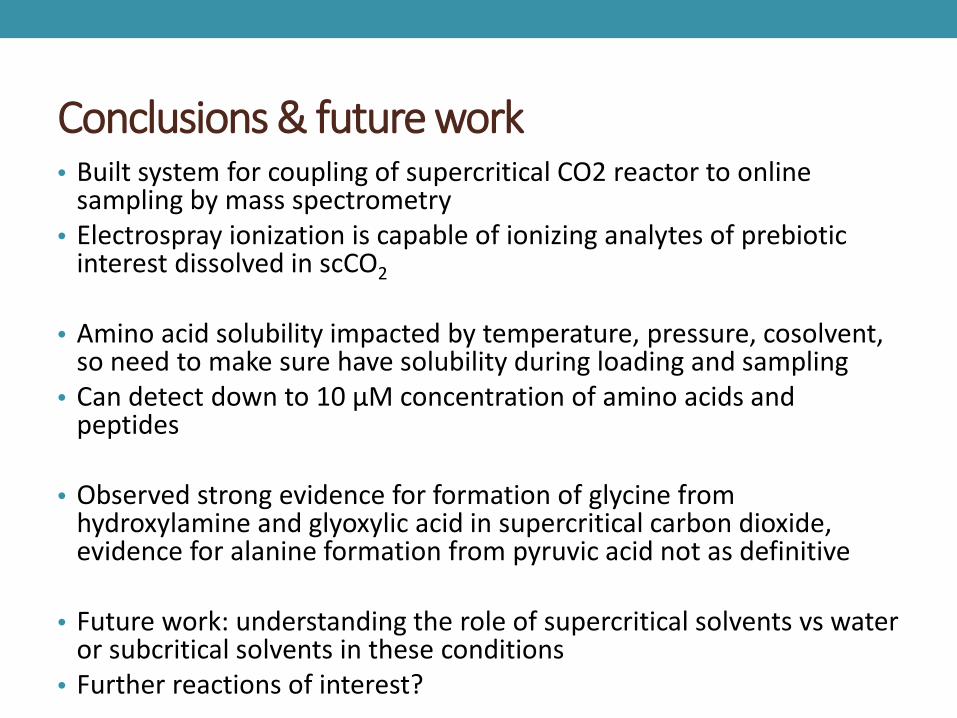
• Built system for coupling of supercritical CO2 reactor to online sampling by mass spectrometry
• Electrospray ionization is capable of ionizing analytes of prebiotic interest dissolved in scCO2
• Amino acid solubility impacted by temperature, pressure, cosolvent, so need to make sure have solubility during loading and sampling
• Can detect down to 10 μM concentration of amino acids and peptides
• Observed strong evidence for formation of glycine from hydroxylamine and glyoxylic acid in supercritical carbon dioxide, evidence for alanine formation from pyruvic acid not as definitive
• Future work: understanding the role of supercritical solvents vs water or subcritical solvents in these conditions
• Further reactions of interest?
Conclusions & future work
• Jenny Fan• Beauchamp group• Scott Virgil, 3CS
Manager• Nathan Dalleska, EAC
Director• Keck Institute for Space
Studies• Caltech SFP Office
Acknowledgements