Embed Size (px)
Citation preview
Extended Program on Immunization (EPI) coverage in selected Ethiopian zones: A baseline survey for L10K’s
Routine Immunization Improvement Initiative
June 2015 Addis Ababa, Ethiopia
Extended Program on Immunization (EPI) coverage in selected Ethiopian zones: A baseline survey for L10K’s Routine
Immunization Improvement Initiative
June 2015
JSI Research and Training Institute Inc. / The Last Ten Kilo Meters Project (L10K)
PO Box: 13898, Addis Ababa, Ethiopia
Tel: +251-11-6620066
Fax: +251-11-6630919
Website: www.l10k.jsi.com

i
Table of Contents
Table of Contents .......................................................................................................................................... i
List of Tables .............................................................................................................................................. iiii
List of Figures ............................................................................................................................................. iv
Acronyms ..................................................................................................................................................... v
Acknowlegements ...................................................................................................................................... vi
Executive summary ................................................................................................................................... vii
Background ................................................................................................................................................... 1
Objectives ..................................................................................................................................................... 3
Methods ........................................................................................................................................................ 4
Study Area and Population ....................................................................................................................... 4
Study Design ............................................................................................................................................. 4
Sample Size and Sampling Technique ...................................................................................................... 5
Field Work and Data Collection ............................................................................................................... 6
Data Management and Analysis ............................................................................................................... 7
Ethical Considerations .............................................................................................................................. 7
Results ........................................................................................................................................................... 8
1. Health Facility Assessments ............................................................................................................. 8
1.1. EPI service delivery .................................................................................................................. 8
1.2. Cold chain and vaccine stock management ............................................................................ 10
1.3. Supervision and EPI in-service training .................................................................................. 12
2. Child Vaccination ........................................................................................................................... 13
2.1. Socio-demographic characteristics of mothers surveyed for child vaccination ...................... 13
2.2. Vaccination coverage .............................................................................................................. 14
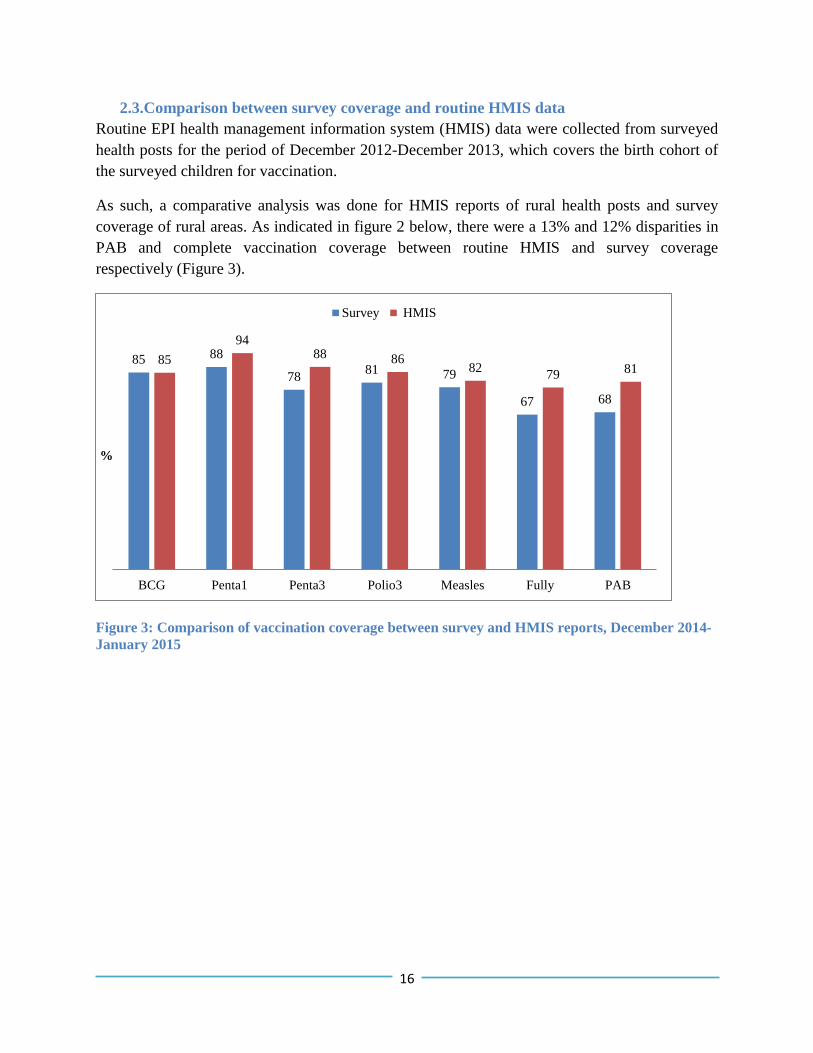
2.3. Comparison between survey coverage and routine HMIS data .............................................. 16
1.1. Access, utilization and quality of vaccination services ........................................................... 17
1.2. Determinants of complete vaccination .................................................................................... 22
1.3. Reason for not completed or never vaccinated ....................................................................... 24
ii
2. TT Vaccination ............................................................................................................................... 26
2.1. Socio-demographic characteristics of mothers surveyed for TT vaccination ......................... 26
2.2. TT vaccination coverage ......................................................................................................... 27
2.3. Determinants for protected against neonatal tetanus at birth (PAB) ....................................... 29
Discussion.................................................................................................................................................... 31
Conclusion and Recommendations ............................................................................................................ 34
Conclusion .............................................................................................................................................. 34
Recommendations ................................................................................................................................... 34
References .................................................................................................................................................. 36
Annexes ....................................................................................................................................................... 38
Annex 1: Survey tools.............................................................................................................................. 38
Annex 2: Summary of the key immunization indicators during December 2014-January 2015, by zone
................................................................................................................................................................ 40
Annex 3: EPI initiatives in Ethiopia .......................................................................................................... 42
iii
List of Tables
Table 1: Estimated coverage, required sample size and cluster size for vaccination coverage survey in
selected zones................................................................................................................................................ 6
Table 2: Health facilities assessed by zone, December 2014-January 2015 ................................................. 8
Table 3: EPI service provisions and interruptions, December 2014-January 2015 ...................................... 8
Table 4: EPI defaulter tracing mechanism of health facilities, December 2014-January 2015 .................... 9
Table 5: Cold chain management of health facilities, December 2014-January 2015 ................................ 10
Table 6: Vaccine stock management of health facilities, December 2014-January 2015 ........................... 11
Table 7: Supportive supervisory visit for EPI, December 2014-January 2015 .......................................... 12
Table 8: EPI in-service training, December 2014-January 2015 ................................................................ 12
Table 9: Socio-demographic characteristics of mothers surveyed for child vaccination, December 2014-
January 2015 ............................................................................................................................................... 13
Table 10: Percentage of children age 12-23 months who received specific vaccines at any time before the
survey and by 12 months of age, by source of information, December 2014-January 2015 ...................... 14
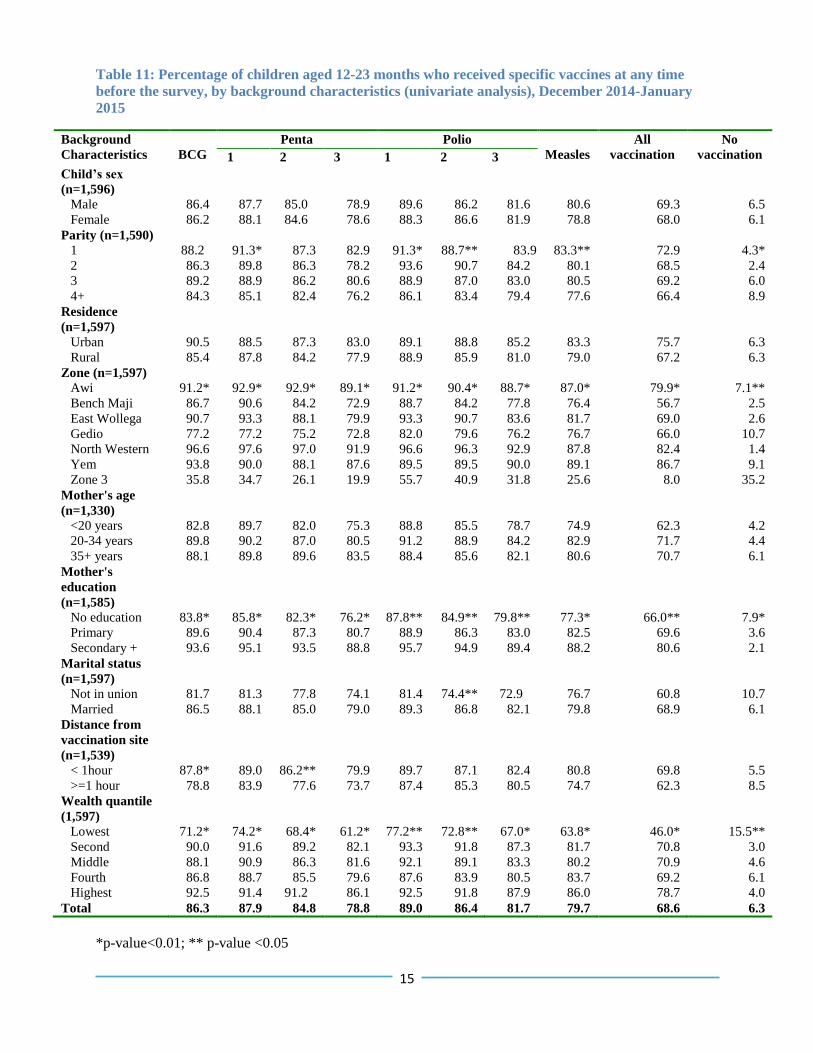
Table 11: Percentage of children aged 12-23 months who received specific vaccines at any time before
the survey, by background characteristics (univariate analysis), December 2014-January 2015 ............... 15
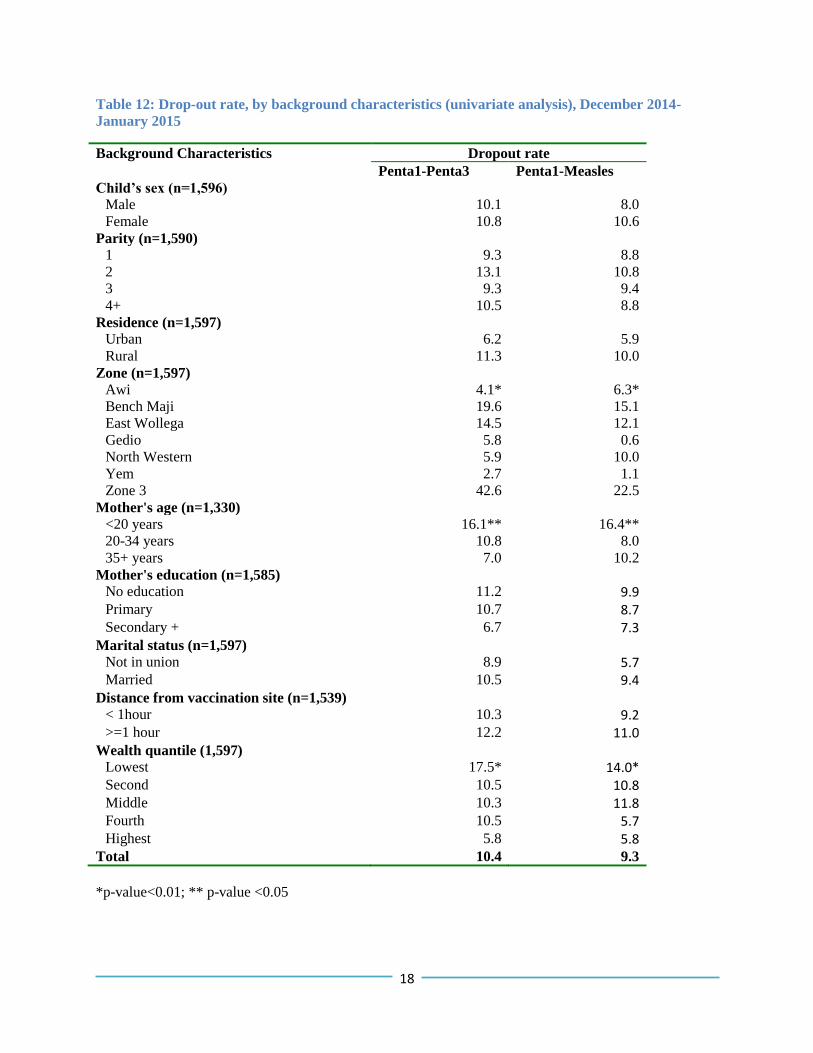
Table 12: Drop-out rate, by background characteristics (univariate analysis), December 2014-January
2015 ............................................................................................................................................................ 18
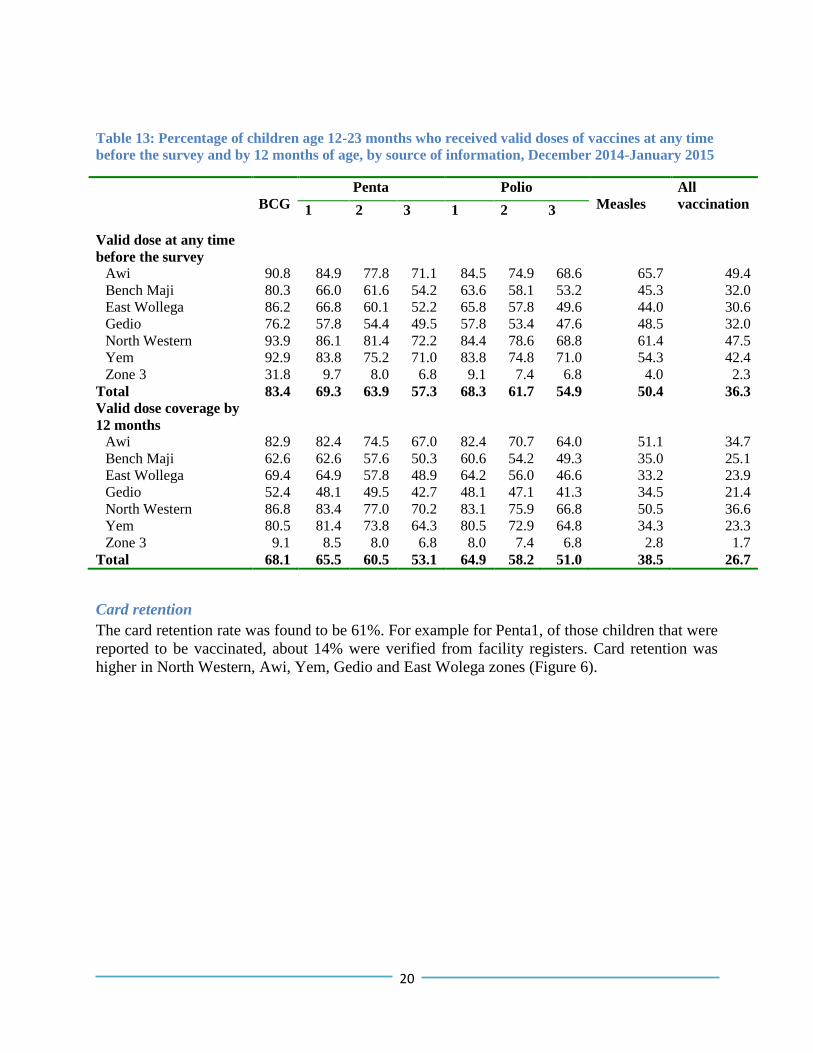
Table 13: Percentage of children age 12-23 months who received valid doses of vaccines at any time
before the survey and by 12 months of age, by source of information, December 2014-January 2015 ..... 20
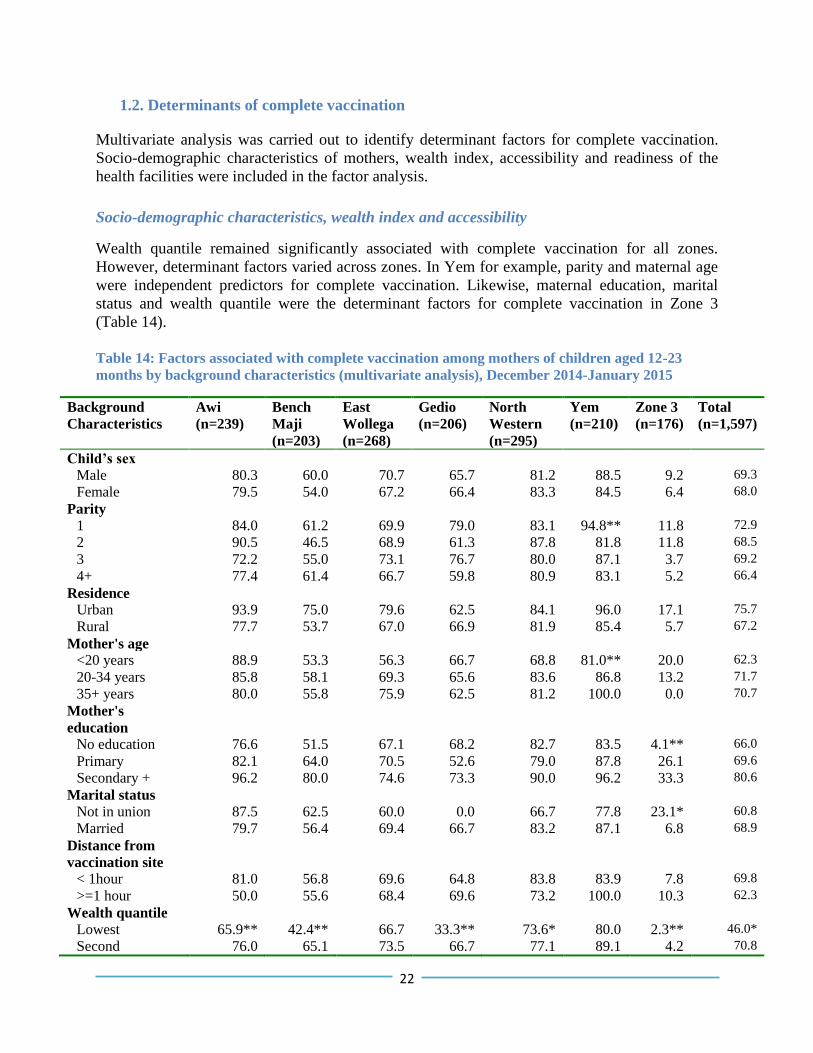
Table 14: Factors associated with complete vaccination among mothers of children aged 12-23 months by
background characteristics (multivariate analysis), December 2014-January 2015 ................................... 22
Table 15: Factors associated with complete vaccination among mothers of children aged 12-23 months by
facility readiness, December 2014-January 2015 ....................................................................................... 23
Table 16: Percentage of mothers of children age 12-23 months who missed any of the vaccination doses
with the reasons for not vaccinating, December 2014-January 2015 ......................................................... 25
Table 17: Socio-demographic characteristics of mothers surveyed for TT vaccination, December 2014-
January 2015 ............................................................................................................................................... 26
Table 18: Maternal and newborn heath care utilization by mothers of children with 0-11 months, by zone,
December 2014-January 2015 .................................................................................................................... 27
Table 19: TT doses received by mothers of children age 0-11 months of age by background characteristics
(univariate analysis), December 2014-January 2015 .................................................................................. 28
Table 20: Factors associated with protected against neonatal tetanus at birth (PAB) among mothers of
children aged 0- 11 months (multivariate analysis), December 2014-January 2015 .................................. 29
iv
List of Figures
Figure 1: Map showing the seven RIIP intervention zones in the five regions of Ethiopia .......................... 4
Figure 2: EPI record keeping tool use at the time of the survey, December 2014-January 2015 ............... 10
Figure 3: Comparison of vaccination coverage between survey and HMIS reports, December 2014-
January 2015 ............................................................................................................................................... 16
Figure 4: Drop-out rate of vaccinations by source of information, December 2014-January 2015 ............ 17
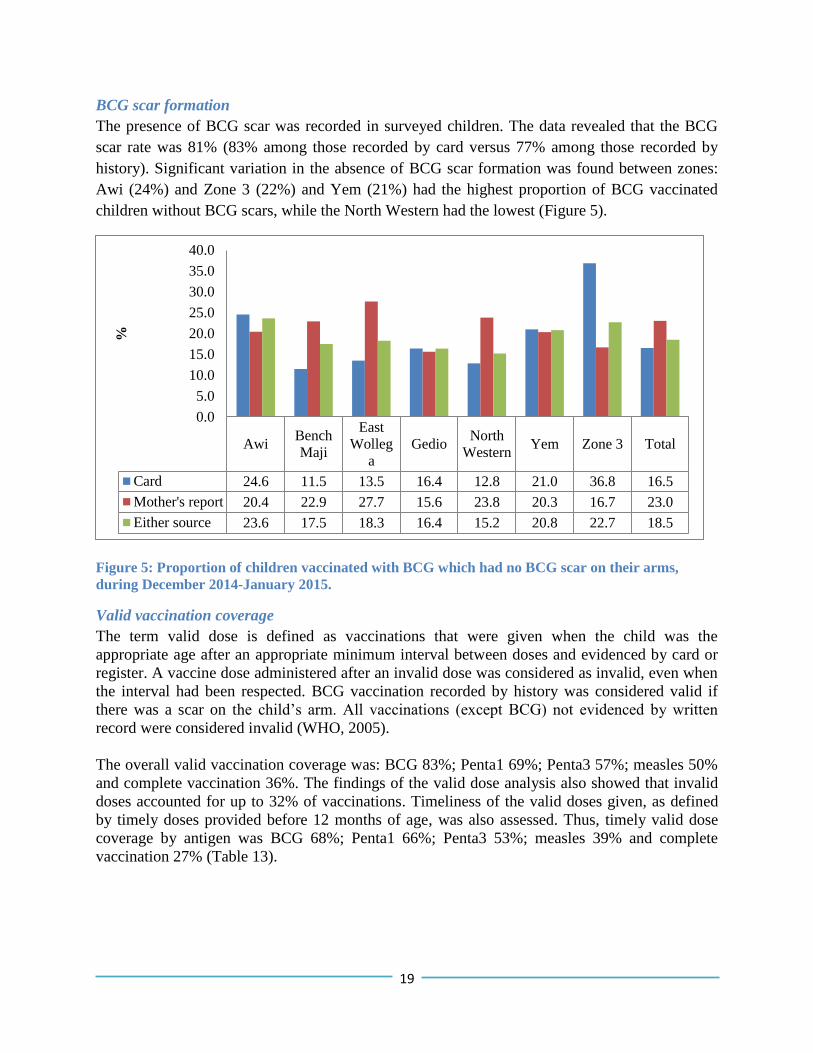
Figure 5: Proportion of children vaccinated with BCG which had no BCG scar on their arms, during
December 2014-January 2015. ................................................................................................................... 19
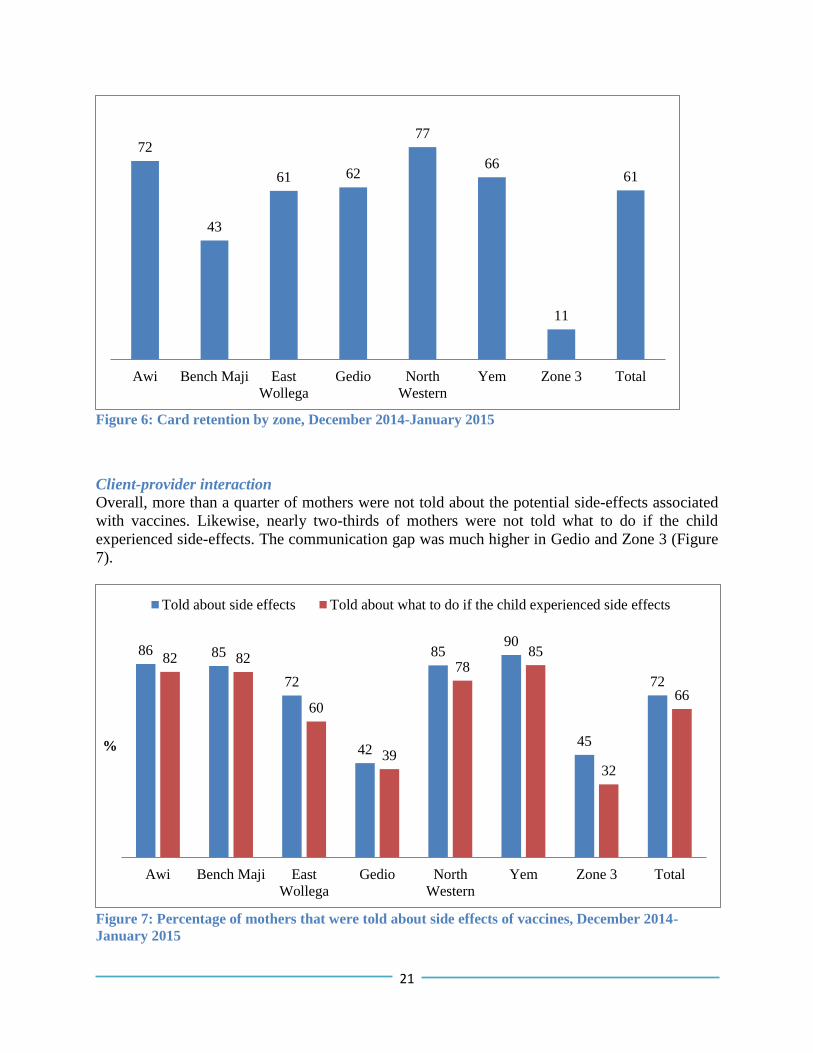
Figure 6: Card retention by zone, December 2014-January 2015............................................................... 21
Figure 7: Percentage of mothers that were told about side effects of vaccines, December 2014-January
2015 ............................................................................................................................................................ 21
Figure 8: Reasons for not completed or never vaccinated among children aged 12-23 months, December
2014-January 2015 ...................................................................................................................................... 24
v
Acronyms AD Auto-Disable
ANC Antenatal Care
BCG Bacillus Calmette–Guérin vaccine
CHW Community Health Worker
DPT Diphtheria-Pertussis-Tetanus vaccine
EDHS Ethiopian Demographic and Health Survey
EHNRI Ethiopian Health and Nutrition Research Institute
EOS Enhanced Outreach Strategy
EPI Expanded Program for Immunization
ERIA Enhanced Routine Immunization Activities
FMoH Federal Ministry of Health
HDA Health Development Army members
HepB Hepatitis B
HEW Health Extension Workers
Hib Hemophilus influenza type B
HMIS Health Management Information System
L10K The Last Ten Kilometers Project
NGO Non-governmental Organization
OPV Oral Polio Vaccine
PAB Protected Against Neonatal Tetanus at Birth
PCV Pneumococcal Conjugate Vaccine
RED Reaching Every District
RIIP Routine Immunization Improvement Plan
SD Standard Deviation
SNNP Southern Nations, Nationalities and Peoples Region
TT Tetanus Toxoid vaccine
USAID United States Agency for International Development
WHO World Health Organization
UNICEF United Nations Children's Fund
vi
Acknowlegements
We would like to extend our special thanks to United States Agency for International
Development (USAID) for funding this project. The implementation of the baseline survey
would not have been possible without the support of the Federal Ministry of Health (FMoH),
regional health bureaus of Afar, Amhara, Oromia, Southern Nations, Nationalities and People’s
(SNNP) and Tigray regions and zonal health departments of Awi, Bench Maji, East Wollega,
Gedio, North Western, Yem and Zone 3 of Afar zones.
We would like to acknowledge our colleagues for their contributions to all the steps of
organizing and implementing the baseline survey. We acknowledge the interviewers and the
supervisors for their hard work, dedication, and for accomplishing the field work on schedule.
Finally, we take this opportunity to extend our gratitude to all study participants including Health
Extension Workers (HEWs) and health center staff who took their time to respond to the survey
questionnaires and provide us with valuable information to plan and implement the Routine
Immunization Improvement Plan (RIIP).
vii
Executive summary
Background: The government of Ethiopia has been delivering routine immunization services
through static, outreach and mobile strategies since 1980. Moreover, programs including
Supplemental Immunization Activities (SIAs), Reaching Every District (RED) and Enhanced
Routine Immunization Activities (ERIA) have been implemented to further expand vaccination
services. Despite the huge efforts made over decades, the access and utilization of immunization
remains low with wide regional variations and unacceptably high drop-out rates. A national
consensus has also been reached that vaccination coverage is stagnating in Ethiopia. The Last
Ten Kilometers (L10K) Project of the John Snow, Inc. (JSI) Research and Training Institute is
supporting the Federal Ministry of Health (FMoH) in implementing the routine immunization
improvement plan in seven selected zones with high numbers of unvaccinated children.
Population-based information regarding vaccination status and the reasons for no or incomplete
vaccination are essential for monitoring the Expanded Program on Immunization (EPI). As
such, this study was conducted to establish baseline vaccination levels and inform
implementation of the project.
Methods: Cross-sectional household and facility surveys were conducted as the baseline for a
pretest-posttest only evaluation design. A total of 1,597 mothers of children from 12-23 months
of age and 1,586 mothers of children 0-11 months of age were interviewed regarding vaccination
coverage from December 2014 to January 2015. The facility survey included data collected from
health facilities serving the selected kebeles of the household survey. In each kebele the health
post and its supervising health center were assessed.
Results: The majority of the health facilities (99% of health posts and 96% of health centers)
were providing routine vaccination services at the time of the survey. However, only 37% of
functional health centers were providing EPI services on a daily basis. More than a quarter of
health facilities missed at least one EPI session in the previous six months.
Almost all health centers and one-third of health posts had at least one refrigerator for EPI
activities. However, refrigerators were not functional in 32% health centers and 71% of health
posts at the time of the survey. Moreover, at least two-thirds of facilities encountered breakdown
of their vaccine refrigerators in the previous three months. Of those facilities which had
functional refrigerator, the temperature reading was outside of the recommended range of 2-8ºC
in 46% health posts and 23% health centers on the day of the visit. Among facilities that stock
vaccines overnight, 67% health centers and 40% health posts experienced shortage of vaccines in
past six months.
The overall vaccination coverage among children aged 12-23 months for each vaccine was as
follows: BCG 86%; Penta1 89%; Penta3 79%; measles 80%; and fully vaccinated 69%. Timely
vaccination coverage, as defined by vaccination by 12 months of age and evidenced by written
record was as follows: BCG 81%; Penta1 82%; Penta3 72%; measles 68%; and fully vaccinated
60%. Child vaccination coverage significantly varied among zones - for instance; Penta3
coverage ranged from 20% in Zone 3 to 92% in the North Western zone. Valid dose analysis

viii
showed that valid vaccination coverage was as follows: BCG 83%; Penta1 69%; Penta3 57%;
measles 50%; and complete vaccination 36%.
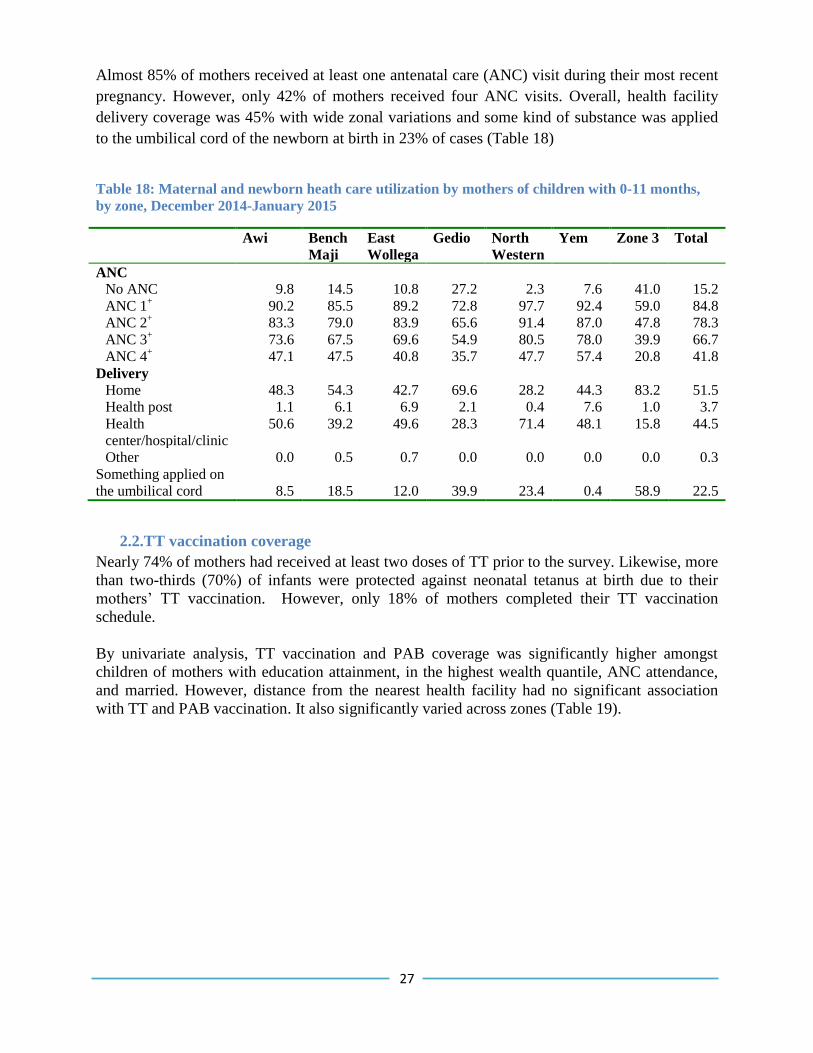
Approximately 85% of mothers received at least one antenatal care visit during their most recent
pregnancy. More than two-thirds (70%) of infants were protected against neonatal tetanus at
birth.
Conclusions: In a significant proportion of facilities, cold chain management was suboptimal
which may reduce vaccine potency.
Vaccination coverage was found to be lower in the households with poorest wealth quantile, low
parity and no maternal education. Facility level determinants including service interruption,
training on EPI and defaulter tracing system were also independent predictors of complete
vaccination. Quality of vaccination services as demonstrated by the validity of doses given,
BCG scar formation, card retention and client-provider interactions were generally low.
Recommendations: Context-based delivery strategies including mobile-based delivery is crucial
to address the low access and utilization of EPI services particularly in pastoralist areas of Afar.
Detailed micro-planning with clear mapping of seasonal nomadic movements is required to
ensure targeted outreach or mobile services to these populations. Detailed planning by individual
health facilities and districts of how to reach the unreached and disadvantaged children in the
catchment area is essential for improving equity in immunization. Observations and close
monitoring of EPI sessions need to be performed to improve the quality of services. Refresher
training is equally important to enhance the knowledge and skills of vaccinators.
There is a need to establish an appropriate and uninterrupted vaccine delivery strategy. There is
also an urgent need to improve the cold chain management system through training and
monitoring, as vaccines in some facilities were at high risk of losing their potency.
To continuously monitor service delivery, quality and the supply chain, a continuous and regular
cycle of planning, monitoring and implementation should be established. Regular and focused
supportive supervision needs to be strengthened at all levels to gain the commitment necessary
for a successful EPI program. Furthermore, observational studies to assess the quality of routine
EPI sessions and field efficacy of vaccines, and operational research to guide program
implementation, particularly to cultivate the vaccination culture, is recommended.
1
Background
Immunization is unquestionably one of the most cost-effective and lifesaving public health
interventions that can be used to protect children from vaccine-preventable diseases. Vaccine-
preventable diseases constitute a major cause of morbidity and mortality in children under-five
years of age in Ethiopia and other developing countries (Mengesha et al. 1995).
The Expanded Program for Immunization (EPI) was launched by the Ethiopian government
Federal Ministry of Health (FMoH) in 1980, with the goal of increasing immunization coverage
by 10% annually and achieve 100% Diphtheria-Pertussis Toxin Vaccine 3 (DPT3) coverage by
19901 (FMoH, 2009). With the intention to realize this goal, the country has developed its EPI
strategy and the schedule for providing antigens to the target children based on the
recommendations of World Health Organization (WHO) (FMoH, 2009). Accordingly, EPI in
Ethiopia provides immunization services through static, outreach, and mobile sites to the target
groups residing in every corner of the country. Despite these huge efforts made over decades by
the FMoH along with its partners, the expansion of the service fell short of the target set for
1990.
Consequently, the FMoH designed and spearheaded implementation of initiatives (see Annex 3)
aimed at furthering the progress made in expanding vaccination coverage. Supplemental
Immunization Activities (SIAs), Reaching Every District (RED) and Enhanced Routine
Immunization Activities (ERIA) for pastoralist areas and zones with large numbers of
unimmunized children has been implemented throughout the country since 2003 with the
concerted efforts of various stakeholders (FMoH, 2009). Thus, a significant rise in Penta3
coverage from 63% in 2003 to 82% in 2009 was observed (FMoH, 2012).
However, stagnation of the progress in national vaccination coverage started to be observed after
2009 (FMoH 2013). This was further buttressed by the findings of the recent national
vaccination coverage cluster survey, conducted in 2012, which revealed the existence of pockets
of inaccessibility and poor utilization of the service in most regions. According to the findings of
the survey, vaccination coverage varies significantly among regions, and that urban regions
(Addis Ababa, Dire Dawa and Hareri) performed better compared to agrarian regions (Amhara,
SNNP, Oromia and Tigray). The predominantly pastoralist regions (Afar, Somali, Gambella and
Beneshangul-Gumuz) reported the lowest performance (EHNRI, 2012).
High maternal workload combined with lack of knowledge, and hence less value associated with
vaccination were the main reasons to which the unacceptably high dropout rate was ascribed,
according to the survey (EHNRI, 2012). Limited access and poor quality vaccination service
were also identified as the main factors that limit vaccination coverage nationally. The 2012
national vaccination coverage survey showed that only 5% of health posts and 51% of health
centers were providing vaccination services on a daily basis. Moreover, 43% of health posts and
1 At the time of launch of the EPI in 1980 it targeted all children under the age of two years. In 1986 this was
revised to focus on children under one year of age in order to decrease infection exposure times in children
(Birhane et al. 2006).
2
38% of health centers had some significant interruptions of routine EPI service. In some places,
incomplete vaccination and low vaccination coverage have contributed to outbreaks of vaccine-
preventable diseases. Furthermore, inadequate technical and managerial capacity has been
observed at all levels, along with missed opportunities and insufficient prioritization of EPI
within health and health-related programs. Additionally, a lack of regular technical supervision,
high staff turnover and inconvenient service delivery strategies for mothers accounted for the
failure to achieve satisfactory results in routine vaccination programs in Ethiopia (Berhane et al.
2006).
In 2013, the FMoH, with the auspices of its partners, developed the Routine Immunization
Improvement Plan (RIIP) with the intention of accelerating progress in expanding the EPI
service (FMoH, 2013). RIIP is directed towards expanding the cold chain system and enhancing
vaccination coverage nationally through; 1) the use of a combination of approaches including
RED to reach everyone targeted for immunization, taking into consideration the geographical
and socio-economic situations of each region in the country; 2) increasing community demand
for immunization with the help of Health Development Army (HDA) members; and 3)
improvement and strengthening of vaccine management systems.
The Last Ten Kilometers (L10K) Project of the John Snow, Inc. (JSI) Research & Training
Institute, has been selected to support implementation of RIIP by the USAID by the virtue of the
strong reputation of L10K in community-based activities in reproductive, maternal, neonatal and
child health for the last six years. The project is being implemented in seven selected zones with
high numbers of unvaccinated children; namely Awi zone of Amhara region, Zone 3 of Afar,
North Western zone of Tigray, East Wolega zone of Oromia, Yem special woreda, Bench Maji,
and Gedio zones of SNNP region. The L10K project will continue to support the implementation
of RIIP at national level and particularly in the selected zones.
In order to benchmark EPI coverage and inform implementation of the project, L10K conducted
this baseline survey. The L10K strategy to support the RIIP is through fostering zonal-level
planning and monitoring the effort. As such, this survey was conducted to determined baseline
zonal levels of EPI coverage.
3
Objectives
General objective
The general objective of the study is to set benchmark levels of vaccine use in order to measure
progress in project implementation in the targeted zones in Ethiopia.
Specific objectives
1. To measure the EPI vaccination coverage of children by assessing mothers of children
12-23 months of age.
2. To determine neonatal tetanus protected childbirth coverage during the year preceding
the survey.
3. To identify factors impacting the utilization of vaccination services.
4. To assess the readiness of health facilities to provide vaccination services.
4
Methods
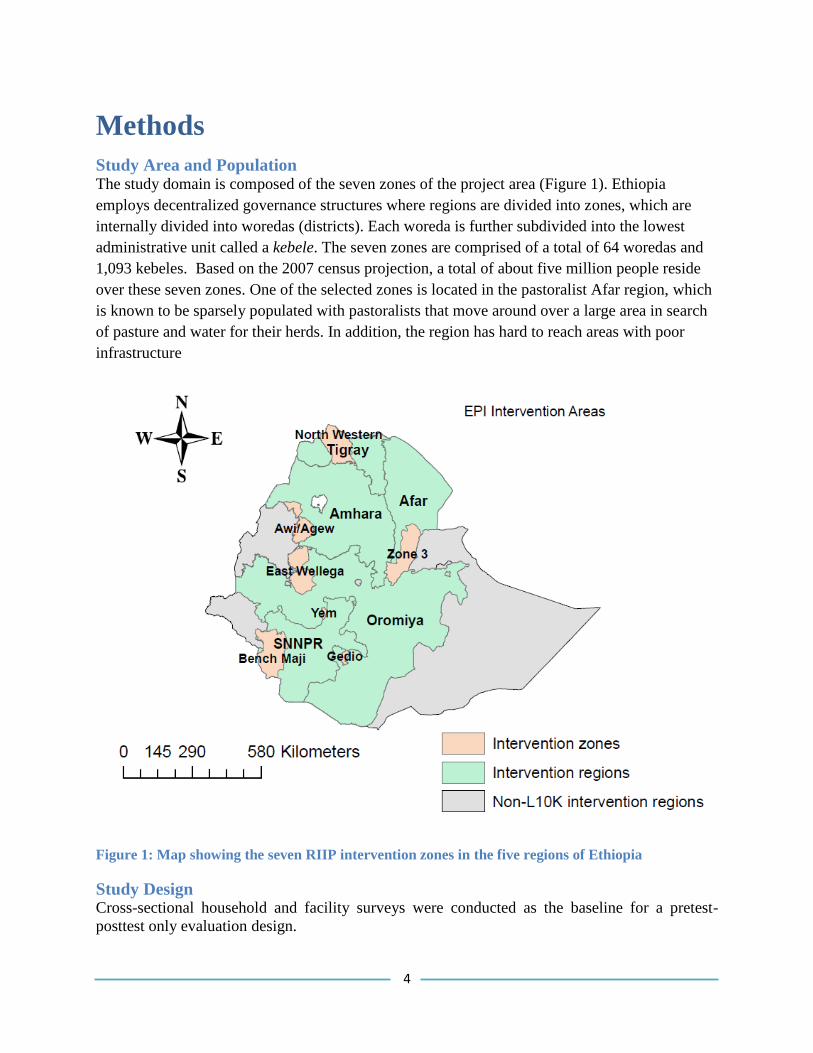
Study Area and Population The study domain is composed of the seven zones of the project area (Figure 1). Ethiopia
employs decentralized governance structures where regions are divided into zones, which are
internally divided into woredas (districts). Each woreda is further subdivided into the lowest
administrative unit called a kebele. The seven zones are comprised of a total of 64 woredas and
1,093 kebeles. Based on the 2007 census projection, a total of about five million people reside
over these seven zones. One of the selected zones is located in the pastoralist Afar region, which
is known to be sparsely populated with pastoralists that move around over a large area in search
of pasture and water for their herds. In addition, the region has hard to reach areas with poor
infrastructure
Figure 1: Map showing the seven RIIP intervention zones in the five regions of Ethiopia
Study Design Cross-sectional household and facility surveys were conducted as the baseline for a pretest-
posttest only evaluation design.
5
The household survey design followed the EPI cluster survey procedures of WHO (WHO, 2005).
Two groups of mothers and health facilities were sampled. Mothers of children 12-23 months of
age were interviewed to collect data on child vaccination and to determine the reasons for no or
incomplete vaccination. Likewise, mothers of children 0-11 months of age were interviewed to
collect data on tetanus toxin (TT) vaccination to determine the levels of neonatal tetanus
protected childbirths. Socio-economic and demographic characteristics were also collected from
both groups of mothers to obtain information on wealth index2 and the socio-demographic
profile of households.
The facility survey included data collected from health facilities serving the selected kebeles of
the household survey. In each kebele the health post and its supervising health center were
assessed. Data was obtained through observation, record review and interviews of service
providers.
Sample Size and Sampling Technique The list of woredas and kebeles with updated population statistics was obtained from the zonal
health departments. The required sample size was calculated for each zone considering the
regional vaccination coverage (EHNRI, 2012). Sample size was determined for measuring
change over time for the pretest-posttest only study design. For the purpose of this study, a two
population proportion formula was devised with equal sample size for comparing baseline and
end-line vaccination coverage. The assumption was made that Pentavalent3/ DPT3 coverage
would increase on average from 68% at baseline to 84% at the end of the project, and protected
at birth against neonatal tetanus (PAB) would increase from 66% to 83%.
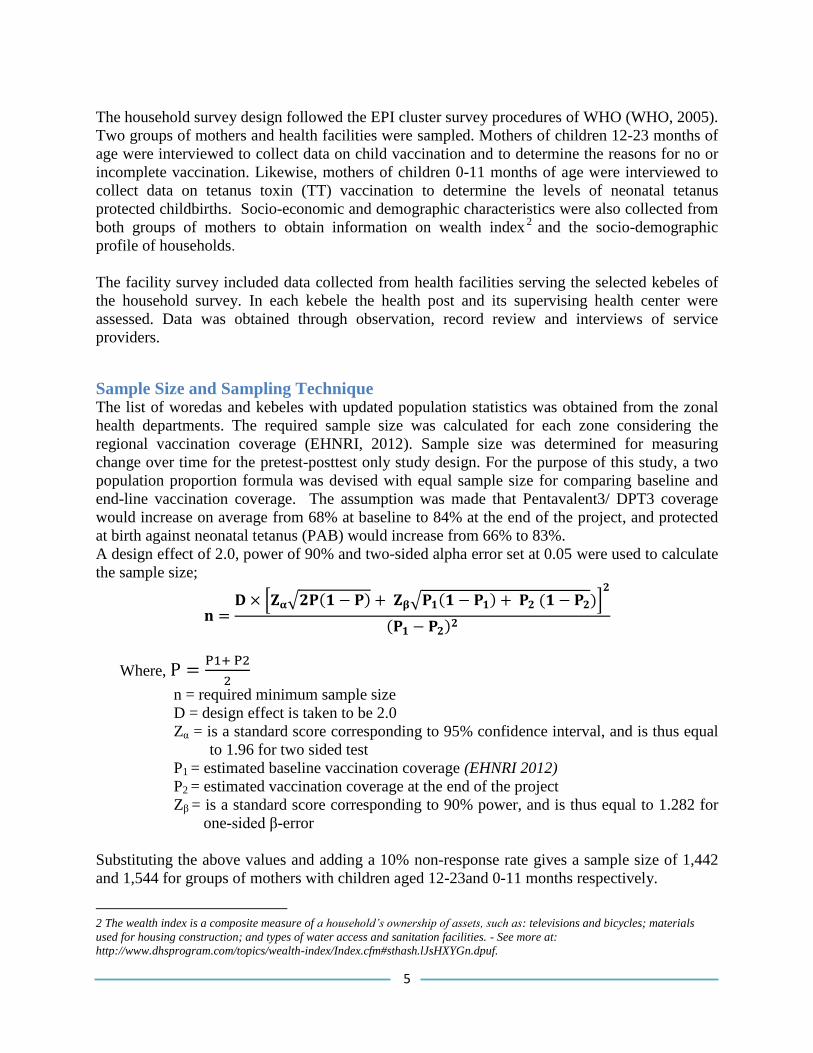
A design effect of 2.0, power of 90% and two-sided alpha error set at 0.05 were used to calculate
the sample size;
𝐧 =𝐃 × [𝐙𝛂√𝟐𝐏(𝟏 − 𝐏) + 𝐙𝛃√𝐏𝟏(𝟏 − 𝐏𝟏) + 𝐏𝟐 (𝟏 − 𝐏𝟐)]
𝟐
(𝐏𝟏 − 𝐏𝟐)𝟐
Where, P =P1+ P2
2
n = required minimum sample size
D = design effect is taken to be 2.0
Zα = is a standard score corresponding to 95% confidence interval, and is thus equal
to 1.96 for two sided test
P1 = estimated baseline vaccination coverage (EHNRI 2012)
P2 = estimated vaccination coverage at the end of the project
Zβ = is a standard score corresponding to 90% power, and is thus equal to 1.282 for
one-sided β-error
Substituting the above values and adding a 10% non-response rate gives a sample size of 1,442
and 1,544 for groups of mothers with children aged 12-23and 0-11 months respectively.
2 The wealth index is a composite measure of a household’s ownership of assets, such as: televisions and bicycles; materials
used for housing construction; and types of water access and sanitation facilities. - See more at:
http://www.dhsprogram.com/topics/wealth-index/Index.cfm#sthash.lJsHXYGn.dpuf.
6
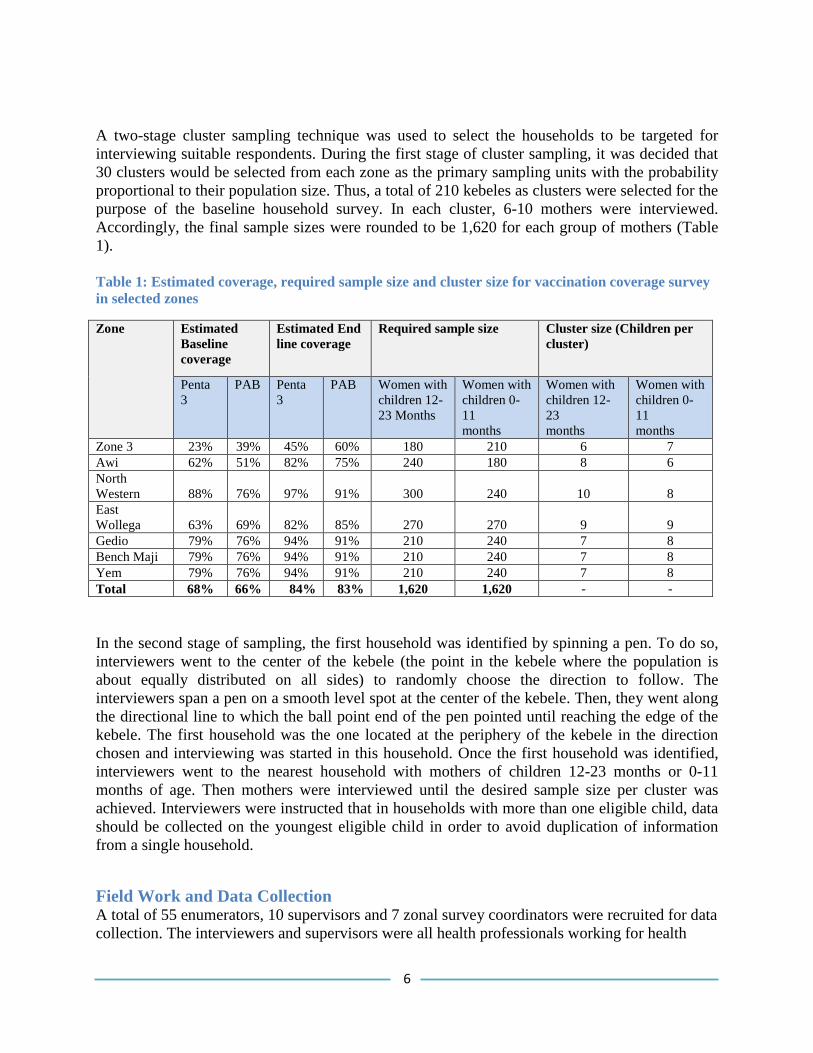
A two-stage cluster sampling technique was used to select the households to be targeted for
interviewing suitable respondents. During the first stage of cluster sampling, it was decided that
30 clusters would be selected from each zone as the primary sampling units with the probability
proportional to their population size. Thus, a total of 210 kebeles as clusters were selected for the
purpose of the baseline household survey. In each cluster, 6-10 mothers were interviewed.
Accordingly, the final sample sizes were rounded to be 1,620 for each group of mothers (Table
1).
Table 1: Estimated coverage, required sample size and cluster size for vaccination coverage survey
in selected zones
Zone Estimated
Baseline
coverage
Estimated End
line coverage
Required sample size Cluster size (Children per
cluster)
Penta
3
PAB Penta
3
PAB Women with
children 12-
23 Months
Women with
children 0-
11
months
Women with
children 12-
23
months
Women with
children 0-
11
months
Zone 3 23% 39% 45% 60% 180 210 6 7
Awi 62% 51% 82% 75% 240 180 8 6
North
Western 88% 76% 97% 91% 300 240 10 8
East
Wollega 63% 69% 82% 85% 270 270 9 9
Gedio 79% 76% 94% 91% 210 240 7 8
Bench Maji 79% 76% 94% 91% 210 240 7 8
Yem 79% 76% 94% 91% 210 240 7 8
Total 68% 66% 84% 83% 1,620 1,620 - -
In the second stage of sampling, the first household was identified by spinning a pen. To do so,
interviewers went to the center of the kebele (the point in the kebele where the population is
about equally distributed on all sides) to randomly choose the direction to follow. The
interviewers span a pen on a smooth level spot at the center of the kebele. Then, they went along
the directional line to which the ball point end of the pen pointed until reaching the edge of the
kebele. The first household was the one located at the periphery of the kebele in the direction
chosen and interviewing was started in this household. Once the first household was identified,
interviewers went to the nearest household with mothers of children 12-23 months or 0-11
months of age. Then mothers were interviewed until the desired sample size per cluster was
achieved. Interviewers were instructed that in households with more than one eligible child, data
should be collected on the youngest eligible child in order to avoid duplication of information
from a single household.
Field Work and Data Collection A total of 55 enumerators, 10 supervisors and 7 zonal survey coordinators were recruited for data
collection. The interviewers and supervisors were all health professionals working for health
7
departments at zonal, woreda or health center levels and were recruited in close consultation with
the zonal health departments. Interviewers who could speak the local language were recruited.
The supervisors and data collectors were assigned to woredas outside of their routine area of
work, in order to ensure the quality and reliability of the data collected. Moreover, in each
cluster, a local guide was used to help the interviewers familiarize themselves with the clusters.
Two-day training for data collectors and supervisors was organized in three sessions. Survey
field teams who used the Amharic version of the questionnaire - specifically, the Afar, Amhara
and SNNP teams - were trained together in one session in Addis Ababa; the Oromia team was
trained in Nekemte; and the team from Tigray was trained in Shire. The training consisted of EPI
essentials, survey tools and data quality maintenance. The survey supervisors reviewed the
responses of each questionnaire for completeness, ensuring proper selection of the first
household in each cluster, and that the coordinators randomly visit the survey teams and then
visit households to validate their responses.
The data were collected from December 2014-January 2015. The standard WHO and Ethiopian
Demographic and Health Survey (EDHS) EPI questions were used. Mothers were asked to show
vaccination cards for the child or TT vaccination, and the dates of vaccination were read and
recorded. If vaccination cards were lost, the maternal report of vaccinations was recorded and
verified from facility registers. Presence of a BCG scar was recorded in surveyed children.
Reasons for not being immunized were also recorded. The survey questionnaires were
administered in three local languages - Amharic (in Afar, Amhara and SNNP), Oromifa (in
Oromia) and Tigregna (in Tigray). In cases when respondents couldn’t speak their local
languages, interviewers translated into local languages.
Data Management and Analysis Five experienced data entry clerks who knew the local languages were recruited. In order to
control for possible errors during data entry a number of checking mechanisms were employed
including spot checking and running intermediate frequencies. Data were entered using EpiData
version 3.1. Data were cleaned and analyzed using Stata version 12.1. Post-stratification
sampling weights were used to adjust the non-proportional allocation of the sample to the
different zones. Thus, weighted analysis was used to ensure representativeness of the survey
estimates at the program level. Socio-demographic data were summarized by frequency tables
and summary statistics. Bivariate logistic regression analyses were used to describe the
association between independent and dependent variables. The p-values for the statistical tests
were two-tailed and set at 0.05.
Ethical Considerations Ethical clearance was obtained from ethical review committees of the regional health bureaus.
All the study participants were informed about the purpose of the study and their right to opt out
or to respond to questions. Informed verbal consent was obtained prior to interviewing any study
subject. The values, rights and norms of the study subjects, the community, enumerators and
supervisors were respected.
8
Results
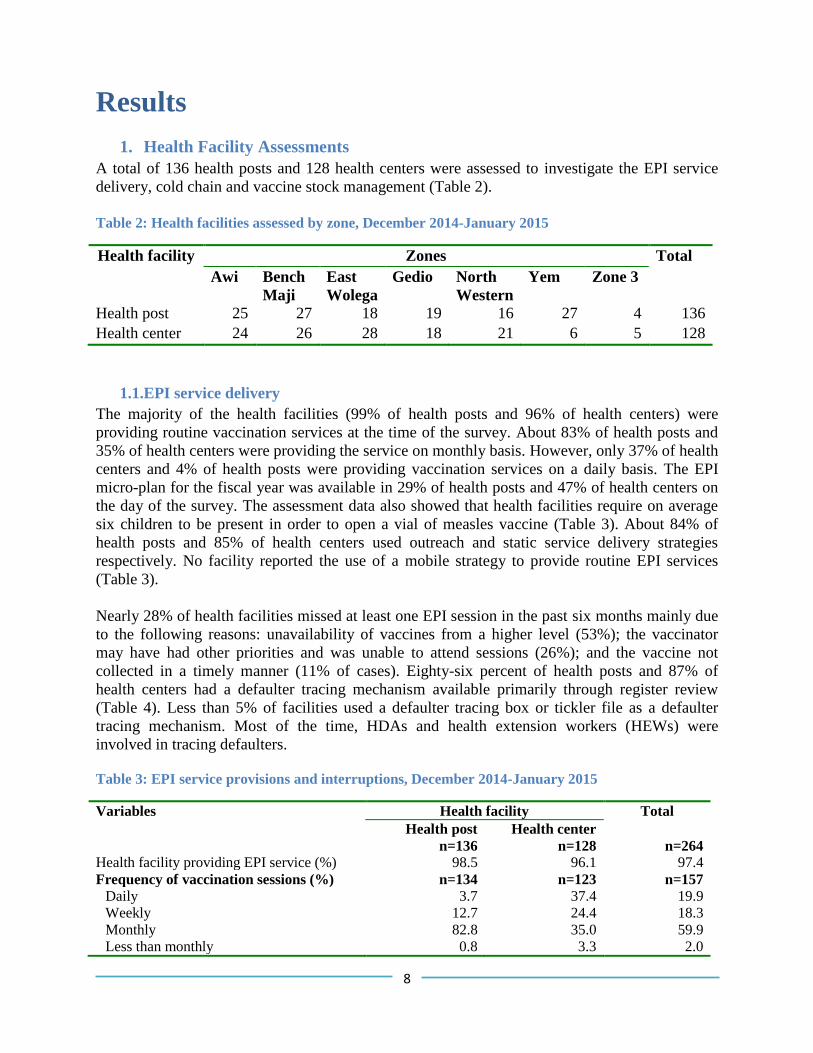
1. Health Facility Assessments
A total of 136 health posts and 128 health centers were assessed to investigate the EPI service
delivery, cold chain and vaccine stock management (Table 2).
Table 2: Health facilities assessed by zone, December 2014-January 2015
Health facility Zones Total
Awi Bench
Maji
East
Wolega
Gedio North
Western
Yem Zone 3
Health post 25 27 18 19 16 27 4 136
Health center 24 26 28 18 21 6 5 128
1.1.EPI service delivery
The majority of the health facilities (99% of health posts and 96% of health centers) were
providing routine vaccination services at the time of the survey. About 83% of health posts and
35% of health centers were providing the service on monthly basis. However, only 37% of health
centers and 4% of health posts were providing vaccination services on a daily basis. The EPI
micro-plan for the fiscal year was available in 29% of health posts and 47% of health centers on
the day of the survey. The assessment data also showed that health facilities require on average
six children to be present in order to open a vial of measles vaccine (Table 3). About 84% of
health posts and 85% of health centers used outreach and static service delivery strategies
respectively. No facility reported the use of a mobile strategy to provide routine EPI services
(Table 3).
Nearly 28% of health facilities missed at least one EPI session in the past six months mainly due
to the following reasons: unavailability of vaccines from a higher level (53%); the vaccinator
may have had other priorities and was unable to attend sessions (26%); and the vaccine not
collected in a timely manner (11% of cases). Eighty-six percent of health posts and 87% of
health centers had a defaulter tracing mechanism available primarily through register review
(Table 4). Less than 5% of facilities used a defaulter tracing box or tickler file as a defaulter
tracing mechanism. Most of the time, HDAs and health extension workers (HEWs) were
involved in tracing defaulters.
Table 3: EPI service provisions and interruptions, December 2014-January 2015
Variables Health facility Total
Health post Health center
n=136 n=128 n=264
Health facility providing EPI service (%) 98.5 96.1 97.4
Frequency of vaccination sessions (%) n=134 n=123 n=157
Daily 3.7 37.4 19.9
Weekly 12.7 24.4 18.3
Monthly 82.8 35.0 59.9
Less than monthly 0.8 3.3 2.0
9
Micro-plan available (%) 29.0 47.1 37.7
Mean number of children required to
open a measles vaccine vial
5.8 6.0 5.9
Service delivery strategies of facilities
Static 15.6 85.6 49.2
Outreach 84.4 14.4 50.8
Mobile 0.0 0.0 0.0
EPI service interruption in the last 6
months (%)
Never 74.6 69.9 72.4
Once or twice 12.7 14.6 13.6
Three or more times 12.7 15.5 14.0
Reasons for service interruption (%)
Vaccines not collected timely 3.0 19.5 12.2
Lack of transport for regular supply 3.0 4.9 4.1
Vaccine was spoiled/expired 0.0 0.0 0.0
Vaccine not available 63.6 41.5 51.4
Vaccinator had other priorities and unable
to attend sessions
30.3
22.0
25.7
No kerosene available for refrigerator 0.0 2.4 1.4
Refrigerator required maintenance 0.0 0.0 0.0
Other 0.0 4.9 2.7
Unknown 0.0 4.9 2.7
Table 4: EPI defaulter tracing mechanism of health facilities, December 2014-January 2015
Health facilities Total
Health post Health center
Defaulter tracing mechanism (%) n=107 n=105 n=212
Review of register by HEW 67.3 30.5 49.1
Review of register by other health
worker
0.9 60.0 30.2
Register kept by HDA/CHW 5.6 0.0 2.8
Family folder review 13.1 0.0 6.6
Defaulter box (card box) 5.6 1.9 3.8
Box with child card with month of
expected return
0.9 0.0 0.5
Other 6.5 3.8 5.2
Unknown 0.0 3.8 1.9
Persons involved for defaulter tracing
(%)
HDA/CHW 64.9 46.7 55.9
Kebele Administrator 15.7 23.8 19.7
HEW 60.5 37.1 48.9
NGO staff 2.2 4.8 3.5
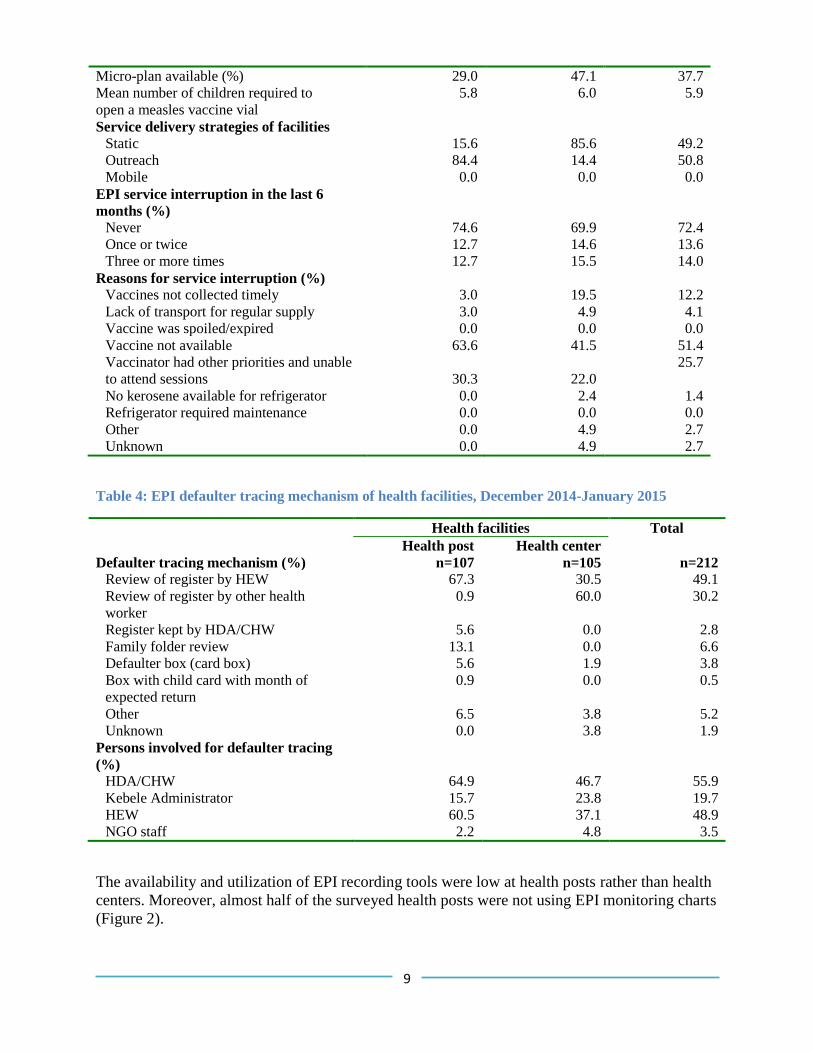
The availability and utilization of EPI recording tools were low at health posts rather than health
centers. Moreover, almost half of the surveyed health posts were not using EPI monitoring charts
(Figure 2).
10
Figure 2: EPI record keeping tool use at the time of the survey, December 2014-January 2015
1.2.Cold chain and vaccine stock management
Almost all health centers and one-third of health posts had at least one refrigerator for EPI
activities. However, in 32% of health centers and 71% of health posts their refrigerator was not
functional at the time of the survey mainly due to either unavailability of energy/fuel (20%) or
that the refrigerator was not installed (19%) (Table 5). The assessment also revealed that over
90% of health posts and health centers received vaccines at least once a month.
More than two-thirds of facilities encountered break-down of the vaccine refrigerators in the
previous three months before the study. The median time that refrigerators were broken-down in
this time was 90 days for health posts and 17 days for health centers. Of facilities which had
functional refrigerators, the temperature reading was out of the recommended range of 2-8ºC in
46% of health posts and 23% of health centers on the day of the visit (Table 5).
Table 5: Cold chain management of health facilities, December 2014-January 2015
Health facilities Total
Health post Health center
Availability of vaccine refrigerator (%) n=134 n=123 n=257
None 66.4 0.8 35.0
One 30.6 23.6 27.2
Two or more 3.0 75.6 37.8
Health facilities that all vaccine refrigerators
were in use (%)
28.9 68.3 47.8
Reasons for non‐use of vaccine
refrigerator (%)
n=38 n=37 n=75
Not installed 23.7 13.5 18.7
83
68 69 72
51
9081
9590
82
Immunization card
Tally sheet Register Monthly reporting format
EPI monitoring
chart
Health post (n=134) Health center (n=123)
%
11
Not needed because of extra fridge 0.0 13.5 6.7
Energy/fuel not available 31.6 37.8 20.0
Needs maintenance 2.6 8.1 2.7
Other 0.0 5.4 2.7
Unknown 42.1 21.6 32.0
Encountered break down of the vaccine
refrigerator in the last 3 months (%)
37.8
22.1
26.6
Median number of days the refrigerator were
broken-down in the last 3 months
90 .0 17 .0 30.0
Temperature of the refrigerator currently
in use (%)
n=13 n=140 n=153
<+20C 7.7 5.0 5.2
+2 to +80C 53.9 77.1 75.2
>+80C 38.5 17.9 19.6
Mean 10.0 6.3 6.7
Range -2 to +300C 0 to +27
0C -2 to +30
0C
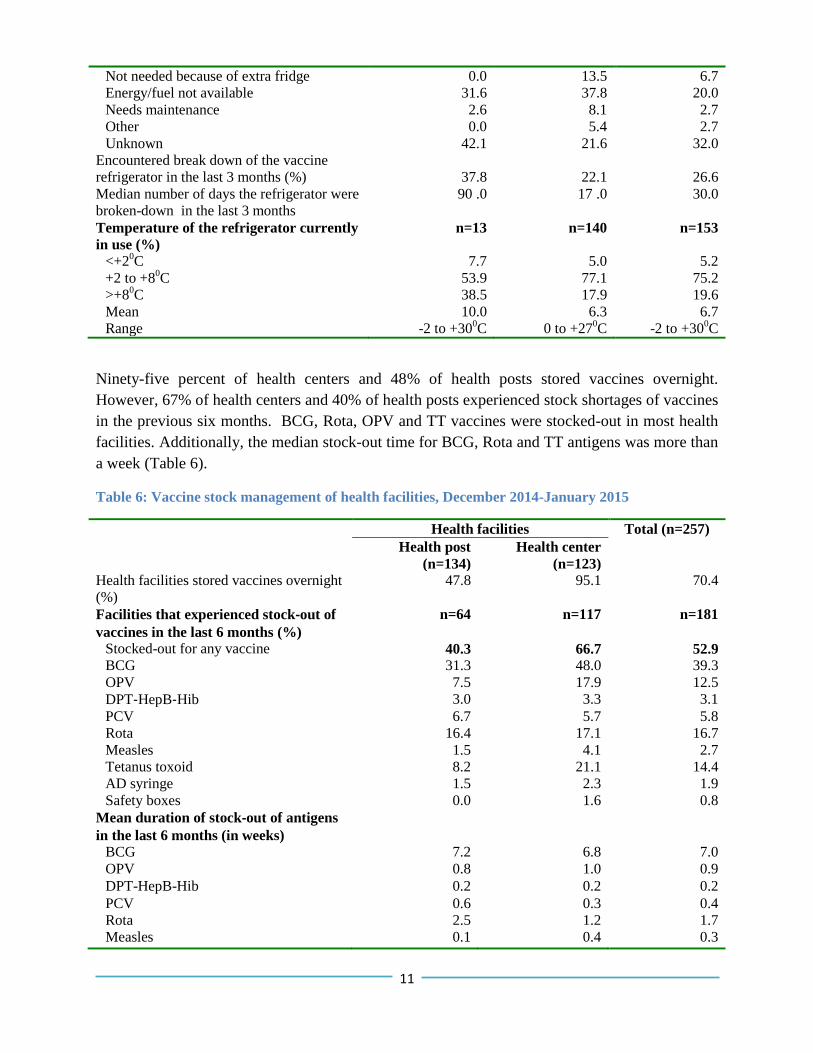
Ninety-five percent of health centers and 48% of health posts stored vaccines overnight.
However, 67% of health centers and 40% of health posts experienced stock shortages of vaccines
in the previous six months. BCG, Rota, OPV and TT vaccines were stocked-out in most health
facilities. Additionally, the median stock-out time for BCG, Rota and TT antigens was more than
a week (Table 6).
Table 6: Vaccine stock management of health facilities, December 2014-January 2015
Health facilities Total (n=257)
Health post
(n=134)
Health center
(n=123)
Health facilities stored vaccines overnight
(%)
47.8 95.1 70.4
Facilities that experienced stock‐out of
vaccines in the last 6 months (%)
n=64 n=117 n=181
Stocked-out for any vaccine 40.3 66.7 52.9
BCG 31.3 48.0 39.3
OPV 7.5 17.9 12.5
DPT‐HepB‐Hib 3.0 3.3 3.1
PCV 6.7 5.7 5.8
Rota 16.4 17.1 16.7
Measles 1.5 4.1 2.7
Tetanus toxoid 8.2 21.1 14.4
AD syringe 1.5 2.3 1.9
Safety boxes 0.0 1.6 0.8
Mean duration of stock‐out of antigens
in the last 6 months (in weeks)
BCG 7.2 6.8 7.0
OPV 0.8 1.0 0.9
DPT-HepB-Hib 0.2 0.2 0.2
PCV 0.6 0.3 0.4
Rota 2.5 1.2 1.7
Measles 0.1 0.4 0.3
12
Tetanus toxoid 1.2 1.5 1.4
AD syringe 0.1 0.2 0.2
Safety boxes 0.0 0.1 0.07
1.3.Supervision and EPI in-service training
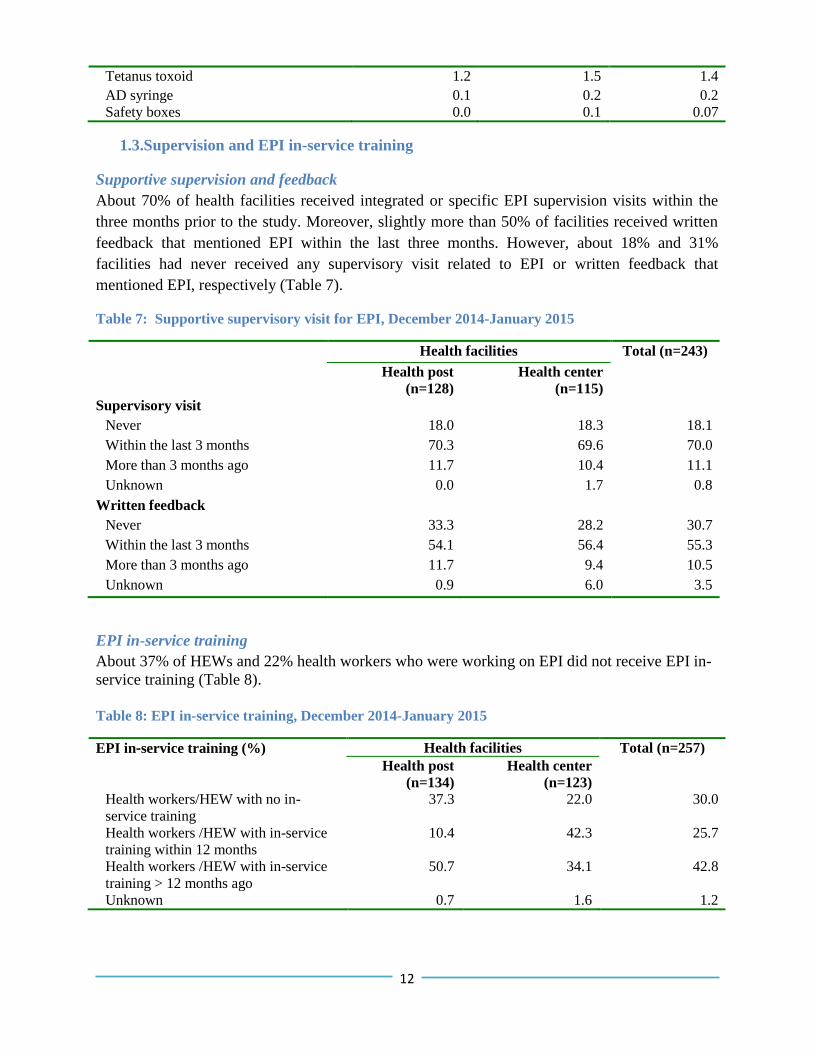
Supportive supervision and feedback
About 70% of health facilities received integrated or specific EPI supervision visits within the
three months prior to the study. Moreover, slightly more than 50% of facilities received written
feedback that mentioned EPI within the last three months. However, about 18% and 31%
facilities had never received any supervisory visit related to EPI or written feedback that
mentioned EPI, respectively (Table 7).
Table 7: Supportive supervisory visit for EPI, December 2014-January 2015
Health facilities Total (n=243)
Health post
(n=128)
Health center
(n=115)
Supervisory visit
Never 18.0 18.3 18.1
Within the last 3 months 70.3 69.6 70.0
More than 3 months ago 11.7 10.4 11.1
Unknown 0.0 1.7 0.8
Written feedback
Never 33.3 28.2 30.7
Within the last 3 months 54.1 56.4 55.3
More than 3 months ago 11.7 9.4 10.5
Unknown 0.9 6.0 3.5
EPI in-service training
About 37% of HEWs and 22% health workers who were working on EPI did not receive EPI in-
service training (Table 8).
Table 8: EPI in-service training, December 2014-January 2015
EPI in‐service training (%) Health facilities Total (n=257)
Health post
(n=134)
Health center
(n=123)
Health workers/HEW with no in-
service training
37.3 22.0 30.0
Health workers /HEW with in-service
training within 12 months
10.4 42.3 25.7
Health workers /HEW with in-service
training > 12 months ago
50.7 34.1 42.8
Unknown 0.7 1.6 1.2
13
2. Child Vaccination
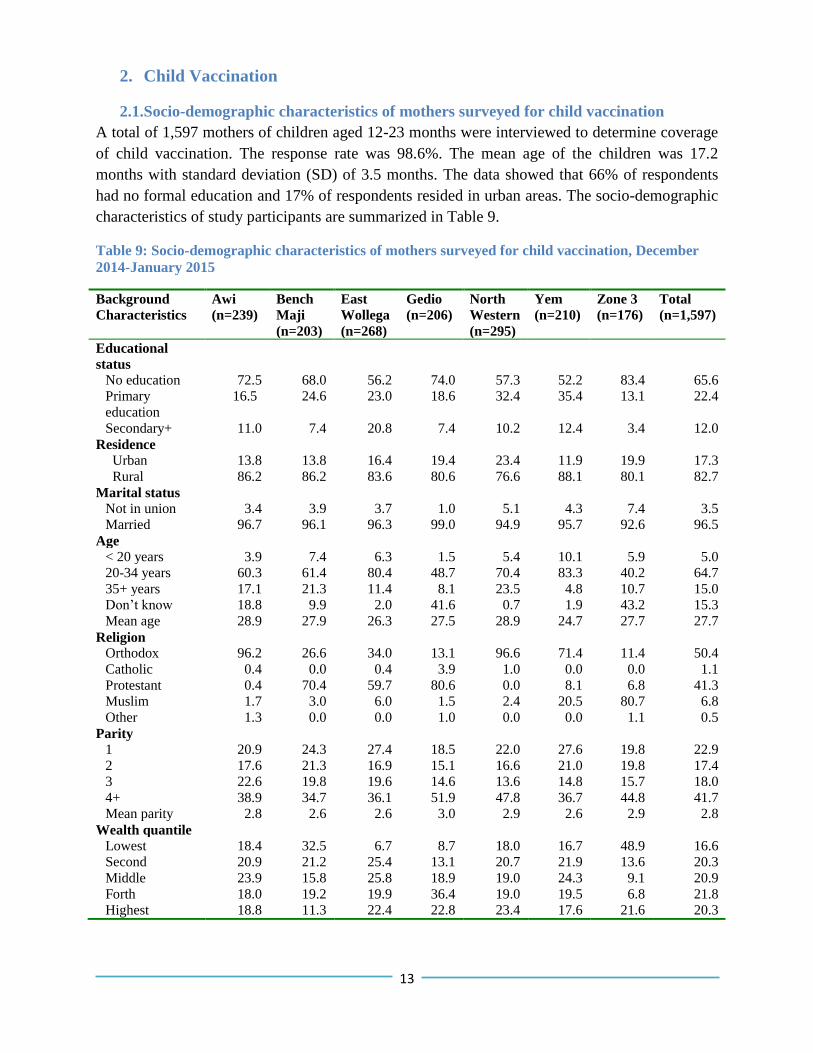
2.1.Socio-demographic characteristics of mothers surveyed for child vaccination
A total of 1,597 mothers of children aged 12-23 months were interviewed to determine coverage
of child vaccination. The response rate was 98.6%. The mean age of the children was 17.2
months with standard deviation (SD) of 3.5 months. The data showed that 66% of respondents
had no formal education and 17% of respondents resided in urban areas. The socio-demographic
characteristics of study participants are summarized in Table 9.
Table 9: Socio-demographic characteristics of mothers surveyed for child vaccination, December
2014-January 2015
Background
Characteristics
Awi
(n=239)
Bench
Maji
(n=203)
East
Wollega
(n=268)
Gedio
(n=206)
North
Western
(n=295)
Yem
(n=210)
Zone 3
(n=176)
Total
(n=1,597)
Educational
status
No education 72.5 68.0 56.2 74.0 57.3 52.2 83.4 65.6
Primary
education
16.5 24.6 23.0 18.6 32.4 35.4 13.1 22.4
Secondary+ 11.0 7.4 20.8 7.4 10.2 12.4 3.4 12.0
Residence
Urban 13.8 13.8 16.4 19.4 23.4 11.9 19.9 17.3
Rural 86.2 86.2 83.6 80.6 76.6 88.1 80.1 82.7
Marital status
Not in union 3.4 3.9 3.7 1.0 5.1 4.3 7.4 3.5
Married 96.7 96.1 96.3 99.0 94.9 95.7 92.6 96.5
Age
< 20 years 3.9 7.4 6.3 1.5 5.4 10.1 5.9 5.0
20-34 years 60.3 61.4 80.4 48.7 70.4 83.3 40.2 64.7
35+ years 17.1 21.3 11.4 8.1 23.5 4.8 10.7 15.0
Don’t know 18.8 9.9 2.0 41.6 0.7 1.9 43.2 15.3
Mean age 28.9 27.9 26.3 27.5 28.9 24.7 27.7 27.7
Religion
Orthodox 96.2 26.6 34.0 13.1 96.6 71.4 11.4 50.4
Catholic 0.4 0.0 0.4 3.9 1.0 0.0 0.0 1.1
Protestant 0.4 70.4 59.7 80.6 0.0 8.1 6.8 41.3
Muslim 1.7 3.0 6.0 1.5 2.4 20.5 80.7 6.8
Other 1.3 0.0 0.0 1.0 0.0 0.0 1.1 0.5
Parity
1 20.9 24.3 27.4 18.5 22.0 27.6 19.8 22.9
2 17.6 21.3 16.9 15.1 16.6 21.0 19.8 17.4
3 22.6 19.8 19.6 14.6 13.6 14.8 15.7 18.0
4+ 38.9 34.7 36.1 51.9 47.8 36.7 44.8 41.7
Mean parity 2.8 2.6 2.6 3.0 2.9 2.6 2.9 2.8
Wealth quantile
Lowest 18.4 32.5 6.7 8.7 18.0 16.7 48.9 16.6
Second 20.9 21.2 25.4 13.1 20.7 21.9 13.6 20.3
Middle 23.9 15.8 25.8 18.9 19.0 24.3 9.1 20.9
Forth 18.0 19.2 19.9 36.4 19.0 19.5 6.8 21.8
Highest 18.8 11.3 22.4 22.8 23.4 17.6 21.6 20.3
14
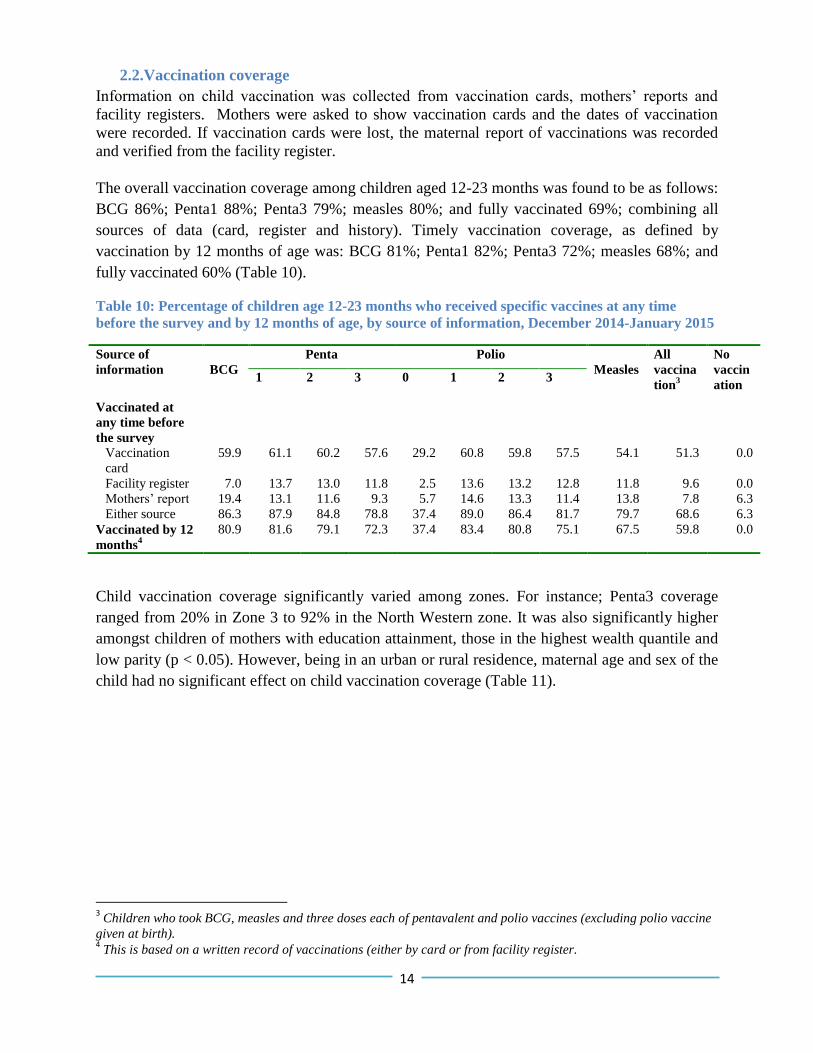
2.2.Vaccination coverage
Information on child vaccination was collected from vaccination cards, mothers’ reports and
facility registers. Mothers were asked to show vaccination cards and the dates of vaccination
were recorded. If vaccination cards were lost, the maternal report of vaccinations was recorded
and verified from the facility register.
The overall vaccination coverage among children aged 12-23 months was found to be as follows:
BCG 86%; Penta1 88%; Penta3 79%; measles 80%; and fully vaccinated 69%; combining all
sources of data (card, register and history). Timely vaccination coverage, as defined by
vaccination by 12 months of age was: BCG 81%; Penta1 82%; Penta3 72%; measles 68%; and
fully vaccinated 60% (Table 10).
Table 10: Percentage of children age 12-23 months who received specific vaccines at any time
before the survey and by 12 months of age, by source of information, December 2014-January 2015
Source of
information
BCG
Penta Polio
Measles
All
vaccina
tion3
No
vaccin
ation 1 2 3 0 1 2 3
Vaccinated at
any time before
the survey
Vaccination
card
59.9 61.1 60.2 57.6 29.2 60.8 59.8 57.5 54.1 51.3 0.0
Facility register 7.0 13.7 13.0 11.8 2.5 13.6 13.2 12.8 11.8 9.6 0.0
Mothers’ report 19.4 13.1 11.6 9.3 5.7 14.6 13.3 11.4 13.8 7.8 6.3
Either source 86.3 87.9 84.8 78.8 37.4 89.0 86.4 81.7 79.7 68.6 6.3
Vaccinated by 12
months4
80.9 81.6 79.1 72.3 37.4 83.4 80.8 75.1 67.5 59.8 0.0
Child vaccination coverage significantly varied among zones. For instance; Penta3 coverage
ranged from 20% in Zone 3 to 92% in the North Western zone. It was also significantly higher
amongst children of mothers with education attainment, those in the highest wealth quantile and
low parity (p < 0.05). However, being in an urban or rural residence, maternal age and sex of the
child had no significant effect on child vaccination coverage (Table 11).
3 Children who took BCG, measles and three doses each of pentavalent and polio vaccines (excluding polio vaccine
given at birth). 4 This is based on a written record of vaccinations (either by card or from facility register.
15
Table 11: Percentage of children aged 12-23 months who received specific vaccines at any time
before the survey, by background characteristics (univariate analysis), December 2014-January
2015
Background
Characteristics
BCG
Penta Polio
Measles
All
vaccination
No
vaccination 1 2 3 1 2 3
Child’s sex
(n=1,596)
Male 86.4 87.7 85.0 78.9 89.6 86.2 81.6 80.6 69.3 6.5
Female 86.2 88.1 84.6 78.6 88.3 86.6 81.9 78.8 68.0 6.1
Parity (n=1,590)
1 88.2 91.3* 87.3 82.9 91.3* 88.7** 83.9* 83.3** 72.9 4.3*
2 86.3 89.8 86.3 78.2 93.6 90.7 84.2 80.1 68.5 2.4
3 89.2 88.9 86.2 80.6 88.9 87.0 83.0 80.5 69.2 6.0
4+ 84.3 85.1 82.4 76.2 86.1 83.4 79.4 77.6 66.4 8.9
Residence
(n=1,597)
Urban 90.5 88.5 87.3 83.0 89.1 88.8 85.2 83.3 75.7 6.3
Rural 85.4 87.8 84.2 77.9 88.9 85.9 81.0 79.0 67.2 6.3
Zone (n=1,597)
Awi 91.2* 92.9* 92.9* 89.1* 91.2* 90.4* 88.7* 87.0* 79.9* 7.1**
Bench Maji 86.7 90.6 84.2 72.9 88.7 84.2 77.8 76.4 56.7 2.5
East Wollega 90.7 93.3 88.1 79.9 93.3 90.7 83.6 81.7 69.0 2.6
Gedio 77.2 77.2 75.2 72.8 82.0 79.6 76.2 76.7 66.0 10.7
North Western 96.6 97.6 97.0 91.9 96.6 96.3 92.9 87.8 82.4 1.4
Yem 93.8 90.0 88.1 87.6 89.5 89.5 90.0 89.1 86.7 9.1
Zone 3 35.8 34.7 26.1 19.9 55.7 40.9 31.8 25.6 8.0 35.2
Mother's age
(n=1,330)
<20 years 82.8 89.7 82.0 75.3 88.8 85.5 78.7 74.9 62.3 4.2
20-34 years 89.8 90.2 87.0 80.5 91.2 88.9 84.2 82.9 71.7 4.4
35+ years 88.1 89.8 89.6 83.5 88.4 85.6 82.1 80.6 70.7 6.1
Mother's
education
(n=1,585)
No education 83.8* 85.8* 82.3* 76.2* 87.8** 84.9** 79.8** 77.3* 66.0** 7.9*
Primary 89.6 90.4 87.3 80.7 88.9 86.3 83.0 82.5 69.6 3.6
Secondary + 93.6 95.1 93.5 88.8 95.7 94.9 89.4 88.2 80.6 2.1
Marital status
(n=1,597)
Not in union 81.7 81.3 77.8 74.1 81.4 74.4** 72.9 76.7 60.8 10.7
Married 86.5 88.1 85.0 79.0 89.3 86.8 82.1 79.8 68.9 6.1
Distance from
vaccination site
(n=1,539)
< 1hour 87.8* 89.0 86.2** 79.9 89.7 87.1 82.4 80.8 69.8 5.5
>=1 hour 78.8 83.9 77.6 73.7 87.4 85.3 80.5 74.7 62.3 8.5
Wealth quantile
(1,597)
Lowest 71.2* 74.2* 68.4* 61.2* 77.2** 72.8** 67.0* 63.8* 46.0* 15.5**
Second 90.0 91.6 89.2 82.1 93.3 91.8 87.3 81.7 70.8 3.0
Middle 88.1 90.9 86.3 81.6 92.1 89.1 83.3 80.2 70.9 4.6
Fourth 86.8 88.7 85.5 79.6 87.6 83.9 80.5 83.7 69.2 6.1
Highest 92.5 91.4 91.2 86.1 92.5 91.8 87.9 86.0 78.7 4.0
Total 86.3 87.9 84.8 78.8 89.0 86.4 81.7 79.7 68.6 6.3
*p-value<0.01; ** p-value <0.05
16
2.3.Comparison between survey coverage and routine HMIS data
Routine EPI health management information system (HMIS) data were collected from surveyed
health posts for the period of December 2012-December 2013, which covers the birth cohort of
the surveyed children for vaccination.
As such, a comparative analysis was done for HMIS reports of rural health posts and survey
coverage of rural areas. As indicated in figure 2 below, there were a 13% and 12% disparities in
PAB and complete vaccination coverage between routine HMIS and survey coverage
respectively (Figure 3).
Figure 3: Comparison of vaccination coverage between survey and HMIS reports, December 2014-
January 2015
85 88
78 81 79
67 68
85
94 88 86
82 79 81
BCG Penta1 Penta3 Polio3 Measles Fully PAB
%
Survey HMIS
17
1.1.Access, utilization and quality of vaccination services
Access and utilization
Penta1 coverage was used as a proxy indicator to measure access to vaccination services. The
overall access to vaccination services was about 88%. The best access to vaccination services
was recorded in North Western, East Wolega, Awi, Bench Maji and Yem zones. Access to
vaccination was lowest in the Afar and Gedio zones.
Penta3 coverage and drop-out rates were used to measure utilization and program continuity
respectively. The survey revealed that the overall Penta3 coverage was 79% with wide zonal
variations (Table 11).
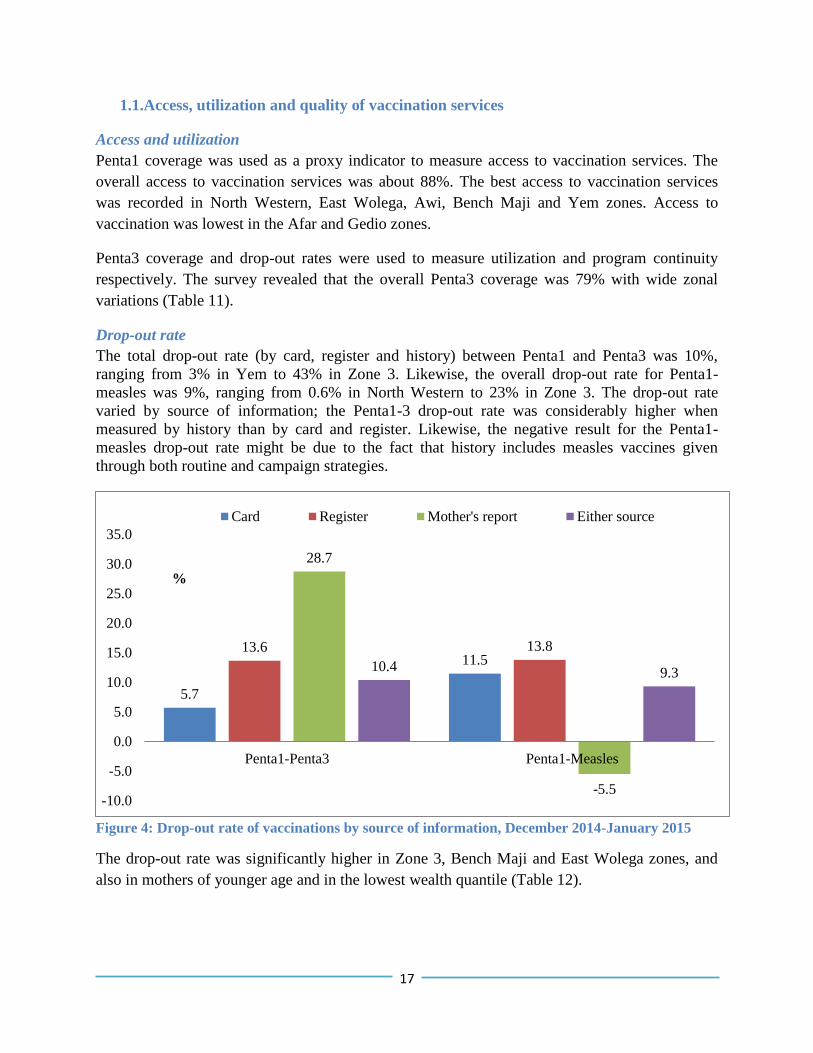
Drop-out rate
The total drop-out rate (by card, register and history) between Penta1 and Penta3 was 10%,
ranging from 3% in Yem to 43% in Zone 3. Likewise, the overall drop-out rate for Penta1-
measles was 9%, ranging from 0.6% in North Western to 23% in Zone 3. The drop-out rate
varied by source of information; the Penta1-3 drop-out rate was considerably higher when
measured by history than by card and register. Likewise, the negative result for the Penta1-
measles drop-out rate might be due to the fact that history includes measles vaccines given
through both routine and campaign strategies.
Figure 4: Drop-out rate of vaccinations by source of information, December 2014-January 2015
The drop-out rate was significantly higher in Zone 3, Bench Maji and East Wolega zones, and
also in mothers of younger age and in the lowest wealth quantile (Table 12).
5.7
11.5 13.6 13.8
28.7
-5.5
10.4 9.3
-10.0
-5.0
0.0
5.0
10.0
15.0
20.0
25.0
30.0
35.0
Penta1-Penta3 Penta1-Measles
%
Card Register Mother's report Either source
%
18
Table 12: Drop-out rate, by background characteristics (univariate analysis), December 2014-
January 2015
Background Characteristics Dropout rate
Penta1-Penta3 Penta1-Measles
Child’s sex (n=1,596)
Male 10.1 8.0
Female 10.8 10.6
Parity (n=1,590)
1 9.3 8.8
2 13.1 10.8
3 9.3 9.4
4+ 10.5 8.8
Residence (n=1,597)
Urban 6.2 5.9
Rural 11.3 10.0
Zone (n=1,597)
Awi 4.1* 6.3*
Bench Maji 19.6 15.1
East Wollega 14.5 12.1
Gedio 5.8 0.6
North Western 5.9 10.0
Yem 2.7 1.1
Zone 3 42.6 22.5
Mother's age (n=1,330)
<20 years 16.1** 16.4**
20-34 years 10.8 8.0
35+ years 7.0 10.2
Mother's education (n=1,585)
No education 11.2 9.9 Primary 10.7 8.7 Secondary + 6.7 7.3
Marital status (n=1,597)
Not in union 8.9 5.7 Married 10.5 9.4
Distance from vaccination site (n=1,539)
< 1hour 10.3 9.2 >=1 hour 12.2 11.0
Wealth quantile (1,597)
Lowest 17.5* 14.0* Second 10.5 10.8 Middle 10.3 11.8 Fourth 10.5 5.7 Highest 5.8 5.8
Total 10.4 9.3
*p-value<0.01; ** p-value <0.05
19
BCG scar formation
The presence of BCG scar was recorded in surveyed children. The data revealed that the BCG
scar rate was 81% (83% among those recorded by card versus 77% among those recorded by
history). Significant variation in the absence of BCG scar formation was found between zones:
Awi (24%) and Zone 3 (22%) and Yem (21%) had the highest proportion of BCG vaccinated
children without BCG scars, while the North Western had the lowest (Figure 5).
Figure 5: Proportion of children vaccinated with BCG which had no BCG scar on their arms,
during December 2014-January 2015.
Valid vaccination coverage
The term valid dose is defined as vaccinations that were given when the child was the
appropriate age after an appropriate minimum interval between doses and evidenced by card or
register. A vaccine dose administered after an invalid dose was considered as invalid, even when
the interval had been respected. BCG vaccination recorded by history was considered valid if
there was a scar on the child’s arm. All vaccinations (except BCG) not evidenced by written
record were considered invalid (WHO, 2005).
The overall valid vaccination coverage was: BCG 83%; Penta1 69%; Penta3 57%; measles 50%
and complete vaccination 36%. The findings of the valid dose analysis also showed that invalid
doses accounted for up to 32% of vaccinations. Timeliness of the valid doses given, as defined
by timely doses provided before 12 months of age, was also assessed. Thus, timely valid dose
coverage by antigen was BCG 68%; Penta1 66%; Penta3 53%; measles 39% and complete
vaccination 27% (Table 13).
AwiBench
Maji
East
Wolleg
a
GedioNorth
WesternYem Zone 3 Total
Card 24.6 11.5 13.5 16.4 12.8 21.0 36.8 16.5
Mother's report 20.4 22.9 27.7 15.6 23.8 20.3 16.7 23.0
Either source 23.6 17.5 18.3 16.4 15.2 20.8 22.7 18.5
0.0
5.0
10.0
15.0
20.0
25.0
30.0
35.0
40.0
%
20
Table 13: Percentage of children age 12-23 months who received valid doses of vaccines at any time
before the survey and by 12 months of age, by source of information, December 2014-January 2015
BCG
Penta Polio
Measles
All
vaccination 1 2 3 1 2 3
Valid dose at any time
before the survey
Awi 90.8 84.9 77.8 71.1 84.5 74.9 68.6 65.7 49.4
Bench Maji 80.3 66.0 61.6 54.2 63.6 58.1 53.2 45.3 32.0
East Wollega 86.2 66.8 60.1 52.2 65.8 57.8 49.6 44.0 30.6
Gedio 76.2 57.8 54.4 49.5 57.8 53.4 47.6 48.5 32.0
North Western 93.9 86.1 81.4 72.2 84.4 78.6 68.8 61.4 47.5
Yem 92.9 83.8 75.2 71.0 83.8 74.8 71.0 54.3 42.4
Zone 3 31.8 9.7 8.0 6.8 9.1 7.4 6.8 4.0 2.3
Total 83.4 69.3 63.9 57.3 68.3 61.7 54.9 50.4 36.3
Valid dose coverage by
12 months
Awi 82.9 82.4 74.5 67.0 82.4 70.7 64.0 51.1 34.7
Bench Maji 62.6 62.6 57.6 50.3 60.6 54.2 49.3 35.0 25.1
East Wollega 69.4 64.9 57.8 48.9 64.2 56.0 46.6 33.2 23.9
Gedio 52.4 48.1 49.5 42.7 48.1 47.1 41.3 34.5 21.4
North Western 86.8 83.4 77.0 70.2 83.1 75.9 66.8 50.5 36.6
Yem 80.5 81.4 73.8 64.3 80.5 72.9 64.8 34.3 23.3
Zone 3 9.1 8.5 8.0 6.8 8.0 7.4 6.8 2.8 1.7
Total 68.1 65.5 60.5 53.1 64.9 58.2 51.0 38.5 26.7
Card retention
The card retention rate was found to be 61%. For example for Penta1, of those children that were
reported to be vaccinated, about 14% were verified from facility registers. Card retention was
higher in North Western, Awi, Yem, Gedio and East Wolega zones (Figure 6).
21
Figure 6: Card retention by zone, December 2014-January 2015
Client-provider interaction
Overall, more than a quarter of mothers were not told about the potential side-effects associated
with vaccines. Likewise, nearly two-thirds of mothers were not told what to do if the child
experienced side-effects. The communication gap was much higher in Gedio and Zone 3 (Figure
7).
Figure 7: Percentage of mothers that were told about side effects of vaccines, December 2014-
January 2015
72
43
61 62
77
66
11
61
Awi Bench Maji East
Wollega
Gedio North
Western
Yem Zone 3 Total
86 85
72
42
85 90
45
72
82 82
60
39
78 85
32
66
Awi Bench Maji East
Wollega
Gedio North
Western
Yem Zone 3 Total
%
Told about side effects Told about what to do if the child experienced side effects
22
1.2. Determinants of complete vaccination
Multivariate analysis was carried out to identify determinant factors for complete vaccination.
Socio-demographic characteristics of mothers, wealth index, accessibility and readiness of the
health facilities were included in the factor analysis.
Socio-demographic characteristics, wealth index and accessibility
Wealth quantile remained significantly associated with complete vaccination for all zones.
However, determinant factors varied across zones. In Yem for example, parity and maternal age
were independent predictors for complete vaccination. Likewise, maternal education, marital
status and wealth quantile were the determinant factors for complete vaccination in Zone 3
(Table 14).
Table 14: Factors associated with complete vaccination among mothers of children aged 12-23
months by background characteristics (multivariate analysis), December 2014-January 2015
Background
Characteristics
Awi
(n=239)
Bench
Maji
(n=203)
East
Wollega
(n=268)
Gedio
(n=206)
North
Western
(n=295)
Yem
(n=210)
Zone 3
(n=176)
Total
(n=1,597)
Child’s sex
Male 80.3 60.0 70.7 65.7 81.2 88.5 9.2 69.3
Female 79.5 54.0 67.2 66.4 83.3 84.5 6.4 68.0
Parity
1 84.0 61.2 69.9 79.0 83.1 94.8** 11.8 72.9
2 90.5 46.5 68.9 61.3 87.8 81.8 11.8 68.5
3 72.2 55.0 73.1 76.7 80.0 87.1 3.7 69.2
4+ 77.4 61.4 66.7 59.8 80.9 83.1 5.2 66.4
Residence
Urban 93.9 75.0 79.6 62.5 84.1 96.0 17.1 75.7
Rural 77.7 53.7 67.0 66.9 81.9 85.4 5.7 67.2
Mother's age
<20 years 88.9 53.3 56.3 66.7 68.8 81.0** 20.0 62.3
20-34 years 85.8 58.1 69.3 65.6 83.6 86.8 13.2 71.7
35+ years 80.0 55.8 75.9 62.5 81.2 100.0 0.0 70.7
Mother's
education
No education 76.6 51.5 67.1 68.2 82.7 83.5 4.1** 66.0
Primary 82.1 64.0 70.5 52.6 79.0 87.8 26.1 69.6
Secondary + 96.2 80.0 74.6 73.3 90.0 96.2 33.3 80.6
Marital status
Not in union 87.5 62.5 60.0 0.0 66.7 77.8 23.1* 60.8
Married 79.7 56.4 69.4 66.7 83.2 87.1 6.8 68.9
Distance from
vaccination site
< 1hour 81.0 56.8 69.6 64.8 83.8 83.9 7.8 69.8
>=1 hour 50.0 55.6 68.4 69.6 73.2 100.0 10.3 62.3
Wealth quantile
Lowest 65.9** 42.4** 66.7 33.3** 73.6* 80.0 2.3** 46.0*
Second 76.0 65.1 73.5 66.7 77.1 89.1 4.2 70.8
23
Middle 84.2 50.0 66.7 69.2 83.9 84.3 6.3 70.9
Fourth 79.1 64.1 62.3 65.3 85.7 85.4 25.0 69.2
Highest 93.3 78.3 73.3 76.6 89.9 94.6 18.4 78.7
Total 79.9 56.7 69.0 66.0 82.4 86.7 8.0 68.6
*p-value<0.01; ** p-value <0.05
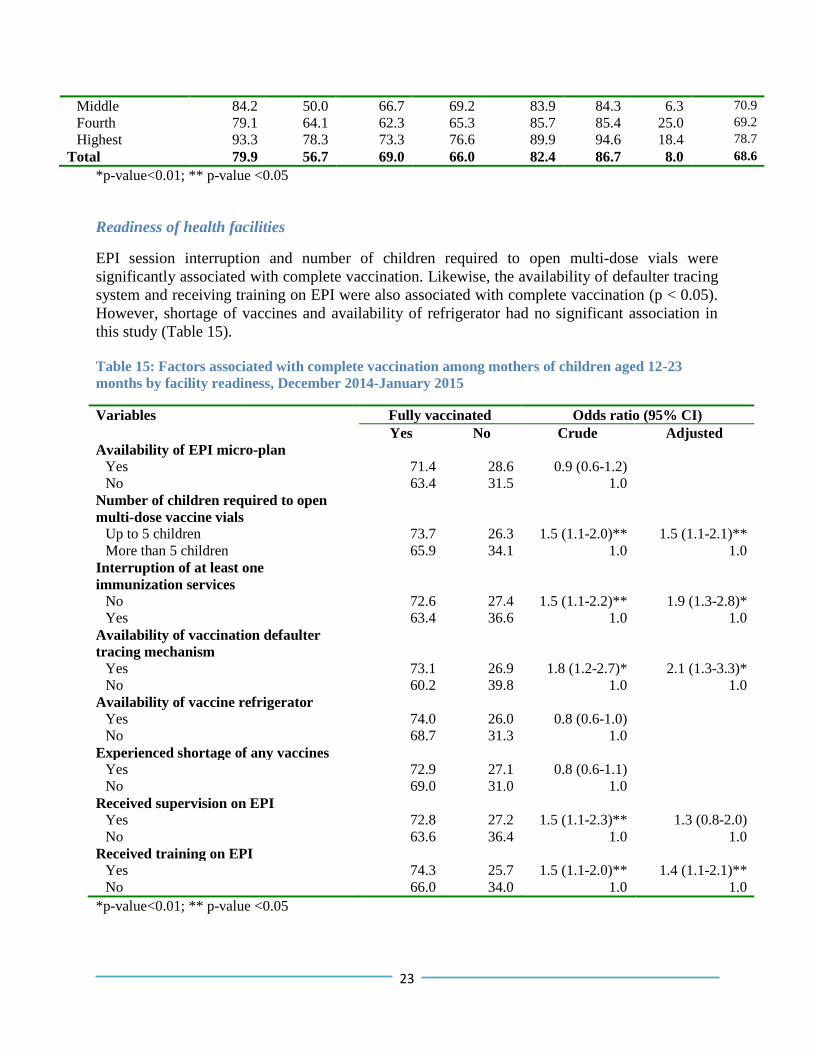
Readiness of health facilities
EPI session interruption and number of children required to open multi-dose vials were
significantly associated with complete vaccination. Likewise, the availability of defaulter tracing
system and receiving training on EPI were also associated with complete vaccination (p < 0.05).
However, shortage of vaccines and availability of refrigerator had no significant association in
this study (Table 15).
Table 15: Factors associated with complete vaccination among mothers of children aged 12-23
months by facility readiness, December 2014-January 2015
Variables Fully vaccinated Odds ratio (95% CI)
Yes No Crude Adjusted
Availability of EPI micro-plan
Yes 71.4 28.6 0.9 (0.6-1.2)
No 63.4 31.5 1.0
Number of children required to open
multi-dose vaccine vials
Up to 5 children 73.7 26.3 1.5 (1.1-2.0)** 1.5 (1.1-2.1)**
More than 5 children 65.9 34.1 1.0 1.0
Interruption of at least one
immunization services
No 72.6 27.4 1.5 (1.1-2.2)** 1.9 (1.3-2.8)*
Yes 63.4 36.6 1.0 1.0
Availability of vaccination defaulter
tracing mechanism
Yes 73.1 26.9 1.8 (1.2-2.7)* 2.1 (1.3-3.3)*
No 60.2 39.8 1.0 1.0
Availability of vaccine refrigerator
Yes 74.0 26.0 0.8 (0.6-1.0)
No 68.7 31.3 1.0
Experienced shortage of any vaccines
Yes 72.9 27.1 0.8 (0.6-1.1)
No 69.0 31.0 1.0
Received supervision on EPI
Yes 72.8 27.2 1.5 (1.1-2.3)** 1.3 (0.8-2.0)
No 63.6 36.4 1.0 1.0
Received training on EPI
Yes 74.3 25.7 1.5 (1.1-2.0)** 1.4 (1.1-2.1)**
No 66.0 34.0 1.0 1.0
*p-value<0.01; ** p-value <0.05
24
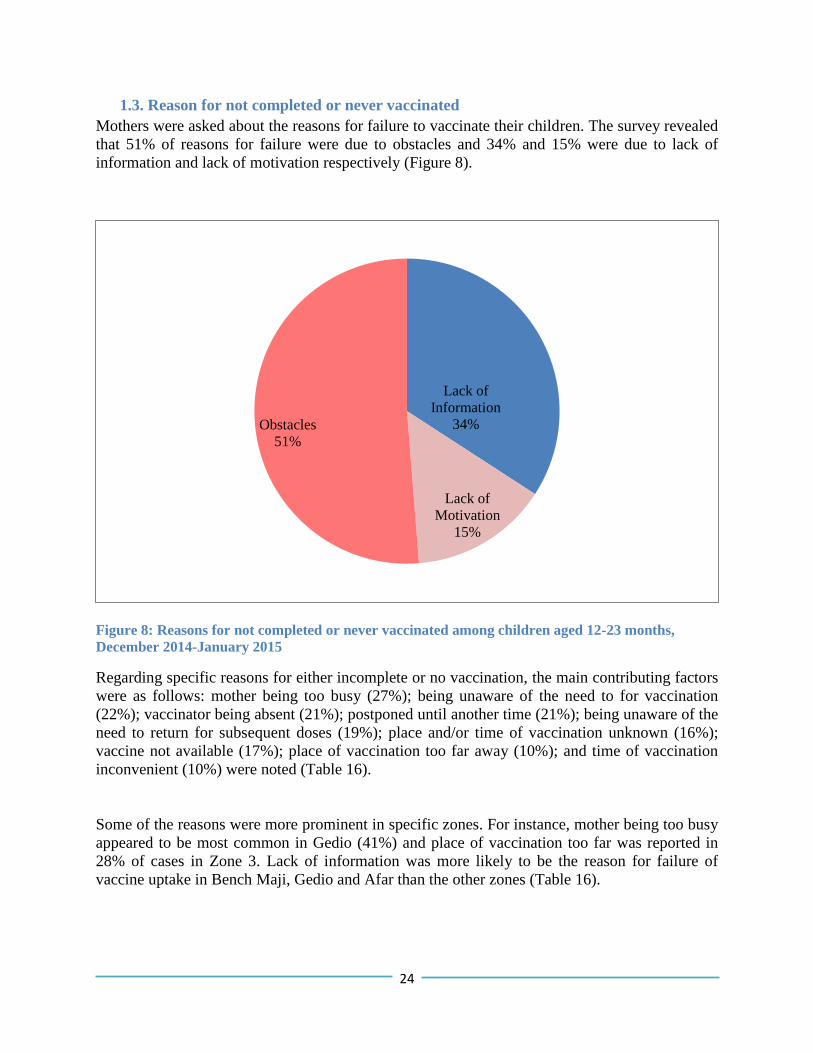
1.3. Reason for not completed or never vaccinated
Mothers were asked about the reasons for failure to vaccinate their children. The survey revealed
that 51% of reasons for failure were due to obstacles and 34% and 15% were due to lack of
information and lack of motivation respectively (Figure 8).
Figure 8: Reasons for not completed or never vaccinated among children aged 12-23 months,
December 2014-January 2015
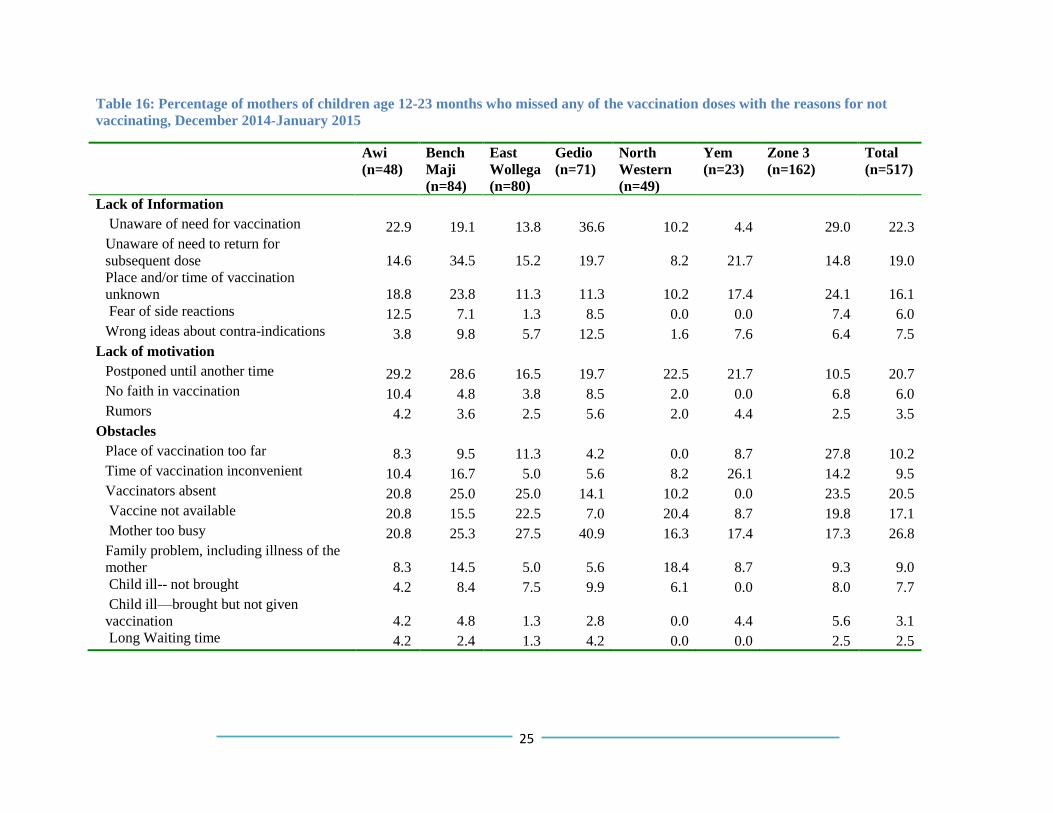
Regarding specific reasons for either incomplete or no vaccination, the main contributing factors
were as follows: mother being too busy (27%); being unaware of the need to for vaccination
(22%); vaccinator being absent (21%); postponed until another time (21%); being unaware of the
need to return for subsequent doses (19%); place and/or time of vaccination unknown (16%);
vaccine not available (17%); place of vaccination too far away (10%); and time of vaccination
inconvenient (10%) were noted (Table 16).
Some of the reasons were more prominent in specific zones. For instance, mother being too busy
appeared to be most common in Gedio (41%) and place of vaccination too far was reported in
28% of cases in Zone 3. Lack of information was more likely to be the reason for failure of
vaccine uptake in Bench Maji, Gedio and Afar than the other zones (Table 16).
Lack of
Information
34%
Lack of
Motivation
15%
Obstacles
51%
25
Table 16: Percentage of mothers of children age 12-23 months who missed any of the vaccination doses with the reasons for not
vaccinating, December 2014-January 2015
Awi
(n=48)
Bench
Maji
(n=84)
East
Wollega
(n=80)
Gedio
(n=71)
North
Western
(n=49)
Yem
(n=23)
Zone 3
(n=162)
Total
(n=517)
Lack of Information
Unaware of need for vaccination 22.9 19.1 13.8 36.6 10.2 4.4 29.0 22.3
Unaware of need to return for
subsequent dose 14.6 34.5 15.2 19.7 8.2 21.7 14.8 19.0
Place and/or time of vaccination
unknown 18.8 23.8 11.3 11.3 10.2 17.4 24.1 16.1
Fear of side reactions 12.5 7.1 1.3 8.5 0.0 0.0 7.4 6.0
Wrong ideas about contra-indications 3.8 9.8 5.7 12.5 1.6 7.6 6.4 7.5
Lack of motivation
Postponed until another time 29.2 28.6 16.5 19.7 22.5 21.7 10.5 20.7
No faith in vaccination 10.4 4.8 3.8 8.5 2.0 0.0 6.8 6.0
Rumors 4.2 3.6 2.5 5.6 2.0 4.4 2.5 3.5
Obstacles
Place of vaccination too far 8.3 9.5 11.3 4.2 0.0 8.7 27.8 10.2
Time of vaccination inconvenient 10.4 16.7 5.0 5.6 8.2 26.1 14.2 9.5
Vaccinators absent 20.8 25.0 25.0 14.1 10.2 0.0 23.5 20.5
Vaccine not available 20.8 15.5 22.5 7.0 20.4 8.7 19.8 17.1
Mother too busy 20.8 25.3 27.5 40.9 16.3 17.4 17.3 26.8
Family problem, including illness of the
mother 8.3 14.5 5.0 5.6 18.4 8.7 9.3 9.0
Child ill-- not brought 4.2 8.4 7.5 9.9 6.1 0.0 8.0 7.7
Child ill—brought but not given
vaccination 4.2 4.8 1.3 2.8 0.0 4.4 5.6 3.1
Long Waiting time 4.2 2.4 1.3 4.2 0.0 0.0 2.5 2.5
26
2. TT Vaccination
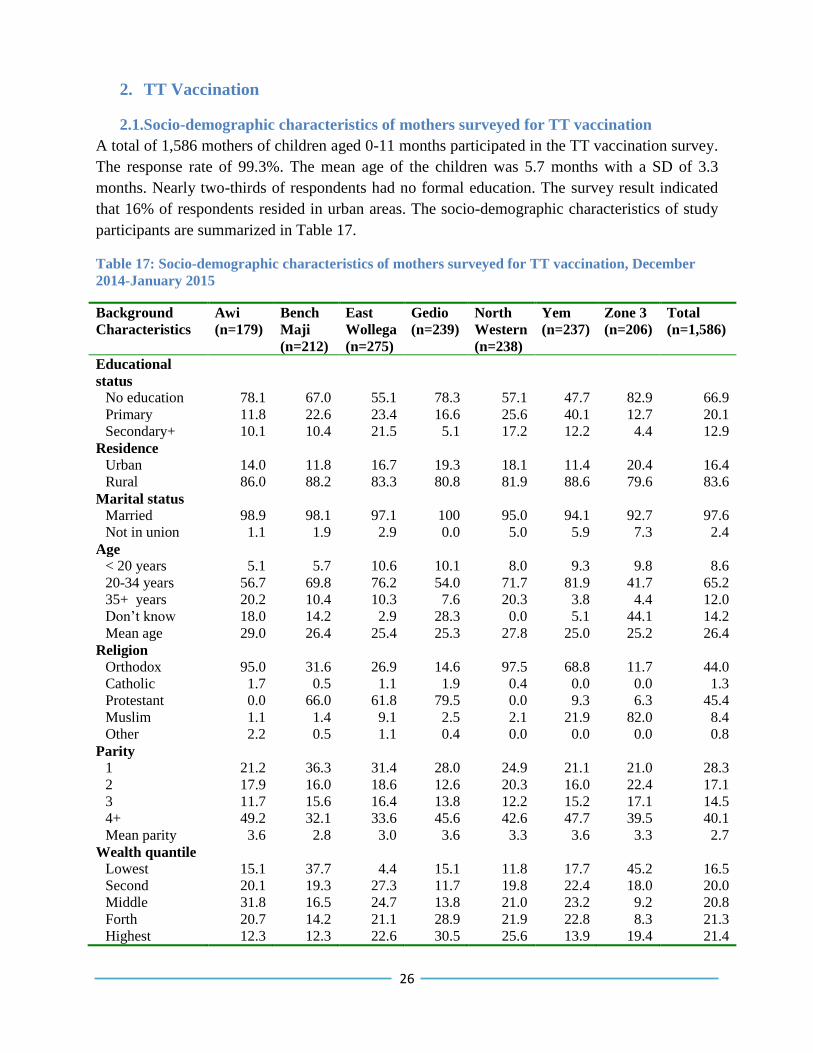
2.1.Socio-demographic characteristics of mothers surveyed for TT vaccination
A total of 1,586 mothers of children aged 0-11 months participated in the TT vaccination survey.
The response rate of 99.3%. The mean age of the children was 5.7 months with a SD of 3.3
months. Nearly two-thirds of respondents had no formal education. The survey result indicated
that 16% of respondents resided in urban areas. The socio-demographic characteristics of study
participants are summarized in Table 17.
Table 17: Socio-demographic characteristics of mothers surveyed for TT vaccination, December
2014-January 2015
Background
Characteristics
Awi
(n=179)
Bench
Maji
(n=212)
East
Wollega
(n=275)
Gedio
(n=239)
North
Western
(n=238)
Yem
(n=237)
Zone 3
(n=206)
Total
(n=1,586)
Educational
status
No education 78.1 67.0 55.1 78.3 57.1 47.7 82.9 66.9
Primary 11.8 22.6 23.4 16.6 25.6 40.1 12.7 20.1
Secondary+ 10.1 10.4 21.5 5.1 17.2 12.2 4.4 12.9
Residence
Urban 14.0 11.8 16.7 19.3 18.1 11.4 20.4 16.4
Rural 86.0 88.2 83.3 80.8 81.9 88.6 79.6 83.6
Marital status
Married 98.9 98.1 97.1 100 95.0 94.1 92.7 97.6
Not in union 1.1 1.9 2.9 0.0 5.0 5.9 7.3 2.4
Age
< 20 years 5.1 5.7 10.6 10.1 8.0 9.3 9.8 8.6
20-34 years 56.7 69.8 76.2 54.0 71.7 81.9 41.7 65.2
35+ years 20.2 10.4 10.3 7.6 20.3 3.8 4.4 12.0
Don’t know 18.0 14.2 2.9 28.3 0.0 5.1 44.1 14.2
Mean age 29.0 26.4 25.4 25.3 27.8 25.0 25.2 26.4
Religion
Orthodox 95.0 31.6 26.9 14.6 97.5 68.8 11.7 44.0
Catholic 1.7 0.5 1.1 1.9 0.4 0.0 0.0 1.3
Protestant 0.0 66.0 61.8 79.5 0.0 9.3 6.3 45.4
Muslim 1.1 1.4 9.1 2.5 2.1 21.9 82.0 8.4
Other 2.2 0.5 1.1 0.4 0.0 0.0 0.0 0.8
Parity
1 21.2 36.3 31.4 28.0 24.9 21.1 21.0 28.3
2 17.9 16.0 18.6 12.6 20.3 16.0 22.4 17.1
3 11.7 15.6 16.4 13.8 12.2 15.2 17.1 14.5
4+ 49.2 32.1 33.6 45.6 42.6 47.7 39.5 40.1
Mean parity 3.6 2.8 3.0 3.6 3.3 3.6 3.3 2.7
Wealth quantile
Lowest 15.1 37.7 4.4 15.1 11.8 17.7 45.2 16.5
Second 20.1 19.3 27.3 11.7 19.8 22.4 18.0 20.0
Middle 31.8 16.5 24.7 13.8 21.0 23.2 9.2 20.8
Forth 20.7 14.2 21.1 28.9 21.9 22.8 8.3 21.3
Highest 12.3 12.3 22.6 30.5 25.6 13.9 19.4 21.4
27
Almost 85% of mothers received at least one antenatal care (ANC) visit during their most recent
pregnancy. However, only 42% of mothers received four ANC visits. Overall, health facility
delivery coverage was 45% with wide zonal variations and some kind of substance was applied
to the umbilical cord of the newborn at birth in 23% of cases (Table 18)
Table 18: Maternal and newborn heath care utilization by mothers of children with 0-11 months,
by zone, December 2014-January 2015
Awi
Bench
Maji
East
Wollega
Gedio North
Western
Yem Zone 3 Total
ANC
No ANC 9.8 14.5 10.8 27.2 2.3 7.6 41.0 15.2
ANC 1+ 90.2 85.5 89.2 72.8 97.7 92.4 59.0 84.8
ANC 2+ 83.3 79.0 83.9 65.6 91.4 87.0 47.8 78.3
ANC 3+ 73.6 67.5 69.6 54.9 80.5 78.0 39.9 66.7
ANC 4+ 47.1 47.5 40.8 35.7 47.7 57.4 20.8 41.8
Delivery
Home 48.3 54.3 42.7 69.6 28.2 44.3 83.2 51.5
Health post 1.1 6.1 6.9 2.1 0.4 7.6 1.0 3.7
Health
center/hospital/clinic
50.6 39.2 49.6 28.3 71.4 48.1 15.8 44.5
Other 0.0 0.5 0.7 0.0 0.0 0.0 0.0 0.3
Something applied on
the umbilical cord
8.5
18.5
12.0
39.9
23.4
0.4
58.9
22.5
2.2.TT vaccination coverage
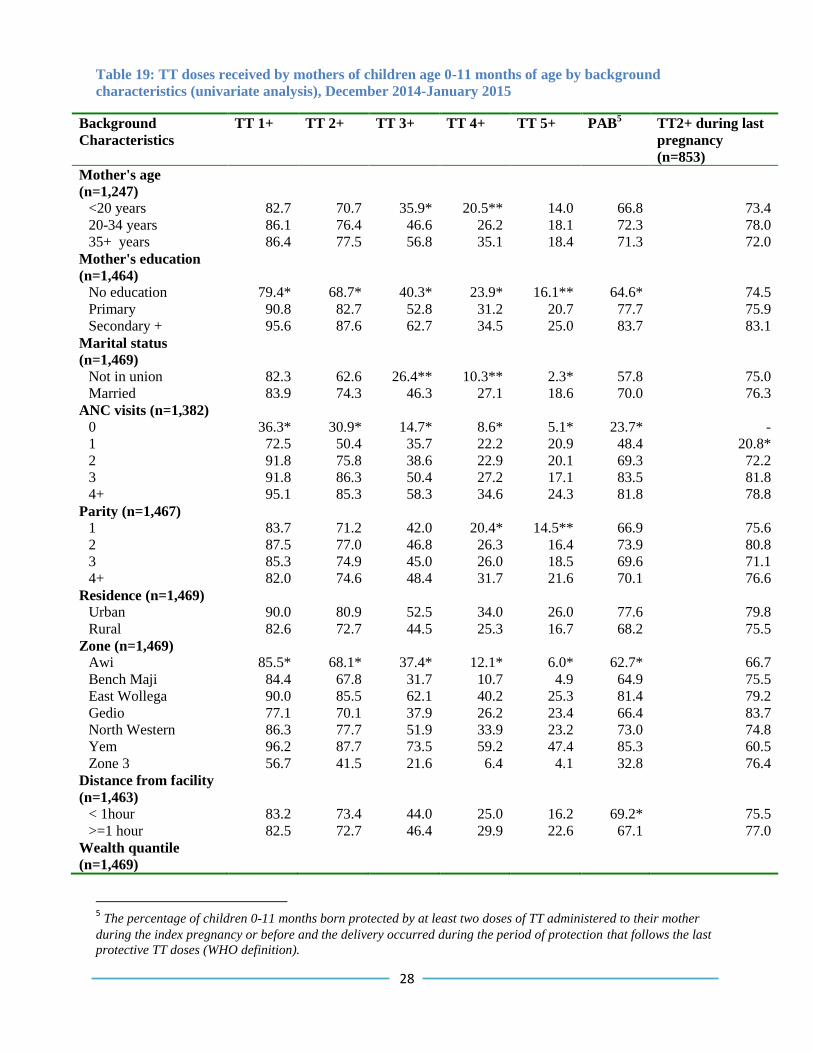
Nearly 74% of mothers had received at least two doses of TT prior to the survey. Likewise, more
than two-thirds (70%) of infants were protected against neonatal tetanus at birth due to their
mothers’ TT vaccination. However, only 18% of mothers completed their TT vaccination
schedule.
By univariate analysis, TT vaccination and PAB coverage was significantly higher amongst
children of mothers with education attainment, in the highest wealth quantile, ANC attendance,
and married. However, distance from the nearest health facility had no significant association
with TT and PAB vaccination. It also significantly varied across zones (Table 19).
28
Table 19: TT doses received by mothers of children age 0-11 months of age by background
characteristics (univariate analysis), December 2014-January 2015
Background
Characteristics
TT 1+ TT 2+ TT 3+ TT 4+ TT 5+ PAB5 TT2+ during last
pregnancy
(n=853)
Mother's age
(n=1,247)
<20 years 82.7 70.7 35.9* 20.5** 14.0 66.8 73.4
20-34 years 86.1 76.4 46.6 26.2 18.1 72.3 78.0
35+ years 86.4 77.5 56.8 35.1 18.4 71.3 72.0
Mother's education
(n=1,464)
No education 79.4* 68.7* 40.3* 23.9* 16.1** 64.6* 74.5
Primary 90.8 82.7 52.8 31.2 20.7 77.7 75.9
Secondary + 95.6 87.6 62.7 34.5 25.0 83.7 83.1
Marital status
(n=1,469)
Not in union 82.3 62.6 26.4** 10.3** 2.3* 57.8 75.0
Married 83.9 74.3 46.3 27.1 18.6 70.0 76.3
ANC visits (n=1,382)
0 36.3* 30.9* 14.7* 8.6* 5.1* 23.7* -
1 72.5 50.4 35.7 22.2 20.9 48.4 20.8*
2 91.8 75.8 38.6 22.9 20.1 69.3 72.2
3 91.8 86.3 50.4 27.2 17.1 83.5 81.8
4+ 95.1 85.3 58.3 34.6 24.3 81.8 78.8
Parity (n=1,467)
1 83.7 71.2 42.0 20.4* 14.5** 66.9 75.6
2 87.5 77.0 46.8 26.3 16.4 73.9 80.8
3 85.3 74.9 45.0 26.0 18.5 69.6 71.1
4+ 82.0 74.6 48.4 31.7 21.6 70.1 76.6
Residence (n=1,469)
Urban 90.0 80.9 52.5 34.0 26.0 77.6 79.8
Rural 82.6 72.7 44.5 25.3 16.7 68.2 75.5
Zone (n=1,469)
Awi 85.5* 68.1* 37.4* 12.1* 6.0* 62.7* 66.7
Bench Maji 84.4 67.8 31.7 10.7 4.9 64.9 75.5
East Wollega 90.0 85.5 62.1 40.2 25.3 81.4 79.2
Gedio 77.1 70.1 37.9 26.2 23.4 66.4 83.7
North Western 86.3 77.7 51.9 33.9 23.2 73.0 74.8
Yem 96.2 87.7 73.5 59.2 47.4 85.3 60.5
Zone 3 56.7 41.5 21.6 6.4 4.1 32.8 76.4
Distance from facility
(n=1,463)
< 1hour 83.2 73.4 44.0 25.0 16.2 69.2* 75.5
>=1 hour 82.5 72.7 46.4 29.9 22.6 67.1 77.0
Wealth quantile
(n=1,469)
5 The percentage of children 0-11 months born protected by at least two doses of TT administered to their mother
during the index pregnancy or before and the delivery occurred during the period of protection that follows the last
protective TT doses (WHO definition).
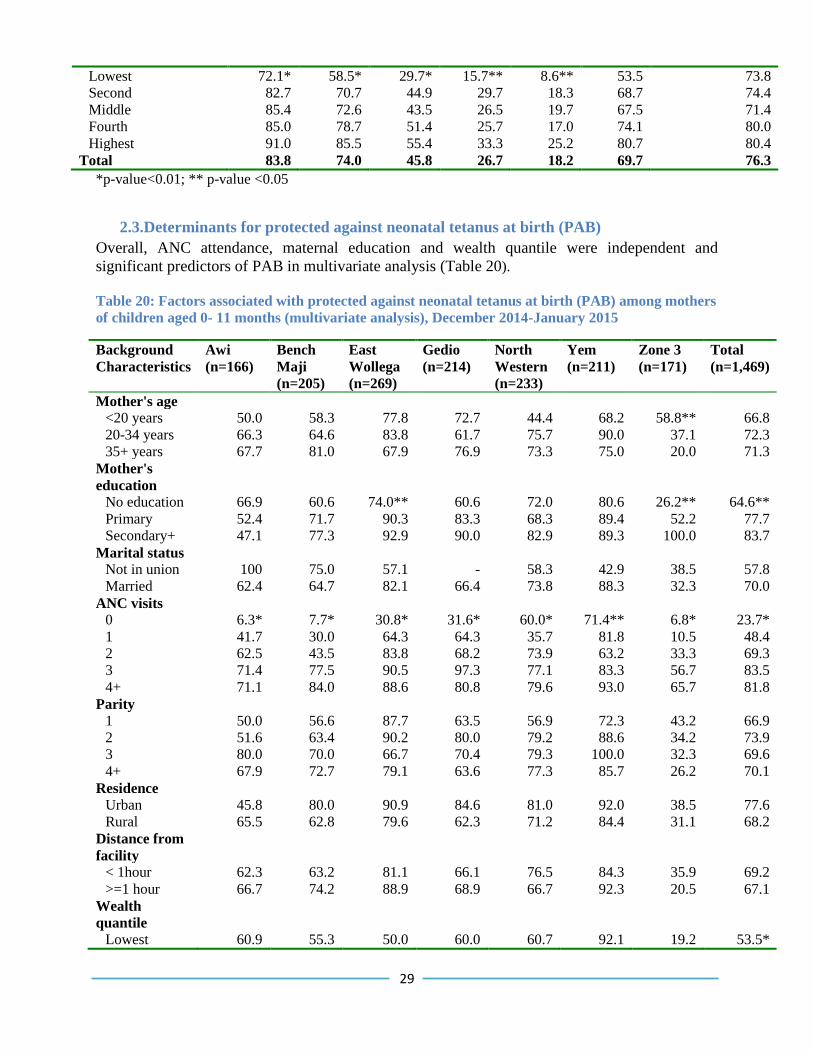
29
Lowest 72.1* 58.5* 29.7* 15.7** 8.6** 53.5 73.8
Second 82.7 70.7 44.9 29.7 18.3 68.7 74.4
Middle 85.4 72.6 43.5 26.5 19.7 67.5 71.4
Fourth 85.0 78.7 51.4 25.7 17.0 74.1 80.0
Highest 91.0 85.5 55.4 33.3 25.2 80.7 80.4
Total 83.8 74.0 45.8 26.7 18.2 69.7 76.3
*p-value<0.01; ** p-value <0.05
2.3.Determinants for protected against neonatal tetanus at birth (PAB)
Overall, ANC attendance, maternal education and wealth quantile were independent and
significant predictors of PAB in multivariate analysis (Table 20).
Table 20: Factors associated with protected against neonatal tetanus at birth (PAB) among mothers
of children aged 0- 11 months (multivariate analysis), December 2014-January 2015
Background
Characteristics
Awi
(n=166)
Bench
Maji
(n=205)
East
Wollega
(n=269)
Gedio
(n=214)
North
Western
(n=233)
Yem
(n=211)
Zone 3
(n=171)
Total
(n=1,469)
Mother's age
<20 years 50.0 58.3 77.8 72.7 44.4 68.2 58.8** 66.8
20-34 years 66.3 64.6 83.8 61.7 75.7 90.0 37.1 72.3
35+ years 67.7 81.0 67.9 76.9 73.3 75.0 20.0 71.3
Mother's
education
No education 66.9 60.6 74.0** 60.6 72.0 80.6 26.2** 64.6**
Primary 52.4 71.7 90.3 83.3 68.3 89.4 52.2 77.7
Secondary+ 47.1 77.3 92.9 90.0 82.9 89.3 100.0 83.7
Marital status
Not in union 100 75.0 57.1 - 58.3 42.9 38.5 57.8
Married 62.4 64.7 82.1 66.4 73.8 88.3 32.3 70.0
ANC visits
0 6.3* 7.7* 30.8* 31.6* 60.0* 71.4** 6.8* 23.7*
1 41.7 30.0 64.3 64.3 35.7 81.8 10.5 48.4
2 62.5 43.5 83.8 68.2 73.9 63.2 33.3 69.3
3 71.4 77.5 90.5 97.3 77.1 83.3 56.7 83.5
4+ 71.1 84.0 88.6 80.8 79.6 93.0 65.7 81.8
Parity
1 50.0 56.6 87.7 63.5 56.9 72.3 43.2 66.9
2 51.6 63.4 90.2 80.0 79.2 88.6 34.2 73.9
3 80.0 70.0 66.7 70.4 79.3 100.0 32.3 69.6
4+ 67.9 72.7 79.1 63.6 77.3 85.7 26.2 70.1
Residence
Urban 45.8 80.0 90.9 84.6 81.0 92.0 38.5 77.6
Rural 65.5 62.8 79.6 62.3 71.2 84.4 31.1 68.2
Distance from
facility
< 1hour 62.3 63.2 81.1 66.1 76.5 84.3 35.9 69.2
>=1 hour 66.7 74.2 88.9 68.9 66.7 92.3 20.5 67.1
Wealth
quantile
Lowest 60.9 55.3 50.0 60.0 60.7 92.1 19.2 53.5*
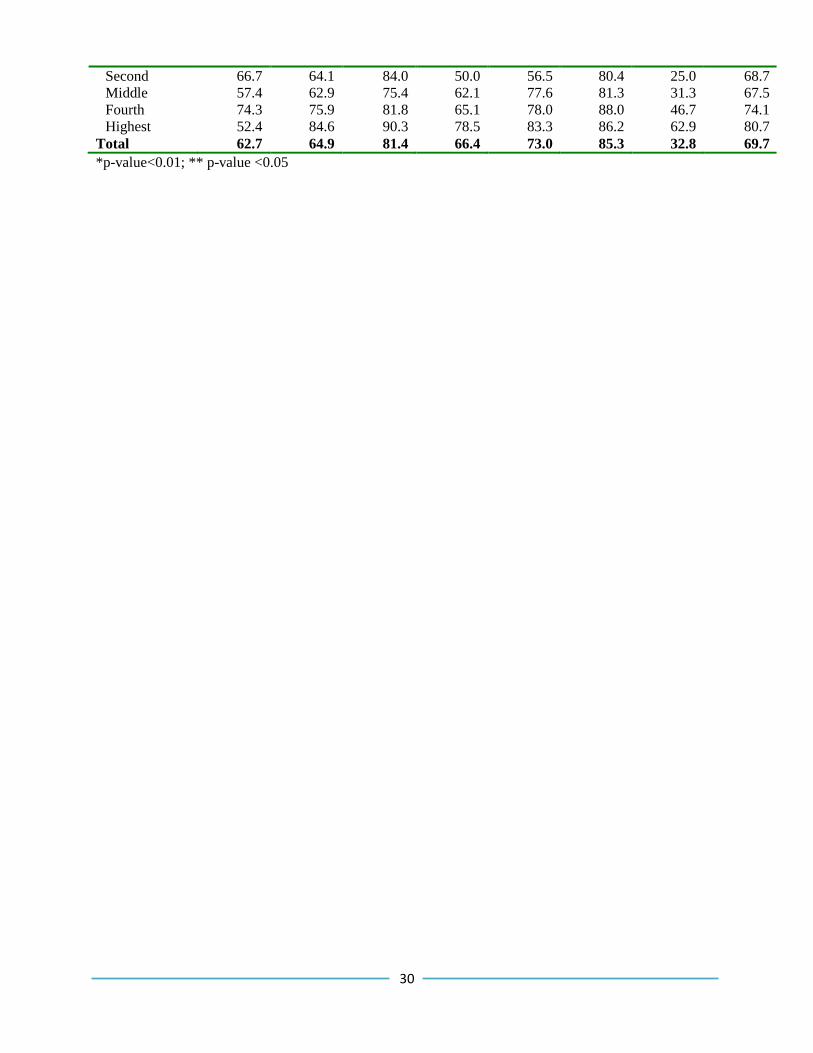
30
Second 66.7 64.1 84.0 50.0 56.5 80.4 25.0 68.7
Middle 57.4 62.9 75.4 62.1 77.6 81.3 31.3 67.5
Fourth 74.3 75.9 81.8 65.1 78.0 88.0 46.7 74.1
Highest 52.4 84.6 90.3 78.5 83.3 86.2 62.9 80.7
Total 62.7 64.9 81.4 66.4 73.0 85.3 32.8 69.7
*p-value<0.01; ** p-value <0.05
31
Discussion To achieve immunization goals, delivery of potent vaccines through properly maintained cold
chain systems and high quality coverage are indispensable. The aim of this study was to assess
vaccination coverage, reasons for incomplete vaccination and health facility service delivery,
vaccine stock and cold chain management systems.
Results showed that almost all health facilities were providing EPI services. However, only 37%
of health centers provided services on a daily basis. Moreover, more than a quarter of health
facilities missed at least one EPI session in the previous six months. This may lead the
community to lose trust in health service providers and the health system. It might also be a
factor contributing to high drop-out rates and low utilization of vaccination services. The
national immunization coverage survey (EHNRI, 2012) reported that 45% of health facilities had
interrupted EPI services which is similar to our data.
The survey also revealed that more than 90% of health facilities collect vaccines at least once in
a month according to guidelines, nevertheless more than half of them encountered stock-out of
any vaccine in the previous three months. This indicates that the availability of vaccines has not
been adequate to enable the program run smoothly. This might be due to collection or requisition
of inadequate amount of vaccines. More than half of the facilities’ refrigerators were not functional at the time of the survey mainly
due to unavailability of energy/fuel and the refrigerators not being installed. An additional 27%
of health facilities encountered breakdown of vaccine refrigerators. Furthermore, about a quarter
of refrigerators were found to be outside of the recommended temperature range. This indicates
that vaccines in these facilities were at high risk of losing their potency. This observation is
similar to a study in Cameroon and another study in Ethiopia (Ateudjieu et al. 2013; Rogie et al.
2013). Insufficient refresher training and supervision was also documented in this study, which
might contribute to the substandard cold chain and vaccine stock management.
Access to vaccination services as estimated by Penta1 coverage was about 88%. However, there
was a significant zonal variation in the access to vaccination services with Zone 3 and Gedio
zones having lower coverage. The overall Penta3 coverage, a proxy indicator for utilization of
vaccination services, was found to be low, and significantly lower in Zone 3, Bench Maji Gedio
and East Wolega zones as compared to the North Western zone.
The drop-out rate was less than 10% in Yem, Awi, North Western and Gedio zones. On the other
hand, the drop-out rate was more than 10% at Zone 3, Bench Maji and East Wolega zones
indicating poor quality of vaccination services in these zones. This finding is in line with the
national immunization coverage survey (EHNRI, 2012) and the WHO/UNICEF 2013 estimates
for Ethiopia (WHO & UNICEF, 2013). However, this rate is higher than the EDHS 2005 and
2011 estimates. The observed difference between our survey and EDHS may be attributed to a
difference in survey design6 and time variation as several interventions have ongoing.
6 EDHS is a national representative survey employing stratified multistage cluster sampling stratified by residence.
Enumeration areas are used as sampling units and 30 households from each enumeration areas were selected.
32
Access and utilization of vaccination services were significantly higher amongst children of
mothers with education attainment, in the highest wealth quantile and low parity (p < 0.05)
groups in this study.
Quality of vaccination services were demonstrated by the validity of doses given, BCG scar
formation, card retention and client-provider interactions. The survey indicated that about 69%
of children with written evidence of vaccination (card and register) were fully vaccinated at any
time before the survey. However, only 36% of children received valid doses of the vaccines. This
indicates that health workers do not screen children adequately before vaccination. Almost
identical findings were reported by national vaccination survey. Scar formation from BCG is a
proxy measure for prior BCG vaccination and injection technique. This study found that 19% of
children vaccinated with BCG had no BCG scar (card and history). This is likely to be due to
poor injection technique or sero-conversion.
A considerable proportion of children reported to be vaccinated during the survey had no
vaccination card for verification. The card retention rate was found to be 61%, slightly higher
than reported in the national immunization coverage survey (EHNRI, 2012), but almost in line
with the national cluster survey conducted in 2006 (Kidane et al 2006). Card retention was
higher in North Western, Awi, Yem, Gedio and East Wolega zones.
Overall, more than a quarter of mothers were not told about side-effects the child might
experience with vaccination. This indicates that there is an opportunity to improve the client-
provider interaction. There was also other evidence, particularly a lack of counseling and
discussion with the mother at outreach sessions as vaccinators were usually rushing to complete
the session (Berhane and Yigzaw, 2006).
The major reasons for incomplete vaccinations were that the mother was too busy or unaware of
the need to for vaccination or of the need to return for subsequent doses; unknown place and/or
time of vaccination were also mentioned by the majority of mothers. On the other hand,
vaccinator absence, unavailability of vaccine, place of vaccination too distant, and inconvenient
vaccination times were also mentioned by a significant number of mothers. These issues could
be improved by conducting regular and focused education and communication activities on the
need for vaccination, as well as interpersonal communication and negotiation on the need for
subsequent doses of vaccines. It is also equally important to expand the vaccination delivery sites
(the outreach, static or mobile sites) to make these more accessible and convenient for mothers.
Access to TT vaccination as estimated by ANC coverage was 85%. In this study, nearly three-
quarters (74%) of mothers received at least two doses of TT at any time before the survey.
Likewise, more than two-thirds (70%) of infants were protected against neonatal tetanus at birth
due to their mothers’ TT vaccination. This is in line with national immunization coverage survey
findings conducted in 2006 (Kidane et al. 2006) and 2012 (EHNRI, 2012). Based on the criteria
used to assess avoidance of risk to neonatal tetanus by achieving clean baby delivery rates of
70% and above, and a routine TT2+ vaccination coverage rate of 80% and above (Berhane and
Yigzaw 2006). However, only North Western had better performance than these standards. Other

33
zones had lower clean delivery and TT coverage and are therefore regarded as higher risk for
neonatal tetanus. Overall, ANC attendance, maternal education, wealth quantile, parity and
residence were the independent and significant predictors of tetanus PAB by multivariate
analysis.
34
Conclusion and Recommendations
Conclusion
Although more than 96% of health centers were providing routine EPI, only 37% provided EPI
on a daily basis. More than a quarter of health facilities surveyed had some interruption of EPI
services mainly due to vaccine delivery related factors and vaccinators work load. In a
significant proportion of health facilities, their cold chain management was suboptimal, and this
may hamper the potency of the vaccines provided.
Vaccination coverage was found to be lower in the households with poorest wealth quantile, low
parity and no maternal education. Timely and valid dose coverage was found to be low in this
study. Mother’s being busy, unaware of the need for vaccination, vaccinator absenteeism, lack of
awareness of the need for subsequent doses and place and/or time of vaccination unknown were
the major reasons mentioned for failure of vaccination. ANC attendance, maternal education,
wealth quantile were the independent predictors of PAB.
Recommendations
Based on the findings of the survey the following changes are recommended:
Targeted service delivery: Context-based delivery strategies including mobile-based delivery is
crucial to address the low access and utilization of EPI services particularly in pastoralist areas of
Afar. Detailed micro-planning with clear mapping of seasonal nomadic movements is required to
ensure targeted outreach or mobile services to these populations. Detailed planning by individual
health facilities and districts of how to reach the unreached and disadvantaged children in the
catchment area is essential for improving equity in immunization.
Quality of vaccination: The administration of invalid doses indicates that vaccinators do not
adequately screen children before administering vaccines. Thus, observations and close
monitoring of EPI sessions need to be performed to improve the quality of services. Refresher
training is equally important to enhance the knowledge and skills of vaccinators.
Integrate services and eliminate missed opportunities: Any child coming to a health facility for
any reason or a child coming to a facility for any vaccinations should get the routine EPI doses
that the child is eligible for during the time of the visit to eliminate the possibility of missed
opportunities. The survey showed that health facilities require on average six children to be
present in order to open a vial of measles vaccine. This indicates that the vaccine open vial
policy of reconstituted vaccines (measles and BCG) is leading to missed opportunities.
Early ANC booking and screening of TT immunization status of the pregnant women and
administering doses to all eligible women could increase PAB coverage. Moreover, utilization of
clean facility birth and clean cord practice should be promoted during ANC care.
Cold chain and vaccine management: There is a need to establish an appropriate and
uninterrupted vaccine delivery strategy. The use of mobile technology for vaccine chain
management could be considered for proper forecasting, requisition, and monitoring wastage.
35
There is also an urgent need to improve the cold chain management system through training and
monitoring, as vaccines in some facilities were at high risk of losing their potency.
Strategic communication and health education: Strategic communication and health education
to increase awareness of the need for vaccination and subsequent doses is vital. Enhancement of
the interpersonal communication skills of providers is important to improve their interaction with
mothers. Involving HDAs in community mobilization is essential to deliver key messages to the
community as well as tracing defaulters.
Planning, monitoring and evaluation: To continuously monitor service delivery, quality and the
supply chain, a continuous and regular cycle of planning, monitoring and implementation should
be established. Use of the EPI monitoring chart as a monitoring tool should be reinforced. A
detailed micro-plan and improvement plan to address key challenges should be present at all
levels. In addition, a performance review should monitor data quality so that it accurately
reflects true immunization coverage at all levels. Furthermore, regular and focused supportive
supervision needs to be strengthened at all levels to gain the commitment necessary for a
successful EPI program.
To augment routine monitoring, observational studies are recommended to assess the quality of
routine EPI sessions, the field efficacy of vaccines and operational processes to guide the
program implementation particularly to cultivate the vaccination culture.
36
References FMoH (2009). Ethiopia National Expanded Program on Immunization: Comprehensive Multi-
Year Plan 2010-2014. Federal Ministry of Health: Addis Ababa. Retrieved from
http://www.moh.gov.et/resources
FMoH (2010). Health and health related indicators, 2010. Federal Ministry of Health: Addis
Ababa. Retrieved from http://www.moh.gov.et/resources
Kidane, T et al. (2006). National EPI coverage survey report in Ethiopia, 2006.Ethiopian Journal
of Health Development. 22:148-157
Central Statistical Agency and ICF International (CSA & ICF) (2005). Ethiopia Demographic
and Health Survey 2005, Addis Ababa. Ethiopia and Calverton, Maryland, USA: Central
Statistical Agency and ICF International.
FMoH (2012). Health and health related indicators, 2012. Retrieved from
http://www.moh.gov.et/resources
FMoH Health sector Development Program IV. Annual Performance Report 2012/2013.
Retrieved from http://www.moh.gov.et/resources
Central Statistical Agency and ICF International (CSA & ICF) (2011). Ethiopia Demographic
and Health Survey 2011. Addis Ababa, Ethiopia and Calverton, Maryland, USA: Central
Statistical Agency and ICF International.
Ethiopian Health and Nutrition Research Institute (EHNRI) (2012). Ethiopian National
immunization coverage survey. (Unpublished report)
WHO (2005). Immunization overage survey reference manual: Department of Immunization,
Vaccines and Biologicals CH-1211 Geneva 27, Switzerland. Retrieved from
http://whqlibdoc.who.int/hq/2005/who_ivb_04.23.pdf
FMoH (2013). Ethiopia Routine Immunization Improvement Plan EFY 2006-2007. FMoH,
Addis Ababa
FMoH (2012). Health and health related indicators. FMoH, Addis Ababa
Berhane, Y., and Yigzaw, A. (2006). Vaccine Preventable Diseases and the Immunization
Program in Ethiopia .In: Berhane Y, Hailemariam D and Kloos H. eds. The
Epidemiology and Ecology of Health and Disease in Ethiopia.Shama Books, Addis
Ababa, Ethiopia. 354-371
37
Ateudjieu, J. et al. (2013). Program on immunization and cold chain monitoring: the status in
eight health districts in Cameroon. BMC Research Notes 2013, 6:101
http://www.biomedcentral.com/1756-0500/6/101
Rogie, B et al. (2013). Assessment of cold chain status for immunization in central Ethiopia.
Ethiop Med J. 51 Suppl 1:21-9.
Mengesha, A et al. (1995). Child health problems in Ethiopia. Ethiop J Health Dev 9:167-187
WHO and UNICEF (2013) Estimates of immunization coverage of Ethiopia: 2013 revision

38
Annexes Annex 1: Survey tools
Survey questionnaires are attached in the EPI Baseline Report.
To access the questionnaires please open the attachment on the left panel of your pdf reader.
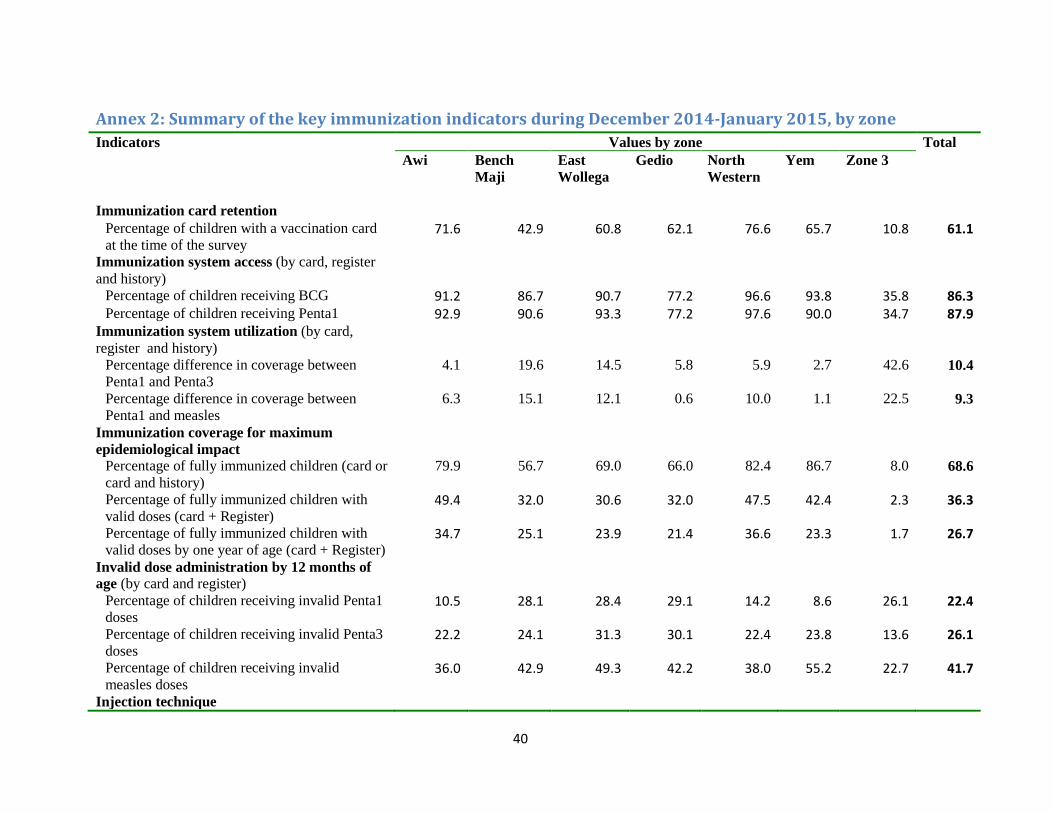
40
Annex 2: Summary of the key immunization indicators during December 2014-January 2015, by zone
Indicators Values by zone Total
Awi
Bench
Maji
East
Wollega
Gedio North
Western
Yem
Zone 3
Immunization card retention Percentage of children with a vaccination card
at the time of the survey 71.6 42.9 60.8 62.1 76.6 65.7 10.8 61.1
Immunization system access (by card, register
and history)
Percentage of children receiving BCG 91.2 86.7 90.7 77.2 96.6 93.8 35.8 86.3 Percentage of children receiving Penta1 92.9 90.6 93.3 77.2 97.6 90.0 34.7 87.9
Immunization system utilization (by card,
register and history)
Percentage difference in coverage between
Penta1 and Penta3
4.1 19.6 14.5 5.8 5.9 2.7 42.6 10.4
Percentage difference in coverage between
Penta1 and measles
6.3 15.1 12.1 0.6 10.0 1.1 22.5 9.3
Immunization coverage for maximum
epidemiological impact
Percentage of fully immunized children (card or
card and history)
79.9 56.7 69.0 66.0 82.4 86.7 8.0 68.6
Percentage of fully immunized children with
valid doses (card + Register) 49.4 32.0 30.6 32.0 47.5 42.4 2.3 36.3
Percentage of fully immunized children with
valid doses by one year of age (card + Register) 34.7 25.1 23.9 21.4 36.6 23.3 1.7 26.7
Invalid dose administration by 12 months of
age (by card and register)
Percentage of children receiving invalid Penta1
doses 10.5 28.1 28.4 29.1 14.2 8.6 26.1 22.4
Percentage of children receiving invalid Penta3
doses 22.2 24.1 31.3 30.1 22.4 23.8 13.6 26.1
Percentage of children receiving invalid
measles doses 36.0 42.9 49.3 42.2 38.0 55.2 22.7 41.7
Injection technique
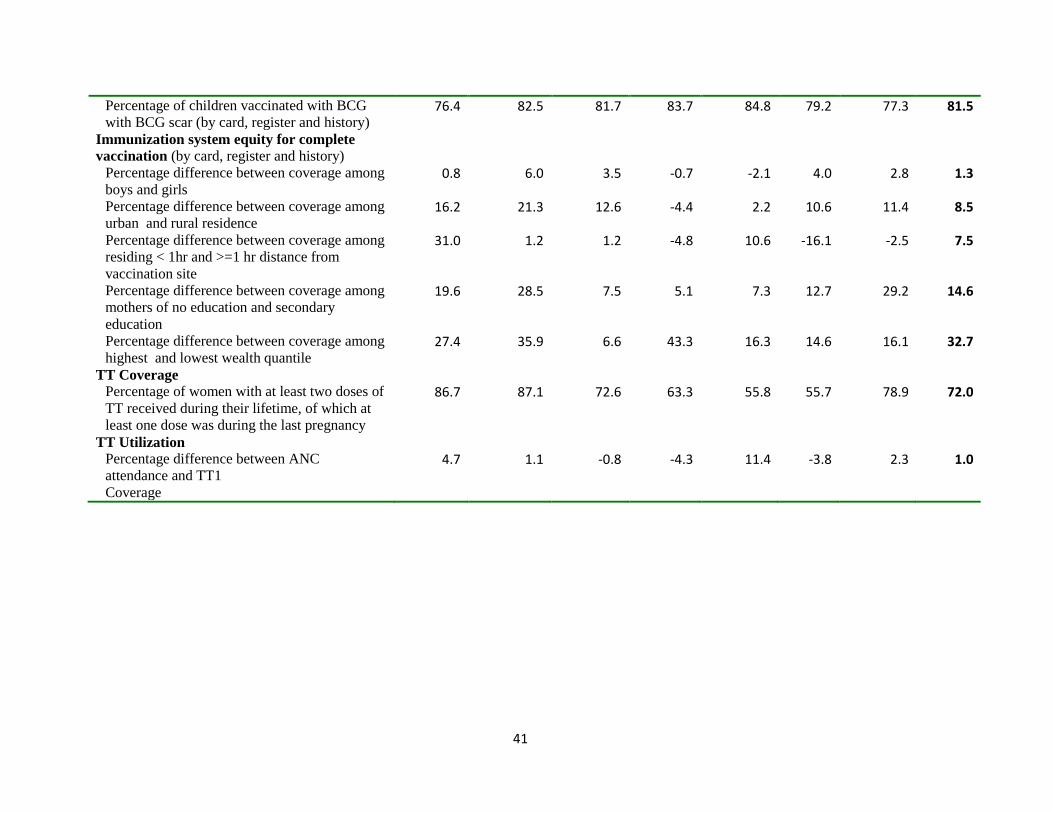
41
Percentage of children vaccinated with BCG
with BCG scar (by card, register and history) 76.4 82.5 81.7 83.7 84.8 79.2 77.3 81.5
Immunization system equity for complete
vaccination (by card, register and history)
Percentage difference between coverage among
boys and girls 0.8 6.0 3.5 -0.7 -2.1 4.0 2.8 1.3
Percentage difference between coverage among
urban and rural residence 16.2 21.3 12.6 -4.4 2.2 10.6 11.4 8.5
Percentage difference between coverage among
residing < 1hr and >=1 hr distance from
vaccination site
31.0 1.2 1.2 -4.8 10.6 -16.1 -2.5 7.5
Percentage difference between coverage among
mothers of no education and secondary
education
19.6 28.5 7.5 5.1 7.3 12.7 29.2 14.6
Percentage difference between coverage among
highest and lowest wealth quantile 27.4 35.9 6.6 43.3 16.3 14.6 16.1 32.7
TT Coverage
Percentage of women with at least two doses of
TT received during their lifetime, of which at
least one dose was during the last pregnancy
86.7 87.1 72.6 63.3 55.8 55.7 78.9 72.0
TT Utilization
Percentage difference between ANC
attendance and TT1
Coverage
4.7 1.1 -0.8 -4.3 11.4 -3.8 2.3 1.0
42
Annex 3: EPI initiatives in Ethiopia Routine Immunization: This is a routine immunization service provided as both static and
outreach services.
Reaching Every District (RED): In order to improve sustainable and equitable immunization
services for every child, RED was developed as a strategy to provide vaccinations for children
who are unreached for reasons of geographic isolation, lack of information and their social or
cultural environments. RED consists of five strategic components: 1) re-establishing outreach; 2)
supportive supervision; 3) monitoring and use of data for action; 4) strengthening planning and
management of resources through micro-plans; and 5) increasing community links.
Enhanced routine immunization Activities (ERIA): This is special immunization strategy
designed for pastoralist communities of Somali, Afar, Gambella and other areas which have low
routine immunization coverage. In this strategy, all children under 12 months of age at kebele
level are registered by HEWs and community volunteers, and any unimmunized children are
immunized at specific dates and immunization sites in their respective kebeles through mobile
immunization teams visiting each village four times a year.
Supplemental Immunization Activities (SIAs): SIAs include any immunization activity
conducted in addition to the provision of routine immunization services. SIAs have been carried
out to enhance routine immunization coverage and in order to achieve elimination and
eradication of measles, polio and neonatal tetanus. Between 2002 and 2005, a series of
emergency and catch up measles immunization and vitamin A supplementation campaigns were
conducted to accelerate the control of measles and reduce morbidity and mortality in various
regions of the country. Measles SIAs were integrated into the six monthly Enhanced Outreach
Strategy (EOS) - which was designed to provide high impact child survival interventions
(Vitamin A supplementation, de-worming, nutrition screening, and targeted supplementary
feeding and bed net distribution) in drought prone districts.