Embed Size (px)
Citation preview
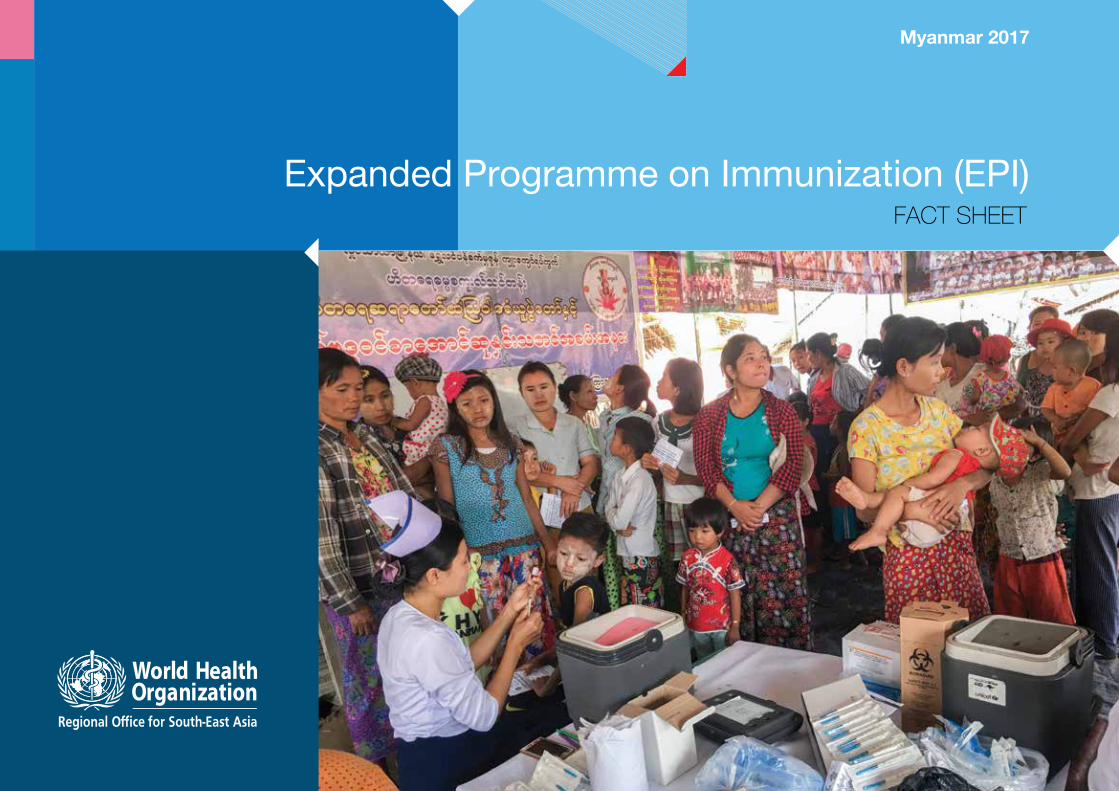
Myanmar 2017
FACT SHEET
Expanded Programme on Immunization (EPI)
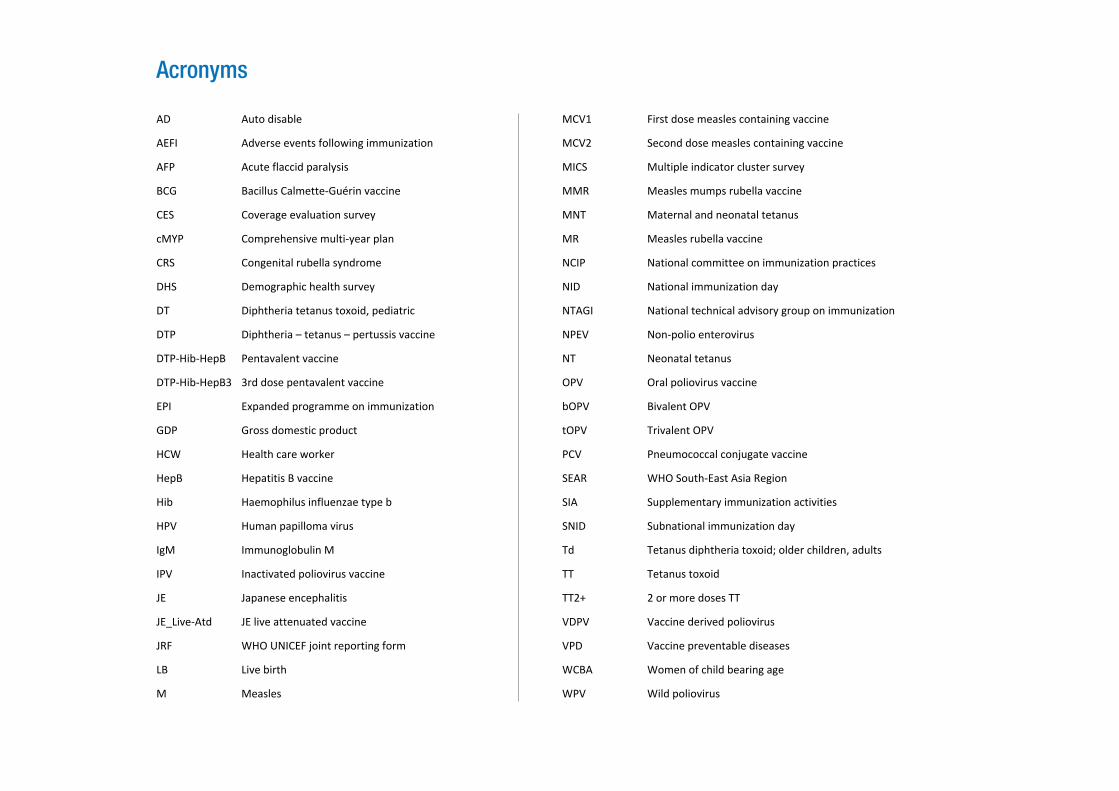
Acronyms
AD Auto disable
AEFI Adverse events following immunization
AFP Acute flaccid paralysis
BCG Bacillus Calmette-Guérin vaccine
CES Coverage evaluation survey
cMYP Comprehensive multi-year plan
CRS Congenital rubella syndrome
DHS Demographic health survey
DT Diphtheria tetanus toxoid, pediatric
DTP Diphtheria – tetanus – pertussis vaccine
DTP-Hib-HepB Pentavalent vaccine
DTP-Hib-HepB3 3rd dose pentavalent vaccine
EPI Expanded programme on immunization
GDP Gross domestic product
HCW Health care worker
HepB Hepatitis B vaccine
Hib Haemophilus influenzae type b
HPV Human papilloma virus
IgM Immunoglobulin M
IPV Inactivated poliovirus vaccine
JE Japanese encephalitis
JE_Live-Atd JE live attenuated vaccine
JRF WHO UNICEF joint reporting form
LB Live birth
M Measles
MCV1 First dose measles containing vaccine
MCV2 Second dose measles containing vaccine
MICS Multiple indicator cluster survey
MMR Measles mumps rubella vaccine
MNT Maternal and neonatal tetanus
MR Measles rubella vaccine
NCIP National committee on immunization practices
NID National immunization day
NTAGI National technical advisory group on immunization
NPEV Non-polio enterovirus
NT Neonatal tetanus
OPV Oral poliovirus vaccine
bOPV Bivalent OPV
tOPV Trivalent OPV
PCV Pneumococcal conjugate vaccine
SEAR WHO South-East Asia Region
SIA Supplementary immunization activities
SNID Subnational immunization day
Td Tetanus diphtheria toxoid; older children, adults
TT Tetanus toxoid
TT2+ 2 or more doses TT
VDPV Vaccine derived poliovirus
VPD Vaccine preventable diseases
WCBA Women of child bearing age
WPV Wild poliovirus
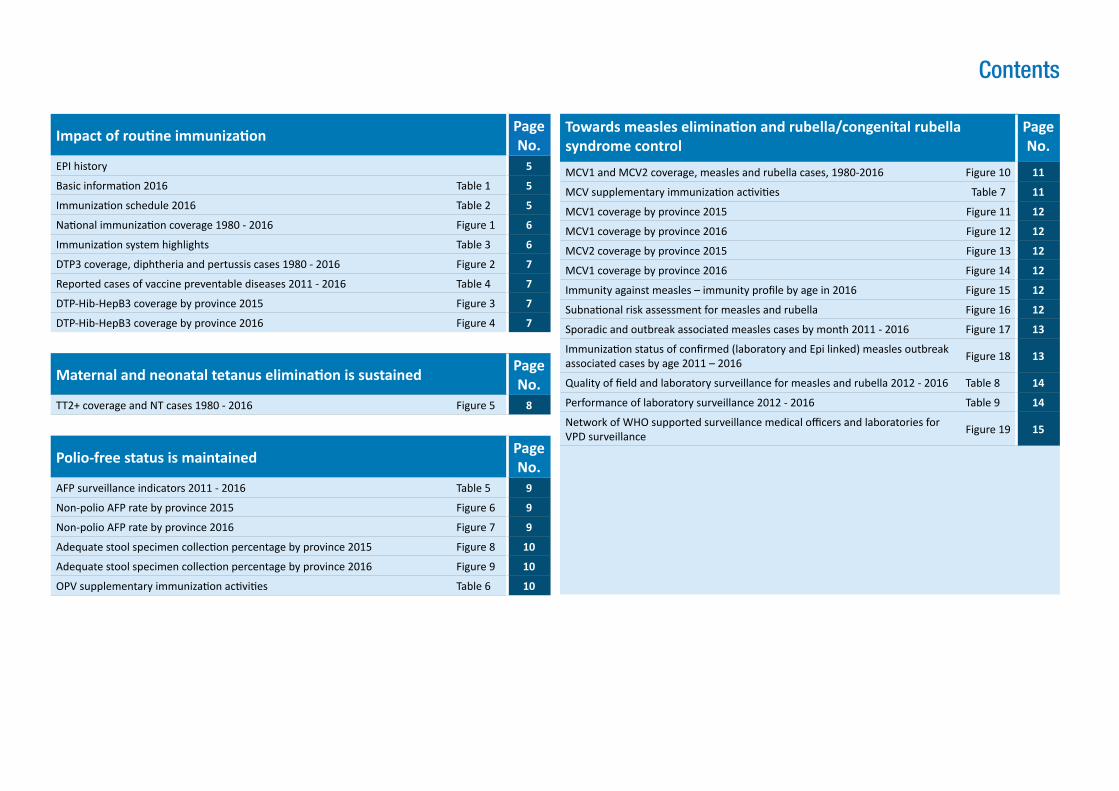
Contents
Impact of routine immunization Page No.
EPI history 5
Basic information 2016 Table 1 5
Immunization schedule 2016 Table 2 5
National immunization coverage 1980 - 2016 Figure 1 6
Immunization system highlights Table 3 6
DTP3 coverage, diphtheria and pertussis cases 1980 - 2016 Figure 2 7
Reported cases of vaccine preventable diseases 2011 - 2016 Table 4 7
DTP-Hib-HepB3 coverage by province 2015 Figure 3 7
DTP-Hib-HepB3 coverage by province 2016 Figure 4 7
Towards measles elimination and rubella/congenital rubella syndrome control
Page No.
MCV1 and MCV2 coverage, measles and rubella cases, 1980-2016 Figure 10 11
MCV supplementary immunization activities Table 7 11
MCV1 coverage by province 2015 Figure 11 12
MCV1 coverage by province 2016 Figure 12 12
MCV2 coverage by province 2015 Figure 13 12
MCV1 coverage by province 2016 Figure 14 12
Immunity against measles – immunity profile by age in 2016 Figure 15 12
Subnational risk assessment for measles and rubella Figure 16 12
Sporadic and outbreak associated measles cases by month 2011 - 2016 Figure 17 13
Immunization status of confirmed (laboratory and Epi linked) measles outbreak associated cases by age 2011 – 2016 Figure 18 13
Quality of field and laboratory surveillance for measles and rubella 2012 - 2016 Table 8 14
Performance of laboratory surveillance 2012 - 2016 Table 9 14
Network of WHO supported surveillance medical officers and laboratories for VPD surveillance Figure 19 15
Maternal and neonatal tetanus elimination is sustained Page No.
TT2+ coverage and NT cases 1980 - 2016 Figure 5 8
Polio-free status is maintained Page No.
AFP surveillance indicators 2011 - 2016 Table 5 9
Non-polio AFP rate by province 2015 Figure 6 9
Non-polio AFP rate by province 2016 Figure 7 9
Adequate stool specimen collection percentage by province 2015 Figure 8 10
Adequate stool specimen collection percentage by province 2016 Figure 9 10
OPV supplementary immunization activities Table 6 10
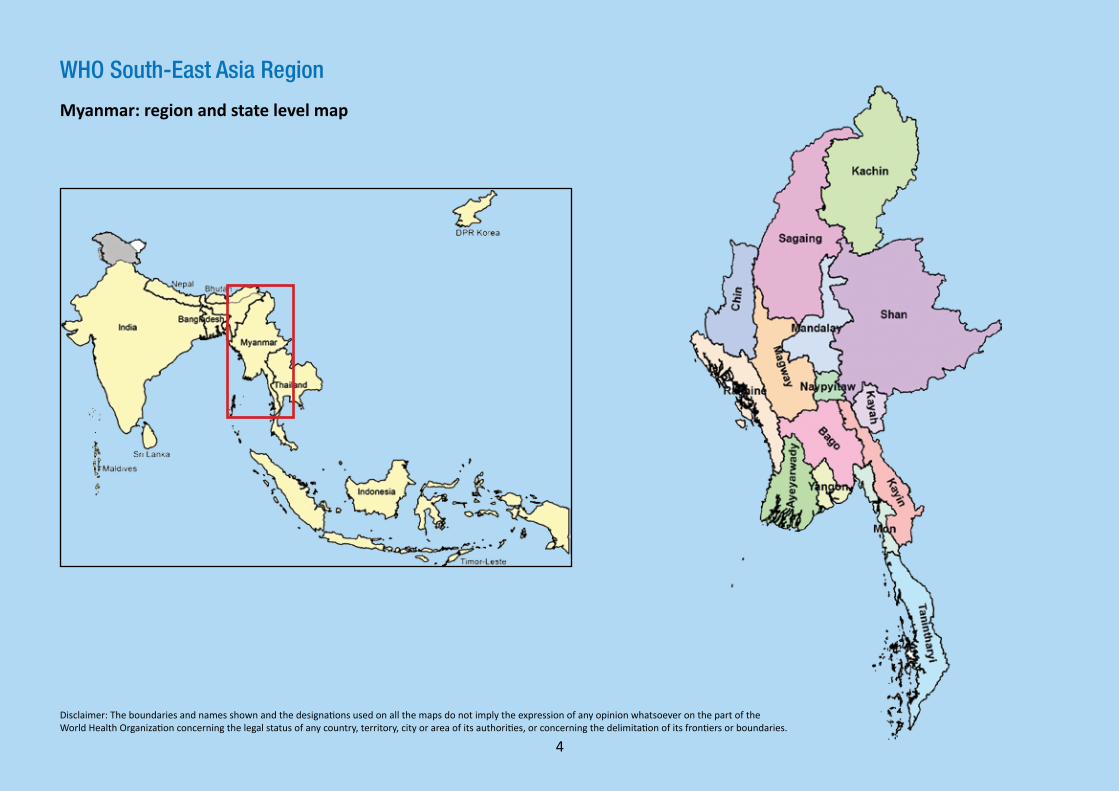
WHO South-East Asia Region
Disclaimer: The boundaries and names shown and the designations used on all the maps do not imply the expression of any opinion whatsoever on the part of the World Health Organization concerning the legal status of any country, territory, city or area of its authorities, or concerning the delimitation of its frontiers or boundaries.
Myanmar: region and state level map
4
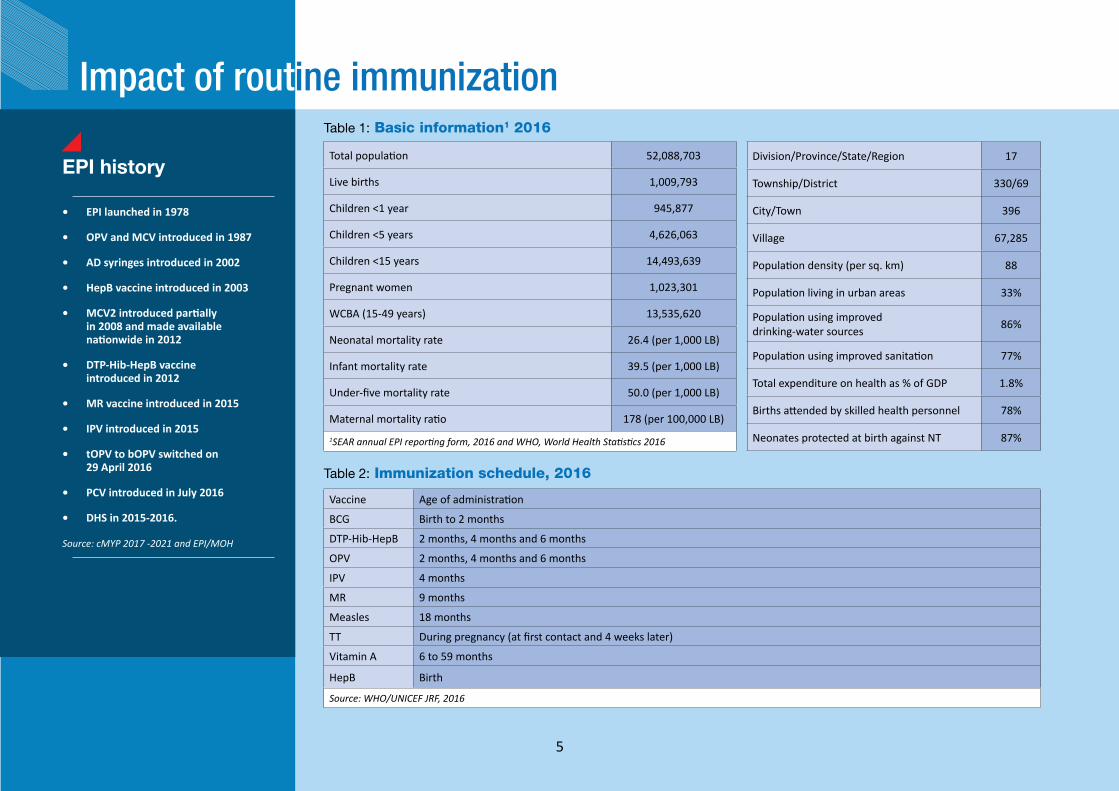
EPI history
• EPI launched in 1978
• OPV and MCV introduced in 1987
• AD syringes introduced in 2002
• HepB vaccine introduced in 2003
• MCV2 introduced partially in 2008 and made available nationwide in 2012
• DTP-Hib-HepB vaccine introduced in 2012
• MR vaccine introduced in 2015
• IPV introduced in 2015
• tOPV to bOPV switched on 29 April 2016
• PCV introduced in July 2016
• DHS in 2015-2016.
Source: cMYP 2017 -2021 and EPI/MOH
Table 1: Basic information1 2016
Total population 52,088,703
Live births 1,009,793
Children <1 year 945,877
Children <5 years 4,626,063
Children <15 years 14,493,639
Pregnant women 1,023,301
WCBA (15-49 years) 13,535,620
Neonatal mortality rate 26.4 (per 1,000 LB)
Infant mortality rate 39.5 (per 1,000 LB)
Under-five mortality rate 50.0 (per 1,000 LB)
Maternal mortality ratio 178 (per 100,000 LB)
1SEAR annual EPI reporting form, 2016 and WHO, World Health Statistics 2016
Division/Province/State/Region 17
Township/District 330/69
City/Town 396
Village 67,285
Population density (per sq. km) 88
Population living in urban areas 33%
Population using improved drinking-water sources 86%
Population using improved sanitation 77%
Total expenditure on health as % of GDP 1.8%
Births attended by skilled health personnel 78%
Neonates protected at birth against NT 87%
Table 2: Immunization schedule, 2016
Vaccine Age of administration
BCG Birth to 2 months
DTP-Hib-HepB 2 months, 4 months and 6 months
OPV 2 months, 4 months and 6 months
IPV 4 months
MR 9 months
Measles 18 months
TT During pregnancy (at first contact and 4 weeks later)
Vitamin A 6 to 59 months
HepB Birth
Source: WHO/UNICEF JRF, 2016
Impact of routine immunization
5
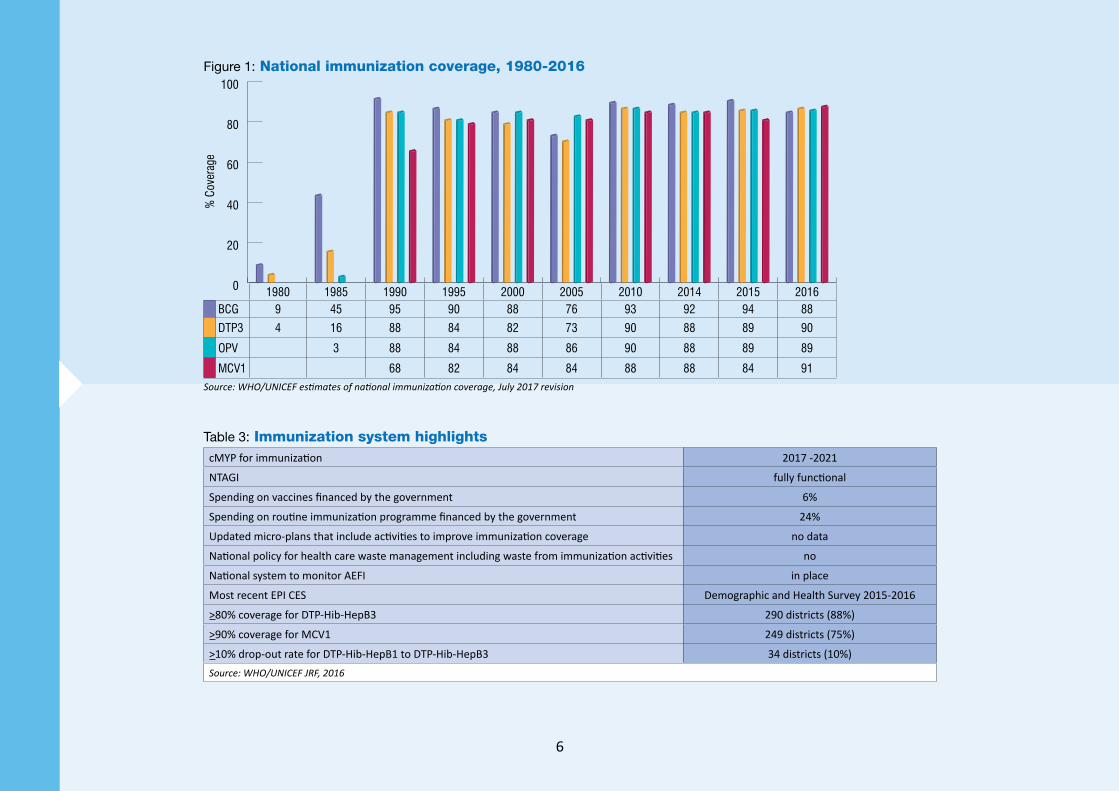
Table 3: Immunization system highlightscMYP for immunization 2017 -2021
NTAGI fully functional
Spending on vaccines financed by the government 6%
Spending on routine immunization programme financed by the government 24%
Updated micro-plans that include activities to improve immunization coverage no data
National policy for health care waste management including waste from immunization activities no
National system to monitor AEFI in place
Most recent EPI CES Demographic and Health Survey 2015-2016
>80% coverage for DTP-Hib-HepB3 290 districts (88%)
>90% coverage for MCV1 249 districts (75%)
>10% drop-out rate for DTP-Hib-HepB1 to DTP-Hib-HepB3 34 districts (10%)Source: WHO/UNICEF JRF, 2016
Figure 1: National immunization coverage, 1980-2016
Source: WHO/UNICEF estimates of national immunization coverage, July 2017 revision
% C
over
age
0
20
40
60
80
100
1980 1985 1990 1995 2000 2005 2010 2014 2015 2016BCG 9 45 95 90 88 76 93 92 94 88
DTP3 4 16 88 84 82 73 90 88 89 90
OPV 3 88 84 88 86 90 88 89 89
MCV1 68 82 84 84 88 88 84 91
6
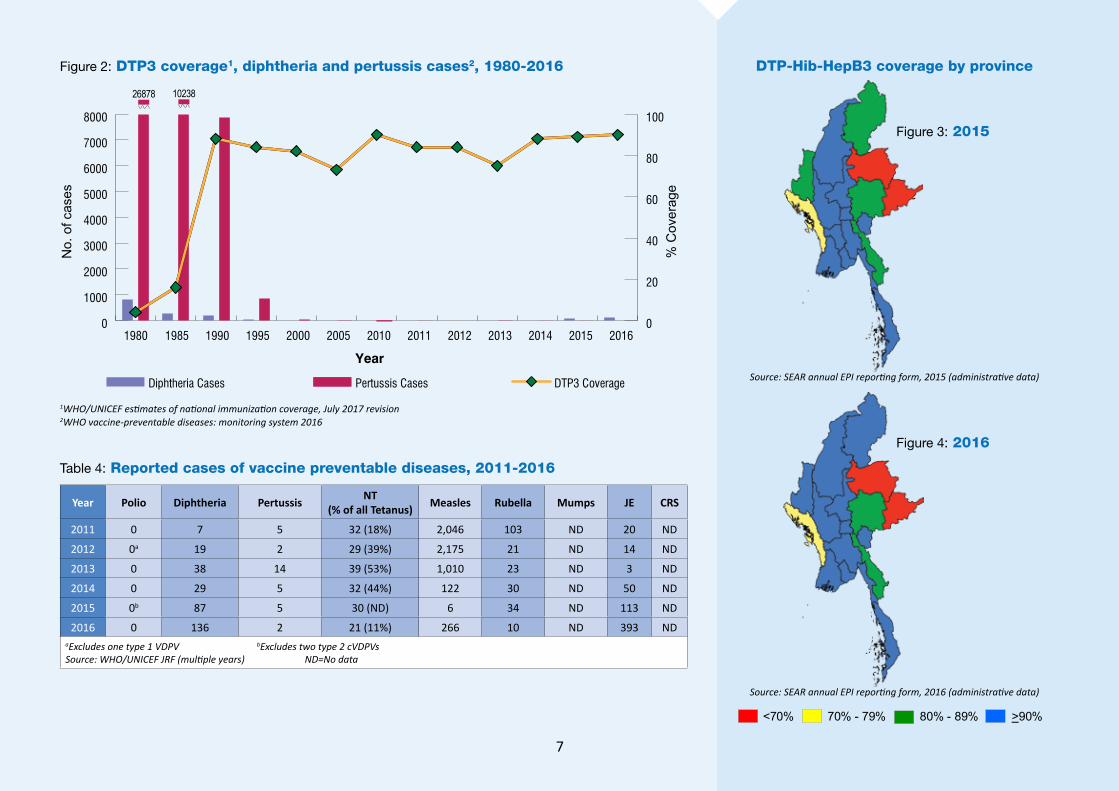
<70% 70% - 79% 80% - 89% >90%
Figure 3: 2015
Figure 4: 2016
Source: SEAR annual EPI reporting form, 2015 (administrative data)
Source: SEAR annual EPI reporting form, 2016 (administrative data)
Figure 2: DTP3 coverage1, diphtheria and pertussis cases2, 1980-2016
Year
Diphtheria Cases Pertussis Cases DTP3 Coverage
% C
over
age
No.
of c
ases
201620152014201320122011201020052000199519901980 1985
26878 102380
0
1000
2000
3000
4000
5000
6000
7000
8000
0
20
40
60
80
100
1WHO/UNICEF estimates of national immunization coverage, July 2017 revision2WHO vaccine-preventable diseases: monitoring system 2016
Table 4: Reported cases of vaccine preventable diseases, 2011-2016
Year Polio Diphtheria Pertussis NT(% of all Tetanus) Measles Rubella Mumps JE CRS
2011 0 7 5 32 (18%) 2,046 103 ND 20 ND
2012 0a 19 2 29 (39%) 2,175 21 ND 14 ND
2013 0 38 14 39 (53%) 1,010 23 ND 3 ND
2014 0 29 5 32 (44%) 122 30 ND 50 ND
2015 0b 87 5 30 (ND) 6 34 ND 113 ND
2016 0 136 2 21 (11%) 266 10 ND 393 NDaExcludes one type 1 VDPV bExcludes two type 2 cVDPVsSource: WHO/UNICEF JRF (multiple years) ND=No data
DTP-Hib-HepB3 coverage by province
7
1980 1985 1990 1995 2000 2005 2010 2011 2012 2013 2014 2015 2016
% C
over
age
No.
of c
ases
Year
NT Cases TT2+ Coverage
0
20
40
60
80
100
0
20
40
60
80
100
120
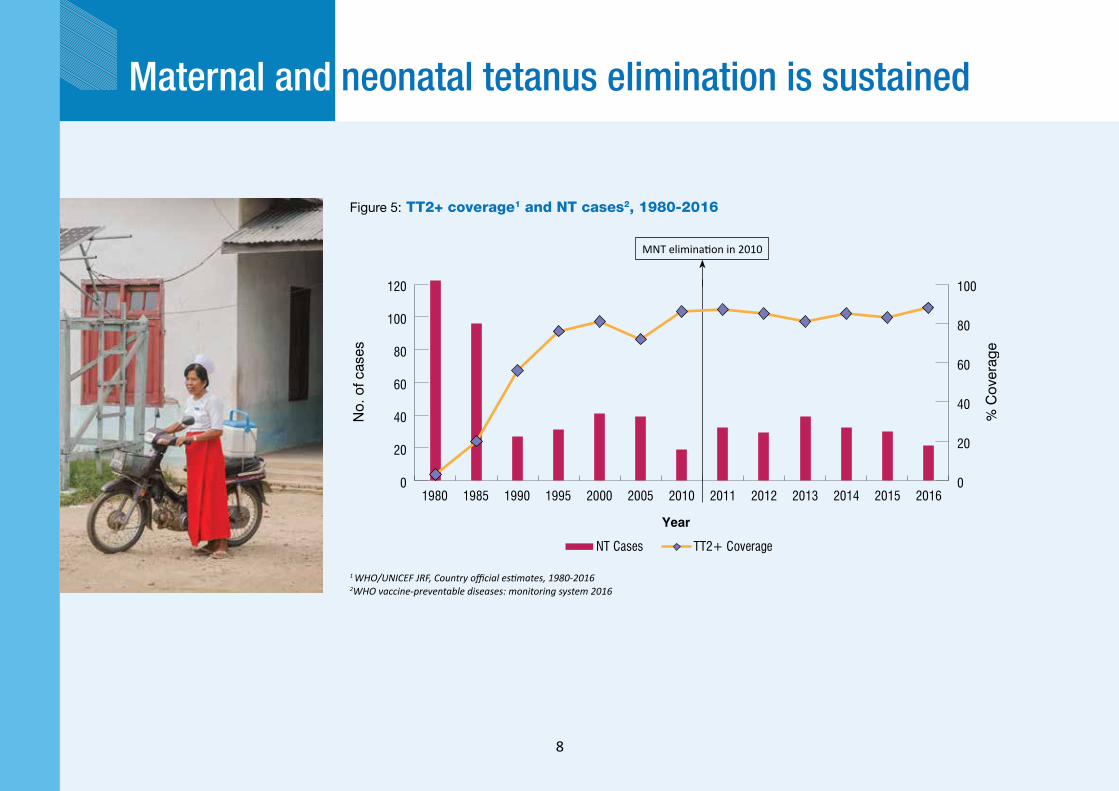
Figure 5: TT2+ coverage1 and NT cases2, 1980-2016
1 WHO/UNICEF JRF, Country official estimates, 1980-20162WHO vaccine-preventable diseases: monitoring system 2016
Maternal and neonatal tetanus elimination is sustained
MNT elimination in 2010
8
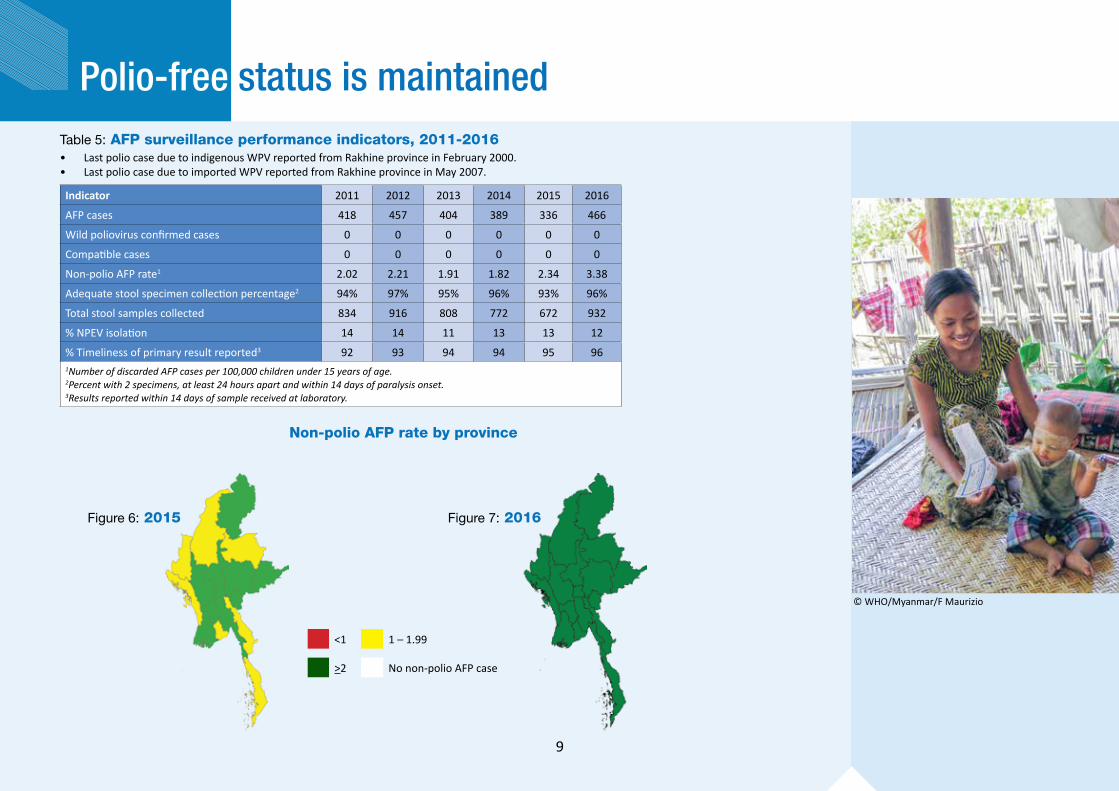
Table 5: AFP surveillance performance indicators, 2011-2016
Indicator 2011 2012 2013 2014 2015 2016
AFP cases 418 457 404 389 336 466
Wild poliovirus confirmed cases 0 0 0 0 0 0
Compatible cases 0 0 0 0 0 0
Non-polio AFP rate1 2.02 2.21 1.91 1.82 2.34 3.38
Adequate stool specimen collection percentage2 94% 97% 95% 96% 93% 96%
Total stool samples collected 834 916 808 772 672 932
% NPEV isolation 14 14 11 13 13 12
% Timeliness of primary result reported3 92 93 94 94 95 961Number of discarded AFP cases per 100,000 children under 15 years of age. 2Percent with 2 specimens, at least 24 hours apart and within 14 days of paralysis onset.3Results reported within 14 days of sample received at laboratory.
Figure 6: 2015 Figure 7: 2016
Polio-free status is maintained
• Last polio case due to indigenous WPV reported from Rakhine province in February 2000.• Last polio case due to imported WPV reported from Rakhine province in May 2007.
Non-polio AFP rate by province
<1 1 – 1.99
>2 No non-polio AFP case
© WHO/Myanmar/F Maurizio
9
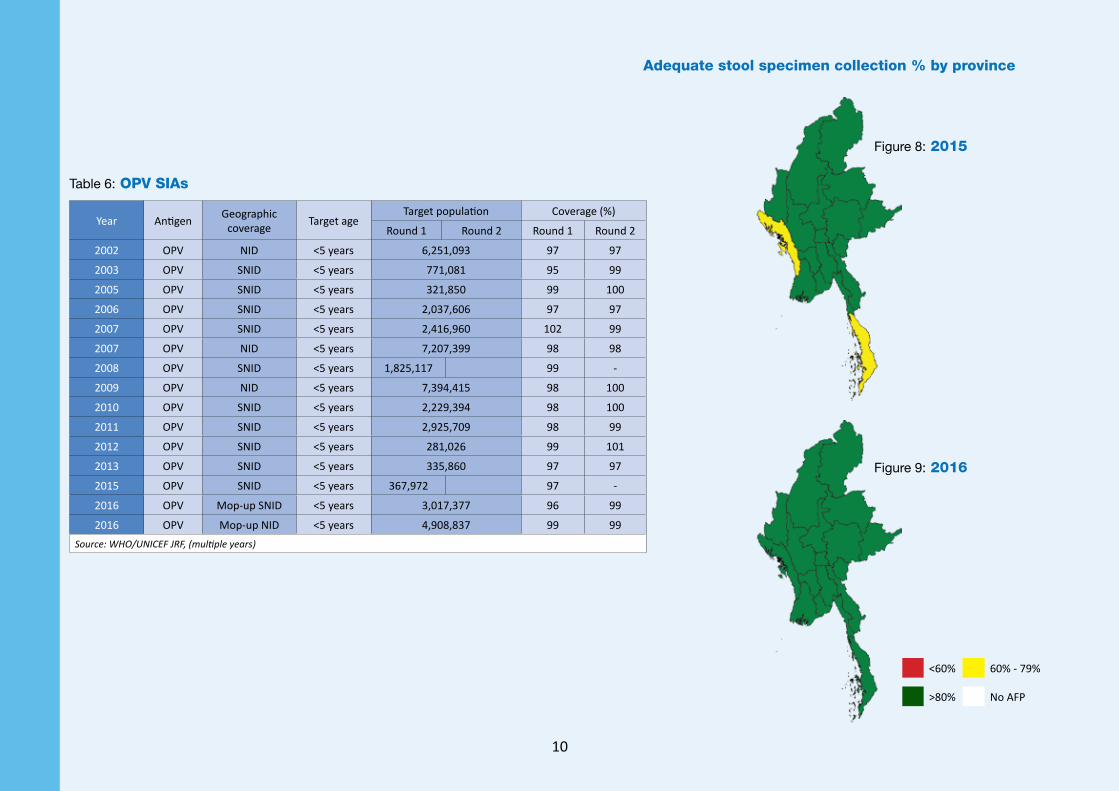
Figure 9: 2016
Figure 8: 2015
Table 6: OPV SIAs
Adequate stool specimen collection % by province
<60% 60% - 79%
>80% No AFP
Year Antigen Geographic coverage Target age
Target population Coverage (%)
Round 1 Round 2 Round 1 Round 2
2002 OPV NID <5 years 6,251,093 97 97
2003 OPV SNID <5 years 771,081 95 99
2005 OPV SNID <5 years 321,850 99 100
2006 OPV SNID <5 years 2,037,606 97 97
2007 OPV SNID <5 years 2,416,960 102 99
2007 OPV NID <5 years 7,207,399 98 98
2008 OPV SNID <5 years 1,825,117 99 -
2009 OPV NID <5 years 7,394,415 98 100
2010 OPV SNID <5 years 2,229,394 98 100
2011 OPV SNID <5 years 2,925,709 98 99
2012 OPV SNID <5 years 281,026 99 101
2013 OPV SNID <5 years 335,860 97 97
2015 OPV SNID <5 years 367,972 97 -
2016 OPV Mop-up SNID <5 years 3,017,377 96 99
2016 OPV Mop-up NID <5 years 4,908,837 99 99Source: WHO/UNICEF JRF, (multiple years)
10
Towards measles elimination and rubella/CRS control
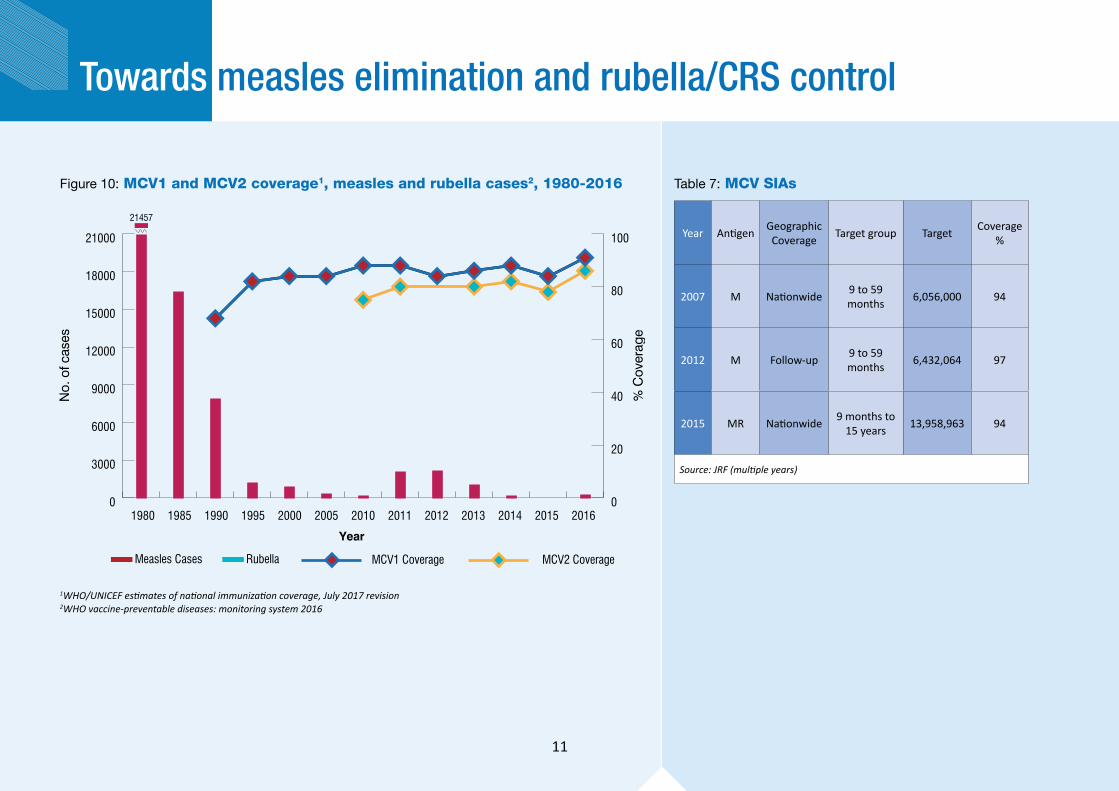
Figure 10: MCV1 and MCV2 coverage1, measles and rubella cases2, 1980-2016
Measles Cases Rubella MCV1 Coverage MCV2 Coverage
2016201520142013201220112010200520001995199019851980
21457
% C
over
age
No.
of c
ases
Year
0
20
40
60
80
100
0
3000
6000
9000
12000
15000
18000
21000
1WHO/UNICEF estimates of national immunization coverage, July 2017 revision2WHO vaccine-preventable diseases: monitoring system 2016
Table 7: MCV SIAs
Year Antigen Geographic Coverage Target group Target Coverage
%
2007 M Nationwide 9 to 59 months 6,056,000 94
2012 M Follow-up 9 to 59 months 6,432,064 97
2015 MR Nationwide 9 months to 15 years 13,958,963 94
Source: JRF (multiple years)
11
0%
20%
40%
60%
80%
100%
0 1 2 3 4 5 6 7 8 9 10 11 12 13 14 15 16 17 18 19
Per
cent
of p
opul
atio
n
Age (in years)Protected by maternal antibodies Protected by routine vaccination with 1st doseProtected by routine vaccination with 2nd dose Protected by SIAsImmune due to past infection Susceptible
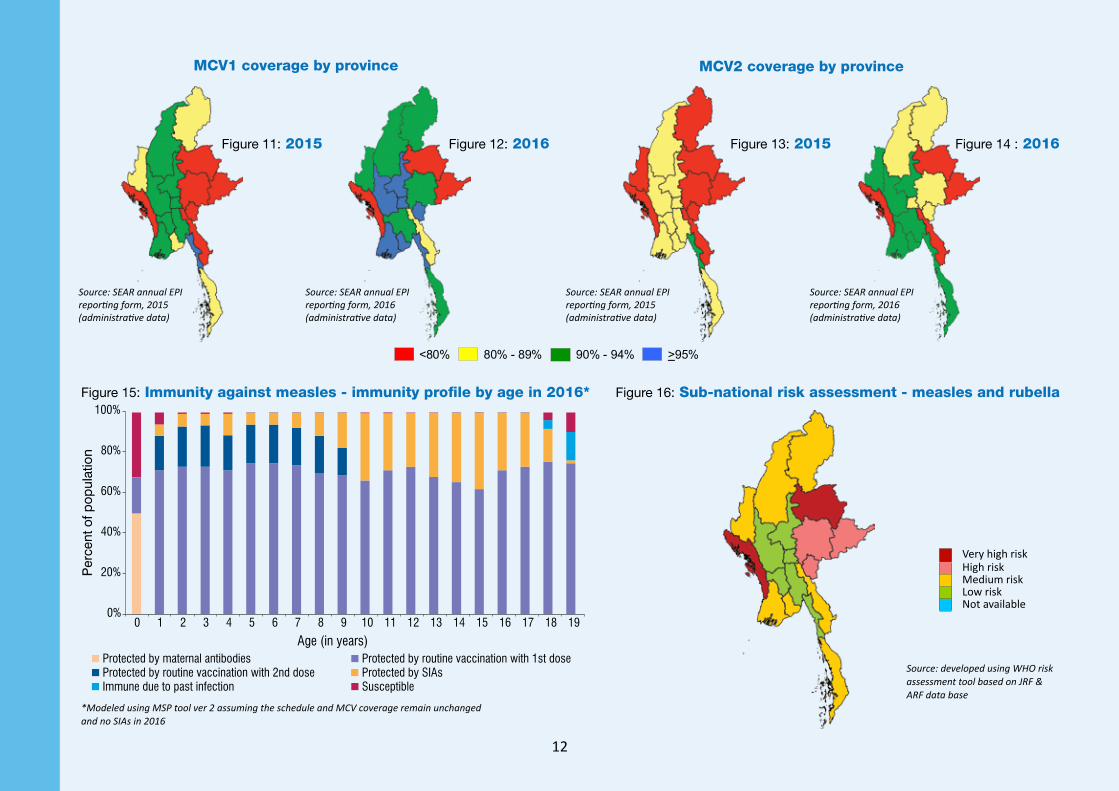
Figure 15: Immunity against measles - immunity profile by age in 2016*
*Modeled using MSP tool ver 2 assuming the schedule and MCV coverage remain unchanged and no SIAs in 2016
<80% 80% - 89% 90% - 94% >95%
Figure 12: 2016 Figure 13: 2015 Figure 14 : 2016
Source: SEAR annual EPI reporting form, 2016 (administrative data)
Source: SEAR annual EPI reporting form, 2016 (administrative data)
Figure 11: 2015
Source: SEAR annual EPI reporting form, 2015 (administrative data)
Source: SEAR annual EPI reporting form, 2015 (administrative data)
Figure 16: Sub-national risk assessment - measles and rubella
MCV1 coverage by province MCV2 coverage by province
Source: developed using WHO risk assessment tool based on JRF & ARF data base
Very high riskHigh riskMedium riskLow riskNot available
12
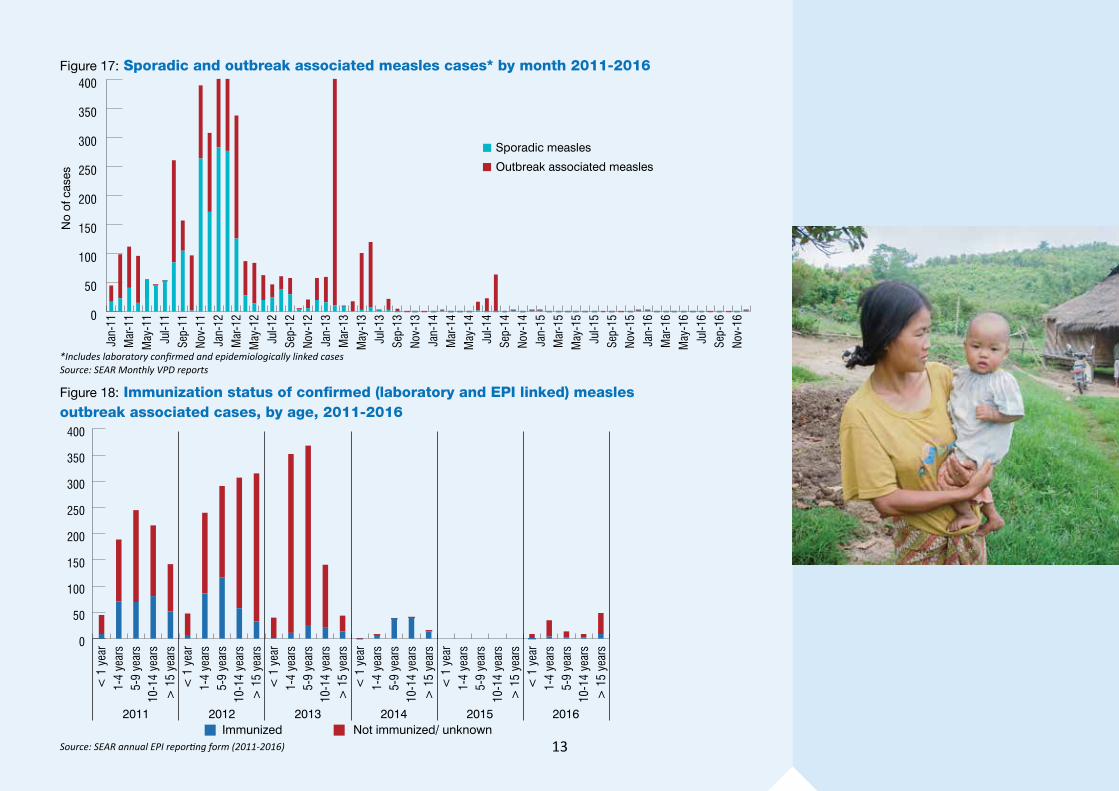
Figure 17: Sporadic and outbreak associated measles cases* by month 2011-2016
Nov-
16Se
p-16
Jul-1
6M
ay-1
6M
ar-1
6Ja
n-16
Nov-
15Se
p-15
Jul-1
5M
ay-1
5M
ar-1
5Ja
n-15
Nov-
14Se
p-14
Jul-1
4M
ay-1
4M
ar-1
4Ja
n-14
Nov-
13Se
p-13
Jul-1
3M
ay-1
3M
ar-1
3Ja
n-13
Nov-
12Se
p-12
Jul-1
2M
ay-1
2M
ar-1
2Ja
n-12
Nov-
11Se
p-11
Jul-1
1M
ay-1
1M
ar-1
1Ja
n-11
Sporadic measles
Outbreak associated measles
No
of c
ases
0
50
100
150
200
250
300
350
400
*Includes laboratory confirmed and epidemiologically linked casesSource: SEAR Monthly VPD reports
Figure 18: Immunization status of confirmed (laboratory and EPI linked) measles outbreak associated cases, by age, 2011-2016
> 1
5 ye
ars
10-1
4 ye
ars
5-9
year
s1-
4 ye
ars
< 1
yea
r>
15
year
s10
-14
year
s5-
9 ye
ars
1-4
year
s<
1 y
ear
> 1
5 ye
ars
10-1
4 ye
ars
5-9
year
s1-
4 ye
ars
< 1
yea
r>
15
year
s10
-14
year
s5-
9 ye
ars
1-4
year
s<
1 y
ear
> 1
5 ye
ars
10-1
4 ye
ars
5-9
year
s1-
4 ye
ars
< 1
yea
r>
15
year
s10
-14
year
s5-
9 ye
ars
1-4
year
s<
1 y
ear
2011 2012 2013 2014 2015 2016Immunized Not immunized/ unknown
0
50
100
150
200
250
300
350
400
Source: SEAR annual EPI reporting form (2011-2016) 13
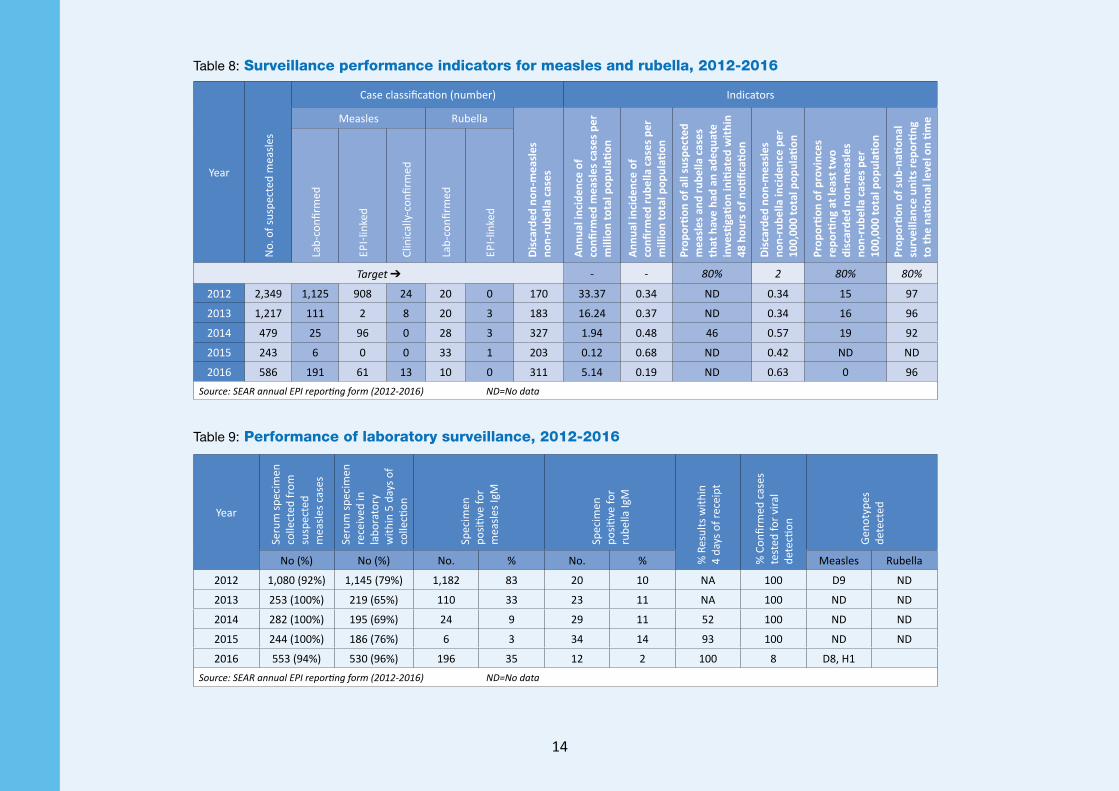
Table 8: Surveillance performance indicators for measles and rubella, 2012-2016
Year
No.
of s
uspe
cted
mea
sles
Case classification (number) Indicators
Measles Rubella
Disc
arde
d no
n-m
easl
es
non-
rube
lla c
ases
Annu
al in
cide
nce
of
confi
rmed
mea
sles
cas
es p
er
mill
ion
tota
l pop
ulati
on
Annu
al in
cide
nce
of
confi
rmed
rube
lla c
ases
per
m
illio
n to
tal p
opul
ation
Prop
ortio
n of
all
susp
ecte
d m
easl
es a
nd ru
bella
cas
es
that
hav
e ha
d an
ade
quat
e in
vesti
gatio
n in
itiat
ed w
ithin
48
hou
rs o
f noti
ficati
on
Disc
arde
d no
n-m
easl
es
non-
rube
lla in
cide
nce
per
100,
000
tota
l pop
ulati
on
Prop
ortio
n of
pro
vinc
es
repo
rting
at l
east
two
disc
arde
d no
n-m
easl
es
non-
rube
lla c
ases
per
10
0,00
0 to
tal p
opul
ation
Prop
ortio
n of
sub-
natio
nal
surv
eilla
nce
units
repo
rting
to
the
natio
nal l
evel
on
time
Lab-
confi
rmed
EPI-l
inke
d
Clin
ical
ly-c
onfir
med
Lab-
confi
rmed
EPI-l
inke
d
Target ➔ - - 80% 2 80% 80%
2012 2,349 1,125 908 24 20 0 170 33.37 0.34 ND 0.34 15 97
2013 1,217 111 2 8 20 3 183 16.24 0.37 ND 0.34 16 96
2014 479 25 96 0 28 3 327 1.94 0.48 46 0.57 19 92
2015 243 6 0 0 33 1 203 0.12 0.68 ND 0.42 ND ND
2016 586 191 61 13 10 0 311 5.14 0.19 ND 0.63 0 96Source: SEAR annual EPI reporting form (2012-2016) ND=No data
Year
Seru
m sp
ecim
en
colle
cted
from
su
spec
ted
mea
sles c
ases
Seru
m sp
ecim
en
rece
ived
in
labo
rato
ry
with
in 5
day
s of
colle
ction
Spec
imen
po
sitive
for
mea
sles I
gM
Spec
imen
po
sitive
for
rube
lla Ig
M
% R
esul
ts w
ithin
4
days
of r
ecei
pt
% C
onfir
med
cas
es
test
ed fo
r vira
l de
tecti
on
Geno
type
s de
tect
ed
No (%) No (%) No. % No. % Measles Rubella
2012 1,080 (92%) 1,145 (79%) 1,182 83 20 10 NA 100 D9 ND
2013 253 (100%) 219 (65%) 110 33 23 11 NA 100 ND ND
2014 282 (100%) 195 (69%) 24 9 29 11 52 100 ND ND
2015 244 (100%) 186 (76%) 6 3 34 14 93 100 ND ND
2016 553 (94%) 530 (96%) 196 35 12 2 100 8 D8, H1Source: SEAR annual EPI reporting form (2012-2016) ND=No data
Table 9: Performance of laboratory surveillance, 2012-2016
14
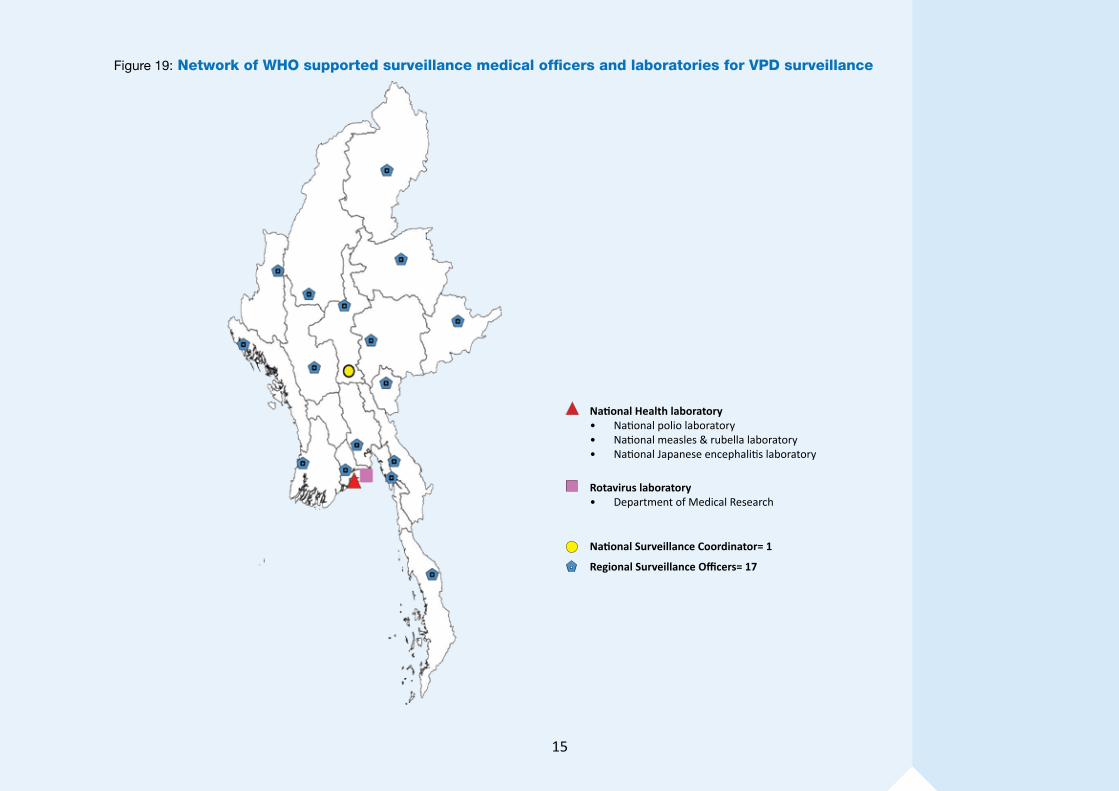
Figure 19: Network of WHO supported surveillance medical officers and laboratories for VPD surveillance
National Health laboratory• National polio laboratory• National measles & rubella laboratory• National Japanese encephalitis laboratory
Rotavirus laboratory• Department of Medical Research
National Surveillance Coordinator= 1
Regional Surveillance Officers= 17
15
For contact or feedback:Director (Epidemiology)Central Epidemiology Unit, Ministry of HealthNay Pyi Taw, Myanmar, Tel: +95 67 420925Email: [email protected]
Immunization and Vaccine Development (IVD)WHO-SEARO, IP Estate, MG Marg, New Delhi 110002, IndiaTel: +91 11 23370804, Fax: +91 11 23370251Email: [email protected]/entity/immunization