Embed Size (px)
Citation preview
Sri LankaNationalImmunizationProgram
ASIAN VACCINATION INITIATIVE
FINANCING ASSESSMENT
This publication was prepared by consultants for the Asian Development Bank. The findings,interpretations, and conclusions expressed in it do not necessarily represent the views of ADBor those of its member governments. The Asian Development Bank does not guarantee theaccuracy of the data included in the publication and accepts no responsibility whatsoever forany consequences of their use.
©Asian Development Bank 2001
ISBN 971-561-348-9Publication Stock No. 020201
Published by the Asian Development BankP.O. Box 789, 0980 Manila, Philippines
Contents
Illustrations and Tables vAcknowledgments viiAbbreviations ix
Executive Summary xi
Introduction 1
Purpose 1
Methodology 1
Background 3
Socioeconomic Situation 3
Health resource allocation 4
Demographic and Health Indicators 4
Vaccine-preventable diseases 5
Health System 6
Structure and decentralization 6
Finance 7
Donor support 8
National Immunization Program 9
Strategic Plan 9
Organizational Structure 9
Coverage 11
Financial Structure 11
Government sources: National level 12
Government sources: Provincial level 12
Past and Current Financing 13
Vaccine costs 13
Nonvaccine costs 13
Overall 14
Future Financing 15
Key Issues 15
Vaccine supply: Sustainability, quality assurance, and price 15
Quality assurance 15
Costs and financing 16
Laboratory services and surveillance 17
Vaccine management and the cold chain 18
Wastage rates 18
Forecasting 18
Storage 18
Transport 19
Equipment 19
Maintenance 20
Costs and financing 20

iv
Quality and community commitment 23
Supervision 23
Environment 23
Costs and financing 24
Equitable access 24
Estate sector 25
Conflict zones in the north and east 25
Costs and financing 26
Safety of injections 26
Costs and financing 26
Introduction of new vaccines 27
Hepatitis B 27
Costs and financing 28
Haemophilus influenzae type B (Hib) 29
Disease control initiatives 29
Polio 29
Measles 29
Costs and financing 30
Neonatal tetanus 30
Financing Needs, Sources, and Gaps 30
Projected costs: Basic EPI program 30
Projected costs: Strengthened/expanded program 30
Projected Sources and Funding Gap 31
Policy and Financing Options 35
Policy Options 35
Vaccine management 35
Donor dependence 35
Cold-chain equipment: Management and procurement 36
Monitoring 36
Financing Options 36
Vaccines 37
Vaccine management and the cold chain 37
Quality and community commitment 37
Equitable access 38
Injection safety 38
Introduction of new vaccines 39
Disease control strategies 39
Summary 39
Recommendations 41
AppendixesAppendix A: Incidence of EPI Target Diseases, 1990–1999 43Appendix B: Working Papers 44
References 49
Illustrations and Tables
Figures
1 Incidence of Measles, 1990 to Mid-2000 5
2 Organization of Provincial Health Services in Relation to Immunization Services 7
3 Ministry of Health Departments with Immunization Responsibilities 10
4 Flow of Funds for the Immunization Program 12
5 Actual Wastage Rates, 1996–1999, and WHO Standards 18
6 AD Syringe and Sterilizable Equipment Costs Compared, 2001–2005 27
7 Overall Financing Gap for Improved EPI, 2001–2005 32
Tables
1 Macroeconomic Indicators, 1990 to 1999 3
2 Demographic Indicators, 1990 to 1999 4
3 Health Indicators, 1990 to 1999 5
4 Government Expenditure on Health, 1995 to 1999 8
5 Immunization Schedule for Sri Lanka 10
6 Expenditures for the Routine Immunization Program, 1999 (US$) 13
7 Projected EPI Vaccine Costs, 2001–2005 (US$) 17
8 Laboratory Quality Assurance Service Needs over Five Years 17
9 Cost Savings Through Reduced Wastage (selected vaccines) 21
10 Cold-Chain Capital Investment Costs 21
11 Costs of Phasing in Cold-Chain Needs over Three Years (US$) 22
12 Cost of Supervising Vehicles for Central and District Levels 24
13 Cost of Supervising Vehicles, Using Phased Approach (US$) 24
14 TT Coverage in Vulnerable Populations, 1999–2000 25
15 Cost of Introducing Hepatitis B Vaccine into the National Program 28
16 Cost per Year of Introducing Combination Hepatitis B–DPT Vaccine (US$) 28
17 Projected Minimum Costs of the Standard Immunization Program, 2001–2005 (US$) 31
18 Strengthened and Expanded EPI, 2001–2005 (US$) 32
19 Total Financing Gap for an Improved EPI, 2001–2005 33
Acknowledgments
This report was prepared by Nimal Attanyake and Sally Stevenson for the Agriculture and
Social Sectors Department (West) of the Asian Development Bank. Camille Contreras of
ADB provided production support.
The study was supervised by Indu Bhushan, Senior Project Economist, under the overall
guidance of Edward M. Haugh, Manager, Education, Health, and Population Division
(West), ADB.
Abbreviations
AD auto-disable
Atd adult tetanus and diphtheria vaccine
AEFI adverse effects following immunization
BCG anti-TB vaccine
DDHS/MOH Divisional Director of Health Services/Medical Officer of Health
DPT or DTP diphtheria and tetanus toxoids and pertussis vaccine
DT diphtheria and tetanus vaccine
EPI Expanded Program on Immunization
EPI Unit Epidemiological Unit
FHB Family Health Bureau
GAVI Global Alliance on Vaccines and Immunization
HepB Hepatitis B vaccine
HIB Haemophilus influenzae type B
JICA Japan International Cooperation Agency
MCH Maternal and Child Health Unit
MOH Ministry of Health
MR measles rubella vaccine
MRI Medical Research Institute
MSF Médecins sans Frontières
NID National Immunization Day
NGO nongovernment organization
OPV oral polio vaccine
SNID Subnational Immunization Day
TB tuberculosis
Td diphtheria (reduced component) and tetanus vaccine
TT tetanus toxoid
TRUST Plantation Housing and Social Welfare Trust
UNFPA United Nations Population Fund
UNICEF United Nations Children’s Fund
WHO World Health Organization
Executive Summary
This financing assessment of the national immunization program of Sri Lanka was carried
out under the Asian Vaccination Initiative and in collaboration with the Government of Sri
Lanka.
Since independence, the Government of Sri Lanka has made it a priority to develop an
equitable health-care system with a focus on primary health care. As a result, health
indicators are excellent, particularly relative to comparable low- or lower-middle-income
countries. Immunization has been an integrated component of the primary health care
program for 20 years.
The national immunization program of Sri Lanka has an excellent record, with low
incidence of Expanded Program on Immunization (EPI) disease and high coverage
(more than 95 percent) for all EPI vaccines. However, unless the country pays attention to
key issues of program quality it could lose the advantages it has gained in disease control
over the last 20 years. Consolidation of gains and successful expansion of the program will
depend primarily on ensuring that improvements are made in the cold chain and service
quality and that hard-to-reach populations have access to quality safe vaccinations.
Rather than being a comprehensive review of the program, this assessment was made to:
• Estimate current and future costs of the program, including the added costs of strength-
ening and expanding it
• Identify future funding sources, and determine any financing gaps
• Recommend ways of strengthening the program and enhancing its financial sustainability
The assessment was also intended to provide a useful tool for immunization financial
planning, policy dialogue, and funding negotiation with donors and international
agencies.
It is clear the Government is committed to the immunization program, and since 1998 Sri
Lanka has been self-sufficient in vaccine procurement. UNICEF, which has provided funds
for supplies and capital equipment, has been the major donor so far although the level of
its future support is unclear.
Over a period of five years, the projected minimum cost of implementing the routine
immunization program is estimated at $8 million, or between $1.5 million and $1.8
million per year, assuming that the use of sterilizable equipment for injections is main-
tained. Introducing hepatitis B vaccine, strengthening laboratory capacity and adverse
effects following immunization (AEFI) reporting, continuing polio eradication, improv-
ing the cold chain and supervision, and completing the upgrade of sterilization equip-
ment would cost an additional $7 million. Of this amount, $3.4 million would go to
capital investment and $1.1 million each to the introduction of hepatitis B vaccine and a
measles campaign. As yet, there are no confirmed donors for these expenditures, and if
the Government funds all core EPI activity and the vaccine for polio eradication there will
be a funding gap of about $6.4 million.
The national immunization
program of Sri Lanka has
an excellent record, with low
incidence of EPI disease and
high coverage for all EPI
vaccines
xii
Administrative decentralization has made it difficult to form a coherent picture of the total
cost of delivering routine immunization services in Sri Lanka. The central Government
aggregates historical data only to a limited extent and accounting at all levels is not
reported on functional lines.
The recommendations in this paper concern financing policies and requirements. They
take into account the fiscal constraints on the Government and the need to maintain high
coverage of quality safe vaccinations. It is recommended that the Government:
• Improve financial sustainability by ensuring full internal funding of all basic opera-
tional costs of the routine program
• Minimize cost by considering multi-year planning and procurement contracts, reduc-
ing wastage, establishing a national inventory and monitoring system, and undertaking
preventive maintenance on equipment
• Mobilize external resources to strengthen the cold chain, upgrade injection equip-
ment, and undertake a measles campaign
• Make the program more accessible to hard-to-reach populations in the north and east
and in the estate sector by ensuring that any investment strategy meets their resource
needs
Finally, the findings and recommendations of this paper should be viewed in the context
of the strategic plan and five-year budget that will follow after the full program review in
March 2001. The review was planned to prepare for the Government’s application for
funding to the Global Alliance on Vaccines and Immunization (GAVI) for the introduc-
tion of Hepatitis B vaccine.
The projected minimum
cost of implementing the
routine immunization
program over a period of five
years is about $8 million, or
between $1.5 and $1.8 million
a year
CHAPTER I
Introduction
Purpose
This assessment was made under the Asian Vaccination Initiative (AVI) of the Asian
Development Bank.
Through this assessment of financing issues in the national immunization program (NIP)
of Sri Lanka and a review of existing documentation, this paper seeks to identify the
following:
• The financial status of the program, including financing gaps
• Future funding requirements for a routine (or expanded) program
• Sustainable financial options for strengthening the program
• Anticipated and potential funding sources
A coherent analysis of financial requirements, available resources, and financing gaps is
an important aspect of medium-term planning.
Methodology
The data used in this report were collected over a period of six weeks, including a two-
week field visit to Sri Lanka by the international consultant. Most of the data are national
level, obtained through documents and a series of interviews with key government and
donor informants at central and provincial level. The appropriate UNICEF officials were
unfortunately not in Sri Lanka during the visit.
The cost and financing analyses used data from the central Ministry of Health, particularly
its Epidemiological Unit and Family Health Bureau, management reports including the
Country Report on the immunization program, the findings of a previous consultant, and
country and global logistic reports of UNICEF.
Information used to estimate target populations came from the Epidemiological Unit and
the Population Information Center.
Acoherent analysis of
financial requirements,
available resources, and
financing gaps is an important
aspect of medium-term
planning
CHAPTER II
Background
Socioeconomic Situation
Sri Lanka has had an open economy since economic liberalization in 1977. In the mid-
1980s and early 1990s economic growth was rapid, and Sri Lanka now ranks as a lower-
middle-income country.1 Despite 17 years of internal conflict the economy has been
resilient, recording an average growth rate of 5.2 percent a year during the last decade
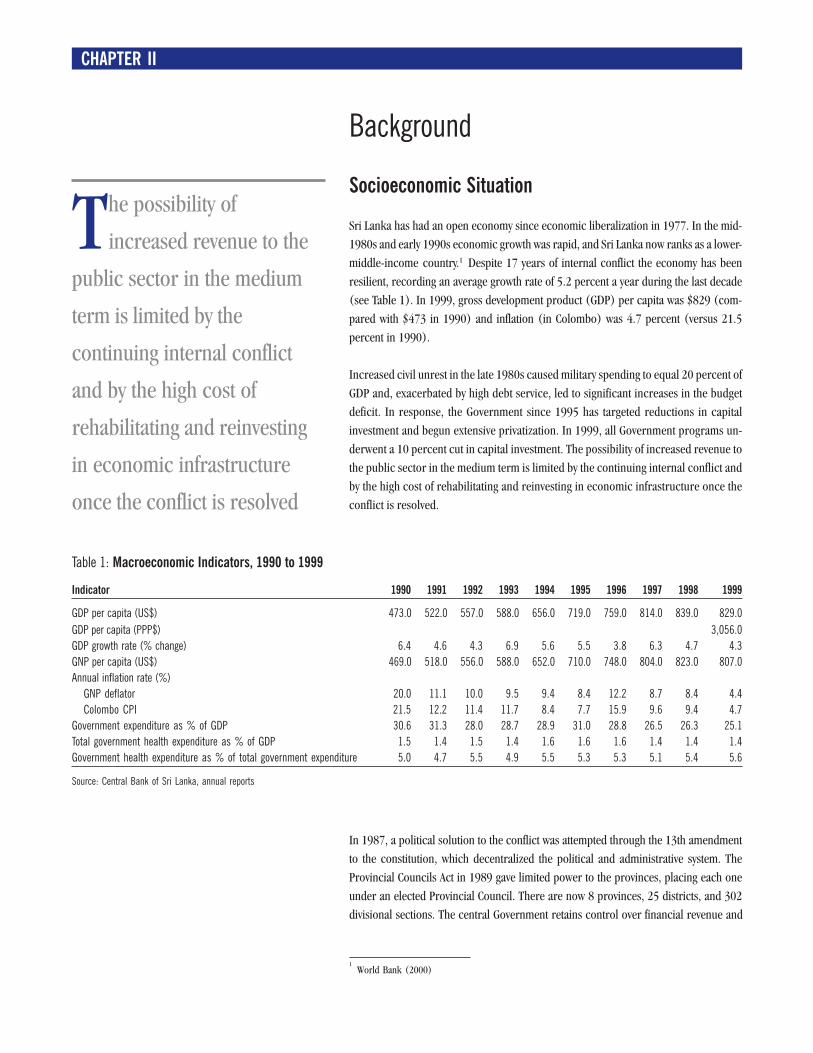
(see Table 1). In 1999, gross development product (GDP) per capita was $829 (com-
pared with $473 in 1990) and inflation (in Colombo) was 4.7 percent (versus 21.5
percent in 1990).
Increased civil unrest in the late 1980s caused military spending to equal 20 percent of
GDP and, exacerbated by high debt service, led to significant increases in the budget
deficit. In response, the Government since 1995 has targeted reductions in capital
investment and begun extensive privatization. In 1999, all Government programs un-
derwent a 10 percent cut in capital investment. The possibility of increased revenue to
the public sector in the medium term is limited by the continuing internal conflict and
by the high cost of rehabilitating and reinvesting in economic infrastructure once the
conflict is resolved.
In 1987, a political solution to the conflict was attempted through the 13th amendment
to the constitution, which decentralized the political and administrative system. The
Provincial Councils Act in 1989 gave limited power to the provinces, placing each one
under an elected Provincial Council. There are now 8 provinces, 25 districts, and 302
divisional sections. The central Government retains control over financial revenue and
Indicator 1990 1991 1992 1993 1994 1995 1996 1997 1998 1999
GDP per capita (US$) 473.0 522.0 557.0 588.0 656.0 719.0 759.0 814.0 839.0 829.0
GDP per capita (PPP$) 3,056.0
GDP growth rate (% change) 6.4 4.6 4.3 6.9 5.6 5.5 3.8 6.3 4.7 4.3
GNP per capita (US$) 469.0 518.0 556.0 588.0 652.0 710.0 748.0 804.0 823.0 807.0
Annual inflation rate (%)
GNP deflator 20.0 11.1 10.0 9.5 9.4 8.4 12.2 8.7 8.4 4.4
Colombo CPI 21.5 12.2 11.4 11.7 8.4 7.7 15.9 9.6 9.4 4.7
Government expenditure as % of GDP 30.6 31.3 28.0 28.7 28.9 31.0 28.8 26.5 26.3 25.1
Total government health expenditure as % of GDP 1.5 1.4 1.5 1.4 1.6 1.6 1.6 1.4 1.4 1.4
Government health expenditure as % of total government expenditure 5.0 4.7 5.5 4.9 5.5 5.3 5.3 5.1 5.4 5.6
Table 1: Macroeconomic Indicators, 1990 to 1999
Source: Central Bank of Sri Lanka, annual reports
The possibility of
increased revenue to the
public sector in the medium
term is limited by the
continuing internal conflict
and by the high cost of
rehabilitating and reinvesting
in economic infrastructure
once the conflict is resolved
1World Bank (2000)
4
allocates up to 90 percent of the requirements of the provinces; local taxes must cover the
remaining 10 percent. Provinces are not required to report back to the center on their
expenditures, reducing accountability and transparency.
Health resource allocation
Consecutive governments since independence have prioritized health and social welfare
spending. Policy objectives have addressed income redistribution and poverty alleviation,
reflecting the country’s long-term commitment to equity. The success of the strategy of
public/private funding for the health sector has kept Government spending modest but
efficient and effective. Despite recent fiscal pressures, public expenditure on health has
averaged 5.5 percent of Government expenditure and 1.5 percent of GDP over the past
decade. Community health services received about 15.4 percent of the total budget in
1998. But while health is likely to retain its privileged position in the budget, current
economic constraints make any increase unlikely. Funding for capital expenditure in
particular will have to come from external sources.
With liberalization, a rapidly growing private health sector has emerged. The sector
attracts about half of national health expenditure, largely for outpatient services or the
purchase of drugs. This has resulted in national health spending equal to 3.4 percent of
GDP (1996).
Demographic and Health Indicators
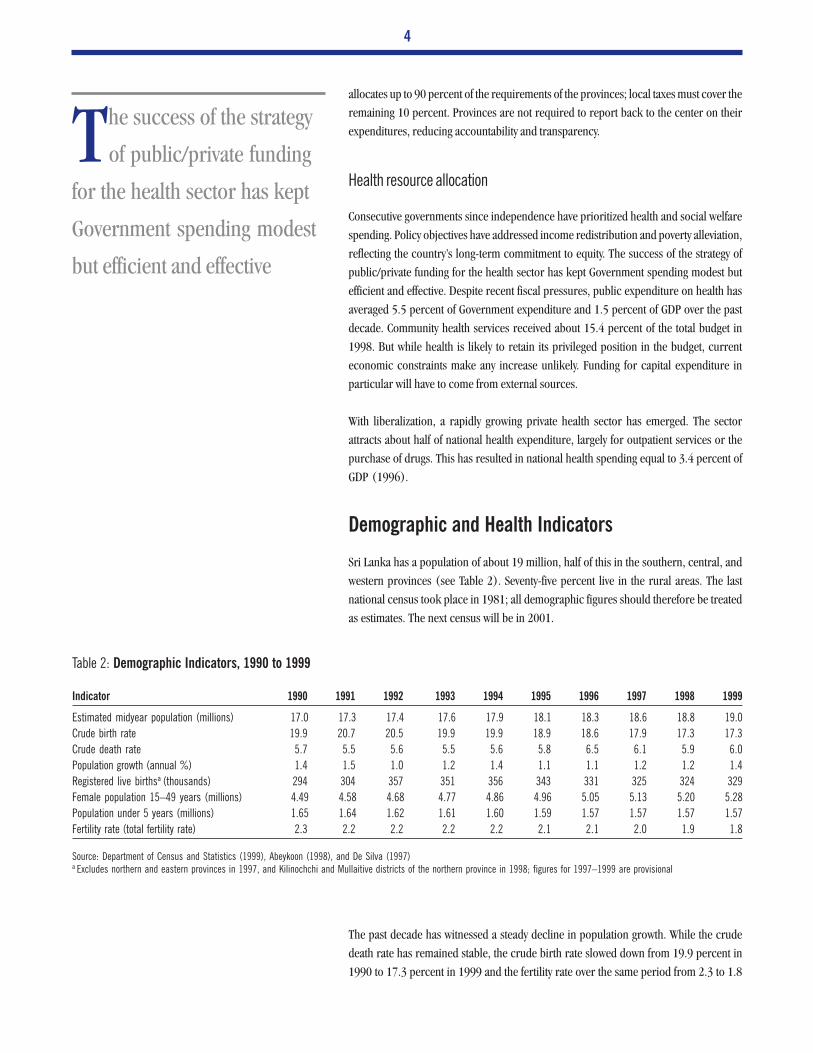
Sri Lanka has a population of about 19 million, half of this in the southern, central, and
western provinces (see Table 2). Seventy-five percent live in the rural areas. The last
national census took place in 1981; all demographic figures should therefore be treated
as estimates. The next census will be in 2001.
The past decade has witnessed a steady decline in population growth. While the crude
death rate has remained stable, the crude birth rate slowed down from 19.9 percent in
1990 to 17.3 percent in 1999 and the fertility rate over the same period from 2.3 to 1.8
Source: Department of Census and Statistics (1999), Abeykoon (1998), and De Silva (1997)a Excludes northern and eastern provinces in 1997, and Kilinochchi and Mullaitive districts of the northern province in 1998; figures for 1997–1999 are provisional
Indicator 1990 1991 1992 1993 1994 1995 1996 1997 1998 1999
Estimated midyear population (millions) 17.0 17.3 17.4 17.6 17.9 18.1 18.3 18.6 18.8 19.0
Crude birth rate 19.9 20.7 20.5 19.9 19.9 18.9 18.6 17.9 17.3 17.3
Crude death rate 5.7 5.5 5.6 5.5 5.6 5.8 6.5 6.1 5.9 6.0
Population growth (annual %) 1.4 1.5 1.0 1.2 1.4 1.1 1.1 1.2 1.2 1.4
Registered live birthsa (thousands) 294 304 357 351 356 343 331 325 324 329
Female population 15–49 years (millions) 4.49 4.58 4.68 4.77 4.86 4.96 5.05 5.13 5.20 5.28
Population under 5 years (millions) 1.65 1.64 1.62 1.61 1.60 1.59 1.57 1.57 1.57 1.57
Fertility rate (total fertility rate) 2.3 2.2 2.2 2.2 2.2 2.1 2.1 2.0 1.9 1.8
Table 2: Demographic Indicators, 1990 to 1999
The success of the strategy
of public/private funding
for the health sector has kept
Government spending modest
but efficient and effective
5
(see Table 3). The demographic shifts that will occur as a result will pose new challenges
for the social sector in general, and the health sector in particular.
Sri Lanka’s equitable health system has achieved excellent health indicators, particularly
relative to comparable low- and lower-middle-income countries. Infant and maternal
mortality rates were 17.3 and 2.3, respectively,2 in 1996, and the proportion of live births
in hospitals was 88.8 percent in 1998. Life expectancy reached 70.7 years for males and
75.4 years for females in 1999. However, the nutritional status of children is a persistent
problem: 23.3 percent of the children in Sri Lanka are considered chronically malnour-
ished.
Reflecting an epidemiological transition, noncommunicable diseases are on the in-
crease. The primary causes of hospitalization are neoplasm and diseases of the circula-
tory, genito-urinary, digestive, and nervous systems. Mental health and suicide are also
significant health problems. In contrast, hospitalization due to parasitic and respiratory
diseases has increased only marginally. HIV/AIDS shows no sign of posing a major public
health problem.
The literacy rate in the country, excluding the north and east, is 90.1 percent, but in the
plantation estate sector it is only 55 percent.
Vaccine-preventable diseases
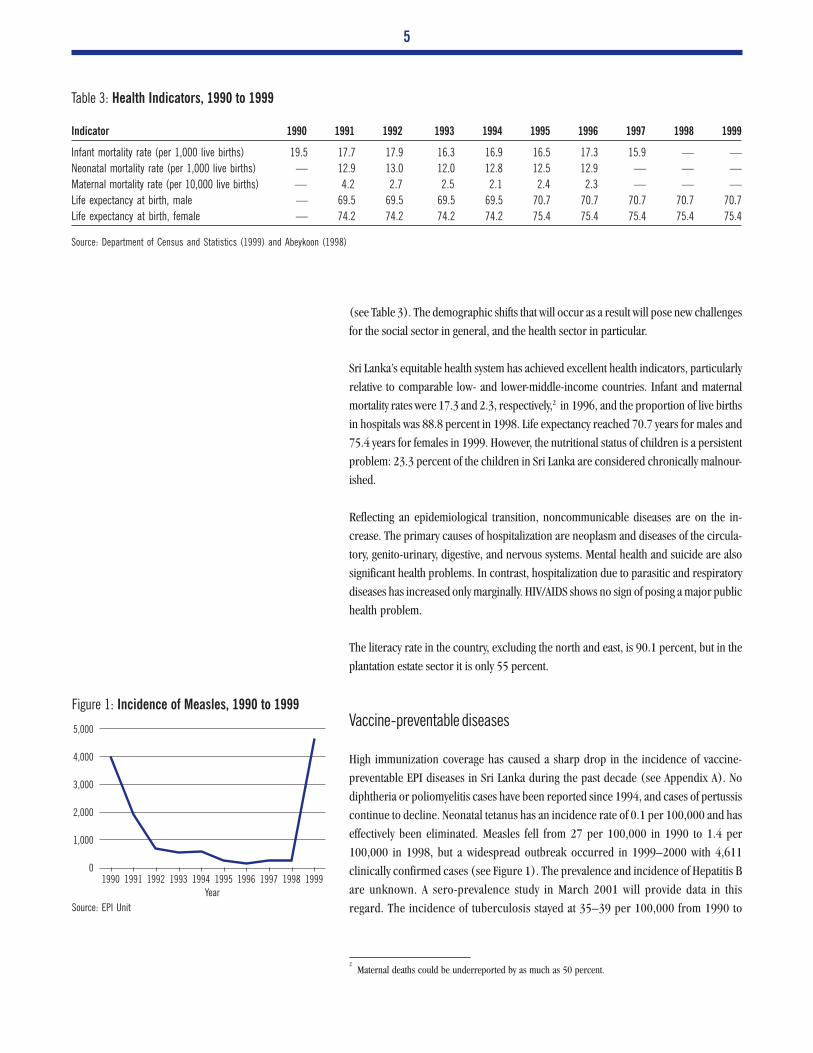
High immunization coverage has caused a sharp drop in the incidence of vaccine-
preventable EPI diseases in Sri Lanka during the past decade (see Appendix A). No
diphtheria or poliomyelitis cases have been reported since 1994, and cases of pertussis
continue to decline. Neonatal tetanus has an incidence rate of 0.1 per 100,000 and has
effectively been eliminated. Measles fell from 27 per 100,000 in 1990 to 1.4 per
100,000 in 1998, but a widespread outbreak occurred in 1999–2000 with 4,611
clinically confirmed cases (see Figure 1). The prevalence and incidence of Hepatitis B
are unknown. A sero-prevalence study in March 2001 will provide data in this
regard. The incidence of tuberculosis stayed at 35–39 per 100,000 from 1990 to
Indicator 1990 1991 1992 1993 1994 1995 1996 1997 1998 1999
Infant mortality rate (per 1,000 live births) 19.5 17.7 17.9 16.3 16.9 16.5 17.3 15.9 — —
Neonatal mortality rate (per 1,000 live births) — 12.9 13.0 12.0 12.8 12.5 12.9 — — —
Maternal mortality rate (per 10,000 live births) — 4.2 2.7 2.5 2.1 2.4 2.3 — — —
Life expectancy at birth, male — 69.5 69.5 69.5 69.5 70.7 70.7 70.7 70.7 70.7
Life expectancy at birth, female — 74.2 74.2 74.2 74.2 75.4 75.4 75.4 75.4 75.4
Table 3: Health Indicators, 1990 to 1999
Source: Department of Census and Statistics (1999) and Abeykoon (1998)
2Maternal deaths could be underreported by as much as 50 percent.
Figure 1: Incidence of Measles, 1990 to 1999
Source: EPI Unit
1990 1991 1992 1993 1994 1995 1996 1997 1998 19990
1,000
2,000
3,000
4,000
5,000
Year

6
1998 but then rose to 54 per 100,000 in 1999. The vaccination of high-risk popu-
lations has caused the incidence of Japanese encephalitis to drop, from 44 in 1996
to 3 in 1999.
Health System
The broad health goals of the Sri Lankan Government, according to the 1996 national
policy statement, are to:
• Further increase life expectancy by reducing preventable deaths due to communicable
as well as noncommunicable diseases
• Improve the quality of life by reducing preventable diseases, health problems, and
disability, and by emphasizing the positive aspects of health through health promotion
The Cabinet of Ministers, headed by the President, is ultimately responsible for national
health policy. The National Health Development Committee, under the Minister of Health,
meets monthly to recommend policies to the Cabinet based on inputs sought by the
Director General of Health Services from national, provincial, and district senior health
managers.
The current policy agenda is largely based on recommendations made in 1997 by the
Presidential Task Force for the Implementation of National Health Policy. These recom-
mendations deal primarily with health sector reform, in line with current trends in
international health. However, most of the proposals have not been welcomed by the line
ministry and public-sector unions, and implementation has therefore been slow.
In any case, it has been argued that the health system lacks the capacity to manage
organizational reform. The provinces in particular do not have the human and financial
resources and the management information systems to plan, manage, and monitor health
services. The politicization of health service management further hampers rational health
planning.
Structure and decentralization
The devolution of health services under the Provisional Council Act resulted in a Ministry
of Health (MOH) at the central level and eight separate provincial ministries of health.
Vertical programs were abolished and the role of the central agencies was largely confined
to direction setting, giving technical advice, procuring medical supplies in bulk, and
monitoring and evaluating the performance of the provincial agencies. National pro-
grams (such as that for malaria control) are implemented and supervised by central
functional units. The MOH also retained control over teaching and specialized hospitals.
The management of all other medical institutions, including primary health care facili-
ties, was transferred to provincial health authorities. Figure 2 shows the provincial health
structure as it relates to the immunization program.
Health units (offices of the Divisional Directors for Health Services and the Medical
Officers of Health) are responsible for implementing health services in the periphery.
The politicization of
health service
management further hampers
rational health planning

7
Figure 2: Organization of Provincial Health Services in Relation to Immunization Services
Provincial Minister (Health)
Provincial Secretary
Provincial Director ofHealth Services (PDHS)
Deputy Provincial Directorsof Health Services (DPDHS)
Divisional Directors ofHealth Services/Medical
Officers of Health(DDHS/MOH)
Provincial level
Regional and divisional level
Preventive Curative Service
Public HealthNursing Sister
Supervising PublicHealth Midwife
Public HealthMidwives
Medical Officer(mother and child health)
Planning andProgramming Officer
Regional Supervising PublicHealth Nursing Officer
RegionalEpidemiologist
Decentralization has almost doubled the number of these units, from 131 in 1990 to 245
in 1998. As a result, many units lack the required buildings, human resources, and
vehicles. Wide disparities in the regional distribution of personnel (caused by a reluc-
tance to move to the periphery) have worsened staff shortages in some areas.
Decentralization has also led to duplication and overlapping of responsibility, creating
considerable administrative confusion and a complex system of information flows. Weak-
nesses in local management and the politicization of services have focused central-level
time on the functions and responsibilities of the health units rather than on policy
development, planning, direction, coordination, and monitoring and evaluation.
Finance
Treasury draws up the national health budget, using estimates submitted annually by the
MOH and the Provincial Councils. Once the budget is approved by Parliament, MOH
receives its allocations directly. The provincial health budget passes through the Ministry
of Provincial Councils to the Provincial Council, which in turn allocates it to the Provin-
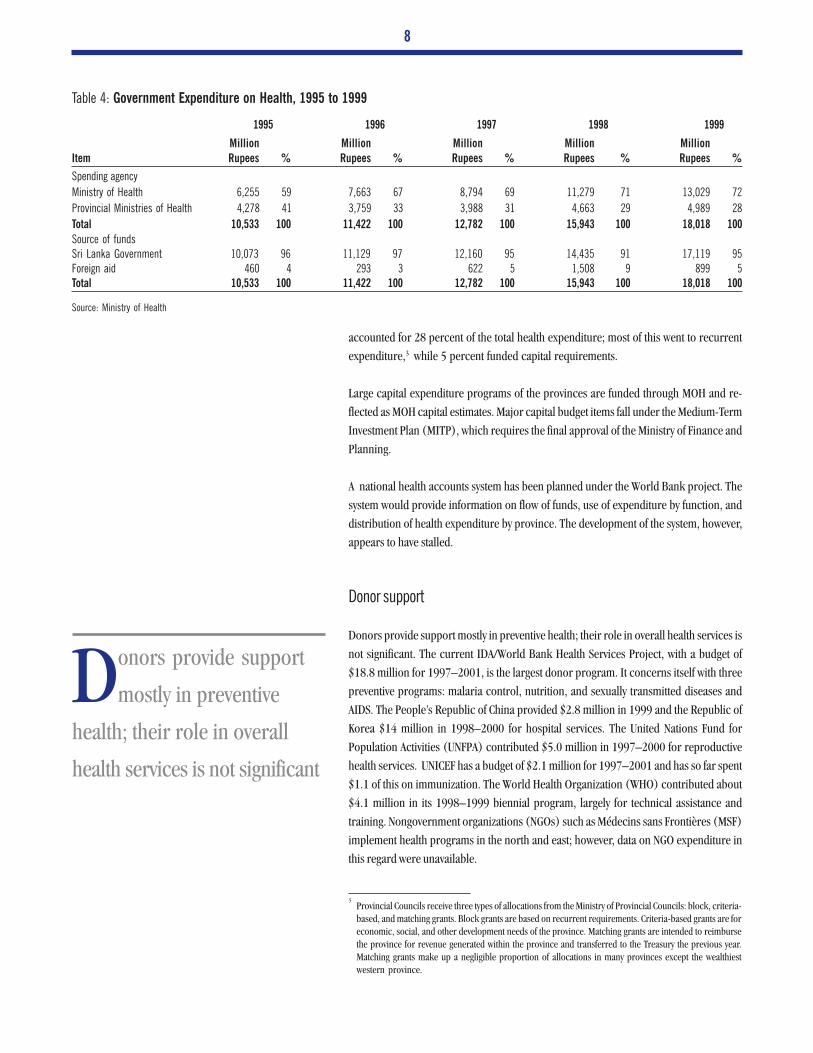
cial Ministry of Health. Health revenue and spending patterns from 1995 to 1999 are
shown in Table 4.
Provincial Councils have discretion in the use of central Government allocations and do
not have to report on their expenditure. This has resulted in weak management and
control of funding as well as minimal data on health expenditure. In 1999, the provinces
Decentralization has
also led to duplication
and overlapping of
responsibility, creating
considerable administrative
confusion and a complex
system of information flows
8
Donors provide support
mostly in preventive
health; their role in overall
health services is not significant
1995 1996 1997 1998 1999
Million Million Million Million MillionItem Rupees % Rupees % Rupees % Rupees % Rupees %
Spending agency
Ministry of Health 6,255 59 7,663 67 8,794 69 11,279 71 13,029 72
Provincial Ministries of Health 4,278 41 3,759 33 3,988 31 4,663 29 4,989 28
Total 10,533 100 11,422 100 12,782 100 15,943 100 18,018 100
Source of fundsSri Lanka Government 10,073 96 11,129 97 12,160 95 14,435 91 17,119 95Foreign aid 460 4 293 3 622 5 1,508 9 899 5Total 10,533 100 11,422 100 12,782 100 15,943 100 18,018 100
Table 4: Government Expenditure on Health, 1995 to 1999
Source: Ministry of Health
3Provincial Councils receive three types of allocations from the Ministry of Provincial Councils: block, criteria-based, and matching grants. Block grants are based on recurrent requirements. Criteria-based grants are foreconomic, social, and other development needs of the province. Matching grants are intended to reimbursethe province for revenue generated within the province and transferred to the Treasury the previous year.Matching grants make up a negligible proportion of allocations in many provinces except the wealthiestwestern province.
accounted for 28 percent of the total health expenditure; most of this went to recurrent
expenditure,3 while 5 percent funded capital requirements.
Large capital expenditure programs of the provinces are funded through MOH and re-
flected as MOH capital estimates. Major capital budget items fall under the Medium-Term
Investment Plan (MITP), which requires the final approval of the Ministry of Finance and
Planning.
A national health accounts system has been planned under the World Bank project. The
system would provide information on flow of funds, use of expenditure by function, and
distribution of health expenditure by province. The development of the system, however,
appears to have stalled.
Donor support
Donors provide support mostly in preventive health; their role in overall health services is
not significant. The current IDA/World Bank Health Services Project, with a budget of
$18.8 million for 1997–2001, is the largest donor program. It concerns itself with three
preventive programs: malaria control, nutrition, and sexually transmitted diseases and
AIDS. The People’s Republic of China provided $2.8 million in 1999 and the Republic of
Korea $14 million in 1998–2000 for hospital services. The United Nations Fund for
Population Activities (UNFPA) contributed $5.0 million in 1997–2000 for reproductive
health services. UNICEF has a budget of $2.1 million for 1997–2001 and has so far spent
$1.1 of this on immunization. The World Health Organization (WHO) contributed about
$4.1 million in its 1998–1999 biennial program, largely for technical assistance and
training. Nongovernment organizations (NGOs) such as Médecins sans Frontières (MSF)
implement health programs in the north and east; however, data on NGO expenditure in
this regard were unavailable.
CHAPTER III
National Immunization Program
No comprehensive assessment of the national immunization program has been made within
the past three years, although a cold-chain study was undertaken in 1997. In preparation for
an application to GAVI for Hepatitis B funding, arrangements are under way for a full review
of the program in 2001. WHO and UNICEF will provide technical assistance.
Strategic Plan
EPI in Sri Lanka began in 1978 and has been revised and expanded since then. The Country
Report (Epidemiological Unit 2000a) identifies the four objectives of the program:
• To reduce mortality and morbidity associated with vaccine-preventable diseases such
as tetanus, diphtheria, whooping cough, poliomyelitis, tuberculosis, measles, rubella,
and Japanese B encephalitis
• To eradicate polio by 2000
• To achieve zero incidence of neonatal tetanus
• To prevent congenital rubella syndrome
After the assessment in March 2001, a five-year strategic plan will be developed.
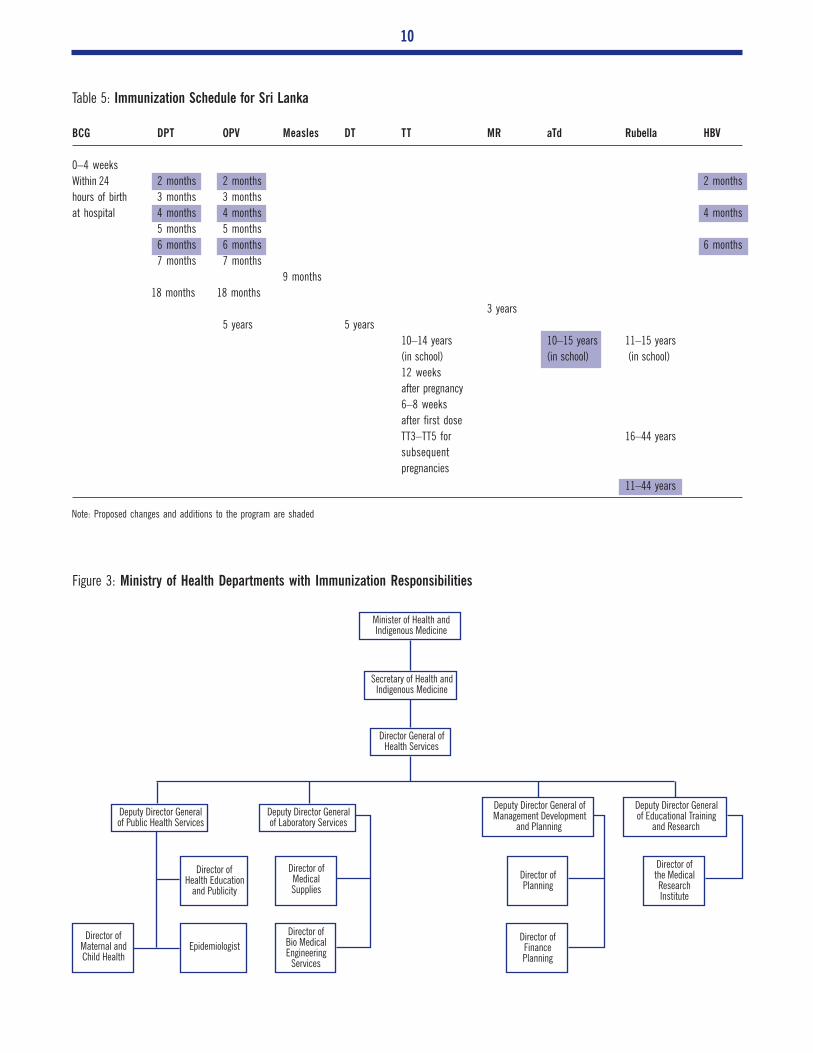
The current national immunization schedule is presented in Table 5. Changes to be
introduced in March 2001, which are highlighted, reflect the addition of routine measles
rubella vaccine (MR) for all children, adult tetanus and diphtheria vaccine (aTd) for
children between 10 and 15 years, and rubella vaccine for all females 11 to 15 years. The
schedule has also been adjusted for the potential introduction of Hepatitis B vaccine (the
timing of oral polio vaccine, or OPV, and diphtheria and tetanus toxoids and pertussis
vaccine, or DTP, vaccinations is now aligned with Hepatitis B), to reduce the program-
matic impact the introduction may have. Vaccinations are given free of charge at Govern-
ment facilities. Private service providers receive the vaccine for free from the Government
but charge a fee for the service.
Organizational Structure
National immunization services are within the purview of the Deputy Director General
of Health Services (Public Health), who is responsible for the Maternal and Child
Health (MCH) Unit and the Epidemiological (EPI) Unit. The MCH Unit assists in
program implementation by disbursing equipment, providing training, and supervis-
ing service delivery. The EPI Unit is accountable for the surveillance of EPI diseases,
vaccine management and distribution, and immunization program planning, monitor-
ing, and evaluation.
Other central MOH departments with immunization responsibilities are shown in
Figure 3.
Immunization has been an
integrated component of
the maternal and child health
(MCH) program since the start
of EPI
10
Minister of Health andIndigenous Medicine
Secretary of Health andIndigenous Medicine
Director General ofHealth Services
Deputy Director Generalof Public Health Services
Deputy Director Generalof Laboratory Services
Deputy Director General ofManagement Development
and Planning
Deputy Director Generalof Educational Training
and Research
Director ofMaternal andChild Health
Epidemiologist
Director ofHealth Education
and Publicity
Director ofMedicalSupplies
Director ofBio MedicalEngineering
Services
Director ofPlanning
Director ofFinancePlanning
Director ofthe MedicalResearchInstitute
Figure 3: Ministry of Health Departments with Immunization Responsibilities
BCG
0–4 weeks
Within 24
hours of birth
at hospital
Table 5: Immunization Schedule for Sri Lanka
DPT
2 months
3 months
4 months
5 months
6 months
7 months
18 months
OPV
2 months
3 months
4 months
5 months
6 months
7 months
18 months
5 years
Measles
9 months
DT
5 years
TT
10–14 years
(in school)
12 weeks
after pregnancy
6–8 weeks
after first dose
TT3–TT5 for
subsequent
pregnancies
MR
3 years
aTd
10–15 years
(in school)
Rubella
11–15 years
(in school)
16–44 years
11–44 years
HBV
2 months
4 months
6 months
Note: Proposed changes and additions to the program are shaded

11
At the district level (see Figure 2), Medical Officers (Maternal and Child Health), Regional
Epidemiologists, and Divisional Directors, Health Services (DDHS)/Medical Officers of
Health work together to provide immunization services. All three positions are indepen-
dent of one another but are accountable to the Deputy Provincial Director of Health
Services (DPDHS), who is responsible for a health division (corresponding to the civil
administrative district) comprising about 60,000 people.
Immunization has been an integrated component of the maternal and child health
(MCH) program since the start of EPI. As such, it is primarily done in MCH clinics staffed
by public health midwives and responsible to the DDHS. Each MCH clinic provides
services for between 2,000 and 3,000 people. All in all, immunization services are
provided at more than 5,000 facilities including hospitals, maternity homes, central
dispensaries, and outreach clinics.
Coverage
Administrative reports place the coverage of routine infant EPI vaccinations at more than
90 percent since the mid-1990s. However, such rates should be treated with caution
because:
• Internal migration (including displaced people) and the lack of recent census data
mean an unreliable denominator. In many instances coverage is reported to be more
than 100 percent.
• An increasing number of vaccinations take place in the private sector, particularly in
urban areas (up to 10 percent in Colombo). Private providers are not obliged to report
vaccination numbers.
Nonetheless, various cluster surveys in 1998 and 1999 have confirmed these high cover-
age figures and in some cases have shown full coverage for some vaccines. No surveys have
been made in conflict zones.
Financial Structure
An accurate picture of the costs involved in delivering the immunization system nation-
wide is difficult to obtain for the following reasons:
• Service delivery expenditure is managed by provincial and district health authorities,
which under the decentralized system do not have to report expenditures to the center.
Hence, expenditure data are not aggregated nationally.
• Only limited aggregation of historical data takes place at the central level. Where
information is available, it is not easily accessible and requires significant time to
retrieve and consolidate.
• Accounting reports at all levels are prepared not along functional lines but along three
general budget lines.4 Any attempt to disaggregate immunization data is further com-
plicated by the program being an integrated component of the MCH program.
• Many logistic and social mobilization costs are absorbed by NGOs (such as Médecins
sans Frontières and Rotary) and are therefore not reflected in the national accounts.5
4General administration and staff services, patient care services, and community health services.
5MSF was unable to provide data for this assessment.
Accounting reports at all
levels are prepared not
along functional lines but
along three general budget
lines. Any attempt to
disaggregate immunization
data is further complicated by
the program being an
integrated component of the
MCH program

12
The immunization program is funded principally by the Government, UNICEF, and WHO.
For special activities such as National Immunization Days (NIDs), NGO resources provide
logistic and technical support. Figure 4 illustrates the flow of funds for the immunization
program.
6Vaccines are included in a general “medical supplies” budget line.
Figure 4: Flow of Funds for the Immunization Program
Provincial Ministryof Health Ministry of Health
World HealthOrganization (WHO)
United Nations Children,s
Fund (UNICEF)Nongovernment
Organizations (NGOs)
Ministry of Finance
Provincial Director ofHealth Services
Deputy Provincial Directorof Health Services
Divisional Directorof Health Services
MedicalSupplies MCH EPI
Service Delivery Points
Service Delivery Points
Vaccines
Government sources: National level
There is no national budget line for immunization in general or vaccines in particular.6
However, at the start of each financial year, Treasury allocates funds to:
• MOH for:
– The administrative costs of the EPI and MCH Units
– The cost of all vaccines (funds are provided directly to the Department of Medical
Supplies, which manages procurement)
– Hospitals that are directly managed by the MOH and that provide immunization
services
– The Medical Research Institute, which is the national control laboratory
– All capital requirements for the program, although these costs are currently met
(where possible) by donor agencies
• Provincial Councils and Provincial Ministries of Health, for program implementation
Government sources: Provincial level
Most provinces have very limited local revenue sources (local taxes and license fees).
Nonetheless, when no central support is available, provinces will use these funds to
purchase immunization equipment, such as refrigerators, that are considered priorities.
The immunization program
is funded principally by
the Government, UNICEF, and
WHO. For special activities
such as National Immunization
Days (NIDs), NGO resources
provide logistic and technical
support
13
Item Central Provincial Government UNICEF WHO NGOs Total % of Total
Operating cost
Vaccines
BCG 118,286 118,286
DPT 90,714 90,714
DT 27,064 27,064
OPV 266,786 266,786
Measles 78,257 78,257
TT 9,514 9,514
RU 252,500 252,500
Subtotal 843,121 843,121 45.9
Supplies
Syringes/needles 81,050 81,050 4.4
Other 10,850 10,850 0.6
Subtotal 91,900 91,900 5.0
Personnel 111,003 111,003 6.0
NIDs 697 2,400 3,097 0.2
Other 94,272 44,626 21,037 7,287 167,222 9.1
General 232,022 232,022 12.6
Capital cost
Cold chain 3,260 38,815 42,075 2.3
Sterilization equipment 253,684 253,684 13.8
Subtotal 3,260 292,499 295,759 16.1
Total 1,051,656 232,022 429,722 21,037 9,687 1,744,124
% 60.3 13.3 24.6 1.2 0.6
Table 6: Expenditures for the Routine Immunization Program, 1999 (US$)
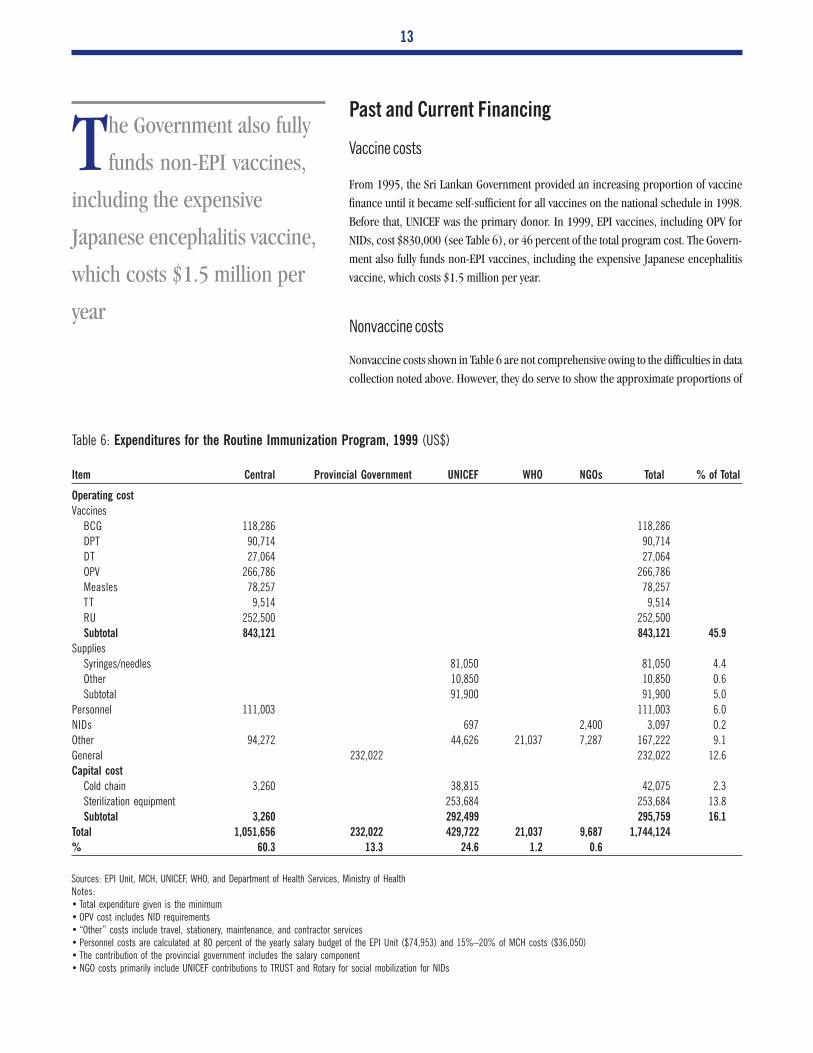
Sources: EPI Unit, MCH, UNICEF, WHO, and Department of Health Services, Ministry of HealthNotes:• Total expenditure given is the minimum• OPV cost includes NID requirements• “Other” costs include travel, stationery, maintenance, and contractor services• Personnel costs are calculated at 80 percent of the yearly salary budget of the EPI Unit ($74,953) and 15%–20% of MCH costs ($36,050)• The contribution of the provincial government includes the salary component• NGO costs primarily include UNICEF contributions to TRUST and Rotary for social mobilization for NIDs
Past and Current Financing
Vaccine costs
From 1995, the Sri Lankan Government provided an increasing proportion of vaccine
finance until it became self-sufficient for all vaccines on the national schedule in 1998.
Before that, UNICEF was the primary donor. In 1999, EPI vaccines, including OPV for
NIDs, cost $830,000 (see Table 6), or 46 percent of the total program cost. The Govern-
ment also fully funds non-EPI vaccines, including the expensive Japanese encephalitis
vaccine, which costs $1.5 million per year.
Nonvaccine costs
Nonvaccine costs shown in Table 6 are not comprehensive owing to the difficulties in data
collection noted above. However, they do serve to show the approximate proportions of
The Government also fully
funds non-EPI vaccines,
including the expensive
Japanese encephalitis vaccine,
which costs $1.5 million per
year
14
the main expenditure areas. Capital costs make up 16 percent of the total, largely on
account of the significant investment in injection equipment, which may influence future
injection safety strategies (see “Safety of Injections” below). The central-level personnel
budget shown in the table is an estimate; it includes the salaries of staff in the EPI and
MCH units as well as provincial salaries, and composes about 14 percent of the total
expenditure.
Social mobilization costs and the total cost of NIDs (personnel, transport, and social
mobilization) are not shown for lack of data. Likewise (and importantly), provincial
government contributions for the procurement and maintenance of cold-chain equip-
ment could not be ascertained.
Overall
Funds for the immunization program come mainly from the Government, which contrib-
uted 74 percent, 60 percent from the central level, in 1999. UNICEF contributed 25
percent of the overall total in 1999 and is clearly the primary donor, although there are no
data on the full cost of NGO contributions. UNICEF has supported the immunization
program since its start and has formed a strong and reliable relationship with MOH
officials. For its 1997–2001 program UNICEF has allocated $1.2 million, of which it has
so far spent about $1.1 million. It provides equipment, supplies, and technical assistance
directly to MCH in response to requests from the Director. WHO contributed $74,000 in
its 1998–1999 biennial program, largely for technical assistance through workshops and
consulting services.
UNICEF has supported the
immunization program
since its start and has formed
a strong and reliable
relationship with MOH officials
CHAPTER IV
Future Financing
Key Issues
The immunization program of Sri Lanka has an excellent record, with low levels of EPI
disease and high coverage. However, the advantages gained in disease control over the last
20 years could be lost unless attention is paid to key issues of program quality. Gains can
be consolidated and the program successfully expanded if improvements are made in the
cold chain and in service quality. The future costs and financing aspects of these areas are
discussed below but should be considered only indicative. The comprehensive review in
March 2001 may highlight other areas of concern and should provide more detail on
issues requiring financial support. Policy and financing options are discussed in the next
main section. Detailed cost estimates are provided in Appendix B.
Vaccine supply: Sustainability, quality assurance, and price
Vaccine self-sufficiency is a key element in the sustainability of any immunization program.
A country is self-sufficient in vaccines if it purchases or produces all of the routine EPI
vaccines that it needs. A critical component of self-sufficiency is good-quality vaccines.
Although there is no separate national budget line for vaccines, the Sri Lankan Govern-
ment has demonstrated its strong commitment to the immunization program by provid-
ing full funding for the national immunization schedule since 1998. The introduction of
MR and aTd vaccines (both relatively expensive) in March 2001 has been approved by the
Treasury. In addition, the Government provides funding for the costly Japanese B en-
cephalitis (JE)7 vaccine ($1.5 million per year). Discussions with Government officials
confirmed the high priority placed on the immunization program by all the relevant
departments. With no record of dispute over price, quantity, or need, the Government’s
commitment appears firm. Cost-effective purchasing strategies will help sustain this sup-
port.
Vaccines are procured by the State Pharmaceutical Committee directly from WHO-
prequalified manufacturers through open bidding. Prices in 1999 were competitive, and
in some cases lower than UNICEF contract prices.
Quality assurance
Vaccines, being biological, are fundamentally different from drugs and require special-
ized procurement knowledge and skills. Vaccine imports must be managed by a national
regulatory authority established by appropriate laws. Such an authority, as recommended
by WHO, should be independent and competent and should at least carry out the critical
7JE is not part of the EPI schedule but is provided to high-risk target populations.
A lthough there is no
separate national budget
line for vaccines, the
Sri Lankan Government has
demonstrated its strong
commitment to the
immunization program by
providing full funding for the
national immunization
schedule since 1998
16
control functions of licensing, surveillance of the safety and efficacy of vaccines in the
field, and lot release.8 The authority must also have access to adequate laboratory services
for routine lot testing or for testing on demand when there are concerns about shipments,
breakdowns in the cold chain, or adverse reactions following vaccination.
The drug regulatory law in Sri Lanka is the Cosmetics Devices and Drugs Act (1980). The
Drugs Regulatory Authority (DRA) is responsible for licensing, and the MOH undertakes
surveillance in coordination with the DRA and the Medical Research Institute (MRI).
MRI operates as the national control laboratory, fulfilling the laboratory access function,
and from 2000 has been responsible for lot release. All these bodies are answerable to the
Cosmetics, Devices, and Drugs Technical Advisory Committee, which was set up to advise
the Minister of Health on drug policy.
An assessment of the vaccine regulatory system by WHO in November 2000 found weak
reporting from the private sector on adverse effects following immunization (AEFI). A
training workshop was recommended to address this deficiency. The assessment also
disclosed the need to strengthen the lot release and laboratory access functions of MRI,
primarily through the training of national staff.
Opinions vary as to the value of lot testing. Some argue that it contributes to quality control
and can therefore reduce dependence on prequalified manufacturers. As prequalified
manufacturers are usually more expensive, purchasing from nonprequalified sources
would lower costs. The degree of savings would depend on the vaccine or antigen but is
likely to be higher in cases where a program seeks to expand beyond the basic EPI
vaccines to introduce newer (more expensive) vaccines. Some non-EPI vaccines have few,
if any, WHO-prequalified suppliers (there are none for JE, for example); more stringent
quality assurance in the importing country is therefore required. MRI has indicated that
its infrastructure for routine lot testing is sufficient but that it requires investment in
equipment and continuing support for supplies.
WHO argues that testing only confirms consistency and identity, and does not assure
quality. Vaccines procured from prequalified suppliers do not need to be routinely
retested on arrival. WHO further maintains that procurement from nonprequalified manu-
facturers may save on cost but is very risky, as experience has shown. For example, testing
cannot predict poor presentation or AEFI. The WHO assessment recommends continued
vaccine procurement through prequalified suppliers.
Costs and financing
EPI vaccine requirements will cost about $1.2 million in 2001, according to the orders
already placed by the EPI Unit. The introduction of MR and aTd vaccines will add almost
$550,000, or 76 percent, to the total. For 2002–2005, needs are forecast using target
population and actual wastage rates instead of historical data (as used by the EPI Unit; see
“Vaccine Management and the Cold Chain”), but not stock levels. For the next five years
8Lot release is a regulatory activity in both manufacturing and purchasing countries. It involves checking eachlot of vaccine to determine or confirm its compliance with the country’s regulations. In purchasing countriesthis is done before distribution. Vaccine quality is subject to lot-by-lot variations.
For sustainability reasons,
it would be remiss of
immunization partners to
suggest providing support for
the purchase of vaccines

17
the total cost will be about $5.9 million, as shown in Table 7. It is assumed that the
Government will meet all costs. For sustainability reasons, it would be remiss of immuni-
zation partners to suggest providing support for the purchase of vaccines.
Laboratory services and surveillance
Strengthening the laboratory access function of MRI will require $3,500 and undertaking
a workshop on AEFI reporting will require $20,000, according to WHO estimates. Sources
for these costs have not been identified.
If Sri Lanka chooses to introduce lot testing, using cost estimates provided by MRI (Table
8), it will need $64,000 in capital expenditure to establish capacity for testing of DPT,
OPV, measles, and TT. An additional $20,000 over five years will be required to cover
operating costs. No source of funds has been identified. The extent of cost savings
possible through the use of nonprequalified suppliers would require more investigation.
Item 2001 2002 2003 2004 2005 Total
BCG 107,692 103,729 101,655 99,622 97,629 510,327
DPT 121,795 104,533 102,443 100,394 98,386 527,551
OPV 230,769 261,333 256,107 250,985 245,965 1,245,159
Measles 96,154 100,513 98,503 96,533 94,602 486,304
Subtotal 558,411 572,111 560,710 549,536 538,587 2,769,340
DT 38,462 64,228 62,943 61,684 60,451 287,767
TT 23,077 72,584 71,133 69,710 68,316 304,820
Rubella 76,923 44,722 43,827 42,951 42,092 250,515
MR 538,462 512,615 401,890 393,853 385,976 2,079,011
aTd 15,385 16,057 15,736 15,421 15,113 77,711
Total 1,250,719 1,282,317 1,156,239 1,133,155 1,110,533 5,932,964
Table 7: Projected EPI Vaccine Costs, 2001–2005 (US$)
Note: Population data projections are based on information provided by the EPI Unit and informationpublished in Population Information Center (1998). All vaccine prices are based on estimates provided bythe EPI Unit (OPV=$0.13, DPT=$0.06, BCG=$0.08, measles=$0.13, rubella=$0.15, BCG=$0.08,TT=$0.05, Dt=$0.08, MR=$0.77, aTd=$0.08). Prices were provided in Sri Lankan rupees and convertedusing the current (October 2000) exchange rate of 78 rupees:US$1. Actual wastage factors of OPV=1.3,DPT=1.3, BCG=4.3, and measles=2.5 are used. Projected wastage rates of 2.0 are used for MR and aTd.MR needs are based on 70% coverage for the first two years, and 80% after that. aTd has a 30% coveragetarget. All other vaccines assume 100% coverage. Although actual prices for 1999 where provided by boththe EPI Unit and the Department of Medical Supplies (DMS) (responsible for procurement), there were largediscrepancies. In theory, DMS prices include customs and handling costs, and should therefore be 10%–15% higher than EPI Unit prices, which are the same as the purchase prices. However, the differences werenot uniform either in direction or in proportion. The most notable was the price of OPV (EPI Unit=$0.16,DMS=$0.06, UNICEF contract price=$0.085).
Total
Item Year 1 Years 2–5 Rupees US$
Capital expenditure 5,000,000 5,000,000 64,103
Operating cost 332,800 1,664,000 1,996,800 21,333
Total 6,996,800 85,436
Table 8: Laboratory Quality Assurance Service Needs over Five Years
Source: MRI
MRI has indicated that its
infrastructure for
routine lot testing is sufficient
but that it requires investment
in equipment and continuing
support for supplies
18
Vaccine management and the cold chain
Good vaccine management decreases cost and risk, and increases the sustainability of a
national program. Apart from tight stock control, it requires a well-functioning cold
chain, including suitable central and regional storage facilities and a distribution system
with adequate transport capacity.
Wastage rates
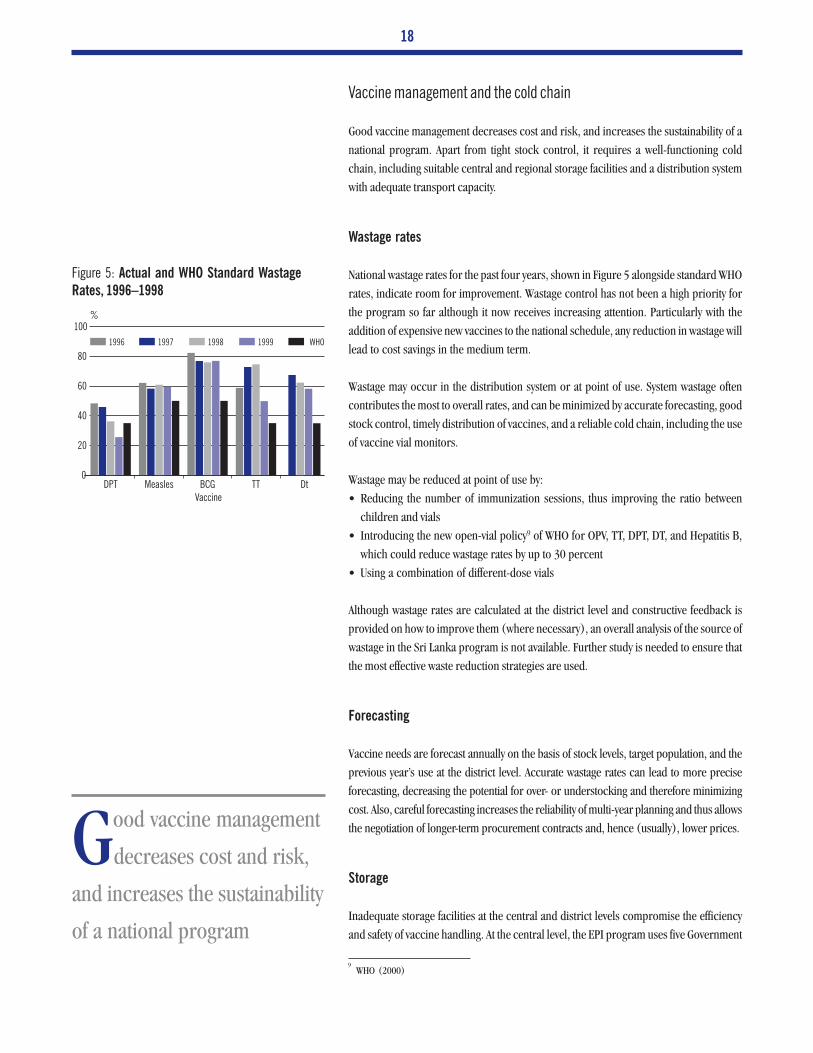
National wastage rates for the past four years, shown in Figure 5 alongside standard WHO
rates, indicate room for improvement. Wastage control has not been a high priority for
the program so far although it now receives increasing attention. Particularly with the
addition of expensive new vaccines to the national schedule, any reduction in wastage will
lead to cost savings in the medium term.
Wastage may occur in the distribution system or at point of use. System wastage often
contributes the most to overall rates, and can be minimized by accurate forecasting, good
stock control, timely distribution of vaccines, and a reliable cold chain, including the use
of vaccine vial monitors.
Wastage may be reduced at point of use by:
• Reducing the number of immunization sessions, thus improving the ratio between
children and vials
• Introducing the new open-vial policy9 of WHO for OPV, TT, DPT, DT, and Hepatitis B,
which could reduce wastage rates by up to 30 percent
• Using a combination of different-dose vials
Although wastage rates are calculated at the district level and constructive feedback is
provided on how to improve them (where necessary), an overall analysis of the source of
wastage in the Sri Lanka program is not available. Further study is needed to ensure that
the most effective waste reduction strategies are used.
Forecasting
Vaccine needs are forecast annually on the basis of stock levels, target population, and the
previous year’s use at the district level. Accurate wastage rates can lead to more precise
forecasting, decreasing the potential for over- or understocking and therefore minimizing
cost. Also, careful forecasting increases the reliability of multi-year planning and thus allows
the negotiation of longer-term procurement contracts and, hence (usually), lower prices.
Storage
Inadequate storage facilities at the central and district levels compromise the efficiency
and safety of vaccine handling. At the central level, the EPI program uses five Government
9WHO (2000)
Figure 5: Actual and WHO Standard Wastage
Rates, 1996–1998
DPT Measles BCG TT Dt0
20
40
60
80
100%
Vaccine
WHO1999199819971996
Good vaccine management
decreases cost and risk,
and increases the sustainability
of a national program

19
cold-room facilities, which are 15–30 years old and are located in three different places
(EPI Unit, Family Health Bureau, and Colombo General Hospital). The facilities are not
always accessible. If the storage requirements exceed cold-room capacity or one of the
cold rooms breaks down, space in another storeroom is leased from a private supplier. At
the regional level, vaccines are stored in individual refrigerators and freezers, usually of
domestic design and mostly 10–15 years old. At both central and regional levels, frequent
breakdowns, limited supply of spare parts, and constant electricity fluctuations and
shortages contribute to logistic (and financial) inefficiencies, which risk compromising
the quality of the cold chain.
Three previous EPI reviews (1981, 1986, and 1989) recommended the construction of
a single cold-room complex in Colombo. Building started in 1986 but has been signifi-
cantly delayed by bureaucratic complications and funding constraints. Although the
World Bank provided some financial support in 1993, the complex is still only partially
complete.
Transport
Poor transport conditions or delays in distribution can jeopardize the potency of vac-
cines. Timely access to dependable vehicles is essential, particularly in cases of outbreaks
or cold-chain breakdowns. Standard delivery vans and lorries are currently being used to
distribute vaccines at the central and regional levels. These vehicles are old (more than 10
years) and unreliable, and regional centers must often resort to borrowing vehicles to
distribute vaccines on time.
In addition, anecdotal evidence points strongly and consistently to the need for improved
transport capacity at the periphery and within the estate sector, particularly where mobile
clinics operate. A comprehensive assessment is required to determine the demand for
and the cost of providing appropriate vehicles at the lower levels of the distribution
system.
Equipment
In 1997, a WHO consultant assessed the cold chain and determined it to be well function-
ing but “fragile,” a situation that continues to this day. Primary concerns include:
• Aging and nonfunctioning cold-chain equipment, with no overall plan for upgrading
equipment, including transfer to CFC refrigeration (about 10 percent of refrigerators
are CFC-free). UNICEF supplied most of the equipment in 1985.
• No systematic monitoring of cold-chain equipment and no national inventory.
• Common, if risky, reliance on private service maintenance for refrigerators and freez-
ers. These services can be irregular and expensive, and may not be available in all areas.
Central accountability for various aspects of the cold chain is fragmented. The EPI Unit is
responsible for the proper storage of vaccines, including technical support, and for cold-
chain training and monitoring. However, MCH as the implementing agency is responsible
for the procurement and distribution of national program equipment. In practice, MCH
A t both central and
regional levels, frequent
breakdowns, limited supply of
spare parts, and constant
electricity fluctuations and
shortages contribute to logistic
(and financial) inefficiencies,
which risk compromising the
quality of the cold chain
20
does not have funds for cold-chain equipment; instead, it acts as the conduit through
which provinces can gain access to the resources of UNICEF, which supplies 95 percent of
equipment requests. If funds are available, provincial governments will purchase urgently
needed cold-chain equipment. With no specific budget for EPI cold-chain equipment,
and no single central body with overall responsibility for cold-chain quality or the status
of equipment, little attention has been given to:
• Establishing a national inventory or monitoring system
• Undertaking a comprehensive assessment of needs
• Developing a national strategy for upgrading equipment
As a result, any projections of needs are broad estimates at best. The EPI Unit has begun
to take on a more comprehensive management role, preparing funding proposals for
upgrading the cold chain and requesting baseline information on all cold-chain equip-
ment from MOH units. The cold-chain assessment in March 2001 is expected to provide
a more accurate analysis of needs.
The extra cold-chain equipment reserved for polio Subnational Immunization Days
(SNIDs) is a valuable resource. The possibility of using it should be taken into account
when forecasting needs.
Maintenance
Good-quality and timely maintenance of cold-chain equipment reduces costs. However,
this is largely carried out by private-sector contractors, who are often unreliable as well as
expensive. A viable alternative would be to build the internal capacity of cold-chain
officers at the regional level, allowing systematic preventive maintenance and timely
repairs to take place. The EPI Unit coordinated a one-time training program in 2000 to
initiate this, and plans to undertake a more comprehensive program in 2001. Regular
training and updates should be built into the immunization program.
Costs and financing
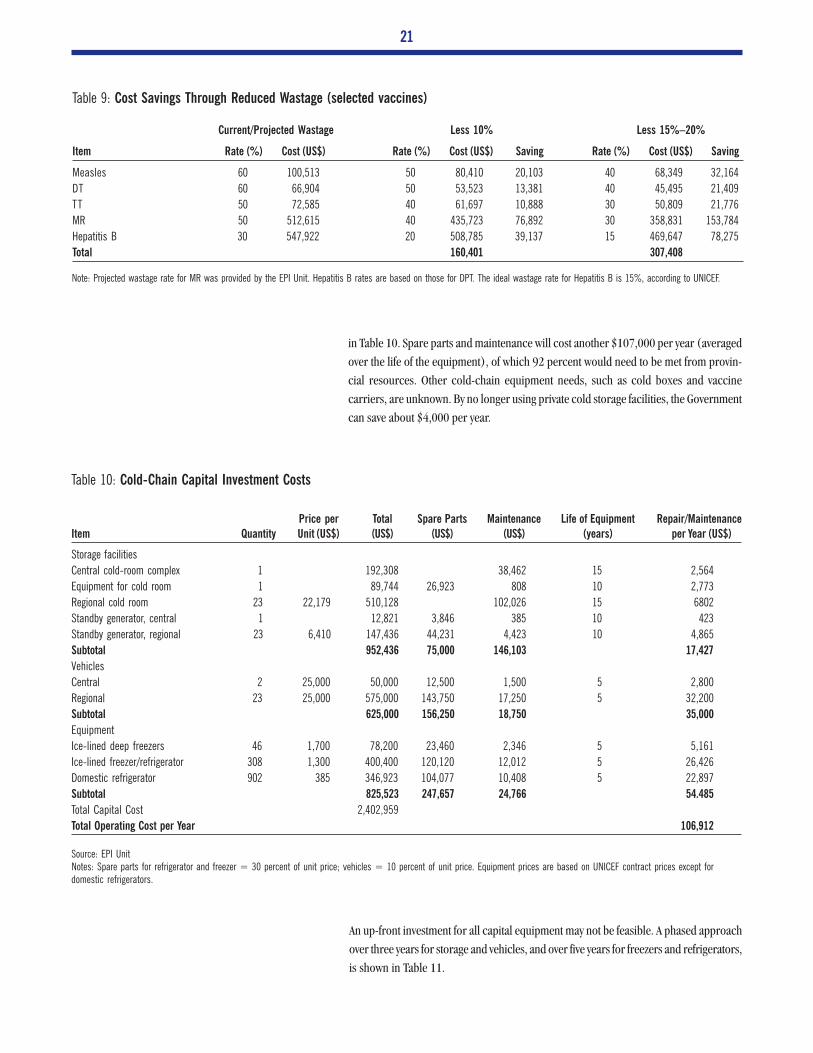
As shown in Table 9, significant savings can be generated by reducing wastage. Consider-
ing the needs for 2002, assuming full coverage of the target population, and using
vaccines where the wastage rate is now relatively high,10 expenditure can be reduced by up
to $300,000 per year. MR accounts for the largest proportion (50 percent) of this cost
savings.
Vaccine inventory control is currently undertaken manually. A computerized system (costing
about $5,000, according to the EPI Unit) would improve management capacity as well as
forecasting, and wastage and quality control.
Capital investment, including the construction of cold stores, the purchase of vehicles,
and the complete upgrading of refrigerators, will amount to about $2.4 million, as shown
10In practice, Hepatitis B and MR will be phased in.
Good-quality and timely
maintenance of cold-
chain equipment reduces
costs. However, this is largely
carried out by private-sector
contractors, who are often
unreliable as well as expensive
21
Current/Projected Wastage Less 10% Less 15%–20%
Item Rate (%) Cost (US$) Rate (%) Cost (US$) Saving Rate (%) Cost (US$) Saving
Measles 60 100,513 50 80,410 20,103 40 68,349 32,164
DT 60 66,904 50 53,523 13,381 40 45,495 21,409
TT 50 72,585 40 61,697 10,888 30 50,809 21,776
MR 50 512,615 40 435,723 76,892 30 358,831 153,784
Hepatitis B 30 547,922 20 508,785 39,137 15 469,647 78,275
Total 160,401 307,408
Table 9: Cost Savings Through Reduced Wastage (selected vaccines)
Note: Projected wastage rate for MR was provided by the EPI Unit. Hepatitis B rates are based on those for DPT. The ideal wastage rate for Hepatitis B is 15%, according to UNICEF.
Price per Total Spare Parts Maintenance Life of Equipment Repair/MaintenanceItem Quantity Unit (US$) (US$) (US$) (US$) (years) per Year (US$)
Storage facilities
Central cold-room complex 1 192,308 38,462 15 2,564
Equipment for cold room 1 89,744 26,923 808 10 2,773
Regional cold room 23 22,179 510,128 102,026 15 6802
Standby generator, central 1 12,821 3,846 385 10 423
Standby generator, regional 23 6,410 147,436 44,231 4,423 10 4,865
Subtotal 952,436 75,000 146,103 17,427
Vehicles
Central 2 25,000 50,000 12,500 1,500 5 2,800
Regional 23 25,000 575,000 143,750 17,250 5 32,200
Subtotal 625,000 156,250 18,750 35,000
Equipment
Ice-lined deep freezers 46 1,700 78,200 23,460 2,346 5 5,161
Ice-lined freezer/refrigerator 308 1,300 400,400 120,120 12,012 5 26,426
Domestic refrigerator 902 385 346,923 104,077 10,408 5 22,897
Subtotal 825,523 247,657 24,766 54.485
Total Capital Cost 2,402,959
Total Operating Cost per Year 106,912
Table 10: Cold-Chain Capital Investment Costs
Source: EPI UnitNotes: Spare parts for refrigerator and freezer = 30 percent of unit price; vehicles = 10 percent of unit price. Equipment prices are based on UNICEF contract prices except fordomestic refrigerators.
in Table 10. Spare parts and maintenance will cost another $107,000 per year (averaged
over the life of the equipment), of which 92 percent would need to be met from provin-
cial resources. Other cold-chain equipment needs, such as cold boxes and vaccine
carriers, are unknown. By no longer using private cold storage facilities, the Government
can save about $4,000 per year.
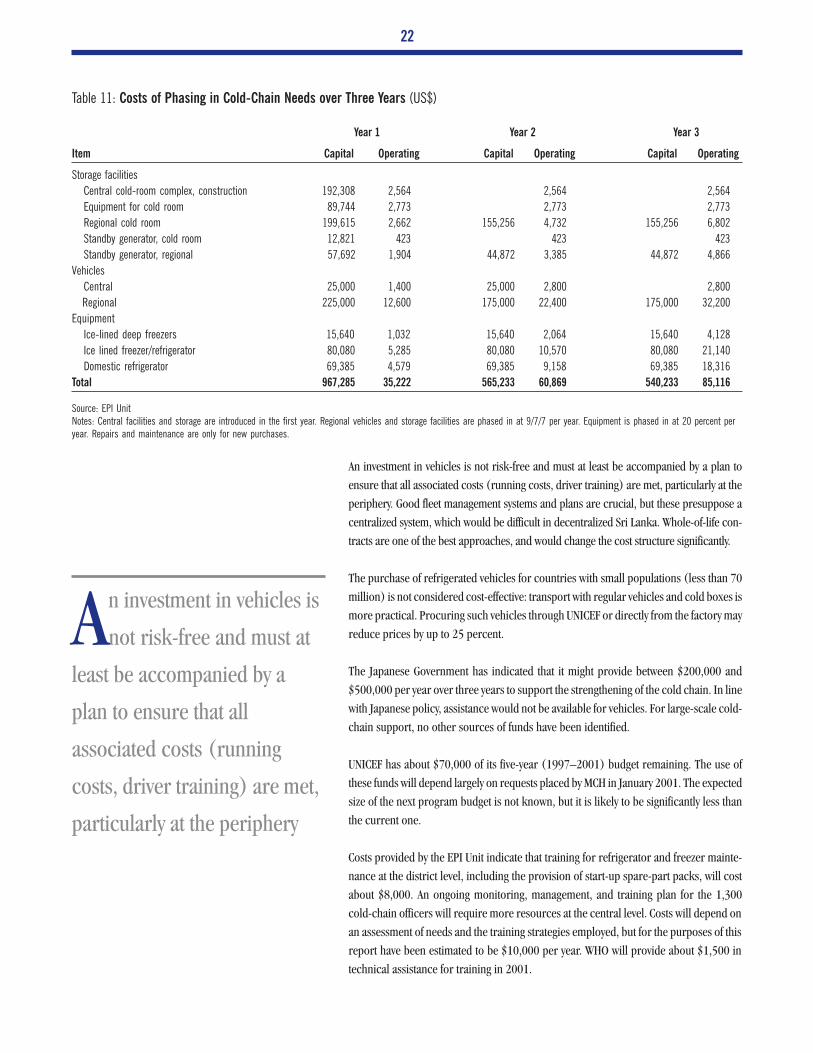
An up-front investment for all capital equipment may not be feasible. A phased approach
over three years for storage and vehicles, and over five years for freezers and refrigerators,
is shown in Table 11.
22
Year 1 Year 2 Year 3
Item Capital Operating Capital Operating Capital Operating
Storage facilities
Central cold-room complex, construction 192,308 2,564 2,564 2,564
Equipment for cold room 89,744 2,773 2,773 2,773
Regional cold room 199,615 2,662 155,256 4,732 155,256 6,802
Standby generator, cold room 12,821 423 423 423
Standby generator, regional 57,692 1,904 44,872 3,385 44,872 4,866
Vehicles
Central 25,000 1,400 25,000 2,800 2,800
Regional 225,000 12,600 175,000 22,400 175,000 32,200
Equipment
Ice-lined deep freezers 15,640 1,032 15,640 2,064 15,640 4,128
Ice lined freezer/refrigerator 80,080 5,285 80,080 10,570 80,080 21,140
Domestic refrigerator 69,385 4,579 69,385 9,158 69,385 18,316
Total 967,285 35,222 565,233 60,869 540,233 85,116
Table 11: Costs of Phasing in Cold-Chain Needs over Three Years (US$)
Source: EPI UnitNotes: Central facilities and storage are introduced in the first year. Regional vehicles and storage facilities are phased in at 9/7/7 per year. Equipment is phased in at 20 percent peryear. Repairs and maintenance are only for new purchases.
An investment in vehicles is not risk-free and must at least be accompanied by a plan to
ensure that all associated costs (running costs, driver training) are met, particularly at the
periphery. Good fleet management systems and plans are crucial, but these presuppose a
centralized system, which would be difficult in decentralized Sri Lanka. Whole-of-life con-
tracts are one of the best approaches, and would change the cost structure significantly.
The purchase of refrigerated vehicles for countries with small populations (less than 70
million) is not considered cost-effective: transport with regular vehicles and cold boxes is
more practical. Procuring such vehicles through UNICEF or directly from the factory may
reduce prices by up to 25 percent.
The Japanese Government has indicated that it might provide between $200,000 and
$500,000 per year over three years to support the strengthening of the cold chain. In line
with Japanese policy, assistance would not be available for vehicles. For large-scale cold-
chain support, no other sources of funds have been identified.
UNICEF has about $70,000 of its five-year (1997–2001) budget remaining. The use of
these funds will depend largely on requests placed by MCH in January 2001. The expected
size of the next program budget is not known, but it is likely to be significantly less than
the current one.
Costs provided by the EPI Unit indicate that training for refrigerator and freezer mainte-
nance at the district level, including the provision of start-up spare-part packs, will cost
about $8,000. An ongoing monitoring, management, and training plan for the 1,300
cold-chain officers will require more resources at the central level. Costs will depend on
an assessment of needs and the training strategies employed, but for the purposes of this
report have been estimated to be $10,000 per year. WHO will provide about $1,500 in
technical assistance for training in 2001.
An investment in vehicles is
not risk-free and must at
least be accompanied by a
plan to ensure that all
associated costs (running
costs, driver training) are met,
particularly at the periphery
23
Quality and community commitment
Quantitative EPI indicators in Sri Lanka are very good. To sustain these, program
credibility, particularly at the periphery, must be maintained. Any decrease in quality
may:
• Lessen the efficacy of vaccines, compromising disease control
• Lead to an increase in AEFI, damaging public confidence in the program
• Cause users to seek more convenient and comfortable services in the private sector,
which is unregulated and does not usually provide reporting or surveillance data to the
national program
Decreasing experience of vaccine-preventable diseases in the community may also
lessen service use. Service quality and social mobilization efforts must therefore be
maintained.
Supervision
All discussions with health officials showed them to be concerned about the deteriorating
levels of knowledge and skills among immunization providers and managers. The reasons
for this deterioration may include:
• Decentralization, which has caused the number of health units to almost double,
creating shortages of staff, including supervisors; at the same time, financial and
human resource capacity at the central level has remained relatively stable, limiting the
provision of technical support and supervision to the periphery
• A wide disparity in the regional distribution of health personnel, leaving some
districts without adequate supervisory personnel and the capacity to provide on-the-
job training
• The limited number of vehicles, inhibiting supervisory access to immunization clinics
• A lack of reference materials on immunization for peripheral workers
• Competing health priorities within the MCH program
The extent to which quality has deteriorated has not been determined. An assessment of
quality aspects will be undertaken with WHO assistance in 2002 and the results should
guide planning for improvement. It is likely that improved supervision, access to vehicles,
and on-the-job competency-based training for vaccinators (public health midwives) will
be recommended.
Environment
The quality of the environment for immunization has begun to influence the use of
services. Many clinic buildings are in disrepair and may lack electricity, water, heating, or
toilets. Because of the integrated nature of primary health care, the costs of upgrading
infrastructure are not linked directly to immunization. Moreover, many clinics are held in
public buildings (e.g., temples, community centers) that do not belong to the provincial
government. Where clinic settings are inferior, parents may choose to reject services or
seek vaccinations in the (unregulated) private sector if they can afford it.
A ll discussions with health
officials showed them to
be concerned about the
deteriorating levels of
knowledge and skills among
immunization providers and
managers

24
Costs and financing
The cost of providing extra vehicles for supervision is just over $464,000, as shown in
Table 12, but this figure only reflects central and regional needs. Table 13 shows the cost
per year, if purchases were phased in over three years. Requirements for supervisory
access at the lower levels or for outreach work are not known but need to be determined
and included in future funding considerations. It is at the lower levels were access is most
critical. There is no identified source of funds for this investment.
Price per Total Spare Parts Maintenance Life of Equipment Repair/Maintenance
Item Quantity Unit (US$) (US$) (US$) (US$) (years) per Year (US$)
Central 2 25,000 50,000 12,500 1,500 5 300
Regional 23 18,000 414,000 103,500 12,420 5 23,284
Total 464,000 115,500 13,920 23,584
Table 12: Cost of Supervising Vehicles for Central and District Levels
Sources: EPI Unit estimates and private market sources
Year 1 Year 2 Year 3
Item Capital Operating Capital Operating Capital Operating
Central 25,000 1,400 25,000 2,800 — 2,800
Regional 162,000 9,072 126,000 16,128 126,000 25,200
Total 187,000 10,472 151,000 18,928 126,000 28,000
Table 13: Cost of Supervising Vehicles, Using Phased Approach (US$)
Sources: EPI Unit estimates and private market sources
A response to increased training and supervision will require both up-front capital invest-
ment and long-term financial support for human resource development. A comprehen-
sive and ongoing training program will demand extra human and financial resources at
the central and district levels, and will require policy support. These projections assume
that training will cost at least $20,000 per year.
WHO plans to provide resources for training in cold-chain maintenance, vaccine logistics,
safe injections practices, and AEFI surveillance (a total of $3,500), and for a survey of
immunization coverage and qualitative aspects of the program ($1,500).
Estimating the costs of upgrading infrastructure is beyond the scope of this report.
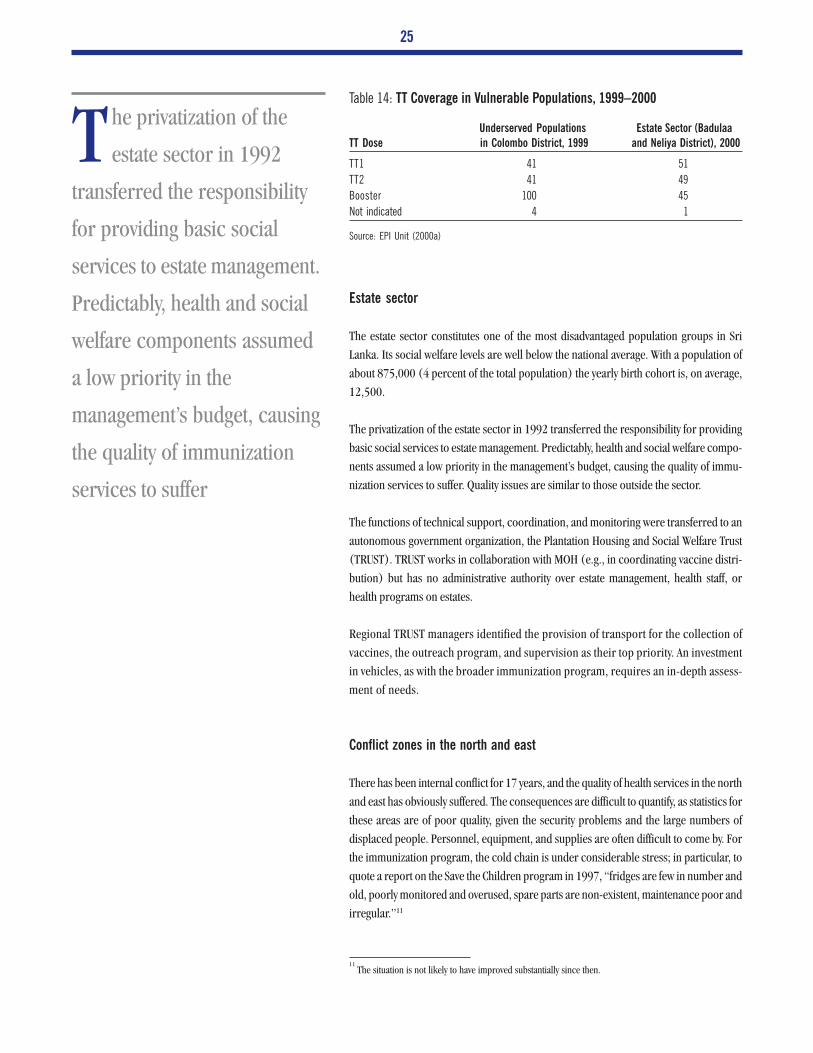
Equitable access
People living in the north and east (conflict zones), the plantation estate sector, and
urban Colombo have limited access to good-quality health services. Table 14 shows low
immunization (TT) coverage rates in two of these areas. Any investment in the immuniza-
tion program must ensure that these populations are equitably served.
A response to increased
training and supervision
will require both up-front
capital investment and long-
term financial support for
human resource development
25
Estate sector
The estate sector constitutes one of the most disadvantaged population groups in Sri
Lanka. Its social welfare levels are well below the national average. With a population of
about 875,000 (4 percent of the total population) the yearly birth cohort is, on average,
12,500.
The privatization of the estate sector in 1992 transferred the responsibility for providing
basic social services to estate management. Predictably, health and social welfare compo-
nents assumed a low priority in the management’s budget, causing the quality of immu-
nization services to suffer. Quality issues are similar to those outside the sector.
The functions of technical support, coordination, and monitoring were transferred to an
autonomous government organization, the Plantation Housing and Social Welfare Trust
(TRUST). TRUST works in collaboration with MOH (e.g., in coordinating vaccine distri-
bution) but has no administrative authority over estate management, health staff, or
health programs on estates.
Regional TRUST managers identified the provision of transport for the collection of
vaccines, the outreach program, and supervision as their top priority. An investment
in vehicles, as with the broader immunization program, requires an in-depth assess-
ment of needs.
Conflict zones in the north and east
There has been internal conflict for 17 years, and the quality of health services in the north
and east has obviously suffered. The consequences are difficult to quantify, as statistics for
these areas are of poor quality, given the security problems and the large numbers of
displaced people. Personnel, equipment, and supplies are often difficult to come by. For
the immunization program, the cold chain is under considerable stress; in particular, to
quote a report on the Save the Children program in 1997, “fridges are few in number and
old, poorly monitored and overused, spare parts are non-existent, maintenance poor and
irregular.”11
Underserved Populations Estate Sector (BadulaaTT Dose in Colombo District, 1999 and Neliya District), 2000
TT1 41 51
TT2 41 49
Booster 100 45
Not indicated 4 1
Table 14: TT Coverage in Vulnerable Populations, 1999–2000
Source: EPI Unit (2000a)
11The situation is not likely to have improved substantially since then.
The privatization of the
estate sector in 1992
transferred the responsibility
for providing basic social
services to estate management.
Predictably, health and social
welfare components assumed
a low priority in the
management’s budget, causing
the quality of immunization
services to suffer

26
Costs and financing
The resources required to improve and sustain quality coverage in hard-to-reach popu-
lations have not been assessed in detail. However, to ensure equitable access to safe
vaccinations, the specific needs of these areas must be accommodated in any investment
strategy.
The Government does not provide assistance for program support in the estate sector,
although UNICEF does. In keeping with the current structure, any donor support should
use TRUST as the financial distribution mechanism, rather than the central or provincial
Ministries of Health.
NGOs have contributed significantly to the delivery of health services in the conflict zones,
and deserve to be given adequate financial assistance as part of any investment in immu-
nization.
Safety of injections
There is no official national safe injection policy or plan, although a policy of using a
clean syringe and needle for each child has been practiced for the last 10 years.
Sri Lanka uses reusable equipment for all vaccinations. Disposable syringes purchased by
parents have been used in the past but health care workers actively discourage this. Reuse
and repackaging of syringes in Sri Lanka is an acknowledged problem.
Evidence of a recent trend of abscess formation after immunization has raised concerns
about the quality of injection techniques. As with other elements of the program, this
relates to issues of quality (see “Quality and Community Commitment” above) and could
strongly affect community use of immunization services. Again, continuing skill-based
training on the job and increased supervision are required.
A joint WHO-UNICEF-UNFPA statement12 released recently calls for all immunization
programs to use only AD syringes by 2003. This would require a comprehensive strategy
for implementation. Operational costs will rise significantly. Training, supervision, and
sensitization activities will need to be undertaken. Equally important will be the introduc-
tion of safety boxes, a strict and supervised waste management policy, adequate waste
disposal infrastructure (e.g., high-temperature incinerators), and technical assistance
and training to ensure safe disposal of syringes.
Costs and financing
In choosing between the existing system and the introduction of AD syringes, the follow-
ing cost implications will need to be considered:
12WHO (1999)
Disposable syringes
purchased by parents
have been used in the past
but health care workers
actively discourage this. Reuse
and repackaging of syringes in
Sri Lanka is an acknowledged
problem

27
• The extensive up-front investment in sterilizable equipment (both past and future)
• The difference in operating costs; for sterilizable equipment, continuing expenditure
for spare parts, replacements, and fuel will be required whereas AD syringe expendi-
ture includes recurrent syringe supplies, distribution, destruction, and final contain-
ment; the cost for sterilizable equipment has been estimated at $5.40–$15.16 per
1,000 parenteral procedures, compared with $75.61–$99.31 for AD syringes13
• Training requirements; training will be required for a measles campaign in 2003 (see
“Introduction of New Vaccines” below), which may use AD syringes and may be part of
a more comprehensive introduction plan
Most injection equipment was originally provided 10–15 years ago. Of the 5,000 steriliz-
ers required for the entire program, about 2,000 have been replaced over the last two
years (by UNICEF), representing a significant investment. There are plans to replace the
remaining 3, 000 over the next three years, at a cost of $150,000 per year. The source of
funds is unclear. UNICEF has not yet announced its new program budget and may not
support the procurement of sterilization equipment from 2003 onward if it decides to
confine its funding to the procurement of AD syringes.14
Figure 6 shows the substantial difference in costs between the two approaches. Capital
and operating costs for sterilizable equipment will amount to $740,000 over five years,
including repairs and maintenance, while AD syringes will require over $2 million. As
long as safety is maintained, the injection strategy of using sterilizable equipment is the
more cost-effective and financially sustainable.
A separate study would be required to estimate the cost of providing an adequate waste
management system and infrastructure.
Introduction of new vaccines
Hepatitis B
Hepatitis B is considered to be, and treated as, an emerging public health problem in Sri
Lanka, although there are few data on its disease burden. In 1992 one district survey
indicated a Hepatitis B surface antigen positivity rate of 2.5 percent, representing interme-
diate endemicity. In 1993 a study in two districts showed a very low prevalence of Hepatitis
B surface antigen (less than 1 percent) and low infectivity status.
Routine introduction of Hepatitis B vaccine will depend on the results of a sero-preva-
lence survey to be undertaken with WHO assistance early in 2001. If required,
a detailed action plan for the introduction of the vaccine will be developed with
WHO/UNICEF support. At present, the vaccine is given to select high-risk groups, mainly
health professionals.
13Battersby et al. (1999)
14Policy clarification has been sought from UNICEF.
Figure 6: AD Syringe and Sterilizable Equipment
Costs Compared, 2001–2005
2001 2002 2003 2004 20050
100
200
300
400
500US$ thousand
Year
AD syringesSterilization equipment
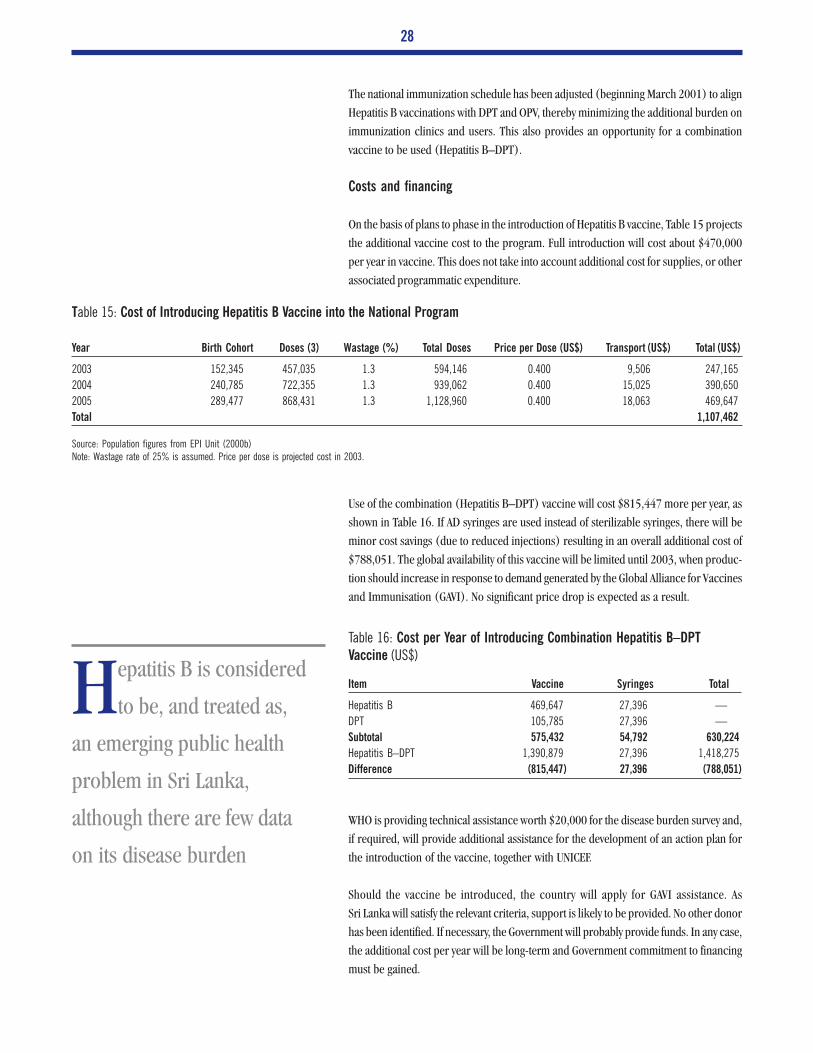
28
The national immunization schedule has been adjusted (beginning March 2001) to align
Hepatitis B vaccinations with DPT and OPV, thereby minimizing the additional burden on
immunization clinics and users. This also provides an opportunity for a combination
vaccine to be used (Hepatitis B–DPT).
Costs and financing
On the basis of plans to phase in the introduction of Hepatitis B vaccine, Table 15 projects
the additional vaccine cost to the program. Full introduction will cost about $470,000
per year in vaccine. This does not take into account additional cost for supplies, or other
associated programmatic expenditure.
Use of the combination (Hepatitis B–DPT) vaccine will cost $815,447 more per year, as
shown in Table 16. If AD syringes are used instead of sterilizable syringes, there will be
minor cost savings (due to reduced injections) resulting in an overall additional cost of
$788,051. The global availability of this vaccine will be limited until 2003, when produc-
tion should increase in response to demand generated by the Global Alliance for Vaccines
and Immunisation (GAVI). No significant price drop is expected as a result.
WHO is providing technical assistance worth $20,000 for the disease burden survey and,
if required, will provide additional assistance for the development of an action plan for
the introduction of the vaccine, together with UNICEF.
Should the vaccine be introduced, the country will apply for GAVI assistance. As
Sri Lanka will satisfy the relevant criteria, support is likely to be provided. No other donor
has been identified. If necessary, the Government will probably provide funds. In any case,
the additional cost per year will be long-term and Government commitment to financing
must be gained.
Year Birth Cohort Doses (3) Wastage (%) Total Doses Price per Dose (US$) Transport (US$) Total (US$)
2003 152,345 457,035 1.3 594,146 0.400 9,506 247,165
2004 240,785 722,355 1.3 939,062 0.400 15,025 390,650
2005 289,477 868,431 1.3 1,128,960 0.400 18,063 469,647
Total 1,107,462
Table 15: Cost of Introducing Hepatitis B Vaccine into the National Program
Source: Population figures from EPI Unit (2000b)Note: Wastage rate of 25% is assumed. Price per dose is projected cost in 2003.
Item Vaccine Syringes Total
Hepatitis B 469,647 27,396 —
DPT 105,785 27,396 —
Subtotal 575,432 54,792 630,224
Hepatitis B–DPT 1,390,879 27,396 1,418,275
Difference (815,447) 27,396 (788,051)
Table 16: Cost per Year of Introducing Combination Hepatitis B–DPT
Vaccine (US$)
Hepatitis B is considered
to be, and treated as,
an emerging public health
problem in Sri Lanka,
although there are few data
on its disease burden
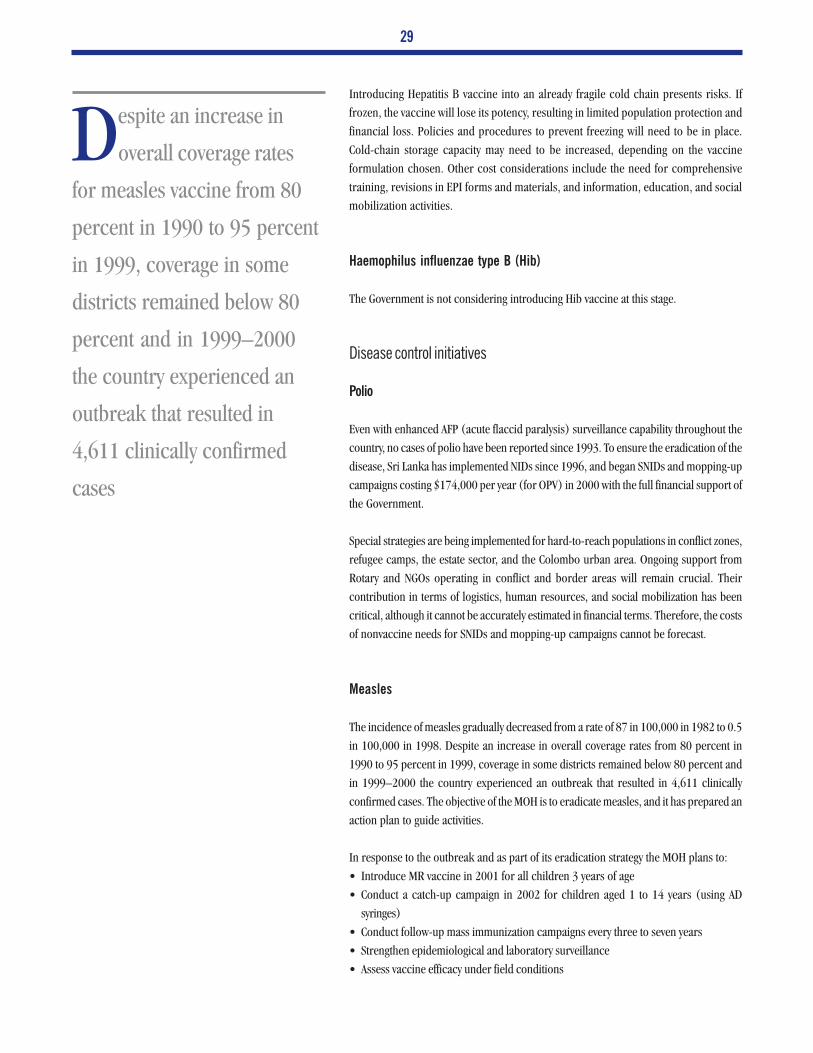
29
Introducing Hepatitis B vaccine into an already fragile cold chain presents risks. If
frozen, the vaccine will lose its potency, resulting in limited population protection and
financial loss. Policies and procedures to prevent freezing will need to be in place.
Cold-chain storage capacity may need to be increased, depending on the vaccine
formulation chosen. Other cost considerations include the need for comprehensive
training, revisions in EPI forms and materials, and information, education, and social
mobilization activities.
Haemophilus influenzae type B (Hib)
The Government is not considering introducing Hib vaccine at this stage.
Disease control initiatives
Polio
Even with enhanced AFP (acute flaccid paralysis) surveillance capability throughout the
country, no cases of polio have been reported since 1993. To ensure the eradication of the
disease, Sri Lanka has implemented NIDs since 1996, and began SNIDs and mopping-up
campaigns costing $174,000 per year (for OPV) in 2000 with the full financial support of
the Government.
Special strategies are being implemented for hard-to-reach populations in conflict zones,
refugee camps, the estate sector, and the Colombo urban area. Ongoing support from
Rotary and NGOs operating in conflict and border areas will remain crucial. Their
contribution in terms of logistics, human resources, and social mobilization has been
critical, although it cannot be accurately estimated in financial terms. Therefore, the costs
of nonvaccine needs for SNIDs and mopping-up campaigns cannot be forecast.
Measles
The incidence of measles gradually decreased from a rate of 87 in 100,000 in 1982 to 0.5
in 100,000 in 1998. Despite an increase in overall coverage rates from 80 percent in
1990 to 95 percent in 1999, coverage in some districts remained below 80 percent and
in 1999–2000 the country experienced an outbreak that resulted in 4,611 clinically
confirmed cases. The objective of the MOH is to eradicate measles, and it has prepared an
action plan to guide activities.
In response to the outbreak and as part of its eradication strategy the MOH plans to:
• Introduce MR vaccine in 2001 for all children 3 years of age
• Conduct a catch-up campaign in 2002 for children aged 1 to 14 years (using AD
syringes)
• Conduct follow-up mass immunization campaigns every three to seven years
• Strengthen epidemiological and laboratory surveillance
• Assess vaccine efficacy under field conditions
Despite an increase in
overall coverage rates
for measles vaccine from 80
percent in 1990 to 95 percent
in 1999, coverage in some
districts remained below 80
percent and in 1999–2000
the country experienced an
outbreak that resulted in
4,611 clinically confirmed
cases
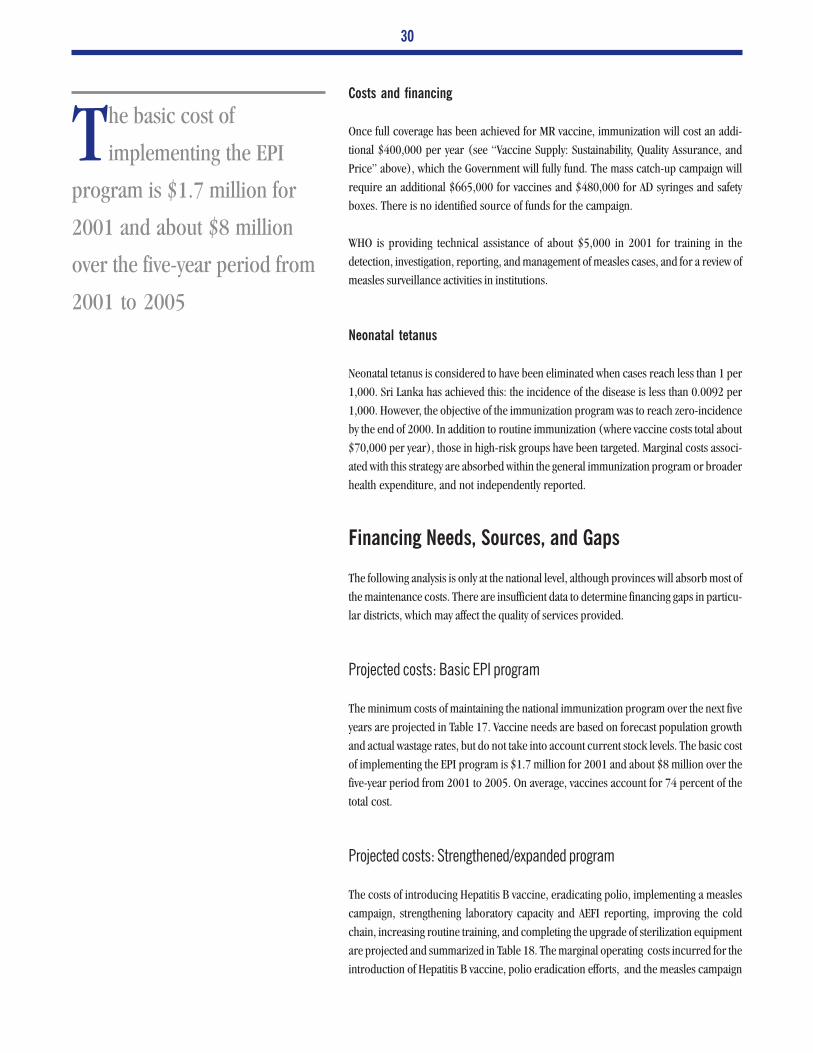
30
Costs and financing
Once full coverage has been achieved for MR vaccine, immunization will cost an addi-
tional $400,000 per year (see “Vaccine Supply: Sustainability, Quality Assurance, and
Price” above), which the Government will fully fund. The mass catch-up campaign will
require an additional $665,000 for vaccines and $480,000 for AD syringes and safety
boxes. There is no identified source of funds for the campaign.
WHO is providing technical assistance of about $5,000 in 2001 for training in the
detection, investigation, reporting, and management of measles cases, and for a review of
measles surveillance activities in institutions.
Neonatal tetanus
Neonatal tetanus is considered to have been eliminated when cases reach less than 1 per
1,000. Sri Lanka has achieved this: the incidence of the disease is less than 0.0092 per
1,000. However, the objective of the immunization program was to reach zero-incidence
by the end of 2000. In addition to routine immunization (where vaccine costs total about
$70,000 per year), those in high-risk groups have been targeted. Marginal costs associ-
ated with this strategy are absorbed within the general immunization program or broader
health expenditure, and not independently reported.
Financing Needs, Sources, and Gaps
The following analysis is only at the national level, although provinces will absorb most of
the maintenance costs. There are insufficient data to determine financing gaps in particu-
lar districts, which may affect the quality of services provided.
Projected costs: Basic EPI program
The minimum costs of maintaining the national immunization program over the next five
years are projected in Table 17. Vaccine needs are based on forecast population growth
and actual wastage rates, but do not take into account current stock levels. The basic cost
of implementing the EPI program is $1.7 million for 2001 and about $8 million over the
five-year period from 2001 to 2005. On average, vaccines account for 74 percent of the
total cost.
Projected costs: Strengthened/expanded program
The costs of introducing Hepatitis B vaccine, eradicating polio, implementing a measles
campaign, strengthening laboratory capacity and AEFI reporting, improving the cold
chain, increasing routine training, and completing the upgrade of sterilization equipment
are projected and summarized in Table 18. The marginal operating costs incurred for the
introduction of Hepatitis B vaccine, polio eradication efforts, and the measles campaign
The basic cost of
implementing the EPI
program is $1.7 million for
2001 and about $8 million
over the five-year period from
2001 to 2005
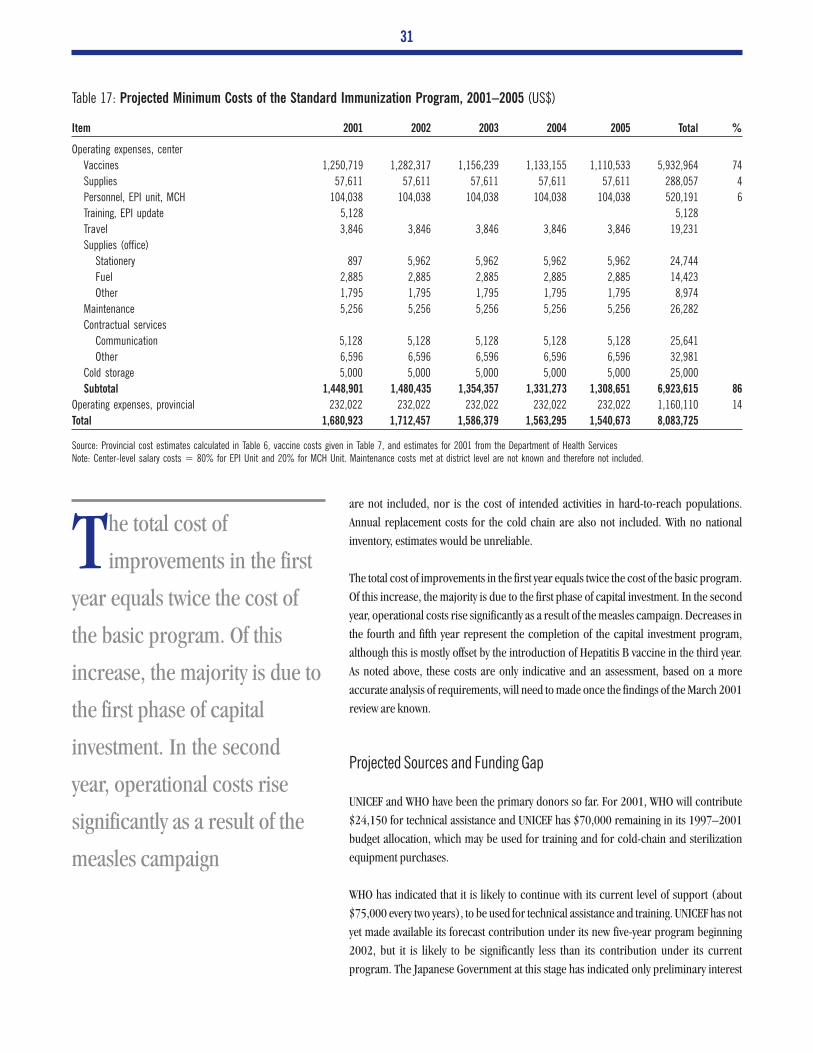
31
Item 2001 2002 2003 2004 2005 Total %
Operating expenses, center
Vaccines 1,250,719 1,282,317 1,156,239 1,133,155 1,110,533 5,932,964 74
Supplies 57,611 57,611 57,611 57,611 57,611 288,057 4
Personnel, EPI unit, MCH 104,038 104,038 104,038 104,038 104,038 520,191 6
Training, EPI update 5,128 5,128
Travel 3,846 3,846 3,846 3,846 3,846 19,231
Supplies (office)
Stationery 897 5,962 5,962 5,962 5,962 24,744
Fuel 2,885 2,885 2,885 2,885 2,885 14,423
Other 1,795 1,795 1,795 1,795 1,795 8,974
Maintenance 5,256 5,256 5,256 5,256 5,256 26,282
Contractual services
Communication 5,128 5,128 5,128 5,128 5,128 25,641
Other 6,596 6,596 6,596 6,596 6,596 32,981
Cold storage 5,000 5,000 5,000 5,000 5,000 25,000
Subtotal 1,448,901 1,480,435 1,354,357 1,331,273 1,308,651 6,923,615 86
Operating expenses, provincial 232,022 232,022 232,022 232,022 232,022 1,160,110 14
Total 1,680,923 1,712,457 1,586,379 1,563,295 1,540,673 8,083,725
Table 17: Projected Minimum Costs of the Standard Immunization Program, 2001–2005 (US$)
Source: Provincial cost estimates calculated in Table 6, vaccine costs given in Table 7, and estimates for 2001 from the Department of Health ServicesNote: Center-level salary costs = 80% for EPI Unit and 20% for MCH Unit. Maintenance costs met at district level are not known and therefore not included.
are not included, nor is the cost of intended activities in hard-to-reach populations.
Annual replacement costs for the cold chain are also not included. With no national
inventory, estimates would be unreliable.
The total cost of improvements in the first year equals twice the cost of the basic program.
Of this increase, the majority is due to the first phase of capital investment. In the second
year, operational costs rise significantly as a result of the measles campaign. Decreases in
the fourth and fifth year represent the completion of the capital investment program,
although this is mostly offset by the introduction of Hepatitis B vaccine in the third year.
As noted above, these costs are only indicative and an assessment, based on a more
accurate analysis of requirements, will need to made once the findings of the March 2001
review are known.
Projected Sources and Funding Gap
UNICEF and WHO have been the primary donors so far. For 2001, WHO will contribute
$24,150 for technical assistance and UNICEF has $70,000 remaining in its 1997–2001
budget allocation, which may be used for training and for cold-chain and sterilization
equipment purchases.
WHO has indicated that it is likely to continue with its current level of support (about
$75,000 every two years), to be used for technical assistance and training. UNICEF has not
yet made available its forecast contribution under its new five-year program beginning
2002, but it is likely to be significantly less than its contribution under its current
program. The Japanese Government at this stage has indicated only preliminary interest
The total cost of
improvements in the first
year equals twice the cost of
the basic program. Of this
increase, the majority is due to
the first phase of capital
investment. In the second
year, operational costs rise
significantly as a result of the
measles campaign
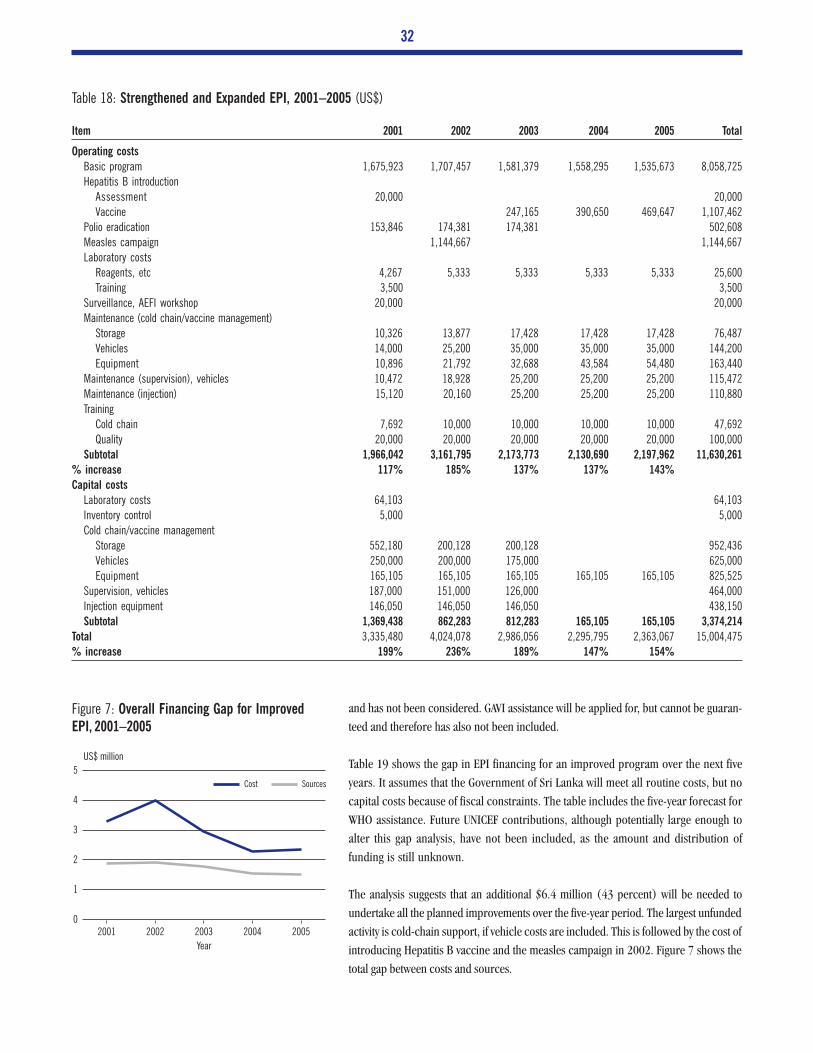
32
Item 2001 2002 2003 2004 2005 Total
Operating costs
Basic program 1,675,923 1,707,457 1,581,379 1,558,295 1,535,673 8,058,725
Hepatitis B introduction
Assessment 20,000 20,000
Vaccine 247,165 390,650 469,647 1,107,462
Polio eradication 153,846 174,381 174,381 502,608
Measles campaign 1,144,667 1,144,667
Laboratory costs
Reagents, etc 4,267 5,333 5,333 5,333 5,333 25,600
Training 3,500 3,500
Surveillance, AEFI workshop 20,000 20,000
Maintenance (cold chain/vaccine management)
Storage 10,326 13,877 17,428 17,428 17,428 76,487
Vehicles 14,000 25,200 35,000 35,000 35,000 144,200
Equipment 10,896 21,792 32,688 43,584 54,480 163,440
Maintenance (supervision), vehicles 10,472 18,928 25,200 25,200 25,200 115,472
Maintenance (injection) 15,120 20,160 25,200 25,200 25,200 110,880
Training
Cold chain 7,692 10,000 10,000 10,000 10,000 47,692
Quality 20,000 20,000 20,000 20,000 20,000 100,000
Subtotal 1,966,042 3,161,795 2,173,773 2,130,690 2,197,962 11,630,261
% increase 117% 185% 137% 137% 143%
Capital costs
Laboratory costs 64,103 64,103
Inventory control 5,000 5,000
Cold chain/vaccine management
Storage 552,180 200,128 200,128 952,436
Vehicles 250,000 200,000 175,000 625,000
Equipment 165,105 165,105 165,105 165,105 165,105 825,525
Supervision, vehicles 187,000 151,000 126,000 464,000
Injection equipment 146,050 146,050 146,050 438,150
Subtotal 1,369,438 862,283 812,283 165,105 165,105 3,374,214
Total 3,335,480 4,024,078 2,986,056 2,295,795 2,363,067 15,004,475
% increase 199% 236% 189% 147% 154%
Table 18: Strengthened and Expanded EPI, 2001–2005 (US$)
and has not been considered. GAVI assistance will be applied for, but cannot be guaran-
teed and therefore has also not been included.
Table 19 shows the gap in EPI financing for an improved program over the next five
years. It assumes that the Government of Sri Lanka will meet all routine costs, but no
capital costs because of fiscal constraints. The table includes the five-year forecast for
WHO assistance. Future UNICEF contributions, although potentially large enough to
alter this gap analysis, have not been included, as the amount and distribution of
funding is still unknown.
The analysis suggests that an additional $6.4 million (43 percent) will be needed to
undertake all the planned improvements over the five-year period. The largest unfunded
activity is cold-chain support, if vehicle costs are included. This is followed by the cost of
introducing Hepatitis B vaccine and the measles campaign in 2002. Figure 7 shows the
total gap between costs and sources.
Figure 7: Overall Financing Gap for Improved
EPI, 2001–2005
2001 2002 2003 2004 20050
1
2
3
4
5US$ million
Year
SourcesCost
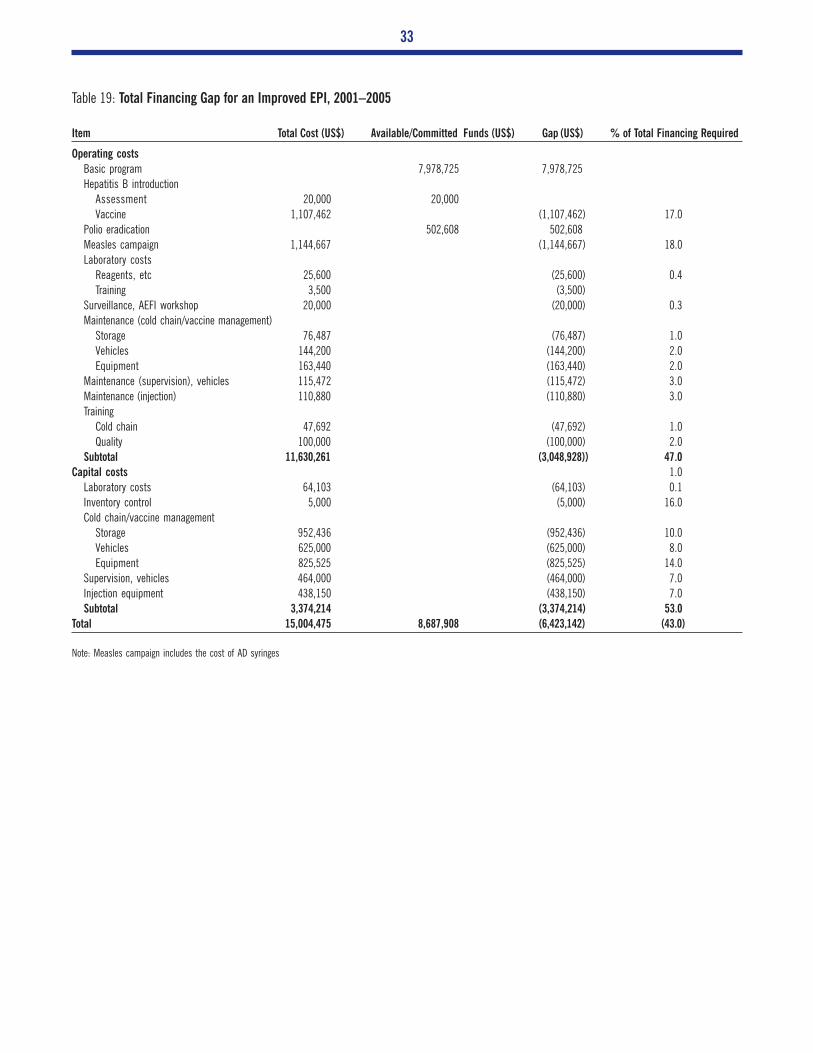
33
Table 19: Total Financing Gap for an Improved EPI, 2001–2005
Note: Measles campaign includes the cost of AD syringes
Item Total Cost (US$) Available/Committed Funds (US$) Gap (US$) % of Total Financing Required
Operating costs
Basic program 7,978,725 7,978,725
Hepatitis B introduction
Assessment 20,000 20,000
Vaccine 1,107,462 (1,107,462) 17.0
Polio eradication 502,608 502,608
Measles campaign 1,144,667 (1,144,667) 18.0
Laboratory costs
Reagents, etc 25,600 (25,600) 0.4
Training 3,500 (3,500)
Surveillance, AEFI workshop 20,000 (20,000) 0.3
Maintenance (cold chain/vaccine management)
Storage 76,487 (76,487) 1.0
Vehicles 144,200 (144,200) 2.0
Equipment 163,440 (163,440) 2.0
Maintenance (supervision), vehicles 115,472 (115,472) 3.0
Maintenance (injection) 110,880 (110,880) 3.0
Training
Cold chain 47,692 (47,692) 1.0
Quality 100,000 (100,000) 2.0
Subtotal 11,630,261 (3,048,928)) 47.0
Capital costs 1.0
Laboratory costs 64,103 (64,103) 0.1
Inventory control 5,000 (5,000) 16.0
Cold chain/vaccine management
Storage 952,436 (952,436) 10.0
Vehicles 625,000 (625,000) 8.0
Equipment 825,525 (825,525) 14.0
Supervision, vehicles 464,000 (464,000) 7.0
Injection equipment 438,150 (438,150) 7.0
Subtotal 3,374,214 (3,374,214) 53.0
Total 15,004,475 8,687,908 (6,423,142) (43.0)

CHAPTER V
Policy and Financing Options
Financing gaps at the national level need to be addressed before the immunization
program can be strengthened and expanded. Over the next five years these gaps will
primarily affect the cold chain, service quality and safety, and measles control. Failure to
address these issues could erode the significant gains of the past 20 years. Closing these
gaps will require increased support from external partners, and the introduction of
policies that can lead to cost savings.
The underfunded health system and the shift in resources toward larger medical institu-
tions have deprived primary health care services of the necessary staff, supplies, and
infrastructure. Additional funding and human resources are needed to improve the
capacity and quality of such services. Any discussion of financing for immunization must
take this broader context into account, particularly since the immunization program is so
well integrated into the primary health care system.
Policy Options
Implementing the following policies will improve financial sustainability through poten-
tial cost savings and increased efficiencies:
Vaccine management
The immunization program enjoys strong Government support for vaccine procurement,
largely because of its excellent reputation. Hence, there has been little pressure to cut
costs. But with the vaccine budget expanding by 75 percent in 2001, the potential
introduction of Hepatitis B vaccine in 2003 (costing an additional 42 percent) and
current fiscal constraints on the Government, automatic funding should not be taken for
granted. Policies that will lower the overall cost of vaccine purchases, while maintaining
coverage and quality, will help sustain Treasury support.
To date, the immunization program has viewed vaccine wastage as a price it must pay for
ensuring that every child is immunized. However, less wastage could mean lower costs,
making wastage rates a useful financial management tool. As high coverage has already
been achieved, wastage rates must now be analyzed in depth (to identify causes) and the
appropriate reduction strategies implemented.
Donor dependence
Issues of financial sustainability extend beyond a commitment to vaccine procurement.
Relying on donors to meet operational costs increases the risk that essential supplies will
The immunization program
enjoys strong Government
support for vaccine
procurement, largely because
of its excellent reputation.
Hence, there has been little
pressure to cut costs
36
be unavailable, and can compromise program integrity. UNICEF has been a partner of
EPI since the start, and its continued (substantial) assistance is assumed. This depen-
dent relationship has limited planning to transfer responsibility of funding critical
supplies, such as syringes, to the Government. UNICEF (or any other donor) support
will not be provided indefinitely, particularly as EPI diseases decrease and other priori-
ties arise. At the very least, the Government should take responsibility for funding
recurrent costs.
Cold-chain equipment: Management and procurement
Capital investment, and therefore the supply of adequate cold-chain equipment, is the
responsibility of the central Government. While the EPI Unit is accountable for monitor-
ing the cold chain, MCH is in charge of procuring and distributing equipment. This split
in management responsibility has meant that inventory control and monitoring of equip-
ment have not been adequate.
Consequently, the country’s equipment needs and the status of its equipment inventory are
not known, and accurate planning, for financial and other requirements is not known.
Consolidating responsibility in one unit would lead to more efficient and effective man-
agement of the cold chain. Given the EPI Unit’s vaccine storage responsibilities, reporting
mechanisms, and strong management capacity, the unit should also be made responsible
for equipment planning, procurement, and distribution.
Monitoring
Significant resources are required to implement a national immunization program, and
managing them well will reduce costs. Cold-chain and sterilization equipment and ve-
hicles should be inventoried and their functional status, performance, and maintenance
schedule monitored to optimize their efficiency and longevity. A national (centralized)
inventory and monitoring system will facilitate needs-based planning and make resource
mobilization more efficient. More importantly, it will identify where (limited) resources
are most needed and can be most effectively used.
An important element of good monitoring is responsiveness. Breakdowns in the cold
chain, for example, need to be addressed as quickly as possible. This will require finan-
cial resources, and a discretionary budget for emergencies, at the national level, is justi-
fiable.
Any investment in capital equipment should support the establishment of an effective and
responsive monitoring system.
Financing Options
The size of financing gaps identified in this report must be considered only indicative.
More accurate information will come from comprehensive assessments. This report
should be read in conjunction with the EPI review (including a cold-chain assessment)
in March–April 2001 and the five-year strategic plan to be developed after that.
While the EPI Unit is
accountable for
monitoring the cold chain,
MCH is in charge of procuring
and distributing equipment.
This split in management
responsibility has meant that
inventory control and
monitoring of equipment have
not been adequate
37
Given its vital role in the program and assumed continuing assistance, UNICEF must
clarify its future funding plans as soon as possible.
Vaccines
The Sri Lankan Government is committed to providing sufficient funds for the purchase
of all vaccines. Donor funding is neither required nor advisable.
The Government may reduce costs by procuring from nonprequalified suppliers and
using lot testing to verify quality. However, the savings may not compensate for the risks
involved. WHO does not recommend this strategy.
Vaccine management and the cold chain
Investment in technical assistance for analysis of wastage rates and the introduction of
appropriate reduction strategies is well justified
The costs of improving vaccine distribution capacity and strengthening the cold chain are
not clear. Estimates provided assume the complete replacement of all vehicles and the
uniform addition of refrigerators and freezers to all health units, and are not based on a
systematic assessment of needs. Further, there has been no inventory of vaccine carriers,
cold boxes, and icepacks. Any cold-chain investment must be preceded by a more
accurate assessment (available after April 2001). Vehicle requirements, particularly at the
periphery, must be assessed in relation to both vaccine distribution and supervision needs
to minimize duplication.
Current estimates indicate a capital investment funding gap of $2.4 million ($952,000
for storage, $625,000 for vehicles, $825,000 for equipment). This total does not include
maintenance costs of just over $100,000 per year. If a three-year phased-in approach is
used, an investment of $960,000 in the first year, followed by about $500,000 in the next
two years, will be required. Projections are based on these investments only and do not
include a budget for replacement costs.
The establishment of a national inventory and monitoring system for equipment and a
management and maintenance system for vehicles should be either a condition of any
assistance package or a part of the package. Ongoing district-level training for cold-chain
officers, costing about $10,000 per year, should accompany any equipment provided.
No committed source of funds for cold-chain equipment has been identified, although
the Japanese Government has indicated interest in providing medium-term support. In
line with Japanese policy, assistance will not be provided for vehicles. The UNICEF budget
for cold-chain equipment is unknown.
Quality and community commitment
Strengthening the quality of the immunization program is arguably the most important
priority. The risk of losing the tremendous advantages gained in disease control should
not be underestimated.
Strengthening the quality of
the immunization program
is arguably the most important
priority. The risk of losing the
tremendous advantages gained
in disease control should not
be underestimated
38
As with the cold chain, the exact financial resources required should be studied further.
The provision of vehicles is an important component but increased human resource
capacity at the central and district levels is also needed. The cost and feasibility of
strengthening capacity in a sustainable manner will require a broader analysis than that
contained in this report, particularly since immunization is an integral part of the primary
health care system. Financing for training, estimated at $20,000 at the minimum, should
be contingent on the development of a medium-term training strategy, which includes
adequate follow-up and supervision. WHO has earmarked $3,500 for training in various
areas.
Problem areas that will require specific training should be identified through a survey of
qualitative aspects in 2001 supported by WHO.
Capital investment in vehicles for the central and district levels will cost about $464,000.
Vehicle needs at the periphery must also be assessed. Access by public health midwife
supervisors and MCH to all clinics is important, and may require the purchase or replace-
ment of motorcycles, for example. Conditions of vehicle assistance are outlined in the
“Future Financing” section above.
Equitable access
Some of the resource needs of the estate sector and the conflict zone were included in the
foregoing cost analyses, but further study will determine the extent and type of extra
funding that will help ensure or increase quality coverage of these hard-to-reach popula-
tions. Any financial assistance for the immunization program should explicitly address
these needs.
Injection safety
The medium-term injection strategy for the immunization program will need to be
decided soon. Introducing auto-disable (AD) syringes, as recommended by WHO/UNICEF,
will have significant financial consequences. Recurrent expenditure will increase dra-
matically and up-front investment for training and sensitization activities as well as an
adequate waste management system will be necessary.
As long as safety is maintained, sterilizable equipment is more cost-effective: the estimated
yearly cost of supplying AD syringes is $430,000, the same amount required to upgrade
steam sterilizers throughout the program. Should the present system be retained, re-
sources for the replacement of old sterilizers must be identified. UNICEF funding cannot
be guaranteed.
Injection safety must be maintained, and investments in equipment are well justified.
However, as with cold-chain equipment, these investments must be preceded by an in-
depth assessment of needs, include the establishment of a national monitoring system for
equipment and supplies, and be accompanied by training in maintenance. The invest-
ment should also be contingent on Government financing of all recurrent costs.
The medium-term
injection strategy for the
immunization program will
need to be decided soon.
Introducing auto-disable
(AD) syringes as
recommended by WHO/
UNICEF, will have significant
financial consequences

39
Introduction of new vaccines
In theory, an immunization program should be expanded only when it is already robust
enough. To introduce new vaccines into a fragile cold chain is to risk damaging the
vaccines, leading to significant financial loss and limited improvement in disease control.
If routine Hepatitis B immunization is introduced, either the Global Alliance on Vaccines
and Immunization (GAVI) or the Government will likely cover the funding requirements.
Indirect but crucial support can be provided through investments in general program
strengthening, including the cold chain.
Disease control strategies
There is good justification for developing medium-term financing arrangements to en-
sure support for the eradication of measles. The minimum investment for a catch-up
campaign in 2002 is $1.3 million, including AD syringes but not the associated program
costs. Follow-up mass campaigns every three to seven years will require similar funding.
Any assistance must consider the policy and financial tension between focusing on a
single disease and ensuring a strong program overall.
Summary
The use of wastage rates in vaccine planning and management could lead to cost savings.
In-depth analysis should identify causes and recommend appropriate strategies to reduce
vaccine usage without compromising quality or coverage.
To strengthen the immunization program, additional funding is required in three areas:
cold chain (storage, vehicles, equipment, and training), quality (vehicles and training),
and injection safety (equipment). Liaison with UNICEF and JICA will facilitate a compre-
hensive donor approach to supporting these areas.
To expand the program, additional funding is required for measles eradication, a priority
for the Government following the outbreak in 1999–2000.
Three funding options are available to the Sri Lankan Government: increase national
spending; increase donor funding; or assume (soft) loan obligations. Substantial Govern-
ment increases are unlikely in the short term, given the reasons outlined above. Donor
funding and loan obligations may provide opportunities to strengthen the program but
should not be relied on to deliver essential components of the program, such as injection
supplies.
Some of the resource needs
of the estate sector and the
conflict zone were included in
the foregoing cost analyses,
but further study will
determine the extent and type
of extra funding that will help
ensure or increase quality
coverage of these hard-to-
reach populations

CHAPTER VI
Recommendations
To strengthen and expand the national immunization program of Sri Lanka, the Govern-
ment should examine cost reduction strategies and policy issues, and mobilize resources.
In view of the primary need to consolidate the substantial gains achieved in coverage and
disease control, the following courses of action are recommended:
• Improve financial sustainability by ensuring full internal funding of all basic opera-
tional costs (particularly syringes and needles) for the routine program.
• Minimize cost by:
(i) Investigating the cost advantages of multi-year planning and procurement con-
tracts
(ii) Using wastage rates when forecasting vaccine needs
(iii)Seeking technical assistance to:
(a) analyze the cause of vaccine wastage
(b) if appropriate, develop and implement waste reduction strategies and policies
(iv) Establishing a national inventory and monitoring system for equipment and sup-
plies (see the third recommendation below)
(v) Undertaking preventive maintenance on equipment
• Mobilize external resources to fund the following:
(i) A national inventory control system for vaccines, equipment, and other sup-
plies
(ii) A stronger cold chain, including storage, vehicle, and equipment needs. The
following are further recommended:
(a) A comprehensive assessment of needs should precede any investment.
(b) Vehicle support should consider cost-effective management systems (such as
whole-of-life contracts) and ensure that sufficient resources are available for
the associated operating costs.
(c) Equipment support should provide assistance for the implementation of
replacement and maintenance systems, including the cost of expanding and
sustaining maintenance capacity at the district level.
(d) Full management of cold-chain equipment should be transferred to the EPI
Unit.
(iii)Better-quality service, through improved capacity for supervision and training.
The following are further recommended:
(a) A comprehensive assessment of needs (including those at the periphery)
should precede the purchase of vehicles.
(b) Support should be contingent on (or provide assistance for) the development
of a medium-term plan to improve service capacity.
(c) Support should be provided for the production and distribution of an immu-
nization manual for health care workers.
(iv) Replacement of injection equipment (assuming the continued use of sterilizable
equipment). The following are further recommended:
(a) Any investment should be subject to the same conditions as investment in
cold-chain equipment (see above).
These recommendations
should be reviewed in
light of the overall program
assessment in March 2001,
and the five-year strategic plan
and budget to be prepared
after that
42
(b) Support should be contingent on Government commitment to cover all rel-
evant operating costs (see the first recommendation above).
(v) A measles eradication campaign
• Improve equitable access for the hard-to-reach, particularly in the north and east and
the plantation estate sector, by drawing up investment strategies that explicitly address
the financial resource needs of these populations.
• Urge UNICEF to clarify its short and medium-term funding plans as soon as possible.
These recommendations should be reviewed in light of the overall program assessment in
March 2001, and the five-year strategic plan and budget to be prepared after that.
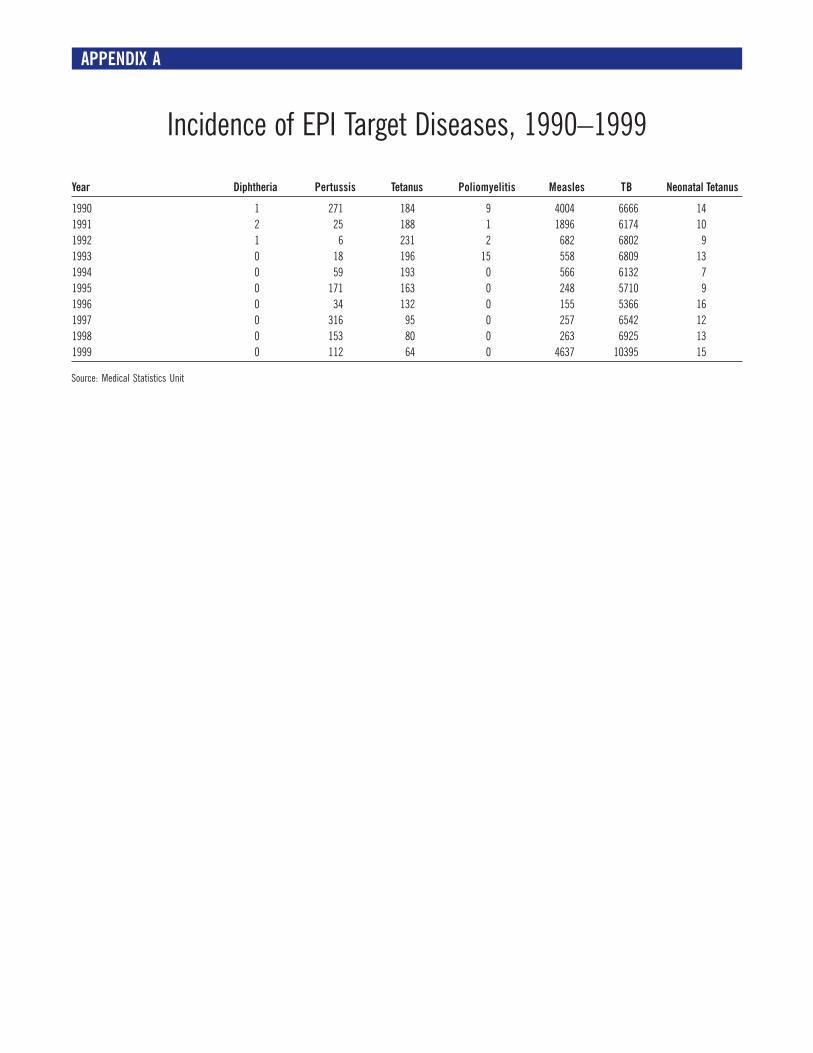
APPENDIX A
Incidence of EPI Target Diseases, 1990–1999
Source: Medical Statistics Unit
Year Diphtheria Pertussis Tetanus Poliomyelitis Measles TB Neonatal Tetanus
1990 1 271 184 9 4004 6666 14
1991 2 25 188 1 1896 6174 10
1992 1 6 231 2 682 6802 9
1993 0 18 196 15 558 6809 13
1994 0 59 193 0 566 6132 7
1995 0 171 163 0 248 5710 9
1996 0 34 132 0 155 5366 16
1997 0 316 95 0 257 6542 12
1998 0 153 80 0 263 6925 13
1999 0 112 64 0 4637 10395 15
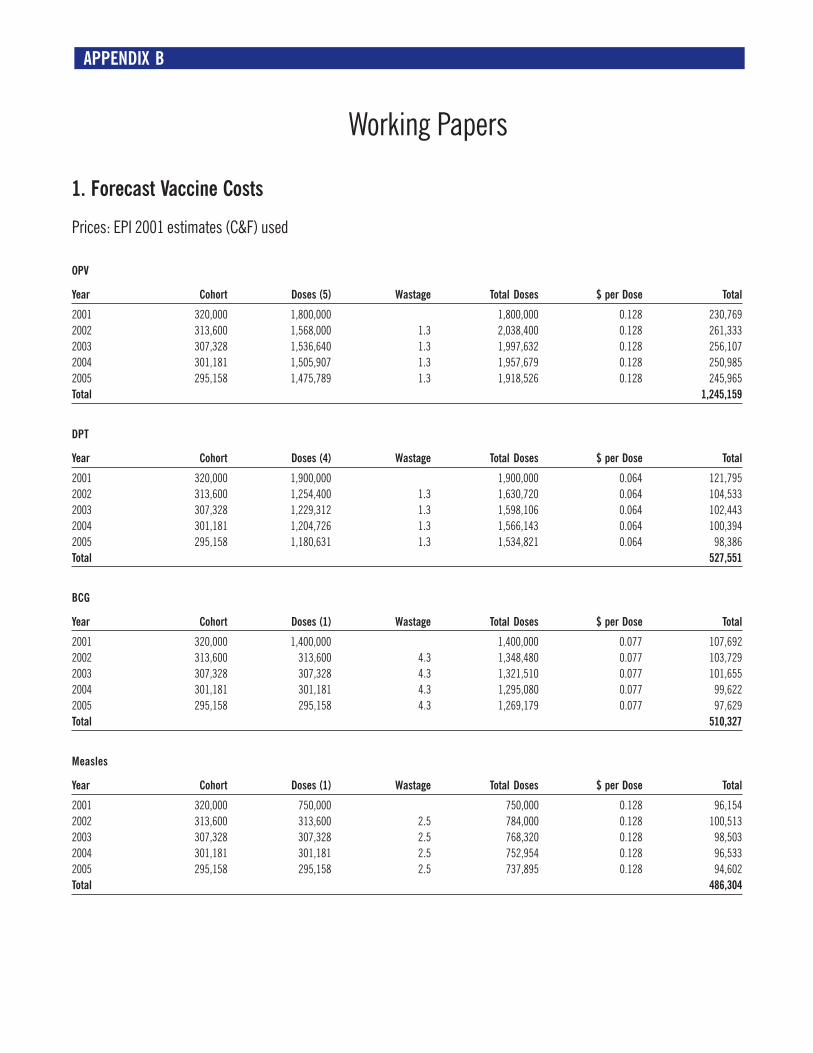
Working Papers
APPENDIX B
1. Forecast Vaccine Costs
Prices: EPI 2001 estimates (C&F) used
OPV
Year Cohort Doses (5) Wastage Total Doses $ per Dose Total
2001 320,000 1,800,000 1,800,000 0.128 230,769
2002 313,600 1,568,000 1.3 2,038,400 0.128 261,333
2003 307,328 1,536,640 1.3 1,997,632 0.128 256,107
2004 301,181 1,505,907 1.3 1,957,679 0.128 250,985
2005 295,158 1,475,789 1.3 1,918,526 0.128 245,965
Total 1,245,159
DPT
Year Cohort Doses (4) Wastage Total Doses $ per Dose Total
2001 320,000 1,900,000 1,900,000 0.064 121,795
2002 313,600 1,254,400 1.3 1,630,720 0.064 104,533
2003 307,328 1,229,312 1.3 1,598,106 0.064 102,443
2004 301,181 1,204,726 1.3 1,566,143 0.064 100,394
2005 295,158 1,180,631 1.3 1,534,821 0.064 98,386
Total 527,551
BCG
Year Cohort Doses (1) Wastage Total Doses $ per Dose Total
2001 320,000 1,400,000 1,400,000 0.077 107,692
2002 313,600 313,600 4.3 1,348,480 0.077 103,729
2003 307,328 307,328 4.3 1,321,510 0.077 101,655
2004 301,181 301,181 4.3 1,295,080 0.077 99,622
2005 295,158 295,158 4.3 1,269,179 0.077 97,629
Total 510,327
Measles
Year Cohort Doses (1) Wastage Total Doses $ per Dose Total
2001 320,000 750,000 750,000 0.128 96,154
2002 313,600 313,600 2.5 784,000 0.128 100,513
2003 307,328 307,328 2.5 768,320 0.128 98,503
2004 301,181 301,181 2.5 752,954 0.128 96,533
2005 295,158 295,158 2.5 737,895 0.128 94,602
Total 486,304

45
Rubella
Year Cohort Doses (1) Wastage Total Doses $ per Dose Total
2001 197,750 500,000 500,000 0.154 76,923
2002 193,795 193,795 1.5 290,693 0.154 44,722
2003 189,919 189,919 1.5 284,879 0.154 43,827
2004 186,121 186,121 1.5 279,181 0.154 42,951
2005 182,398 182,398 1.5 273,597 0.154 42,092
Total 250,515
Note: Demographic projections from Population Information Center
MR
Year Cohort Doses (1) Wastage Total Doses $ per Dose Total
2001 340,000 700,000 700,000 0.769 538,462
2002 333,200 333,200 2.0 666,400 0.769 512,615
2003 326,536 261,229 2.0 522,458 0.769 401,890
2004 320,005 256,004 2.0 512,008 0.769 393,853
2005 313,605 250,884 2.0 501,768 0.769 385,976
Total 2,232,796
Note: 2001 cohort based on 1998 live births (see EPI 2000a). Assumes 70% coverage in years 1 and 2, 80% in years 3 to 5
Dt
Year Cohort Doses (1) Wastage Total Doses $ per Dose Total
2001 355,000 500,000 500,000 0.077 38,462
2002 347,900 347,900 2.4 834,960 0.077 64,228
2003 340,942 340,942 2.4 818,261 0.077 62,943
2004 334,123 334,123 2.4 801,896 0.077 61,684
2005 327,441 327,441 2.4 785,858 0.077 60,451
Total 287,767
Note: 2001 cohort based on 1996 live births
TT
Year Cohort Doses (2) Wastage Total Doses $ per Dose Total
2001 361,071 450,000 450,000 0.051 23,077
2002 353,849 707,698 2.0 1,415,396 0.051 72,584
2003 346,772 693,544 2.0 1,387,088 0.051 71,133
2004 339,837 679,673 2.0 1,359,347 0.051 69,710
2005 333,040 666,080 2.0 1,332,160 0.051 68,316
Total 304,820
aTd
Year Cohort Doses (1) Wastage Total Doses $ per Dose Total
2001 355,000 106,500 200,000 0.077 15,385
2002 347,900 104,370 2.0 208,740 0.077 16,057
2003 340,942 102,283 2.0 204,565 0.077 15,736
2004 334,123 100,237 2.0 200,474 0.077 15,421
2005 327,441 98,232 2.0 196,464 0.077 15,113
Total 77,711
Note: Assumes 30% coverage

46
Plus Polio Subnational Immunization Days
Year Cohort Doses (5) Wastage Total Doses $ per Dose Total
2001 618,259 1,200,000 1,200,000 0.128 153,846
2002 618,259 1,236,518 1.1 1,360,170 0.128 174,381
2003 618,259 1,236,518 1.1 1,360,170 0.128 174,381
Total 502,608
Note: Based on 2000 population and dose requirements
Plus Measles Campaign
Year 1–15 Doses (1) Wastage Total Doses $ per Dose Total
2003 4,719,000 4,719,000 1.1 5,190,900 0.128 665,500
2. Injection Equipment
No. of Injections Required
Year DPT Measles BCG HepB Rubella DT TT MR aTd Total
2001 1,280,000 320,000 320,000 960,000 395,500 355,000 361,071 238,000 71,400 4,300,971
2002 1,254,400 313,600 313,600 940,800 387,590 347,900 353,849 247,694 74,308 4,233,742
2003 1,229,312 307,328 307,328 921,984 379,838 340,942 346,772 277,418 83,225 4,194,147
2004 1,204,726 301,181 301,181 903,544 372,241 334,123 339,837 271,869 81,561 4,110,264
2005 1,180,631 295,158 295,158 885,473 364,797 327,441 333,040 266,432 79,930 4,028,059
AD Syringes
No. of Wastage $ per Safety $ per
Year Years (4%) Total Unit Total ($) Transport Subtotal Boxes Unit Total Transport Subtotal Total
2001 4,300,971 172,039 4,473,009 0.07 313,111 93,933 407,044 43,010 0.55 23,655 3,548 27,204 434,247
2002 4,233,742 169,350 4,403,091 0.07 308,216 92,465 400,681 42,337 0.55 23,286 3,493 26,778 427,460
2003 4,194,147 167,766 4,361,913 0.07 305,334 91,600 396,934 41,941 0.55 23,068 3,460 26,528 423,462
2004 4,110,264 164,411 4,274,675 0.07 299,227 89,768 388,995 41,103 0.55 22,606 3,391 25,997 414,993
2005 4,028,059 161,122 4,189,181 0.07 293,243 87,973 381,216 40,281 0.55 22,154 3,323 25,477 406,693
Total 2003–2005 1,167,145 1,245,148
Total 2001–2005 1,974,870 2,106,855
AD Syringes
Year 1–15 Doses (1) Syringes Wastage (4%) Total $ per Unit $ Transport Total
AD syringes 4,719,000 4,719,000 4,719,000 188,760 4,907,760 0.07 343,543 103,063 446,606
Safety boxes 47,190 47,190 0.60 28,314 4,247 32,561
Total 479,167
Note: Transport based on 30% of cost for syringes and 15% of cost for safety boxes; UNICEF indicative prices used

47
Sterilizable Equipment
Capital Costs
Item Number Price Total ($) Transport Total R&M Total R&M/Year
Steam sterilizers, double rack 750600 1,000 107 107,000 16,050 123,050 21,400 144,450 4,280
Steam sterilizers, single 200 95 19,000 2,850 21,850 3,800 25,650 760
Kerosene stoves 100 10 1,000 150 1,150
Total 146,050 25,200 170,100 5,040
Note: R&M = repair and maintenance
Operating Costs per Year
Item Price Transport Total
Syringe, 5 ml 12,006 1,801 13,807
Syringe, 0.5 ml epi 26,243 3,936 30,179
Needles 7,500 1,125 8,625
Fuel 5,000
Hard water pad 3,000
TST 5,000
Total 57,611
Note: Based on cohort of 350,000
Yearly Costs
Item Year 1 Year 2 Year 3 Year 4 Year 5
Sterilization Equipment
Capital 146,050 146,050 146,050
Operating
Supplies 57,611 57,611 57,611 57,611 57,611
R&M 15,120 20,160 25,200 25,200 25,200
Subtotal 72,731 57,611 57,611 57,611 57,611
Total 218,781 203,661 203,661 57,611 57,611
AD syringes
Total 434,247 427,460 423,462 414,993 406,693
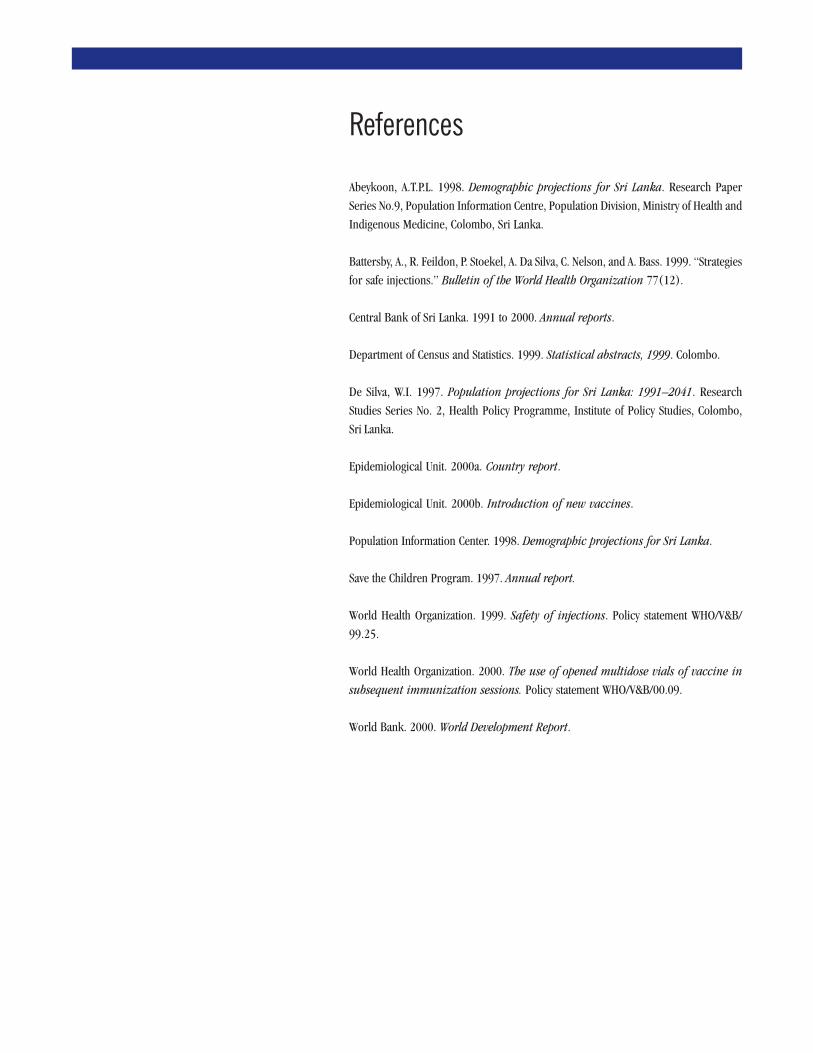
References
Abeykoon, A.T.P.L. 1998. Demographic projections for Sri Lanka. Research Paper
Series No.9, Population Information Centre, Population Division, Ministry of Health and
Indigenous Medicine, Colombo, Sri Lanka.
Battersby, A., R. Feildon, P. Stoekel, A. Da Silva, C. Nelson, and A. Bass. 1999. “Strategies
for safe injections.” Bulletin of the World Health Organization 77(12).
Central Bank of Sri Lanka. 1991 to 2000. Annual reports.
Department of Census and Statistics. 1999. Statistical abstracts, 1999. Colombo.
De Silva, W.I. 1997. Population projections for Sri Lanka: 1991–2041. Research
Studies Series No. 2, Health Policy Programme, Institute of Policy Studies, Colombo,
Sri Lanka.
Epidemiological Unit. 2000a. Country report.
Epidemiological Unit. 2000b. Introduction of new vaccines.
Population Information Center. 1998. Demographic projections for Sri Lanka.
Save the Children Program. 1997. Annual report.
World Health Organization. 1999. Safety of injections. Policy statement WHO/V&B/
99.25.
World Health Organization. 2000. The use of opened multidose vials of vaccine in
subsequent immunization sessions. Policy statement WHO/V&B/00.09.
World Bank. 2000. World Development Report.