Embed Size (px)
Citation preview

Operations Management Research, Volume 1, Number 2, December, 2008
1
EXPLORING THE FINANCIAL CONSEQUENCES OF THE
SERVITIZATION OF MANUFACTURING
Andy Neely - [email protected]
University of Cambridge and Cranfield School of Management
Institute for Manufacturing, University of Cambridge, Mill Lane, Cambridge, England, CB2 1RX
Operations Management Research, Volume 1, Number 2, December, 2008
2
EXPLORING THE FINANCIAL CONSEQUENCES OF THE
SERVITIZATION OF MANUFACTURING
ABSTRACT
Commentators suggest that to survive in developed economies manufacturing firms have to move
up the value chain, innovating and creating ever more sophisticated products and services, so they
do not have to compete on the basis of cost. While this strategy is proving increasingly popular with
policy makers and academics there is limited empirical evidence to explore the extent to which it is
being adopted in practice. And if so, what the impact of this servitization of manufacturing might
be. This paper seeks to fill a gap in the literature by presenting empirical evidence on the range and
extent of servitization. Data are drawn from the OSIRIS database on 10,028 firms incorporated in
25 different countries. The paper presents an analysis of these data which suggests that: [i]
manufacturing firms in developed economies are adopting a range of servitization strategies – 12
separate approaches to servitization are identified; [ii] these 12 categories can be used to extend the
traditional three options for servitization – product oriented Product-Service Systems, use oriented
Product-Service Systems and result oriented Product-Service Systems, by adding two new
categories “integration oriented Product-Service Systems” and “service oriented Product-Service
Systems”; [iii] while the manufacturing firms that have servitized are larger than traditional
manufacturing firms in terms of sales revenues, at the aggregate level they also generate lower
profits as a % of sales; [iv] these findings are moderated by firm size (measured in terms of
numbers of employees). In smaller firms servitization appears to payoff while in larger firms it
proves more problematic; and [v] there are some hidden risks associated with servitization – the
sample contains a greater proportion of bankrupt servitized firms than would be expected.
Operations Management Research, Volume 1, Number 2, December, 2008
3
Keywords:
Manufacturing, service, servitization, product-service systems, value added, globalisation,
international comparison
1. Introduction
How can manufacturing based in developed countries compete in today’s global economic system?
Data suggest that US manufacturers have to cut the costs of their products by 30% to compete with
Chinese producers (Wu et al., 2006). Add to this the market opportunities offered by emerging
economies and the burgeoning regulation and legislation imposed on firms based in the European
Union, and it is little surprise that offshoring is becoming a key strategy for manufacturing firms.
Is this process of offshoring an inevitable one? Is it simply a consequence of globalisation
and the industrialisation of emerging economies (Friedman, 2005)? If so, what future does
manufacturing have in the US, the UK, or in any other developed economy, for that matter.
Already over 80% of people employed in the UK and the US are now employed in the service
sector (Spohrer and Maglio, 2008). Should developed economies abandon manufacturing and
accept that the former British Prime Minister Margaret Thatcher was right all those years ago when
she claimed that developed economies could live on services?
The problem with headline grabbing figures such as these is that they mask the real trends
that underlie the data. In fact the boundaries between manufacturing and service firms are breaking
down across the globe. As they have been for years. Rolls-Royce Aerospace no longer simply sells
aero engines. Now it offers a total care package, where customers buy the capability the engines
deliver – “power by the hour”. Rolls-Royce retains responsibility for risk and maintenance,
generating revenues by making the engine available for use. But even before Rolls-Royce changed
its business model and adopted “power by the hour”, the firm still used to sell spares and offer
repair and overhaul services. Indeed one could legitimately ask whether Rolls-Royce – or any
Operations Management Research, Volume 1, Number 2, December, 2008
4
similar manufacturing firm – has ever been a pure manufacturing firm. If the business has always
sold spares and offered repair and overhaul services then it has always offered a combination of
product and service. Similar examples can be drawn from a wide variety of sectors. Some
traditional manufacturing firms, such as IBM, have fundamentally reinvented themselves as service
businesses, moving away from the production of hardware to offer business solutions. Yet others
have integrated service operations with traditional manufacturing. BP and Shell both manufacture
oil, yet they also both run extensive service retail operations.
The point is that to survive manufacturing firms appear rarely to remain as pure
manufacturing firms. Instead they move beyond manufacturing and offer services and solutions,
often delivered through their products, or at least in association with them. This trend to
servitization was first discussed by Vandermerwe and Rada in the late 1980s, but appears to have
received relatively little attention in the mainstream engineering and management literatures
(Baines et al., 2007; Tukker and Tischner, 2006; Vandermerwe and Rada, 1988). Clearly there are
notable exceptions (Davies et al., 2006; Tukker and van Halen, 2003), but these exceptions are
generally based on case evidence and many of them focus on the potential environmental benefits
of product-service systems as oppose to their commercial advantages (Cook et al., 2006; Goedkoop
et al., 1999; Manzini and Verzzoli, 2002; Mont and Plepys, 2003; Mont, 2004; and Morelli, 2002).
Increasingly new technologies, especially those associated with information and communications
technologies are becoming an important enabler of servitization. Developments – especially in data
capture and information processing – allow manufacturing firms to develop new business models,
exploiting the potential of informated products. Concepts such as intelligent vehicle health
management (IVHM) and remote product sensing have entered the management lexicon (Baroth et
al., 2001). It is for these reasons that servitization should not simply be seen as a variant of vertical
integration, although clearly one way of adding services is through vertical integration. Hence the

Operations Management Research, Volume 1, Number 2, December, 2008
5
calls in the business strategy literature for manufacturing firms to go downstream (Wise and
Baumgartner, 1999).
Despite all of the discussion about the importance of servitization there is remarkably little
empirical evidence that explores the phenomenon. It is this gap in the literature which this paper
seeks to address, by presenting an empirical analysis of the servitization of manufacturing. The
paper seeks to explore questions such as: to what extent are manufacturing firms servitizing? If
they are servitizing, how are they servitizing and do the observed trends vary depending on firm
size and/or country of firm incorporation? The contribution of the paper lies in the fact that it is one
of the first to unpack the notion of servitization empirically.
2. Theoretical Background: Dimensions of Servitization
The notion of servitization was first introduced by Vandermerwe and Rada in the late 1980s
(Vandermerwe and Rada, 1988). They argued that there were three reasons why manufacturing
firms should servitize – (i) to lock out competitors; (ii) to lock in customers and (iii) to increase the
level of differentiation. In additional to these strategic rationales for servitization, other authors
have posed economic and environmental rationales (Goedkoop et al., 1999; Wise and Baumgartner,
1999). One particularly strong rationale for firms that provide complex engineered products is the
installed base argument, where ratios of installed-base-to-new-units of 13 to 1 for automobiles, 15
to 1 for civil aircraft and 22 to 1 for locomotives are quoted (Wise and Baumgartner, 1999). Clearly
with such market structures, especially when product life cycles have extended, it makes economic
sense to the manufacturer of the original equipment to offer through life support and servicing. An
alternative rationale is provided – especially from a customer perspective – when one considers risk
(Slack, 2005). Governments across the world are now declaring that they will contract for capability
rather than buy specific products (Ministry of Defence, 2005). The UK defence industrial strategy
makes it clear that the Ministry of Defence is interested in procuring the capability to carry out
Operations Management Research, Volume 1, Number 2, December, 2008
6
operations, rather than the physical equipment itself. Hence the growth in outsourced support
services offered by firms such as BAe and Rolls-Royce. As Slack (2005) points out, this trend has
advantages for both suppliers and customers. From a supplier perspective, servitization of a way of
increasing sales revenues, while from a customer perspective servitization offers a route of reducing
risk and decreasing or a least stabilising and making predictable maintenance and support costs.
In parallel to the discussions in the management and economics literature, the environmental
literature has alighted on servitization as a route to increase environmental performance (Goedkoop
et al., 1999). The core thesis is that it is possible to reduce the adverse environmental impact of
products if firms change their business models and customers revise their conceptions of ownership.
An oft quoted illustration is the rented washing machine. Customers no longer buy washing
machines, but instead they rent them and pay a fixed fee per washing cycle. The revised business
model means that it is in the customers’ interest to minimise the number of washes they undertake –
they pay less as a consequence. It is also in the provider’s interest to maximise the product lifecycle.
Once the machine is installed the provider does not want to have to undertake any maintenance.
This revised business model changes the incentives for both the customer and provider –
encouraging both parties to pursue courses of action that minimise the environmental impact of the
product (Mont and Plepys, 2003; Mont, 2004).
At a more abstract and theoretical level each of these rationales for servitization – strategic,
economic and environmental - can be linked back to the basics of competitive strategy, in general,
and the Porter’s five forces in particular (Porter, 1980). Servitization is seen by many as one of the
best ways of manufacturing firms in developed economies addressing the five forces that influence
an industry’s dynamics and its inherent profitability (Porter and Ketels, 2003). It is for these
reasons that authors have been exhorting manufacturing firms to “go downstream” and “capture the
value of supplementary services” (Anderson and Narus, 1995; Wise and Baumgartner, 1999).
Operations Management Research, Volume 1, Number 2, December, 2008
7
In the future these calls are likely to grow louder, not least because the convergence of data
availability and information processing technology opens up radical new business opportunities to
manufacturers. This convergence is aptly illustrated by Sir John Rose, Chief Executive of Rolls-
Royce, who explains how the Rolls-Royce TotalCare service offering works:
“With the real-time data we receive via satellites, we can identify an ‘event’ and our
engineers can make remote diagnoses. Under normal circumstances, after an engine gets
hit by lightning you would have to land the plane, call in an engineer, do a visual
inspection, and make a decision about how much damage might have been done and
whether the plane has to be delayed in order to do a repair. But remember, these airlines
do not have much turnaround time. If this plane is delayed, you throw off the crews, you
drop out of your position to fly back home. It gets very costly. We can monitor and
analyse engine performance automatically in real time, with our engineers making
decisions about exactly what is needed by the time the plane has landed. And if we can
determine by all the information we have about the engine that no intervention or even
inspection is needed, the airplane can return on schedule, and that saves our customers
time and money” – quoted in Friedman, pp 199-200 (Friedman, 2005).
New business models for manufacturers, where the operational capability delivered is underpinned
by data collection and information processing capabilities, as well as changed notions of ownership
and asset management, have massive implications for many of the traditional operations
management frameworks and philosophies. Where, in the strategy frameworks, for example, do we
take account of risk and asset ownership? To what extent have members of the management
community paid attention to questions of business model and incentive design and the implications
of these for customer behaviour?
Operations Management Research, Volume 1, Number 2, December, 2008
8
3. Research Methodology
As the previous section shows, while there has been some discussion of the servitization of
manufacturing, there is a paucity of empirical research concerning the phenomenon and that which
does exist raises the question of a service paradox, namely that it appears more difficult for firms to
make incremental profits by adding services than might be expected (Gebauer et al., 2005; Reinartz
and Ulaga, 2008). To address these issues the current study seeks to explore empirically the
phenomenon of servitization. The data used in the study is drawn from the OSIRIS database which
contains financial data for 44,000 publicly listed companies from around the world. Data were
downloaded from the database in the first week of January 2007. The initial search involved
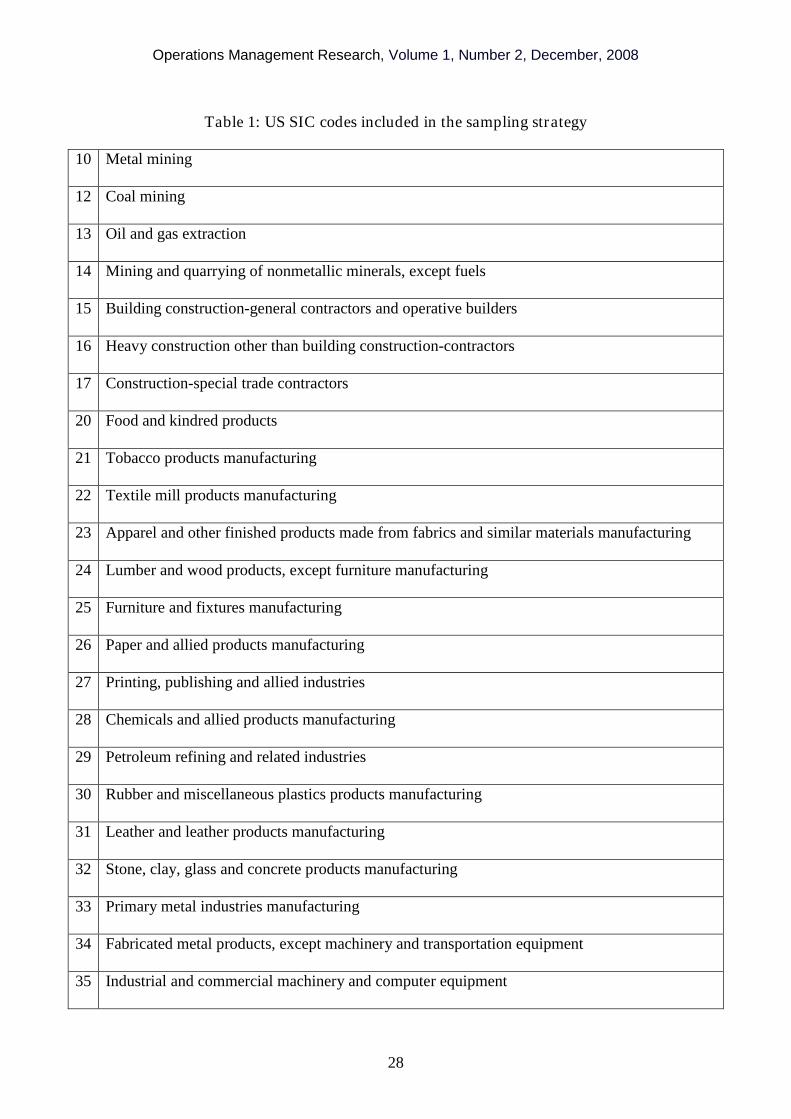
identifying all companies with primary or secondary US SIC codes in the range 10-39 inclusive,
effectively all of the SIC codes relating to manufacturing firms (see Table 1). This search resulted
in the identification of 22,952 companies. The second search involved adding a control from
company size. Only companies with over 100 employees were included in the sample. This resulted
in the sample being reduced to 12,521 companies.
Insert Table 1 around here
In essence a ground theory approach was taken to the coding of the data (Glasser and Strauss,
1967). The coding was carried out manually by a single coder. The OSIRIS dataset contains a field
“description and history” for each firm. This field includes a text based description of the firm,
detailing its history and main activities. The coder reviewed the descriptions of each of the first 50
firms in the dataset, seeking to identify words or phrases that could be used to establish whether the
firms were “pure manufacturers”, “servitized manufacturers” or “pure service”. The distinguishing
Operations Management Research, Volume 1, Number 2, December, 2008
9
words and phrases were documented in a code book which was used subsequently to categorise all
of the firms in the sample.
Appendix A contains several examples of the business descriptions included in the OSIRIS
database. Three examples will illustrate the coding process used. The first is provided by Siemens.
The business description for Siemens states “Siemens is a German based multinational corporation
with a balanced business portfolio of activities predominantly in the field of electronics and
electrical engineering” suggesting that Siemens manufactures electronics. Hence Siemens has a
manufacturing element to its business. The business description continues, however, by saying that
one of Siemens business units – ICN - “develops, manufactures and sells public communication
systems, private business communication systems and related software, and provides a wide variety
of consulting, maintenance and other services”. Hence it is clear that as well as manufacturing
products, Simens also offers accompanying services. Hence Siemens is classified as a servitized
firm.
The Siemens example can be contrasted with PetroChina – another of the firms included in the
dataset. PetroChina’s business description says that the firm is “principally engaged in a broad
range of petroleum and natural gas-related activities” and hence PetroChina is classified as a pure
manufacturing firm. Interestingly, despite the fact that all of the firms selected had been assigned a
primary SIC code that related to manufacturing, some firms have clearly been allocated the wrong
SIC code. For example, The Brink’s Company, another firm in the dataset is described as follows:
“The Brink’s Company, conducts business in the security industry. The services
offered by the Company include armoured-car transportation, automated teller machine
(ATM) servicing, currency and deposit processing, coin sorting and wrapping, and
arranging the secure air transportation of valuables”.
Operations Management Research, Volume 1, Number 2, December, 2008
10
The Brink’s Company is clearly a service firm that has been misallocated a manufacturing
related SIC code. For the purposes of this study, such firms are classified as pure service
firms and omitted from the analysis.
During the manual coding process the coder developed a codebook of words and phrases
used in the business descriptions. Frequently mentioned services included: consulting services;
design and development services; financial services; installation and implementation services;
leasing services; maintenance and support services; outsourcing and operating services;
procurement services; property and real estate; retail and distribution services; systems and
solutions; and transportation and trucking services.
Of course these 12 services are essentially pragmatic in their description. They reflect the
language that business uses to describe its range of activities, so it is worth reflecting on how well
they map onto the extant literature. Much of the servitization literature makes an important, albeit
usually implicit distinction between four concepts: (i) the product-service system, (ii) servitization,
(iii) the servitized organisation that supports the product-service system and (iv) the global value
system that supports the product-service system. At a more detailed level these four concepts can be
defined as1:
A Product-Service System is an integrated product and service offering that delivers value in
use.
Servitization involves the innovation of an organisation’s capabilities and processes so that it
can better create mutual value through a shift from selling product to selling Product-Service
Systems.
Operations Management Research, Volume 1, Number 2, December, 2008
11
A Servitized Organisation designs, builds and delivers one or more integrated product and
service offerings that deliver value in use.
The Global Value System is the globally distributed network of suppliers, customer and partners
who have to co-operate to ensure that integrated product and service offerings deliver value in
use.
Traditionally three different forms of Product-Service System have been discussed product oriented
PSS, use oriented PSS and result oriented PSS (Hockerts and Weaver, 2002). In product oriented
Product-Service Systems ownership of the tangible product is transferred to the customer, but
additional services directly related to the product are provided by the manufacturer. For use oriented
Product-Service Systems ownership of the tangible product is retained by the service provider, who
sells the functions of the product, via modified distribution and payment systems, such as sharing,
pooling, and leasing. While in result oriented Product-Service Systems, the PSS replaces services
for products – e.g. voicemail service replacing answering machines.
Some of the 12 pragmatic types of service identified above map clearly onto these three
categories of Product-Service System, e.g. design and development services; installation and
implementation services; and maintenance and support services map onto product-oriented PSS, but
it appears that an extension of the classification scheme is required to fully represent the range of
servitization strategies being pursued by firms. This extension involves adding two new categories –
“integration oriented PSS” and “service oriented PSS”. Integration oriented PSS result when firms
seek to add services by going downstream and vertically integrating. Service oriented PSS result
when firms add services to products, by integrating those services into the product, e.g. Intelligent
1 With thanks to my colleagues at Cranfield University who helped develop the first three of these definitions throughthe IMRC sponsored Ideas Factories.
Operations Management Research, Volume 1, Number 2, December, 2008
12
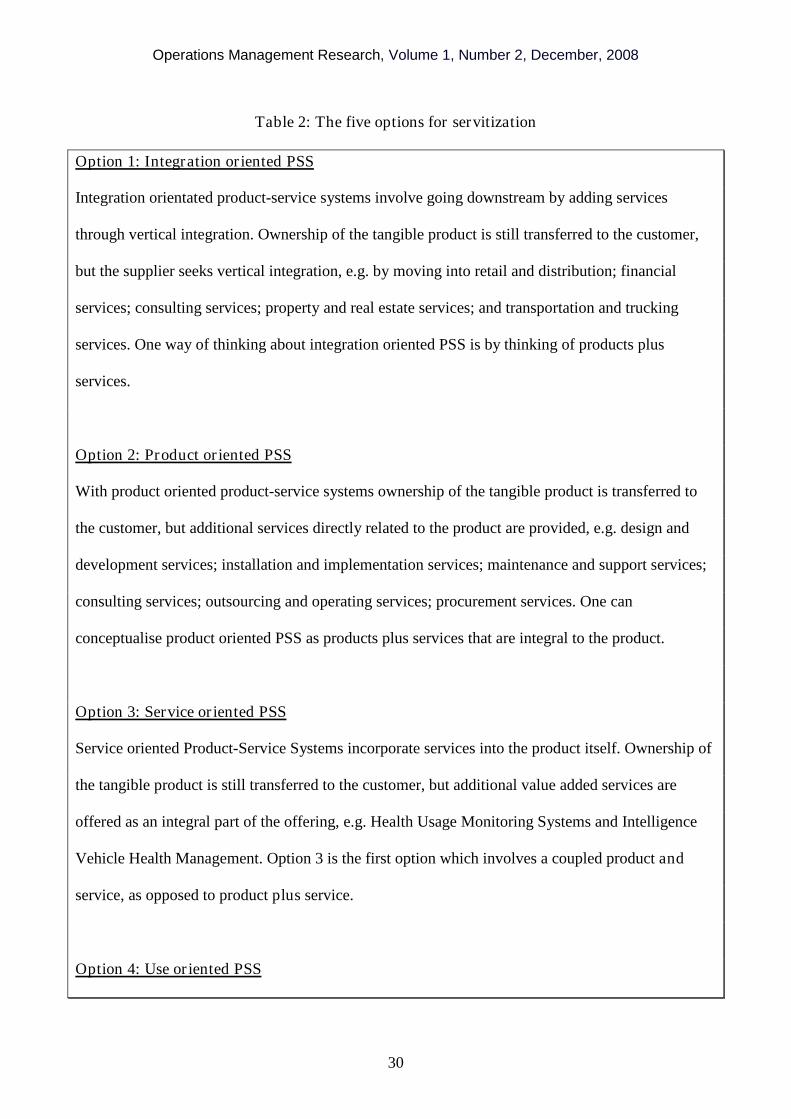
Vehicle Health Monitoring services. Table 2 shows this extended categorisation framework, which
identifies five options for servitization, an important contribution of this paper.
Insert Table 2 around here
To prosecute the coding the researcher had to return to the pragmatic descriptions used by the
businesses in their descriptions rather than the more theoretical classification shown in Table 2.
Using the 12 sets of terms and phrases identified through the grounded theory approach [and their
variants as keywords] an automated coding process was developed using the Excel SEARCH
function. Strings of words that identified whether firms offered specific services – e.g.
IF(ISNUMBER(SEARCH("consult*",$D4)),1,0) – were developed and used to automatically code
the first 50 firms that had been manually coded previously.
To check the effectiveness of the automated coding process a comparison between the
manual coding and the automated coding was carried out. Every discrepancy was examined and the
reason for it identified. This process resulted in some modifications to the search strings, with
additional phrases being introduced as appropriate. At the end of this process 96 coding
discrepancies between the original manual coding and the automated coding remained [12.8% of
total codings]. 57.3% of these were due to errors in the original manual coding, leaving 5.5%
coding errors caused by the automatic process. Further modification of the search strings made the
coding errors increase, so at this the search strings were frozen and applied to the entire data set.
A conservative approach to coding was adopted. All firms were automatically classified as
pure manufacturing firms unless there was clear evidence that they should be classified either as
servitized firms or pure service firms.
Operations Management Research, Volume 1, Number 2, December, 2008
13
Having completed the automatic coding a random sample of firms was selected and the
codings reviewed. No significant miscodings were identified at this stage, so the coded data were
imported into STATA for further statistical analysis.
4. The Extent and Impact of Servitization
As mentioned previously the initial sample consisted of 12,521 firms. However for 1,478 firms
there was no business descripation and hence the firms could not be coded. Additionally 197 firms
were classified as pure service firms and were hence irrelevant for this phase of the research. 212 of
the remaining 10,846 firms had also declared bankruptcy. Once these three groups are eliminated
from the original sample – those with no description, those classified as pure service and those that
have declared bankruptcy, the remaining usable sample consists of 10,634 firms. Despite the fact
that all of these firms were classified as manufacturing, in terms of their primary SIC codes, 3,196
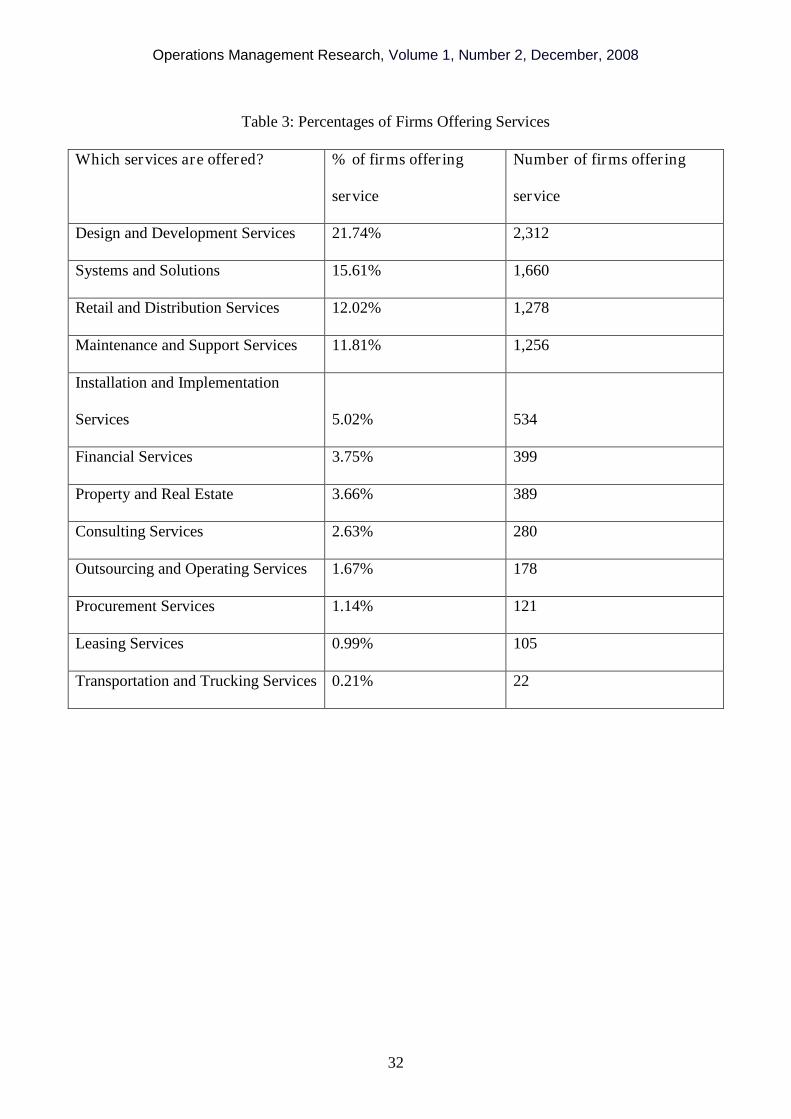
(30.05%) of them had servitized. A more detailed breakdown is provided in Table 3, which
highlights that the most common service offerings include design and development services
[21.74%], followed by systems and solutions [15.61%], retail and distribution [12.02%] and
maintenance and support [11.81%].
Insert Table 3 around here
Interestingly of those 212 firms that had declared bankruptcy, 113 (53.3%) had servitized, while 99
(46.7%) were pure manufacturing firms. As stated previously, the sample as a whole consisted of
30.05% servitized firms and 69.95% pure manufacturing firms. Hence considerably more of the
servitized firms had declared bankruptcy than might be expected, suggesting that the transition from
a manufacturing firm to a servitized firm might be problematic. In some ways this is not surprising
as increased diversification – moving to product and service offerings – might hold some significant
Operations Management Research, Volume 1, Number 2, December, 2008
14
challenges for firms, not least because of the increased investment required and changed risk
profile. Of course, an alternative explanation is that manufacturing firms already in financial
difficulties might chose to servitize in an attempt to escape from their problems. Hence they are
more likely to go bankrupt, even before embarking on a strategy of servitization. A more detailed
study of the stories behind the bankrupt firms will be necessary to establish whether either of these
hypotheses are valid.
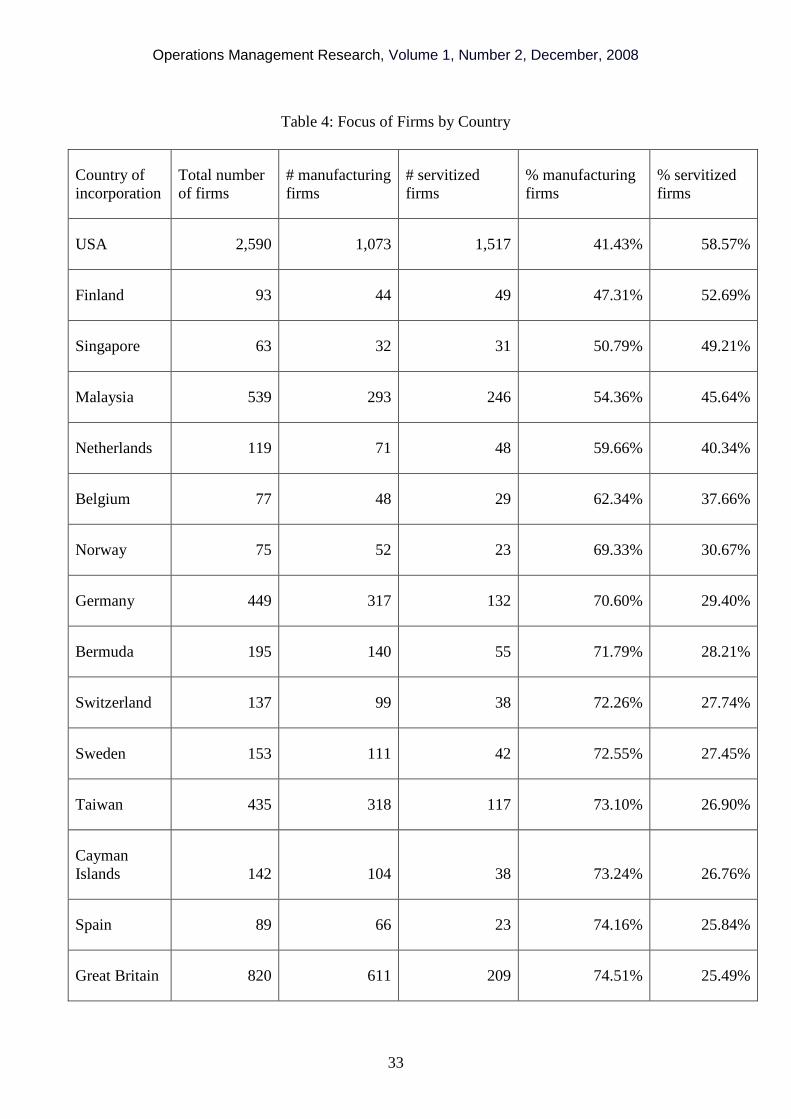
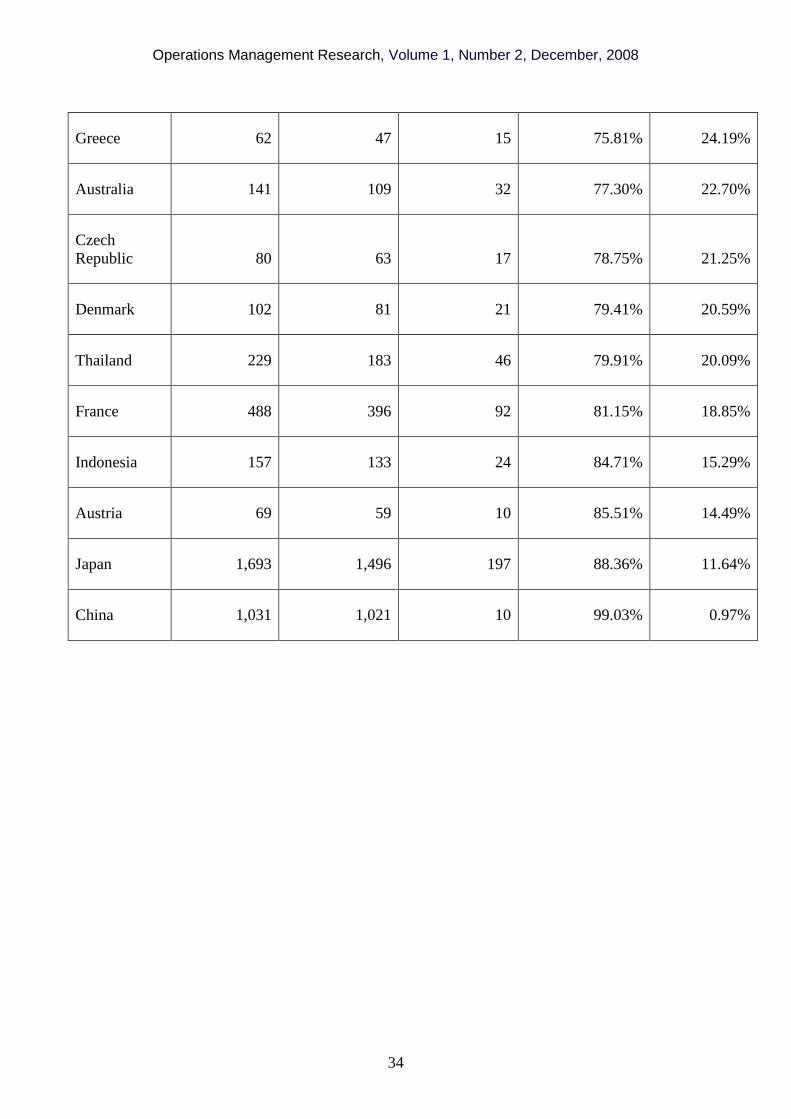
Of the usable sample of 10,634 firms, 10,028 firms were incorporated in just 25 countries.
Table 4 shows the spread. Countries with less than 60 firms were excluded from the analysis.
Insert Table 4 around here
The data in Table 4 shows some interesting patterns, with the United States (59%); Finland (53%),
Singapore (49%), Malaysia (46%) and the Netherlands (40%) having a higher number of servitized
firms than other countries. Perhaps, not surprisingly given its recent rate of development, China is
the country with the highest number of manufacturing only firms (99%). It is also possible to
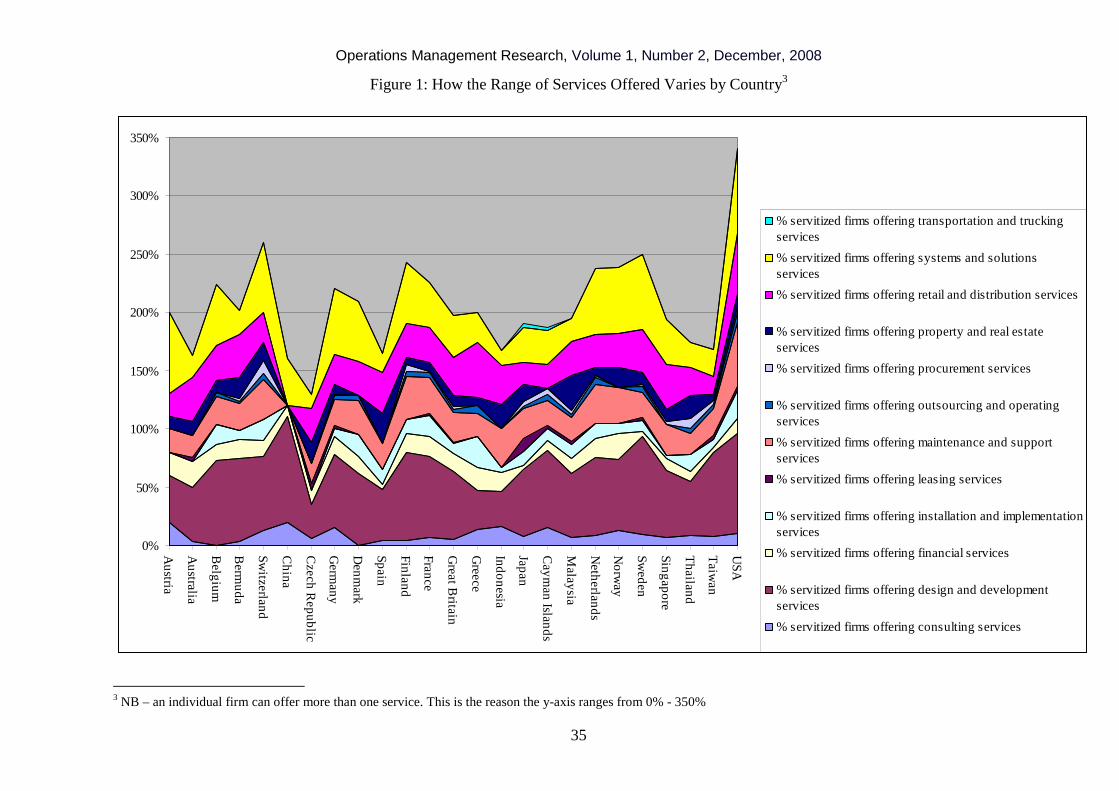
analyse the countries by the 12 forms of servitization presented in Table 3. Figure 1 shows the
resultant analysis, which highlights the propensity of servitized firms to offer different services in
different countries. There are two particularly noteworthy points about the data shown in Figure 3.
First, the variation in average numbers of services offered by firms across the different countries,
ranging from close to 3 different services per firm in the US, to less than 1.5 in the Czech Republic.
Second there are some areas of service offering that appear universally – e.g. design and
development services – while others appear to be particularly prevalent in specific countries – e.g.
systems and solutions services in Sweden, Finland and Germany. While this is not surprising given
the industrial heritage of these countries, it does raise the question should firms in other developed
economies broaden the range of services they offer?
Operations Management Research, Volume 1, Number 2, December, 2008
15
Insert Figure 1 around here
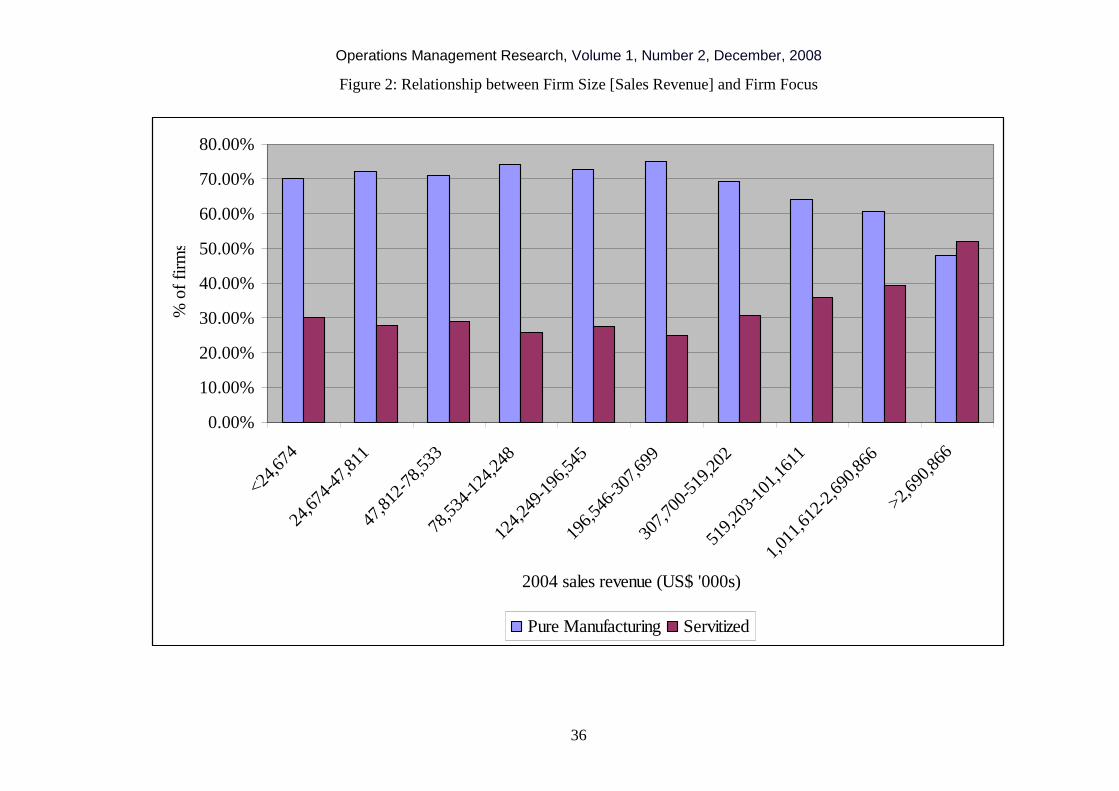
In terms of descriptive statistics there are various other ways in which the data can be cut. Figure 2
shows a breakdown by firm size, measured in terms of 2004 sales revenues2. 2004 was chosen as
the initial year for analysis as this was the most complete year with data being available for 7,836 of
the 10,028 firms in the sample. The data show that it is only in the top decile [measured in terms of
sales revenues] that the number of servitized firms is greater than the number of pure manufacturing
firms. This distribution results in an important statistic, for while only 32.27% of the sample have
servitized, these firms account for 55.46% of 2004 sales revenues. In all other deciles [measured in
terms of sales revenues] the majority of firms concentrate on pure manufacturing. This has
important implications for the question of servitization. Is servitization a strategy that only larger
firms are pursuing or can afford to pursue? If so, how do the first, second and third tier suppliers
support larger firms in their efforts to servitize? Clearly some smaller firms are seeking to servitize,
for in all deciles roughly one third of firms have servitized, but it appears that servitization is not yet
a majority phenomenon for manufacturing firms of all sizes.
Insert Figure 2 around here
Clearly sales revenues is one way of exploring the data, but a more interesting question is what
level of profitability do servitized manufacturing firms achieve. Profitability and sales revenue
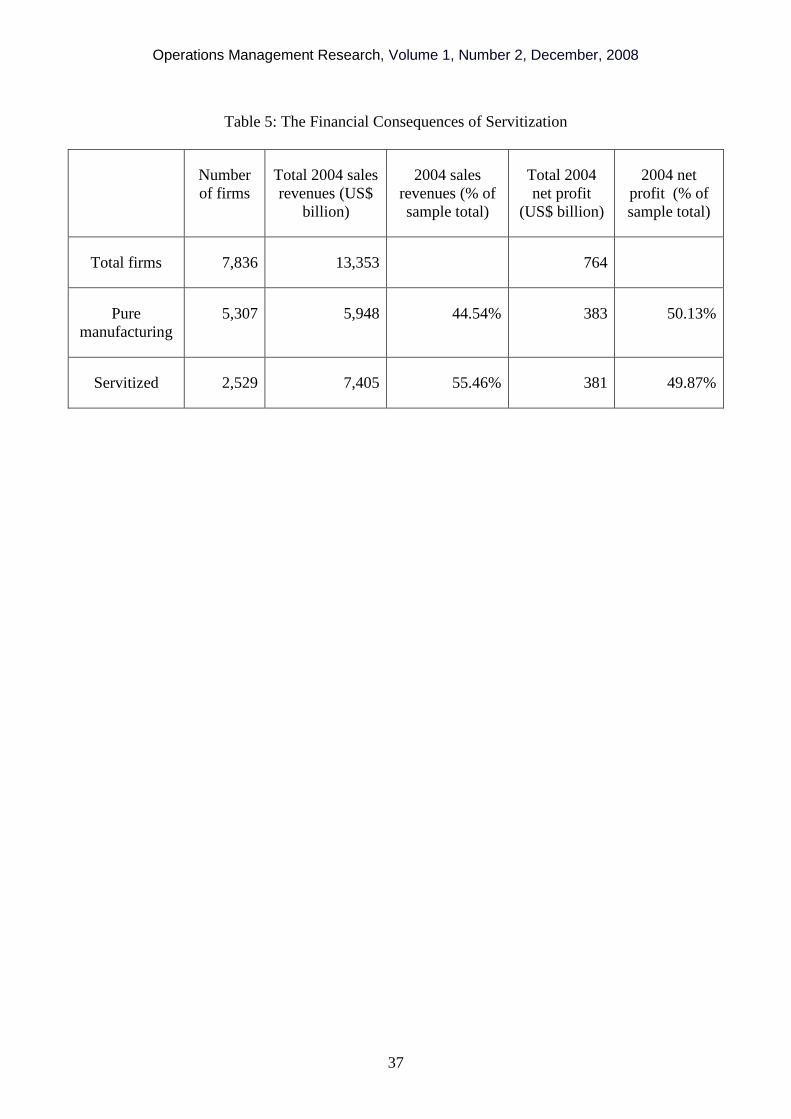
figures are available for 7,836 firms in 2004. Table 5 provides summary statistics for these two
variables, categorised in terms of whether or not the firms concerned have servitized. As can be
seen from Table 5, the servitized firms account for 55.46% of 2004 sales revenues, but only 49.87%
2 Analysis using employee numbers as a proxy for firm size reveals the same result.
Operations Management Research, Volume 1, Number 2, December, 2008
16
of 2004 net profit. This implies that while servitized firms are generally larger in terms of sales
revenues (US$ 7,405 billion versus US$ 5,948 billion), they are also collectively less profitable than
pure manufacturing firms (US$ 381 billion versus US$ 383 billion). Of course averages hide
significant variations, so the remainder of this paper turns to the apparent servitization paradox –
why are servitized firms generating higher revenues, but delivering lower profits than pure
manufacturing firms.
Insert Table 5 around here
5. Exploring the Paradox of Servitization
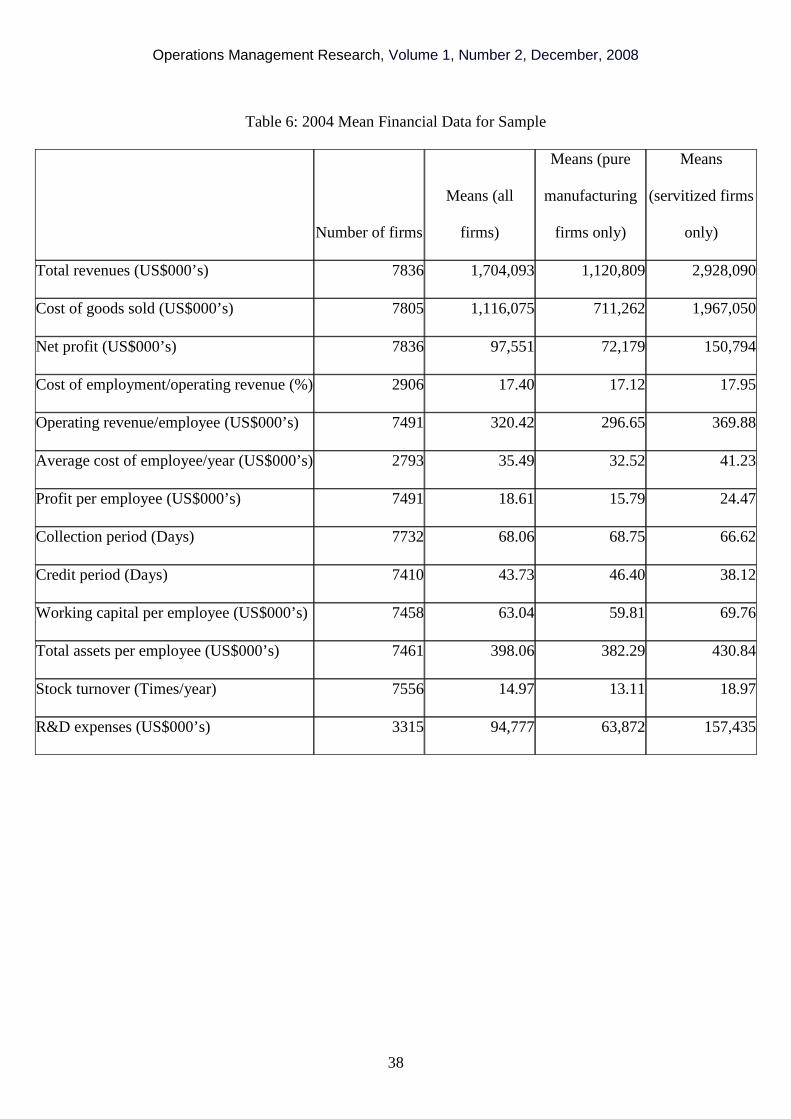
Table 6 presents average financial data for the sample, comparing the cost base of the servitized and
pure manufacturing firms. The data show that while the average servitized firm generates total sales
revenues of US$ 2.9 billion, it only generates a net profit of US$ 150 million, giving a net profit as
a % of total sales revenues of 5.17%. This contrasts with a pure manufacturing firm, which on
average generates total revenues of US$ 1.12 billion, with a net profit of US$ 72 million, giving a
net profit as a % of total revenue 6.43%.
Insert Table 6 around here
Of the variables listed in Table 6 there are several that are particularly marked, with the
most significant being the cost of goods sold (US$ 1.97 billion for servitized firms versus US$ 711
million for the pure manufacturers). Why should the cost of goods sold be so much higher for the
servitized firms? It is important to remember that the servitized firms are larger than pure
manufacturing firms (as previously discussed). Hence it would be more appropriate to talk in terms
of cost of goods sold as a % of total sales revenues. This perspective eliminates the apparent
Operations Management Research, Volume 1, Number 2, December, 2008
17
difference between the pure manufacturing and the servizited firms. The cost of goods sold as a %
of total revenues for the pure manufacturing firms is 63.46%, while for the servitized firms it is
67.18%.
So what are the substantive differences between the pure manufacturing firms and the
servitized firms according to the data in Table 6. First, employment costs are lower in pure
manufacturing firms (US$32,520/employee) than in the servitized firms (US$41,230/employee),
although operating revenues per employee are higher in servitized firms (US$370,000/employee),
than in the pure manufacturing firms (US$297,000/employee). Second the working capital per
employee is lower in pure manufacturing firms (US$59,800/employee) than in the servitized firms
(US$69,800/employee). Third the total assets per employee are lower in pure manufacturing firms
(US$382,000/employee) than in the servitized firms (US$431,000/employee). Taken together it
appears that the reasons net profits as a % of revenues are lower in the servitized firms is that their
cost per employee is higher, as is their working capital and the net asset base. In some ways this is
not surprising. Staff who can offer consultancy services and/or design complex systems and
solutions are likely to be more expensive than staff who have a narrower set of skills and work
solely in a manufacturing plant. Offering additional services will require additional assets and hence
working capital. The more concerning fact is that firms appear unable to recoup the additional value
that might be expected following the investments they have to make to move to a position where
they can offer a combination of product and service.
Of course, as already stated the aggregated data hide significant variations and so it is also
worth exploring these data at a more disaggregated level. Of particular interest is whether the
observed patterns vary either by firm size and/or range of servitization – both of which bring into
play questions of economies and dis-economies of scale. If, as the data, suggest servitizing requires
incremental investment in staff (hiring more expensive people hence the observed increase in
employment costs) and capital (hence the observed increases in net assets and working capital) then
Operations Management Research, Volume 1, Number 2, December, 2008
18
one could argue that: (i) larger firms would be more likely to be able to carry and profit from this
incremental investment – an economies of scale argument; while the range of servitization would
increase the requirement for incremental investment (a dis-economies of scale argument).
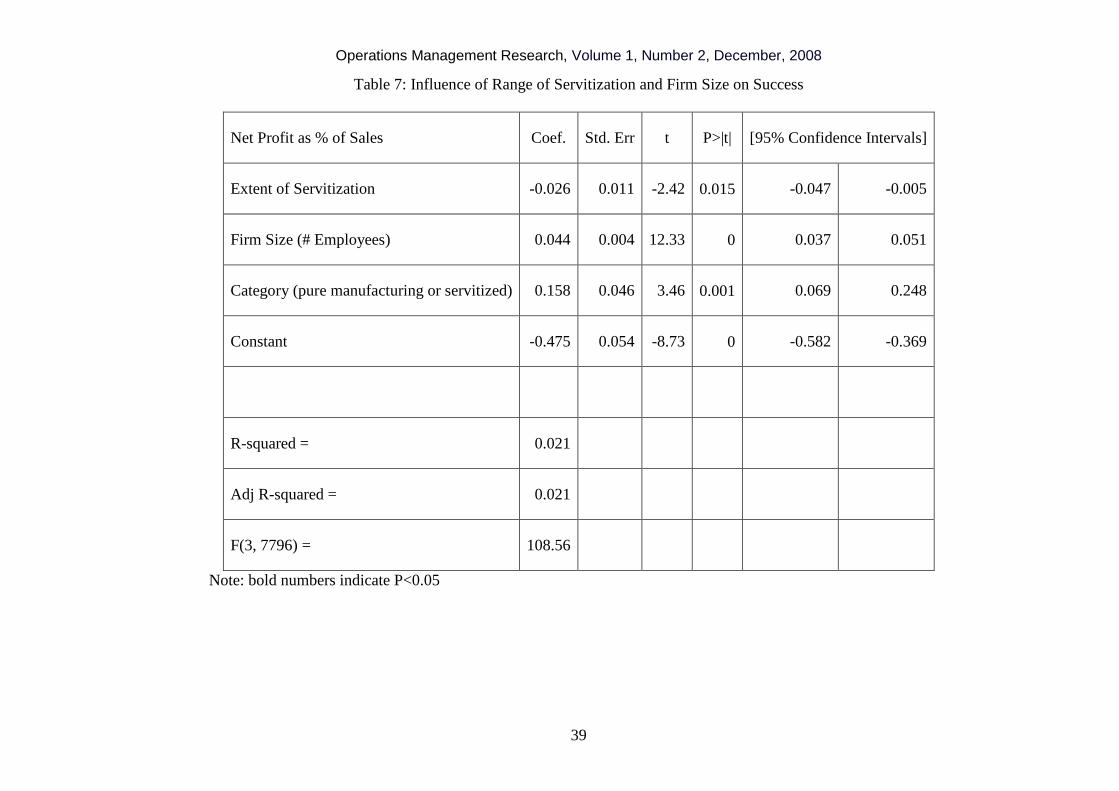
To explore this issue a regression analysis is used, where net profit as a % of sales revenues
is the dependent variable, while extent of servitization and size of firm are the independent
variables. To calculate the extent of servitization a simple classification is used, namely the number
of different categories of services offered by each firm from the list of 12 services in Table 3. The
range is from 0 (for pure manufacturing) to 9 different services. Firm size is measured in terms of
numbers of employees. The reason for this is that the dependent variable used in this analysis is
2004 net profit as a % of 2004 sales revenues. Categorising size in terms of number of employees
rather than sales revenues maintains some independence between the variables, although clearly
there is a relationship between a firm’s sales revenue and the number of people it employs. The
extremes of the data set have also been cropped for this stage of the analysis. This involves
dropping any firms from the analysis where net profit as a % of sales revenue is either greater than
20% or less than -20% (hence the sample size of n=7,800). Table 7 summarises the resultant
regression.
Insert Table 7 around here
As can be seen from the regression equation, it appears that the extent of servitization (measured in
terms of the number of services offered) has a negative impact on 2004 net profit as a % of 2004
sales revenues, while the decision to servitize (at least to some degree) and the size of the firm
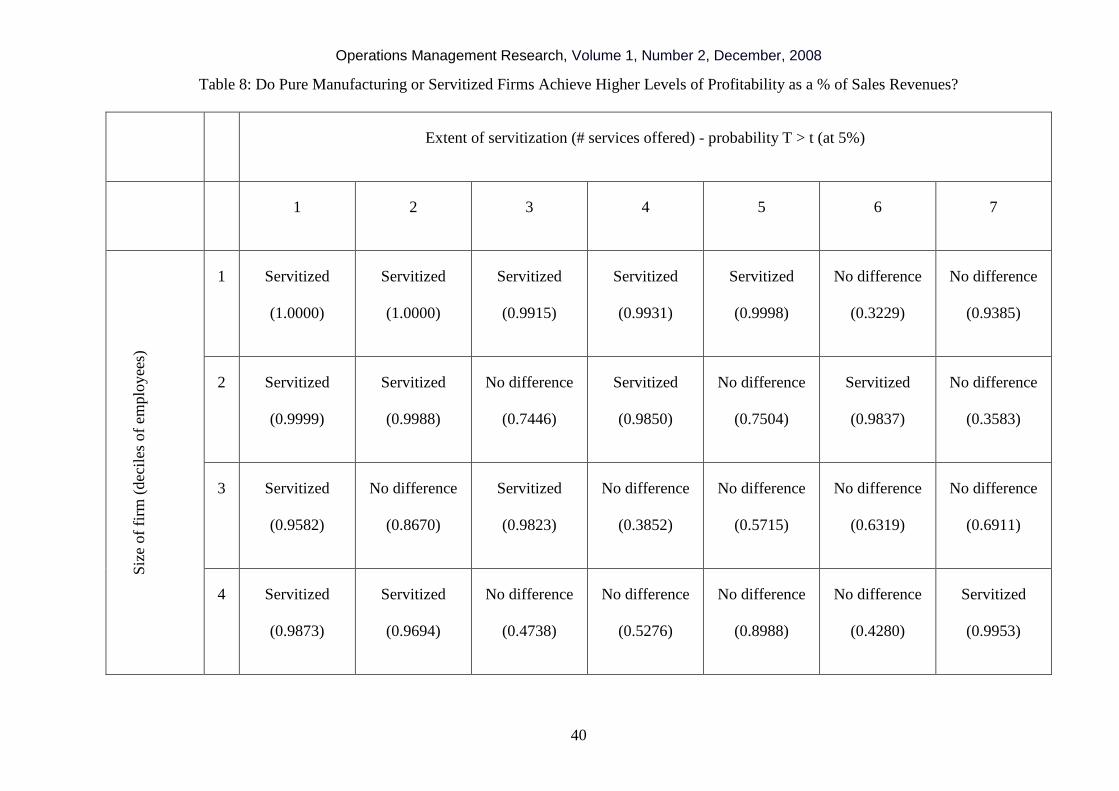
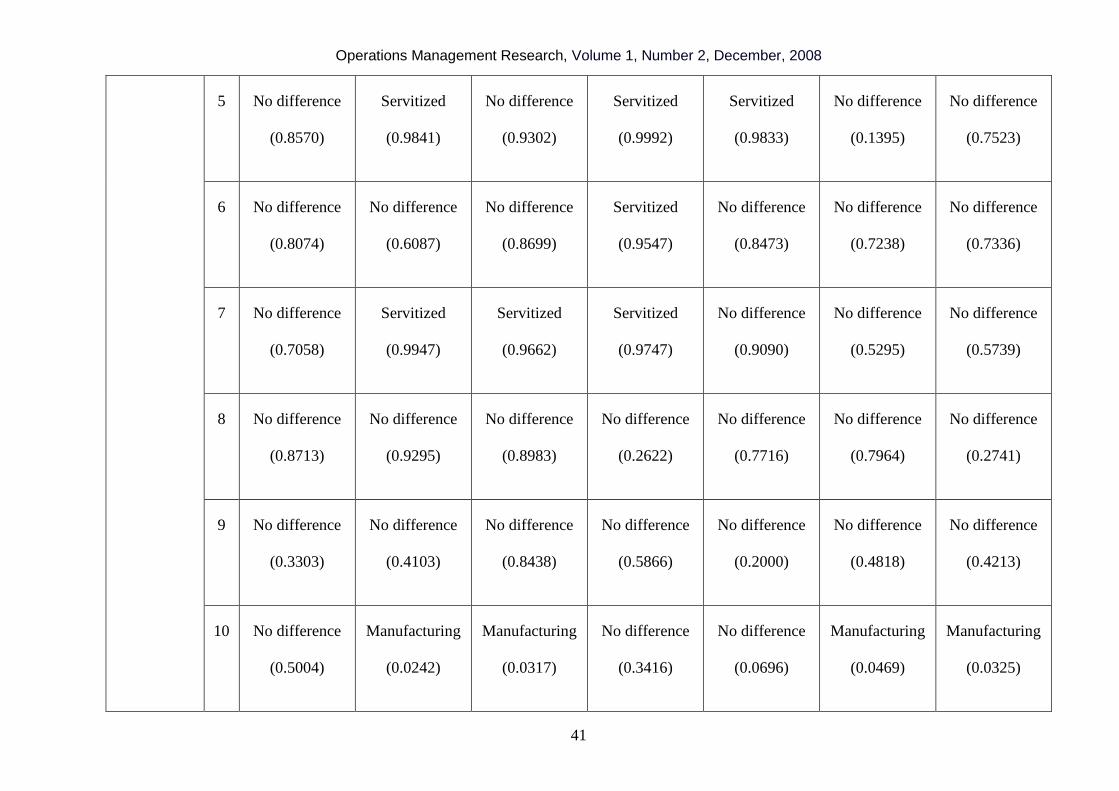
(measured in terms of numbers of employees) both have a positive impact. Table 8 explores these
relationships in more detail, breaking down the sample into deciles of employees and the extent of
servitization. As Table 8 shows the decision to servitize (for smaller firms – up to 3000 employees)
Operations Management Research, Volume 1, Number 2, December, 2008
19
is statistically significantly associated with higher net profits as a % of sales revenues, but this
effect reverses for the largest firms (where in 4 out of 7 cases the pure manufacturing firms achieve
statistically significantly higher net profits as a % of sales revenues than do the servitized firms).
Insert table 8 around here
This finding increases in importance when one considers that it is only in the largest decile of firms
that the number of servitized firms outweighs the number of pure manufacturing firms. The data
suggest that those smaller firms that have not yet servitized might benefit by adding services, yet
calls into question how easy it is for larger firms to benefit. Of course this does not mean that
servitizing is the wrong strategy for larger firms. The findings merely suggest that larger firms
appear to find it difficult to achieve the financial benefits of servitization that might be expected.
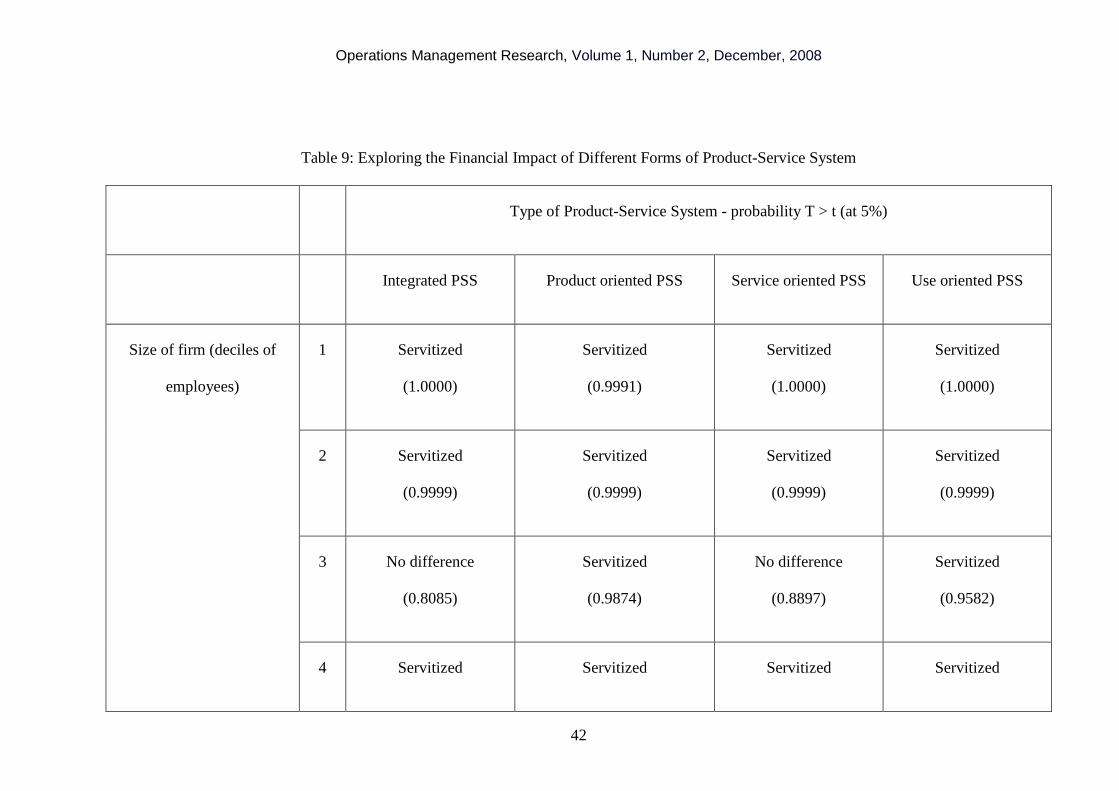
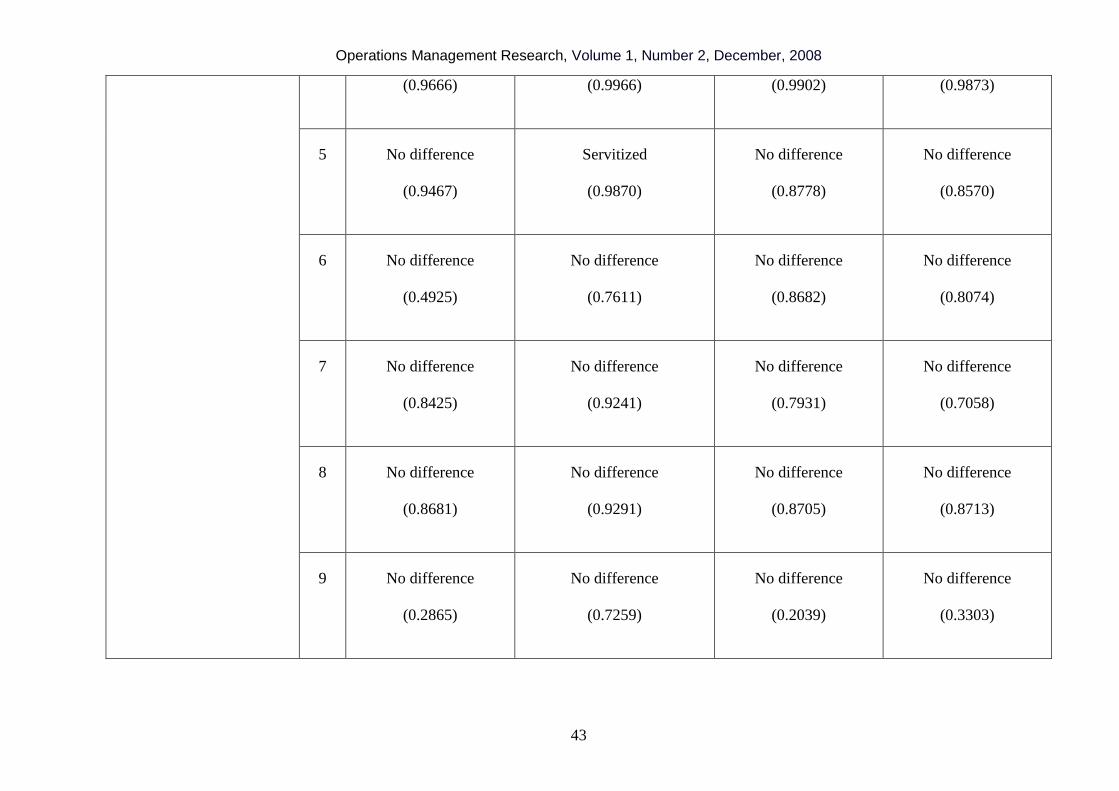
The analysis presented in this section has focused on the extent of servitization, making no
distinction between the different forms of servitization (and the potential complexity of these)
discussed in Tables 2 and 3. Table 2 identifies five different forms of Product-Service System
(PSS): integration oriented PSS, product oriented PSS, service oriented PSS, use oriented PSS and
result oriented PSS. The 12 different forms of service identified in this study map onto these five
categories. Integration oriented PSS involve moving downstream, offering services such as
consulting services, financial services, retail and distribution, transportation and trucking services
and property and real estate services. Product oriented PSS involve offering additional services that
are directly related to the product, e.g. design and development services, installation and
implementation services, maintenance and support services, outsourcing and operating, and
procurement services. Service oriented PSS involve offering systems and solutions. While use
oriented PSS involve services such as leasing. The fifth category, result oriented PSS involve
Operations Management Research, Volume 1, Number 2, December, 2008
20
shifting completely to a service, thereby replacing the need for a product. These are outside the
scope of this analysis.
Table 9 repeats the analysis presented in table 8, but shows the relationship between firm
size and form of Product-Service System offered. The data shows a similar pattern to that in Table
8, suggesting that the different forms of PSS enable smaller firms to generate higher net profits as a
% of sales revenues.
Insert Table 9 around here
IMPLICATIONS FOR THEORY AND PRACTICE:
So what can we learn from this analysis? First, there are multiple different forms of service that
manufacturing firms offer. The empirical data suggests that there are 12 different forms, which in
decreasing prevalence are: [1] design and development services; [2] systems and solutions; [3] retail
and distribution services; [4] maintenance and support services; [5] installation and implementation
services; [6] financial services; [7] property and real estate; [8] consulting services; [9] outsourcing
and operating services; [10] procurement services; [11] leasing services; and [12] transportation and
trucking services.
Second, the servitization of manufacturing is clearly influenced by firm size and local
economic circumstances. Larger firms, measured both in terms of numbers of employees and
revenues, tend to servitize more than smaller firms. And there tend to be more manufacturing firms
that have servitized in highly developed economies than in industrialising economies [e.g. US
versus China]. While not universal [e.g. Austria versus Malaysia] this finding is consistent with
current national policy debates which suggest that firms in developed economies should seek to
move up the value chain (Delbridge et al, 2006).
Operations Management Research, Volume 1, Number 2, December, 2008
21
Third, the analysis raises some interesting questions about the economic impact of
servitization. While servitized firms generate higher revenues they tend to generate lower net profits
as a % of revenues than pure manufacturing firms. The reasons for this are that servitized firms
have higher average labour costs, working capital and net assets. And they appear unable to
generate high enough revenues or margins to cover the additional investment they have to make
over and above the investment made by pure manufacturing firms. This finding applies particularly
to the largest firms, for while smaller servitized firms (those with less than 3000 employees) often
generate higher net profits as a % of sales revenues than their pure manufacturing counterparts, this
finding does not hold for larger firms. Indeed for the largest firms, it is the pure manufacturing
firms that generate the higher net profits as a % of sales revenues.
This finding is particularly important given current calls from the policy community for
manufacturing firms in developed economies to servitize, moving to a position where they offer
higher value added products and services. Before abandoning this call, however, it is important to
explore in more detail the challenges facing firms, especially large firms, as they seek to servitize.
Several recent papers talk of a services paradox, noting that it often proves more difficult than
expected to recoup the expected level of return from services (Gebauer et al, 2005; Reinartz and
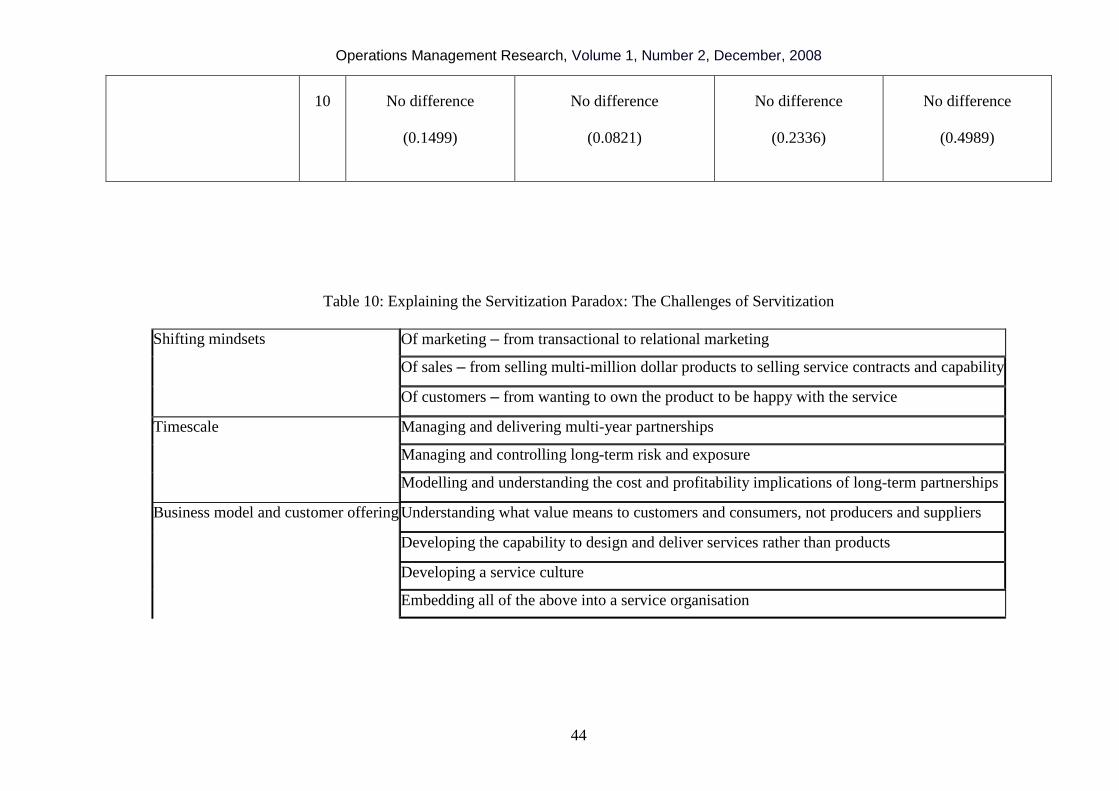
Ulaga, 2008). Literature and anecdotal evidence suggests three broad categories of reasons why this
might be the case – (i) the challenges of shifting mindsets, (ii) the challenges of timescale and (iii)
the challenges of business models/customer offerings. Underlying these three broad categories of
challenge are ten factors (summarised in Table 10). The first set of challenges – those of shifting
mindsets apply particularly to the marketing and sales functions, as well as to the organisation’s
customers. For marketeers, the servitization of manufacturing involves a shift from transactional to
relational marketing. No longer are products simply sold. Instead long term contracts are entered
into and hence the nature and length of the relationship between supplier and customer changes. For
the sales function, the servitization of manufacturing, can change the nature of what is being sold.
Operations Management Research, Volume 1, Number 2, December, 2008
22
Gebauer et al. (2005), in their study of the German machine tool industry, highlight that one of the
reasons the machine tool manufacturers had not able to accrue as much profit from services as they
had expected, was that many of the sales staff either gave away services as an incentive to buy the
product, or did not see the sale of a $50,000 service contract, as compelling as the sale of a $1
million machine tool. Hence the sales staff tended to put more emphasis on the sale of tangible
products rather than services. The third changing mindsets issue relates to the customer. Here the
challenge lies in the concept of product ownership. Many customers are emotionally attached to the
products they buy – in the consumer market this phenomenon is particularly obvious in the
automotive sector. For manufacturing to servitize successfully, customers have to accept that it is
not always necessary for them to take ownership of the physical product.
The second broad set of challenges – those of timescale – are a function of the changing
contractual relationship often implied by servitization. For complex engineered services, such as
contracting for capability in aerospace sector and through life management of buildings in the
construction industry, firms engage in multi-year partnerships. Managing and controlling long-term
risk and exposure in these partnerships, as well as modelling and understanding their cost and
profitability implications is a significant challenge. In recent months, we have seen massive
fluctuations in oil prices and currency exchange rates, two factors beyond the control of individual
firms that have material implications for the cost and hence profitability of service and support
contracts. Understanding how such factors are likely to shift over time and how the associated risk
can be mitigated is essential if manufacturing firms are to sustain profitably their efforts to servitize.
Finally, there appear to be challenges in terms of business models and customer offerings.
The debates about value-in-use that dominate the marketing literature highlight the need to
understand what value customers and consumers derive from services, rather than define value in
terms of the producers’ perspective (Vargo and Lusch, 2004). From an operations perspective, we
know relatively little about the design of services and much of our knowledge is grounded in the
Operations Management Research, Volume 1, Number 2, December, 2008
23
design and delivery of mass services, although there is now growing interest in experiential services
(Roth and Menor, 2003; Voss and Zomerdijk, 2007). This relative paucity of knowledge –
especially about the design and deliver of complex engineered services - is linked to concerns about
our understanding of the organisational capabilities needed for service design and delivery, as well
as the challenges of developing a service culture inside a traditional manufacturing business.
Finally, there is a need to understand the transformation journey required to embed the nine factors
identified above into a servitized manufacturing firm. Future research, which explores the extent to
which these ten challenges together explain the paradox of servitization described in this paper, will
surely be worthwhile.
Operations Management Research, Volume 1, Number 2, December, 2008
24
References
Anderson, J.C. and Narus, J.A. (1995) Capturing the value of supplementary services. Harvard
Business Review, Jan-Feb, 75-83.
Baines, T., Lightfoot, H., Evans, S., Neely, A.D., Greenough, R., Peppard, J., Roy, R., Shehab, E.,
Braganza, A., Tiwari, A., Alcock, J., Angus, J., Bastl, M., Cousens, A., Irving, P., Johnson, M.,
Kingston, J., Lockett, H., Martinez, V., Micheli, P., Tranfield, D., Walton, I. and Wilson, H. State-
of-the-Art in Product Service Systems. Proceedings of the Institution of Mechanical Engineers,
Part B, Journal of Engineering Manufacture.
Baroth, E. C. ; Zakrajsek, J.; Powers, W.T.; Fox, J.; Prosser, B.; Pallix, J. and Schweikard, K.
(2001) IVHM (Integrated Vehicle Health Management) Techniques for Future Space Vehicles. 37th
Joint Propulsion Conference, Salt Lake City, UT, USA.
Cook, M.B., Bhamra, T.A. and Lemon, M. (2006) The Transfer and Application of Product Service
Systems: From Academia to UK Manufacturing Firms. Journal of Cleaner Production, 14, 1455-
1465.
Davies, A., Brady, T. and Hobday, M. (2006) Charting a Path Toward Integrated Solutions. MIT
Sloan Management Review, 47: 39-48.
Delbridge, R., Johnson, G. and Gratton, L. et al. (2006) The Exceptional Manager: Making a
Difference. Oxford: Oxford University Press.
Operations Management Research, Volume 1, Number 2, December, 2008
25
Friedman, T.L. (2005) The World is Flat: The Globalised World in the Twenty-First Century.
London: Penguin Books.
Gebauer, H., Fleisch, E. and Friedli, T. (2005) Overcoming the Service Paradox in Manufacturing
Companies, European Management Journal 23(1): 14-26.
Glasser, B.G. and Strauss, A.L. (1967) The Discovery of Grounded Theory: Strategies for
Qualitative Research. Chicago: Aldine Publishing.
Goedkoop, M., van Halen, C., Te Riele, H. and Rommens, P. (1999) Product Service Systems:
Ecological and Economic Basics. The Hague: Netherlands.
Hockerts, K. and Weaver, N. (2002) Towards a Theory of Sustainable Product Service Systems,
INSEAD-CMER Research Workshop on Sustainable Product Service Systems.
Manzini, E. and Verzzoli, Z. (2002) Product-Service Systems and Sustainability. United Nations
Environment Programme.
Ministry of Defence (2005) Defence Industrial Strategy. London: Her Majesty’s Stationery Office.
Mont, O., (Ed.) (2004) Product-Service Systems: Panacea or Myth. Lund University.
Mont, O. and Plepys, A., (Eds.) (2003) Customer Satisfaction: Review of Literature and
Application to the Product-Service Systems. International Institute for Industrial Environmental
Economics, Lund University.
Operations Management Research, Volume 1, Number 2, December, 2008
26
Morelli, N. (2002) Designing Product/Service Systems: A Methodological Exploration. Design
Issues, 18, 3-17.
Porter, M.E. (1980) Competitive Strategy: Techniques for Analyzing Industries and Competitors.
New York: Free Press.
Porter, M. and Ketels, C. (2003) UK Competitiveness: Moving to the Next Stage. London:
Department of Trade and Industry.
Reinartz, W. and Ulaga, W. (2008) How to Sell Services More Profitably, Harvard Business
Review, 86: 90-96.
A.V. Roth and Menor, L.J. (2003) Insights into Service Operations Management: A Research
Agenda, Production and Operations Management, 12, 2, 145-163.
Slack, N. (2005) Patterns of Servitization: Beyond Products and Service. Cambridge: Institute for
Manufacturing, Cambridge University.
Spohrer, J. and Maglio, P.P. (2008) The Emergence of Service Science: Toward Systematic Service
Innovations to Accelerate Co-Creation of Value. Production and Operations Management 17(3):
238-246.
Tukker, A. and van Halen, C. (2003) Innovation Scan for Product Service Systems.
PriceWaterhouseCoopers.
Operations Management Research, Volume 1, Number 2, December, 2008
27
Tukker, A. and Tischner, U. (Eds.) (2006) New Business for Old Europe: Product-Service
Development, Competitiveness and Sustainability. Sheffield, Greenleaf Publishing.
Vandermerwe, S. and Rada, J. (1988) Servitization of Business: Adding Value by Adding Services.
European Management Journal, 6, 314-324.
Vargo, S. L. and Lusch, R. F. (2004) Evolving to a New Dominant Logic for Marketing. Journal of
Marketing, 68, 1–17.
Voss, C. and Zomerdijk, L. (2007) Innovation in Experiential Services – An Empirical View.
Advanced Institute of Management Research/London Business School, June.
Wise, R. and Baumgartner, P. (1999) Go Downstream: The New Profit Imperative in
Manufacturing. Harvard Business Review, Sept-Oct, 133-141.
Wu, L., Yue, X. and Sim, T. (2006) Supply Chain Clusters: A Key to China's Cost Advantage,
Supply Chain Management Review.
Operations Management Research, Volume 1, Number 2, December, 2008
28
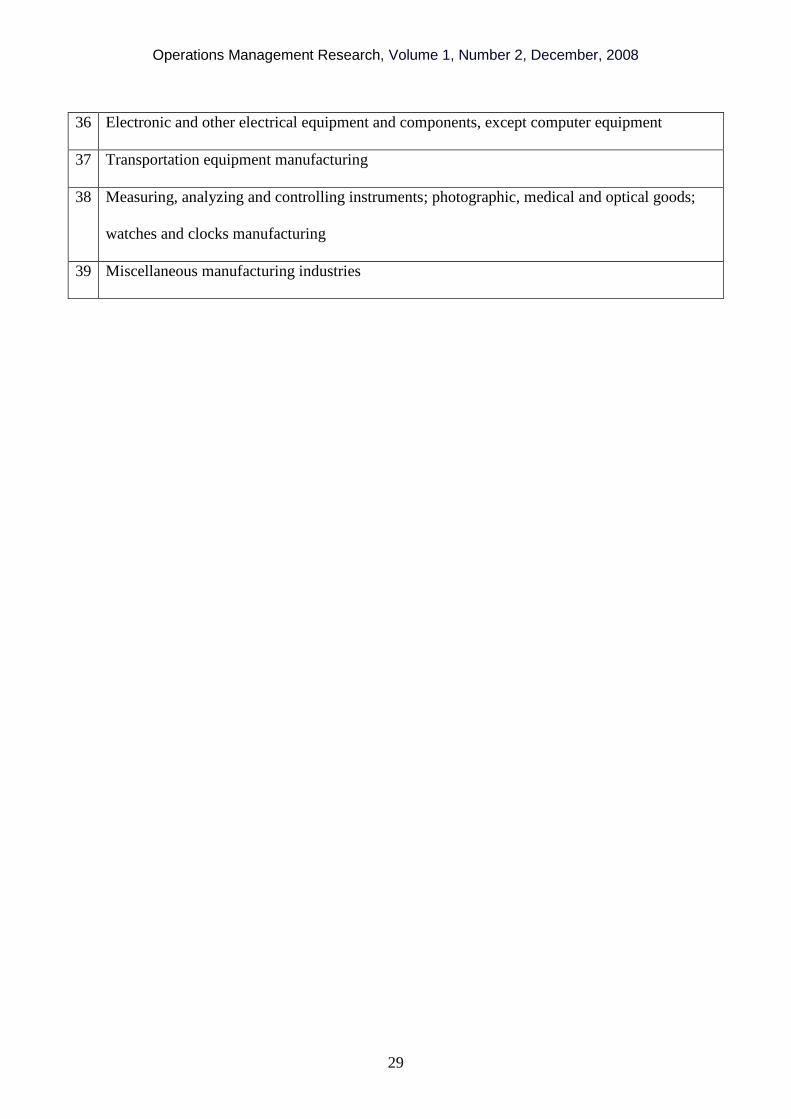
Table 1: US SIC codes included in the sampling strategy
10 Metal mining
12 Coal mining
13 Oil and gas extraction
14 Mining and quarrying of nonmetallic minerals, except fuels
15 Building construction-general contractors and operative builders
16 Heavy construction other than building construction-contractors
17 Construction-special trade contractors
20 Food and kindred products
21 Tobacco products manufacturing
22 Textile mill products manufacturing
23 Apparel and other finished products made from fabrics and similar materials manufacturing
24 Lumber and wood products, except furniture manufacturing
25 Furniture and fixtures manufacturing
26 Paper and allied products manufacturing
27 Printing, publishing and allied industries
28 Chemicals and allied products manufacturing
29 Petroleum refining and related industries
30 Rubber and miscellaneous plastics products manufacturing
31 Leather and leather products manufacturing
32 Stone, clay, glass and concrete products manufacturing
33 Primary metal industries manufacturing
34 Fabricated metal products, except machinery and transportation equipment
35 Industrial and commercial machinery and computer equipment
Operations Management Research, Volume 1, Number 2, December, 2008
29
36 Electronic and other electrical equipment and components, except computer equipment
37 Transportation equipment manufacturing
38 Measuring, analyzing and controlling instruments; photographic, medical and optical goods;
watches and clocks manufacturing
39 Miscellaneous manufacturing industries
Operations Management Research, Volume 1, Number 2, December, 2008
30
Table 2: The five options for servitization
Option 1: Integration oriented PSS
Integration orientated product-service systems involve going downstream by adding services
through vertical integration. Ownership of the tangible product is still transferred to the customer,
but the supplier seeks vertical integration, e.g. by moving into retail and distribution; financial
services; consulting services; property and real estate services; and transportation and trucking
services. One way of thinking about integration oriented PSS is by thinking of products plus
services.
Option 2: Product oriented PSS
With product oriented product-service systems ownership of the tangible product is transferred to
the customer, but additional services directly related to the product are provided, e.g. design and
development services; installation and implementation services; maintenance and support services;
consulting services; outsourcing and operating services; procurement services. One can
conceptualise product oriented PSS as products plus services that are integral to the product.
Option 3: Service oriented PSS
Service oriented Product-Service Systems incorporate services into the product itself. Ownership of
the tangible product is still transferred to the customer, but additional value added services are
offered as an integral part of the offering, e.g. Health Usage Monitoring Systems and Intelligence
Vehicle Health Management. Option 3 is the first option which involves a coupled product and
service, as opposed to product plus service.
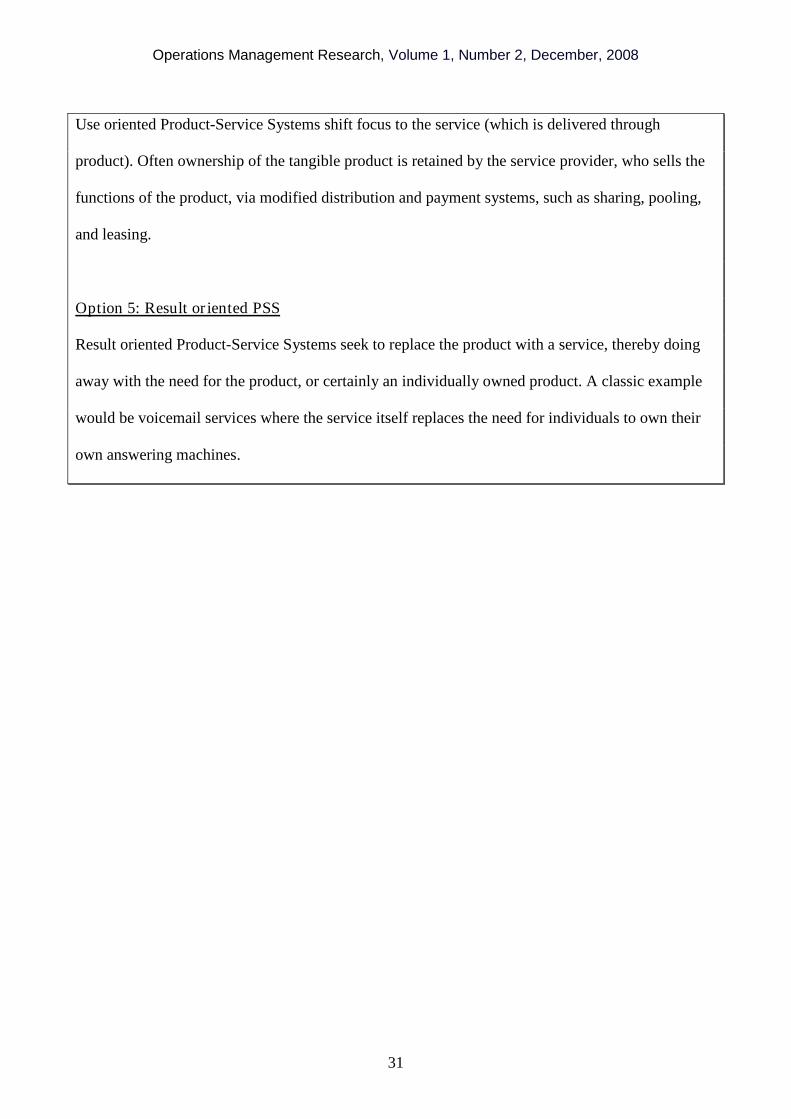
Option 4: Use oriented PSS
Operations Management Research, Volume 1, Number 2, December, 2008
31
Use oriented Product-Service Systems shift focus to the service (which is delivered through
product). Often ownership of the tangible product is retained by the service provider, who sells the
functions of the product, via modified distribution and payment systems, such as sharing, pooling,
and leasing.
Option 5: Result oriented PSS
Result oriented Product-Service Systems seek to replace the product with a service, thereby doing
away with the need for the product, or certainly an individually owned product. A classic example
would be voicemail services where the service itself replaces the need for individuals to own their
own answering machines.
Operations Management Research, Volume 1, Number 2, December, 2008
32
Table 3: Percentages of Firms Offering Services
Which services are offered? % of firms offering
service
Number of firms offering
service
Design and Development Services 21.74% 2,312
Systems and Solutions 15.61% 1,660
Retail and Distribution Services 12.02% 1,278
Maintenance and Support Services 11.81% 1,256
Installation and Implementation
Services 5.02% 534
Financial Services 3.75% 399
Property and Real Estate 3.66% 389
Consulting Services 2.63% 280
Outsourcing and Operating Services 1.67% 178
Procurement Services 1.14% 121
Leasing Services 0.99% 105
Transportation and Trucking Services 0.21% 22
Operations Management Research, Volume 1, Number 2, December, 2008
33
Table 4: Focus of Firms by Country
Country ofincorporation
Total numberof firms
# manufacturingfirms
# servitizedfirms
% manufacturingfirms
% servitizedfirms
USA 2,590 1,073 1,517 41.43% 58.57%
Finland 93 44 49 47.31% 52.69%
Singapore 63 32 31 50.79% 49.21%
Malaysia 539 293 246 54.36% 45.64%
Netherlands 119 71 48 59.66% 40.34%
Belgium 77 48 29 62.34% 37.66%
Norway 75 52 23 69.33% 30.67%
Germany 449 317 132 70.60% 29.40%
Bermuda 195 140 55 71.79% 28.21%
Switzerland 137 99 38 72.26% 27.74%
Sweden 153 111 42 72.55% 27.45%
Taiwan 435 318 117 73.10% 26.90%
CaymanIslands 142 104 38 73.24% 26.76%
Spain 89 66 23 74.16% 25.84%
Great Britain 820 611 209 74.51% 25.49%
Operations Management Research, Volume 1, Number 2, December, 2008
34
Greece 62 47 15 75.81% 24.19%
Australia 141 109 32 77.30% 22.70%
CzechRepublic 80 63 17 78.75% 21.25%
Denmark 102 81 21 79.41% 20.59%
Thailand 229 183 46 79.91% 20.09%
France 488 396 92 81.15% 18.85%
Indonesia 157 133 24 84.71% 15.29%
Austria 69 59 10 85.51% 14.49%
Japan 1,693 1,496 197 88.36% 11.64%
China 1,031 1,021 10 99.03% 0.97%
Operations Management Research, Volume 1, Number 2, December, 2008
35
Figure 1: How the Range of Services Offered Varies by Country3
3 NB – an individual firm can offer more than one service. This is the reason the y-axis ranges from 0% - 350%
0%
50%
100%
150%
200%
250%
300%
350%
Au
stria
Au
stralia
Belg
ium
Berm
ud
a
Sw
itzerland
Ch
ina
Czech
Rep
ub
lic
Germ
any
Den
mark
Sp
ain
Fin
land
Fran
ce
Great
Britain
Greece
Ind
on
esia
Japan
Cay
man
Island
s
Malay
sia
Neth
erland
s
No
rway
Sw
eden
Sin
gap
ore
Th
ailand
Taiw
an
US
A
% servitized firms offering transportation and truckingservices
% servitized firms offering systems and solutionsservices
% servitized firms offering retail and distribution services
% servitized firms offering property and real estateservices
% servitized firms offering procurement services
% servitized firms offering outsourcing and operatingservices
% servitized firms offering maintenance and supportservices
% servitized firms offering leasing services
% servitized firms offering installation and implementationservices
% servitized firms offering financial services
% servitized firms offering design and developmentservices
% servitized firms offering consulting services
Operations Management Research, Volume 1, Number 2, December, 2008
36
Figure 2: Relationship between Firm Size [Sales Revenue] and Firm Focus
0.00%
10.00%
20.00%
30.00%
40.00%
50.00%
60.00%
70.00%
80.00%
<24,6
74
24,6
74-4
7,81
1
47,8
12-7
8,53
3
78,5
34-1
24,2
48
124,
249-
196,
545
196,
546-
307,
699
307,
700-
519,
202
519,
203-
101,
1611
1,01
1,61
2-2,
690,
866
>2,69
0,86
6
2004 sales revenue (US$ '000s)
%of
firm
s
Pure Manufacturing Servitized
Operations Management Research, Volume 1, Number 2, December, 2008
37
Table 5: The Financial Consequences of Servitization
Numberof firms
Total 2004 salesrevenues (US$
billion)
2004 salesrevenues (% ofsample total)
Total 2004net profit
(US$ billion)
2004 netprofit (% ofsample total)
Total firms 7,836 13,353 764
Puremanufacturing
5,307 5,948 44.54% 383 50.13%
Servitized 2,529 7,405 55.46% 381 49.87%
Operations Management Research, Volume 1, Number 2, December, 2008
38
Table 6: 2004 Mean Financial Data for Sample
Number of firms
Means (all
firms)
Means (pure
manufacturing
firms only)
Means
(servitized firms
only)
Total revenues (US$000’s) 7836 1,704,093 1,120,809 2,928,090
Cost of goods sold (US$000’s) 7805 1,116,075 711,262 1,967,050
Net profit (US$000’s) 7836 97,551 72,179 150,794
Cost of employment/operating revenue (%) 2906 17.40 17.12 17.95
Operating revenue/employee (US$000’s) 7491 320.42 296.65 369.88
Average cost of employee/year (US$000’s) 2793 35.49 32.52 41.23
Profit per employee (US$000’s) 7491 18.61 15.79 24.47
Collection period (Days) 7732 68.06 68.75 66.62
Credit period (Days) 7410 43.73 46.40 38.12
Working capital per employee (US$000’s) 7458 63.04 59.81 69.76
Total assets per employee (US$000’s) 7461 398.06 382.29 430.84
Stock turnover (Times/year) 7556 14.97 13.11 18.97
R&D expenses (US$000’s) 3315 94,777 63,872 157,435
Operations Management Research, Volume 1, Number 2, December, 2008
39
Table 7: Influence of Range of Servitization and Firm Size on Success
Net Profit as % of Sales Coef. Std. Err t P>|t| [95% Confidence Intervals]
Extent of Servitization -0.026 0.011 -2.42 0.015 -0.047 -0.005
Firm Size (# Employees) 0.044 0.004 12.33 0 0.037 0.051
Category (pure manufacturing or servitized) 0.158 0.046 3.46 0.001 0.069 0.248
Constant -0.475 0.054 -8.73 0 -0.582 -0.369
R-squared = 0.021
Adj R-squared = 0.021
F(3, 7796) = 108.56
Note: bold numbers indicate P<0.05
Operations Management Research, Volume 1, Number 2, December, 2008
40
Table 8: Do Pure Manufacturing or Servitized Firms Achieve Higher Levels of Profitability as a % of Sales Revenues?
Extent of servitization (# services offered) - probability T > t (at 5%)
1 2 3 4 5 6 7
Siz
eof
firm
(dec
iles
of
emplo
yee
s)
1 Servitized
(1.0000)
Servitized
(1.0000)
Servitized
(0.9915)
Servitized
(0.9931)
Servitized
(0.9998)
No difference
(0.3229)
No difference
(0.9385)
2 Servitized
(0.9999)
Servitized
(0.9988)
No difference
(0.7446)
Servitized
(0.9850)
No difference
(0.7504)
Servitized
(0.9837)
No difference
(0.3583)
3 Servitized
(0.9582)
No difference
(0.8670)
Servitized
(0.9823)
No difference
(0.3852)
No difference
(0.5715)
No difference
(0.6319)
No difference
(0.6911)
4 Servitized
(0.9873)
Servitized
(0.9694)
No difference
(0.4738)
No difference
(0.5276)
No difference
(0.8988)
No difference
(0.4280)
Servitized
(0.9953)
Operations Management Research, Volume 1, Number 2, December, 2008
41
5 No difference
(0.8570)
Servitized
(0.9841)
No difference
(0.9302)
Servitized
(0.9992)
Servitized
(0.9833)
No difference
(0.1395)
No difference
(0.7523)
6 No difference
(0.8074)
No difference
(0.6087)
No difference
(0.8699)
Servitized
(0.9547)
No difference
(0.8473)
No difference
(0.7238)
No difference
(0.7336)
7 No difference
(0.7058)
Servitized
(0.9947)
Servitized
(0.9662)
Servitized
(0.9747)
No difference
(0.9090)
No difference
(0.5295)
No difference
(0.5739)
8 No difference
(0.8713)
No difference
(0.9295)
No difference
(0.8983)
No difference
(0.2622)
No difference
(0.7716)
No difference
(0.7964)
No difference
(0.2741)
9 No difference
(0.3303)
No difference
(0.4103)
No difference
(0.8438)
No difference
(0.5866)
No difference
(0.2000)
No difference
(0.4818)
No difference
(0.4213)
10 No difference
(0.5004)
Manufacturing
(0.0242)
Manufacturing
(0.0317)
No difference
(0.3416)
No difference
(0.0696)
Manufacturing
(0.0469)
Manufacturing
(0.0325)
Operations Management Research, Volume 1, Number 2, December, 2008
42
Table 9: Exploring the Financial Impact of Different Forms of Product-Service System
Type of Product-Service System - probability T > t (at 5%)
Integrated PSS Product oriented PSS Service oriented PSS Use oriented PSS
Size of firm (deciles of
employees)
1 Servitized
(1.0000)
Servitized
(0.9991)
Servitized
(1.0000)
Servitized
(1.0000)
2 Servitized
(0.9999)
Servitized
(0.9999)
Servitized
(0.9999)
Servitized
(0.9999)
3 No difference
(0.8085)
Servitized
(0.9874)
No difference
(0.8897)
Servitized
(0.9582)
4 Servitized Servitized Servitized Servitized
Operations Management Research, Volume 1, Number 2, December, 2008
43
(0.9666) (0.9966) (0.9902) (0.9873)
5 No difference
(0.9467)
Servitized
(0.9870)
No difference
(0.8778)
No difference
(0.8570)
6 No difference
(0.4925)
No difference
(0.7611)
No difference
(0.8682)
No difference
(0.8074)
7 No difference
(0.8425)
No difference
(0.9241)
No difference
(0.7931)
No difference
(0.7058)
8 No difference
(0.8681)
No difference
(0.9291)
No difference
(0.8705)
No difference
(0.8713)
9 No difference
(0.2865)
No difference
(0.7259)
No difference
(0.2039)
No difference
(0.3303)
Operations Management Research, Volume 1, Number 2, December, 2008
44
10 No difference
(0.1499)
No difference
(0.0821)
No difference
(0.2336)
No difference
(0.4989)
Table 10: Explaining the Servitization Paradox: The Challenges of Servitization
Shifting mindsets Of marketing – from transactional to relational marketing
Of sales – from selling multi-million dollar products to selling service contracts and capability
Of customers – from wanting to own the product to be happy with the service
Timescale Managing and delivering multi-year partnerships
Managing and controlling long-term risk and exposure
Modelling and understanding the cost and profitability implications of long-term partnerships
Business model and customer offering Understanding what value means to customers and consumers, not producers and suppliers
Developing the capability to design and deliver services rather than products
Developing a service culture
Embedding all of the above into a service organisation
Operations Management Research, Volume 1, Number 2, December, 2008
45
Appendix A: Sample Business Descriptions
Bosch: Bosch is a worldwide name in a large number of areas. These include, for example,
electrical and electronic automotive technology, power tools, thermotechnology, household
appliances, security systems and broadband networks as well as automation technology and
packaging technology. The small 'workshop for precision mechanics and electrical engineering'
which Robert Bosch founded in Stuttgart in 1886, and which soon specialized in ignition systems
for motor vehicles and engines of all kinds, has now become the Bosch group, which is active
worldwide and is one of the largest companies in the Federal Republic of Germany in terms of
turnover, which amounted to EUR 35 billion in 2002. The international orientation of Bosch started
at the end of the 19th century. The first agencies were set up abroad at that time. At the beginning of
2003, the Bosch Group had approximately 224,000 employees, more than half of which were
outside Germany. The company has around 250 subsidiaries and associated companies in over 50
countries. A total of 236 manufacturing sites, 179 of which are located outside Germany, support
the international activities. A key part here is played by the efficient sales and customer service
organization with 9,000 Bosch Service centers with approximately 60,000 employees in 130
countries. An essential component of Bosch's corporate policy is the maintenance of its innovative
force which is based upon the knowledge and competence of experienced employees. Worldwide,
Bosch has around 20 000 scientists, engineers, and technicians working on the improvement of the
function and reliability of existing products and on the development of new products and systems.
As a result of their work, Bosch applies for over 2000 patents each year. This number places the
company at the top for the entire automotive industry. The Bosch Group concentrates its business
activities on the development, production, and sale of products featuring a high technical standard.
A significant share of the Bosch turnover is allocated to maintaining this position. Expenditures for
Research and Development totalled around EUR 2.5 billion in 2002. Bosch reserves considerable
Operations Management Research, Volume 1, Number 2, December, 2008
46
funds for expanding production capacity and for production engineering. In 2002, expenditures in
tangible fixed assets totalled around EUR 2 billion. The Bosch group differs from other companies
not just in the width and variety of its product range, but also through its constitution under
company law. Bosch has been one of the largest industrial foundations in the Federal Republic of
Germany since June 1964: Robert Bosch Foundation owns 92 per cent of the nominal capital of
Robert Bosch GmbH. Its constitution is based on the will of Robert Bosch. The foundation manages
the company assets in accordance with non-profit principles, and uses the funds it receives from the
profits of Robert Bosch GmbH for public-benefit purposes. The areas sponsored by the foundation
include science in society, health and humanitarian aid, international relations, and youth, education
and civic society. The foundation's international activities are focused on France, the USA and the
countries of central and Eastern Europe.
DaimlerChrysler: DaimlerChrysler is engaged in automotive, transportation and services. Its
passenger car brands include Maybach, Mercedes-Benz, Chrysler, Jeep, Dodge and Smart.
Commercial vehicles are produced under the Mercedes-Benz, Freightliner, Sterling, Western Star,
Setra, Thomas Built Buses, Orion and American LaFrance brands. It offers financial and other
services through DaimlerChrysler Services. DaimlerChrysler has a global workforce, a global
shareholder base, a global brand awareness and a global outlook. DaimlerChrysler's strategy rests
on four pillars: Global Presence, Strong Brands, Broad Product Range, and Technology Leadership.
PetroChina Company Limited: PetroChina Company Limited (the 'Company') was established as
a joint stock company with limited liability under the Company Law of the People's Republic of
China (the 'PRC') on November 5, 1999 as part of the restructuring of the China National Petroleum
Corporation ('CNPC'). The American Depositary Shares (the 'ADSs') and H shares of the company
were listed on the New York Stock Exchange, Inc. and the Hong Kong Stock Exchange ('HKSE')
Operations Management Research, Volume 1, Number 2, December, 2008
47
on April 6, 2000 and April 7, 2000, respectively. In the restructuring, CNPC injected into the
company most of the assets and liabilities of CNPC relating to its exploration and production,
refining and marketing, chemicals and natural gas businesses. The Company and its subsidiaries
are principally engaged in a broad range of petroleum and natural gas-related activities, including:
the exploration, development, production and sale of crude oil and natural gas; the refining,
transportation, storage and marketing of crude oil and petroleum products; the production and sale
of basic petrochemical products, derivative chemical products and other chemical products; and the
transmission of natural gas and crude oil and sale of natural gas.
Siemens: Siemens is a German based multinational corporation with a balanced business portfolio
of activities predominantly in the field of electronics and electrical engineering. The Group's
business segments are as follows: - Information and Communication Networks (ICN) - ICN
develops, manufactures and sells public communication systems, private business communication
systems and related software, and provides a wide variety of consulting, maintenance and other
services. This includes circuit switching and communication access equipment, private branch
exchange systems, voice and data public telecommunication elements, and broadband network
products for carrying data over the Internet. It also provides Internet core network switches, routers
and related services. - Information and Communication Mobile (ICM) - ICM designs, manufactures
and sells a broad range of communication devices, applications and interfaces, and mobile network
products and systems including mobile, cordless and corded fixed-line telephones and radio base
stations, base station controllers and switches for mobile communications networks as well as
mobile and intelligent network systems. - Siemens Business Services (SBS) - SBS provides
information and communications services to customers in industry, in the public sector, and in the
telecommunications, transport, utilities and finance industries. SBS designs, builds and operates
both discrete and large-scale information and communications systems, and provides related
Operations Management Research, Volume 1, Number 2, December, 2008
48
maintenance and support services. - Automation and Drives (A&D) - A&D produces and installs
manufacturing automation systems, drives systems, low voltage controllers and distributors, and
process automation products and instrument systems. - Industrial Solutions and Services (I&S) -
I&S provides a range of facilities systems and services, including general contracting, to raw
materials processing companies and infrastructure customers. - Siemens Dematic (SD) - SD
supplies logistics and factory automation equipment. It designs, engineers, manufactures and
supplies turnkey facilities and the associated components, systems and services for electronic
assembly systems, logistics and factory automation equipment as well as postal automation
systems. SD was formed in May 2001, following the merger of the former Group Siemens
Production and Logistics Systems and Mannesmann Dematic Systems. - Siemens Building
Technologies (SBT) - SBT provides products, systems and services for monitoring and regulating
the temperature, safety, electricity, lighting and security of commercial and industrial property. In
addition, it provides full technical facility management services within selected markets. - Power
Generation (PG) - PG provides customers worldwide with a full range of equipment necessary for
the efficient conversion of energy into electricity and heat. It offers a broad range of power plant
technology, with activities that include: development and manufacture of key components,
equipment, and systems; planning, engineering and construction of new power plants; and
comprehensive servicing, retrofitting and modernizing of existing facilities. - Power Transmission
and Distribution (PTD) - PTD supplies energy utilities and large industrial power users with
equipment, systems and services used to process and transmit electrical power to various points
along the power transmission network, including end users. - Transportation Systems (TS) - TS
provides products and services for the rail industry, including signaling and control systems,
railway electrification systems, complete heavy rail systems including rapid transit systems and
locomotives, light rail systems and other rail vehicles. - Siemens VDO Automotive (SV) - SV
designs, manufactures and sells integrated electrical, electronic and electromechanical systems and
Operations Management Research, Volume 1, Number 2, December, 2008
49
modules and individual components used in automotive applications. Its product range includes
components and systems used in automobile powertrains, body electronic systems, safety and
chassis systems, electric motor drives, information and cockpit systems, and driver information,
communication and multimedia systems. SV is the result of the merger in April 2001 of the former
Siemens Automotive group with Mannesmann VDO. - Medical Solutions (Med) - Med develops,
manufactures and markets diagnostic and therapeutic systems and devices such as computed
tomography, magnetic resonance imagers, ultrasound and radiology devices, and hearing
instruments as well as information technology systems for clinical and administrative purposes. It
provides technical maintenance, professional and consulting services. - Osram - Osram designs,
manufactures and sells a full spectrum of lighting products for a variety of applications such as
general lighting and automotive, photo-optic and optosemiconductor lighting. - Infineon
Technologies (Infineon) - Infineon's products include discrete and integrated semiconductor circuit
and systems for wireless communications, computer networks and for use in automotive and
industrial applications. Effective December 2001, Infineon is no longer consolidated but instead
accounted for as an investment using the equity method. - Siemens Financial Services (SFS) - SFS,
the Company's international financial services segment, provides a variety of customized financial
solutions both to third parties and to other Siemens business groups and their customers. - Siemens
Real Estate (SRE) - SRE owns and manages a substantial part of Siemens' real estate portfolio and
offers service portfolio specializing in real estate development projects, real estate disposals, asset
management, and lease and service management.
Yue Yuen Industrial: Yue Yuen Industrial (Holdings) Ltd is a largest branded athletic & casual
footwear manufacturer in the world with production facilities in China, Vietnam & Indonesia. The
company is an original equipment/design manufacturer (OEM/ODM) for major international brand
name companies such as Nike, Addidas, Reeboks, Asics, New Balance, Puma, Timberland &

Operations Management Research, Volume 1, Number 2, December, 2008
50
Rockport. Founded in 1988, Yue Yuen has been listed on the Stock Exchange of Hong Kong
Limited since 1992 and named as one of consitituent stocks of Hang Seng Index (HSI) and Morgan
Stanley Capital International Standard Index in June 2003.