Embed Size (px)
Citation preview

Exploring Bus Rapid Transit
A Comparison of York Region and Ottawa’s BRT Systems
A Master’s Report
By Laura Moebs
A Report submitted in partial fulfillment of the requirements for the degree of Master of Urban
and Regional Planning
School of Urban and Regional Planning
Queen’s University, Kingston, Ontario
April 2011

Acknowledgements
I would firstly like to thank my supervisor, Preston Schiller. His encouragement and insight has
been extremely valuable and I appreciate all the time he put in to review and edit my work. I am
grateful for all of his help and contribution to this report.
I would like to thank my parents for all of their support. They have provided me with so many
opportunities and I am forever grateful to them.
Finally, I would like to thank York Region Transit and OC Transpo for all of their help. To
everyone who helped answer my questions and provided me with valuable information, I
appreciate your kindness and patience.


Executive Summary
i
Background
Bus Rapid Transit (BRT) is an alternative mode of public transportation that is often
considered superior to the conventional bus system. The purpose of this report is to compare a
newly established BRT system (VIVA) to a well-established BRT system (OC Transpo), to
examine the strengths of BRT, establish how BRT systems can learn from one another, and
determine how to improve current systems to become more attractive to potential riders. This
report seeks to answer three related research questions:
1. How does York Region’s BRT system compare to Ottawa’s BRT system?
2. What can York Region Transit learn from OC Transpo?
3. What can OC Transpo learn from York Region Transit?
These questions will be answered using a case study comparison, examining and comparing
seven common BRT criteria taken from the literature.
Case Study Cities
York Region is located within the Greater Toronto and Hamilton Area (GTHA), just
north of the City of Toronto and is comprised of nine towns and cities (See Figure 1).
Figure 1: York Region
York Region is one of the fastest growing areas in the GTHA and population and employment
levels are on the rise, which has led to increased traffic and congestion. York Region Transit
(YRT) is the agency that provides transit service across the Region and they developed a BRT

Executive Summary
ii
system “VIVA” in 2005. VIVA currently runs on five routes and uses articulated buses which
are branded as specialized rapid transit vehicles. The goal of VIVA is to increase transit mode
share in York Region, as well as to support Transit Oriented Development and attract new riders
to bus transit. Phase One of VIVA is complete, and Phase Two is currently underway, which
consists of the development of five separated running ways to increase service efficiency and
reliability.
Ottawa is Canada’s capital City and is located in Eastern Ontario, adjacent to the Quebec
border. Ottawa is considered to have one of the best BRT systems in North America, due to its
development of the Transitway. The Transitway opened in 1983 and comprises of over 30
kilometers of separate roadway specifically for buses. The Transitway currently spans across the
entire City, serving approximately 100 million passengers every year (See Figure 2). The success
of Ottawa’s BRT system and Transitway is due to early transit supportive policies in the 1970s
and 1980s, as well as a lot of government funding.
Figure 2: OC Transpo’s Transitway System
Methodology
This report uses a comparative case study to compare YRT’s VIVA system to OC
Transpo’s BRT system. The two systems are compared based on seven common BRT criteria
extracted from two Transit Cooperative Research Program (TRCP) reports and include: running
ways, stations and bus stops, vehicles, fare collection, route structure and servicing, ITS
technology and marketing and branding. Data was collected using three methods: document
review, observations and interviews. Each criteria contains common features and elements that
are compared and displayed in a variety of tables. A summary of the general comparison is
outlined below in Table 1.

Executive Summary
iii
Analysis
Table 1: Summary of York Region Transit and OC Transpo’s BRT Criteria Comparison
BRT Criteria York Region Transit OC Transpo
Running ways No running ways present -
VIVA buses run in mixed
traffic
Has its own Class 1
running way (the
Transitway)
Stations and Bus Stops Clearly branded
“vivastations”
Real-time information
present at all stations
Wide variety of passenger
amenities
Lacks security and public
telephones and trash
containers at stations and
bus stops
Lacks station and
Transitway branding
No real-time information
at any stations
Wide variety of passenger
amenities
Security and public
telephones and trash cans
are located at all stations
and bus stops
Vehicles 40 and 60 ft. buses
Interior and exterior
branding
Passenger information on-
board
Electronic signboards and
automated voice
announcements
40 and 60 ft. buses
Limited exterior branding
and no interior branding
No passenger information
on-board
Electronic signboards and
automated voice
announcements
Fare Collection Off-board, proof-of
payment only
Accepts passes (weekly or
monthly)
Fare zones
On-board and off-board
payment
Accepts passes (weekly or
monthly)
System-wide fares
Route Structure and Servicing No express routes
Limited peak/counter peak
routes
5 BRT routes
3.5 minutes – 11 minutes
peak wait times
Many express routes
Many peak/counter peak
routes
8 BRT routes
2 minutes – 3 minutes
peak wait times
ITS Technology All buses equipped with
GPS technology
Real-time information
No task-force
Some buses equipped with
GPS technology
No real-time information
Transit Priority Task Force
Marketing and Branding Offers promotional
programs
Extensive branding and
unique system name
Offers promotional
programs
Limited branding and lack
of system name

Executive Summary
iv
Conclusions
The most significant difference between the two BRT systems is the running way criteria;
OC Transpo has a famous Transitway system which consists of a separate roadway for buses
only. In contrast, YRT currently has no running ways. However, YRT has managed to provide a
rapid bus service that is more reliable and efficient compared to the conventional bus and is
currently in the process of developing five rapidways. The two systems have many of the same
features and benefits, but another major difference is the fact that Ottawa’s government
supported rapid transit years ago, before York Region Transit even existed. Lastly, this research
has demonstrated that both YRT and OC Transpo can learn from each other. Each system has
key strengths, but also areas for improvement. The lessons learned from each BRT system is
translated below into recommendations.
The use of qualitative methods has demonstrated the role that BRT has in the public
transportation industry, including the specific features that this type of bus service offers,
compared to a conventional bus system. Learning about the strengths and weaknesses of both
BRT systems can help planners to understand BRT’s influence on public transportation,
including ridership levels.
Recommendations
Recommendations for York Region Transit
Continue with VIVA rapidway construction and model its design after OC Transpo’s
Transitway
Connect and expand future rapidways to allow for greater running way service
Install security telephones and/or public telephones at all Viva stations
Provide trash cans at every Viva station
Increase the amount of information on VIVA’s electronic signboard to include the current
time and upcoming intersection at the next stop
Install two ticket vending machines at all Viva stations
Offer a wider variety of peak-hour and express routes
Add more traffic signal priority measures to VIVA’s system
Develop and implement a Transit Priority Task Force
Create a YRT/VIVA customer service centre located in a high passenger volume area
Offer more marketing and advertising campaigns (e.g. reduced rate for university
students and free transit to seniors on a specific day)
Recommendations for OC Transpo
Install real-time information at all Transitway stops and stations
Equip a greater percentage of OC Transpo’s fleet with Automated Passenger Counting
Improve branding for the Transitway and Transitway vehicles
Provide more on-board passenger information (e.g. maps, brochures, or advertisements)
Implement a two-hour use on all fare purchases
Consider the possibility of implementing fare zones for the entire system

v
List of Tables
Table 2.1: Running ways classified by extent of access control 12
Table 2.2: Fare media advantages and disadvantages 15
Table 2.3: BRT Service Types and Span 16
Table 2.4: BRT Vehicle Design Characteristics 19
Table 2.5: Typical Canadian and U.S. BRT Vehicle dimensions and capacities 20
Table 3.1: A Comparison of York Region & Ottawa’s Demographic and Transit Information 25
Table 3.2: Reviewed Documents for Data Collection 28
Table 3.3: Running Ways Classified by Extent of Access Control 31
Table 4.1: Comparing YRT and OC Transpo’s Running Ways 36
Table 4.2: A Comparison of BRT Station and Bus Stop Features and Amenities 39
Table 4.3: A Comparison of BRT Vehicle Design Characteristics 46
Table 4.4: A Comparison of BRT Vehicle Features 47
Table 4.5: A Comparison of BRT Fare Collection 50
Table 4.6: A Comparison of Fare Structure 53
Table 4.7: A Comparison of BRT Fare Media 55
Table 4.8: A Comparison of BRT Route Types 56
Table 4.9: A Comparison of BRT Services 57
Table 4.10: A Comparison of ITS Technology for YRT and OC Transpo 59
Table 4.11: A Comparison of BRT Marketing and Branding Strategies 62
Table 4.12: Summary of York Region Transit and OC Transpo’s BRT Criteria Comparison 66
Table 5.1: An Overview of York Region Transit’s BRT Components and Features 69
Table 5.2: A Comparison of Two VIVA and YRT Conventional Bus Service Routes 71
Table 6.1: A Summary of the Major Findings and Conclusions between York Region Transit
and OC Transpo’s BRT systems 81

vi
List of Figures
Figure 1.1: Map of York Region 4
Figure 1.2: Map of Ottawa 6
Figure 1.3: OC Transpo’s Transitway System 7
Figure 2.1: Examples of BRT Marketing Activities 20
Figure 4.1: OC Transpo’s Transitway 37
Figure 4.2: Buses Entering the Transitway 37
Figure 4.3: York Region Transit Station Amenities 40
Figure 4.4: York Region Transit Station Amenities 41
Figure 4.5: OC Transpo’s Transitway Station Amenities 41
Figure 4.6: OC Transpo’s Transitway Station Amenities 42
Figure 4.7: VIVA’s Real-Time Signage 43
Figure 4.8: OC Transpo’s Basic Signage 43
Figure 4.9: VIVA’s Bus Stop Branding 43
Figure 4.10: OC Transpo’s Limited Station Branding 43
Figure 4.11: OC Transpo’s Security Telephones 44
Figure 4.12: The Exterior of a VIVA Bus 47
Figure 4.13: The Exterior of an OC Transpo Bus 47
Figure 4.14: VIVA Interior Vehicle Branding 48
Figure 4.15: YRT Exterior Vehicle Branding 48
Figure 4.16: OC Transpo’s Generic Vehicle Interior 49
Figure 4.17: VIVA’s On-Board Passenger Information 49
Figure 4.18: VIVA’s On-Board Passenger Information 49
Figure 4.19: VIVA’s Ticket Vending Machine 51
Figure 4.20: OC Transpo’s Vehicle Restrictions for Proof-of-Payment 52
Figure 4.21: OC Transpo’s Service Centre Located in the Rideau Centre 53
Figure 4.22: VIVA’s Route Map Displaying Two Fare Zones 54
Figure 4.23: OC Transpo Bus Signs Indicating Peak and Express Routes 58
Figure 4.24: A Common Yield to Bus Sign Found on all Bus Vehicles 60
Figure 4.25: VIVA Branding 65
Figure 5.1: YRT’s Conventional Bus 70
Figure 5.2: YRT’s VIVA Bus 70
Figure 6.1: View of a Future VIVA Rapidway in Newmarket 83
Figure 6.2: View of a Future Vivastation Canopy 83

Table of Contents
1.0. Introduction .............................................................................................................................. 1
1.1. The Need for Public Transportation .................................................................................... 1
1.2. An Overview of BRT ........................................................................................................... 2
1.3. Case Study Selections: York Region and Ottawa ................................................................ 3
1.3.1. York Region .................................................................................................................. 3
1.3.2. Ottawa ........................................................................................................................... 5
1.4. Summary .............................................................................................................................. 7
2.0. Literature Review..................................................................................................................... 9
2.1. Introduction .......................................................................................................................... 9
2.2. What is Bus Rapid Transit? ................................................................................................. 9
2.3. Components of BRT from the literature ............................................................................ 11
2.3.1. Running Ways ............................................................................................................. 11
2.3.2. Stations and bus stops ................................................................................................. 13
2.3.3. Fare Collection ............................................................................................................ 14
2.3.4. Route Structure and Servicing .................................................................................... 15
2.3.5. ITS Technology .......................................................................................................... 17
2.3.6. Vehicles....................................................................................................................... 18
2.3.7. Marketing and Branding ............................................................................................. 20
2.4. BRT Research .................................................................................................................... 22
2.5. Gaps and Shortcomings ..................................................................................................... 22
2.6. Conclusion ......................................................................................................................... 23
3.0. Methodology .......................................................................................................................... 24
3.1 Introduction ......................................................................................................................... 24
3.2 Case Study Selection........................................................................................................... 25
3.2.1. York Region ................................................................................................................ 25
3.2.2 Ottawa .......................................................................................................................... 26
3.3 Data Collection ................................................................................................................... 26
3.3.1. Reviewing Documents ................................................................................................ 27
3.3.2. Direct Observation ...................................................................................................... 29

3.3.3. Interviews .................................................................................................................... 29
3.4. Case Comparison Research Method .................................................................................. 30
3.4.1. Running Ways ............................................................................................................. 31
3.4.2 Stations and Bus Stops ................................................................................................. 31
3.4.3 Vehicles........................................................................................................................ 32
3.4.4 Fare Collection ............................................................................................................. 32
3.4.5 Route Structure and Servicing ..................................................................................... 33
3.4.6. ITS Technology .......................................................................................................... 34
3.4.7 Marketing and Branding .............................................................................................. 34
4.0. Analysis Part 1 ....................................................................................................................... 35
4.1. BRT Findings ..................................................................................................................... 35
4.1.1. Running Ways ............................................................................................................. 35
4.1.2. Stations and Bus Stops ................................................................................................ 38
4.1.3. Vehicles....................................................................................................................... 45
4.1.4. Fare Collection ............................................................................................................ 50
4.1.5. Route Structure and Servicing .................................................................................... 56
4.1.6. ITS Technology .......................................................................................................... 58
4.1.7. Marketing and Branding ............................................................................................. 61
5.0. Analysis Part 2 ....................................................................................................................... 67
5.1. Discussion .......................................................................................................................... 67
5.1.1. An Overview of the Findings: The Importance of Running Ways ............................. 67
5.2. How Does York Region Transit’s BRT System compare to OC Transpo’s BRT system? 72
5.3. Recommendations: What can York Region learn from OC Transpo? .............................. 74
5.3.1. Running Ways ............................................................................................................. 74
5.3.2. Bus Stations and Stops ................................................................................................ 75
5.3.3. Vehicles....................................................................................................................... 75
5.3.4. Fare Collection ............................................................................................................ 75
5.3.5 Route Structuring ......................................................................................................... 76
5.3.6. ITS Technology .......................................................................................................... 76
5.3.7. Marketing and Branding ............................................................................................. 76
5.4. What can OC Transpo Learn from York Region Transit? ................................................. 77

5.4.1. Real-Time Information ............................................................................................... 77
5.4.2. Automated Passenger Counting .................................................................................. 78
5.4.3. Transitway Branding ................................................................................................... 78
5.4.4. On-Board Passenger Information ............................................................................... 78
6.0. Conclusion ............................................................................................................................. 80
6.1. Discussion .......................................................................................................................... 80
6.2. The Future of VIVA........................................................................................................... 83
6.3. The Future of OC Transpo ................................................................................................. 85
6.4. Limitations ......................................................................................................................... 85
6.5. Final Thoughts ................................................................................................................... 86
7.0. Bibliography .......................................................................................................................... 88
8.0. Appendices ............................................................................................................................. 92
8.1. Appendix A: Observing BRT - General Observations ...................................................... 92
8.2. Appendix B: Interview Questions ...................................................................................... 94


Chapter 1: Introduction
Page | 1
1.0. Introduction
1.1. The Need for Public Transportation
The automobile has greatly changed society; it has altered the design of cities and
changed the way in which people go about their regular activities (Kennedy, 2002, p. 459).
However, in recent years, it has come to society’s attention that reliance on the automobile is no
longer a feasible transportation option, due to the detrimental effects it has on the environment,
human health and society as a whole. Transportation is becoming more recognized as a growing
issue for many cities and eventually, the provision of additional road capacity will be impossible
(Carey, 2002, p. 98). Due to increased traffic, congestion, stress related to longer commute times
and vehicle emissions, cities today are becoming increasingly concerned with improving their
transit services, to encourage more drivers to make to the switch to public transportation. Thus,
alternative modes of transportation are gaining popularity. Cities are increasingly trying to
promote public transportation and/or active transportation (e.g. walking or cycling).
Transportation is arguably the backbone of urban life; without it, activities in cities grind
to a halt (Pucher, 2004, p. 199). For our transportation systems to sustain future growth, we must
use our road space and transit facilities more efficiently, and we must also become less
dependent on the automobile. The efficient use of road space requires more sophisticated traffic
management which focuses on moving people instead of moving vehicles (Jarzab et al., 2002).
Currently, public transportation helps to relieve congestion, save energy, reduce pollution,
revitalize cities, provide mobility to the disadvantaged, and ensure basic mobility options for
everyone (Pucher, 2004). However, there have been concerns with the service and reliability of
the conventional public bus systems. For example, some have argued that existing bus systems
are difficult to use, unreliable, and unattractive with complex route structures that provide little
or no information at bus stops (Levinson et al., 2003a; Levinson et al., 2003b).
One attractive alternative for improving existing bus services and public transportation in
general has been the implementation of Bus Rapid Transit (BRT). BRT has been growing in
popularity among transit agencies and professionals in order to meet the changing needs and
desires of the public. BRT has been defined as: a flexible, high performance rapid transit mode
that combines a variety of physical, operating and system elements into a permanently integrated
system with a quality image and unique identity (Levinson et al., 2003a, p. 12). It should be
noted though, that there are multiple definitions of what BRT is, making it difficult to assess

Chapter 1: Introduction
Page | 2
what constitutes a real or “true” BRT system. A review of the literature has demonstrated that
there are consistent components which make up a BRT system, including: running ways, stations
and bus stops, specialized vehicles, fare collection, route structure and servicing, Intelligent
Transportation Systems (ITS), and marketing and branding (Levinson et al., 2003a, p. 3).
Ultimately, BRT should be viewed as a low-cost and highly effective way to upgrade existing
bus services throughout Canada (Pucher, 2004, p. 230).
BRT services are growing in popularity in Canadian cities; eight Canadian provinces now
have operated, planned or proposed BRT facilities and services (CUTA, 2007). Canada’s first
BRT system was developed in Ottawa by OC Transpo in 1983. Ottawa’s Transitway is renowned
worldwide and is considered one of the best BRT systems in North America (Cervero, 1998, p.
237). In contrast, York Region only recently developed a BRT system titled “VIVA” in 2005.
York Region Transit (YRT) is proceeding to further develop its BRT system under the general
criteria of what BRT is, in order to serve the mobility needs of the growing population of York
Region. Therefore, the purpose of this report is to compare and contrast a well-established BRT
system to a newly established BRT system. Specifically, this report seeks to answer three related
research questions:
1. How does York Region’s BRT system (VIVA) compare to Ottawa’s BRT system?
2. What can York Region Transit learn from OC Transpo?
3. What can OC Transpo learn from York Region Transit?
These questions will guide the investigation for comparing York Region Transit’s VIVA system
to OC Transpo’s BRT system.
1.2. An Overview of BRT
There is a broad range of perspectives as to what constitutes BRT (Levinson et al.,
2003a). Definitions vary from different agencies and some are more specific than others. For
example, one definition states that BRT is a “flexible, rubber-tired form of rapid transit that
combines stations, vehicles, services, running ways, and ITS elements into an integrated system
with a strong image and identity” (Kittelson & Associates Inc., 2007; Levinson et al., 2003a). In
contrast, the Federal Transit Administration (FTA) defines BRT as a “rapid mode of
transportation that can combine the quality of rail transit and the flexibility of buses” (Thomas,
2001, p.4). One thing that is agreed upon is that BRT has many benefits. The major benefits to

Chapter 1: Introduction
Page | 3
BRT include: increased service speed and reliability, greater ridership, lower costs, high
capacity, and operational flexibility (CUTA, 2007). Ultimately, BRT is a fully integrated system
of facilities, services, and amenities that are designed to improve the speed, reliability, and
identity of bus transit (Levinson et al., 2003a). As well, BRT can be an extremely cost-effective
way of providing high-quality, high-performance transit (Levinson et al., 2003a).
Although BRT has grown in popularity over the past twenty years, the idea of a rapid bus
system is not new. BRT proposals, plans and studies were developed as early as the 1930s in a
few U.S. cities, including Chicago (Levinson et al., 2003a). However, BRT gained a large
amount of attention when it was implemented in Curitiba, Brazil in the 1970s; this system is
often referred to as the first successful BRT implemented worldwide. This was an integral part of
Curitiba’s development strategy and was carefully integrated with adjacent development
(Levinson et al., 2002). BRT systems are now found today in major cities throughout the world.
However, this report will focus on only two BRT systems: York Region Transit’s VIVA system
and OC Transpo’s BRT system.
1.3. Case Study Selections: York Region and Ottawa
York Region and Ottawa have implemented BRT systems in Canada. The major
difference between the two is that Ottawa’s BRT system has been in place for thirty years;
operation began in 1983. In contrast, York Region Transit only implemented its BRT system
“VIVA” in 2005. The goal of this report is to compare a newly implemented BRT system to a
well-established one, in order to examine the similarities and differences between the two, and to
determine what YRT can learn from OC Transpo.
1.3.1. York Region
York Region is one of the fastest growing areas within the Greater Toronto and Hamilton
Area (GTHA). It has grown rapidly from a predominantly rural and agricultural area to an urban
and employment centre (Greater Toronto Transportation Authority, 2008; Steer Davies Gleave,
2008). York Region is located just north of the City of Toronto, in Southern Ontario (See Figure
1.1).

Chapter 1: Introduction
Page | 4
Figure 1.1: Map of York Region
(Source: York Region, 2006, www.york.ca)
Between 1991 and 2008, the population of York Region doubled to more than one
million people and rapid growth is expected to continue with population increasing to an
estimated 1.5 million people by 2031 (Greater Toronto Transportation Authority, 2008). York
Region is a designated location under Ontario’s Place to Grow Act, which means that York
Region is a designated municipality in Ontario that will embrace growth in the next 25 years.
This Act, through a variety of policy initiatives, will help to ensure that York Region offers
complete communities to residents that offer more options for living, working, shopping, and
playing, and will implement initiatives to curb sprawl, protect green spaces and reduce traffic
gridlock (Government of Ontario, 2007). It is expected that rapid population and employment
growth will continue for the next 25 years and will generate some 50% more traffic on the
region’s roadways (Steer Davies Gleave, 2008). As well, travel patterns are also changing in
York Region. More people are commuting from Toronto to York Region, whereas in the past, it
was vice versa. A combination of these factors has created a significant need for reliable,
efficient and sustainable transportation in York Region.

Chapter 1: Introduction
Page | 5
York Region Transit (YRT) created VIVA, a BRT system in 2005, which now consists of
90 clearly branded buses (mainly articulated buses), which run in mixed traffic (Steer Davies
Gleave, 2008). The goal of VIVA is to increase the mode share to 33% within the four
designated Urban Growth Centres in York Region and 22% on a region-wide basis (Steer Davies
Gleave, 2008). The investment in VIVA is a tool to further support Transit Oriented
Development (TOD) and to prevent urban sprawl (Steer Davies Gleave, 2008). Currently, the
VIVA system has defined bus stops with real-time information, automated ticket machines and
validation of tickets before boarding. As well, service is provided every three and a half to ten
minutes in peak periods and every fifteen minutes in non-peak periods. The system offers five
routes in four designated corridors, with queue jump lanes, traffic signal priority measures, and
Automatic Vehicle Locater (AVL) technology (York Region Rapid Transit Cooperation, 2010;
CUTA, 2007). Since the introduction of VIVA in 2005, ridership has experienced considerable
growth and grew 16% between 2006 and 2007 (Steer Davies Gleave, 2008). Ridership has
continued to increase for York Region Transit since VIVA implementation. For example, from
2009 to 2010, ridership increased for every month between 3% and 11% (York Region Transit,
2006). The average weekday ridership ranged from 54,563 (in August 2010) to 73,834 (in
October 2010). As well, VIVA began its operation with 1,054,000 passengers in 2005, whereas it
increased to 6,807,000 passengers in 2009 (York Region, 2010, p. 54). This demonstrates that
VIVA has been successful in attracting new ridership and increasing total ridership for York
Region Transit since 2005.
1.3.2. Ottawa
Ottawa is Canada’s capital city and is located in Eastern Ontario (See Figure 1.2). It has a
population of approximately 900,000 people and is a large multicultural city with various
neighbourhoods of interest within the city boundaries (City of Ottawa, 2010a). OC Transpo is the
public transit service provider for the city of Ottawa. The population served is 793,400 and in
2009, OC Transpo was used by 83.2 million passengers (OC Transpo, 2010).

Chapter 1: Introduction
Page | 6
Figure 1.2: Map of Ottawa
(Source: 4data, 2011, www.4data.ca)
Ottawa implemented Canada’s first BRT system (the Transitway), which opened in 1983.
It was built in stages beginning in 1978 and construction ended in 1996, comprising of nineteen
miles (Jarzab et al., 2002, p. 36). This project spurred transit systems worldwide to implement
their own BRT system, due to Ottawa’s success (CUTA, 2007). Currently, the Transitway is
highly utilized by Ottawa residents and surrounding communities. For example, the system’s
Central Business District (CBD) link carries more people in peak hour peak direction than most
Light Rail Transit (LRT) segments in North America (Levinson et al., 2003a). The Transitway
carries approximately 10,000 riders one-way in the AM peak hour at the maximum load point
(Levinson et al., 2003a). As well, The Transitway system has an average of about 100 million
trips annually with about 400,000 trips being made on any given weekday. On average, about
119 transit trips are made per person per year, which is the highest in North America for any city
of comparable size (Connelly, 2011). Figure 1.3 illustrates OC Transpo’s Transitway system,
which spans across the entire City of Ottawa.

Chapter 1: Introduction
Page | 7
Figure 1.3: OC Transpo’s Transitway System
(Source: OC Transpo, 2010, www.octranspo1.com)
Ottawa is known for having good coordination between transportation and land-use
planning, which has led to positive impacts on land development around major stations (Vuchic,
2002). Ottawa’s high public transport performance is mainly due to policies that were
implemented prior to the opening of the Transitway, specifically during the period of rapid
ridership growth from 1972 to 1983 (Al-Dubikhi & Mees, 2010). For example, the Region’s
transportation policy gave public transportation projects priority over all forms of road
construction or widening (Levinson et al., 2003a; Rathwell & Schijn, 2002). As well, the Region
of Ottawa-Carleton had provincial funding of 75% of transit infrastructure capital costs
(Rathwell & Schijn, 2002, p.171). This type of funding significantly helped with the creation and
development of Ottawa’s BRT system and overall, this system is one of the best examples of
BRT in North America.
1.4. Summary
The following report compares and contrasts two BRT systems: York Region Transit and
OC Transpo’s BRT systems. OC Transpo’s system has been in place for over thirty years,
whereas YRT’s VIVA system was only developed in 2005. Through document reviews,
observations, and interviews, the similarities and differences between specific BRT components
for each system will be examined and analyzed. The recommendations that come out of this
Chapter 1: Introduction
Page | 8
report aim to guide York Region Transit, OC Transpo, and any other transit agency that is
considering developing a BRT system or any transit agency that is trying to improve its current
BRT system. Chapter Two provides a literature review of the history and background
information of BRT, including its main components and features; seven common criteria of BRT
are identified and discussed. Chapter Three explains the methodology used to compare the BRT
systems in York Region and Ottawa. An overview of the three methods for data collection is
provided, including documents, observations and interviews. This Chapter also discusses any
limitations of the research, including biases. Chapter Four and Five discusses and analyzes the
findings. Chapter Four also discusses each BRT criteria examined individually, and the
comparison between YRT and OC Transpo; tables and figures are displayed to illustrate the
findings. Chapter Five provides answers to the proposed research questions and discusses
recommendations for both BRT systems. Finally, Chapter Six provides the concluding thoughts
for this report.

Chapter 2: Literature Review
Page | 9
2.0. Literature Review
2.1. Introduction
Public transportation services have historically been fixed-route systems operating along
a well-defined corridor making pre-determined stops to collect passengers at scheduled times
(TRB, 2010). However, transportation is slowly evolving in order to meet more passenger
demands and to become more attractive to potential riders. Ultimately, transportation systems
need to be more effective, integrated, multi-modal, and funded in a sustainable way (Greater
Toronto Transportation Authority, 2008). Currently, public transit investment is being used as a
key springboard for a sustainable future, especially in large metropolitan areas with growing
populations (Hensher & Golob, 2008).
It has been found that all cities need high quality infrastructure to facilitate the movement
of people and goods, and the delivery of basic services to their populations (Young & Keil,
2010). Unfortunately though, public transportation filters into the automobilized landscape, and
not vice versa (Young & Keil, 2010). As people become more aware of the dangers of an
automobilized landscape (low density development), there has been an abundance of research
and planning pertaining to transportation and the encouragement of making transportation more
sustainable. A major shift in the transportation sector has been focusing on more energy efficient
forms of transport, including light rail and bus rapid transit, while creating innovative public
transit systems (Potter, 2007). This solution is found to be coupled with proposals for planning
controls to produce settlement patterns and conditions that will favour sustainable modes and
disadvantage car use (Potter, 2007). The purpose of this literature review is to provide a general
overview of BRT research and will discuss the major components found on the topic.
2.2. What is Bus Rapid Transit?
Bus Rapid Transit (BRT) is an alternative mode of transit that is becoming more popular
in its effort to improve the overall efficiency and reliability of public transportation. However,
there is not one standard definition of BRT; there are multiple definitions. One definition of BRT
is a “flexible, rubber-tired form of rapid transit that combines stations, vehicles, services, running
ways, and ITS elements into an integrated system with a strong image and identity” (Kittelson &
Associates Inc., 2007, p. 15; Levinson et al., 2003a, p. 12). The FTA defines BRT as “a rapid
mode of transportation that can combine the quality of rail transit and the flexibility of buses”

Chapter 2: Literature Review
Page | 10
(Thomas, 2001, p. 4). Another definition is a rubber-tired rapid transit service that combines
stations, vehicles, running ways and a flexible operating plan into a high-quality, customer-
focused service that is fast, reliable, comfortable and cost efficient (CUTA, 2007). It has also
been argued that it is a more sustainable mode of transportation and helps to decrease automobile
dependency, due to the fact that a single BRT vehicle may replace as many as 50 cars along a
corridor (Galicia et al., 2009).
Although there are various definitions for BRT, no definition specifies at all which
attributes are essential to a system and which are optional (Carey, 2002). A preferred BRT
scenario would support high speeds, no (or low) operating subsidies, low floor buses with at
level boarding, smart off-card vehicle fare payment, seamless modal interchange and minimum
access and egress time (Hensher & Golob, 2008). Unfortunately, there is no BRT system that
comes closest to fulfilling all these conditions. However, the major components of BRT that
most agencies will try to offer include: running ways, specialized stations and bus stops,
specialized vehicles, services, ITS elements, and marketing and branding (Levinson et al., 2002;
Jarzab et al., 2002; Kittelson & Associates Inc., 2007).
BRT is often compared to Light Rail Transit (LRT). For example, BRT is seen as a cost-
effective means of achieving improved transit services and performance, and can be built in
stages, requires shorter planning and construction time frame, and has lower cost and greater
flexibility than LRT (Levinson et al., 2003b). The fact that BRT can be completed in phases is
often what attracts investors and agencies to implement this type of service. Due to the fact that
there is service flexibility, even the core segment can be left for last (Jarzab et al., 2002).
Another key characteristic of BRT is that it can provide a lower-cost method for providing better
quality public transit service, which can help to retain current passengers and attract new
customers, as well as garner political and taxpayer support (Polzin & Baltes, 2002).
Lastly, BRT should be an outgrowth of a planning and development process that stresses
solving demonstrated current and forecasted future problems and related needs (Kittelson &
Associates Inc., 2007). Planning objectives for BRT systems include: serving demonstrated
current and forecasted future transit demand and needs, providing reserve capacity for future
demand growth, attracting auto drivers to transit, relating to and reinforcing transit-and
pedestrian oriented development plans, and offering affordable initial implementation and
ongoing operating and maintenance costs (Kittelson & Associates Inc., 2007).

Chapter 2: Literature Review
Page | 11
2.3. Components of BRT from the literature
After reviewing the literature, common components of BRT were found to be prominent
in many articles, which helped to determine what BRT features will be compared and analyzed
for this report. The following components will be discussed: running ways, stations and bus
stops, fare collection, route structure and servicing, ITS technology, vehicles, and marketing and
branding.
2.3.1. Running Ways
One of the most common elements found in almost of all the literature regarding BRT is
the importance of running ways to a BRT system. Due to the growth in private automobiles,
there has been increased pressure on transit agencies to create additional lane capacities and to
consider ways for public transit to bypass traffic and congestion (Levinson et al., 2003a). This
has led to the creation of running ways, which can also be called Right of Ways (ROW).
Running ways are integral to BRT and help to increase the overall efficiency of the system. The
goal of a running way is to give BRT an operating environment where buses are free from delays
caused by other vehicles and by certain regulations, and to provide transit riders with better,
more reliable service (Levinson et al., 2003a). Running ways are one of the most important BRT
features; it determines the basic characteristics of the system and strongly influences the
selection of system technology, vehicle design and operational features (Vuchic, 2002).
Essentially, the basic characteristic of a running way is its degree of separation from other traffic.
There are many diverse running way components, which can include: mixed traffic lanes, curb
bus lanes, median busways on city streets, exclusive transitways, High Occupancy Vehicle
(HOV) lanes, dedicated transit lanes, reserved lanes on freeways, bus-only roads and tunnels,
normal flow freeway HOV lanes, busways on separate rights of way, arterial bus lanes, transit
signal priority, and queue jumps (Levinson et al., 2003a; Kittelson & Associates Inc., 2007).
There are various classifications of running ways. For example, Vuchic (2002) outlines
three ROW categories: A, B, and C. ROW Category A is fully controlled and used exclusively
by transit vehicles, requiring the highest investment to provide the highest performance. ROW
category B is partially separated from other traffic but has crossings at grade and curbed street
median with LRT tracks, which go through intersections and can be crossed by pedestrians. This
category can also be represented by physically separated bus roadways (called semi rapid

Chapter 2: Literature Review
Page | 12
transit). Category B requires higher investment but again, provides higher performance. ROW
Category C uses urban streets with mixed traffic. The success of the system's performance
depends on traffic conditions for Category C. This requires a lower investment due to the fact
that the streets already exist. However, it provides the lowest performance compared to the other
two categories (Vuchic, 2002, p. 73).
Another running way classification system is through the extent of access control. Table
2.1 outlines the various classes and their description.
Table 2.1: Running ways classified by extent of access control
(Source: Levinson et al., 2003b, p. 3-2)
Although running ways in general are critical to the overall efficiency and reliability of BRT
systems, busways on separate ROWs (also called transitways), provide the highest type of BRT
service in terms of travel speeds, service reliability, BRT identity and passenger attraction
(Kittelson & Associates Inc., 2007).
As dedicated busways are one of the most effective BRT running ways, they should save
at least five minutes in travel time per trip; busways should be at least five miles long, but ten
miles or more is usually desirable (Kittelson & Associates Inc., 2007, p. 4-7). Transit time and
reliability are very important to passengers; travel time may be the single attribute of a transit
system that customers care about the most (FTA, 2009, p. 3-2). Additionally, improvement in
travel time (through speed improvement, delay reduction and increases in service frequency) is
the most important determinant of attracting rides to transit (FTA, 2009, p. 4-3). Reducing travel
time for passengers (e.g. increasing travel speeds and reducing dwell times) is important because

Chapter 2: Literature Review
Page | 13
it makes the bus more comparable to the automobile. Passengers are more likely to use BRT if it
is somewhat comparable to the automobile in terms of travel times (up to a certain point).
Therefore, running ways help to increase travel time because buses do not have to worry about
getting stuck in traffic – they have their own right-of-way.
There are also variations of running ways that constitute "full" BRT compared to "light"
BRT: grade separated BRT operations are generally considered "full" BRT, whereas BRT
operations in bus-only lanes or in mixed traffic are generally considered “light” BRT (Kittelson
& Associates Inc., 2007). Lastly, running ways should serve three basic components: the Central
Business District (CBD) distribution, the line haul, and neighbourhood collection, as well as
serving major travel markets (Levinson et al., 2003a).
2.3.2. Stations and bus stops
Stations and bus stops are a crucial component to BRT systems; they can greatly affect a
passenger’s experience and can help to identify the system as a whole. A well-designed transit
station can help make travellers feel relaxed, informed and appreciated (Greater Toronto Transit
Authority, 2008). BRT stations can range from simple stops with shelters to complex facilities
with extensive amenities and features (Kittelson & Associates Inc., 2007). It is important for
stations and bus stops to offer passenger amenities and to have appropriate designs, in order to
provide the best possible service to all passengers. Stations should be permanent, weather-
protected facilities that are convenient, comfortable, and fully accessible. For both stations and
bus stops, amenities and features that should be present include: signage, passenger information
(including real-time information), route schedules, maps, brochures and displays, seating,
adequate lighting, weather appropriate features (e.g. windscreens and heaters), public telephones,
street furniture (for bus stations), ample space for waiting, fare vending points, and a BRT icon
designating each station (Kittelson & Associates Inc., 2007; CUTA, 2007; Levinson et al.,
2003b).
The spacing of stations is an important consideration for BRT because it can allow the
buses to operate at higher speeds, while decreasing travel time due to a decrease in stops.
Spacing of stations along freeways and busways can range from 2000 to 21,000 feet (Levinson et
al., 2003a). As well, stations should typically accommodate two to three buses, although busier
stations should be able to accommodate more than three buses. Essentially, station design should

Chapter 2: Literature Review
Page | 14
provide sufficient capacity for the likely peak-hour bus flows (Levinson et al., 2003a). There
should also be park and ride facilities at BRT stations when a large number of potential riders are
located beyond easy walking distance of stations, or when riders cannot be served effectively by
connecting bus services (Levinson et al., 2003a).
2.3.3. Fare Collection
Fare collection has a large influence on dwell time and speed of service. Therefore, many
BRT systems provide various options for payment. There are three different categories when it
comes to payment: fare collection, fare media, and fare structure. Fare collection refers to
various devices that one can use to pay for their ticket, including devices to validate payment.
This is broken down into on-board collection and off-board collection. Off-board fare collection
is desirable at major boarding points because it has been known to speed up services (Levinson
et al., 2003a). Off-board fare collection can include: prepayment (passengers pay fares and then
pass through turnstiles or barrier gates to board buses) and proof of payment (using a ticket
vending machine and requiring passengers to show their validated ticket or passes on vehicles
when requested to do so). On board collection works well at low-volume stations and includes
using exact change payment, tokens, or passes at the front of the bus.
Fare media refers to the types of payment that are accepted and can include cash and
tokens, paper passes and tickets, magnetic stripe cards and smart cards (Levinson et al., 2003a).
Table 2.2 outlines the advantages and disadvantages of each type of fare media.

Chapter 2: Literature Review
Page | 15
Table 2.2: Fare Media Advantages and Disadvantages
Advantages Disadvantages
Cash and tokens:
Simplest form of payment
Most widely used
Cash and tokens:
Most expensive form of payment to process
Highly susceptible to theft
High exposure to fraud
Paper passes and tickets:
Inexpensive to purchase stock
Easily combined with other payment
technology, such as magnetic stripe and optical
coating
Paper passes and tickets:
Susceptible to fraud
Labour intensive
Pre-printed stock needs to be treated like a
currency
Magnetic stripe cards:
Proven technology
Inexpensive Media
Can be combined with printing
Magnetic stripe cards:
Requires complex equipment
Maintenance Intensive
More susceptible to fraud than smart cards
Smart Cards:
Secure data transfer
Larger memory capacity
Highly reliable
High resistance to fraud
Smart Cards:
Cost – prohibits use for a single ride
(Source: Levinson et al., 2003b, p. 7-13)
Fare structure refers to the system wide structure for fare collection. This can include a
one-time fare amount for the entire duration of the trip, or having various fare amounts
depending on distances traveled. There is no one type of fare collection that is mandatory for a
BRT system; depending on location and the number of passengers using the service, the type of
fare collection varies from city to city for BRT.
2.3.4. Route Structure and Servicing
Service plans should be designated for the specific needs of each BRT environment and
can include a variety of services to offer to its passengers (Levinson et al., 2003a). Bus services
should be clear, direct, frequent and rapid. Common types of BRT routes that are offered
include: all-stop connecting bus routes, peak or counter peak direction express or limited stop
service, all stop express, local arterial or feeder service, and connecting bus routes (Levinson et
al., 2003a; CUTA, 2007). Table 2.3 outlines various BRT service types and spans.

Chapter 2: Literature Review
Page | 16
Table 2.3: BRT Service Types and Span
(Source: Levinson et al., 2003b, p. 8-2)
Excessively long BRT routes should be avoided to ensure reliable service. Routes should
not be more than two hours of round trip travel time, and three hours should be considered the
absolute maximum (Levinson et al., 2003a). Maximum headways of ten minutes in peak periods
and fifteen minutes in non-peak periods will minimize the need for set passenger schedules on
BRT for stop service routes, decreasing a passenger’s wait time and thus, improving their transit
experience (Levinson et al., 2003a). Clock-face scheduling is one option for BRT scheduling;
this is when public transit runs in consistent intervals and is easy to remember. One example of
clock-face schedules is if a bus comes in fifteen minute intervals (e.g. 8:00 am, 8:15 am, 8:30 am
and 8:45 am). This is helpful for passengers because they do not have to look at a schedule - they

Chapter 2: Literature Review
Page | 17
simply know exactly when the bus is coming. As well, BRT routes should be in service all day,
specifically between six in the morning to midnight (Kittelson & Associates Inc., 2007).
2.3.5. ITS Technology
Intelligent Transportation Systems (ITS) are a broad range of technologies applied to
transportation systems to make them safer, more efficient and reliable and more environmental
friendly (Haider, 2003). Various features of ITS include: Automated Passenger Counting (APC),
Automatic Vehicle Locator (AVL), passenger information systems, traffic signal priorities, and
smart cards (Haider, 2003; National Center for Transit Research, 2005; Levinson et al., 2003b).
Transit signal priority measures include passive, active, real-time, and preemption.
Passive measures include strategies that attempt to accommodate transit operations through the
use of pre-timed modifications to the signal system. This can include simple changes made to the
signal timing and system-wide retiming to address bus operations (Koonce et al., 2002). Active
measures include adjusting the signal timing after sensing the arrival of a bus, whereas real-time
measures are implemented by systems that provide continuous feedback between the priority
request generator (e.g. bus) and the priority request server (e.g. unit that discerns which request
to serve) (Koonce et al., 2002). Preemption measures results in changes to the normal signal
phasing and sequencing of the traffic signal, which is most commonly associated with
emergency response vehicles (Koonce et al., 2002).
AVL is becoming more popular among transit agencies. This type of technology uses
Global Positioning Systems (GPS) and it helps to determine where exactly any transit vehicle is
at any given time. AVL is used to pinpoint a bus’s location on the street network, allowing real-
time monitoring of a bus’s movement, closer schedule adherence and the ability to direct
maintenance crews in the event of a vehicle break-down (Levinson et al., 2003a). In one study
conducted in Toronto, it was found that service improvements from its AVL system resulted in a
0.5-1% increase in ridership (National Center for Transit Research, 2005). AVL is also known
for providing better customer satisfaction and for offering increased service reliability and
facilitates. AVL influences real-time information that is offered to passengers, and it is a feature
that is extremely important. People use real-time information to make decisions about modes of
travel, travel routes and times. As well, real-time information has been known to help reduce

Chapter 2: Literature Review
Page | 18
anxiety by letting passengers know when the next bus or train will arrive (National Center for
Transit Research, 2005).
Passenger information systems are also important to BRT because it provides information
before trips, at stations and bus stops, and/or on the vehicles. The National Center for Transit
Research has found that offering an abundance of pre-trip information (maps, fares and
schedules) in different forms can help to increase ridership because it makes transit systems
easier to use and thus, makes using BRT more attractive (2005).
2.3.6. Vehicles
Vehicles are another important component to BRT. They affect the perception of quality
for the entire system and have a strong, measurable impact on revenue speed and reliability, and
thus on ridership levels (Levinson et al., 2003a). There are many key considerations to vehicle
design, which include: sufficient capacity, speed, ease of passenger entry and exit, dimensions,
doors, aisle width, floor height and flatness, improved comfort, adequate circulation space, and
reduced noise and emissions (Levinson et al., 2003a). As well, vehicles should convey identity
and image by colour and markings, which will also be discussed under “marking and branding.”
Table 2.4 outlines common bus design characteristics.

Chapter 2: Literature Review
Page | 19
Table 2.4: BRT Vehicle Design Characteristics
(Source: Levinson et al., 2003b, p. 6-2)
In Canada, most BRT vehicles are 60 foot buses articulated buses, which are bigger than
conventional buses (Levinson et al., 2003a). As well, a sufficient number of doors of sufficient
width should be provided. Specifically when there is off board fare collection, one door channel
should be provided for each ten feet of vehicle length (Levinson et al., 2003a). Table 2.5 outlines
common BRT vehicle dimensions and capacities for Canada and the U.S.

Chapter 2: Literature Review
Page | 20
Table 2.5: Typical Canadian and U.S. BRT vehicle dimensions and capacities
(Source: Levinson et al., 2003b, p. 6-3)
Service structure is critical to a BRT system. However, it is the attractiveness of a vehicle
that initially brings a passenger “through the door” (Carey, 2002). The most difficult task is
getting people to try the product. However, once people first try BRT (which is why vehicle
design is so important – it can help to entice future riders), it will be the service that maintains
the consumer’s interest (Carey, 2002).
2.3.7. Marketing and Branding
A key element for successfully implementing BRT is through marketing and branding.
Marketing helps to distinguish BRT from a conventional bus service and the marketing for and
branding of BRT appears to influence how the public, press, and elected officials will respond to
the service and future flexibility in establishing price points (Jarzab et al., 2002). Due to the fact
that there are many stigmas associated with conventional bus services, marketing and branding
of BRT is of utmost important in order to make BRT attractive and to increase ridership.
Marketing for BRT has two basic objectives: to emphasize the unique features of BRT and to
create a unified system image and identify by coordinating marketing with the overall BRT
theme used throughout the system (Levinson et al., 2003a).
Marketing should be people-centred and focus on product, promotion, and price.
Promotional programs should be offered, including advertising and public information, service
innovations, and pricing incentives (Levinson et al., 2003a). Marketing can be communicated
through brochures, system maps, telephone information systems, internet web sites, newspapers,
radio, television, billboards, direct mail, and special events (Bitterman & Hess, 2008). Physical

Chapter 2: Literature Review
Page | 21
elements (e.g. maps, timetables, websites, etc.) convey an image but perceptual characteristics
can be difficult to isolate, quantify and communicate individually but are reinforced through
physical identity and branding, which includes: defining a system name, typography, text,
colour, graphics, images, logos, sounds, along with physical components such as vehicles,
shelters, and stations (Bitterman & Hess, 2008). Figure 2.1 illustrates the various marketing
activities for BRT.
Figure 2.1: Examples of BRT Marketing Activities
(Source: Levinson et al., 2003b, p. 8-12)
It should be noted though, that there is no single set of guidelines set out to evaluate every
possible aspect of a planned or existing BRT identity system. As well, there have been issues
pertaining to branding and marketing. For example, although some of the features of BRT may
be very convenient, they may not benefit those with visual, cultural or situational impairments.
There are often times that maps or posters, which are supposed to be promoting the use of BRT,
will have very small font, which can make it difficult for some to read the information
(Bitterman & Hess, 2008). Therefore, it is important for the individuals responsible for the

Chapter 2: Literature Review
Page | 22
marketing and branding of BRT to consider various methods of awareness and promotion in
which to appeal to all types of passengers.
2.4. BRT Research
A literature review has demonstrated that BRT research consists of a variety of methods,
including: case studies, interviews, surveying, and observation. Case studies are often used in
order to determine which cities around the world have BRT systems and what features they have
to offer. Specifically, case study comparisons are quite common. Hensher & Golob (2008)
compared 44 BRT systems with one another, in order to compare levels of service, costs and
investment. One document examined 26 different cities worldwide that have BRT and the
applications that accompany their services, including design features, operating practices,
institutional arrangements, costs, and benefits (Levinson et al., 2003a). Rathwell & Schijn (2002)
compared Ottawa’s BRT system with Brisbane’s BRT system, to see how Brisbane was
influenced by Ottawa’s success.
A fair amount of the BRT literature compares BRT to LRT and how BRT is often a
precursor to implementing LRT. Polzin & Baltes (2002) discuss whether or not BRT is a step
towards LRT, as well as the land use associated with BRT vs. LRT. Vuchic (2002) and Carey
(2002) each address the fact that often BRT is implemented in stages, and then eventually will
turn into LRT (especially if there are already separate ROWs present). As well, BRT is often
compared not only to LRT but also to other modes of transportation, which is discussed in the
article “Bus Semirapid Transit Mode Development and Evaluation” (Vuchic, 2002). Depending
on the information one is seeking, the methods for obtaining information regarding BRT will
change accordingly.
2.5. Gaps and Shortcomings
Despite the fact that there are many academic sources regarding BRT, it has been found
that there is a lack of research conducted within Canada. Many of the case studies or cities
examined are either from the United States, Europe, Australia and South America, and offer
minimal information on Canada. This is due to the fact that when many of the examined articles
were written, Canada only had few BRT systems in place (e.g. Ottawa). However, within the
past ten years, more BRT systems are being developed, including York Region Transit’s VIVA
service. This could lead to future research to be conducted within Canada to learn more about
Chapter 2: Literature Review
Page | 23
Canadian specific BRT systems. Although it can be helpful to research case studies from other
cities and countries, often times their strategies are not applicable to Canada’s cities and land use
patterns (e.g. European cities are much more compact and dense compared to Canadian cities).
Although there has been an enormous amount of research conducted on BRT systems
worldwide, there appears to be a lack of information regarding who is actually using this type of
bus service. Many of the articles outline the features and benefits of BRT, but rarely discuss the
kinds of people who use it (e.g. certain demographics, people living in specific neighbourhoods,
etc.). Although it may be difficult to determine specific passenger information, it could be
important to know, in order to market and advertise to the correct demographic groups, as well as
target the demographic sectors that do not normally use public transportation.
2.6. Conclusion
Within the field of transportation, research is constantly being updated. Many sources,
even as recently as five years ago, can be out-dated with new information or technology
pertaining to new transportation ideas. For example, transit fare collection has evolved from a
manual based system to automated systems (Haider, 2003). Therefore, one has to take into
account that research once considered ground breaking can easily become obsolete only years
after its publication. Although there have been many advances within the field of BRT, much
more work and research must be done if the goal is to raise transit demand substantially
(Transportation Research Board, 2001). Planners need to be aware of the challenges facing BRT
(e.g. obtaining exclusive BRT lanes and maintaining them), and need to be prepared to overcome
these problems. BRT has a long way to go to prove itself as a viable mode to the general public;
planners must be aware of its limitations in order to not raise false expectations (Carey, 2002).
Some suggestions for future needs in Canada regarding BRT include: one standard BRT
definition, a BRT inventory, a vehicle’s handbook, specific planning guidelines, standard design
guidelines and vehicle guidance (CUTA, 2007). Hopefully one day, all of these will be
accomplished and more, in order to further understand and promote BRT in Canada and around
the world. The reviewed literature provides a great foundation to form ideas and conclusions
regarding BRT. Although there are some gaps in the literature reviewed, there is sufficient
information out there that is relevant and interesting. The information gathered will serve as a
point of reference for future research pertaining to the comparison of York Region’s VIVA
system to Ottawa’s BRT system
Chapter 3: Methodology
Page | 24
3.0. Methodology
3.1 Introduction
A comparative case study method was chosen to compare York Region’s VIVA system
to Ottawa’s BRT system. This method was chosen firstly because of the nature of the research
questions. “How” or “why” questions are more explanatory and likely will lead to the use of case
studies; the first research question is a “how” question. This is because such questions deal with
operational links needed to be traced over time, rather than mere frequencies or incidence (Yin,
2009). One of the benefits of using a case study approach is its unique strength in its ability to
deal with a full variety of evidence (through documents, observations, and interviews), beyond
what might be available in a conventional historical study (Yin, 2009). As well, a comparative
case study approach directly tackles the question of generalizability by demonstrating the
similarities and differences across a number of settings (Yin, 2009). The goal of this report, aside
from comparing two BRT systems, is to ensure a reliable research design. The goal of reliability
is to minimize the errors and bias of a study (Yin, 2009). Therefore, outlining a sound research
design in the following section has helped to minimize the errors and bias in this study.
A case study comprises of five components which include:
1. A study’s question
2. It’s propositions, if any
3. Its unit(s) of analysis (this defines what the case is)
4. The logic linking the data to the propositions
5. The criteria for interpreting the findings
The complete research design should indicate the data to be collected – as indicated by a study’s
questions, its propositions and its units of analysis (Yin, 2009). How the data was collected will
be discussed under Section 3.3 “Data Collection”. This report’s three research questions were
already discussed in Chapter One and the unit of analysis (the two BRT systems) is discussed in
section 3.2 “Case Study Selection.” The study’s propositions (the criteria that will be used to
compare two BRT systems), the logic linking the data to the propositions, and the criteria for
interpreting the findings (i.e. the method for analyzing the comparison) is outlined in Section 3.4
“Case Comparison Research Method.” This chapter concludes with a review of the research
method and discusses the study’s limitations, including any biases, validity or generalizability
issues. This chapter helps the reader to understand the foundation for the research approach,
including the criteria for comparing two BRT systems and how the research has been conducted.

Chapter 3: Methodology
Page | 25
3.2 Case Study Selection
As demonstrated in the previous chapter, a literature review was conducted in order to
scan for information and to narrow down the topic between two specific locations that have
implemented BRT systems. The two case study locations had to firstly be located in Canada.
Although there are not a wide variety of BRT systems that have been implemented in Canada,
the numbers are slowly starting to increase. Secondly, the two BRT systems that were to be
examined had to be in a location that the researcher would be able to visit (in order to conduct
site visits and observations). Lastly, due to the fact that this research is comparing two BRT
systems, it is important to compare a BRT system that has been in service much longer than
another system. This will allow the researcher to make recommendations based on the success of
a well-established, older BRT system. Once the literature review was complete, the two cities for
the case study comparison were chosen. Each city and BRT system will be briefly discussed
below. Table 3.1 illustrates a basic comparison of the two cities and their demographic and
transit information.
Table 3.1: A Comparison of York Region and Ottawa’s Demographic and Transit Information
INFORMATION
YORK REGION
OTTAWA
Municipal Population 1,032,606 908,400
Service Area Population 1,032,606 793,400
Service Area Size 1,776.0 square kilometres 441.7 square kilometres
Transit Name York Region Transit (YRT) OC Transpo
Service provided by: Regional, under contract with bus
services
Municipal Department
Year System was Established January 1, 2001 August 1, 1972
Year BRT was Implemented 2005 1983
Ridership 18,314,618 83,177,343
Active vehicles – articulated
buses
41 (all VIVA vehicles) 274 (combination of Transitway
and conventional bus vehicles)
Adult Cash Fare $3.25 $3.25
Number of Fixed Routes 125 257
Hours of Service 5:30 am – 12:30 am 24 hours a day (Source: CUTA, 2009)
3.2.1. York Region
York Region is located in the GTHA and is growing steadily in population. Due to a
combination of factors, including increased growth and population, YRT created VIVA, a BRT
system which opened in 2005. Therefore, the system is still fairly new and there is still a lot of
Chapter 3: Methodology
Page | 26
development that can be done in order to further improve the system. The vision for YRT is to
provide quality public transit services which support the economic vitality, environmental
sustainability and health of the Regional community (York Region, 2010). YRT’s goal is to
increase the mode share to 33% within the 4 designated Urban Growth Centres in York Region
and 22% on a region-wide basis (Steer Davies Gleave, 2008). The investment in VIVA is a tool
to further support Transit Oriented Development (TOD) and to prevent urban sprawl (Steer
Davies Gleave, 2008). York Region’s BRT service was chosen because it was only implemented
within the last ten years, and is still being researched regarding its success and areas for
improvement.
3.2.2 Ottawa
Ottawa developed Canada’s first BRT system, which opened in 1983. It was built in
stages beginning in 1978 and construction ended in 1996, now comprising of over 19 miles (30.5
kilometres) of BRT services (Jarzab et al., 2002). Ottawa’s BRT system was chosen for this
report because it is known to be one of the best BRT services in North America, as well as for
being one of the most transit-friendly centres in North America (Rathwell & Schijn, 2002).
Ottawa’s BRT has even spurred other transit agencies in other countries to develop their own
BRT system, due to its success (CUTA, 2007). This system has been in place much longer than
York Region’s. Therefore, it is an appropriate case study to use, in order to see why it has been
so successful and how other BRT systems can learn from it.
3.3 Data Collection
In order to compare York Region and Ottawa’s BRT systems, multiple sources of
evidence were used to collect data, including documents, direct observation and interviews.
Multiple data sources help to increase the study’s construct validity and reduce the chances for
bias (Yin, 2009). This is due to the fact that the use of multiple sources of evidence in case
studies is likely to be more convincing and accurate based on several different sources of
information (Yin, 2009). The following sections will outline and discuss each method for
collecting data.

Chapter 3: Methodology
Page | 27
3.3.1. Reviewing Documents
The first step of data collection was to review variety of documents. As Yin (2009)
discusses, documents play an explicit role in any data collection in doing case studies. The
strengths of reviewing documents include the stability (documents can be viewed repeatedly),
and the broad coverage one is able to examine (including many events and settings) (Yin, 2009).
Reviewing documents was the first type of data collection used because it helped to provide
basic information about the two BRT systems and provided a base for data collection. One is
able to make inferences from documents (Yin, 2009) and it can help to determine what kinds of
questions the researcher should ask during an interview. As well, using documents has helped to
define the features that should be observed when using direct observation. Table 3.2 outlines the
documents that were reviewed, as well as their purpose for the research.

Chapter 3: Methodology
Page | 28
Table 3.2: Reviewed Documents for Data Collection
DOCUMENT PURPOSE
CITY IT
DESCRIBES
1. Ontario Urban Transit Fact Book 2009
Operating Data
Provides detailed facts and
statistics on York Region
Transit and OC Transpo
York Region and
Ottawa
2. VIVA Benefits Case Offers information
specifically on VIVA and the
future of the system York Region
3. York Region’s 2010 Operating Business
Plan and Budget
Outlines information
regarding York Region’s
budget, specifically for York
Region Transit York Region
4. YRT/VIVA 2010 Revenue Ridership
Summaries
Provides a comparison in
ridership levels from month
to month York Region
5. Bus Rapid Transit in Ottawa, 1978 to
2009 – Assessing the Results
Analyzes the performance of
the city’s public transit and
the role of BRT in this
performance Ottawa
6. OC Transpo Transit Services Annual
Performance Report 2009
Provides facts, charts and
visuals of how Ottawa’s
transit services was planned,
operated and managed,
including ridership levels Ottawa
7. OC Transpo 2009 Fact and Figures Provides general facts and
knowledge about Ottawa’s
transit in 2009 Ottawa
8. OC Transpo On-Time Performance from
January – June 2010
Displays the route and the
percentage of whether the
service was on time or late Ottawa
9. OC Transpo Active Bus Fleet and
Service Facts
Describes bus fleet
information, as well as basic
service facts and statistics Ottawa
These specific documents were chosen due to their availability and the significant information
they provided. Some of the documents were accessed online. However, one was retrieved
through Ontario’s Ministry of Transportation via email (Ontario Urban Transit Fact Book), and
others were provided by YRT and OC Transpo.

Chapter 3: Methodology
Page | 29
3.3.2. Direct Observation
The second method of data collection was through direct observation. In order to further
gain an understanding of what BRT entails and the features that each agency has to offer, the
researcher spent a few days riding each BRT system in order to experience first-hand both York
Region and Ottawa’s services. The researcher rode each system on weekdays and weekends, and
at various times throughout the day (including morning, afternoon, evening and rush-hour). The
purpose of observing each system at various times and on both weekdays and weekends was to
reduce the chance of bias; there are times when more people would be using the bus (e.g. during
weekday rush-hour). However, it was important to observe who uses the system not just during
peak hours, but also, how the system is being utilized during off-peak hours.
When completing the literature review, it was learned that there are seven common
criteria within a BRT system, including: running ways, stations and bus stops, vehicles, fare
collection, ITS technology, route structuring and marketing (Levinson et al., 2003a; Kittelson &
Associates Inc., 2007) When using direct observation, the seven common criteria of BRT were
observed, as well as any other features that stood out. Appendix A outlines a detailed list of what
was observed.
During observations, common BRT features were documented through photography at
bus stops and stations, as well as off and on the bus. Pictures were taken in order to document the
features available to passengers and to be able to compare the features that both York Region and
Ottawa have. Many of the photographs that were taken are displayed in the analysis in Chapter
Four: Analysis Part 1.
3.3.3. Interviews
The third and final method for collecting data was through the use of interviews.
Interviews are an essential source of case study evidence; well-informed interviewees can
provide important insight into such affairs or events and can provide shortcuts to the prior history
of such situations, which can be helpful in identifying other sources of evidence (Yin, 2009).
Interviews were the last method for collecting data because they were used to collect information
that was not able to be retrieved from documents or direct observation. They also provided the
chance to gain insight and perspective on both BRT systems, as well as provide clarification
when needed.

Chapter 3: Methodology
Page | 30
Ethical considerations are necessary when conducting interviews because the use of
human subjects is involved. An application was submitted to the General Research Ethics Board
(GREB) at Queen’s university and the interview component of this research has been granted
ethical approval. The participants interviewed signed a consent form and had the ability to
withdraw from the interview at any time.
Interviews were conducted with both York Region Transit and OC Transpo employees.
One individual from each agency was interviewed, chosen for a knowledge and familiarity with
each BRT system. As well, the two individuals were chosen because they have each been
involved in planning for each BRT system and are familiar with their system’s features.
Availability was another factor; the two interviewees were also willing and available to meet
with the researcher. The interviews took place in both York Region and Ottawa and both
interviews were approximately an hour long. The interviews were structured, guided by a set
questions obtained from a previous BRT Ridership Analysis Survey conducted by WestStart,
combined with additional questions developed by the researcher. The list of questions that each
participant was asked is attached in Appendix B.
3.4. Case Comparison Research Method
After using multiple sources of evidence to collect the data, the two case studies (York
Region and Ottawa) are examined and compared. Two case studies are used because the
analytical benefits from having two or more cases may be substantial and conclusions
independently arising from two cases will be more powerful than those coming from a single
case alone (Yin, 2009). As well, construct validity is validated through the use of multiple
sources of evidence (Yin, 2009).
The two BRT systems are compared based on the general criteria of what comprises
BRT, which is extracted from TCRP Report 118: Bus Rapid Transit Practitioner’s Guide (2007)
and TCRP Report 90: Bus Rapid Transit Volume 2: Implementation Guidelines (2003). Through
the literature review it was found that there are seven common criteria of a BRT system and all
are used to compare York Region and Ottawa. The method for evaluating each criteria is
described below. This report makes recommendations based on the various tables illustrated in
Chapter Four: Analysis Part 1, which demonstrate how the two BRT systems compare to one
another, and thus, how and what York Region can learn from Ottawa’s system (and vice versa).

Chapter 3: Methodology
Page | 31
3.4.1. Running Ways
Running ways are integral to BRT and help to increase the overall efficiency of the
system. The goal of a running way is to give BRT an operating environment where buses are free
from delays caused by other vehicles and by certain regulations, and to provide transit riders with
better, more reliable service (Levinson et al., 2003a). Running ways are one of the most
important BRT features; they determine the basic characteristics of the system and strongly
influence the selection of system technology, vehicle design and operational features (Vuchic,
2002). The basic characteristic of a running way is its degree of separation from other traffic, but
there are many different running way components that a BRT system can have. Although there
are various categories of running ways, the way in which both systems will be compared for this
report is based on the extent of their access control, through a five class system. Table 3.3
outlines the various classes and their description. This class system was chosen because each
type of running way is outlined very specifically.
Table 3.3: Running Ways Classified by Extent of Access Control
CLASS
ACCESS CONTROL
FACILITY TYPE
1.
Uninterrupted Flow – Full Control of Access
Bus Tunnel
Grade- Separated Busway
Reserved Freeway Lanes
2.
Partial Control of Access
At-Grade Busway
3.
Physically Separated Lanes Within Street
Rights-of-Way
Arterial Median
Busway, Bus Streets
4.
Exclusive / Semi-Exclusive Lanes
Concurrent and
Contra Flow Bus Lanes
5.
Mixed Traffic Operations
HOV Lanes (Source: Levinson et al., 2003b, p.3-2)
3.4.2 Stations and Bus Stops
BRT Stations and bus stops can greatly affect a passenger’s experience and can help to
identify the system as a whole. A well-designed transit station can help make travellers feel

Chapter 3: Methodology
Page | 32
relaxed, informed and appreciated (Greater Toronto Transit Authority, 2008). BRT stations can
range from simple stops with shelters to complex facilities with extensive amenities and features
(Kittelson & Associates Inc., 2007). It is important for stations and bus stops to offer passenger
amenities and to have appropriate designs, in order to provide the best possible service to all
passengers. Stations should be permanent, weather-protected facilities that are convenient,
comfortable, and fully accessible. For stations and bus stops, each BRT system is compared
based on passenger information (e.g. signage, route schedules, maps and displays and
brochures), seating, passenger amenities (e.g. trash and lighting), public automated passenger
information systems, real-time information, fare vending points, BRT branding, weather
appropriate features (e.g. heating and barriers), public and security telephones, wheelchair
accessibility, restrooms, and park and ride facilities (Kittelson & Associates Inc., 2007; CUTA,
2007; Levinson et al., 2003a). Additionally, passenger services are also compared, which include
vending machines, newsstands, shops and special services. The comparison of BRT station and
bus stop features are illustrated in Table 4.2, located in Chapter 4: Analysis Part 1.
3.4.3 Vehicles
Vehicles impact the perception of quality for the entire system and have strong,
measureable impact on revenue speed and reliability, and thus, on ridership levels (Levinson et
al., 2003a). The two BRT systems are compared based on vehicle design for 60 ft. articulated
buses and standard 40 ft. buses, which includes: length, width, height, number of doors,
passenger capacity (number of seats and standees), maximum capacity, wheelchair accessibility
and low floor capability, which is illustrated in Table 4.3. Additionally, vehicle features are
compared in Table 4.4, which includes: electronic signboards, automated voice announcements,
on-board passenger information, branding and heating.
3.4.4 Fare Collection
Fare collection has a large influence on dwell time and speed of service; therefore many
BRT systems provide various options for payment. There are three different categories when it
comes to payment: fare collection, fare media, and fare structure. Each BRT system will be
compared based on these three categories. Fare collection refers to various devices that one can
use to pay for their ticket, including devices to validate payment. This is broken down into on-

Chapter 3: Methodology
Page | 33
board collection and off-board collection. Off-board fare collection is desirable at major
boarding points because it has been known to speed up services (Levinson et al., 2003a). Off-
board fare collection can include: prepayment (passengers pay fares and then pass through
turnstiles or barrier gates to board buses) and proof of payment (using a ticket vending machine
and requiring passengers to show their validated ticket or passes on vehicles when requested to
do so). On board collection works well at low-volume stations and includes using exact change
payment, tokens, or passes at the front of the bus, in which the passenger has to pay the driver.
Table 4.5 illustrates exactly how fare collection is compared, which includes on and off-board
collection. Fare media refers to the types of payment that are accepted and can include cash and
tokens, paper passes and tickets, magnetic stripe cards and smart cards (Levinson et al., 2003a).
Table 4.7 illustrates a comparison of fare media, including: cash, tokens, paper passes and
tickets, weekly and monthly passes, and smart cards. Fare structure refers to the system-wide
structure for fare collection. This can include a one-time fare amount for the entire duration of
the trip, or using fare zones depending on distances traveled. There is no one type of fare
collection that is mandatory for a BRT system; depending on location and the number of
passengers using the service, the type of fare collection varies from city to city for BRT. Table
4.6 outlines how fare structure is compared based on one standard fare, premium fares, and fare
zones.
3.4.5 Route Structure and Servicing
Service plans should be designated for the specific needs of each BRT environment and
can include a variety of services to offer to its passengers (Levinson et al., 2003). Bus services
should be clear, direct, frequent and rapid. Each BRT system will be compared on common types
of routes that are offered, which include: all-stop connecting bus routes, peak or counter peak
direction service, all stop express, local arterial or feeder service, and connecting bus routes.
Table 4.8 illustrates the specific route types that are compared, including all-stop connecting bus
routes, peak/counter peak, express, local arterial/feeder service, and connecting bus routes. As
well, the various BRT services are also compared, which is illustrated in Table 4.9. BRT services
that are compared include: maximum wait times, headways, station spacing, hours of operation
and number of BRT routes.

Chapter 3: Methodology
Page | 34
3.4.6. ITS Technology
Intelligent Transportation Systems (ITS) are a broad range of technologies applied to
transportation systems to make them safer, more efficient and reliable and more environmental
friendly (Haider, 2003). The features of ITS that are compared between York Region and Ottawa
include: Transit signal priority measures (including passive, active, real-time and preemption),
Automated Passenger Counting (APC), Automatic Vehicle Locator (AVL), and passenger
information systems, which is outlined in Table 4.10.
3.4.7 Marketing and Branding
Marketing helps to distinguish BRT from a conventional bus service and the marketing
for and branding of BRT appears to influence how the public, press, and elected officials will
respond to the service and future flexibility in establishing price points (Jarzab et al., 2002).
Marketing should be people-centred and focus on product, promotion, and price. The marketing
and branding criterion comparison is based on: promotional programs (advertising, public
information, service innovations, and pricing incentives), physical elements (brochures, maps,
internet web sites, radio, television, billboards, direct mail), and perceptual characteristics
(system, name, typography, text, colour, graphics, images, logos, and sounds), which is
illustrated in Table 4.11.

Chapter 4: Analysis Part 1
Page | 35
4.0. Analysis Part 1
4.1. BRT Findings
This chapter describes the findings from examining YRT and OC Transpo’s BRT system
with respect to the seven common criteria of BRT: running ways, vehicles, stations and bus
stops, fare collection, route structuring and services, ITS technology, and marketing and
branding. After examining various documents, conducting direct observations, and interviewing
transit professionals, it has been found that YRT and OC Transpo are both similar and different
in a variety of aspects. However, despite some major differences, both systems have seen an
increase in ridership and are continuing to attract and retain riders through continuous
improvements to both systems. For example, OC Transpo annual ridership was 74,734,163 in
1999 and rose to 93,934,710 in 2008 (OC Transpo, 2010). The annual ridership level in 2009
was 83,177,343 (OC Transpo, 2010). However, the numbers dropped from 2008 to 2009 because
there was transit service disruption due to a strike. Regardless, transit ridership has risen
significantly since 1999 to 2009 in Ottawa. Similarly, the number of transit riders in York
Region has significantly increased since the implementation of VIVA. For example, from 2004
to 2009, the number of people taking YRT increased 33% from 13.8 million to 18.3 million.
However, York Region’s population only grew about 13%, demonstrating that more residents
were willing to use YRT (York Region, 2006).
The seven common criteria of BRT have been examined and compared for each system
and will be discussed individually, followed by a discussion of the findings and
recommendations for each BRT system in Chapter 5: Analysis Part 2. The following is an in-
depth comparison of each BRT criteria, including the similarities and differences for each
system.
4.1.1. Running Ways
The first criteria examined were running ways, which is also known as rapidways,
busways or Right-of-Ways (ROW). This was the first criteria because it is one of the most
important BRT criteria, if not the most important. Running ways come in different classes and
can be as simple as the implementation of a High Occupancy Vehicle (HOV) lane, to a fully
separate ROW, providing buses with their own lanes, separated from road traffic (Levinson et

Chapter 4: Analysis Part 1
Page | 36
al., 2003a). The greatest and most significant difference between YRT and OC Transpo’s BRT
system is the running way component. VIVA does not currently have its own running way,
whereas OC Transpo has the Transitway, a high frequency rapid transit service on its own lanes
dedicated only to buses (Al-Dubikhi & Mees, 2010). Table 4.1 demonstrates the significant
difference between YRT and OC Transpo’s running way classes.
Table 4.1: Comparing YRT and OC Transpo’s Running Ways
Type of Running Way
York Region OC Transpo
Class 1: Uninterrupted Flow – Full
Control of Access
Class 2: Partial Control of Access
Class 3: Physically Separated Lanes
Within Streets Rights-of-Way
Class 4: Exclusive / Semi Exclusive
Lanes
Class 5: Mixed Traffic Operations
Legend
Present in the BRT system Not present in the BRT system
Table 4.1 illustrates that VIVA only has a Class 5 running way, in which the BRT
vehicles are considered mixed traffic operations and are integrated with the traffic on the road.
As well, no HOV lanes currently exist on VIVA routes. In contrast, OC Transpo has its own
Transitway, which is comprised of over 30 km of separate roadway specifically for buses,
allowing for uninterrupted flow; the buses are not mixed with traffic and have full control of
access (Vuchic, 2002). As well, OC Transpo also has exclusive lanes on major roads that are for
buses only (e.g. along Rideau Street) and even has some routes that run with mixed traffic (once
the buses exits from the Transitway). Figures 4.1 and 4.2 illustrate the exclusivity of the
Transitway; it is made very explicit to drivers that the Transitway is for buses only. Signs are
displayed throughout the Transitway, indicating that there is a $125 fine for illegally driving on
it.

Chapter 4: Analysis Part 1
Page | 37
Figure 4.1: OC Transpo’s Transitway Figure 4.2: Buses Entering the Transitway
(Source: Laura Moebs, 2011) (Source: Laura Moebs, 2011)
The Transitway is convenient and efficient for OC Transpo riders because they do not
have to worry about traffic congestion when getting to and from their destinations.
Unfortunately, transit riders in York Region do have to factor in traffic and congestion when
riding VIVA, which can hinder the amount of time it takes to get from one location to another,
reducing efficiency and convenience. Compared to OC Transpo’s Transitway, VIVA is severely
lacking by not having its own running way or even HOV lanes. To be fair, OC Transpo’s
Transitway has been in place for over 30 years and is the largest bus-only guideway in North
America (Cervero, 1998). The Transitway was also built in such a way that when a section was
built, it was put into operation immediately, without having to wait for the entire network to be
constructed (Connelly, 2011). Thus, it would be very hard to compete with this kind of system.
York Region did conduct a best practices review on various BRT systems across North America,
which included Ottawa as a prime example (Marshall Macklin Monaghan Ltd., 2007). YRT still
chose not to develop its own Transitway at the beginning of VIVA’s implementation, but VIVA
does plan to build its own running way. YRT has coined Phase 2 of VIVA’s additional projects
“VivaNext”, which includes the development of five rapidways in York Region (York Region
Transit, 2006). However, it will be further examined how the lack of running ways in York
Region affects VIVA’s system in Chapter 5: Analysis Part 2.

Chapter 4: Analysis Part 1
Page | 38
4.1.2. Stations and Bus Stops
Bus stops and stations have the ability to range from simple stops with a basic shelter
design, to a complex facility complete with a variety of services and amenities. VIVA’s stations
and bus stops have some very different features when compared to OC Transpo’s Transitway
stations. One major reason for this difference is because that the Transitway requires specialized
stations. However, there are also some common station and bus stop features that are similar to
both systems. The following table illustrates the various station and bus stop features located on
both BRT systems.

Chapter 4: Analysis Part 1
Page | 39
Table 4.2: A Comparison of BRT Station and Bus Stop Features and Amenities
Feature York Region Ottawa
Passenger Amenities
Passenger Information:
Signage
Route Schedules
Maps and Displays
Brochures
Seating
Trash Container
Illumination
Public automated passenger
information systems
Real-time Information
Fare Vending Points
BRT Branding
Weather Appropriate
Features:
Heating
Weather Barriers
Enclosed areas
Public Telephone
Security Telephone
Wheelchair Accessibility
Restrooms
Park and Ride Facilities

Chapter 4: Analysis Part 1
Page | 40
Feature York Region Ottawa
Passenger Services
Vending machines
Newsstands
Shops
Special services (e.g. dry
cleaners)
Legend
Present at all stations/stops Present at some stations/stops Present at no stations/stops
Table 4.2 illustrates that both BRT systems have basic amenities located at their stations and bus
stops. For example, YRT and OC Transpo both offer passenger information including signage,
maps and displays, as well as seating, illumination, and physical shelters. The following figures
illustrate the amenities located at both VIVA and Transitway bus stop and stations.
Figure 4.3: York Region Transit Station Amenities
(Source: Laura Moebs, 2010)

Chapter 4: Analysis Part 1
Page | 41
Figure 4.4: York Region Transit Station Amenities
(Source: Laura Moebs, 2010)
Figure 4.5: OC Transpo’s Transitway Station Amenities
(Source: Laura Moebs, 2011)

Chapter 4: Analysis Part 1
Page | 42
Figure 4.6: OC Transpo’s Transitway Station Amenities
(Source: Laura Moebs, 2011)
A few significant differences between the two bus stop and stations include a lack of real-
time information at Transitway stations, as well as a lack of BRT branding and fare vending
points. OC Transpo currently does not offer real-time information to its passengers. This is one
area in which OC Transpo is significantly lacking and in contrast, YRT’s VIVA service is
flourishing. VIVA offers real-time information at all stops and stations, allowing passengers to
know exactly when the next few buses will be arriving. This feature helps passengers to feel at
ease and allows for greater convenience when riding VIVA. This also helps to alleviate some of
the pressure VIVA has for driving with mixed traffic; if there happens to be severe traffic or
congestion that will impact arrival times, the real-time information provided will at least let
passengers know how long they will have to wait for the next bus to arrive. Figure 4.7 and 4.8
illustrate the differences between real-time information signage and basic signage for YRT and
OC Transpo.

Chapter 4: Analysis Part 1
Page | 43
Figure 4.7: VIVA’s Real-Time Signage Figure 4.8: OC Transpo’s Basic Signage
(Source: Laura Moebs, 2010) (Source: Laura Moebs, 2011)
Another difference is that OC Transpo does not brand its BRT stations, whereas YRT
does. YRT has created a special name for its BRT stations, titled “vivastations” (York Region
Transit, 2006) and has incorporated the VIVA logo and colouring into all of its stations’ design
features. OC Transpo has matched the Transitway station colours to its vehicle colours by
making the Transitway stations red. However, OC Transpo does not have a specific logo, system
name or colour scheme the same way that VIVA does. Figure 4.9 illustrates the viva logo (The
white V), and the word “VIVA” displayed across the shelter. Figure 4.10 illustrates the red
colour scheme in the station, but also illustrates the lack of branding, including the lack of logos
and images.
Figure 4.9: VIVA’s Bus Stop Branding Figure 4.10: OC Transpo’s Limited Station Branding
(Source: York Region Transit, 2006) (Source: Laura Moebs, 2011)

Chapter 4: Analysis Part 1
Page | 44
Another major difference between VIVA and the Transitway stations is security
telephones; OC Transpo provides a security telephone at every station, in order for passengers to
contact OC Transpo’s security division in case of an emergency (illustrated in Figure 4.11).
Public telephones are also available at almost every station, which increases security for
passengers when riding OC Transpo.
Figure 4.11: OC Transpo’s Security Telephones
(Source: Laura Moebs, 2011)
In contrast, VIVA provides no security telephones at its vivastations, and only has public
telephones located at major transit hubs (e.g. Richmond Hill Centre and Newmarket Station).
This poses a threat to YRT riders in case of emergencies. Therefore, improving security features
within VIVA’s system is something that should be mandatory for the future of YRT.
Both systems have wheelchair accessible stations and bus stops, and both offer park and
ride facilities and bicycle racks at some stations, but not at all stations. One issue that an OC
Transpo representative noted during an interview is that some of OC Transpo’s Transitway
stations are older, including the elevators, which are in need of retrofits. Due to the fact that
many Transitway stations are below street level (but not underground), ramps, elevators and
stairs are required to allow for access to the street. Some stations only have elevators though and

Chapter 4: Analysis Part 1
Page | 45
no ramps, which poses a problem to riders with disabilities if the power goes out or an elevator
has technical difficulties (Connelly, 2011). However, OC Transpo has noted this issue and is
attempting to build ramps and improve elevator technology at new and old stations (Connelly,
2011).
Both VIVA and Transitway stations have weather appropriate features, including
precipitation and wind barriers, including enclosed waiting areas at some stations. OC Transpo
also provides two stations with heating – Mackenzie King Bridge Station and Laurier Station.
This is extremely helpful during the cold winter months. Unfortunately, the heaters are not
vandal-proof and often get mistreated, making transit agencies weary to install (Connelly, 2011).
One more difference, and a somewhat surprising one, is the lack of trash cans located at VIVA
stations. Major VIVA stations carry trash cans but small bus stops that are not considered major
transit hubs do not. In comparison, trash cans are located at almost all OC Transpo stations.
Although both BRT systems do have basic amenities located at many of their stops and
stations, there are still some important changes to be made to both, in order to improve customer
service and the overall BRT experience. York Region Transit could install trash cans at all
stations, as well as offer some type of security telephone, or even just a public telephone to
improve safety and security within its system. Similarly, OC Transpo could offer real-time
information to passengers to let them know exactly when the next bus is coming. Fortunately,
implementing real-time information is on OC Transpo’s future agenda, which will be further
discussed in Chapter 6: Conclusion.
4.1.3. Vehicles
YRT and OC Transpo have both 60 ft. articulated buses and 40 ft. regular buses in their
fleet that serves BRT routes. Most of the vehicle design characteristics are similar in York
Region and Ottawa, despite the fact that the buses from each city have different models and
manufacturers. Each transit agency offers two types of buses (60 ft. and 40 ft.) with similar
dimensions and passenger capacities, which is illustrated in Table 4.3. Figures 4.12 and 4.13
illustrate the exterior vehicle design of both VIVA and OC Transpo vehicles, demonstrating the
similarity between what the buses look like. Both vehicles have their transit agency’s name and
the route name on an electronic signboard displayed at the front of each bus. The main exterior
differences between VIVA and OC Transpo vehicles are minor vehicle dimensions and colour.

Chapter 4: Analysis Part 1
Page | 46
Table 4.3: A Comparison of BRT Vehicle Design Characteristics
Design Characteristics
York Region Ottawa
40 Ft. Regular Bus
Make/Model Van Hool A330 NOVA
Length 40 ft. 40 ft.
Height 10.25 ft. 9.5 ft.
Width 8.5 ft. 8.5 ft.
Number of Doors 2 2
Seating Capacity 28 41
Maximum Capacity (seating
and standing)
39 45
Wheelchair accessibility Yes Yes (90% of fleet)
Low Floor capability Yes Yes (90% of fleet)
60 Ft. Articulated Bus
Make/Model Van Hool AG300 New Flyer
Length 60 ft. 60 ft.
Height 11 ft. 10.9 ft.
Width 8.5 ft. n/a
Number of Doors 3 3
Seating Capacity 45 54
Maximum Capacity (seating
and standing)
72 70
Wheelchair accessibility Yes Yes
Low Floor capability Yes Yes

Chapter 4: Analysis Part 1
Page | 47
Figure 4.12: The Exterior of a VIVA Bus Figure 4.13: The Exterior of an OC Transpo Bus
(Source: Laura Moebs, 2011) (Source: Laura Moebs, 2011)
The main difference between VIVA and OC Transpo’s vehicles is their features, which is
displayed in Table 4.4.
Table 4.4: A Comparison of BRT Vehicle Features
Features
York Region Ottawa
Electronic Signboard
Automated Voice
Announcements
Passenger Information
(on-board)
Branding
Interior
Exterior
Heating
Legend
Present on all vehicles Present on some vehicles Present on no vehicles
Both YRT and OC Transpo vehicles have electronic signboards on-board displaying the
next stop, as well as an automated voice system which announces the next stop for passengers to
hear. One small difference found from riding both vehicles is that the electronic signboard on OC
Transpo buses displays not only the next stop, but also displays the intersection name too, as well
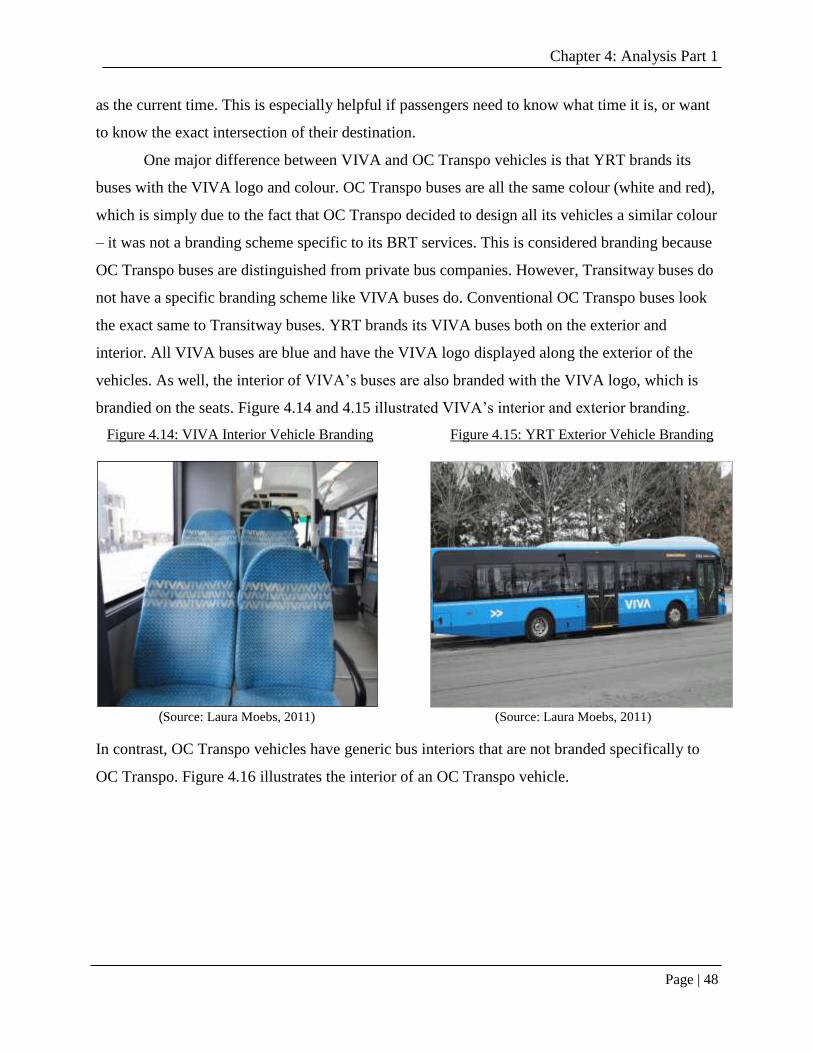
Chapter 4: Analysis Part 1
Page | 48
as the current time. This is especially helpful if passengers need to know what time it is, or want
to know the exact intersection of their destination.
One major difference between VIVA and OC Transpo vehicles is that YRT brands its
buses with the VIVA logo and colour. OC Transpo buses are all the same colour (white and red),
which is simply due to the fact that OC Transpo decided to design all its vehicles a similar colour
– it was not a branding scheme specific to its BRT services. This is considered branding because
OC Transpo buses are distinguished from private bus companies. However, Transitway buses do
not have a specific branding scheme like VIVA buses do. Conventional OC Transpo buses look
the exact same to Transitway buses. YRT brands its VIVA buses both on the exterior and
interior. All VIVA buses are blue and have the VIVA logo displayed along the exterior of the
vehicles. As well, the interior of VIVA’s buses are also branded with the VIVA logo, which is
brandied on the seats. Figure 4.14 and 4.15 illustrated VIVA’s interior and exterior branding.
Figure 4.14: VIVA Interior Vehicle Branding Figure 4.15: YRT Exterior Vehicle Branding
(Source: Laura Moebs, 2011) (Source: Laura Moebs, 2011)
In contrast, OC Transpo vehicles have generic bus interiors that are not branded specifically to
OC Transpo. Figure 4.16 illustrates the interior of an OC Transpo vehicle.

Chapter 4: Analysis Part 1
Page | 49
Figure 4.16: OC Transpo’s Generic Vehicle Interior
(Source: Laura Moebs, 2011)
Another minor difference between the vehicles is that VIVA offers on-board passenger
information, whereas OC Transpo does not. VIVA vehicles have VIVA’s system map displayed
inside the bus over the doors, as well as “My Transit” brochures situated throughout the bus.
Figures 4.17 and 4.18 illustrate the passenger information on board YRT vehicles. In contrast,
OC Transpo provides no maps, brochures or any kind of information at all regarding its system
on-board its vehicles.
Figures 4.17 and 4.18: VIVA’s On-Board Passenger Information
(Source: Laura Moebs, 2011)
Despite OC Transpo being renowned worldwide for its successful BRT system, it does
lack basic passenger amenities that could enhance a rider’s experience. In contrast, it appears that

Chapter 4: Analysis Part 1
Page | 50
YRT has done a successful job in providing passenger necessities on-board and has been able to
display its specialized features both off and on-board too.
4.1.4. Fare Collection
The basic objective of fare collection is to maximize convenience and minimize dwell
times at stops (Levinson et al., 2003a). YRT and OC Transpo have both implemented systems
that try to increase efficiency at all stops, and both do a good job at keeping dwell times low.
However, there are some large differences between the two agencies when it comes to fare
collection. Table 4.5 illustrates how fare collection differs between YRT and OC Transpo.
Table 4.5: A Comparison of BRT Fare Collection
Fare Collection
York Region Ottawa
On-Board
Exact Change
Token/Tickets
Passes (Weekly and Monthly)
Off-Board
Proof-of-payment
Pre-Payment
Legend
Used on all BRT vehicles Used on no BRT vehicles
It is evident that YRT’s VIVA service and OC Transpo have very different types of fare
collection. The only method of fare collection offered in York Region is off-board, proof-of-
payment (which also consists of using monthly or weekly passes). In contrast, riders can pay
both on-board and off-board in Ottawa. The purpose of having proof-of-payment fare collection
is to decrease dwell time and to speed up boarding and VIVA does have decreased boarding

Chapter 4: Analysis Part 1
Page | 51
times compared to YRT’s conventional bus service (York Region Transit, 2006). Riders are able
to enter VIVA buses through both the front and back doors, and do not have to show a ticket or
proof-of-payment to the driver. Rather, fare enforcement officers travel on VIVA’s vehicles at
random times throughout VIVA’s hours of operation checking passengers’ proof-of-payment.
YRT prides itself on offering proof-of-payment fare collection because it demonstrates
the agency’s ability to provide convenient and efficient service. Riders have to purchase their
tickets at ticket vending machines, which are located at every VIVA station (see Figure 4.19).
These machines are user friendly, complete with a touch screen and step-by-step instructions.
Riders are able to use cash, credit, or debit in order to purchase a ticket at any VIVA ticket
vending machine.
Figure 4.19: VIVA’s Ticket Vending Machine
(Source: Laura Moebs, 2011)
In contrast, OC Transpo offers both on-board and off-board payment; its proof-of-
purchase payments are limited only to articulated buses (Connelly, 2011). OC Transpo riders are
able to pay with exact change, tokens/tickets and weekly or monthly passes on-board. However
riders who use their passes, have obtained a transfer from another vehicle, and have proof-of-
payment are able to simply enter any doors on specified vehicles that offer proof-of-payment

Chapter 4: Analysis Part 1
Page | 52
boarding. OC Transpo will specify on each vehicle whether or not boarding is limited to just the
front door, or if boarding is allowed through all doors, illustrated in Figure 4.20.
Figure 4.20: OC Transpo’s Vehicle Restrictions for Proof-of-Payment
(Source: Laura Moebs, 2011)
Although it is generally assumed that having on-board fare collection will slow down service,
OC Transpo has proven that this is not the case. It has been found that median station dwell
times along Ottawa’s 95 and 97 BRT lines (two of the busiest lines) are reported to be less than
30 seconds and compared to other cities, such as Portland, Oregon which has a dwell time of one
minute or more, this is low (Levinson et al., 2003a)
One concern with proof-of-payment purchase is fare evasion: passengers riding the bus
without paying for a ticket. However, OC Transpo only has a 2.5% fare evasion rate (Connelly,
2011). Similarly, VIVA has a 3% fare evasion rate (Wright, 2011). This demonstrates that both
BRT systems have low fare evasion rates, and are successful in making sure that every passenger
pays their appropriate fare. There are other concerns with proof-of-payment though, such as
technical difficulties with ticket vending machines. There can be times when a ticket vending
machine stops working/becomes out of the service. Therefore, it is desirable to provide at least
two ticket vending machines whenever fares are collected off-board, to give backup when one
machine is out of service (Levinson et al., 2003a). Due to the fact that VIVA only offers proof-
of-payment fare collection and relies heavily on ticket vending machines, the proposed solution
of having two ticket vending machines at each bus stop or station is something that should be
considered. OC Transpo does not have to worry about providing ticket vending machines
because OC Transpo riders have the option of on-board payment too.
One interesting feature of OC Transpo is its service centres; OC Transpo has four
services centres where riders can purchase passes and obtain transit information. One service
centre is located in the Rideau Centre, a high-traffic shopping mall, illustrated in Figure 4.21.

Chapter 4: Analysis Part 1
Page | 53
This is a convenient location for many Ottawa residents who live or work in the downtown core.
YRT currently has no service centres. However, this could be a smart initiative to implement,
and could help improve fare collection (by selling passes), while increasing VIVA advertising
and customer service.
Figure 4.21: OC Transpo’s Service Centre Located in the Rideau Centre
(Source: Laura Moebs, 2011)
Another important category of fare collection is fare structure. Table 4.6 displays a comparison
of fare structure in York Region and Ottawa.
Table 4.6: A Comparison of Fare Structure
Fare Structure York Region Ottawa
System-Wide Fare (one fare
regardless of distance
travelled)
Premium Fare (e.g. express
routes)
Fare Zones
Legend
Fare structure present in the system Fare structure not present in the System
The major difference between YRT and OC Transpo in regards to fare structure is that VIVA
charges for fare zones, whereas OC Transpo does not. In York Region, fares are a set price when
travelling south of Jefferson vivastation but increase in price when travelling north past King

Chapter 4: Analysis Part 1
Page | 54
vivastation; this is the dividing line between zones. If a passenger is travelling through two
zones, the price of a VIVA ticket will increase because the passenger is travelling a longer
distance. Figure 4.22 illustrates VIVA’s route map, where the zone boundary is displayed in grey
(surrounded by a red circle). This map is displayed at all ticket vending machines and bus stops,
to let riders know whether or not they will have to purchase a one zone ticket or a two zone
ticket.
Figure 4.22: VIVA’s Route Map Displaying Two Fare Zones
(Source: York Region Transit, 2006, www.yorkregiontransit.com)
Although fare media may seem like an insignificant component of fare collection, the
types of payment that are accepted at transit agencies can have significant advantages or
disadvantages towards service and efficiency. Table 4.7 outlines the various types of fare media
that VIVA and OC Transpo has.

Chapter 4: Analysis Part 1
Page | 55
Table 4.7: A Comparison of BRT Fare Media
Fare Media
York Region Ottawa
Cash
Tokens
Paper passes and tickets
Weekly and monthly passes
Smart cards
Legend
Fare media that is used Fare media that is not used
As previously discussed, VIVA only uses proof-of-payment and therefore does not accept cash.
However, riders are able to use cash at any ticket vending machine in order to purchase a paper
pass, which serves as a proof-of-payment for two hours. Ottawa accepts every kind of fare
media, except for tokens. Although cash is the simplest form of payment and is most widely used
for fare collection, it is the most expensive form of payment to process and is highly susceptible
to theft and to fraud (Levinson at al., 2003). In contrast, paper passes and tickets which both
BRT system use, has the advantage of cheap purchase stock, but is labour intensive and also
more susceptible to fraud when compared to cash (Levinson at al., 2003).
Surprisingly, both YRT and OC Transpo lack the use of smart cards. Technology is at the
forefront of transportation planning and many cities are considering the implementation of a
smart card feature. Smart cards have numerous advantages, including convenience, serving as a
highly reliable method of payment with high resistance to fraud and secure data transfers
(Levinson at al., 2003). The only major drawback is the cost – it prohibits the use for a single
ride (Levinson at al., 2003). However, the implementation of smart card technology is something
that both YRT and OC Transpo plan to develop. YRT is beginning to implement PRESTO, an
integrated fare card within the GTA (York Region Transit, 2006). Similarly, OC Transpo has
future plans to implement a similar PRESTO smart card (only for use in the Ottawa region) by
November 2011 (Connelly, 2011). Therefore, both YRT and OC Transpo are aiming to improve

Chapter 4: Analysis Part 1
Page | 56
their overall fare collection by attempting to further improve convenience and efficiency through
the implementation of a smart card.
4.1.5. Route Structure and Servicing
Route structure and servicing differ greatly between YRT and OC Transpo’s BRT
systems. Table 4.8 demonstrates a comparison of route types, whereas Table 4.9 illustrates a
comparison of route services. It is evident that the majority of differences between the two
systems lie in express routes and route services.
Table 4.8: A Comparison of BRT Route Types
Route Types
York Region Ottawa
All-stop connecting bus routes
Peak/counter peak
Express
Local arterial / feeder service
Connecting bus routes
Legend
Present in the system Present sometimes in the system Not present in the system

Chapter 4: Analysis Part 1
Page | 57
Table 4.9: A Comparison of BRT Services
Route Services York Region Ottawa
Maximum wait time
Peak 3.5 minutes – 11 minutes 2-3 minutes
Off Peak 15 minutes 7-12 minutes
Headways
Peak 5-7 minutes 2-5 minutes (varies for
specific routes)
Off Peak 10-15 minutes 7-12 minutes (varies for
specific routes)
Station spacing 1 km (approximate) 1 km (approximate)
Hours of Operation
Weekday 5:00 am – 12:30 am 24 hours/day
Weekend 6:00 am – 12:45 am 24 hours/day
Number of BRT routes 5 8
VIVA’s route structures are similar but more basic when compared to OC Transpo’s.
Although both BRT services serve major employment centres and connect to conventional bus
services, OC Transpo offers a greater variety of peak and express routes. VIVA only has one
peak route, which is a limited rush hour service route between Finch station and Newmarket
(Wright, 2011). This service is peak direction only during rush hour times; in the morning this
consists of buses travelling south to Finch station and in the evening for buses travelling back up
north to Newmarket. As well, two of VIVA routes (pink and green) are only served during rush
hour. In contrast, OC Transpo offers a variety of peak only routes that run only on weekdays
during rush hour. The peak routes are indicated by red numbers on bus stop signs (see Figure
4.23) and travel to major employment areas and the downtown core too (OC Transpo, 2010) As
well, OC Transpo also offers express routes whereas VIVA does not; only York Region Transit’s
conventional bus service has express routes. OC Transpo’s express routes run during weekday
rush hour and allow riders to travel between suburban communities and the downtown core (for
an increased fare). Express routes are indicated by green numbers on bus stop signs, illustrated in
Figure 4.23. When compared to OC Transpo, VIVA lacks specialized route servicing, including
express and peak hour routes.
Another major difference between VIVA and OC Transpo’s route services is the hours of
operation. Twenty-four hour service was introduced on the Transitway in 2009 (Connelly, 2011),
which greatly increases passenger reliability. Although headways and wait times are longer later

Chapter 4: Analysis Part 1
Page | 58
at night and early in the mornings, Ottawa residents are able to get to and from their destinations
at all hours of the day. Although VIVA does operate for the majority of the day, from 5:00 am on
weekdays to past midnight on weekday and weekends, it does not offer twenty-four hour service.
However, OC Transpo’s Transitway is much more extensive and longer than YRT’s VIVA
service. As well, VIVA only serves five routes, whereas OC Transpo’s Transitway serves over
eight routes. Therefore, VIVA may not have the demand for more peak hour, express routes, or
twenty-four hour service. This is an area in which YRT can conduct further research, in order to
determine if these types of services would be necessary and useful to VIVA riders.
Figure 4.23: OC Transpo Bus Signs Indicating Peak and Express Routes
(Source; Laura Moebs, 2011)
Ultimately, OC Transpo has more advanced route structuring and services when
compared to YRT. However, OC Transpo’s BRT system has been in place for much longer than
VIVA, and has had over thirty years to perfect its routes and servicing. YRT only offers five
BRT routes, but does have future plans to improve its services through the construction of
rapidways and even a light rail system, which will be further discussed in Chapter 6: Conclusion.
4.1.6. ITS Technology
ITS Technology is an important component of BRT systems; it is a large factor in making
BRT vehicles more efficient and faster, when compared to conventional bus services. Table 4.10

Chapter 4: Analysis Part 1
Page | 59
demonstrates how VIVA compares to OC Transpo with regards to their ITS technology
functions.
Table 4.10: A Comparison of ITS Technology for YRT and OC Transpo
ITS Technology
York Region Ottawa
Yield to Bus Law
Transit Signal Priority
Measures:
Passive (pre timed)
Active (sensing the arrival
of a bus)
Real-Time
Pre-emption
Global Positioning System
(GPS)
Automated Passenger
Counting
Automatic Vehicle Locater
Passenger Information
Systems
Legend
Used in the system Used sometimes in the system Not used in the system
VIVA and OC Transpo have installed a variety of ITS technologies in order to improve transit
operations. One similarity between the two is that both agencies have implemented the Yield to
Bus law. On January 2, 2004, the Province of Ontario introduced a new traffic law requiring
drivers to yield to buses that are re-entering the traffic flow from a bus stop (City of Ottawa,
2010b). Signs have been posted on the back of all transit vehicles (see Figure 4.24) to make
drivers aware of this new law.
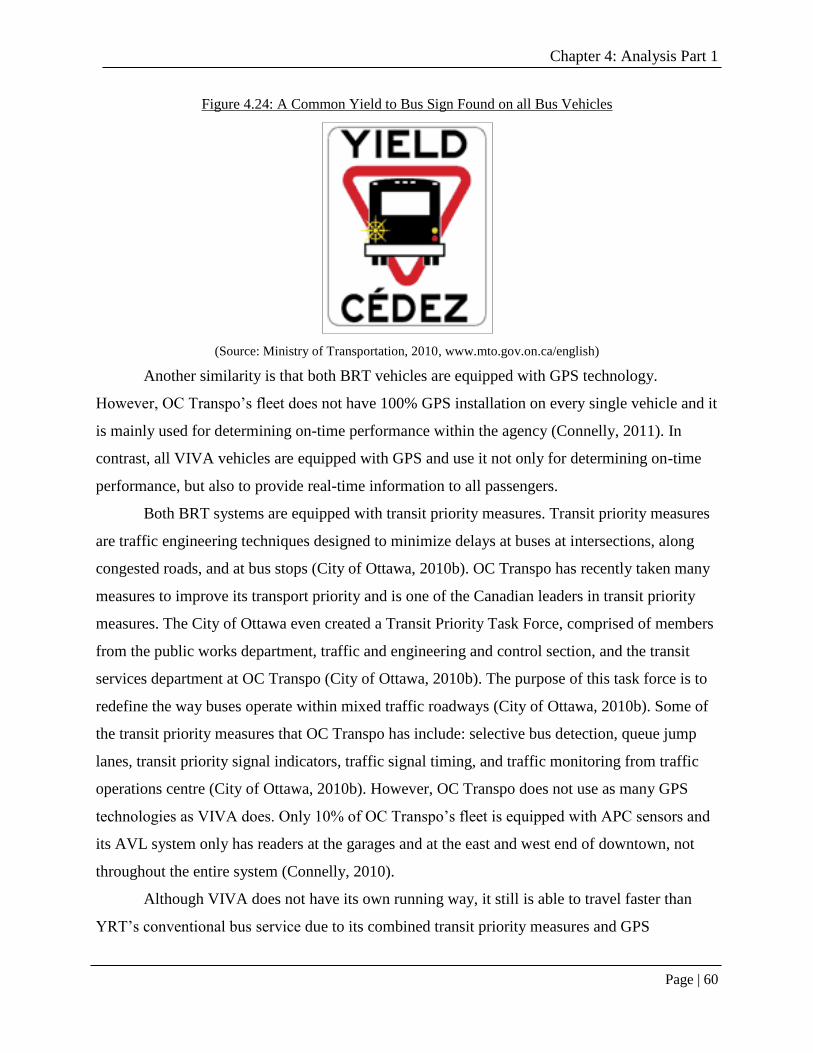
Chapter 4: Analysis Part 1
Page | 60
Figure 4.24: A Common Yield to Bus Sign Found on all Bus Vehicles
(Source: Ministry of Transportation, 2010, www.mto.gov.on.ca/english)
Another similarity is that both BRT vehicles are equipped with GPS technology.
However, OC Transpo’s fleet does not have 100% GPS installation on every single vehicle and it
is mainly used for determining on-time performance within the agency (Connelly, 2011). In
contrast, all VIVA vehicles are equipped with GPS and use it not only for determining on-time
performance, but also to provide real-time information to all passengers.
Both BRT systems are equipped with transit priority measures. Transit priority measures
are traffic engineering techniques designed to minimize delays at buses at intersections, along
congested roads, and at bus stops (City of Ottawa, 2010b). OC Transpo has recently taken many
measures to improve its transport priority and is one of the Canadian leaders in transit priority
measures. The City of Ottawa even created a Transit Priority Task Force, comprised of members
from the public works department, traffic and engineering and control section, and the transit
services department at OC Transpo (City of Ottawa, 2010b). The purpose of this task force is to
redefine the way buses operate within mixed traffic roadways (City of Ottawa, 2010b). Some of
the transit priority measures that OC Transpo has include: selective bus detection, queue jump
lanes, transit priority signal indicators, traffic signal timing, and traffic monitoring from traffic
operations centre (City of Ottawa, 2010b). However, OC Transpo does not use as many GPS
technologies as VIVA does. Only 10% of OC Transpo’s fleet is equipped with APC sensors and
its AVL system only has readers at the garages and at the east and west end of downtown, not
throughout the entire system (Connelly, 2010).
Although VIVA does not have its own running way, it still is able to travel faster than
YRT’s conventional bus service due to its combined transit priority measures and GPS

Chapter 4: Analysis Part 1
Page | 61
technologies. In comparison to OC Transpo, VIVA has fewer transit signal priority measures but
uses more GPS systems, including AVL, APC, and passenger information systems. VIVA has
queue jumping lanes and signal system priority. However, priority is only requested when a
VIVA vehicle is running behind schedule – they do not have priority at every signal. Depending
on how off schedule a VIVA vehicle is, the driver can ask for either a low or high level or transit
priority (York Region Rapid Transit Corporation, 2010). Although this may seem trivial, it helps
to put a vehicle back on schedule. Missing one light can easily put a bus behind schedule,
especially when York Region light cycles can last for up to two minutes (York Region Rapid
Transit Corporation, 2010). Although YRT does not have as many transit signal priority
measures when compared OC Transpo, VIVA’s ITS technology still helps to improve and
increase vehicle reliability and efficiency. One future consideration for YRT is to create its own
Transit Priority Task Force similar to what the City of Ottawa has, to help further improve
vehicle efficiency and speed.
4.1.7. Marketing and Branding
The marketing and branding of a BRT system is extremely important in order to let the
public know that this type of service is superior to the conventional bus. The public should be
aware of the features and benefits that BRT has to offer, which should help to encourage BRT
use. Marketing and branding can be used in many different types of forms and Table 4.11
demonstrates the differences between YRT and OC Transpo’s marketing and branding strategies.

Chapter 4: Analysis Part 1
Page | 62
Table 4.11: A Comparison of BRT Marketing and Branding Strategies
Marketing and Branding
Features
York Region Ottawa
Promotional Programs
Advertising
Public Information
Pricing Incentives
Physical Elements
Maps
Brochures
Internet website
Direct mail
Perceptual Characteristics
System name
Text, colour, and graphics
Images
Logos
Sound
Legend
Used in the system Used sometimes in the system Not used in the system
The marketing of YRT and OC Transpo’s BRT services are very similar, whereas the
branding of both BRT services differs greatly. Considering that OC Transpo’s BRT service has
been in place since the 1980s, residents living in Ottawa have had many years to learn about the
Transitway and its benefits. In contrast, due to the fact that YRT only recently implemented
VIVA within the past six years, YRT has had to create a variety of marketing and branding
strategies in order to reach out to the public.

Chapter 4: Analysis Part 1
Page | 63
YRT has reached out to local communities within York Region to promote VIVA
through various campaigns and promotions. Roadside banners were put up along highways
advertising VIVA’s services, and many public open houses were held (Wright, 2011). As well,
YRT did a lot of promoting at York University, which is one of the stops on VIVA’s purple and
orange routes (Wright, 2011). YRT has created pricing incentives for its riders, by offering
reduced rates when purchasing ten tickets at a time or a monthly pass, as well as offering
decreased rates for high school students. Similarly, OC Transpo also offers pricing incentives,
with reduced rates when purchasing passes and tickets. One difference between the two is that
OC Transpo markets their system directly to university students by offering a “free” bus pass to
Ottawa University and Carleton University students. The bus pass is not actually free because
students pay for this pass through their tuition. However, the rate is extremely reduced (students
save $210 compared to semester passes and $296 compared to monthly passes) and thus, because
the fee is lumped together with tuition, it feels like it is free to students (OC Transpo, 2010).
Regardless, this helps to create awareness for students and encourages them to use public transit.
One innovative campaign that OC Transpo uses is the Ecopass program. This program
provides enrolees with a monthly transit pass through automatic payroll deduction, providing
value-added convenience for customers, as well as a 15% yearly savings in comparison to
regular monthly passes (Connelly, 2011). OC Transpo also recently developed the program
“Seniors ride free on Wednesdays” in which senior citizens get to ride the bus for free on
Wednesdays (Connelly, 2011). These are great programs to encourage transit use and are
something that YRT should think about developing too, in order to further increase ridership and
encourage more transit use.
OC Transpo does have a few other advertising techniques, mainly through posters and
written schedules posted at all stations. OC Transpo does not market for specific BRT routes
though; rather, OC Transpo representatives will go to local communities when a new route is
added, post it in the local paper and at stations, and will post it online (Connelly, 2011). One
similarity is that both YRT and OC Transpo use physical elements to advertise their BRT
system, including maps and brochures, and both have a user-friendly website complete with an
online trip planner. However, OC Transpo only has minimal advertising on-board, whereas YRT
has maps and brochures available on VIVA buses for riders to read or take home. This is one
area of advertising that OC Transpo could improve; it is important to provide up-to-date

Chapter 4: Analysis Part 1
Page | 64
information to current riders. Providing brochures and handouts on-board can be one solution for
retaining riders by providing them with updates and knowledge about the system while
physically riding it.
As previously discussed, the branding between the two BRT systems is very different.
Ultimately, VIVA has its own branding complete with a logo, colour scheme, and a system
name, which is illustrated in Figure 4.25. This figure displays YRT’s use of the VIVA logo “V”,
as well as keeping a consistent colour scheme (blue) for all VIVA objects. In contrast, OC
Transpo does not have any specific branding for its Transitway operations. Although OC
Transpo does have a red and white colour scheme for its fleet, the BRT vehicles do not have
their own distinction when compared to conventional buses. However, it was revealed that OC
Transpo is unable to brand its BRT vehicles (mainly the articulated buses) because OC Transpo
vehicles often change routes; one day a vehicle could be on a BRT route, whereas the next day, it
could transform into a conventional bus route (Connelly, 2011). This poses great difficulty in
branding OC Transpo buses, when they are constantly changing routes and services.

Chapter 4: Analysis Part 1
Page | 65
Figure 4.25: VIVA Branding
(Source: Laura Moebs, 2011)
One significant difference between branding techniques is the use of YRT’s system
name. YRT created the term “VIVA” to represent its BRT system; the name is catchy and easy
to remember. VIVA is branded throughout the entire BRT system, including on all vehicles,
inside the vehicles, on ticket vending machines, at all stations and stops, and even on the real-
time information signage. YRT has been very successful in noting the differences between
VIVA’s service and YRT’s conventional bus system. In contrast, OC Transpo does not have a
specific name for its BRT service; it has coined its running way “The Transitway”, but that is not
a name exclusive to OC Transpo. Despite the fact that OC Transpo’s BRT service has been
extremely successful despite its lack of branding, OC Transpo could learn something from YRT
with respect to promoting its BRT service.
A summary of the findings comparing the two BRT systems are displayed below in Table
4.12.

Chapter 4: Analysis Part 1
Page | 66
Table 4.12: Summary of York Region Transit and OC Transpo’s BRT Criteria Comparison
BRT Criteria York Region Transit OC Transpo
Running ways No running ways present -
VIVA buses run in mixed
traffic
Has its own Class 1
running way (the
Transitway)
Stations and Bus Stops Clearly branded
“vivastations”
Real-time information
present at all stations
Wide variety of passenger
amenities
Lacks security and public
telephones and trash
containers at stations and
bus stops
Lacks station and
Transitway branding
No real-time information
at any stations
Wide variety of passenger
amenities
Security and public
telephones and trash cans
are located at all stations
and bus stops
Vehicles 40 and 60 ft. buses
Interior and exterior
branding
Passenger information on-
board
Electronic signboards and
automated voice
announcements
40 and 60 ft. buses
Limited exterior branding
and no interior branding
No passenger information
on-board
Electronic signboards and
automated voice
announcements
Fare Collection Off-board, proof-of
payment only
Accepts passes (weekly or
monthly)
Fare zones
On-board and off-board
payment
Accepts passes (weekly or
monthly)
System-wide fares
Route Structure and Servicing No express routes
Limited peak/counter peak
routes
5 BRT routes
3.5 minutes – 11 minutes
peak wait times
Many express routes
Many peak/counter peak
routes
8 BRT routes
2 minutes – 3 minutes
peak wait times
ITS Technology All buses equipped with
GPS technology
Real-time information
No task-force
Some buses equipped with
GPS technology
No real-time information
Transit Priority Task Force
Marketing and Branding Offers promotional
programs
Extensive branding and
unique system name
Offers promotional
programs
Limited branding and lack
of system name

Chapter 5: Analysis Part 2
Page | 67
5.0. Analysis Part 2
5.1. Discussion
This chapter begins with a general discussion about the findings, which includes the
importance of running ways in a BRT system. Following this discussion will be the answers to
the three research questions:
1. How does York Region’s BRT system compare to Ottawa’s BRT system?
2. What can York Region Transit learn from OC Transpo?
3. What can OC Transpo learn from York Region Transit?
5.1.1. An Overview of the Findings: The Importance of Running Ways
There have been numerous discussions throughout the literature debating what exactly
constitutes a Bus Rapid Transit system. There is uncertainty among elected officials and even
some transit professionals about what BRT is and how it differs from conventional bus services
and systems (FTA, 2009). This question is difficult to answer because the options available for
each BRT element are so extensive that there is a large variety of integrated BRT systems (FTA,
2009). BRT’s inherent flexibility means that no two BRT systems will look exactly the same
within a given region, let along between two different metropolitan areas. BRT has multiple
definitions which specify certain aspects that are included into a BRT system. Some definitions
outline a more general approach to BRT, such as “a rapid mode of transportation that can
combine the quality of rail transit and the flexibility of buses” (Thomas, 2001, p. 4). However,
some definitions specify BRT criteria: “flexible, rubber-tired form of rapid transit that combines
stations, vehicles, services, running ways, and ITS elements into an integrated system with a
strong image and identity” (Kittelson & Associates Inc., 2007; Levinson et al., 2003a). The fact
that there is a range of BRT definitions makes it very difficult to assess whether or not a bus
system really is BRT, or just simply includes a few BRT elements into its system.
Although BRT is comprised of seven components, the running way component is the
most important; how running ways are incorporated into a BRT system is the major defining
factor for the entire BRT system (FTA, 2009). Running ways are the most critical element in
determining speed and reliability of BRT services and as the BRT element most visible to the

Chapter 5: Analysis Part 2
Page | 68
general public, running ways can have a significant impact on the image and identity of the
system (FTA, 2009)
When comparing VIVA to OC Transpo, the most significant difference between the two
is the running ways; VIVA currently has no running ways and runs in mixed traffic, whereas OC
Transpo has over 30 km of a Class 1 Running way (The Transitway). However, YRT markets
VIVA’s service as “rapid transit”; the agency states that “Viva vehicles are so un-bus like, we
call them rapid transit vehicles and they’re like nothing you’ve experienced before” (York
Region Transit, 2006). Clearly YRT has marketed and branded VIVA to ensure that the public is
aware that it is a true BRT system. Within the past six years, various organizations and agencies
have included YRT in their case studies and research. For example, the Center for Urban
Transportation Research (CUTR) at the University of South Florida prepared a final report titled
“Best Practices in Transit Service Planning.” Within the report, CUTR outlined that “YRT’s
BRT system, named VIVA, is designed to provide frequent, limited stop service using distinct
vehicles, ITS, off-board payment, and queue-jump lanes” (CUTR, 2009).
Similarly, various literature and case studies of BRT have included VIVA, demonstrating
that it is considered a true BRT system in the transportation industry. For example, the Canadian
Urban Transit Association (CUTA) released a brief paper on “Bus Rapid Transit: A Canadian
Perspective” in November 2007. This report outlines what BRT is, its benefits, existing and
planned services in Canada, and the future needs of BRT in Canada. VIVA is listed under
“existing services”, which demonstrates that VIVA is considered a “true” BRT system within
Canada, despite the fact that it does not have its own running way.
However, YRT’s lack of running ways will be further examined in this discussion, in
order to see how this limitation affects YRT overall. The following table summarizes YRT’s
BRT components and features.

Chapter 5: Analysis Part 2
Page | 69
Table 5.1: An Overview of York Region Transit’s BRT Components and Features
BRT Criteria
BRT Components and Features
Running Ways There are currently no running ways present; VIVA
runs with mixed traffic
Stations and Bus Stops Real-time information is present at every station and
bus stop
Ticket vending machines are located at every station
and bus stop
Shelters and passenger amenities are provided
Branded with VIVA’s logo
Vehicles 40 ft. and 60 ft. articulated buses
Electronic signboards and automated passenger
announcements
Low-floor, accessible buses
Interior and exterior is branded with VIVA’s logo
Passenger information is available on-board
Riders board through all doors
Fare Collection Proof-of-payment
Monthly and weekly passes accepted
Pricing incentives exist
Route Structure and Servicing Serves employment centres and high traffic areas
Has peak-only routes and rush hour routes
Connects with local YRT routes
Intelligent Technology Systems Real-time information
GPS
Queue-jump lanes
Signal system priority
Marketing and Branding Advertised to the public through posters, banners,
open houses
VIVA branding is present throughout the entire
system (uses logos, images, and a consistent colour
scheme)
Table 5.1 demonstrates that VIVA does offer features and benefits that YRT’s conventional bus
service does not have. VIVA is faster and more frequent than the conventional bus, while
offering real-time information at all stations and bus stops, therefore providing increased
efficiency and convenience to riders. Boarding is quick due to proof-of-payment, and the use of
articulated vehicles allows for increased passenger capacity. Although VIVA does not currently
have its own running ways, YRT have implemented a variety of measures to ensure that VIVA
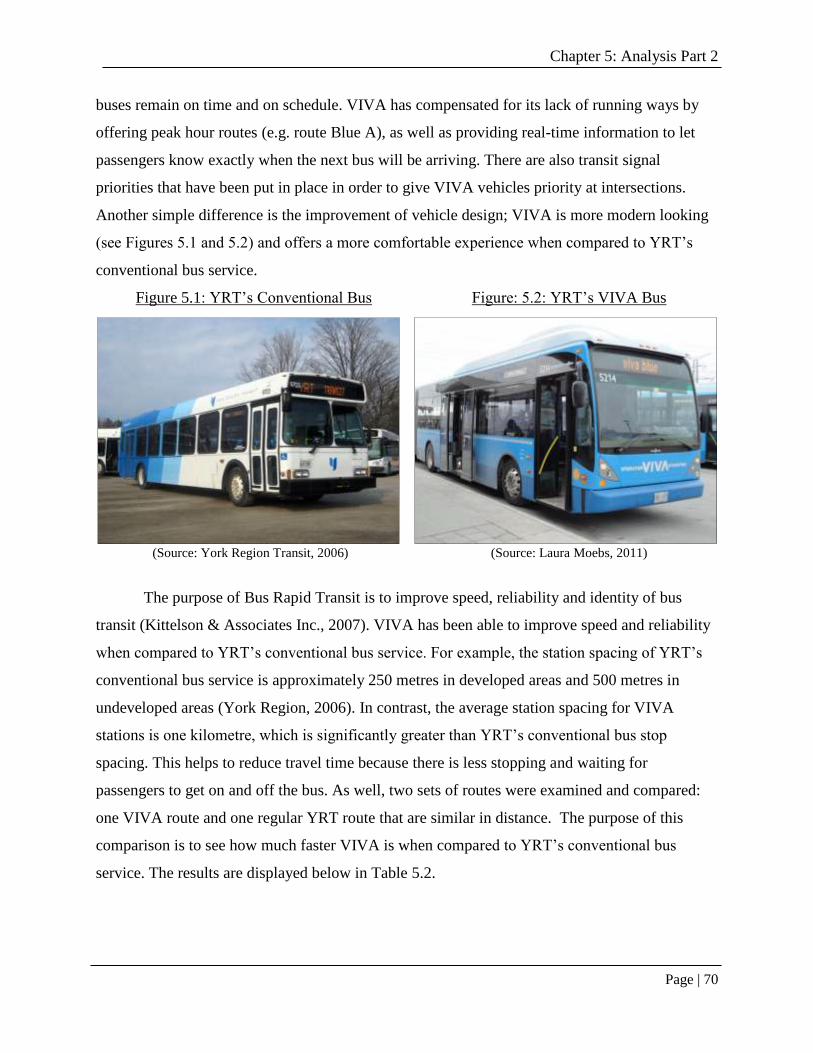
Chapter 5: Analysis Part 2
Page | 70
buses remain on time and on schedule. VIVA has compensated for its lack of running ways by
offering peak hour routes (e.g. route Blue A), as well as providing real-time information to let
passengers know exactly when the next bus will be arriving. There are also transit signal
priorities that have been put in place in order to give VIVA vehicles priority at intersections.
Another simple difference is the improvement of vehicle design; VIVA is more modern looking
(see Figures 5.1 and 5.2) and offers a more comfortable experience when compared to YRT’s
conventional bus service.
Figure 5.1: YRT’s Conventional Bus Figure: 5.2: YRT’s VIVA Bus
(Source: York Region Transit, 2006) (Source: Laura Moebs, 2011)
The purpose of Bus Rapid Transit is to improve speed, reliability and identity of bus
transit (Kittelson & Associates Inc., 2007). VIVA has been able to improve speed and reliability
when compared to YRT’s conventional bus service. For example, the station spacing of YRT’s
conventional bus service is approximately 250 metres in developed areas and 500 metres in
undeveloped areas (York Region, 2006). In contrast, the average station spacing for VIVA
stations is one kilometre, which is significantly greater than YRT’s conventional bus stop
spacing. This helps to reduce travel time because there is less stopping and waiting for
passengers to get on and off the bus. As well, two sets of routes were examined and compared:
one VIVA route and one regular YRT route that are similar in distance. The purpose of this
comparison is to see how much faster VIVA is when compared to YRT’s conventional bus
service. The results are displayed below in Table 5.2.

Chapter 5: Analysis Part 2
Page | 71
Table 5.2: A Comparison of Two VIVA and YRT Conventional Bus Service Routes
Features Viva YRT Conventional Bus Service
FIRST ROUTE COMPARISON
Route Name Purple Route 3
Origin Richmond Hill Centre Bayview Avenue and John Street
Destination York University York University
Route Distance 12.6 km 11.9 km
Service Frequency 11-15 minutes 20 minutes
Approximate Driving Time 18 minutes 19 minutes
Bus Travel Time 26 minutes 37 minutes
SECOND ROUTE COMPARISON
Route Name Purple or Blue Route 99
Origin Richmond Hill Centre Richmond Hill Centre
Destination Finch GO Bus Terminal Finch GO Bus Terminal
Route Distance 7.1 km 7.1 km
Service Frequency 3.5-15 minutes 25 minutes
Approximate Driving Time 15 minutes 15 minutes
Bus Travel Time 23 minutes 26 minutes
Table 5.2 demonstrates that VIVA routes are often quicker and have shorter wait times in
comparison to YRT conventional bus routes. It should be noted though that only two routes were
compared and thus, this does not reflect every single comparative route between VIVA and
YRT’s conventional bus service. However, it does help to demonstrate that VIVA is more rapid
that regular conventional YRT.
Although VIVA is faster than YRT’s conventional bus service, the service is still
significantly slower when compared to OC Transpo’s Transitway. OC Transpo Transitway has
speed limits of 70-90km/hour between stations and 50 km/h in the station areas (OC Transpo,
2010). In 2009, OC Transpo’s average bus speeds were 26.41 km/hour (CUTA, 2009). In
contrast, YRT’s average bus speeds were lower at 23.58 km/hour (CUTA, 2009). This is due to
the fact that VIVA runs with mixed traffic and all VIVA vehicles have to follow York Region’s
speed limits which can range from 50 km/hour to 80 km/hour. Thus, separate running ways
really do help to enhance BRT service speed and efficiency.
VIVA was one of the first new and innovative transit services offered within the GTA,
and has done its job of providing a reliable, rapid transit service throughout York Region.
Therefore, although York Region does not yet have its own running ways, it is definitely a form

Chapter 5: Analysis Part 2
Page | 72
of rapid transit. The lack of running ways has not impeded VIVA’s mandate to provide reliable
and efficient bus transit. Additionally, future plans for VIVA include the development and
implementation of five rapidways, which will be dedicated lanes in the centre of the road to
allow VIVA vehicles to avoid congestion and maintain faster, more consistent travel times (York
Region Rapid Transit Corporation, 2010). Construction has already begun for two of the
rapidway projects and overall project completion is expected to finish in 2020 (York Region
Rapid Transit Corporation, 2010). This project will only further enhance VIVA’s BRT status and
will no doubt, complete the transformation of VIVA into a fully developed, true BRT system.
5.2. How Does York Region Transit’s BRT System compare to OC Transpo’s BRT system?
After reviewing documents, observing and riding each BRT system, and interviewing
transit professionals from each agency, it has been found that YRT’s BRT system (VIVA)
compares very well to OC Transpo’s BRT system in some areas, but is not comparable in others.
However, considering that OC Transpo’s BRT system has been in service since the 1980s and is
respected worldwide, VIVA is not entirely lacking when compared to OC Transpo. There are a
few major differences, one being YRT’s lack of running ways, but through a careful examination
of YRT and OC Transpo’s BRT features and components, YRT is not too far behind when it
comes to providing BRT services and passenger amenities. However, it is important to look at
the history and policy considerations that were taken to implement these two systems. A brief
review of both BRT systems’ policy and governmental considerations will reveal that Ottawa’s
transit services were supported by the regional government beginning in the 1970s, whereas
York Region Transit did not even exist until 2001.
The difference between the two transit agencies began years ago, beginning in the 1970s.
Ottawa’s transit services were run by one agency (OC Transpo), whereas in the 1970s, York
Region Transit did not exist; each individual municipality situated in York Region ran their own
transit service until 2001, when the regional government amalgamated the five individual transit
authorities into one (York Region Transit, 2006). Regional planning and governance was an
integral component in Ottawa, which helped to successfully link transportation and land use in
the Ottawa-Carleton region (Cervero, 1998). The idea of a Transitway surfaced in the early
1970s as a tool to guide growth and as a response to the mobility needs of a rapidly growing
population (Cervero, 1998).

Chapter 5: Analysis Part 2
Page | 73
The concept of building a rapid transit system was first introduced into the Official Plan
in 1974 (Connelly, 2011). Although many other cities at the time were pursuing LRT transit
options, Ottawa opted for a busway, due to its cheap building and operating costs. Additionally,
it made the most sense given the region’s preferred settlement pattern – concentrated
employment and spread-out residences (Cervero, 1998). Land use development was not intense
and the low densities meant that relatively few people could actually walk to the rapid transit
station (Connelly, 2011). Ottawa has embedded the importance of transportation into its
Regional and Official Plans for many years and this led to the successful development of the
Transitway, which now serves thousands of riders each day, and millions each year (OC
Transpo, 2008).
In contrast, York Region was a little behind in developing its future transportation plans.
York Region Transit was not created until 2001, and its Transportation Master Plan (TMP) was
only approved in 2002. The purpose of the TMP was to define a long-term transportation vision
and integrated road and transit network plan that will support growth in York Region to the year
2031 (York Region Transit, 2006). The TMP also reaffirmed the need to achieve a balanced
transportation system by recommending an implementation of rapid transit in four corridors
(Cansult et al., 2002). Therefore, the plans for VIVA were a result of policy and governmental
initiatives similar to OC Transpo, but unfortunately, it was thirty years after Ottawa began its
Transitway development.
The implementation of VIVA has been a combined effort of York Region’s TMP and the
Government of Ontario’s future plans for transit improvements across the province, including
Metrolinx’s Regional Transportation Plan, titled “The Big Move” and the MoveOntario 2020
initiative (Metrolinx, 2011). Metrolinx is helping to fund YRT’s rapidway construction projects,
and is working to transform regional transit expansion in the GTA (Metrolinx, 2011). Policy and
governmental action has been a large factor for both York Region and Ottawa’s BRT
development. The only difference is that the regional government of Ottawa realized much
earlier the benefits of investing in public transit, including the benefits that BRT could bring to
Ottawa.
Although OC Transpo has had a thirty year head start for improving its BRT system,
YRT has done a fairly good job at providing the major components of a BRT system (minus a
running way), in order to provide rapid and reliable transportation to York Region residents

Chapter 5: Analysis Part 2
Page | 74
(despite the lack of early policy efforts to support transportation initiatives in the region). When
compared to OC Transpo, YRT has similar vehicles, similar station and stop amenities and
similar route structure and servicing, but on a much smaller scale. However in some areas, YRT
surpasses OC Transpo with better features and amenities, which will be further discussed in the
next section. Ultimately, both BRT systems have been successful in retaining and increasing
ridership, and both have great projects planned for the future, which will be discussed in Chapter
6: Conclusions.
5.3. Recommendations: What can York Region learn from OC Transpo?
OC Transpo has long established itself as a successful BRT system, known worldwide for
its famous Transitway. Thus, York Region has a lot to learn from OC Transpo, not only in the
implementation of running ways, but in other aspects of BRT too. The following is a discussion
on what York Region Transit can learn from OC Transpo’s Transitway and BRT service, looking
specifically at each BRT criteria:
5.3.1. Running Ways
OC Transpo’s Transitway provides 33 km of congestion and traffic free travel, providing
maximum efficiency and convenience (OC Transpo, 2008). It was constructed in pieces and in
such a way that BRT vehicles were still able to drive on the Transitway even if a new section
was being added (Connelly, 2011). The Transitway expands all across the Ottawa-Carleton
region and greatly reduces commuting and travel time for passengers. York Region’s Phase Two
of VIVA is the construction of rapidways. By the end of 2020, five rapidways should be present
in York Region (York Region Rapid Transit Corporation, 2010).
Recommendation: Continue with VIVA rapidway construction and model its design after OC
Transpo’s Transitway. As well, it is recommended that York Region Transit considers
connecting and expanding its rapidways in the future, rather than making them separate and
limited to only five routes within York Region.

Chapter 5: Analysis Part 2
Page | 75
5.3.2. Bus Stations and Stops
Two station features that were noted during BRT observation was the use of security
telephones and trash cans located at all Transitway stops in Ottawa. The security telephones are
bright yellow and easily accessible to use in case of an emergency. Currently, not all vivastations
have public telephones, let alone security telephones provided. As well, it was found that trash
cans were also located at every Transitway stop, whereas not all vivastations provided trash cans.
Recommendation: Install security telephones or public telephones at all vivastations, in order to
improve passenger safety and the overall security of YRT. A second recommendation is to
provide trash cans at every vivastation, in order to discourage littering and encourage the use of
proper waste management.
5.3.3. Vehicles
Although OC Transpo and VIVA vehicles are very similar, one noted difference was the
amount of information provided to passengers on the electronic signboards located inside the
buses. OC Transpo provides not only the next stop, but also the approaching intersection and
time of day on its electronic signboards. This is convenient for passengers to know the exact time
of day and to see their exact destination location on-board. VIVA vehicles only display the next
stop.
Recommendation: Increase the amount of information on VIVA’s electronic signboards, to
include the time and upcoming intersection at the next stop.
5.3.4. Fare Collection
VIVA stations are all equipped with a ticket vending machine, in order for riders to
purchase proof-of-payment. However, many vivastations only have one ticket vending machine
provided, which could be problematic if it stops working or the power goes out. Additionally, a
second ticket vending machine would be helpful during peak volume periods when there is a
higher volume of passengers needing to purchase tickets.

Chapter 5: Analysis Part 2
Page | 76
Recommendation: To consider installing two ticket vending machines at all vivastations, or to
provide a back-up method of proof-of-payment, to ensure that passengers will always be able to
purchase a VIVA ticket, regardless of passenger volume, power or technical difficulties.
5.3.5 Route Structuring
OC Transpo offers a large variety of express and peak-hour routes. However, VIVA only
has one peak-hour route, two rush hour routes, and no express routes. As well, VIVA’s
headways are longer when compared to OC Transpo. For some VIVA routes, the headways are
two or three minutes, but can be as long as fifteen minutes. In contrast, OC Transpo’s headways
are maximum twelve minutes.
Recommendation: To offer a wider variety of peak-hour and express routes, and to try to
decrease headways by a few minutes, in order to encourage more ridership and to make VIVA
more attractive and comparable to the private automobile.
5.3.6. ITS Technology
Ottawa has a wide variety of traffic signal priority measures, as well as a Transit Priority
Task Force which helps to redefine the way buses operate within mixed traffic roadways (City of
Ottawa, 2010b). VIVA does use a few transit signal priorities (e.g. signal system priority), but
not as extensively as OC Transpo does.
Recommendation: Add more traffic signal priority measures to VIVA’s system. Considering
there are no running ways present in York Region, improving and adding traffic signal priority
measures would only help to improve service and reduce headways. A second recommendation
is to consider implementing a Transit Priority Task Force, similar to the City of Ottawa’s, in
order to gather experts to improve ITS technology within VIVA’s system.
5.3.7. Marketing and Branding
OC Transpo uses many campaigns to advertise and encourage the use of public transit,
including: offering Eco Passes to various companies, providing special transit fare deals on
specific days (e.g. seniors ride free on Wednesday), and providing “free” bus passes to university

Chapter 5: Analysis Part 2
Page | 77
students. As well, OC Transpo has four service centres located around the city, where riders can
purchase passes and obtain transit information. Although YRT does have pricing incentives, it
does not have the same kind of advertising and marketing campaigns that OC Transpo does. As
well, YRT does not have its own service centre.
Recommendation: Create a YRT/VIVA customer service centre located in a high volume area
(e.g. Promenade Mall), where York Region residents can talk to YRT representatives in person,
purchase tickets, and obtain transit information. A second recommendation is to consider
offering more marketing and advertising campaigns, to appeal to specific demographic groups
(e.g. providing a reduced rate for university students or offering free transit to seniors on a
specific day). This could help to encourage more YRT ridership.
5.4. What can OC Transpo Learn from York Region Transit?
Much of what YRT can learn from OC Transpo are small, simple lessons that would
assist in improving the overall convenience and efficiency of the system. Not everything listed is
major, such as the development of a running way; sometimes small, seemingly insignificant
factors such as installing trash cans at all vivastations can help to improve the overall BRT
experience. However, it is important to note that just because OC Transpo’s BRT service has
been established and successful for over thirty years, that it does not need any improvements.
After analyzing and comparing OC Transpo and YRT’s VIVA service, it can be seen that YRT
can learn from OC Transpo, but OC Transpo can also learn from YRT.
The following is a list of recommendations for OC Transpo, based on what was found
from YRT.
5.4.1. Real-Time Information
OC Transpo does not currently offer real-time information to its passengers. However,
real-time information is an important component of BRT; it helps to improve reliability and
makes passengers feel at ease because they know exactly when the next bus will arrive.
Therefore, it is recommended that OC Transpo installs real-time information at all Transitway
stops and stations, to let passengers know exactly when the next bus is coming.

Chapter 5: Analysis Part 2
Page | 78
5.4.2. Automated Passenger Counting
Although OC Transpo has many ITS features already in place (transit priority, GIS, etc.),
the agency lacks the use of Automated Passenger Counting technology. This can help to provide
increased ridership information statistics to OC Transpo which can help lead to improve route
servicing and frequency. It is therefore recommended that OC Transpo equips a greater
percentage of OC Transpo’s fleet with Automated Passenger Counting.
5.4.3. Transitway Branding
OC Transpo brands its entire fleet with similar colours and uses the OC Transpo logos on
all vehicles, stations and bus stops. However, OC Transpo’s BRT system does not have its own
branding specific to the Transitway. Branding a BRT service gives it a distinct identity, which
results in clear and positive public recognition and improved acceptance of the service (APTA,
2010). Thus, it is recommended that OC Transpo improves branding for the Transitway, to let
customers know the difference between OC Transpo’s BRT service and conventional bus
service. This could help lead to increased customer loyalty, improved employee satisfaction and
retention, increased brand value, and a potential for attracting development activity for Ottawa
(APTA, 2010).
5.4.4. On-Board Passenger Information
After conducting observations, it was found that OC Transpo lacks on-board passenger
information compared to VIVA vehicles. It is therefore recommended that OC Transpo provides
more passenger information on-board, using maps, brochures, or advertisements.
5.4.5. Fares
York Region Transit allows its passengers to use their proof-of-purchase for a two hour
time period, even if a passenger gets off the bus. It is recommended that OC Transpo considers
implementing a two-hour use on all fare purchases. This could help to encourage more transit
use, especially for people running errands or travelling under a two-hour time span. As well,
York Region Transit uses fare zones, whereas OC Transpo only has one fare for the entire
system. However, a passenger taking a short trip pays the same amount as a passenger taking a

Chapter 5: Analysis Part 2
Page | 79
much longer trip; is this fair? Therefore, one idea for OC Transpo to think about is the
implementation of fare zones, to make passengers pay based on how far they actually travel.
Transit agencies have the ability to learn from one another, even if one is more well-
established than the other. This analysis has demonstrated that both BRT systems have strengths
and weaknesses in various BRT criteria, and each system has room for improvements.
Fortunately, some of the recommendations listed above are currently being implemented, or are
being discussed within each transit agency. The future goals and plans for YRT and OC Transpo
will be discussed in the following chapter, Chapter 6: Conclusions.

Chapter 6: Conclusion
Page | 80
6.0. Conclusion
6.1. Discussion
This report examined and compared two BRT systems: York Region Transit’s VIVA
service and OC Transpo. OC Transpo’s BRT system has been well-established for over thirty
years, whereas VIVA was only implemented in 2005. Thus, it was assumed that YRT could learn
from OC Transpo’s successful development of a BRT system. The purpose of this report was to
compare both BRT systems to answer three research questions:
1. How does York Region’s BRT system compare to Ottawa’s BRT System?
2. What can York Region Transit learn from OC Transpo?
3. What can OC Transpo learn from York Region Transit?
These questions were answered through a literature review, document review, observations, and
interviews. Some similarities were found between the two BRT systems, including passenger
information, basic station amenities, vehicle design, and the use of Intelligent Technology
Systems. However, many differences were also found, which aided in the development of
recommendations for each BRT system. The following table illustrates a summary of the major
findings and conclusions between the two systems.

Chapter 6: Conclusion
Page | 81
Table 6.1: A Summary of the Major Findings and Conclusions between York Region Transit and OC Transpo’s
BRT Systems
FINDINGS
Category York Region OC Transpo
Running Ways No running ways present Class 1 running way with
separate lanes for buses only
Real-Time Information Offers real-time information No real-time information present
Fare Structure Fare zones One fare for the entire system
Branding A large amount of BRT branding Minimal BRT branding
Route Structuring Limited express and peak hour
routes
A wide variety of express and
peak hour routes
Security Telephones Not present at most stations and bus
stops
Present at every station and bus
stop
On-Board Passenger
Information
A wide variety of on-board
passenger information
Very limited on-board passenger
information, if any
Transit Priority Measures Limited transit signal priority
measures
Many transit signal priority
measures
CONCLUSIONS
How does York Region’s
BRT system compare to
Ottawa’s BRT system?
VIVA is comparable to OC
Transpo, with many of the same
features and benefits (minus a
running way)
One major difference is that
Ottawa’s government and OP
introduced the idea of rapid
transit years before YRT did
What can OC Transpo learn
from York Region Transit?
The importance of running ways
and how it helps to improve the
overall system
Ottawa is known worldwide for
its convenient and efficient
Transitway BRT service
What can OC Transpo learn
from York Region Transit?
YRT has an abundance of system
branding, on-board information, and
real-time information
BRT branding, increasing
passenger information and using
real-time information
RECOMMENDATIONS
Recommendations for each
BRT System Expand future rapidways
Install security/public
telephones at all stations
Provide more trash cans
Increase information on
electronic signboards
Install two ticket vending
machines at all stations
Increase peak hour/express
routes
Decrease headways
Add more traffic signal priority
measures
Create a Transit Priority Task
Force
Develop a customer service
centre
Increase marketing/advertising
campaigns
Install real-time information
Improve Transitway
branding
Offer more on-board
passenger information
Use more APC technology
Develop a time-frame for the
use of fare tickets
Implement fare zones

Chapter 6: Conclusion
Page | 82
From this research, it has been found that firstly, despite its lack of running ways, York
Region Transit has managed to provide an efficient and integrated bus system (VIVA) that is
superior to conventional bus travel; VIVA’s service is still faster and more “rapid” when
compared to YRT’s conventional bus service. VIVA offers real-time information, along with
proof-of-payment fare collection which helps to speed up boarding and reduce travel time.
Additionally, VIVA’s articulated buses offer more passenger capacity and increased comfort
when compared to YRT’s conventional vehicles. However, fully separated running ways still
provide more speed and efficiency, compared to buses that run with mixed traffic. The fact that
OC Transpo’s routes perform better even on city streets with transit preferential lanes and,
especially on the Transitway, is indicated by the average speed differences between the two
systems as indicated in Section 5.1.1 “An Overview of the Findings: The Importance of Running
Ways”. OC Transpo’s Transitway speeds are faster than VIVA’s because the Transitway has its
own speed limit. In contrast, VIVA buses have to obey York Region speed limits, which can be
as slow as 50 km/hour. In contrast, the Transitway speed limits range from 70 to 90 km/hour.
Secondly, this research has found that VIVA is comparable to OC Transpo. Although the
histories of both systems are different in the sense that Ottawa’s government and Official Plans
included the idea of rapid transit long before York Region Transit even existed, VIVA and OC
Transpo have many of the same features and benefits. However, the biggest difference is that OC
Transpo has its Transitway, whereas VIVA runs with mixed traffic and currently has no running
ways. Fortunately, Phase 2 of VIVA is the development of five rapidways, which will be
discussed in Section 6.2: The Future of VIVA. As well, another slight difference between the
two systems is that VIVA is more of a suburban transit system whereas OC Transpo’s system is
more urban with some suburban features.
Lastly, this research has found that not only can York Region Transit learn from OC
Transpo, but OC Transpo can also learn from York Region Transit. After comparing the two
BRT systems, it has been found each system has some key strengths, but also some weaknesses
too. The lessons learned from OC Transpo were translated into recommendations for York
Region. The following list is a summary of the key recommendations made for York Region
Transit’s VIVA service:

Chapter 6: Conclusion
Page | 83
Continuing VIVA rapidway construction and connecting/expanding VIVA’s
rapidways after implementation
Install security telephones and public telephones at all vivastations
Provide trash cans at every vivastation
Increase the amount of information provided on VIVA’s electronic signboards to
include the local time and the approaching intersection
Installing two ticket vending machines at every vivastation in case of emergencies or
high passenger volume
Offering more peak hours/express routes
Decrease headways by a few minutes
Add more traffic signal priority measures
Implement a Transit Priority Task Force
Develop a YRT/VIVA customer service centre
Offer more marketing/advertising campaigns
This research has also revealed that OC Transpo can learn from VIVA’s service too. The
following list outlines the key recommendations made for OC Transpo:
Install real-time information at all Transitway stops
Add Automated Passenger Counting technology to more OC Transpo vehicles
Improve Transitway branding
Offer more on-board passenger information
Develop a time-frame for the use of OC Transpo fare tickets
Consider implementing fare zones
Some of the proposed recommendations are tasks that are on each transit agency’s agenda. The
following sections will discuss the future plans and projects of both VIVA and OC Transpo.
6.2. The Future of VIVA
York Region Transit’s VIVA system was developed in three Phases. Phase One, which is
already complete, was a plan to build ridership and public support through the creation of a Bus
Rapid Transit system (York Region Rapid Transit Corporation, 2010). The future of VIVA lies

Chapter 6: Conclusion
Page | 84
in Phase Two, which includes the construction of exclusive rapidways to separate transit vehicles
from general traffic and reduce overall travel times by up to 40%. Phase Three includes the
development of a light rail transit system (York Region Rapid Transit Corporation, 2010).
Phase Two is already underway and construction has begun on two rapidways. New
vivastations are also being built, and will include new urban design elements such as pedestrian
friendly boulevards and green, open spaces. Figures 6.1 and 6.2 illustrate the future rapidway in
Newmarket and a future vivastation design.
Figure 6.1: View of a Future VIVA Rapidway in Newmarket
(Source: York Region Rapid Transit Corporation, 2010, www.vivanext.com)
Figure 6.2: View of a Future Vivastation Canopy
(Source: York Region Rapid Transit Corporation, 2010, www.vivanext.com)

Chapter 6: Conclusion
Page | 85
The goal for YRT is to have all five rapidways completed and running by 2020 (York Region
Rapid Transit Corporation, 2010). Once the rapidways are complete, Phase Three will be the
creation of two LRT lines. The BRT rapidways are being designed in such a way that they will
be easily convertible to LRT. However, LRT will not be constructed until ridership increases, in
order to respond to future ridership demand (York Region Rapid Transit Corporation, 2010).
Additionally, YRT plans to implement PRESTO, an integrated smart card within the next year
(York Region Transit, 2006). PRESTO will help to improve overall passenger experience by
improving fare collection and making it more convenient to pay and ride the bus (York Region
Transit, 2006).
6.3. The Future of OC Transpo
OC Transpo has many future plans that will be implemented in the next few years. Some
of the plans are simple design and construction improvements. For example, OC Transpo wants
to improve customer experience by adding more platform protection to all Transitway stops.
Specifically, OC Transpo wants to extend their transit shelter roofs to reach all the way out to the
curb, in order to better protect riders from the weather (Connelly, 2011). As well, OC Transpo
plans on utilizing more of their technology capabilities by providing real-time information at all
stations and bus stops. The goal is to implement real-time information and install Automated
Vehicle Locaters on all OC Transpo vehicles by the end of 2011 (Connelly, 2011). OC Transpo
also plans to implement a smart card (PRESTO), which will increase boarding efficiency and
allow for easier transfers and payments (Connelly, 2011).
The major changes to OC Transpo include the implementation of a LRT system. The idea
of Ottawa’s Light Rail project began in 2007; construction is expected to take approximately five
years and full service is expected by 2019 (City of Ottawa, 2011). The entire project is estimated
to cost $2.1 billion but is forecasted to reduce carbon dioxide emissions by approximately 38,000
tonnes and it is expected that by 2031, OC Transpo ridership will increase by 78% from 98
million trips to 166 million annual trips (City of Ottawa, 2011).
6.4. Limitations
There are a few limitations to this research. Firstly, there is not a standard definition of
Bus Rapid Transit. Therefore, a BRT system may be classified as BRT by some definitions, but
not others. However, multiple definitions of BRT were provided throughout this report and not

Chapter 6: Conclusion
Page | 86
one single definition was used to define BRT. There is a need for a one definition of BRT to be
adopted and disseminated within Canada, in order to make BRT standard across the country
(CUTA, 2007).
Secondly, it should be noted that not every single aspect of BRT was examined and
compared for this research. Only the common BRT criteria which were extracted from the
literature supported this research. This may have altered the findings, depending on the BRT
criteria that were used for the comparison.
Thirdly, on-time performance and reliability would have been a valuable point of
comparison. OC Transpo provided this type of data in their Annual Performance reports, which
was very easy to obtain. However, YRT’s on-time performance and reliability data did not
appear to be available or easily attainable. Therefore, due to limited data, this type of comparison
was unable to be completed.
Fourthly, another limitation is the fact that observations were only able to take place
during the winter months due to time constraints. This has the potential to influence the findings,
due to weather issues. For example, the bus floors were often dirty due to snow and slush that
were tracked onto the bus from passengers. However, this observation was not factored into the
analysis, because it was only due to the weather; if it were summertime, the buses would be
much cleaner without the worry of snow and salt stains. As well, winter weather has the ability
to influence service with increased delays and reduced speeds for safety issues. Fortunately, the
winter weather did not affect any observations made during site visits and bus riding.
Lastly, one final limitation is that due to the scope of this paper, some interesting
analyses could not take place. For example, there is the potential to conduct an economic
analysis, examining BRT’s effects on residential and commercial property attractiveness and the
potential for Transit Oriented Development along York Region and Ottawa’s BRT corridors.
However, this is beyond the scope of the report and thus, could be conducted for future research.
6.5. Final Thoughts
This research has led to the conclusion that Bus Rapid Transit is an effective mode of
transit that provides efficient and sustainable transportation. It has helped to increase public
transit ridership and has transformed bus travel into a sophisticated and convenient mode of
travel. Both York Region Transit and OC Transpo has seen increases in ridership since the
implementation of their BRT systems and with constant system upgrades and improvements,

Chapter 6: Conclusion
Page | 87
ridership will only continue to increase. This research has also led to the conclusion that no
transit agency or system is perfect; there is always room for improvement. For example, OC
Transpo established its Transitway and BRT system over thirty years ago in the 1980s. However,
OC Transpo still has a few weak areas (e.g. real-time information and branding) which could be
improved to further strengthen their services. VIVA is still a relatively new BRT system and
YRT conducted a lot of research and completed best case practices in order to help them develop
VIVA. Through their research, YRT would have realized the importance and benefits of running
ways, but still chose to develop the first phase of VIVA with no running ways.
The lessons learned from York Region Transit and OC Transpo can help with the
implementation or improvements to other BRT systems worldwide. Both BRT systems have
strengths and weaknesses, but overall demonstrate successful BRT implementation. Many transit
plans require case studies to be conducted prior to development, in order to find best case
practices or scenarios. Both OC Transpo and York Region Transit’s VIVA service are the perfect
case studies for implementing successful BRT systems. Ottawa’s system illustrates how to
achieve a good running way design, whereas York Region’s system illustrates how to achieve
implementing successful real-time information and proof-of-payment fare collection, which is a
common feature of fare collection for BRT systems. There is the potential for further research for
these two BRT systems; in five or ten years, another comparison could be made between YRT
and OC Transpo to see how the service and system improvements have affected ridership levels
and the flow of traffic in York Region and Ottawa. As well, it would be interesting to note
whether or not each transit agency has achieved their goals set out in their Transportation Master
Plans and Official Plans, and whether or not construction has stayed on schedule.

Chapter 7: Bibliography
Page | 88
7.0. Bibliography
Al-Dubikhi, S., & Mees, P. (2010). Bus rapid transit in Ottawa, 1978 to 2008 –
Assessing the Results. TRP, 81(4), 407-424.
American Public Transportation Association (APTA) (2010). BRT Branding, Imaging and
Marketing. APTA Bus Rapid Transit Working Group. 1-10.
Bitterman, A., & Hess, D.B. (2008). Bus rapid transit identity meets universal design.
Disability & Society, 23(5), 445-459.
Canadian Urban Transit Association (CUTA) (2007). Bus Rapid Transit: A Canadian
Perspective. Issue Paper 25. Retrieved October 15, 2010 from www.cutaactu.ca
Canadian Urban Transit Association (CUTA). (2009). Ontario Urban Transit Fact Book 2009
Operating Data. Ontario Ministry of Transportation. 1-147.
Cansult Limited & Marshall Macklin Monaghan. (2002). York Region Transportation Master
Plan. York Region. 1-86.
Carey, G.N. (2002). Applicability of Bus Rapid Transit to Corridors with Intermediate
Levels of Transit Demand. Journal of Public Transportation, 5(2), 97-114
Center for Urban Transportation Research (CUTR) (2009). Best Practices in Transit Service
Planning.1-118.
Cervero, R. (1998). The Transit Metropolis: A Global Inquiry. Washington: Island Press.
City of Ottawa (2010a). Portrait of Ottawa. Retrieved November 1, 2010 from
http://www.ottawa.ca/visitors/about/portrait_en.html
City of Ottawa (2010b). Transit Priority: Getting the Most Out of Your Transportation
Investment. 1-18.
City of Ottawa. (2011). Ottawa Light Rail. Retrieved February 20, 2011 from
http://www.ottawalightrail.ca/en/project-plan/next-steps
Connelly, C. (2011). Personal Interview. January 21, 2011, Ottawa, ON: OC Transpo Office.
Federal Transit Administration (FTA). (2009). Characteristics of Bus Rapid transit for Decision
Making. U.S. Department of Transportation.1-412.
Galicia, L.D., Cheu, R.L., Machemehl, R.B., & Liu, H. (2009). Bus Rapid Transit
Features and Deployment Phases for U.S. Cities. Journal of Public Transportation,
12(2), 23-28.
Chapter 7: Bibliography
Page | 89
Government of Ontario. (2007). Places to Grow. Accessed February 15, 2011 from
https://www.placestogrow.ca/index.php
Greater Toronto Transportation Authority. (2008). The Big Move – Transforming
Transportation in the Greater Toronto and Hamilton Area. Metrolinx. 1-111.
Haider, Z. (2003). The future of emerging technologies in public transit in Greater
Toronto Area. Master’s Thesis. Ryerson University.
Hensher, D.A., & Golob, T.F. (2008) Bus rapid transit: a comparative assessment.
Transportation, 35, 501-518.
Jarzab, J.T., Lightbody, J., & Maeda, E. (2002). Bus Rapid Transit: An Overview.
Journal of Public Transportation, 5(2), 31- 46.
Kennedy, C.A. (2002). A comparison of the sustainability of public and private
transportation systems: Study of the Greater Toronto Area. Transportation, 29,
459-493.
Kittelson & Associates Inc. (2007). Bus Raid Transit Practitioner’s Guide. Transit
Cooperative Research Program, Report 118. 1-255.
Koonce, P., Ringert, J., Urbanik, T., Rotich, W., & Kloos, B. (2002). Detection Range
Setting Methodology for Signal Priority. Journal of Public Transportation, 5(2),
115-136.
Levinson, H.S., Zimmerman, S., Clinger, J., & Rutherford, S.C. (2002). Bus Rapid
Transit: An Overview. Journal of Public Transportation, 5(2), 1-30.
Levinson, H., Zimmerman, S., Clinger, J., Rutherford, S., Smith, R.L., Cracknell, J., &
Soberman, R. (2003a). TCRP Report 90 Bus Rapid Transit Volume 1: Case Studies in
Bus Rapid Transit. Transportation Research Board, 90(1), 1-54.
Levinson, H.S., Zimmerman, S., Clinger, J., Gast, J., Rutherford, S., & Bruhn E. (2003b).
TCRP Report 90 Bus Rapid Transit Volume 2: Implementation Guidelines.
Transportation Research Board, 90(2), 1-230.
Marshall Macklin Monaghan Ltd. (2007). Best Practices Review – Sustainable Transportation
Programs Across North America. 1-67.
Metrolinx. (2011). The Big Move. Metrolinx. Retrieved January 5, 2011 from
http://www.metrolinx.com/mx_pgm/en/default.aspx
Ministry of Transportation. (2010). Yield to Bus. Retrieved February 20, 2011 from
http://www.mto.gov.on.ca/english/faq/other.shtml

Chapter 7: Bibliography
Page | 90
National Center for Transit Research. (2005). Enhancing the Rider Experience: The
Impact of Real-Time Information on Transit Ridership. Center for Urban
Transportation Research, University of South Florida. 1-74.
OC Transpo. (2008). Transitway: Past Present, Future – 25th
Anniversary. OC Transpo.
Pamphlet.
OC Transpo (2010). Public Transit in Canada’s Capital. Retrieved November 1, 2010
from http://www.octranspo1.com/
Polzin, S.E., & Baltes, M.R. (2002). Bus Rapid Transit: A Viable Alternative? Journal of
Public Transportation, 5(2), 47-70.
Potter, S (2007). Exploring Approaches Towards a Sustainable Transport System.
International Journal of Sustainable Transportation, 1(2), 115-131.
Pucher, J. (2004). Public Transportation. In S. Hanson, S. & G. Giuliano (Eds.), The Geography
of Urban Transportation Third Edition (pp. 199-236). New York, NY: Guilford Press
Rathwell, S., & Schijn, S. (2002). Ottawa and Brisbane: Comparing a Mature Busway
System with Its State-of-the-Art Progeny. Journal of Public Transportation, 5(2),
163 - 182.
Steer Davies Gleave (2008). VIVANext Benefits Case. Prepared for Metrolinx.
Retrieved November 1, 2010 from
http://www.metrolinx.com/Docs/general/Benefits_Case_VIVA_final.pdf
Thomas, E. (2001). Paper presentation at the Institute of Transportation Engineers
Annual Meeting. Chicago, IL.
Transit Research Board of the National Academies (TRB). (2010). A Guide for Planning and
Operating Flexible Public Transportation Services. Transit Cooperative Research
Program. 1-98.
Transportation Research Board. (2001). Making Transit Work – Insight from Western
Europe, Canada, and the United States. Special Report 257. 1-170.
Vuchic, V.R. (2002). Bus Semirapid Transit Mode Development and Evaluation. Journal
of Public Transportation, 5(2), 71- 96.
Wright, M. (2011). Personal Interview. January 6, 2011, Richmond Hill, ON: York Region
Transit Office.
Yin, R.K. (2009). Case Study Research Design and Methods. Fourth Edition. SAGE
Publications, Inc. Thousand Oaks, California.

Chapter 7: Bibliography
Page | 91
York Region. (2006). Publications. The Regional Municipality of York. Retrieved January 15,
2011 from http://www.york.ca/default.htm
York Region Transit. (2006). Viva. The Regional Municipality of York. Retrieved September
15, 2010 from http://www.yorkregiontransit.com/services/viva.asp
York Region. (2010). Business Plan and Budget: Operating. The Regional Municipality of York.
1-373.
York Region Rapid Transit Corporation. (2010). VivaNext. Retrieved November 1, 2010
from http://www.vivanext.com/
Young, D., Keil, R. (2010). Reconnecting the disconnected: The politics of infrastructure
in the in-between city. Cities, 27, 87-95.
Chapter 8: Appendices
Page | 92
8.0. Appendices
8.1. Appendix A: Observing BRT - General Observations
The following is a list of what was generally observed when riding each BRT system:
1. Running Ways
What types of running ways exist?
Are the running ways integrated into mixed traffic or do they have their own lanes/bus
ways
Are HOV lanes present? If yes, are they being utilized? Are people abusing the HOV
lanes?
If the running ways are integrated into mixed traffic, are the buses getting stuck in traffic?
Are the busways flowing with minimal traffic?
2. Stations and bus stops
What is present at bus stations and bus shelters?
Is seating available?
Are the stations and bus shelters clearly marked?
Approximately how far are the bus stops and stations from each other?
What type of lighting was present?
Is transit information available at both stations and bus stops? What kinds of information
are available? Is it real time information?
Are there telephones/security phones present?
Are there any passenger services or amenities present or nearby?
Are the stations or stops dirty? Well-maintained?
Are the stations or stops conducive to various types of weather?
3. Vehicles
What do the vehicles look like? How are they designed?
What is the layout like?
Are they heated/have air conditioning?
What is the door configuration?
How easy is it to board the bus? How low/high are the floors? Is it wheelchair accessible?
Is there information on board?
Is there an overhead speaker announcing each stop?
Is there an electronic signboard displaying each stop?
How many people (approximately) are on the vehicle?
4. Fare Collection
What types of fare collection are available both off and on-board?
What are the methods of payment?
How fast does it take people to pay the bus driver (if payment is made on-board)?

Chapter 8: Appendices
Page | 93
5. Route Structure and Services
What types of service are available?
Where do the routes go to and from? Major employment centre? The CBD?
Is there all day service? Peak hour service? High frequency service?
What is the speed of the vehicle?
How often does the vehicle make stops?
What are the hours of operation? Is there late night service?
6. ITS Technology
Is there passenger information at stops? On the vehicles?
Can I get real-time information?
How can I find out this information?
Are there traffic signal priorities? If yes, is it effective?
7. Marketing and Branding
Is there branding? What does it look like?
How is the system marketed?
Do all features of the system have the same logo, fonts, colouring, etc.?

Chapter 8: Appendices
Page | 94
8.2. Appendix B: Interview Questions
Some of these questions were created by Matt Peak, a Project Manager and Clean Transportation
and Policy Analyst from the company WestStart-CALSTART. The specific questions were
found in:
WestStart-CALSTART. (2005). Bus Rapid Transit Ridership Analysis. Prepared for the U.S.
Department of Transportation. 1-43.
However, some of the questions were also created by the researcher. The following is a list of
questions that were asked at both interviews:
1. What is your position at (insert name of transit agency)? What does your position entail?
2. What is the date that (insert name of transit agency) BRT service was first implemented?
3. What were the major reasons for implementing BRT? What was the goal of its
implementation?
4. Was your BRT modeled of off another city’s BRT system?
5. How was it decided what features were initially going to be developed for your BRT system?
(e.g. real time information, running ways, specialized marketing/branding, etc.).
6. How many BRT routes did you operate when your BRT service was first implemented?
i. Since BRT service implementation, how many routes has your agency added?
ii. How many BRT routes does your agency currently operate?
iii. What is your agency’s plan for expanding BRT service and/or increasing the number
of routes?
7. How many transit buses does your agency have in service, on both BRT and non-BRT
routes? That is,
i. How many are specifically BRT designed vehicles?
ii. How many are specifically non-BRT designed vehicles?
8. What was the overall transit bus ridership level before and after BRT service
implementation?
9. For specific transit bus routes that were converted to BRT service, what were the ridership
levels before and after conversion?
i. What does this say about how many choice riders your agency’s BRT system
attracted?
10. Which makes and models of BRT vehicles do you currently have in service?
11. How are these vehicles “branded” with regard to BRT amenities? (i.e. unique vehicle paint
schemes, low-floor interiors, rail like designs, etc.).

Chapter 8: Appendices
Page | 95
i. Have these BRT amenities been present in your BRT service operation since service
implementation?
12. For BRT routes that replaced general transit buses with BRT specific buses, how were
ridership levels affected?
13. If there was ridership growth after BRT service implementation, what do you attribute to this
growth? Is there raw data that you can provide? Focus groups, anecdotal information, rider
surveys? Quantified ratings of elements relating to vehicles?
14. Was growth simply due to travel time savings, or were riders influenced by the bus interior?
If so, what specific parts of the interior (seats, windows, lighting, sound level, etc.)?
15. Were exterior elements at least partially responsible for increased ridership? (signage, paint
scheme, advertising).
16. How far are these new choice riders riding? What are the reasons for the new trips? ( e.g.
work, recreational activities, etc.).
17. What time of day did ridership growth occur?
18. What are your current ridership levels for BRT routes and for your agency in general?
19. Did the specific look and amenities of the BRT vehicle assist or impede the system’s
acceptability by local communities?
20. What do you think is the most important BRT feature that helps to attract new passengers and
retain current ones?
21. Do you feel that BRT is an effective method of public transportation for gaining and
increasing ridership?
22. What do you think can be improved with your agency’s BRT system?
23. What are the future plans for your agency’s OC Transpo’s BRT service? What is the major
focus?
24. How important is BRT for the future of public transportation?