Embed Size (px)
Citation preview
energies
Article
Experiments on the Performance of Small HorizontalAxis Wind Turbine with Passive Pitch Control byDisk Pulley
Yu-Jen Chen and Y. C. Shiah *
Institute of Aeronautics and Astronautics, National Cheng Kung University, Tainan 70101, Taiwan;[email protected]* Correspondence: [email protected]; Tel.: +886-6275-7575 (ext. 63623)
Academic Editor: Frede BlaabjergReceived: 23 March 2016; Accepted: 4 May 2016; Published: 7 May 2016
Abstract: The present work is to design a passive pitch-control mechanism for small horizontal axiswind turbine (HAWT) to generate stable power at high wind speeds. The mechanism uses a diskpulley as an actuator to passively adjust the pitch angle of blades by centrifugal force. For this design,aerodynamic braking is caused by the adjustment of pitch angles at high wind speeds. As a markedadvantage, this does not require mechanical brakes that would incur electrical burn-out and structuralfailure under high speed rotation. This can ensure the survival of blades and generator in severoperation environments. In this paper, the analysis uses blade element momentum theory (BEMT) todevelop graphical user interface software to facilitate the performance assessment of the small-scaleHAWT using passive pitch control (PPC). For verification, the HAWT system was tested in a full-scalewind tunnel for its aerodynamic performance. At low wind speeds, this system performed the sameas usual, yet at high wind speeds, the equipped PPC system can effectively reduce the rotationalspeed to generate stable power.
Keywords: blade element momentum theory; passive pitch control; disk pulley; small horizontalaxis wind turbine
1. Introduction
Nowadays, it has been widely recognized that wind is one of the promising green energy sourcesfor its non-regional availability. This has driven significant resource efforts devoted to the study ofwind energy (e.g., [1–3]). In principal, there are two major classifications for wind turbines, namelyvertical axis wind turbine (VAWT) and horizontal axis wind turbine (HAWT). Typically, a VAWTcan generate more power at a relatively low wind speed in urban areas compared to the HAWT.Nevertheless, when they both operate at the same wind speed, a HAWT is expected to generate morepower since the aerodynamic drag is less and the entire rotation of all blades receives more windpower. Currently, small-scale wind turbines are gaining more attention due to the fact that risingenergy costs have driven the consumer to seek alternative solutions of independent power supply.Despite the high efficiency of the HAWT, its main drawback is the potential risk of circuit burnout orstructural failure when the wind speed exceeds its critical value. The present research is to provide asolution to this problem of the small-scale HAWT by an innovative passive pitch-control mechanism.
Over the years, there are various solutions proposed, including the short-circuit braking system,Choudhry et al. [4] has outlined the control requirements for dynamic stall [5] for wind turbines, wherethree passive control methodologies have been investigated. By applying this approach of dynamicstall control, Yen and Ahmed [6] showed synthetic jet actuation to be effective for a vertical axiswind turbine (VAWT). By the stall-controlled approach, the system may sustain its stable operation
Energies 2016, 9, 353; doi:10.3390/en9050353 www.mdpi.com/journal/energies
Energies 2016, 9, 353 2 of 13
generating power under a critical wind speed. However, when operating beyond the critical windspeed, the system will be at the risk of over-running due to a rapid rise of receiving excessive windpower. Another approach proposed by Xie et al. [7,8] was to design a folding blade of turbine rotor,controlled by a servo motor [7] or a passive mechanism regulation [8]. The main drawback of thisdesign is its difficulty of retaining dynamic equilibrium at variable speeds of rotation. Anotherinnovative design of a flywheel rotor system was proposed by Jauch and Hippel [9] to control therotation of HAWT via inertia effect. Still, this flywheel mechanism has very limited capability ofbraking when the HAWT is subjected to very high wind speeds. Having borrowed the design oftrailing edge flap of airplanes, Barlas et al. [10] used active flaps on a small-scale HAWT. An alternativedesign to protect the HAWT system is the so called “yaw control” mechanism, which applies theprincipal of misalignment to achieve the goal of reducing rotational speeds. Under operations athigh wind speeds, the system shall keep yawing to seek a balance with the incoming wind. Amongmany innovations in this category, Kragh [11] proposed a rotor speed-dependent yaw control of windturbines. Although applicable, this design has a potential problem of structural fatigue occurring atits support due to the dynamic loads arising from the frequent oscillations of the system. For this,Ekelund [12] presented mathematical models obtained from the equations of motion and proposed touse a yaw servo for attenuation of structural dynamic load oscillations. Additionally, Shariatpanah [13]developed another model for PMSG-based wind turbine with yaw control. Despite its effectiveness,the active control system requires a complicated design of an electro-mechanical sub-system andthus, the system reliability is still an issue when operated under long lasting sever conditions. Someother active pitch-angle control can be found in [14–17]. Still, these systems require relatively delicateelectro-mechanical systems for fulfilling the function of active control and its reliability is always anissue of concerns. Moreover, the issue of consuming extra electric power is another drawback of theconsumer’s concern for using the active control. To the authors' personal opinions, designs of passivepitch-angle control on these aspects are comparably more ideal in consideration of system reliabilityand saving of electricity. Li [18] presented a self-powered passive adaptive control to adjust pitchangle of blade. The principal of the self-powered passive adaptive control is to use aerodynamic forceacting upon on the blade as the control power under balance with the spring force. Hertel et al. [19]developed a simple strip theory model for the analysis of a conceptual passive pitch control, providingthe aerodynamics as a function of the relative wind vector’s magnitude and local angle of attack.
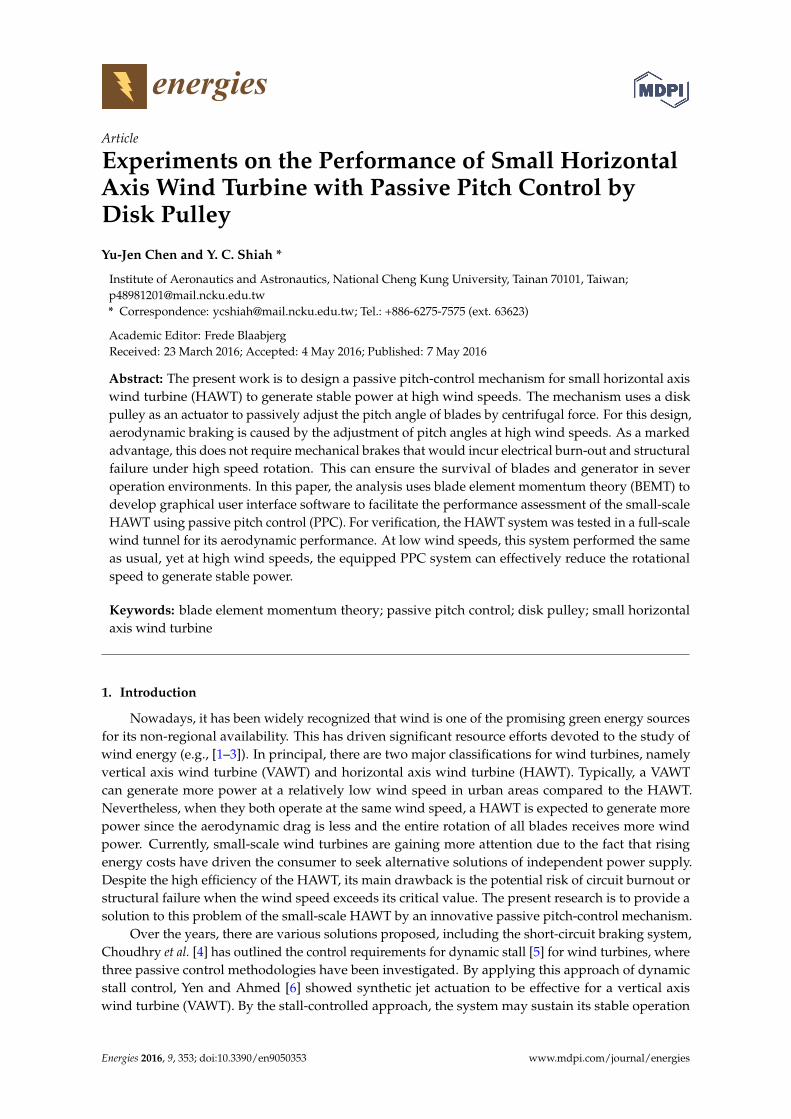
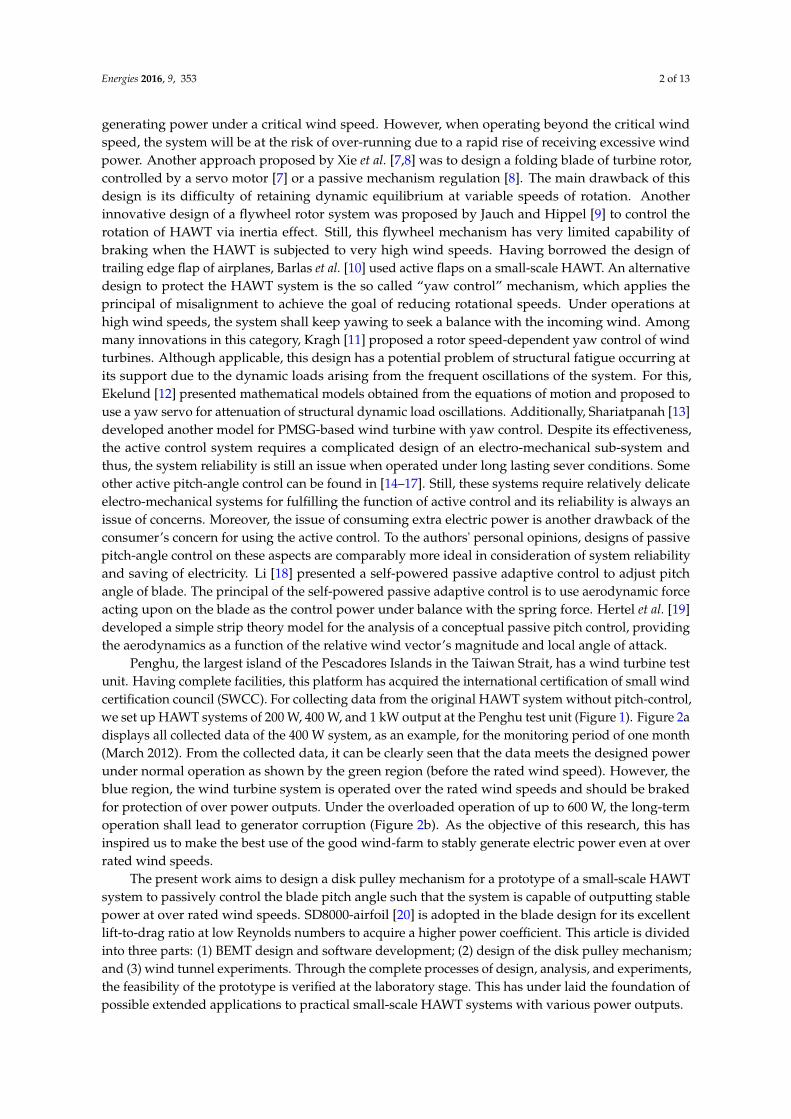
Penghu, the largest island of the Pescadores Islands in the Taiwan Strait, has a wind turbine testunit. Having complete facilities, this platform has acquired the international certification of small windcertification council (SWCC). For collecting data from the original HAWT system without pitch-control,we set up HAWT systems of 200 W, 400 W, and 1 kW output at the Penghu test unit (Figure 1). Figure 2adisplays all collected data of the 400 W system, as an example, for the monitoring period of one month(March 2012). From the collected data, it can be clearly seen that the data meets the designed powerunder normal operation as shown by the green region (before the rated wind speed). However, theblue region, the wind turbine system is operated over the rated wind speeds and should be brakedfor protection of over power outputs. Under the overloaded operation of up to 600 W, the long-termoperation shall lead to generator corruption (Figure 2b). As the objective of this research, this hasinspired us to make the best use of the good wind-farm to stably generate electric power even at overrated wind speeds.
The present work aims to design a disk pulley mechanism for a prototype of a small-scale HAWTsystem to passively control the blade pitch angle such that the system is capable of outputting stablepower at over rated wind speeds. SD8000-airfoil [20] is adopted in the blade design for its excellentlift-to-drag ratio at low Reynolds numbers to acquire a higher power coefficient. This article is dividedinto three parts: (1) BEMT design and software development; (2) design of the disk pulley mechanism;and (3) wind tunnel experiments. Through the complete processes of design, analysis, and experiments,the feasibility of the prototype is verified at the laboratory stage. This has under laid the foundation ofpossible extended applications to practical small-scale HAWT systems with various power outputs.
Energies 2016, 9, 353 3 of 13
Energies 2016, 9, 353 3 of 13
Figure 1. Small-scale HAWT systems tested at Penghu.
(a) (b)
Figure 2. (a) Monitoring data of the 400 W HAWT; and (b) damage of the generator of the 400 W
HAWT.
2. Blade Modeling by BEMT and Development of GUI Software
2.1. Theoretical Modeling of Blade Design
Our blade design is based on BEMT, which has been widely applied in industry for the blade
design of wind turbines. The flowchart collating the blade design process according to [21,22] is
shown in Figure 3a. Table 1 lists all parameters for this blade design. Figure 3b shows the prototype
and the CAD drawing of the blade design following processes depicted by the flowchart. Table 2 lists
all designed values of chord lengths and pitch angles for ten sections of the airfoil SD8000 [20] as
shown in Figure 4a. All defined angles are indicated in Figure 4b, where a is the axial induction factor
and a' is the angular induction factor.
Figure 1. Small-scale HAWT systems tested at Penghu.
Energies 2016, 9, 353 3 of 13
Figure 1. Small-scale HAWT systems tested at Penghu.
(a) (b)
Figure 2. (a) Monitoring data of the 400 W HAWT; and (b) damage of the generator of the 400 W
HAWT.
2. Blade Modeling by BEMT and Development of GUI Software
2.1. Theoretical Modeling of Blade Design
Our blade design is based on BEMT, which has been widely applied in industry for the blade
design of wind turbines. The flowchart collating the blade design process according to [21,22] is
shown in Figure 3a. Table 1 lists all parameters for this blade design. Figure 3b shows the prototype
and the CAD drawing of the blade design following processes depicted by the flowchart. Table 2 lists
all designed values of chord lengths and pitch angles for ten sections of the airfoil SD8000 [20] as
shown in Figure 4a. All defined angles are indicated in Figure 4b, where a is the axial induction factor
and a' is the angular induction factor.
Figure 2. (a) Monitoring data of the 400 W HAWT; and (b) damage of the generator of the 400 W HAWT.
2. Blade Modeling by BEMT and Development of GUI Software
2.1. Theoretical Modeling of Blade Design
Our blade design is based on BEMT, which has been widely applied in industry for the bladedesign of wind turbines. The flowchart collating the blade design process according to [21,22] is shownin Figure 3a. Table 1 lists all parameters for this blade design. Figure 3b shows the prototype andthe CAD drawing of the blade design following processes depicted by the flowchart. Table 2 lists alldesigned values of chord lengths and pitch angles for ten sections of the airfoil SD8000 [20] as shownin Figure 4a. All defined angles are indicated in Figure 4b, where a is the axial induction factor and a1
is the angular induction factor.

Energies 2016, 9, 353 4 of 13Energies 2016, 9, 353 4 of 13
(a) (b)
Figure 3. (a) Flowchart of the blade design from BEMT; and (b) CAD for ten sections of the blade and
prototype.
(a) (b)
Figure 4. (a) Geometry of airfoil SD8000; and (b) BEMT angle definition for an airfoil.
Table 1. The parameter of the blade.
Item Parameter Item Parameter
ρ 1.225 (kg·m−3) R 0.41 (m)
TSR 3.7 Root of blade 0.14 (m)
α 5° B 3
Vs 12 (m/s) Rated Power 200 (W)
Table 2. The Geometry parameter of the blade.
Section r/R Chord Length (m) Pitch Angle (deg)
1 0.341 0.06 0
2 0.415 0.093 18.48
3 0.488 0.107 15.27
4 0.561 0.095 12.81
5 0.634 0.085 10.86
6 0.707 0.076 9.29
7 0.780 0.070 8.00
8 0.854 0.064 6.92
9 0.927 0.059 6.00
10 1.000 0.055 5.21
Principally, the effective radius of rotation R [21–25] is determined by:
PVR ps C 3
5.0 (1)
Figure 3. (a) Flowchart of the blade design from BEMT; and (b) CAD for ten sections of the bladeand prototype.
Energies 2016, 9, 353 4 of 13
(a) (b)
Figure 3. (a) Flowchart of the blade design from BEMT; and (b) CAD for ten sections of the blade and
prototype.
(a) (b)
Figure 4. (a) Geometry of airfoil SD8000; and (b) BEMT angle definition for an airfoil.
Table 1. The parameter of the blade.
Item Parameter Item Parameter
ρ 1.225 (kg·m−3) R 0.41 (m)
TSR 3.7 Root of blade 0.14 (m)
α 5° B 3
Vs 12 (m/s) Rated Power 200 (W)
Table 2. The Geometry parameter of the blade.
Section r/R Chord Length (m) Pitch Angle (deg)
1 0.341 0.06 0
2 0.415 0.093 18.48
3 0.488 0.107 15.27
4 0.561 0.095 12.81
5 0.634 0.085 10.86
6 0.707 0.076 9.29
7 0.780 0.070 8.00
8 0.854 0.064 6.92
9 0.927 0.059 6.00
10 1.000 0.055 5.21
Principally, the effective radius of rotation R [21–25] is determined by:
PVR ps C 3
5.0 (1)
Figure 4. (a) Geometry of airfoil SD8000; and (b) BEMT angle definition for an airfoil.
Table 1. The parameter of the blade.
Item Parameter Item Parameter
ρ 1.225 (kg¨ m´3) R 0.41 (m)TSR 3.7 Root of blade 0.14 (m)
α 5˝ B 3Vs 12 (m/s) Rated Power 200 (W)
Table 2. The Geometry parameter of the blade.
Section r/R Chord Length (m) Pitch Angle (deg)
1 0.341 0.06 02 0.415 0.093 18.483 0.488 0.107 15.274 0.561 0.095 12.815 0.634 0.085 10.866 0.707 0.076 9.297 0.780 0.070 8.008 0.854 0.064 6.929 0.927 0.059 6.00
10 1.000 0.055 5.21

Energies 2016, 9, 353 5 of 13
Principally, the effective radius of rotation R [21–25] is determined by:
R “b
0.5ρV3s CpπP (1)
The tip speed ratio (TSR) of the system, denoted by λ [21–25] here, is defined by:
λ “Rω
Vs(2)
which is 3.7 for the present design. The speed ratio for each blade section [21–25] is:
λr “ λ´ r
R
¯
(3)
where r is the rotational radius of each blade section as defined in Table 2. Then, the tip speed ratioat each section given in Equation (3) can be substituted into the following equation to give the localinflow angle by [21–25]:
ϕ “ tan´1ˆ
23λr
˙
(4)
For giving more detailed derivations, consider the Figure 4b. From the figure, one may readilyhave the following relationships from geometrical considerations [21–25]:
tanϕ “Vsp1´ aqωrp1` a1q
“1´ a
p1` a1qλr(5)
For the case when a1 = 0 (no wake rotation) and a = 1/3 (the Betz optimum rotor) [21–25],one obtains:
tanϕ “2
3λr(6)
Thus, the values of λr and ϕ obtained above can be further substituted into the following equationto give the corresponding cord length c [21–25]:
c “8π rsinϕ
3 B CLλr(7)
For gaining optimal performance, the angle of attack α should be selected to achieve its maximumlift-to-drag ratio. With reference to Figure 4b, the pitch angle of blade [21–25] for each section of therotor is:
θp “ ϕ´ α (8)
A piece of GUI-software, called HAWT-Blade, was developed in MATLAB, where all pertinentformulas in Equations (1)–(8) are integrated altogether, as shown in Figure 5. As can be observed fromthis figure, the pitch angles and chord lengths near the root are modified for the prototype design.This is mainly due to the large pitch angles and chord lengths near that area, which would causemanufacturing difficulties and overweight of the blade; however, their contributions to the overallresulting torque are very trivial.

Energies 2016, 9, 353 6 of 13
Energies 2016, 9, 353 6 of 13
Figure 5. The analysis by HAWT-Blade.
2.2. GUI of Blade Performance Development
Having provided all design parameters for the blade design, one may then calculate the resulting
torque Q [21–25] by:
iii
ii
Dii
Lrel rcCCUB
Q
10
1
)()(2cossin
2
(9)
where Δ denotes the constant interval length between two consecutive sections, C(i)
L /C(i)
D represents
the lift/drag coefficient of the i-th section, i is the local inflow angle of the i-th section, ci and ri stand
for the cord length and the rotational radius of the i-th section, respectively. Another piece of GUI-
software, called HAWT-Perform, was developed using Equation (9) to calculate the output torque.
Figure 6 is the GUI of HAWT-Perform, showing such analysis of the resulting torque, output
mechanical power, and the corresponding Cp (power coefficient) of the blade design.
Figure 6. The performance curve of blade predicted by HAWT-Perform.
As displayed in Figure 6, one may readily obtain corresponding performance curves with an
input of pitch control angle for a known geometry of a blade design. From this, it may be easily
Figure 5. The analysis by HAWT-Blade.
2.2. GUI of Blade Performance Development
Having provided all design parameters for the blade design, one may then calculate the resultingtorque Q [21–25] by:
Q “ρ B2
U2rel ∆
10ÿ
i“1
´
CpiqL sinϕi ´ CpiqD cosϕi
¯
ciri (9)
where ∆ denotes the constant interval length between two consecutive sections, CpiqL /CpiqD representsthe lift/drag coefficient of the i-th section, φi is the local inflow angle of the i-th section, ci and ristand for the cord length and the rotational radius of the i-th section, respectively. Another pieceof GUI-software, called HAWT-Perform, was developed using Equation (9) to calculate the outputtorque. Figure 6 is the GUI of HAWT-Perform, showing such analysis of the resulting torque, outputmechanical power, and the corresponding Cp (power coefficient) of the blade design.
Energies 2016, 9, 353 6 of 13
Figure 5. The analysis by HAWT-Blade.
2.2. GUI of Blade Performance Development
Having provided all design parameters for the blade design, one may then calculate the resulting
torque Q [21–25] by:
iii
ii
Dii
Lrel rcCCUB
Q
10
1
)()(2cossin
2
(9)
where Δ denotes the constant interval length between two consecutive sections, C(i)
L /C(i)
D represents
the lift/drag coefficient of the i-th section, i is the local inflow angle of the i-th section, ci and ri stand
for the cord length and the rotational radius of the i-th section, respectively. Another piece of GUI-
software, called HAWT-Perform, was developed using Equation (9) to calculate the output torque.
Figure 6 is the GUI of HAWT-Perform, showing such analysis of the resulting torque, output
mechanical power, and the corresponding Cp (power coefficient) of the blade design.
Figure 6. The performance curve of blade predicted by HAWT-Perform.
As displayed in Figure 6, one may readily obtain corresponding performance curves with an
input of pitch control angle for a known geometry of a blade design. From this, it may be easily
Figure 6. The performance curve of blade predicted by HAWT-Perform.

Energies 2016, 9, 353 7 of 13
As displayed in Figure 6, one may readily obtain corresponding performance curves with an inputof pitch control angle for a known geometry of a blade design. From this, it may be easily observedhow the variation of pitch control angle affects the resulting performance curves. Just as independentexamples for demonstrations, the pitch control angles 0˝/10˝/20˝/30˝ were input separately inHAWT-Perform for wind speed equaling 12 m/s. Each set of outcomes are recorded and plotted inFigure 7a,b for the power coefficients and torques, respectively. From these plots, it is evident that thesystem shall work with reduced torque and power coefficients. The issue remains to design a propermechanism to adjust pitch control angles at high wind speeds in a passive way. Before elaborating thispoint of designing the mechanism, it is important to grasp the effect of changing pitch control angle onthe resulting flow field around blade, which will be addressed next.
Energies 2016, 9, 353 7 of 13
observed how the variation of pitch control angle affects the resulting performance curves. Just as
independent examples for demonstrations, the pitch control angles 0°/10°/20°/30° were input
separately in HAWT-Perform for wind speed equaling 12 m/s. Each set of outcomes are recorded and
plotted in Figure 7a,b for the power coefficients and torques, respectively. From these plots, it is
evident that the system shall work with reduced torque and power coefficients. The issue remains to
design a proper mechanism to adjust pitch control angles at high wind speeds in a passive way.
Before elaborating this point of designing the mechanism, it is important to grasp the effect of
changing pitch control angle on the resulting flow field around blade, which will be addressed next.
(a) (b)
Figure 7. Performance curves for sample pitch control angles, simulated by HAWT-Perform at
12 m/s: (a) Cp vs. TSR curves; and (b) torque vs. RPM curves.
3. Mechanical Design of Pitch Control
In principal, the pitch-control mechanism can be broadly categorized into two kinds: active
control and passive control. The former requires delicate electro-mechanical designs with relatively
high costs, while the latter is less costly with a simpler design. The most obvious merit of using a
passive pitch control is its reliability when operating under sever conditions. There are several
designs of passive pitch control proposed over the years. The novel design of this present work
employs a disk pulley combined with newly-designed shift-drive components to achieve the goal of
passively controlling the pitch angle of turbine blades. In what follows, details of the motion principal
along with the functions of each component will be elaborated next.
3.1. Principle of Motion
Verifying by the foregoing analyses by theories, one may proceed with the process to design the
mechanism of the passive pitch control system. As functioning in motor scooters, the disk pulley can
be applied for this purpose. To meet this working requirement, a disk pulley mechanism has been
designed as shown in Figure 8a. When in operation, rotors of the blade start to rotate, and as a result,
centrifugal forces are produced to drive the disk to move forward (Figure 8a). With the forward
moving of the disk pulley at high rotational speeds, pitch angles of the blades are adjusted by an
assemblage of bearings. Figure 8b shows pictures of the HAWT blades when the disk pulley triggers
the rotation at the pitch angle 90°. From Figure 8b, one may clearly see how the disk pulley functions
to control the pitch angle.
Figure 7. Performance curves for sample pitch control angles, simulated by HAWT-Perform at 12 m/s:(a) Cp vs. TSR curves; and (b) torque vs. RPM curves.
3. Mechanical Design of Pitch Control
In principal, the pitch-control mechanism can be broadly categorized into two kinds: activecontrol and passive control. The former requires delicate electro-mechanical designs with relativelyhigh costs, while the latter is less costly with a simpler design. The most obvious merit of using apassive pitch control is its reliability when operating under sever conditions. There are several designsof passive pitch control proposed over the years. The novel design of this present work employs adisk pulley combined with newly-designed shift-drive components to achieve the goal of passivelycontrolling the pitch angle of turbine blades. In what follows, details of the motion principal alongwith the functions of each component will be elaborated next.
3.1. Principle of Motion
Verifying by the foregoing analyses by theories, one may proceed with the process to design themechanism of the passive pitch control system. As functioning in motor scooters, the disk pulleycan be applied for this purpose. To meet this working requirement, a disk pulley mechanism hasbeen designed as shown in Figure 8a. When in operation, rotors of the blade start to rotate, and as aresult, centrifugal forces are produced to drive the disk to move forward (Figure 8a). With the forwardmoving of the disk pulley at high rotational speeds, pitch angles of the blades are adjusted by anassemblage of bearings. Figure 8b shows pictures of the HAWT blades when the disk pulley triggersthe rotation at the pitch angle 90˝. From Figure 8b, one may clearly see how the disk pulley functionsto control the pitch angle.

Energies 2016, 9, 353 8 of 13
Energies 2016, 9, 353 8 of 13
(a)
(b)
Figure 8. Mechanism of the passive pitch control: (a) cross-section of the design; and (b) blade motion
of the prototype.
3.2. Components Function
When the disk pulley operates under high-speed rotation, weight rollers in the disk will be
pushed toward the outside wall by the centrifugal force and then drive the blades to rotate by both a
cam-bearing and a linear bearing (Figure 9). As displayed in Figure 9, the complete system consists
of five main components, namely the disk pulley, bearings, spring, torque sensor, and the blades. In
most practice, active pitch control is generally applied with various types of gears powered by servo-
motors to change pitch angle (e.g., [7]). This design of power transmission by gears generally faces a
problem of assemblage and backlash. To improve the conventional design of gears, this system
adopts linear bearings, cam bearings, and ball bearings to alter the direction of movement. The cam
bearing is designed to displace along the planned track to drive blades to rotate. Additionally, a
spring unit is placed at the center to resist the rigid motion of the disk pulley and to position it back
to the original place when the rotation slows down at low rpms.
According to each respective working function, the PPC system mainly consists of four sub-
systems, including (1) the pulley system; (2) the forward-moving system; (3) the shift-drive system;
and (4) the position-recovering system. For the sub-system (1), the main part is the disk pulley applied
in scooters. As shown in Figure 10, there are six weight rollers placed inside the disk. Figure 8a
schematically depicts the forward motion of the disk pulley driven by the weight rollers when
subjected to high-speed rotation. Being connected to the disk pulley, the linear bearing of the sub-
system (2) is, thus, driven to move forward. The sub-system (3) consists of the ball bearing and the
cam bearing, functioning to replace the conventional design of a rack and pinion. For this sub-system,
the moving force conveyed from (2) is used to turn the rotors and then adjust the pitch angles. By
this, the shortcoming of requiring tolerance precision when applying the conventional mechanism of
rack and pinion can be overcome. Sub-system (4) includes the components of a spring and an
adjustable nut. The spring functions to recover the sub-systems back to their original positions; the
nut is used to adjust the resistance force, controlling the triggering speed of rotation for adjusting
pitch angle.
Figure 8. Mechanism of the passive pitch control: (a) cross-section of the design; and (b) blade motionof the prototype.
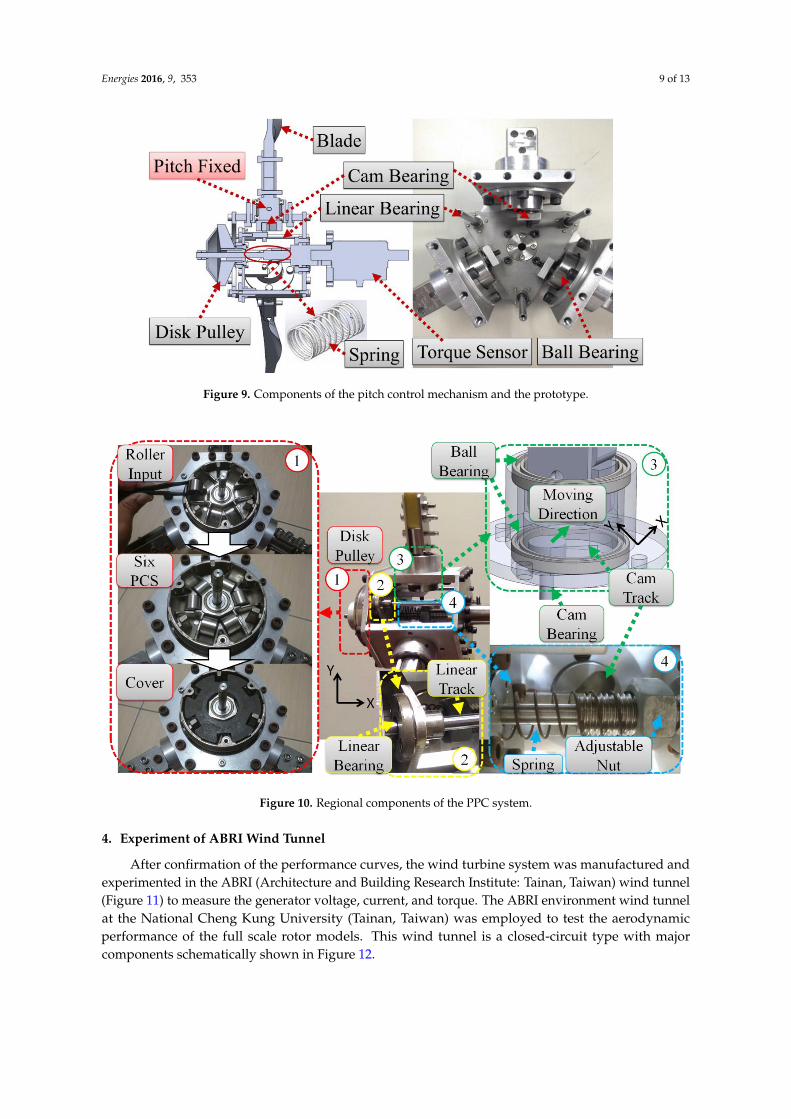
3.2. Components Function
When the disk pulley operates under high-speed rotation, weight rollers in the disk will bepushed toward the outside wall by the centrifugal force and then drive the blades to rotate by both acam-bearing and a linear bearing (Figure 9). As displayed in Figure 9, the complete system consists offive main components, namely the disk pulley, bearings, spring, torque sensor, and the blades. In mostpractice, active pitch control is generally applied with various types of gears powered by servo-motorsto change pitch angle (e.g., [7]). This design of power transmission by gears generally faces a problemof assemblage and backlash. To improve the conventional design of gears, this system adopts linearbearings, cam bearings, and ball bearings to alter the direction of movement. The cam bearing isdesigned to displace along the planned track to drive blades to rotate. Additionally, a spring unit isplaced at the center to resist the rigid motion of the disk pulley and to position it back to the originalplace when the rotation slows down at low rpms.
According to each respective working function, the PPC system mainly consists of foursub-systems, including (1) the pulley system; (2) the forward-moving system; (3) the shift-drivesystem; and (4) the position-recovering system. For the sub-system (1), the main part is the diskpulley applied in scooters. As shown in Figure 10, there are six weight rollers placed inside the disk.Figure 8a schematically depicts the forward motion of the disk pulley driven by the weight rollerswhen subjected to high-speed rotation. Being connected to the disk pulley, the linear bearing of thesub-system (2) is, thus, driven to move forward. The sub-system (3) consists of the ball bearing and thecam bearing, functioning to replace the conventional design of a rack and pinion. For this sub-system,the moving force conveyed from (2) is used to turn the rotors and then adjust the pitch angles. By this,the shortcoming of requiring tolerance precision when applying the conventional mechanism of rackand pinion can be overcome. Sub-system (4) includes the components of a spring and an adjustablenut. The spring functions to recover the sub-systems back to their original positions; the nut is used toadjust the resistance force, controlling the triggering speed of rotation for adjusting pitch angle.
Energies 2016, 9, 353 9 of 13
Energies 2016, 9, 353 9 of 13
Figure 9. Components of the pitch control mechanism and the prototype.
Figure 10. Regional components of the PPC system.
4. Experiment of ABRI Wind Tunnel
After confirmation of the performance curves, the wind turbine system was manufactured and
experimented in the ABRI (Architecture and Building Research Institute: Tainan, Taiwan) wind
tunnel (Figure 11) to measure the generator voltage, current, and torque. The ABRI environment
wind tunnel at the National Cheng Kung University (Tainan, Taiwan) was employed to test the
aerodynamic performance of the full scale rotor models. This wind tunnel is a closed-circuit type with
major components schematically shown in Figure 12.
Figure 9. Components of the pitch control mechanism and the prototype.
Energies 2016, 9, 353 9 of 13
Figure 9. Components of the pitch control mechanism and the prototype.
Figure 10. Regional components of the PPC system.
4. Experiment of ABRI Wind Tunnel
After confirmation of the performance curves, the wind turbine system was manufactured and
experimented in the ABRI (Architecture and Building Research Institute: Tainan, Taiwan) wind
tunnel (Figure 11) to measure the generator voltage, current, and torque. The ABRI environment
wind tunnel at the National Cheng Kung University (Tainan, Taiwan) was employed to test the
aerodynamic performance of the full scale rotor models. This wind tunnel is a closed-circuit type with
major components schematically shown in Figure 12.
Figure 10. Regional components of the PPC system.
4. Experiment of ABRI Wind Tunnel
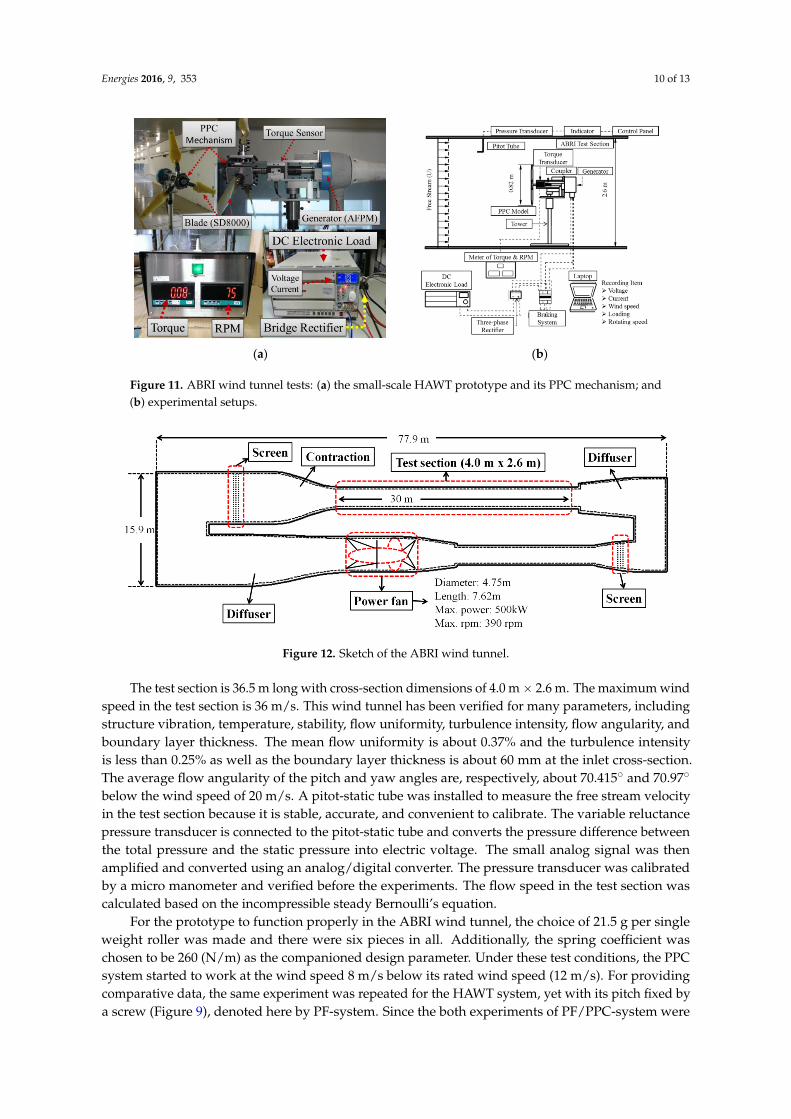
After confirmation of the performance curves, the wind turbine system was manufactured andexperimented in the ABRI (Architecture and Building Research Institute: Tainan, Taiwan) wind tunnel(Figure 11) to measure the generator voltage, current, and torque. The ABRI environment wind tunnelat the National Cheng Kung University (Tainan, Taiwan) was employed to test the aerodynamicperformance of the full scale rotor models. This wind tunnel is a closed-circuit type with majorcomponents schematically shown in Figure 12.
Energies 2016, 9, 353 10 of 13
Energies 2016, 9, 353 10 of 13
(a)
(b)
Figure 11. ABRI wind tunnel tests: (a) the small-scale HAWT prototype and its PPC mechanism;
and (b) experimental setups.
Figure 12. Sketch of the ABRI wind tunnel.
The test section is 36.5 m long with cross-section dimensions of 4.0 m × 2.6 m. The maximum
wind speed in the test section is 36 m/s. This wind tunnel has been verified for many parameters,
including structure vibration, temperature, stability, flow uniformity, turbulence intensity, flow
angularity, and boundary layer thickness. The mean flow uniformity is about 0.37% and the
turbulence intensity is less than 0.25% as well as the boundary layer thickness is about 60 mm at the
inlet cross-section. The average flow angularity of the pitch and yaw angles are, respectively, about
70.415° and 70.97° below the wind speed of 20 m/s. A pitot-static tube was installed to measure the
free stream velocity in the test section because it is stable, accurate, and convenient to calibrate. The
variable reluctance pressure transducer is connected to the pitot-static tube and converts the pressure
difference between the total pressure and the static pressure into electric voltage. The small analog
signal was then amplified and converted using an analog/digital converter. The pressure transducer
was calibrated by a micro manometer and verified before the experiments. The flow speed in the test
section was calculated based on the incompressible steady Bernoulli’s equation.
For the prototype to function properly in the ABRI wind tunnel, the choice of 21.5 g per single
weight roller was made and there were six pieces in all. Additionally, the spring coefficient was
chosen to be 260 (N/m) as the companioned design parameter. Under these test conditions, the PPC
system started to work at the wind speed 8 m/s below its rated wind speed (12 m/s). For providing
comparative data, the same experiment was repeated for the HAWT system, yet with its pitch fixed
by a screw (Figure 9), denoted here by PF-system. Since the both experiments of PF/PPC-system were
conducted for the same prototype, no issue of different hub-weight needs to concern such that the
performance difference between the both could be experimentally identified for various wind speeds.
Figure 11. ABRI wind tunnel tests: (a) the small-scale HAWT prototype and its PPC mechanism; and(b) experimental setups.
Energies 2016, 9, 353 10 of 13
(a)
(b)
Figure 11. ABRI wind tunnel tests: (a) the small-scale HAWT prototype and its PPC mechanism;
and (b) experimental setups.
Figure 12. Sketch of the ABRI wind tunnel.
The test section is 36.5 m long with cross-section dimensions of 4.0 m × 2.6 m. The maximum
wind speed in the test section is 36 m/s. This wind tunnel has been verified for many parameters,
including structure vibration, temperature, stability, flow uniformity, turbulence intensity, flow
angularity, and boundary layer thickness. The mean flow uniformity is about 0.37% and the
turbulence intensity is less than 0.25% as well as the boundary layer thickness is about 60 mm at the
inlet cross-section. The average flow angularity of the pitch and yaw angles are, respectively, about
70.415° and 70.97° below the wind speed of 20 m/s. A pitot-static tube was installed to measure the
free stream velocity in the test section because it is stable, accurate, and convenient to calibrate. The
variable reluctance pressure transducer is connected to the pitot-static tube and converts the pressure
difference between the total pressure and the static pressure into electric voltage. The small analog
signal was then amplified and converted using an analog/digital converter. The pressure transducer
was calibrated by a micro manometer and verified before the experiments. The flow speed in the test
section was calculated based on the incompressible steady Bernoulli’s equation.
For the prototype to function properly in the ABRI wind tunnel, the choice of 21.5 g per single
weight roller was made and there were six pieces in all. Additionally, the spring coefficient was
chosen to be 260 (N/m) as the companioned design parameter. Under these test conditions, the PPC
system started to work at the wind speed 8 m/s below its rated wind speed (12 m/s). For providing
comparative data, the same experiment was repeated for the HAWT system, yet with its pitch fixed
by a screw (Figure 9), denoted here by PF-system. Since the both experiments of PF/PPC-system were
conducted for the same prototype, no issue of different hub-weight needs to concern such that the
performance difference between the both could be experimentally identified for various wind speeds.
Figure 12. Sketch of the ABRI wind tunnel.
The test section is 36.5 m long with cross-section dimensions of 4.0 mˆ 2.6 m. The maximum windspeed in the test section is 36 m/s. This wind tunnel has been verified for many parameters, includingstructure vibration, temperature, stability, flow uniformity, turbulence intensity, flow angularity, andboundary layer thickness. The mean flow uniformity is about 0.37% and the turbulence intensityis less than 0.25% as well as the boundary layer thickness is about 60 mm at the inlet cross-section.The average flow angularity of the pitch and yaw angles are, respectively, about 70.415˝ and 70.97˝
below the wind speed of 20 m/s. A pitot-static tube was installed to measure the free stream velocityin the test section because it is stable, accurate, and convenient to calibrate. The variable reluctancepressure transducer is connected to the pitot-static tube and converts the pressure difference betweenthe total pressure and the static pressure into electric voltage. The small analog signal was thenamplified and converted using an analog/digital converter. The pressure transducer was calibratedby a micro manometer and verified before the experiments. The flow speed in the test section wascalculated based on the incompressible steady Bernoulli’s equation.
For the prototype to function properly in the ABRI wind tunnel, the choice of 21.5 g per singleweight roller was made and there were six pieces in all. Additionally, the spring coefficient waschosen to be 260 (N/m) as the companioned design parameter. Under these test conditions, the PPCsystem started to work at the wind speed 8 m/s below its rated wind speed (12 m/s). For providingcomparative data, the same experiment was repeated for the HAWT system, yet with its pitch fixed bya screw (Figure 9), denoted here by PF-system. Since the both experiments of PF/PPC-system were

Energies 2016, 9, 353 11 of 13
conducted for the same prototype, no issue of different hub-weight needs to concern such that theperformance difference between the both could be experimentally identified for various wind speeds.
Figure 13 shows the electric output powers and RPM of the both systems at various wind speeds.As can be observed from this figure, both started to generate power at 4 m/s. Additionally, it is evidentto see the difference of the both once the wind speed reached 8 m/s when the PPC-system startedto work. To our expectation, the PPC-system functioned properly in accordance with the originaldesign whereas, in contrast, the PF-system output power in a manner of cubic growth with the windspeed. At this point now, it is very clear that operation of the small HAWT system is very dangerous,particularly when its electric controller malfunctions; at high wind speeds, the system may eitherbreak down with its generator burned out for overloading or fall apart from the great centrifugal force.As can be observed from Figure 13, the PPC-system started functioning to protect the system at windspeed reaching 6 m/s. Under the no-loading condition, the stable rotation speed of the PPC-systemis at 720 rpm, when operating with the maximum power, the PPC-system generates stable power atabout 500–550 rpm.
Energies 2016, 9, 353 11 of 13
Figure 13 shows the electric output powers and RPM of the both systems at various wind speeds.
As can be observed from this figure, both started to generate power at 4 m/s. Additionally, it is
evident to see the difference of the both once the wind speed reached 8 m/s when the PPC-system
started to work. To our expectation, the PPC-system functioned properly in accordance with the
original design whereas, in contrast, the PF-system output power in a manner of cubic growth with
the wind speed. At this point now, it is very clear that operation of the small HAWT system is very
dangerous, particularly when its electric controller malfunctions; at high wind speeds, the system
may either break down with its generator burned out for overloading or fall apart from the great
centrifugal force. As can be observed from Figure 13, the PPC-system started functioning to protect
the system at wind speed reaching 6 m/s. Under the no-loading condition, the stable rotation speed
of the PPC-system is at 720 rpm, when operating with the maximum power, the PPC-system
generates stable power at about 500–550 rpm.
Figure 13. Experiment data of PF and PPC at 4 m/s to 16 m/s.
Figure 14a shows our experimental results for wind speeds at 8 m/s, 10 m/s, and 12 m/s; those
for wind speeds at 14 m/s and 16 m/s are in Figure 14b. Obviously, accompanied with the increase of
wind speed is the greater percentage of power decrease. At the wind speed 8 m/s, the maximum
blade Cp would drop by about 10% while, at 14 m/s, the drop would increase up to 30%. From the
experiments, the functioning of the PPC system is very clear that it may be applied to protect the
system from aerodynamic overloading.
(a) (b)
Figure 14. Experimental results: (a) blade Cp—TSR at 8 m/s to 12 m/s; and (b) blade Cp—TSR at
14 m/s to 16 m/s.
Figure 13. Experiment data of PF and PPC at 4 m/s to 16 m/s.
Energies 2016, 9, 353 11 of 13
Figure 13 shows the electric output powers and RPM of the both systems at various wind speeds.
As can be observed from this figure, both started to generate power at 4 m/s. Additionally, it is
evident to see the difference of the both once the wind speed reached 8 m/s when the PPC-system
started to work. To our expectation, the PPC-system functioned properly in accordance with the
original design whereas, in contrast, the PF-system output power in a manner of cubic growth with
the wind speed. At this point now, it is very clear that operation of the small HAWT system is very
dangerous, particularly when its electric controller malfunctions; at high wind speeds, the system
may either break down with its generator burned out for overloading or fall apart from the great
centrifugal force. As can be observed from Figure 13, the PPC-system started functioning to protect
the system at wind speed reaching 6 m/s. Under the no-loading condition, the stable rotation speed
of the PPC-system is at 720 rpm, when operating with the maximum power, the PPC-system
generates stable power at about 500–550 rpm.
Figure 13. Experiment data of PF and PPC at 4 m/s to 16 m/s.
Figure 14a shows our experimental results for wind speeds at 8 m/s, 10 m/s, and 12 m/s; those
for wind speeds at 14 m/s and 16 m/s are in Figure 14b. Obviously, accompanied with the increase of
wind speed is the greater percentage of power decrease. At the wind speed 8 m/s, the maximum
blade Cp would drop by about 10% while, at 14 m/s, the drop would increase up to 30%. From the
experiments, the functioning of the PPC system is very clear that it may be applied to protect the
system from aerodynamic overloading.
(a) (b)
Figure 14. Experimental results: (a) blade Cp—TSR at 8 m/s to 12 m/s; and (b) blade Cp—TSR at
14 m/s to 16 m/s. Figure 14. Experimental results: (a) blade Cp—TSR at 8 m/s to 12 m/s; and (b) blade Cp—TSR at14 m/s to 16 m/s.
Figure 14a shows our experimental results for wind speeds at 8 m/s, 10 m/s, and 12 m/s; thosefor wind speeds at 14 m/s and 16 m/s are in Figure 14b. Obviously, accompanied with the increaseof wind speed is the greater percentage of power decrease. At the wind speed 8 m/s, the maximum
Energies 2016, 9, 353 12 of 13
blade Cp would drop by about 10% while, at 14 m/s, the drop would increase up to 30%. From theexperiments, the functioning of the PPC system is very clear that it may be applied to protect thesystem from aerodynamic overloading.
5. Conclusions
Under operation at high wind speeds, the small-scale HAWT system will be subjected toaerodynamic overloading that may cause burning out of its generator and/or structural breakdown.There are several techniques to protect the system from the overloading condition. In this article, aninnovative disk pulley mechanism is designed to protect the small-scale HAWT system by passivecontrol of the blade pitch angle according to the rotation speed. The theoretical analysis was performedusing our self-developed GUI software, called “HAWT-Perform”, which can be used to predict theblade performance. Through the theoretical analysis of HAWT-Perform, one may learn the significantperformance change when blade pitch angle is adjusted by our disk pulley mechanism. For verification,experiments were carried out for a HAWT prototype with blades (using a SD8000 airfoil) designed byBEMT. From the experiments, one may learn the performance change from the use of our PPC system.This PPC system is featured with the advantages of great reliability, easy maintenance, and low cost.The present work simply determines a feasible approach to protect the small-scale HAWT; however,more extensive studies are required regarding the design parameters of the disk pulley mechanism tomatch different HAWT systems with other output powers.
Supplementary Materials: The following are available online at www.mdpi.com/link, Video S1: Operation ofpassive pitch control system.
Acknowledgments: The authors gratefully acknowledge the funding support by National Science Council (NSC102-2221-E-006-290-MY3). This research is also partially supported by Research Center for Energy Technology andStrategy, National Cheng Kung University and Digisine Energytech Co., Ltd.
Author Contributions: The author Y.C. Shiah planned the experiments and organized the research directions;Yu-Jen Chen performed the mechanism design, theoretical analyses.
Conflicts of Interest: The authors declare no conflict of interest.
Abbreviations
The following abbreviations are used in this manuscript:
NCKU National Cheng Kung UniversityPPC Passive pitch controlPF Pitch fixed
References
1. Mc Garrigle, E.V.; Leahy, P.G. Quantifying the value of improved wind energy forecasts in a pool-basedelectricity market. Renew. Energy 2015, 80, 517–524. [CrossRef]
2. Browne, O.; Poletti, S.; Young, D. How does market power affect the impact of large scale wind investmentin “energy only” wholesale electricity markets? Energy Policy 2015, 87, 17–27. [CrossRef]
3. Gillenwater, M.; Lu, X.; Fischlein, M. Additionality of wind energy investments in the U.S. voluntary greenpower market. Renew. Energy 2014, 63, 452–457. [CrossRef]
4. Choudhry, A.; Arjomandi, M.; Kelso, R. Methods to control dynamic stall for wind turbine applications.Renew. Energy 2016, 86, 26–37. [CrossRef]
5. Choudhry, A.; Leknys, R.; Arjomandi, M.; Kelso, R. An insight into the dynamic stall lift characteristics.Exp. Thermal Fluid Sci. 2014, 58, 188–208. [CrossRef]
6. Yen, J.; Ahmed, N.A. Enhancing vertical axis wind turbine by dynamic stall control using synthetic jets.J. Wind Eng. Ind. Aerodyn. 2013, 114, 12–17. [CrossRef]
7. Xie, W.; Zeng, P.; Lei, L.P. A novel folding blade of wind turbine rotor for effective power control.Energy Convers. Manag. 2015, 101, 52–65. [CrossRef]

Energies 2016, 9, 353 13 of 13
8. Xie, W.; Zeng, P.; Lei, L.P. Wind tunnel experiments for innovative pitch regulated blade of horizontal axiswind turbine. Energy 2015, 91, 1070–1080. [CrossRef]
9. Jauch, C.; Hippel, S. Hydraulic-pneumatic flywheel system in a wind turbine rotor for inertia control.IET Renew. Power Generat. 2016, 10, 33–41. [CrossRef]
10. Barlas, T.K.; van Wingerden, W.; Hulskamp, A.W.; van Kuik, G.A.M.; Bersee, H.E.N. Smart dynamic rotorcontrol using active flaps on a small-scale wind turbine: Aeroelastic modeling and comparison with windtunnel measurements. Wind Energy 2013, 16, 1287–1301. [CrossRef]
11. Kragh, K.A.; Fleming, P.A.; Scholbrock, A.K. Increased Power Capture by Rotor Speed-Dependent YawControl of Wind Turbines. J. Sol. Energy Eng. 2013, 135, 031018. [CrossRef]
12. Ekelund, T. Yaw control for reduction of structural dynamic loads in wind turbines. J. Wind Eng. Ind. Aerodyn.2000, 85, 241–262. [CrossRef]
13. Shariatpanah, H.; Fadaeinedjad, R.; Rashidinejad, M. A New Model for PMSG-Based Wind Turbine withYaw Control. IEEE Trans. Energy Convers. 2013, 28, 929–937. [CrossRef]
14. Lesic, V.; Vasak, M.; Peric, N.; Wolbank, T.M.; Joksimovic, G. Fault-tolerant Control of a Wind Turbine with aSquirrel-cage Induction Generator and Rotor Bar Defects. Automatika 2013, 54, 316–328.
15. Lee, J.; Kim, J.; Kim, Y.H.; Chun, Y.H.; Lee, S.H.; Seok, J.K.; Kang, Y.C. Rotor Speed-based Droop of a WindGenerator in a Wind Power Plant for the Virtual Inertial Control. J. Electr. Eng. Technol. 2013, 8, 1021–1028.[CrossRef]
16. Simley, E.; Pao, L.Y.; Frehlich, R.; Jonkman, B.; Kelley, N. Analysis of light detection and ranging wind speedmeasurements for wind turbine control. Wind Energy 2014, 17, 413–433. [CrossRef]
17. Chiang, M.H.; Wang, C.S.; Chen, C.S. Intelligent Pitch Control for a 2MW Wind Turbine. Int. J. Fuzzy Syst.2012, 14, 89–96.
18. Li, S.C. Self-powered passive adaptive control of pitch angle and Betz-shaped wind tunnel. In Proceedingsof the International Conference on Renewable Energies and Power Quality, Madrid, Spain, 4–6 May 2010.
19. Hertel, J.; Nygaard, T.; Duque, E. Passive pitch control of small horizontal axis wind turbines. In Proceedingsof the 42nd AIAA Aerospace Sciences Meeting and Exhibit, Aerospace Sciences Meetings, Reno, NV, USA,5–8 January 2004; pp. 2004–1369.
20. Barlow, J.B.; Rae, W.H.; Pope, A. Low-Speed Wind Tunnel Testing, 3rd ed.; Wiley-Interscience: New York, NY,USA, 1999.
21. Burton, T.; Jenkins, N.; Sharpe, D.; Bossanyi, E. Wind Energy Handbook; John Wiley & Sons Ltd.: Hoboken, NJ,USA, 2001.
22. Manwell, J.F.; McGowan, J.G.; Rogers, A.L. Wind Energy Explained—Theory, Design and Application; John Wiley& Sons Ltd.: Hoboken, NJ, USA, 2002.
23. Lee, M.-H.; Shiah, Y.C.; Bai, C.-J. Experiments and numerical simulations of the rotor-blade performance fora small-scale horizontal axis wind turbine. J. Wind Eng. Ind. Aerodyn. 2016, 149, 17–29. [CrossRef]
24. Hsiao, F.B.; Bai, C.J.; Chong, W.T. The Performance Test of Three Different Horizontal Axis Wind Turbine(HAWT) Blade Shapes Using Experimental and Numerical Methods. Energies 2013, 6, 2784–2803. [CrossRef]
25. Bai, C.J.; Hsiao, F.B.; Li, M.H.; Huang, G.Y.; Chen, Y.J. Design of 10 kW Horizontal-Axis Wind Turbine(HAWT) Blade and Aerodynamic Investigation Using Numerical Simulation. Procedia Eng. 2013, 67, 279–287.[CrossRef]
© 2016 by the authors; licensee MDPI, Basel, Switzerland. This article is an open accessarticle distributed under the terms and conditions of the Creative Commons Attribution(CC-BY) license (http://creativecommons.org/licenses/by/4.0/).