Embed Size (px)
Citation preview
Introduction
Aerial surveys carried out by Unmanned Aerial Vehicles (UAVs) are under quick expansion, thanks to the development of new platforms equipped with automatic systems for plan-ning and controlling the flights and to the improvement of sensors and data acquisition devices.
As a consequence, the increased ease of use widens the employment of UAVs for proximal sensing; the capabilities of these systems are widely explored according to different re-quirements. Some interesting analysis of UAV usage in the close-range field can be found in Remondino et al. (2011), Eisenbeiss and Sauerbier (2011), Colomina et al. (2008). Although it is nowadays clear that unmanned aerial systems are a flexible technology able to collect a big amount of high resolution information, some investigation is still needed to assess the accuracies that such imagery can reach, both for metric and interpretation uses.
G. Sona :R. GiniPolitecnico di Milano, DICA, Via Valleggio, 11, 22100 Como, Italy
G. Sonae-mail: [email protected]
R. Ginie-mail: [email protected]
L. Pinto :D. Pagliari (*) :D. PassoniPolitecnico di Milano, DICA, Piazza Leonardo da Vinci 32,20133 Milano, Italye-mail: [email protected]
L. Pintoe-mail: [email protected]
D. Passonie-mail: [email protected]
Experimental analysis of different software packagesfor orientation and digital surface modelling from UAV images
Giovanna Sona & Livio Pinto & Diana Pagliari &Daniele Passoni & Rossana Gini
Received: 6 August 2013 /Accepted: 23 December 2013 /Published online: 15 January 2014
The limited payload implies the use of new, ultra-lightsensors, often less precise with respect to the normal-sizeones. Very small digital cameras, for instance, can be used toacquire a large amount of images at very high resolution, butare usually affected by higher deformations compared withphotogrammetric calibrated cameras.
Furthermore, newmethods for data post-processing are underdevelopment, as UAV data can require the use of non-traditionalapproaches (Grenzdörffer et al. 2008;Haarbrink andKoers 2006;Remondino et al. 2009). As regards aerial images surveys, twodifferent approaches are generally used and tested: digital imagestaken from UAVs can be processed using traditional photogram-metric methods or software coming from the computer vision(CV) field. In the first case, high accuracy in points coordinatesdetermination and in 3D modelling is the main pursued require-ment, whilst the others work mainly to achieve a quick process-ing and an effective final product.
In the present work, some further tests are presented, per-formed with the purpose of validating vector-sensor systems andoptimizing the UAVs survey for 3D modelling and to comparedifferent software packages that follow different workflows, inorder to evaluate their effectiveness and weaknesses.
In this frame, images taken by compact cameras mountedon UAVs are processed by standard photogrammetric soft-ware (PhotoModeler, Erdas LPS) and home-made softwarelike EyeDEA developed by University of Parma (Roncellaet al. 2011), Calge developed by the Dept. ICA of Politecnicodi Milano (Forlani 1986) or by software specifically built formanaging UAVs images, as Pix4UAVand AgiSoft Photoscan.
In the photogrammetric approach, exterior orientation pa-rameters and ground point coordinates are estimated togetherwith the related accuracies: however, some difficulties oftenarise during the image georeferencing and the block formationphase (bundle adjustment), especially when image positionsand attitudes are far from those commonly obtained in aphotogrammetric survey (aerial, terrestrial or close range).
On the other hand, by using software coming from CV, theprocessing of a large amount of images is usually faster and easierand digitalmodel of the object, orthoimages and photorealistic 3Drepresentations are produced with minor control on some pro-cessing steps (as georeferencing and block formation) and on theaccuracies of computed geometric parameters.
Therefore, it is still necessary to test and compare thecapabilities of different systems, in order to carefully assessthe accuracies of final products and be aware in the choice ofthe system, which should be the most suitable for the surveypurpose (Remondino et al. 2012).
Data acquisition
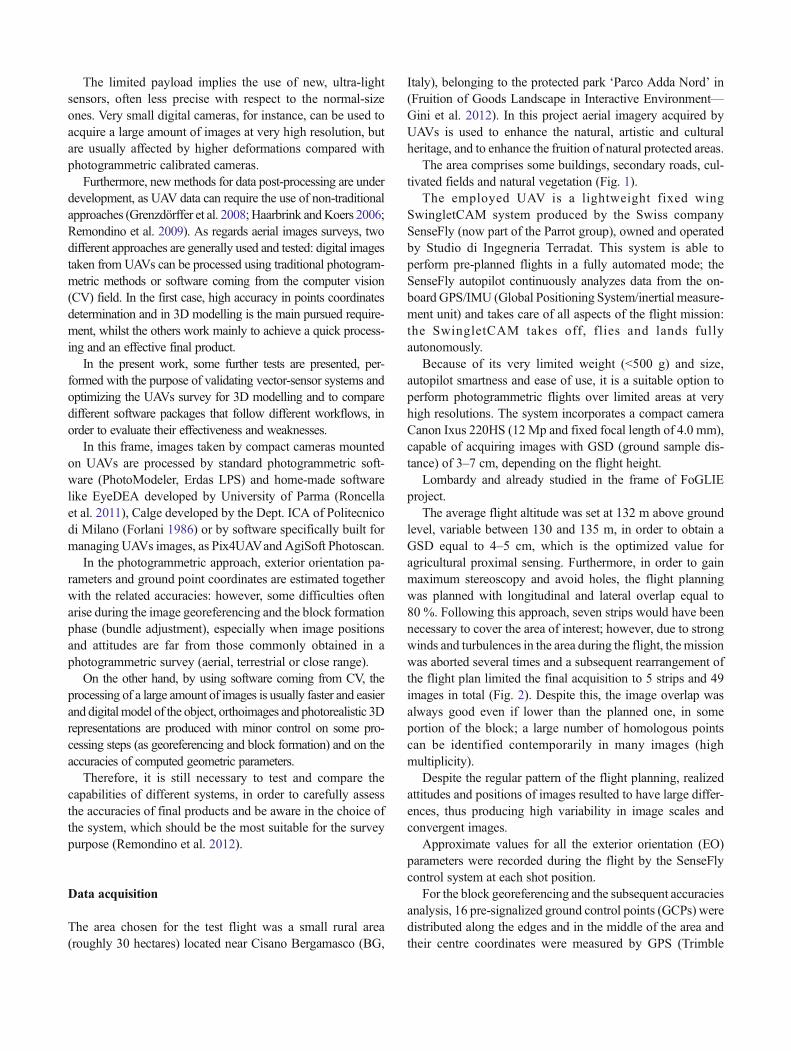
The area chosen for the test flight was a small rural area(roughly 30 hectares) located near Cisano Bergamasco (BG,
Italy), belonging to the protected park ‘Parco Adda Nord’ in(Fruition of Goods Landscape in Interactive Environment—Gini et al. 2012). In this project aerial imagery acquired byUAVs is used to enhance the natural, artistic and culturalheritage, and to enhance the fruition of natural protected areas.
The area comprises some buildings, secondary roads, cul-tivated fields and natural vegetation (Fig. 1).
The employed UAV is a lightweight fixed wingSwingletCAM system produced by the Swiss companySenseFly (now part of the Parrot group), owned and operatedby Studio di Ingegneria Terradat. This system is able toperform pre-planned flights in a fully automated mode; theSenseFly autopilot continuously analyzes data from the on-board GPS/IMU (Global Positioning System/inertial measure-ment unit) and takes care of all aspects of the flight mission:the SwingletCAM takes off, flies and lands fullyautonomously.
Because of its very limited weight (<500 g) and size,autopilot smartness and ease of use, it is a suitable option toperform photogrammetric flights over limited areas at veryhigh resolutions. The system incorporates a compact cameraCanon Ixus 220HS (12 Mp and fixed focal length of 4.0 mm),capable of acquiring images with GSD (ground sample dis-tance) of 3–7 cm, depending on the flight height.
Lombardy and already studied in the frame of FoGLIEproject.
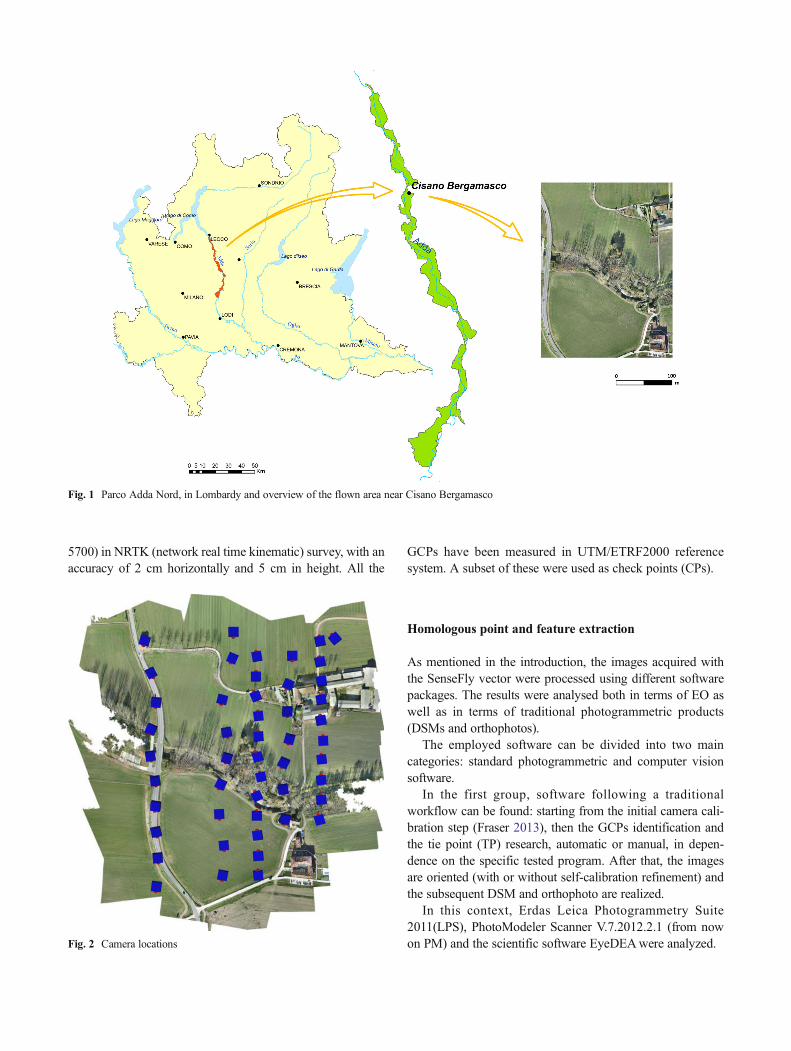
The average flight altitude was set at 132 m above groundlevel, variable between 130 and 135 m, in order to obtain aGSD equal to 4–5 cm, which is the optimized value foragricultural proximal sensing. Furthermore, in order to gainmaximum stereoscopy and avoid holes, the flight planningwas planned with longitudinal and lateral overlap equal to80 %. Following this approach, seven strips would have beennecessary to cover the area of interest; however, due to strongwinds and turbulences in the area during the flight, the missionwas aborted several times and a subsequent rearrangement ofthe flight plan limited the final acquisition to 5 strips and 49images in total (Fig. 2). Despite this, the image overlap wasalways good even if lower than the planned one, in someportion of the block; a large number of homologous pointscan be identified contemporarily in many images (highmultiplicity).
Despite the regular pattern of the flight planning, realizedattitudes and positions of images resulted to have large differ-ences, thus producing high variability in image scales andconvergent images.
Approximate values for all the exterior orientation (EO)parameters were recorded during the flight by the SenseFlycontrol system at each shot position.
For the block georeferencing and the subsequent accuraciesanalysis, 16 pre-signalized ground control points (GCPs) weredistributed along the edges and in the middle of the area andtheir centre coordinates were measured by GPS (Trimble
5700) in NRTK (network real time kinematic) survey, with anaccuracy of 2 cm horizontally and 5 cm in height. All the
GCPs have been measured in UTM/ETRF2000 referencesystem. A subset of these were used as check points (CPs).
Homologous point and feature extraction
As mentioned in the introduction, the images acquired withthe SenseFly vector were processed using different softwarepackages. The results were analysed both in terms of EO aswell as in terms of traditional photogrammetric products(DSMs and orthophotos).
The employed software can be divided into two maincategories: standard photogrammetric and computer visionsoftware.
In the first group, software following a traditionalworkflow can be found: starting from the initial camera cali-bration step (Fraser 2013), then the GCPs identification andthe tie point (TP) research, automatic or manual, in depen-dence on the specific tested program. After that, the imagesare oriented (with or without self-calibration refinement) andthe subsequent DSM and orthophoto are realized.
In this context, Erdas Leica Photogrammetry Suite2011(LPS), PhotoModeler Scanner V.7.2012.2.1 (from nowon PM) and the scientific software EyeDEAwere analyzed.
Fig. 1 Parco Adda Nord, in Lombardy and overview of the flown area near Cisano Bergamasco
Fig. 2 Camera locations
In the second group, 3D modelling software packages canbe found: they carry out the image relative orientation togetherwith the self-calibration, in an arbitrary reference system,which is often obtained using a minimum constraint comingfrom the approximate orientation provided by the UAV onboard positioning system. Tie point extraction, measurementand outlier rejection are completely automatized steps(Barazzetti et al. 2010a, b; Pollefeys et al. 1999; Strechaet al. 2010); the subsequent use of GCPs allows to translateand rotate the photogrammetric block in a specific referencesystem. Pix4UAV Desktop (from now on P4) by Pix4D andAgisoft Photoscan (from now on APh) by AgiSoft LLC weretaken under analysis.
A specific procedure was realized for each software pack-age according to its characteristic, as briefly presented below.
LPS is a well-known photogrammetry system available in auser-friendly environment that guarantees photogrammetricprecision. LPS provides tools for manual and automated mea-surement and for carrying out bundle adjustment computation,digital surface model generation, orthophoto production,mosaicking, and 3D feature extraction. With its tight integra-tion with ERDAS Image software, LPS is a photogrammetricpackage for projects that involve various types of data andfurther processing and analyses of airborne imagery.
For this work TPs used to compute EO of the images weremanually selected and measured, for a total of 295 points withan average multiplicity of 5 rays per point.
On the other hand, EyeDEA is a scientific software pack-age developed by the University of Parma and it implementsSURF (Speed Up Robust Feature) operator (Bay et al. 2008).Like any other interest operator (Remondino 2006), SURFallows one to identify a large number of matches with errone-ous correspondence within each set: for this reason, EyeDEAimplements also some robust error rejection techniques.
First of all, the fundamental matrix F (see Hartley andZisserman 2006) is used to define the constraint betweentwo sets of image coordinates: since the epipolar constraintis not sufficient to discriminate wrong matches between twopoints located on the epipolar line, also the trifocal tensor hasbeen implemented. The RANSAC (RAndom SAmpleConsensus) paradigm (Fischler and Bolles 1981) is run aftereach geometric control to guarantee a higher percentage ofinlier. EyeDEA proceeds by successive image triplets, so thehomologous points are seen, on average, only on three frames.
EyeDEA requires undistorted images as input, whose de-formations were removed according to the models and param-eters estimated with the camera calibration procedure imple-mented in the commercial software PM, making use of an adhoc developed software, called ‘DistRemover’ (Univ. ofParma). As the number of TPs extracted with EyeDEA wastoo large (21224) and non-homogeneously distributed, it wasdecided to reduce them to better manage the photogrammetricblock during the orientation phase as proposed in Barazzetti
et al. (2010a). The point reduction was performed with an adhoc developed Matlab® function, on the basis of the criteria ofhomogeneous distribution throughout the block and higherpoint multiplicity. In this way the final accuracy is not affectedalthough the time required to compute the solution is signif-icantly decreased; thus, the number of tie points was reducedto 2,924 image points.
Since the longitudinal overlap through the block was notalways adequate to guarantee the automatic extraction ofpoints on all the subsequent triplets and in order to strengthenthe block itself, TPs extraction was also repeated along thetransverse direction. Despite that, the software was not able atall to extract points on two images and for other six images itwas necessary to manually measure some additional homolo-gous points. Manual TP extraction was carried out with thecommercial software PM in order to obtain the terrain coor-dinates necessary to the subsequent analysis and to manuallymeasure the GCPs.
PhotoModeler Scanner allows users to accomplish fullyautomated projects (with the ‘Smart Project’ option), requiringas input only images and camera calibration parameters. Itperforms feature detection, image matching and orientation ina free-network mode. In a second phase user can add GCPs toconstrain the block; PM can use a rigorous photogrammetricapproach to minimize the block deformation throughout thebundle-block adjustment if one choose the ‘control’ option orcan transform object coordinate without affecting the shape ofthe model itself (only by rotating, scaling and translating themodel, like the most part of CV software does). For thepresent work the first procedure was applied, in order to obtainbetter quality result, similar to the one obtainable with a classicphotogrammetric approach. During this step it is also possibleto refine camera calibration parameters.
For what concerns the CV-based software, the specificallydesigned software for UAV application Pix4UAV was tested.It allows one to compute the block orientation in a fullyautomatic way, requiring as input only camera calibrationparameters and an image approximate geo-location; more-over, GCPs were manually measured with the aim of compar-ing the results with the ones computed with other programs.The coordinates of all the points used to perform the bundle-block adjustment were exported and converted in the PMinput format in order to generate the corresponding coordi-nates in the terrain reference system: these coordinates had tobe used as approximate values for the next computations (seeparagraph 4). The software allows users to create in an auto-matic way also the points cloud, the DSM and the orthophoto.
Eventually, APh was employed to automatically computeboth image orientations and tie points cloud. It is a low costcommercial software, developed by Agisoft LCC, that allowsto compute EO of large image datasets. First of all it performsa feature matching between the images, detecting points thatare stable with respect to viewpoint and lighting variations.

These points are then used to generate a descriptor for eachpoint based on its local neighbourhood. The descriptor is usedin a second step to compute correspondence (with an approachsimilar to SIFT (Lowe 2004)). After this phase the softwareperforms both interior and exterior orientation using a greedyalgorithm to find approximate camera locations: then it refinestheir attitude using a classic bundle-block adjustment.
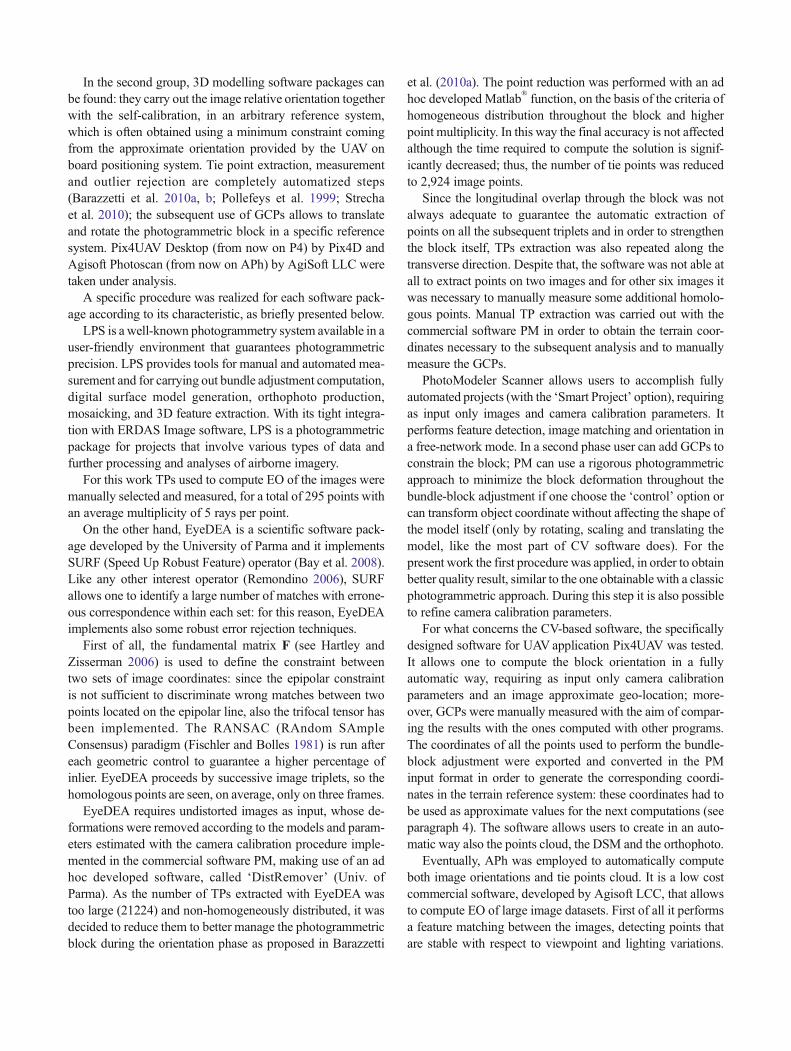
In this case the software extracted a large amount of points,so it was decided to decimate them considering only the pointsmatched at least on three images, and that yield an RMSE(Root Mean Square Error) in the bundle adjustment lowerthan 0.40 m. The layouts of the TPs used in the four differentsoftware packages are shown in Fig. 3.
It is evident how the points extracted by using fully auto-mated suites (such as PM and AS) outnumber the number ofpoints extracted from other software packages. One can alsonotice how the points extracted by using PM Smart Projectsare characterized, in average, by a greater number of rays per3D point.
It is also interesting to notice how all the software packagesthat use feature based matching are unable to extract pointsmore or less in the same areas, such as in correspondence offorest trees and fields with a particular homogenous texture.The result of EyeDEA is similar in terms of multiplicity,but the point set selected is smaller because the TPswere decimated before the bundle-block adjustmentphase. P4 identified less points than APh but it wasable to detect points visible on more images. The caseof LPS is different because all the measurements wereperformed manually, by leading to an average multiplic-ity of five and a more uniform distribution.
Bundle-block adjustment
A standard procedure was defined to align the analysis of EOparameters, estimated by the different software: for this pur-pose the home-made scientific software Calge was used.Calge is a computer program designed to compute LeastSquares adjustment of a general geodetic network or a photo-grammetric block.
A first comparison between the different software packagesinvolved the bundle-block adjustment using the TPs mea-sured, either manually (LPS, some points for EyeDEA andall the GCPs) or automatically (the most of TPs extracted withEyeDEA and all the points identified by P4 and APh). In allcases, the calibration parameters were refined thank to theself-calibration executed during the bundle-block adjustmentitself: especially, the variations of the 10 parameters of themodel in Brown (1971) were estimated. The Canon Ixus220HS optic is retractable to protect the lens during landing:for this reason is unavoidable to perform a self-calibration inorder to estimate the correct interior orientation parameters.
For each software package, two different kinds of bundle-block adjustment were run: i) with constrains on all themeasured GCPs; ii) with constrains only on 5 GCPs, 4 ofwhich selected along the block edges and one near the center(see Fig. 4). Both GCPs and CPs measures on images weredone manually by different non-expert operators.
In Table 1 the obtained results are listed.The first columns show the number of TPs and the obser-
vation sample sizes: the ratio between these two quantities isequal to the average TPs multiplicity. In the subsequent col-umn, the bundle-adjustment σ0 is reported: it ranges from0.3 μm (APh) to 2.6 μm (LPS), respectively 0.2 and 1.6 timesthe pixel size equal to 1.54 μm.
The estimated focal lengths, reported in the fifth row, variesbetween 4.234 mm (P4) and 4.438 mm (LPS), representingmeaningful corrections with respect to the given initial valueof 4.3559 mm that comes from the calibration procedure. Onthe other hand, the self-calibrated values do not vary signifi-cantly, also with respect to the estimated accuracies that are ofthe same order of magnitude. Moreover, as images were takenat constant height, there is a big correlation between estimatedfocal length (c) and estimated projection centers heights Z0: avariation in c is absorbed by variation in Z0.
In the following rows the RMS (Root Mean Square)of standard deviation of the TPs and RMSE (RootMean Square Error) of the CPs are shown for eachcoordinate.
As expected, the RMS of the standard deviationvalues are smaller for software that extracted automati-cally a large number of TPs (also because of the lowervalue of σ0). As regards LPS results, RMS high valuesare surely due to the small number of TPs, manuallyselected with high multiplicity, but not by expert pho-togrammetric technicians. Other software packages arealmost fully automatic, so the extracted TPs number ishigher and, consequently, the RMS of the standarddeviation values are smaller (also because of the lowervalue of σ0). As regards CPs RMSE, results are morehomogenous, especially in east and north coordinates,for which they are around GSD whereas the differencesare more pronounced in altitude. Especially, the bestresult has been obtained for APh (1.1*GSD both hori-zontally and in height) while the worst has been obtain-ed for EyeDEA (respectively 2.2*GSD horizontally and4.3*GSD for height coordinates).
A further analysis was carried out with Calge, in order toevaluate the quality of EO parameters estimated by eachsoftware. Exterior orientations obtained by different softwarepackages by using the 5 selected GCP (Fig. 4) were used asfixed constrains in Calge to estimate CP coordinates. SinceEyeDEA performed only the TPs extraction, the EO parame-ters were calculated by PM. At the same time also a self-calibration was performed, in order to evaluate the best
calibration parameters set. The RMSE of CPs residuals aresummarized in Table 2.
The RMSE values are low with respect to the image scaleof 1:31,000 and the GSD equal to 4.5 cm. Considering thehorizontal coordinates, the minimum value (0.33*GSD) wasachieved with the combination of the software PM and
EyeDEA, followed by LPS (1*GSD). Worse results wereobtained by P4 and APh.
When height coordinates are considered, the RMSE arehigher than horizontal ones, even if the values are smaller than100 mm (with the exception of the value obtained by process-ing the block with P4, which is equal to 214 mm).
TP_LPS
TP_EyeDEA
TP_P4
TP_APh
TP_PM
Fig. 3 Tie points distribution onthe images for the differentsoftware: from top to bottomLPS,EyeDEA, P4, APh, PM

DSM comparisons
A second kind of comparison among software results wasdone analyzing the DSM produced. A mesh of 0.20 m waschosen to compute surface models with different software
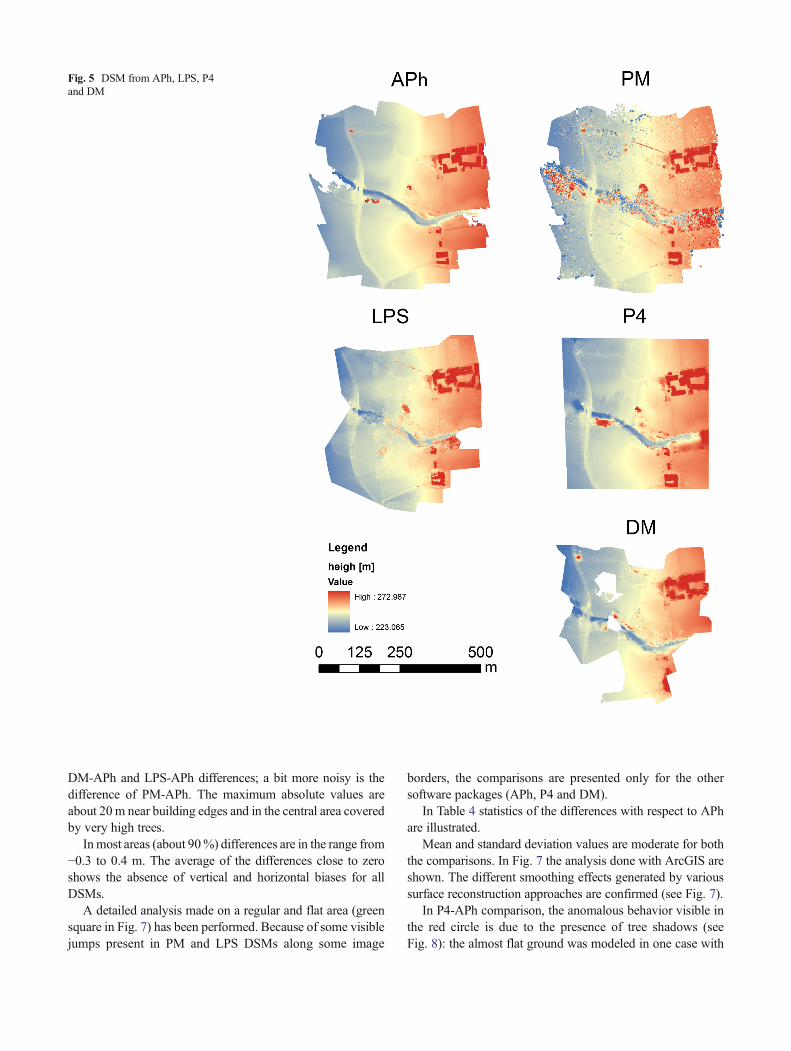
packages. Automatic procedures were used to produce direct-ly the DSM in LPS, P4 and APh whilst PM was used toproduce a point cloud as well as another home-made softwarecalled Dense Matcher (DM—Re et al. 2012), used to processthe data coming from EyeDEA/PM workflow. The pointscloud created by PM and DM were interpolated on the samegrid mesh through ArcGIS 10.0. A first visual analysis (seeFig. 5) shows that not all the software can create DSM in thewhole area: especially the one made with DM is characterizedby some gaps located in those areas where the number ofoverlapping images is low and the texture is poor.
A different behavior can be observed also where sharp heightvariations occur, for instance around buildings. P4, DM, LPS andPM indeed compute interpolated values, as in all the other parts,while APh, run in ‘sharp’ mode, seems to recognize edges andproduces a sharper DSM.
This is clearly visible in the layouts where the differencescoming from APh and the other software packages are pre-sented (see Fig. 6).
Statistics of the differences are shown in Table 3.The average value is of some centimeters for the all differ-
ences while the standard deviation is approx. 1 m for P4-APh,
Fig. 4 The 10 CPs employed in the analysis with 5 GCPs
Table 1 Bundle-block adjustment results (15 and 5 GCPs configuration)
Software TPs’generator
# TPs # observedpoints
# GCPs σ0 TheoreticalAccuracy (RMSof std.dev.) of TPs
Empirical accuracy(RMSE) of CPs
Estimatedfocal lenght
# rays perpoint
Est Nord h Est Nord h[μm] [mm] [mm] [mm] [mm] [mm] [mm] [mm]
LPSa 285 1492 15 2.6 109 89 215 − − − 4.437 5
5 2.6 119 101 259 50 50 130 4.438 5
EyeDEAb 1052 3395 15 1.4 57 50 142 − − − 4.295 3
5 1.4 68 61 181 73 81 329 4.295 3
PM 13647 55887 15 1.1 23 21 57 − − − 4.389 4
5 1.1 26 23 66 54 50 114 4.390 4
Pix4UAV 1317 6146 15 1.0 25 23 61 − − − 4.234 5
5 1.0 30 28 76 39 54 213 4.237 5
Agisoft PhotoScan 6098 19097 15 0.3 8 7 20 − − − 4.361 3
5 0.3 9 8 23 50 19 55 4.360 3
aManual measurementsb Some manual measurements
Table 2 RMSE on the CPs residuals obtained in the second test (fixedEO)
LPS EyeDEA/PM P4 APh PM
E [mm] 48 16 81 74 51
N [mm] 47 12 46 61 41
h [mm] 90 36 214 83 137
DM-APh and LPS-APh differences; a bit more noisy is thedifference of PM-APh. The maximum absolute values areabout 20m near building edges and in the central area coveredby very high trees.
Inmost areas (about 90%) differences are in the range from−0.3 to 0.4 m. The average of the differences close to zeroshows the absence of vertical and horizontal biases for allDSMs.
A detailed analysis made on a regular and flat area (greensquare in Fig. 7) has been performed. Because of some visiblejumps present in PM and LPS DSMs along some image
borders, the comparisons are presented only for the othersoftware packages (APh, P4 and DM).
In Table 4 statistics of the differences with respect to APhare illustrated.
Mean and standard deviation values are moderate for boththe comparisons. In Fig. 7 the analysis done with ArcGIS areshown. The different smoothing effects generated by varioussurface reconstruction approaches are confirmed (see Fig. 7).
In P4-APh comparison, the anomalous behavior visible inthe red circle is due to the presence of tree shadows (seeFig. 8): the almost flat ground was modeled in one case with
Fig. 5 DSM from APh, LPS, P4and DM

false height variations of the order of 1 m. This is probably dueto homologous points chosen at shadow edges, which areslightly moving during the survey, thus causing mismatchingand false intersections. This effect is visible also in the LPS
and DM DSMs. Again, there is a different software behavior:P4 and the other software packages produced higher andsharper undulations, while APh gave a smoother surface.
Finally, Fig. 9 shows the two orthophotos carried out fromthe DSM generated by P4 (above) and APh (below) with aresolution of 20 cm. The different behaviour near the roofedges is clear: APh defined the edges better than P4.
Conclusions
The rapid dissemination of UAV systems and computer visionsoftware opens new application scenarios in the context of the
Fig. 6 DSM differences
Table 3 Statistics of DSM differences
Mean St.dev. Min Max[m] [m] [m] [m]
P4-APh 0.06 0.84 −11.11 19.00
DM-APh −0.01 0.89 −15.30 16.03
LPS-APh −0.12 1.03 −15.73 15.19
PM-APh 0.06 1.57 −26.83 17.85

land management. In this work a survey of heritage landscapewas carried out for environmental documentation and moni-toring purposes, with an UAV. The images acquired by UAVs(in particular the fixed-wing ones), are suitable to be processedby different software packages developed in both computervision and photogrammetric communities (even home-madelike EyeDEA and Dense Matcher). All software packageswere able to provide the exterior orientation of the imagesand products such as the digital surface model (DSM).Programs of the first type can work almost entirely in anautomatic way and they can quickly create a high quality finalproduct. Moreover, Pix4UAV, PhotoModeler Scanner and
Agistoft Photoscan can automatically generate very densepoint clouds with high multiplicity.
The photogrammetric software requires an operator’s in-tervention in some phases, as in the exterior orientation vali-dation, in the estimation of the self-calibration parameters orin themanual selection of points in critical areas of the images.The computational time is often very high in comparison withthe other software packages. For instance, the DSM genera-tion in Dense Matcher required many hours of processing. Onthe other hand, the photogrammetric software results are better
Fig. 7 Differences of DSMs: detail in flat area
Table 4 Statistics of DSM difference in the flat region
Mean St.dev. Min Max[m] [m] [m] [m]
P4-APh 0.00 0.07 −0.37 0.49
DM-APh 0.08 0.06 −0.54 0.39
Fig. 8 Differences of DSMs (P4-APh): detail in shadow area producedfrom trees
Fig. 9 Differences of ortophotos (APh up—P4 down): detail in the edgesof some buildings
(see Table 2), in terms RMSE of control points obtained byconstraining the exterior orientation parameters. The resultsobtained in terms of DSM and orthophoto during the testswith Agisoft Photoscan seem to achieve the most reliableresults; this is highlighted by a comparison of details ratherthan a global analysis (indeed, all products did not havesystematic errors). Moreover, Agisoft Photoscan providedthe best product, especially in flat areas and in the presenceof shadows. Eventually, the strategy that this software packageemploys for the buildings outlines allows the creation oforthophotos with a high level of quality (see Fig. 9).
Acknowledgments The authors would like to thank Dr RiccardoRoncella for providing the software EyeDEA and Terradat company,owned by Paolo Dosso, who performed the flight with SenseFly System.
The project has been sponsored by Regione Lombardia (Italy)
References
Barazzetti L, Remondino F, Scaioni M, Brumana R (2010a) Fully auto-matic UAV image-based sensor orientation. Int Arch PhotogrammRemote Sens Spatial Inf Sci XXXVIII(1):6
Barazzetti L, Scaioni M, Remondino F (2010b) Orientation and 3Dmodeling from markerless terrestrial images: combining accuracywith automation. Photogramm Rec 25(132):356–381
Bay H, Ess A, Tuylelaars T, Van Gool (2008) Speeded Robust Features(SURF). Comput Vis Image Underst 110:346–359
Brown DC (1971) Close-range camera calibration. Photogramm Eng37(8):855–866
Colomina I, Blazquez M, Molina P, Parés ME, Wis M (2008) Towards anew paradigm for high-resolution low-cost photogrammetry andremote sensing. IAPRS SIS 37(B1):1201–1206
Eisenbeiss H, Sauerbier M (2011) Investigation of UAV systems andflight modes for photogrammetric applications. Photogramm Rec26(136):400–421
Fischler M, Bolles R (1981) Random sample consensus: a paradigm formodel fitting with application to image analysis and automatedcartography. Commun Assoc Comp Mach 24:81–95
Forlani G (1986) Sperimentazione del nuovo programma CALGEdell’ITM. Boll SIFET 2:63–72
Fraser CS (2013) Automatic camera calibration in close range photo-grammetry. Photogramm Eng Remote Sens 79:381–388
Gini R, Passoni D, Pinto L, Sona G (2012) Aerial images from an UAVsystem: 3d modeling and tree species classification in a park area. IntArch PhotogrammRemote Sens Spatial Inf Sci XXXIX-B1:361–366
Grenzdörffer GJ, Engel A, Teichert B (2008) The photogrammetricpotential of low-cost UAVs in forestry and agriculture. IAPRS SIS37(B1):1207–1213
Haarbrink RB, Koers E (2006) Helicopter UAV for photogrammetry andrapid response. In: International Archives of Photogrammetry,Remote Sensing and Spatial Information Sciences, ISPRSWorkshop of Inter-Commission WG I/V, Autonomous Navigation,Antwerp, Belgium
Hartley R, Zisserman A (2006) Multiple view geometry in computervision. Cambridge University Press, UK
Lowe DG (2004) Distinctive image feature from scale-invariant keypoints. Int J Comput Vis 60(2):91–110
Pollefeys M, Koch R, Van Gool L (1999) Self-calibration and metricreconstruction inspite of varying and unknown internal cameraparameters. IJCV 32(1):7–25
Re C, Roncella R, Forlani G, Cremonese G, Naletto G (2012) Evaluationof area-based image matching applied to DTM generation withHirise images. ISPRS Ann Photogramm Remote Sens Spatial InfSci I-4:209–214
Remondino F, Del Pizzo S, Kersten T, Troisi S (2012) Low-cost andopen-source solutions for automated image orientation—a criticaloverview. Progress in Culturale Heritage Preservation. LectureNotes in Computer Science. Vol.7616, pp 40–54
Remondino F, GruenA, von Schwerin J, Eisenbeiss H, Rizzi A, Giraldi S,Sauerbier M, Richards-Rissetto H (2009) Multi-sensor 3D docu-mentation of the Maya site of Copan. Proceedings of the XXIIndCIPA Symposium
Remondino F, Barazzetti L, Nex F, Scaioni M, Sarazzi D (2011) UAVphotogrammetry for mapping and 3D modeling—current status andfuture perspectives. Int Arch Photogramm Remote Sens Spat Inf SciXXXVIII-1/C22:25–31. doi:10.5194/isprsarchives-XXXVIII-1-C22-25-2011
Remondino F (2006) Detectors and descriptors for photogrammetricapplications. Int Arch Photogramm Remote Sens Spat Inf Sci36(3):4914
Roncella R, ReC, Forlani G (2011) Performance evaluation of a structure andmotion strategy in architecture and cultural heritage. Int ArchPhotogramm Remote Sens Spatial Inf Sci XXXVIII-5(W16):285–292
Strecha C, Pylvanainen T, Fua P (2010) Dynamic and scalable large scaleimage reconstruction. Comput Vis Pattern Recognit (CVPR), IEEEConference on, pp. 406–413