Embed Size (px)
Citation preview
11 Vol. 24 No. 1 April 2017
Mase.
Diterima 28 April 2015, Direvisi 04 Februari 2017, Diterima untuk dipublikasikan 31 Maret 2017.
Copyright 2017 Diterbitkan oleh Jurnal Teknik Sipil ITB, ISSN 0853-2982, DOI: 10.5614/jts.2017.24.1.2
Experimental Liquefaction Study of Southern Yogyakarta Using Shaking Table
Lindung Zalbuin Mase
Lecturer of Department of Civil Engineering, Faculty of Engineering, University of Bengkulu WR. Supratman. Rd, No.2, Kandang Limun 38371, Muara Bangkahulu, Bengkulu City
E-mail: [email protected]
ISSN 0853-2982
Jurnal Teoretis dan Terapan Bidang Rekayasa SipilJurnal Teoretis dan Terapan Bidang Rekayasa Sipil
Abstract
An experimental study using shaking table was conducted to learn liquefaction. Samples used were sandy soils from South of Yogyakarta Special Region Province. Analysis of liquefaction potential was performed by considering several factors, i.e. peak ground acceleration (PGA) of 0.3 g to 0.4 g, vibrational frequency of 1.8 Hz, and vibration duration of 8, 16, and 32 seconds which reflect earthquake magnitudes of 5, 6, and 7. The pore water pressure was measured by using a pressure transducer. Liquefaction potential was determined by using the parameter of excess pore water pressure ratio (ru). Liquefaction potentially occurred when ru > 1, whereas ru < 1 indicated liquefaction didn’t occur. The results of test showed that liquefaction potentially occur in each applied dynamic load, that maximum excess pore wate pressure (ru max) measured was equal to or larger than 1. The larger peak ground acceleration applied, the faster beginning time of liquefaction. The bigger peak ground acceleration applied, the slower dissipation time of pore water pressure. The duration of liquefaction become longer, along with the increase of applied peak ground acceleration. The bigger applied peak ground acceleration, the larger maximum excess pore water pressure.
Keywords: Sandy soil, liquefaction, vibrational frequency, excess pore water pressure ratio, shaking table.
Abstrak
Sebuah penelitian eksperimetal dengan menggunakan alat shaking table (meja getar) dilakukan untuk mempelajari likuifaksi. Bahan uji yang digunakan adalah tanah pasir yang diambil dari daerah selatan Provinsi Daerah Istimewa Yogyakarta. Analisis potensi likuifaksi dilakukan dengan mempertimbangkan beberapa parameter di antaranya percepatan maksimum gempa (PGA) sebesar 0,3 g sampai dengan 0,4 g, frekuensi getaran 1,8 Hz, dan waktu penggetaran selama 8, 16 dan 32 detik yang mewakili gempa dengan magnitudo 5, 6, dan 7. Alat pembacaan tekanan air pori yang digunakan adalah pressure tranducer. Likuifaksi ditentukan dengan menggunakan parameter rasio peningkatan tekanan air (ru). Likuifaksi berpotensi terjadi apabila nilai ru > 1, sedangkan nilai ru < 1 mengindikasikan bahwa likuifaksi tidak berpotensi terjadi. Hasil pengujian menunjukkan bahwa pasir dari selatan Provinsi Daerah Istimewa Yogyakarta berpotensi likuifaksi untuk setiap beban dinamik yang diberikan, dimana nilai rasio peningkatan tegangan air pori maksimum (ru max) yang diperoleh bernilai lebih besar atau sama dengan satu. Semakin besar percepatan maksimum yang diterapkan, maka waktu dimulainya likuifaksi semakin cepat. Semakin besar percepatan maksimum yang diberikan, maka waktu terdisipasinya tegangan air pori akan semakin lambat. Durasi terjadinya likuifaksi menjadi semakin lama, seiring dengan bertambahnya percepatan maksimum yang diterapkan. Semakin besar percepatan maksimum yang diterapkan, maka semakin besar pula tegangan air pori maksimum yang dihasilkan.
Kata-kata Kunci: Tanah pasir, likuifaksi, frekuensi getaran, rasio peningkatan tegangan air pori, shaking table.
1. Introduction
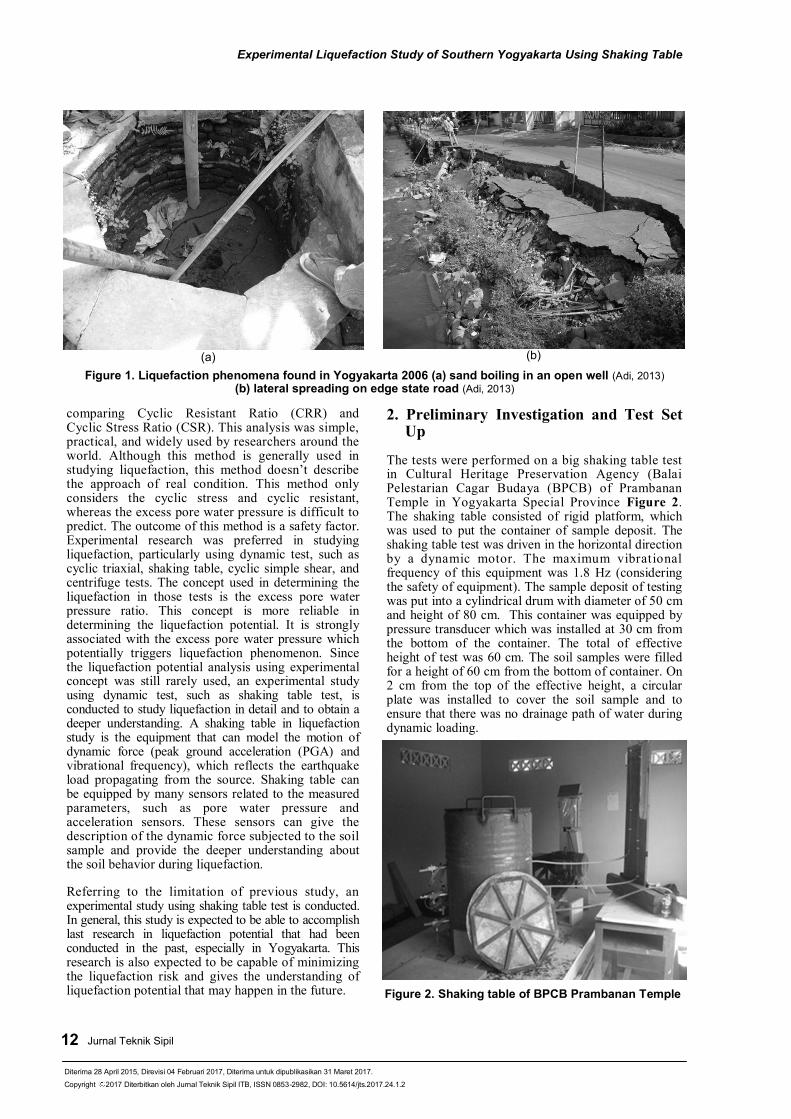
On May 26, 2006 a large earthquake with a magnitude of 6.3 MW attacked Yogyakarta. The extensive damages were resulted by this earthquake, i.e. buildings and houses collapse, the death victims (about 6000 identified death victims), and other catastrophic hazards following the earthquake. This earthquake also triggered liquefaction soils in Yogyakarta, particularly in Southern Yogyakarta, Central of Yogyakarta, and Eastern Yogyakarta. The liquefaction phenomena, such as lateral spreads and sand boils, were obviously detected in many places. These phenomena were the first witness event that occurred in Yogyakarta since the modern of geotechnical earthquake engineering. Figure 1 shows several phenomena of liquefaction in Yogyakarta Special Province.
Learning from the earthquake event on May 26, 2006, many researchers had conducted study of liquefaction potential, especially in Yogyakarta City and Bantul Regency (Southern Yogyakarta), by using empirical analyses. Several researchers had studied liquefaction potential in Southern Yogyakarta using empirical analysis, e.g. Yogatama (2013) and Setiabudi (2013). Both of them studied the liquefaction potential using CPT (Cone Penetration Test) and SPT (Standard Penetration Test) to investigate the vulnerable liquefaction zones caused during the 2006 earthquake.
The most popular analysis conducted in liquefaction study was investigating safety of liquefaction using site investigation data, such as CPT, SPT, and shear wave velocity data (VS). The analysis method used is by
12 Jurnal Teknik Sipil
Experimental Liquefaction Study of Southern Yogyakarta Using Shaking Table
Diterima 28 April 2015, Direvisi 04 Februari 2017, Diterima untuk dipublikasikan 31 Maret 2017.
Copyright 2017 Diterbitkan oleh Jurnal Teknik Sipil ITB, ISSN 0853-2982, DOI: 10.5614/jts.2017.24.1.2
comparing Cyclic Resistant Ratio (CRR) and Cyclic Stress Ratio (CSR). This analysis was simple, practical, and widely used by researchers around the world. Although this method is generally used in studying liquefaction, this method doesn’t describe the approach of real condition. This method only considers the cyclic stress and cyclic resistant, whereas the excess pore water pressure is difficult to predict. The outcome of this method is a safety factor. Experimental research was preferred in studying liquefaction, particularly using dynamic test, such as cyclic triaxial, shaking table, cyclic simple shear, and centrifuge tests. The concept used in determining the liquefaction in those tests is the excess pore water pressure ratio. This concept is more reliable in determining the liquefaction potential. It is strongly associated with the excess pore water pressure which potentially triggers liquefaction phenomenon. Since the liquefaction potential analysis using experimental concept was still rarely used, an experimental study using dynamic test, such as shaking table test, is conducted to study liquefaction in detail and to obtain a deeper understanding. A shaking table in liquefaction study is the equipment that can model the motion of dynamic force (peak ground acceleration (PGA) and vibrational frequency), which reflects the earthquake load propagating from the source. Shaking table can be equipped by many sensors related to the measured parameters, such as pore water pressure and acceleration sensors. These sensors can give the description of the dynamic force subjected to the soil sample and provide the deeper understanding about the soil behavior during liquefaction.
Referring to the limitation of previous study, an experimental study using shaking table test is conducted. In general, this study is expected to be able to accomplish last research in liquefaction potential that had been conducted in the past, especially in Yogyakarta. This research is also expected to be capable of minimizing the liquefaction risk and gives the understanding of liquefaction potential that may happen in the future.
2. Preliminary Investigation and Test Set Up
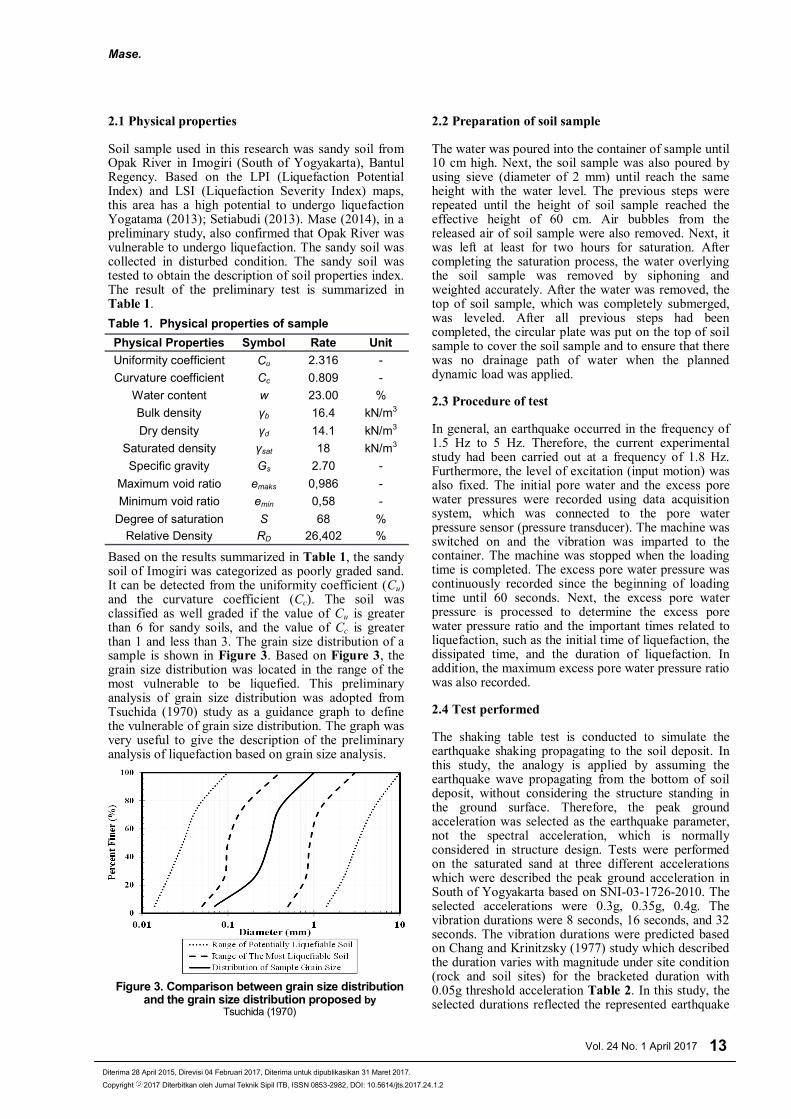
The tests were performed on a big shaking table test in Cultural Heritage Preservation Agency (Balai Pelestarian Cagar Budaya (BPCB) of Prambanan Temple in Yogyakarta Special Province Figure 2. The shaking table consisted of rigid platform, which was used to put the container of sample deposit. The shaking table test was driven in the horizontal direction by a dynamic motor. The maximum vibrational frequency of this equipment was 1.8 Hz (considering the safety of equipment). The sample deposit of testing was put into a cylindrical drum with diameter of 50 cm and height of 80 cm. This container was equipped by pressure transducer which was installed at 30 cm from the bottom of the container. The total of effective height of test was 60 cm. The soil samples were filled for a height of 60 cm from the bottom of container. On 2 cm from the top of the effective height, a circular plate was installed to cover the soil sample and to ensure that there was no drainage path of water during dynamic loading.
Figure 1. Liquefaction phenomena found in Yogyakarta 2006 (a) sand boiling in an open well (Adi, 2013) (b) lateral spreading on edge state road (Adi, 2013)
(a) (b)
Figure 2. Shaking table of BPCB Prambanan Temple
13 Vol. 24 No. 1 April 2017
Mase.
Diterima 28 April 2015, Direvisi 04 Februari 2017, Diterima untuk dipublikasikan 31 Maret 2017.
Copyright 2017 Diterbitkan oleh Jurnal Teknik Sipil ITB, ISSN 0853-2982, DOI: 10.5614/jts.2017.24.1.2
2.1 Physical properties
Soil sample used in this research was sandy soil from Opak River in Imogiri (South of Yogyakarta), Bantul Regency. Based on the LPI (Liquefaction Potential Index) and LSI (Liquefaction Severity Index) maps, this area has a high potential to undergo liquefaction Yogatama (2013); Setiabudi (2013). Mase (2014), in a preliminary study, also confirmed that Opak River was vulnerable to undergo liquefaction. The sandy soil was collected in disturbed condition. The sandy soil was tested to obtain the description of soil properties index. The result of the preliminary test is summarized in Table 1.
Based on the results summarized in Table 1, the sandy soil of Imogiri was categorized as poorly graded sand. It can be detected from the uniformity coefficient (Cu) and the curvature coefficient (Cc). The soil was classified as well graded if the value of Cu is greater than 6 for sandy soils, and the value of Cc is greater than 1 and less than 3. The grain size distribution of a sample is shown in Figure 3. Based on Figure 3, the grain size distribution was located in the range of the most vulnerable to be liquefied. This preliminary analysis of grain size distribution was adopted from Tsuchida (1970) study as a guidance graph to define the vulnerable of grain size distribution. The graph was very useful to give the description of the preliminary analysis of liquefaction based on grain size analysis.
2.2 Preparation of soil sample
The water was poured into the container of sample until 10 cm high. Next, the soil sample was also poured by using sieve (diameter of 2 mm) until reach the same height with the water level. The previous steps were repeated until the height of soil sample reached the effective height of 60 cm. Air bubbles from the released air of soil sample were also removed. Next, it was left at least for two hours for saturation. After completing the saturation process, the water overlying the soil sample was removed by siphoning and weighted accurately. After the water was removed, the top of soil sample, which was completely submerged, was leveled. After all previous steps had been completed, the circular plate was put on the top of soil sample to cover the soil sample and to ensure that there was no drainage path of water when the planned dynamic load was applied.
2.3 Procedure of test
In general, an earthquake occurred in the frequency of 1.5 Hz to 5 Hz. Therefore, the current experimental study had been carried out at a frequency of 1.8 Hz. Furthermore, the level of excitation (input motion) was also fixed. The initial pore water and the excess pore water pressures were recorded using data acquisition system, which was connected to the pore water pressure sensor (pressure transducer). The machine was switched on and the vibration was imparted to the container. The machine was stopped when the loading time is completed. The excess pore water pressure was continuously recorded since the beginning of loading time until 60 seconds. Next, the excess pore water pressure is processed to determine the excess pore water pressure ratio and the important times related to liquefaction, such as the initial time of liquefaction, the dissipated time, and the duration of liquefaction. In addition, the maximum excess pore water pressure ratio was also recorded.
2.4 Test performed
The shaking table test is conducted to simulate the earthquake shaking propagating to the soil deposit. In this study, the analogy is applied by assuming the earthquake wave propagating from the bottom of soil deposit, without considering the structure standing in the ground surface. Therefore, the peak ground acceleration was selected as the earthquake parameter, not the spectral acceleration, which is normally considered in structure design. Tests were performed on the saturated sand at three different accelerations which were described the peak ground acceleration in South of Yogyakarta based on SNI-03-1726-2010. The selected accelerations were 0.3g, 0.35g, 0.4g. The vibration durations were 8 seconds, 16 seconds, and 32 seconds. The vibration durations were predicted based on Chang and Krinitzsky (1977) study which described the duration varies with magnitude under site condition (rock and soil sites) for the bracketed duration with 0.05g threshold acceleration Table 2. In this study, the selected durations reflected the represented earthquake
Table 1. Physical properties of sample
Physical Properties Symbol Rate Unit
Uniformity coefficient Cu 2.316 -
Curvature coefficient Cc 0.809 -
Water content w 23.00 %
Bulk density γb 16.4 kN/m3
Dry density γd 14.1 kN/m3
Saturated density γsat 18 kN/m3
Specific gravity Gs 2.70 -
Maximum void ratio emaks 0,986 -
Minimum void ratio emin 0,58 -
Degree of saturation S 68 %
Relative Density RD 26,402 %
Figure 3. Comparison between grain size distribution and the grain size distribution proposed by
Tsuchida (1970)

14 Jurnal Teknik Sipil
Experimental Liquefaction Study of Southern Yogyakarta Using Shaking Table
Diterima 28 April 2015, Direvisi 04 Februari 2017, Diterima untuk dipublikasikan 31 Maret 2017.
Copyright 2017 Diterbitkan oleh Jurnal Teknik Sipil ITB, ISSN 0853-2982, DOI: 10.5614/jts.2017.24.1.2
magnitudes of 5, 6, and 7. These selected durations also reflected the earthquake duration for the epicenter of earthquake less than 10 km. This required distance was also in a good agreement with the distance between the investigated area and the 2006 earthquake source (Opak Fault) i.e. about 8-10 km.
The tests had been conducted on saturated sand at three different levels of accelerations as listed in Table 3. At each acceleration variation, the excess pore water pressure was recorded. The liquefaction parameter used in this experiment was excess pore water pressure ratio (ru). This parameter were used in experimental test of liquefaction as conducted by several researchers who studied liquefaction, such as Mase, et al. (2013) studying liqefaction potential in Opak Imogiri sandy soil and Singh, et al. (2008) studying the liquefaction potential in Solani sandy soil. ru was the comparison between excess pore water pressure and effective vertical stress. Liquefaction potentially occurred if excess pore water pressure ratio was larger than or equal to 1. In contrast, liquefaction didn’t occur when the excess pore water pressure ratio was less than 1.
3. Result and Discussion
3.1 Excess pore water pressure due to dynamic loading
Figure 4 shows the result of excess pore water pressure due to dynamic load of 0.3 g with magnitudes of 5, 6, and 7 or vibration duration of 8, 16, and 32
seconds. Based on Figure 3, the ratio of excess pore water pressure or ru has built up because of the excess pore water pressure. The value of excess pore water pressure has reached ratio of 1 or greater. It means the rate of excess pore water pressure has been the same with or larger than the effective stress (ru > 1). Generally, the excess pore water pressure has started to liquefaction in short time, i.e. the 5th second and started to dissipate at the 15th to 37th second. The excess pore water pressure resulted due to 32 second duration is the highest, whereas the excess pore water pressure ration resulted due to 16 seconds duration is higher than 8 seconds. This indicates that when the longer duration was applied, the accumulation of excess pore water pressure built up was larger. The larger accumulation results in the reduction of effective stress of soil, so the excess pore water pressure ratio is higher. The vibration duration also influences the liquefaction duration. The longer vibration keeps the excess pore water pressure amount to decrease the effective stress. The longer vibration duration means the longer liquefaction duration. In general, based on the result, it can be concluded that the sandy soil samples potentially undergo liquefaction for the dynamic load of 0.3g.
Figure 5 shows the result of excess pore water pressure due to dynamic load of 0.35 g with magnitude of 5, 6, and 7 or vibration time of 8, 16, and 32 seconds. In general, based on the result shown, it can be concluded that the sandy soil sample potentially undergoes liquefaction for the dynamic load 0.35g. Based on Figure 5, the rate of excess pore water pressure has reached ratio of 1 or greater, or the rate of excess pore water pressure has been the same with or larger than the effective stress (ru > 1). The ratio of excess pore water pressure or ru has built up and generated liquefaction when the loading was shortly started, i.e. the 4th second. This condition showed that liquefaction has already started to occur. It has started to dissipate at the 16th to 38th second. Similar to the previously mentioned result Figure 4, the longer vibration duration applied in this test also results in the higher excess pore water pressure ratio than the shorter vibration duration. The shorter time to start liquefaction and the longer time to dissipate contribute to result in the longer liquefaction duration. Compared with the experiment result of 0.3g, the excess pore water pressure ratio is higher. In addition, the starting
Table 2. Duration of strong vibration for epicenter earthquake less than 10 km (Chang and Krinitszky, 1977)
Magnitude
(MW)
Duration (seconds)
Rock Soil
5.0 4 8
5.5 6 12
6.0 8 16
6.5 11 23
7.0 16 32
7.5 22 45
8.0 31 62
8.5 43 86
Table 3. Design of dynamic loading
PGA frequency Vibration duration
(g) (Hz) (seconds)
0,30 1.8 8
0,30 1.8 16
0,30 1.8 32
0,35 1.8 8
0,35 1.8 16
0,35 1.8 32
0,40 1.8 8
0,40 1.8 16
0,40 1.8 32
Figure 4. The ratio of pore water pressure vs time for dynamic load of 0.3 g

15 Vol. 24 No. 1 April 2017
Mase.
Diterima 28 April 2015, Direvisi 04 Februari 2017, Diterima untuk dipublikasikan 31 Maret 2017.
Copyright 2017 Diterbitkan oleh Jurnal Teknik Sipil ITB, ISSN 0853-2982, DOI: 10.5614/jts.2017.24.1.2
time and the dissipation time are also shorter and longer, respectively. This indicates that the larger dynamic load tends to increase the liquefaction potential.
Figure 6 shows the result of excess pore water pressure due to dynamic load of 0.4 g with magnitude of 5, 6, and 7 or vibration time of 8, 16, and 32 seconds. In general, the soil sample can undergo liquefaction due to the dynamic load of 0.4g with all variation of vibration duration. In Figure 6, the ratio of excess pore water pressure or ru has built up because of the excess pore water pressure. The value of excess pore water pressure has reached ratio of 1 or greater. It means the rate of excess pore water pressure has been the same with or larger than the effective stress (ru > 1). The excess pore water pressure ratio has passed the initial effective stress shortly, i.e. the 3rd second. The pore water pressure also starts to dissipate at the 21st to 40th second. Compared with the previous results in Figure 3 and Figure 4, the starting time of liquefaction and the dissipated time are the shortest and the longest, respectively. In addition, the liquefaction duration resulted from dynamic load of 0.4g is longer than dynamic loads of 0.3g and 0.35g. In term of the maximum excess pore water pressure ratio, the dynamic load of 0.4g produce the higher excess pore water pressure ratio than dynamic loads of 0.3g and 0.35g. The result indicates that the larger dynamic load is able to increase liquefaction potential than the smaller dynamic load.
3.2 Effect of Peak Ground Acceleration (PGA) on the initial time of liquefaction
Figure 6 shows the variation of the applied peak ground accelerations to the initial time of liquefaction. The results are also compared with the result of Mase, et al. (2013), with vibrational frequency of 1.6 Hz and vibration duration of 32 seconds. In general, peak ground acceleration strongly influences the initial time of liquefaction. The larger peak ground acceleration shortly triggers liquefaction, whereas the smaller peak ground acceleration produces the longer starting time of liquefaction. The larger peak ground acceleration results in the larger energy than the smaller peak ground acceleration. The larger energy certainly results in the larger excess pore water pressure. The generated excess pore water pressure reaches the liquefaction threshold in a short time. In term of the effect of vibration duration, the longer vibration duration tends to generate the shorter initial time of liquefaction. The results are also in a good agreement with the previous study conducted by Mase, et al. (2013), especially for vibrational frequency of 1.6 Hz and vibration duration of 32 seconds.
3.3 Effect of Peak Ground Acceleration (PGA) to the dissipated time of pore water pressure
Figure 7 shows the time variation of dissipate pore water pressure to the applied peak ground accelerations for various vibration durations. In general, the larger
peak ground acceleration produces the longer dissipated time. When the larger PGA is applied, excess pore water pressure is generated and passes the effective stress in a short time. After the initial time of liquefaction, the larger PGA also triggers to keep the excess pore water pressure ratio standing in threshold condition. The remained vibration duration after generating the initial liquefaction also gives the contribution to PGA in generating the larger rate of excess pore water pressure. When the loading is stopped, the shaking table platform is not directly stopped. There is a free vibration after loading. The free vibration still releases the remained energy which contributes to generate a small value of excess pore water pressure. This small value of excess pore water pressure also contributes to increase the excess pore water pressure in threshold condition in a longer time. After the free vibration is totally stopped, the pore water pressure starts to dissipate. In term of vibration duration, the PGA applied in the longer vibration duration produces the longer dissipated time and vice versa. After the initial time of liquefaction, the remained vibration duration continuously triggers the liquefaction until the vibration is stopped. Therefore, the longer vibration can produce the longer dissipated time. The result also strengthens the result of Mase, et al. (2013) study stating that the peak ground acceleration influenced the dissipated time of pore water pressure, particularly for vibrational frequency of 1.6 Hz and vibrational frequency of 32 seconds.
Figure 5. The ratio of pore water pressure vs time for dynamic load of 0.35 g
Figure 6. The ratio of pore water pressure vs time for dynamic load of 0.4 g

16 Jurnal Teknik Sipil
Experimental Liquefaction Study of Southern Yogyakarta Using Shaking Table
Diterima 28 April 2015, Direvisi 04 Februari 2017, Diterima untuk dipublikasikan 31 Maret 2017.
Copyright 2017 Diterbitkan oleh Jurnal Teknik Sipil ITB, ISSN 0853-2982, DOI: 10.5614/jts.2017.24.1.2
3.4 Effect of Peak Ground Acceleration (PGA) on duration of liquefaction
Figure 8 shows the variation liquefaction duration to variation of the applied peak ground accelerations for various vibration durations. In general, the liquefaction duration becomes longer when the dynamic load increases. As previously presented in Section 3.2 and 3.3, the dynamic load plays role in determining the initial time of liquefaction and the dissipated time. Both time parameters are certainly influencing the liquefaction duration. The shorter initial time of liquefaction and the longer dissipate time will results in the longer liquefaction duration. The liquefaction duration is also strongly influenced by the vibration duration. The longer vibration duration tends to generate the longer dissipated time of pore water pressure. Certainly, the longer dissipated time of pore water pressure contributes to determine the longer liquefaction duration. Therefore, the longer vibration duration can affect the liquefaction duration. The results also deal with Mase, et al. (2013) study (vibrational frequency of 1.6 Hz and vibration duration of 32 seconds), who also stated that PGA strongly influenced the liquefaction duration.
3.5 Effect of peak ground acceleration (PGA) on maximum excess pore water pressure ratio (ru max)
Figure 9 shows the variation of the maximum excess pore water pressure ratio (ru max) to the applied peak ground accelerations for various vibration duration. In general, the larger peak ground acceleration and the longer vibration duration produce the higher maximum excess pore water pressure ratio. The larger peak ground acceleration means the larger released energy. The larger energy triggers the larger excess pore water pressure which will result in the higher excess pore water pressure ratio. In term of the vibration duration, the longer vibration duration results in the longer liquefaction duration. In the longer liquefaction duration, the applied dynamic load is able to generate the larger rate of excess pore water pressure. The larger excess pore water pressure ratio will contribute to generate the higher excess pore water pressure ratio.
Therefore, the longer vibration duration affects the generated maximum excess pore water pressure ratio. Similar to the previously presented results, the results are generally in a good agreement with Mase, et al. (2013) study, who investigated the effect of vibrational frequency of 1.6 Hz and vibration duration of 32 seconds.
4. Conclusions
The major conclusions based on the results of this study are listed as follows :
1. Liquefaction can occur in Southern Yogyakarta. It is concluded based on the result of excess pore water pressure obtained that generally exceeds the effective stress of soil.
2. The increase of peak ground acceleration will result in the shorter liquefaction starting time. The higher time of vibration also produces the shorter liquefaction starting time in the same applied peak ground acceleration.
3. The larger peak ground acceleration generally increases the dissipated time of pore water pressure. The longer vibration duration also produces the longer dissipated time.
Figure 7. The variation in time to be dissipated liquefaction with Peak Ground Acceleration
(PGA)
Figure 8. The variation in duration of liquefaction with Peak Ground Acceleration (PGA)
Figure 9. The variation in maximum excess pore water pressure ratio (ru max) with Peak Ground
Acceleration (PGA)
17 Vol. 24 No. 1 April 2017
Mase.
Diterima 28 April 2015, Direvisi 04 Februari 2017, Diterima untuk dipublikasikan 31 Maret 2017.
Copyright 2017 Diterbitkan oleh Jurnal Teknik Sipil ITB, ISSN 0853-2982, DOI: 10.5614/jts.2017.24.1.2
4. The liquefaction duration becomes longer when the applied peak ground acceleration increases. The longer vibration duration also results in the longer liquefaction duration.
5. The larger peak ground acceleration is able to result in the higher maximum excess pore water pressure ratio. In the same value of the applied peak ground acceleration, the longer vibration duration also potentially produces the higher maximum excess pore water pressure ratio.
5. Acknowledgements
Author would like to thank to Head of Cultural Heritage Preservation Agency (BPCB) Prambanan Temple Unit for the laboratory facilities and assistances in conducting shaking table tests.
References
Adi, A.D., 2013, Personal Discussion about Liquefaction in Yogyakarta.
Chang, F.K., and Krinitszky, E.L., 1977, Duration
Spectral Content and Predominant Period of Strong-Motion Earthquake Records from Western United States, Miscellaneous Paper 5-73-1, US Army Corps of Engineers Waterways Experiment Station, Vicksburg, MS, USA.
Mase, L.Z., 2014, Analisis Pendahuluan Potensi
Likuifaksi di Kali Opak Imogiri Daerah Istimewa Yogyakarta, Proceeding of the 1st Yogyakarta Geotechnical Engineers Society Seminar, Yogyakarta, Indonesia, June 10-11, 2014, pp. 145-149.
Mase, L.Z., Fathani, T.F., and Adi, A.D., 2013, Studi
Eksperimental Potensi Likuifaksi di Kali Opak Imogiri Provinsi Daerah Istimewa Yogyakarta, Proceeding of PIT HATTI XVII, Jakarta, Indonesia, November 13-14, pp. 199-204.
Setiabudi, A.P., 2013, Liquefaction Probability
Analysis Using Liquefaction Severity Index Method on Bantul Regency, Sleman Regency, and Yogyakarta City, Undergraduate Thesis: Civil Engineering, Universitas Gadjah Mada (in Indonesian).
Singh, H.P., Maheswari, B.K., and Saran, S., 2008,
Liquefaction Behavior of the Solani Sand Using Small Shaking Table, Proceeding of the 12th International Conference of International Association for Computer Method and Advances in Geomechanics, Goa, India, October 1-6, pp. 2797-2803.
SNI 03-1726-2010, 2010, Rancangan Standar Nasional
Indonesia - Standar Perencanaan Ketahanan Gempa Untuk Struktur Bangunan Gedung dan Non Gedung. Departemen Pekerjaan Umum.
Tsuchida, H., 1970, Prediction and Countermeasure against Liquefaction in Sand Deposits, Abstract of the Seminar of the Port and Harbour Research Institute, Ministry of Transport, Yokosuka, Japan.
Yogatama, B.A., and Fathani, T.F., 2013, Liquefaction
Potential Analysis on Bantul Regency and Yogyakarta City Area, Proceeding of PIT HATTI XVII, Jakarta, November 13-14, 2013. pp. 205-210.

18 Jurnal Teknik Sipil
Experimental Liquefaction Study of Southern Yogyakarta Using Shaking Table
Diterima 28 April 2015, Direvisi 04 Februari 2017, Diterima untuk dipublikasikan 31 Maret 2017.
Copyright 2017 Diterbitkan oleh Jurnal Teknik Sipil ITB, ISSN 0853-2982, DOI: 10.5614/jts.2017.24.1.2