Embed Size (px)
Citation preview

Full Terms & Conditions of access and use can be found athttps://www.tandfonline.com/action/journalInformation?journalCode=tjov20
International Journal of Ventilation
ISSN: (Print) (Online) Journal homepage: https://www.tandfonline.com/loi/tjov20
Experimental investigation of difference in indoorenvironment using impinging jet ventilation anddisplacement ventilation systems
Haruna Yamasawa , Tomohiro Kobayashi , Toshio Yamanaka , Narae Choi &Mako Matsuzaki
To cite this article: Haruna Yamasawa , Tomohiro Kobayashi , Toshio Yamanaka , Narae Choi& Mako Matsuzaki (2021): Experimental investigation of difference in indoor environment usingimpinging jet ventilation and displacement ventilation systems, International Journal of Ventilation,DOI: 10.1080/14733315.2020.1864572
To link to this article: https://doi.org/10.1080/14733315.2020.1864572
Published online: 27 Jan 2021.
Submit your article to this journal
View related articles
View Crossmark data
Experimental investigation of difference in indoorenvironment using impinging jet ventilation anddisplacement ventilation systems
Haruna Yamasawa , Tomohiro Kobayashi, Toshio Yamanaka , Narae Choi andMako Matsuzaki�Department of Architectural Engineering, Osaka University, Suita, Osaka, Japan
ABSTRACTThe impinging jet ventilation (IJV) system has been proposed as a newair distribution strategy and is expected to overcome the disadvantagesof mixing ventilation (MV) system, which is the most widely used sys-tem, and displacement ventilation (DV), which provides better air qualitythan MV. The aim of this study is to accumulate the fundamental fea-ture of IJV and to propose a simple method to predict the indoor envir-onment with IJV. Full-scale experiments were conducted in a climatechamber, in order to investigate the features of IJV. Different ventilationsystems and supply air conditions were investigated along with indoorthermal environments, and ventilation effectiveness. For IJV, the indoorenvironment was similar to that of DV with small supply momentum,and was similar to that of MV with large supply momentum. The spe-cific Archimedes number, which can be calculated by design conditions,was defined to express the balance between the supply momentumand buoyancy force. The correlation between the Archimedes numberand indices for thermal environment and ventilation effectiveness arefinally shown as prediction method.
Abbreviations: CFD: computational fluid dynamics; CRE: contaminantremoval effectiveness; DV: displacement ventilation; FL: floor level; IJV:impinging jet ventilation; MV: mixing ventilation; RNG k-e: renormalisedgroup k-e; SST k-x: sheer-stress transport k-x
ARTICLE HISTORYReceived 29 June 2020Accepted 5 December 2020
KEYWORDSImpinging jet ventilation;full-scale experiment;displacement ventilation;thermal stratification;ventilation effectiveness
1. Introduction
The mixing ventilation (MV) system has been the most popular and widely used air conditioningsystem for decades. However, in MV, the entire air in the room is mixed and diluted with sup-plied air to maintain the air quality; therefore, the contaminated air spreads through the room,even to areas that were not originally contaminated (Boyle, 1899). Accordingly, the displacementventilation (DV) system (Mundt, 1995; Suzuki et al., 2007; Xu et al., 2001; Yuan et al., 1998) wasintroduced to improve the ventilation effectiveness. In DV, the cooled air is supplied to the lowerlevel of the room with low momentum. The supplied cooled air spreads through the lower levelof the room until it reaches the heat sources. It rises upward within the thermal plume gener-ated from the heat sources, along with contaminated air. In a room with DV, vertical
CONTACT Haruna Yamasawa [email protected] Department of Architectural Engineering,Osaka University, 2-1 Yamadaoka, Suita, Osaka 565-0871, Japan.�Nikken Sekkei Ltd., Tokyo, Japan.� 2020 Informa UK Limited, trading as Taylor & Francis Group
INTERNATIONAL JOURNAL OF VENTILATIONhttps://doi.org/10.1080/14733315.2020.1864572
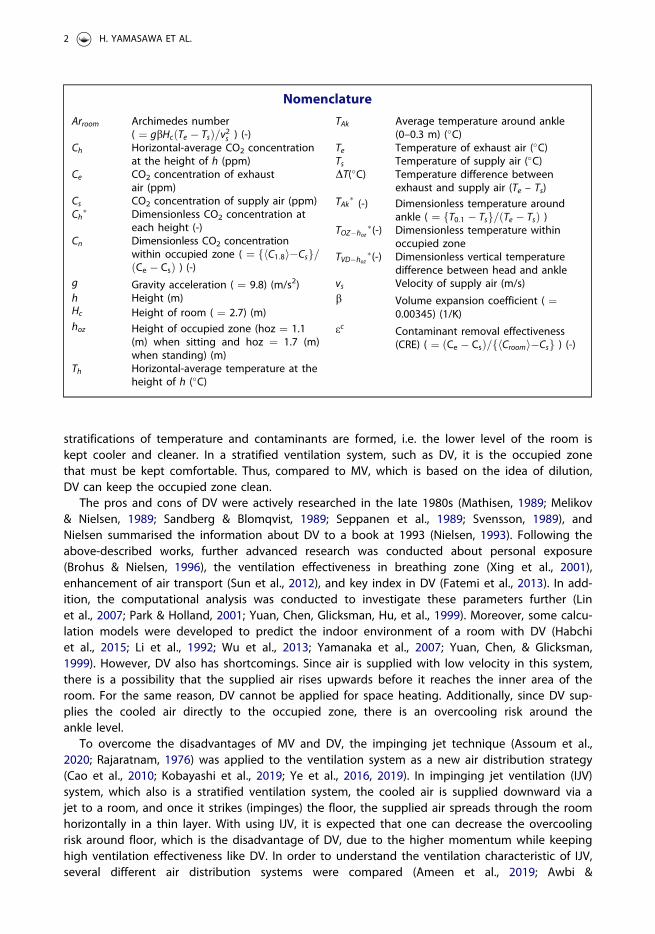
stratifications of temperature and contaminants are formed, i.e. the lower level of the room iskept cooler and cleaner. In a stratified ventilation system, such as DV, it is the occupied zonethat must be kept comfortable. Thus, compared to MV, which is based on the idea of dilution,DV can keep the occupied zone clean.
The pros and cons of DV were actively researched in the late 1980s (Mathisen, 1989; Melikov& Nielsen, 1989; Sandberg & Blomqvist, 1989; Seppanen et al., 1989; Svensson, 1989), andNielsen summarised the information about DV to a book at 1993 (Nielsen, 1993). Following theabove-described works, further advanced research was conducted about personal exposure(Brohus & Nielsen, 1996), the ventilation effectiveness in breathing zone (Xing et al., 2001),enhancement of air transport (Sun et al., 2012), and key index in DV (Fatemi et al., 2013). In add-ition, the computational analysis was conducted to investigate these parameters further (Linet al., 2007; Park & Holland, 2001; Yuan, Chen, Glicksman, Hu, et al., 1999). Moreover, some calcu-lation models were developed to predict the indoor environment of a room with DV (Habchiet al., 2015; Li et al., 1992; Wu et al., 2013; Yamanaka et al., 2007; Yuan, Chen, & Glicksman,1999). However, DV also has shortcomings. Since air is supplied with low velocity in this system,there is a possibility that the supplied air rises upwards before it reaches the inner area of theroom. For the same reason, DV cannot be applied for space heating. Additionally, since DV sup-plies the cooled air directly to the occupied zone, there is an overcooling risk around theankle level.
To overcome the disadvantages of MV and DV, the impinging jet technique (Assoum et al.,2020; Rajaratnam, 1976) was applied to the ventilation system as a new air distribution strategy(Cao et al., 2010; Kobayashi et al., 2019; Ye et al., 2016, 2019). In impinging jet ventilation (IJV)system, which also is a stratified ventilation system, the cooled air is supplied downward via ajet to a room, and once it strikes (impinges) the floor, the supplied air spreads through the roomhorizontally in a thin layer. With using IJV, it is expected that one can decrease the overcoolingrisk around floor, which is the disadvantage of DV, due to the higher momentum while keepinghigh ventilation effectiveness like DV. In order to understand the ventilation characteristic of IJV,several different air distribution systems were compared (Ameen et al., 2019; Awbi &
Nomenclature
Arroom Archimedes number( ¼ gbHc Te � Tsð Þ=v2s ) (-)
Ch Horizontal-average CO2 concentrationat the height of h (ppm)
Ce CO2 concentration of exhaustair (ppm)
Cs CO2 concentration of supply air (ppm)Ch
� Dimensionless CO2 concentration ateach height (-)
Cn Dimensionless CO2 concentrationwithin occupied zone ( ¼ C1:8h i�Csf g=Ce � Csð Þ ) (-)
g Gravity acceleration ( ¼ 9.8) (m/s2)h Height (m)Hc Height of room ( ¼ 2.7) (m)hoz Height of occupied zone (hoz ¼ 1.1
(m) when sitting and hoz ¼ 1.7 (m)when standing) (m)
Th Horizontal-average temperature at theheight of h (�C)
TAk Average temperature around ankle(0–0.3 m) (�C)
Te Temperature of exhaust air (�C)Ts Temperature of supply air (�C)DT(�C) Temperature difference between
exhaust and supply air (Te – Ts)TAk� (-) Dimensionless temperature around
ankle ( ¼ T0:1 � Tsf g=ðTe � TsÞ )TOZ�hoz
�(-) Dimensionless temperature withinoccupied zone
TVD�hoz�(-) Dimensionless vertical temperature
difference between head and anklevs Velocity of supply air (m/s)b Volume expansion coefficient ( ¼
0.00345) (1/K)ec Contaminant removal effectiveness
(CRE) ( ¼ Ce � Csð Þ= Croomh i�Csf g ) (-)
2 H. YAMASAWA ET AL.
Karimipanah, 2002; Karimipanah et al., 2000; Karimipanah & Awbi, 2002). To understand moreabout this newly proposed air distribution strategy, parametric studies are required, and compu-tational fluid dynamics (CFD) is an effective way for it, because it is possible to set the parame-ters easier than experiments. Several CFD analysis was conducted for understanding keyparameters in IJV (Chen et al., 2012; Chen, Moshfegh, & Cehlin, 2013; Chen Moshfegh, & Mathias,2013), verifying analysis method (Kobayashi et al., 2017), and investigating optimal design for IJV(Ye et al., 2020). Additionally, some investigation showed the advantages of IJV under heatingmode compared to MV (Ye et al., 2016, 2017, 2018).
Although some studies have been done to understand the features of IJV as reviewed above,few studies have been done to propose a simplified prediction method of the indoor environ-ment for the room with IJV, that is available in the design phase. For instance, Nielsen proposedthe idea of ‘family tree’ for interconnecting different type of air distribution systems for coolingwith using three-dimensional chart (Nielsen, 2001). He claimed that by collecting and organisingthe data by Archimedes number, it is possible to clarify the feature of flow pattern. This seemsto be logically rational concept which is also valid for IJV system. To date, however, the datarequired for practical prediction of the indoor environment for IJV has not been sufficientlyorganised. In a room with IJV, the distribution of temperature and contaminant varies betweenthat of DV and MV depending on several design conditions. It has not been well understood towhat extent some important parameters like Archimedes number should be adjusted to achieveintended stratification in IJV system. In this context, further knowledge must be accumulated.
Therefore, in this paper, there are two purposes: One is to understand how the indoor tem-perature and contaminant concentration distribution changes depending on the supply condi-tions, i.e. depending on the specific Archimedes number, which has not yet been sufficientlyclarified. The other is to propose a simple prediction method of some important indices regard-ing thermal environment and ventilation effectiveness for IJV, which is available in the designphase to determine supply condition.
The experiment is conducted in a climate chamber with heating elements distributed inside.For both IJV and DV, supply air conditions are the adjusted parameters. To understand the effectof the correlation between supply airflow momentum and buoyancy, the indoor temperatureand contaminant distribution are measured. Some of the results are expressed in normalisedform such as dimensionless temperature or ventilation effectiveness as important indices. Thespecific Archimedes number is used to predict these indices and the correlations are arranged,which seem to be of use for simplified estimation in the preliminary/working design phase, andhave never been organised for IJV system to date. Consequently, the empirical equations are tobe provided in the present paper.
2. Experimental methods
2.1. Experimental set-up
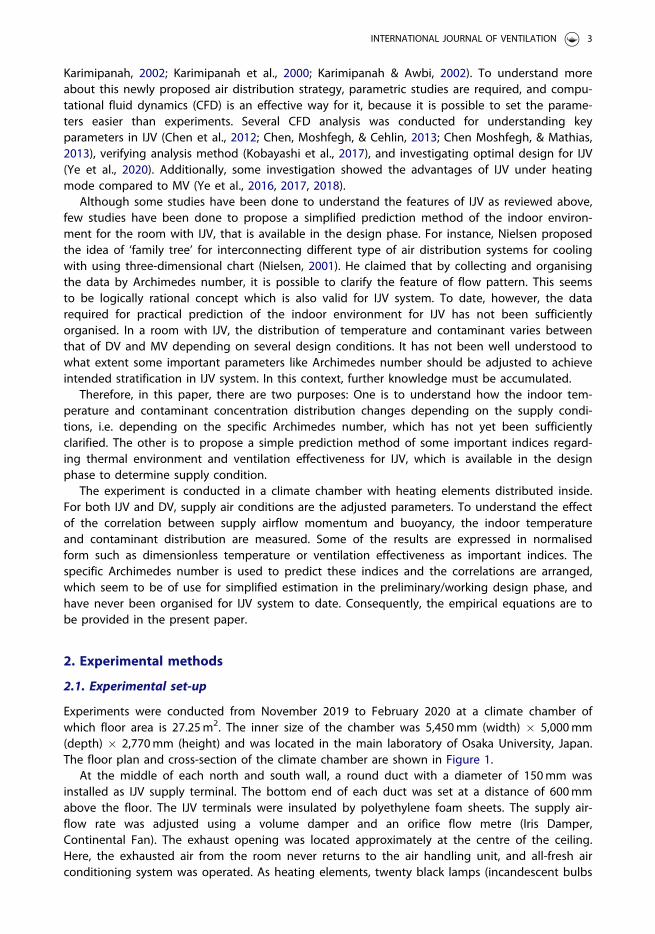
Experiments were conducted from November 2019 to February 2020 at a climate chamber ofwhich floor area is 27.25m2. The inner size of the chamber was 5,450mm (width) � 5,000mm(depth) � 2,770mm (height) and was located in the main laboratory of Osaka University, Japan.The floor plan and cross-section of the climate chamber are shown in Figure 1.
At the middle of each north and south wall, a round duct with a diameter of 150mm wasinstalled as IJV supply terminal. The bottom end of each duct was set at a distance of 600mmabove the floor. The IJV terminals were insulated by polyethylene foam sheets. The supply air-flow rate was adjusted using a volume damper and an orifice flow metre (Iris Damper,Continental Fan). The exhaust opening was located approximately at the centre of the ceiling.Here, the exhausted air from the room never returns to the air handling unit, and all-fresh airconditioning system was operated. As heating elements, twenty black lamps (incandescent bulbs
INTERNATIONAL JOURNAL OF VENTILATION 3
covered with dark purple glass), whose heat generation rate was 50W each, were distributed inthe chamber. Since its luminous efficiency is quite low, most of the electrical power is used forgenerating heat, and the portion of convective heat from black lamp is approximately 82%.
The heating elements were originally prepared for simulating the heat generation from seatedhuman and other apparatus. In this paper, for simplicity, all of the heating elements wereassumed to be simulated by cylinder of the same shape. Moreover, to facilitate the experiment,black lamp was adopted instead of cylinder. Skistad (Skistad, 1994) provided the method tolocate point heat source to replace the cylinder with heat generation rate of 50W. He providedthe equation for calculating the installation height of the point heat source that generates thesame convection current as that of the specific cylinder heat source. In order to simulate theconvection current from the cylinder with a diameter of 400mm and a height of 1,100mm,which simulates a seated human, the point heat source should be located at the height of511mm. Therefore, the black lamps were located at the height of 500mm as point heat source.Four of the black lamps were chosen for simulating the emission of contaminant generated froma human. A vinyl tube, which provided CO2 gas as the contaminant from a human, was fixedover each of the four black lamps. To decrease the initial velocity of CO2 emission, the emission-end of the tubes was inserted into sponges.
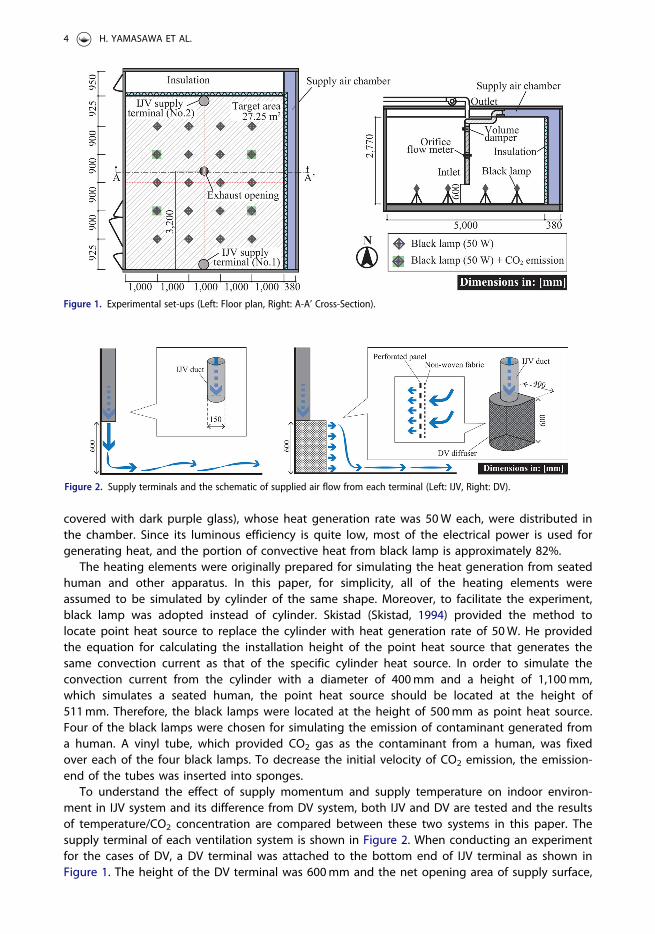
To understand the effect of supply momentum and supply temperature on indoor environ-ment in IJV system and its difference from DV system, both IJV and DV are tested and the resultsof temperature/CO2 concentration are compared between these two systems in this paper. Thesupply terminal of each ventilation system is shown in Figure 2. When conducting an experimentfor the cases of DV, a DV terminal was attached to the bottom end of IJV terminal as shown inFigure 1. The height of the DV terminal was 600mm and the net opening area of supply surface,
Figure 2. Supply terminals and the schematic of supplied air flow from each terminal (Left: IJV, Right: DV).
Figure 1. Experimental set-ups (Left: Floor plan, Right: A-A’ Cross-Section).
4 H. YAMASAWA ET AL.
which was made of a curved perforated panel with a porosity of 40.3%, was 0.188m2. Inside thesupply plane, non-woven fabric was installed for uniform velocity distribution.
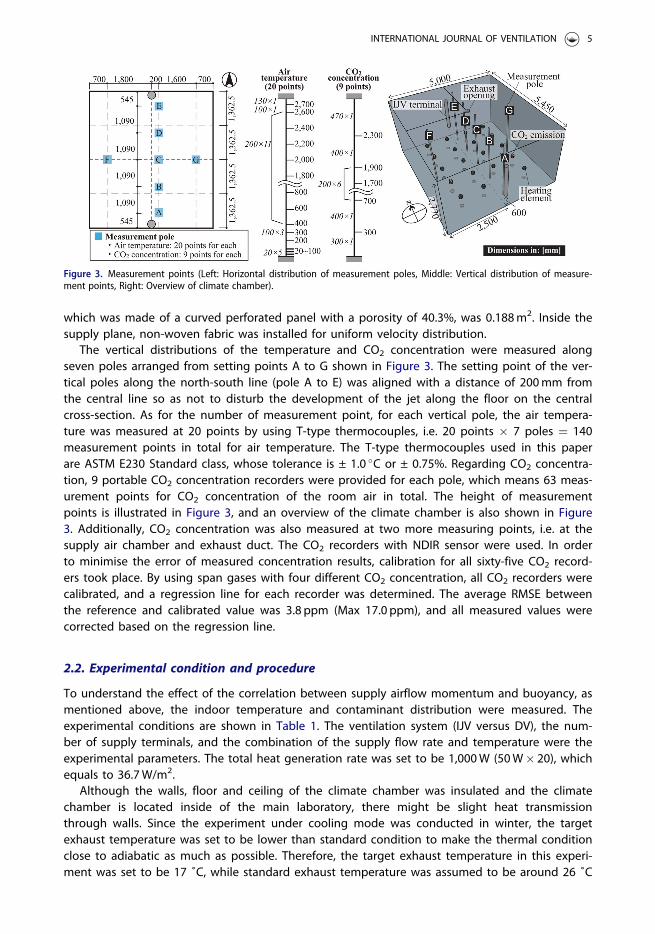
The vertical distributions of the temperature and CO2 concentration were measured alongseven poles arranged from setting points A to G shown in Figure 3. The setting point of the ver-tical poles along the north-south line (pole A to E) was aligned with a distance of 200mm fromthe central line so as not to disturb the development of the jet along the floor on the centralcross-section. As for the number of measurement point, for each vertical pole, the air tempera-ture was measured at 20 points by using T-type thermocouples, i.e. 20 points � 7 poles ¼ 140measurement points in total for air temperature. The T-type thermocouples used in this paperare ASTM E230 Standard class, whose tolerance is ± 1.0 �C or ± 0.75%. Regarding CO2 concentra-tion, 9 portable CO2 concentration recorders were provided for each pole, which means 63 meas-urement points for CO2 concentration of the room air in total. The height of measurementpoints is illustrated in Figure 3, and an overview of the climate chamber is also shown in Figure3. Additionally, CO2 concentration was also measured at two more measuring points, i.e. at thesupply air chamber and exhaust duct. The CO2 recorders with NDIR sensor were used. In orderto minimise the error of measured concentration results, calibration for all sixty-five CO2 record-ers took place. By using span gases with four different CO2 concentration, all CO2 recorders werecalibrated, and a regression line for each recorder was determined. The average RMSE betweenthe reference and calibrated value was 3.8 ppm (Max 17.0 ppm), and all measured values werecorrected based on the regression line.
2.2. Experimental condition and procedure
To understand the effect of the correlation between supply airflow momentum and buoyancy, asmentioned above, the indoor temperature and contaminant distribution were measured. Theexperimental conditions are shown in Table 1. The ventilation system (IJV versus DV), the num-ber of supply terminals, and the combination of the supply flow rate and temperature were theexperimental parameters. The total heat generation rate was set to be 1,000W (50W� 20), whichequals to 36.7W/m2.
Although the walls, floor and ceiling of the climate chamber was insulated and the climatechamber is located inside of the main laboratory, there might be slight heat transmissionthrough walls. Since the experiment under cooling mode was conducted in winter, the targetexhaust temperature was set to be lower than standard condition to make the thermal conditionclose to adiabatic as much as possible. Therefore, the target exhaust temperature in this experi-ment was set to be 17 ˚C, while standard exhaust temperature was assumed to be around 26 ˚C
Figure 3. Measurement points (Left: Horizontal distribution of measurement poles, Middle: Vertical distribution of measure-ment points, Right: Overview of climate chamber).
INTERNATIONAL JOURNAL OF VENTILATION 5
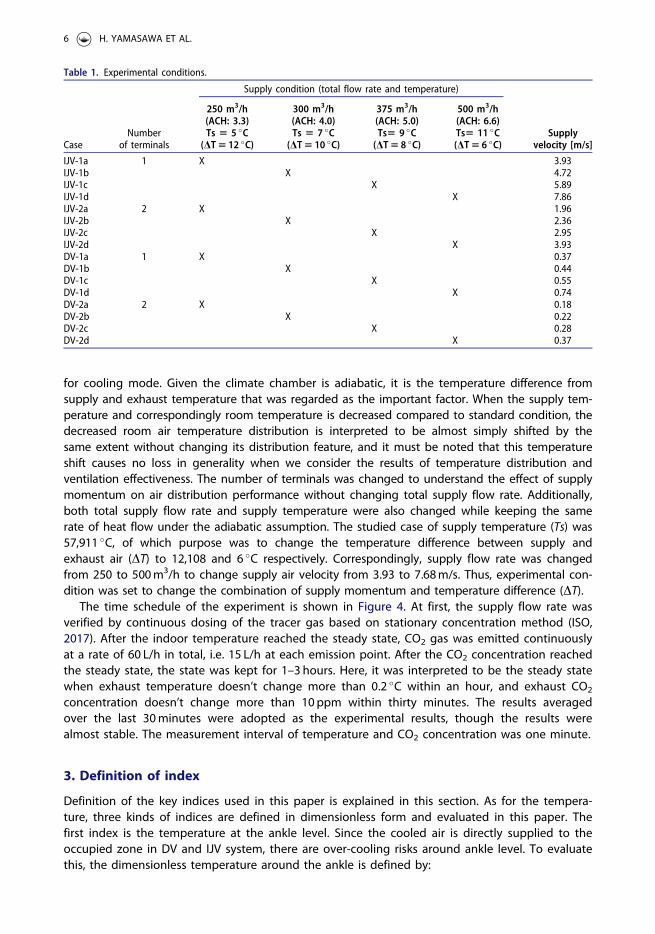
for cooling mode. Given the climate chamber is adiabatic, it is the temperature difference fromsupply and exhaust temperature that was regarded as the important factor. When the supply tem-perature and correspondingly room temperature is decreased compared to standard condition, thedecreased room air temperature distribution is interpreted to be almost simply shifted by thesame extent without changing its distribution feature, and it must be noted that this temperatureshift causes no loss in generality when we consider the results of temperature distribution andventilation effectiveness. The number of terminals was changed to understand the effect of supplymomentum on air distribution performance without changing total supply flow rate. Additionally,both total supply flow rate and supply temperature were also changed while keeping the samerate of heat flow under the adiabatic assumption. The studied case of supply temperature (Ts) was57,911 �C, of which purpose was to change the temperature difference between supply andexhaust air (DT) to 12,108 and 6 �C respectively. Correspondingly, supply flow rate was changedfrom 250 to 500m3/h to change supply air velocity from 3.93 to 7.68m/s. Thus, experimental con-dition was set to change the combination of supply momentum and temperature difference (DT).
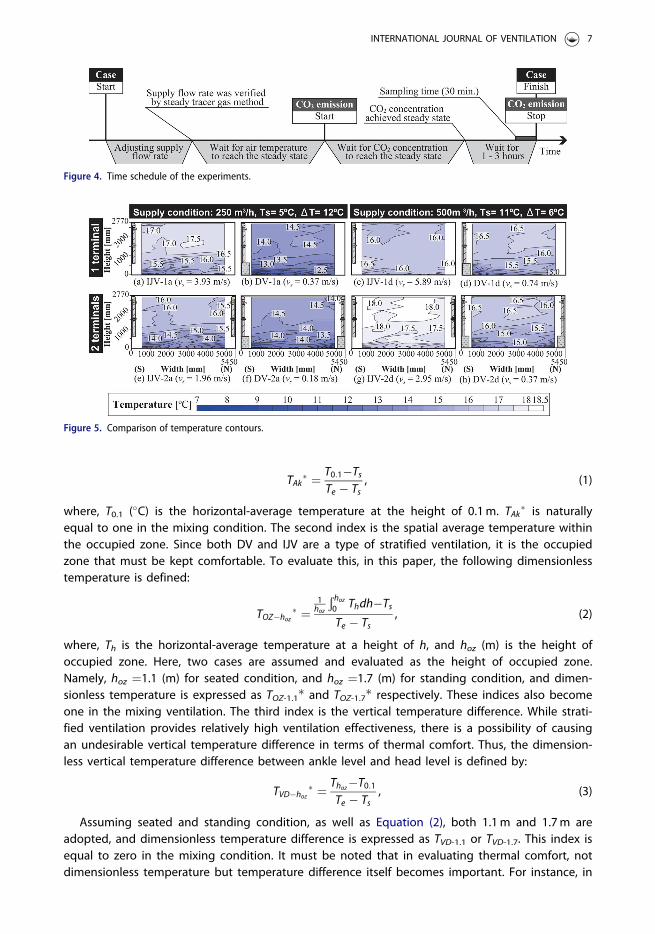
The time schedule of the experiment is shown in Figure 4. At first, the supply flow rate wasverified by continuous dosing of the tracer gas based on stationary concentration method (ISO,2017). After the indoor temperature reached the steady state, CO2 gas was emitted continuouslyat a rate of 60 L/h in total, i.e. 15 L/h at each emission point. After the CO2 concentration reachedthe steady state, the state was kept for 1–3 hours. Here, it was interpreted to be the steady statewhen exhaust temperature doesn’t change more than 0.2 �C within an hour, and exhaust CO2
concentration doesn’t change more than 10ppm within thirty minutes. The results averagedover the last 30minutes were adopted as the experimental results, though the results werealmost stable. The measurement interval of temperature and CO2 concentration was one minute.
3. Definition of index
Definition of the key indices used in this paper is explained in this section. As for the tempera-ture, three kinds of indices are defined in dimensionless form and evaluated in this paper. Thefirst index is the temperature at the ankle level. Since the cooled air is directly supplied to theoccupied zone in DV and IJV system, there are over-cooling risks around ankle level. To evaluatethis, the dimensionless temperature around the ankle is defined by:
Table 1. Experimental conditions.
CaseNumber
of terminals
Supply condition (total flow rate and temperature)
Supplyvelocity [m/s]
250 m3/h(ACH: 3.3)Ts 5 5 �C
(DT5 12 �C)
300 m3/h(ACH: 4.0)Ts 5 7 �C
(DT5 10 �C)
375 m3/h(ACH: 5.0)Ts5 9 �C(DT5 8 �C)
500 m3/h(ACH: 6.6)Ts5 11 �C(DT5 6 �C)
IJV-1a 1 X 3.93IJV-1b X 4.72IJV-1c X 5.89IJV-1d X 7.86IJV-2a 2 X 1.96IJV-2b X 2.36IJV-2c X 2.95IJV-2d X 3.93DV-1a 1 X 0.37DV-1b X 0.44DV-1c X 0.55DV-1d X 0.74DV-2a 2 X 0.18DV-2b X 0.22DV-2c X 0.28DV-2d X 0.37
6 H. YAMASAWA ET AL.
TAk� ¼ T0:1�Ts
Te � Ts, (1)
where, T0.1 (�C) is the horizontal-average temperature at the height of 0.1m. TAk� is naturallyequal to one in the mixing condition. The second index is the spatial average temperature withinthe occupied zone. Since both DV and IJV are a type of stratified ventilation, it is the occupiedzone that must be kept comfortable. To evaluate this, in this paper, the following dimensionlesstemperature is defined:
TOZ�hoz� ¼
1hoz
Ð hoz0 Thdh�TsTe � Ts
, (2)
where, Th is the horizontal-average temperature at a height of h, and hoz (m) is the height ofoccupied zone. Here, two cases are assumed and evaluated as the height of occupied zone.Namely, hoz ¼1.1 (m) for seated condition, and hoz ¼1.7 (m) for standing condition, and dimen-sionless temperature is expressed as TOZ-1.1� and TOZ-1.7� respectively. These indices also becomeone in the mixing ventilation. The third index is the vertical temperature difference. While strati-fied ventilation provides relatively high ventilation effectiveness, there is a possibility of causingan undesirable vertical temperature difference in terms of thermal comfort. Thus, the dimension-less vertical temperature difference between ankle level and head level is defined by:
TVD�hoz� ¼ Thoz�T0:1
Te � Ts, (3)
Assuming seated and standing condition, as well as Equation (2), both 1.1m and 1.7m areadopted, and dimensionless temperature difference is expressed as TVD-1.1 or TVD-1.7. This index isequal to zero in the mixing condition. It must be noted that in evaluating thermal comfort, notdimensionless temperature but temperature difference itself becomes important. For instance, in
Figure 4. Time schedule of the experiments.
Figure 5. Comparison of temperature contours.
INTERNATIONAL JOURNAL OF VENTILATION 7
ASHRAE standards 55 (ASHRAE, 2013), temperature difference between head level and anklelevel shall not exceed 3 �C (5.4 �F). This corresponds to ‘Category A’ in ISO 7730 (ISO, 2005). Inthis context, dimensional value seems to be required. However, this paper aims to organise cor-relation between these indices and Archimedes number calculated from several design condi-tions, which is explained later. Based on this correlation, dimensional temperature difference caneasily be predicted.
As for the contaminant concentration, two indices for ventilation effectiveness are evaluatedin this paper. As the first index, the contaminant removal effectiveness (CRE), ec, is evaluated thatis introduced in the REHVA guidebook (Mundt et al., 2004) by using the following equation:
ec ¼ Ce�Cs1Hc
Ð HcChdh� Cs, (4)
where, Ce and CS are the CO2 concentration of exhaust and supply air, respectively, and Ch is thehorizontal-averaged concentration at the height of h. In a fully mixed situation, CRE is equal to1.0 because the concentration in the exhaust is the same as in the whole room. As the secondindex regarding ventilation effectiveness, the dimensionless CO2 concentration within the occu-pied zone, Cn, is provided in SHASE Standard 102 in Japan (SHASE, 2011), which is defined as:
Cn ¼11:8
Ð 1:80 Chdh�CsCe � Cs
: (5)
High ventilation effectiveness gives a small value of Cn, while it gives a large value of e c.The practical role of Cn in ventilation design is that when installing a high-efficiency ventila-tion system, e.g. DV and IJV systems, the ventilation rate can be decreased to Cn � 100% incomparison with the ventilation requirement in MV to achieve the same environment in theoccupied zone.
One of the purposes of this paper is to provide a simple method to predict these indices,thus, empirical equations are expected to be obtained. In a room with an IJV system, these indi-ces are expected to be significantly affected by a number of factors, and they seem to varybetween MV and DV. As mentioned in the introduction, supply temperature and momentumseem to be the most important factors. Therefore, the Archimedes number is adopted as a par-ameter to predict above-shown indices because it considers both inertial and buoyancy force. Inthis paper, the following specific Archimedes number (Arroom) was defined and adopted:
Table 2. Actual experimental conditions.
Case
Target temperature (�C) Measured temperature (�C) Supply flow rate (m3/h)
Temperaturedifference Supply Supply Exhaust T2.7 Target
Tracer gasmeasurement
Error(%)
IJV-1a 5 12 4.7 17.1 17.3 250 235 6.1IJV-1b 7 10 6.6 15.0 15.2 300 300 0.0IJV-1c 9 8 9.1 15.3 15.7 375 375 0.1IJV-1d 11 6 11.2 15.8 16.1 500 484 3.1IJV-2a 5 12 4.4 16.0 16.2 250 262 �4.8IJV-2b 7 10 6.2 16.3 16.5 300 295 1.8IJV-2c 9 8 9.1 17.7 17.9 375 354 5.6IJV-2d 11 6 10.6 17.7 18.2 500 479 4.3DV-1a 5 12 4.4 14.4 14.4 250 241 3.7DV-1b 7 10 6.3 14.6 14.6 300 310 �3.4DV-1c 9 8 8.7 14.9 15.0 375 376 �0.2DV-1d 11 6 10.9 16.3 16.5 500 516 �3.3DV-2a 5 12 4.5 14.5 14.4 250 266 �6.3DV-2b 7 10 6.6 14.0 14.0 300 315 �5.1DV-2c 9 8 8.4 14.7 14.6 375 387 �3.3DV-2d 11 6 10.4 16.3 16.4 500 510 �2.0
8 H. YAMASAWA ET AL.
Arroom ¼ gbHc Te � Tsð Þvs2
, (6)
where, g is the gravity acceleration (9.8m/s2), b is the thermal expansion coefficient, Hc is theheight of the room (¼ 2.77m), Te is the temperature of exhaust air as the target temperature, TSis the temperature of supply air, and vs is the supply velocity. Given Te can roughly be estimatedby assuming certain heat loss condition, Arroom can be obtained by design conditions, such assupply temperature, supply flow rate, target temperature, room shape and inlet shape.Therefore, it is expected that by obtaining the correlation between Arroom and indoor environ-ment indices, it is possible to predict the indoor environment in the design phase. In order toexpress the inlet condition, Kobayashi also defined ArSA, which adopted the temperature differ-ence between the supply air and the air at lower level of the room, which is entrained into thejet (Kobayashi et al., 2019). However, since the aim of this paper is to provide the predictionmethod available in a design phase, the input parameter shall be obtained from the design con-ditions. The temperature of the entrained air at the lower level cannot be easily estimated fromdesign conditions, but that itself is the target to be predicted. Thus, Arroom which can beobtained by only design parameters is adopted as an explanatory variable to predict indoorenvironmental indices for IJV system.
4. Results and discussion
4.1. Temperature distribution
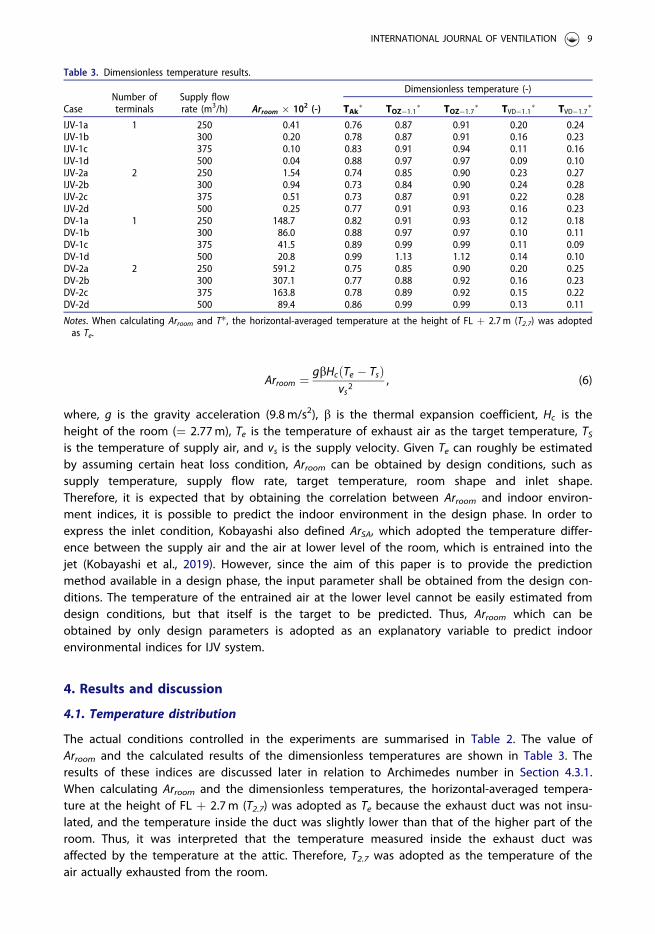
The actual conditions controlled in the experiments are summarised in Table 2. The value ofArroom and the calculated results of the dimensionless temperatures are shown in Table 3. Theresults of these indices are discussed later in relation to Archimedes number in Section 4.3.1.When calculating Arroom and the dimensionless temperatures, the horizontal-averaged tempera-ture at the height of FL þ 2.7m (T2.7) was adopted as Te because the exhaust duct was not insu-lated, and the temperature inside the duct was slightly lower than that of the higher part of theroom. Thus, it was interpreted that the temperature measured inside the exhaust duct wasaffected by the temperature at the attic. Therefore, T2.7 was adopted as the temperature of theair actually exhausted from the room.
Table 3. Dimensionless temperature results.
CaseNumber ofterminals
Supply flowrate (m3/h) Arroom � 102 (-)
Dimensionless temperature (-)
TAk� TOZ�1:1� TOZ�1:7
� TVD�1:1� TVD�1:7
�
IJV-1a 1 250 0.41 0.76 0.87 0.91 0.20 0.24IJV-1b 300 0.20 0.78 0.87 0.91 0.16 0.23IJV-1c 375 0.10 0.83 0.91 0.94 0.11 0.16IJV-1d 500 0.04 0.88 0.97 0.97 0.09 0.10IJV-2a 2 250 1.54 0.74 0.85 0.90 0.23 0.27IJV-2b 300 0.94 0.73 0.84 0.90 0.24 0.28IJV-2c 375 0.51 0.73 0.87 0.91 0.22 0.28IJV-2d 500 0.25 0.77 0.91 0.93 0.16 0.23DV-1a 1 250 148.7 0.82 0.91 0.93 0.12 0.18DV-1b 300 86.0 0.88 0.97 0.97 0.10 0.11DV-1c 375 41.5 0.89 0.99 0.99 0.11 0.09DV-1d 500 20.8 0.99 1.13 1.12 0.14 0.10DV-2a 2 250 591.2 0.75 0.85 0.90 0.20 0.25DV-2b 300 307.1 0.77 0.88 0.92 0.16 0.23DV-2c 375 163.8 0.78 0.89 0.92 0.15 0.22DV-2d 500 89.4 0.86 0.99 0.99 0.13 0.11
Notes. When calculating Arroom and T�, the horizontal-averaged temperature at the height of FL þ 2.7m (T2.7) was adoptedas Te.
INTERNATIONAL JOURNAL OF VENTILATION 9
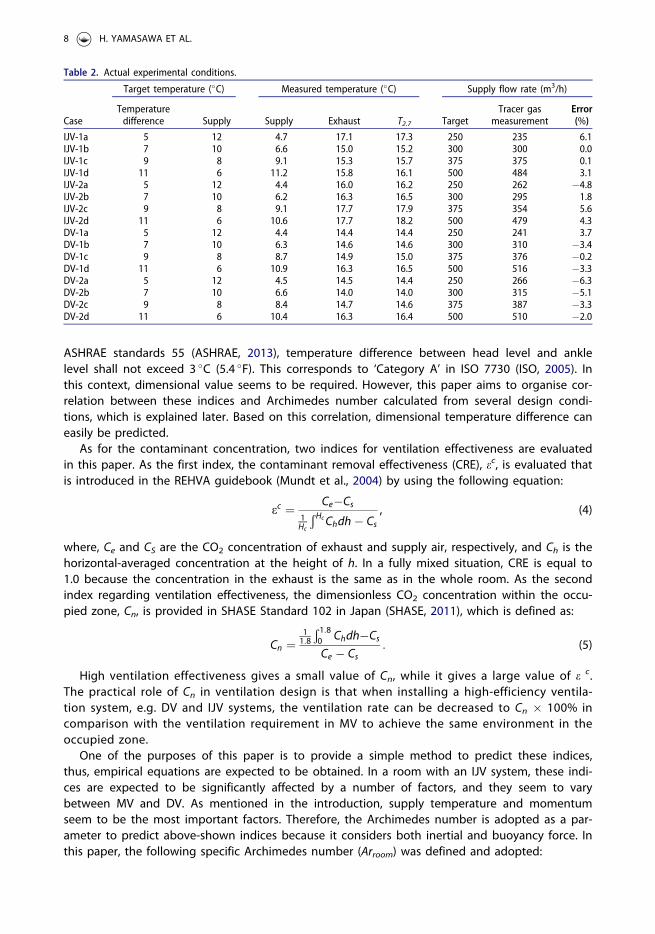
Temperature distributions of the north-south central cross-section are shown as contours inFigure 5. In the Case IJV series with a small supply flow rate, the vertically stratified temperaturedistribution is formed, while it cannot be seen with a large supply flow rate. On the other hand,in the Case DV series, the temperature stratified clearly in all cases.
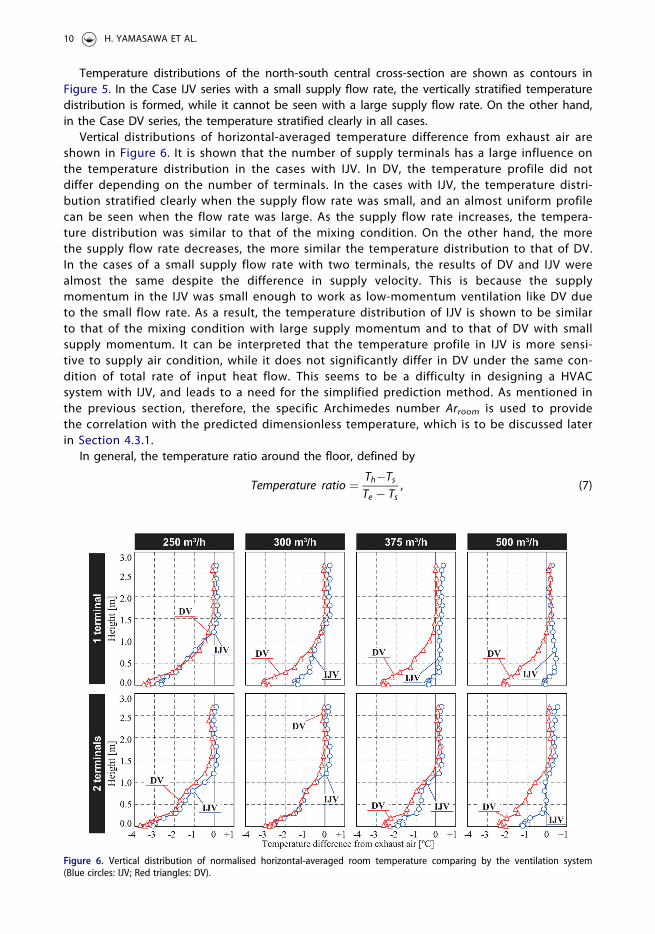
Vertical distributions of horizontal-averaged temperature difference from exhaust air areshown in Figure 6. It is shown that the number of supply terminals has a large influence onthe temperature distribution in the cases with IJV. In DV, the temperature profile did notdiffer depending on the number of terminals. In the cases with IJV, the temperature distri-bution stratified clearly when the supply flow rate was small, and an almost uniform profilecan be seen when the flow rate was large. As the supply flow rate increases, the tempera-ture distribution was similar to that of the mixing condition. On the other hand, the morethe supply flow rate decreases, the more similar the temperature distribution to that of DV.In the cases of a small supply flow rate with two terminals, the results of DV and IJV werealmost the same despite the difference in supply velocity. This is because the supplymomentum in the IJV was small enough to work as low-momentum ventilation like DV dueto the small flow rate. As a result, the temperature distribution of IJV is shown to be similarto that of the mixing condition with large supply momentum and to that of DV with smallsupply momentum. It can be interpreted that the temperature profile in IJV is more sensi-tive to supply air condition, while it does not significantly differ in DV under the same con-dition of total rate of input heat flow. This seems to be a difficulty in designing a HVACsystem with IJV, and leads to a need for the simplified prediction method. As mentioned inthe previous section, therefore, the specific Archimedes number Arroom is used to providethe correlation with the predicted dimensionless temperature, which is to be discussed laterin Section 4.3.1.
In general, the temperature ratio around the floor, defined by
Temperature ratio ¼ Th�TsTe � Ts
, (7)
Figure 6. Vertical distribution of normalised horizontal-averaged room temperature comparing by the ventilation system(Blue circles: IJV; Red triangles: DV).
10 H. YAMASAWA ET AL.
is approximately equal to 0.65 in the displacement ventilated room with the distributed heatsources (Kosonen et al., 2002). Here, the temperature ratio around the floor was calculated byusing the temperature at a height of 20mm, T0:02, as Th: The average temperature ratio of IJVwas 0.829 (standard deviation: 0.087) and that of DV was 0.660 (standard deviation: 0.014). It wasshown that the temperature ratio around the floor was approximately the same as the literaturevalue in the cases of DV, while it becomes larger in IJV cases. This indicates that in IJV the tem-perature at the lower level can be kept higher in comparison with DV, where over coolingaround the floor can be a problem.
4.2. Co2 concentration distribution
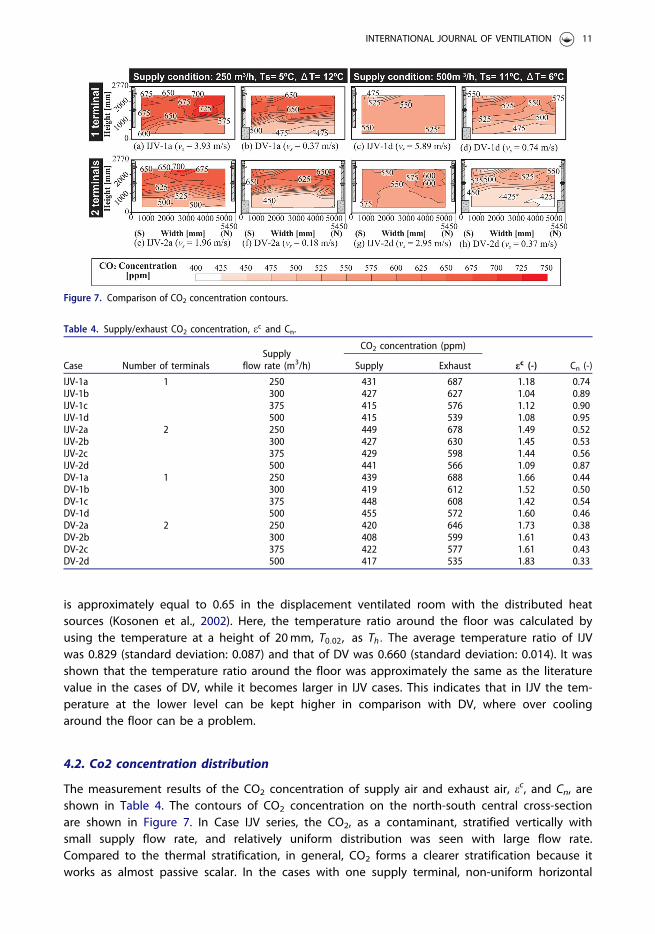
The measurement results of the CO2 concentration of supply air and exhaust air, ec, and Cn, areshown in Table 4. The contours of CO2 concentration on the north-south central cross-sectionare shown in Figure 7. In Case IJV series, the CO2, as a contaminant, stratified vertically withsmall supply flow rate, and relatively uniform distribution was seen with large flow rate.Compared to the thermal stratification, in general, CO2 forms a clearer stratification because itworks as almost passive scalar. In the cases with one supply terminal, non-uniform horizontal
Figure 7. Comparison of CO2 concentration contours.
Table 4. Supply/exhaust CO2 concentration, ec and Cn.
Case Number of terminalsSupply
flow rate (m3/h)
CO2 concentration (ppm)
ec (-) Cn (-)Supply Exhaust
IJV-1a 1 250 431 687 1.18 0.74IJV-1b 300 427 627 1.04 0.89IJV-1c 375 415 576 1.12 0.90IJV-1d 500 415 539 1.08 0.95IJV-2a 2 250 449 678 1.49 0.52IJV-2b 300 427 630 1.45 0.53IJV-2c 375 429 598 1.44 0.56IJV-2d 500 441 566 1.09 0.87DV-1a 1 250 439 688 1.66 0.44DV-1b 300 419 612 1.52 0.50DV-1c 375 448 608 1.42 0.54DV-1d 500 455 572 1.60 0.46DV-2a 2 250 420 646 1.73 0.38DV-2b 300 408 599 1.61 0.43DV-2c 375 422 577 1.61 0.43DV-2d 500 417 535 1.83 0.33
INTERNATIONAL JOURNAL OF VENTILATION 11
distribution can be seen, as well as temperature distribution, when the supply momentum wassmall. As shown in Case IJV-1a, though fresh air was supplied from the terminal mounted on thesouth wall, the CO2 concentration around the lower part of the room was lower than that in thenorth part of the room. It was assumed that after the impingement on the floor, the jet startedspreading with a thin layer. As the jet spreads, the thickness of the jet increases due to theentrainment of the ambient air and the jet rose upward when it reached the heating elements.Thus, the CO2 concentration was relatively high in the south area, which was close to the sup-ply terminal.
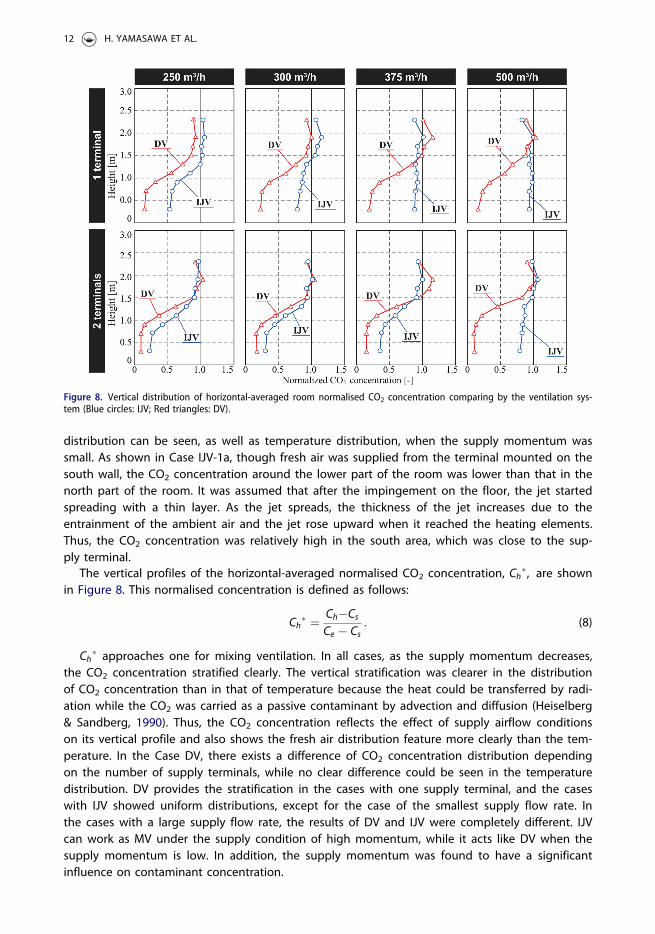
The vertical profiles of the horizontal-averaged normalised CO2 concentration, Ch�, are shownin Figure 8. This normalised concentration is defined as follows:
Ch� ¼ Ch�CsCe � Cs
: (8)
Ch� approaches one for mixing ventilation. In all cases, as the supply momentum decreases,
the CO2 concentration stratified clearly. The vertical stratification was clearer in the distributionof CO2 concentration than in that of temperature because the heat could be transferred by radi-ation while the CO2 was carried as a passive contaminant by advection and diffusion (Heiselberg& Sandberg, 1990). Thus, the CO2 concentration reflects the effect of supply airflow conditionson its vertical profile and also shows the fresh air distribution feature more clearly than the tem-perature. In the Case DV, there exists a difference of CO2 concentration distribution dependingon the number of supply terminals, while no clear difference could be seen in the temperaturedistribution. DV provides the stratification in the cases with one supply terminal, and the caseswith IJV showed uniform distributions, except for the case of the smallest supply flow rate. Inthe cases with a large supply flow rate, the results of DV and IJV were completely different. IJVcan work as MV under the supply condition of high momentum, while it acts like DV when thesupply momentum is low. In addition, the supply momentum was found to have a significantinfluence on contaminant concentration.
Figure 8. Vertical distribution of horizontal-averaged room normalised CO2 concentration comparing by the ventilation sys-tem (Blue circles: IJV; Red triangles: DV).
12 H. YAMASAWA ET AL.
In order to make the emitted CO2 rise up within thermal plume, the emission point of CO2
was set just above the heating element, which is 600mm above the floor. However, 600mm waspossibly too low for simulating the contaminant emission from human, and the low emissionpoint could have made the height of contaminant interface (the height that vertical contaminantconcentration suddenly changes) lower than actual phenomenon. Therefore, the method for sim-ulating heat and contaminant generation from human remained as issues to be discussed.
4.3. Correlation between the Archimedes number and various indices
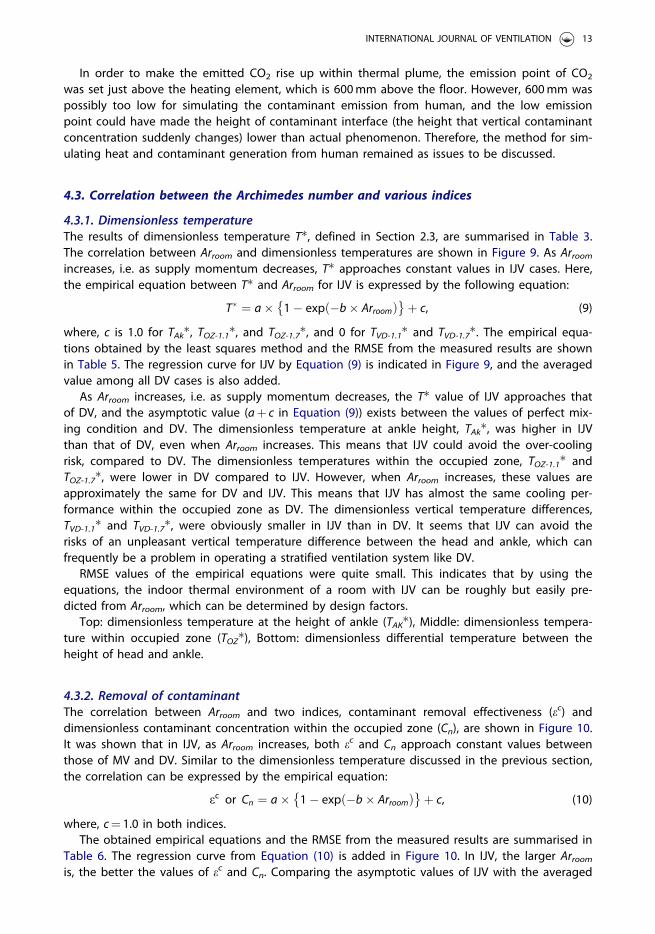
4.3.1. Dimensionless temperatureThe results of dimensionless temperature T�, defined in Section 2.3, are summarised in Table 3.The correlation between Arroom and dimensionless temperatures are shown in Figure 9. As Arroomincreases, i.e. as supply momentum decreases, T� approaches constant values in IJV cases. Here,the empirical equation between T� and Arroom for IJV is expressed by the following equation:
T� ¼ a� 1� exp �b� Arroomð Þ� �þ c, (9)
where, c is 1.0 for TAk�, TOZ-1.1�, and TOZ-1.7�, and 0 for TVD-1.1� and TVD-1.7�. The empirical equa-tions obtained by the least squares method and the RMSE from the measured results are shownin Table 5. The regression curve for IJV by Equation (9) is indicated in Figure 9, and the averagedvalue among all DV cases is also added.
As Arroom increases, i.e. as supply momentum decreases, the T� value of IJV approaches thatof DV, and the asymptotic value (aþ c in Equation (9)) exists between the values of perfect mix-ing condition and DV. The dimensionless temperature at ankle height, TAk�, was higher in IJVthan that of DV, even when Arroom increases. This means that IJV could avoid the over-coolingrisk, compared to DV. The dimensionless temperatures within the occupied zone, TOZ-1.1� andTOZ-1.7�, were lower in DV compared to IJV. However, when Arroom increases, these values areapproximately the same for DV and IJV. This means that IJV has almost the same cooling per-formance within the occupied zone as DV. The dimensionless vertical temperature differences,TVD-1.1� and TVD-1.7�, were obviously smaller in IJV than in DV. It seems that IJV can avoid therisks of an unpleasant vertical temperature difference between the head and ankle, which canfrequently be a problem in operating a stratified ventilation system like DV.
RMSE values of the empirical equations were quite small. This indicates that by using theequations, the indoor thermal environment of a room with IJV can be roughly but easily pre-dicted from Arroom, which can be determined by design factors.
Top: dimensionless temperature at the height of ankle (TAK�), Middle: dimensionless tempera-ture within occupied zone (TOZ�), Bottom: dimensionless differential temperature between theheight of head and ankle.
4.3.2. Removal of contaminantThe correlation between Arroom and two indices, contaminant removal effectiveness (ec) anddimensionless contaminant concentration within the occupied zone (Cn), are shown in Figure 10.It was shown that in IJV, as Arroom increases, both ec and Cn approach constant values betweenthose of MV and DV. Similar to the dimensionless temperature discussed in the previous section,the correlation can be expressed by the empirical equation:
ec or Cn ¼ a� 1� exp �b� Arroomð Þ� �þ c, (10)
where, c¼ 1.0 in both indices.The obtained empirical equations and the RMSE from the measured results are summarised in
Table 6. The regression curve from Equation (10) is added in Figure 10. In IJV, the larger Arroomis, the better the values of ec and Cn. Comparing the asymptotic values of IJV with the averaged
INTERNATIONAL JOURNAL OF VENTILATION 13
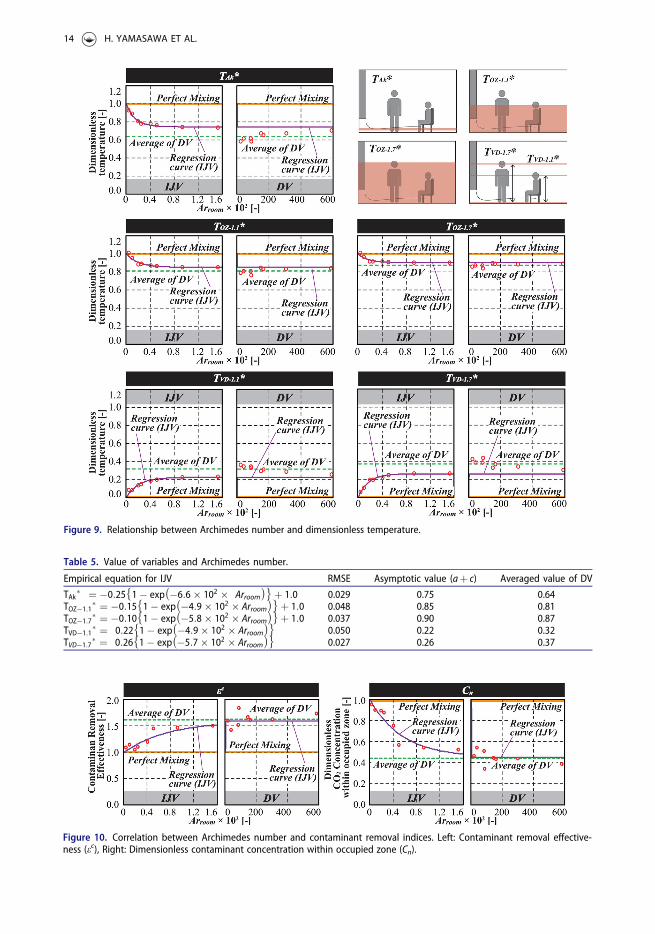
Figure 9. Relationship between Archimedes number and dimensionless temperature.
Table 5. Value of variables and Archimedes number.
Empirical equation for IJV RMSE Asymptotic value (aþ c) Averaged value of DV
TAk� ¼ �0:25 1� exp �6:6� 102 � Arroom� �� �
þ 1:0 0.029 0.75 0.64TOZ�1:1
� ¼ �0:15 1� exp �4:9� 102 � Arroom� �� �
þ 1:0 0.048 0.85 0.81TOZ�1:7
� ¼ �0:10 1� exp �5:8� 102 � Arroom� �� �
þ 1:0 0.037 0.90 0.87TVD�1:1
� ¼ 0:22 1� exp �4:9� 102 � Arroom� �� �
0.050 0.22 0.32TVD�1:7
� ¼ 0:26 1� exp �5:7� 102 � Arroom� �� �
0.027 0.26 0.37
Figure 10. Correlation between Archimedes number and contaminant removal indices. Left: Contaminant removal effective-ness (ec), Right: Dimensionless contaminant concentration within occupied zone (Cn).
14 H. YAMASAWA ET AL.
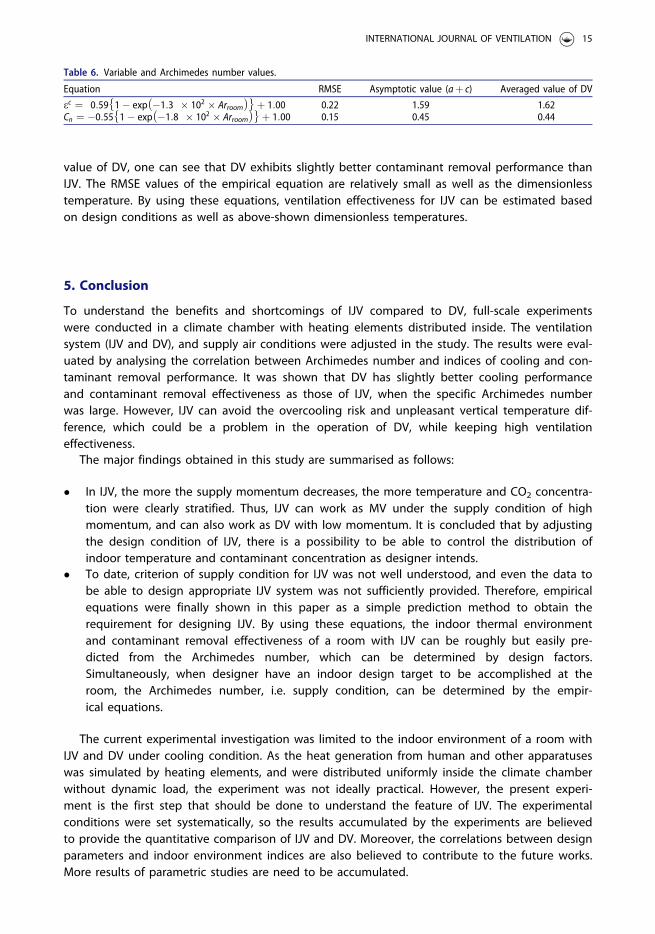
value of DV, one can see that DV exhibits slightly better contaminant removal performance thanIJV. The RMSE values of the empirical equation are relatively small as well as the dimensionlesstemperature. By using these equations, ventilation effectiveness for IJV can be estimated basedon design conditions as well as above-shown dimensionless temperatures.
5. Conclusion
To understand the benefits and shortcomings of IJV compared to DV, full-scale experimentswere conducted in a climate chamber with heating elements distributed inside. The ventilationsystem (IJV and DV), and supply air conditions were adjusted in the study. The results were eval-uated by analysing the correlation between Archimedes number and indices of cooling and con-taminant removal performance. It was shown that DV has slightly better cooling performanceand contaminant removal effectiveness as those of IJV, when the specific Archimedes numberwas large. However, IJV can avoid the overcooling risk and unpleasant vertical temperature dif-ference, which could be a problem in the operation of DV, while keeping high ventilationeffectiveness.
The major findings obtained in this study are summarised as follows:
� In IJV, the more the supply momentum decreases, the more temperature and CO2 concentra-tion were clearly stratified. Thus, IJV can work as MV under the supply condition of highmomentum, and can also work as DV with low momentum. It is concluded that by adjustingthe design condition of IJV, there is a possibility to be able to control the distribution ofindoor temperature and contaminant concentration as designer intends.
� To date, criterion of supply condition for IJV was not well understood, and even the data tobe able to design appropriate IJV system was not sufficiently provided. Therefore, empiricalequations were finally shown in this paper as a simple prediction method to obtain therequirement for designing IJV. By using these equations, the indoor thermal environmentand contaminant removal effectiveness of a room with IJV can be roughly but easily pre-dicted from the Archimedes number, which can be determined by design factors.Simultaneously, when designer have an indoor design target to be accomplished at theroom, the Archimedes number, i.e. supply condition, can be determined by the empir-ical equations.
The current experimental investigation was limited to the indoor environment of a room withIJV and DV under cooling condition. As the heat generation from human and other apparatuseswas simulated by heating elements, and were distributed uniformly inside the climate chamberwithout dynamic load, the experiment was not ideally practical. However, the present experi-ment is the first step that should be done to understand the feature of IJV. The experimentalconditions were set systematically, so the results accumulated by the experiments are believedto provide the quantitative comparison of IJV and DV. Moreover, the correlations between designparameters and indoor environment indices are also believed to contribute to the future works.More results of parametric studies are need to be accumulated.
Table 6. Variable and Archimedes number values.
Equation RMSE Asymptotic value (aþ c) Averaged value of DV
ec ¼ 0:59 1� exp �1:3 � 102 � Arroom� �� �
þ 1:00 0.22 1.59 1.62Cn ¼ �0:55 1� exp �1:8 � 102 � Arroom
� �� �þ 1:00 0.15 0.45 0.44
INTERNATIONAL JOURNAL OF VENTILATION 15
Disclosure statement
No potential conflict of interest was reported by the authors.
Funding
A part of this work was supported by JSPS KAKENHI Grant Number JP20J10608 (Principal Investigator, HarunaYamasawa). This research did not receive any other specific grant from funding agencies in the public, commercial,or not-for-profit sectors.
Notes on contributors
Haruna Yamasawa is a PhD student at the Department of Architectural Engineering, Osaka University in Japan andis a research fellow of Japan Society for the Promotion of Science. Her research includes indoor air quality, thermalcomfort, air distribution and thermal energy storage.
Tomohiro Kobayashi is an associate professor at the Department of Architectural Engineering, Osaka University inJapan. His research includes ventilation, air distribution, indoor air quality, thermal comfort, and HVAC-systemsin buildings.
Toshio Yamanaka is a professor at the Department of Architectural Engineering, Osaka University in Japan. Hisresearch includes ventilation, indoor air quality, thermal comfort, air distribution and odor evaluation.
Narae Choi is a specially appointed assistant professor at the Department of Architectural Engineering, OsakaUniversity in Japan. Her research includes indoor air quality, thermal comfort, air distribution and odor evaluation.
Mako Matsuzaki serves as facility designer at Nikken Sekkei Ltd. in Japan. Her research includes indoor air quality,thermal comfort and air distribution.
ORCID
Haruna Yamasawa http://orcid.org/0000-0002-1262-8781Toshio Yamanaka http://orcid.org/0000-0002-7660-1609
References
Ameen, A., Cehlin, M., Larsson, U., & Karimipanah, T. (2019). Experimental investigation of the ventilation perform-ance of different air distribution systems in an office environment—cooling mode. Energies, 12(7), 1354–1368.https://doi.org/10.3390/en12071354
ASHRAE. (2013). ASHRAE Standard 55-2013: Thermal Environmental Conditions for Human Occupancy. Retrievedfrom: https://www.ashrae.org/technical-resources/bookstore/standard-55-thermal-environmental-conditions-for-human-occupancy.
Assoum, H. H., Hamdi, J., El Hassan, M., Abed-Meraim, K., El Kheir, M., Mrach, T., El Asmar, S., & Sakout, A. (2020).Turbulent kinetic energy and self-sustaining tones: Experimental study of a rectangular impinging jet using highspeed 3D tomographic particle image velocimetry. Journal of Mechanical Engineering and Sciences, 14(1),6322–6333. https://doi.org/10.15282/jmes.14.1.2020.10.0495
Awbi, H., & Karimipanah, T. (2002). A comparison between four different ventilation systems [Paper presentation]. InRoomvent, Copenhagen, Denmark (pp. 181–184). https://doi.org/10.2307/3405502
Boyle, R. (1899). Natural and artificial methods of ventilation. Nature, 61, 72–83. https://doi.org/10.1038/061006a0Brohus, H., & Nielsen, P. (1996). Personal exposure in displacement ventilated rooms. Indoor Air, 6(3), 157–167.
https://doi.org/10.1111/j.1600-0668.1996.t01-1-00003.xCao, G., Ruponen, M., & Kurnitski, J. (2010). Experimental investigation of the velocity distribution of the attached
plane jet after impingement with the corner in a high room. Energy and Buildings, 42(6), 935–944. https://doi.org/10.1016/j.enbuild.2010.01.005
Chen, H. J., Moshfegh, B., & Cehlin, M. (2012). Numerical investigation of the flow behavior of an isothermal imping-ing jet in a room. Building and Environment, 49, 154–166. https://doi.org/10.1016/j.buildenv.2011.09.027
Chen, H. J., Moshfegh, B., & Cehlin, M. (2013). Investigation on the flow and thermal behavior of impinging jet ven-tilation systems in an office with different heat loads. Building and Environment, 59, 127–144. https://doi.org/10.1016/j.buildenv.2012.08.014
16 H. YAMASAWA ET AL.
Chen, H., Moshfegh, B., & Mathias, C. (2013). Computational investigation on the factors influencing thermal com-fort for impinging jet ventilation. Building and Environment, 66, 29–41. https://doi.org/10.1016/j.buildenv.2013.04.018
Fatemi, I., Wang, B. C., Koupriyanov, M., & Tully, B. (2013). Experimental study of a non-isothermal wall jet issued bya displacement ventilation system. Building and Environment, 66, 131–140. https://doi.org/10.1016/j.buildenv.2013.04.019
Habchi, C., Ghali, K., & Ghaddar, N. (2015). Displacement ventilation zonal model for particle distribution resultingfrom high momentum respiratory activities. Building and Environment, 90, 1–14. https://doi.org/10.1016/j.buil-denv.2015.03.007
Heiselberg, P., & Sandberg, M. (1990). Convection from a slender cylinder in a ventilated room [Paper presentation].In: Roomvent, Norway.
ISO. (2005). ISO-7730: Ergonomics of the Thermal Environment — Analytical Determination and Interpretation ofThermal Comfort Using Calculation of the PMV and PPD Indices and Local Thermal Comfort Criteria. Retrievedfrom: https://www.iso.org/standard/39155.html International Organization for Standardization.
ISO. (2017). ISO-12569: Thermal Performance of Buildings and Materials - Determination of Specific Airflow Rate inBuildings - Tracer Gas Silution Method Retrieved from: https://www.iso.org/standard/69817.html.
Karimipanah, T., & Awbi, H. B. (2002). Theoretical and experimental investigation of impinging jet ventilation andcomparison with wall displacement ventilation. Building and Environment, 37(12), 1329–1342. https://doi.org/10.1016/S0360-1323(01)00117-2
Karimipanah, T., Sandberg, M., & Awbi, H. B. (2000). A comparative study of different air distribution systems in aclassroom [Paper presentation]. In Roomvent, Reading, United Kingdom (pp. 1013–1018).
Kobayashi, T., Nishiumi, T., & Umemiya, N. (2019). Simplified prediction method of vertical temperature distribution forimpinging jet ventilation system [Paper presentation]. In: CLIMA 2019 Congress, Bucharest, Romania. https://doi.org/10.1051/e3sconf/201,911,101,097
Kobayashi, T., Sugita, K., Umemiya, N., Kishimoto, T., & Sandberg, M. (2017). Numerical investigation and accuracyverification of indoor environment for an impinging jet ventilated room using computational fluid dynamics.Building and Environment, 115, 251–268. https://doi.org/10.1016/j.buildenv.2017.01.022
Kosonen, R., Melikov, A., Mundt, E., Mustakallio, P., & Nielsen, P. V. (2002). Displacement Ventilation, RehvaGuidebook No. 23. Brussels: REHVA.
Li, Y., Sandberg, M., & Fuchs, L. (1992). Vertical temperature profiles in rooms ventilated by displacement: Full-scalemeasurement and nodal modelling. Indoor Air, 2(4), 225–243. https://doi.org/10.1111/j.1600-0668.1992.00005.x
Lin, Z., Chow, T. T., & Tsang, C. F. (2007). Effect of door opening on the performance of displacement ventilation ina typical office building. Building and Environment, 42(3), 1335–1347. https://doi.org/10.1016/j.buildenv.2005.11.005
Mathisen, H. M. (1989). Case studies of displacement ventilation in public halls. ASHRAE Transactions, 95,1018–1027.
Melikov, A. K., & Nielsen, J. B. (1989). Local thermal discomfort due to draft and vertical temperature difference inrooms with displacement ventilation. ASHRAE Transactions, 95, 1050–1057.
Mundt, E. (1995). Displacement ventilation systems - Convection flows and temperature gradients. Building andEnvironment, 30(1), 129–133. https://doi.org/10.1016/0360-1323(94)E0002-9
Mundt, E., Martin, H., Peter, M., Nielsen, V., & Moser, A. (2004). Ventilation Effectiveness, Rehva Guidebook No. 2.Brussels: REHVA The Society of Heating, Air-Conditioning and Sanitary Engineers of Japan..
Nielsen, P. V. (1993). Displacement Ventilation -Theory and Design. Aalborg University.Nielsen, P. V. (2001). The “family tree” of air distribution systems [Paper presentation]. In: Roomvent, Trondheim,
Norway, 2011.Park, H. J., & Holland, D. (2001). The effect of location of a convective heat source on displacement ventilation: CFD
study. Building and Environment, 36(7), 883–889. https://doi.org/10.1016/S0360-1323(01)00014-2Rajaratnam, N. (1976). Turbulent jet. Elsevier Science Ltd.Sandberg, M., & Blomqvist, C. (1989). Displacement ventilation systems in office rooms. ASHRAE Transactions, 95,
1041–1049.Seppanen, O. A., Fisk, W. J., Eto, J., & Grimsrud, D. T. (1989). Comparison of conventional mixing and displacement
air-conditioning and ventilating systems in U.S. commercial buildings. ASHRAE Transactions, 95, 1028–1040.SHASE. (2011). Ventilation Requirements for Acceptable Air Quality [In Japanese], Retrieved from: http://www.shasej.
org/tosho/shase-s.html.Skistad, H. (1994). Displacement Ventilation. Research Studies Press Ltd. International Organization for
Standardization.Sun, W., Cheong, K. W. D., & Melikov, A. K. (2012). Subjective study of thermal acceptability of novel enhanced dis-
placement ventilation system and implication of occupants’ personal control. Building and Environment, 57,49–57. https://doi.org/10.1016/j.buildenv.2012.04.004
INTERNATIONAL JOURNAL OF VENTILATION 17
Suzuki, T., Sagara, K., Yamanaka, T., Kotani, H., & Yamashita, T. (2007). Vertical profile of contaminant concentrationin sickroom with lying person ventilated by displacement. In: IAQVEC 2007 Proceedings, Sendai, Japan (pp.369–376).
Svensson, A. G. L. (1989). Nordic experience of displacement ventilation systems. ASHRAE Transactions, 95,1013–1017.
Wu, X., Olesen, B. W., Fang, L., & Zhao, J. (2013). A nodal model to predict vertical temperature distribution in aroom with floor heating and displacement ventilation. Building and Environment, 59, 626–634. https://doi.org/10.1016/j.buildenv.2012.10.002
Xing, H., Hatton, A., & Awbi, H. B. (2001). A study of the air quality in the breathing zone in a room with displace-ment ventilation. Building and Environment, 36(7), 809–820. https://doi.org/10.1016/S0360-1323(01)00006-3
Xu, M., Yamanaka, T., & Kotani, H. (2001). Vertical profiles of temperature and contaminant concentration in roomsventilated by displacement with heat loss through room envelopes. Indoor Air, 11(2), 111–119. https://doi.org/10.1034/j.1600-0668.2001.110205.x
Yamanaka, T., Kotani, H., & Xu, M. (2007). Zonal models to predict vertical contaminant distribution in room withdisplacement ventilation accounting for convection flows along walls [Paper presentation]. IAQVEC 2007Proceedings - 6th International Conference on Indoor Air Quality, Ventilation and Energy Conservation inBuildings: Sustainanle Built Environment, Sendai, Japan.
Ye, X., Kang, Y., Yan, Z., Chen, B., & Zhong, K. (2020). Optimization study of return vent height for an impinging jetventilation system with exhaust/return-split configuration by TOPSIS method. Building and Environment, 177,106858. https://doi.org/10.1016/j.buildenv.2020.106858
Ye, X., Kang, Y., Yang, F., & Zhong, K. (2019). Comparison study of contaminant distribution and indoor air qualityin large-height spaces between impinging jet and mixing ventilation systems in heating mode. Building andEnvironment, 160, 106159. https://doi.org/10.1016/j.buildenv.2019.106159
Ye, X., Kang, Y., Yang, X., & Zhong, K. (2018). Temperature distribution and energy consumption in impinging jetand mixing ventilation heating rooms with intermittent cold outside air invasion. Energy and Buildings, 158,1510–1522. https://doi.org/10.1016/j.enbuild.2017.11.038
Ye, X., Kang, Y., Zuo, B., & Zhong, K. (2017). Study of factors affecting warm air spreading distance in impinging jetventilation rooms using multiple regression analysis. Building and Environment, 120, 1–12. https://doi.org/10.1016/j.buildenv.2017.03.044
Ye, X., Zhu, H., Kang, Y., & Zhong, K. (2016). Heating energy consumption of impinging jet ventilation and mixingventilation in large-height spaces: A comparison study. Energy and Buildings, 130, 697–708. https://doi.org/10.1016/j.enbuild.2016.08.055
Yuan, X., Chen, Q., & Glicksman, L. R. (1998). A critical review of displacement ventilation. ASHRAE Transactions, 104(Part 1A), 78–90.
Yuan, X., Chen, Q., & Glicksman, L. R. (1999). Models for predictions of temperature difference and ventilation effect-iveness with displacement ventilation. ASHRAE Transactions, 105, 353–367.
Yuan, X., Chen, Q., Glicksman, L. R., Hu, Y., & Yang, X. (1999). Measurements and computations of room airflow withdisplacement ventilation. ASHRAE Transactions, 105, 340–352.
18 H. YAMASAWA ET AL.