Embed Size (px)
Citation preview
7/28/2013
1
INDOOR AIR
QUALITYCO2 SENSORS
& DEMAND CONTROLLED
VENTILATION
This material is based upon work supported by the National Science Foundation under Grant No. 1132585 and by the IEEE Control Systems Society (CSS). Any opinions, findings, and conclusions or recommendations expressed in this material are those of the author(s) and do not necessarily reflect the views of the National Science Foundation or IEEE CSS.
We also gratefully acknowledge RET (Research Experiences for Teachers), on Sensor Networks, Electrical Engineering Department, and Institute of Applied Sciences, UNT, Denton, Texas.
Project Goals
Build experimental IAQ CO2 monitoring system with “On Demand” ventilation capabilities
Compare performance of the prototype CO2 sensor with the professional grade GrayWolf IAQ measurement system
Test IAQ CO2 sensor in simulated classroom environment to collect building material effects on CO2 levels
Analyze IAQ data Develop a lesson plan and prepare hardware and
software for inclusion in a high school classroom

7/28/2013
2
Government and PolicyASHRAE- American Society of Heating, Refrigerating and
Air-Conditioning Engineers A building technology society with more than 50,000
members worldwide. The Society and its members focus on building systems, energy efficiency, indoor air quality and sustainability within the industry.
EPA- United States Environmental Protection Agency The Indoor Environments Division has created partnerships
with public and private sector entities to help encourage the public to take action to minimize their risk and mitigate indoor air quality problems.
Government and Policy
OSHA- Occupational Health and Safety Administration
A part of the United States Department of Labor.
Created by Congress with the Occupational Safety and Health Act of 1970
Purpose is to assure safe and healthful working conditions for working men and women by setting and enforcing standards and by providing training, outreach, education, and assistance.

7/28/2013
3
Current CO2 Standards
ASHRAE (American Society of Heating, Refrigerating, & Air-Conditioning Engineers)
Standard 62.1-2010 Allowable CO2 levels for occupied spaces
CO2 not to exceed 1,000 ppm, but levels less than 800 ppm indicates that sufficient ventilation is being applied to the building
CO2 levels > 5000ppm can cause health risks
Professional Grade Monitoring Systems
PPM Technology Wireless IAQ Profile Monitor
GrayWolf Direct Sense IAQ monitor
Not adaptable to “On Demand” ventilation needs

7/28/2013
4
Professional Grade Monitoring Systems
GrayWolf Direct Sense IAQ monitor with IQ610 probeWPIAQ-PLUS WolfPack IAQ Plus Survey & Monitoring Kit $7449IQ-610 Probe measures ppb VOCs, CO2, CO, %RH and temperature Multi-function
Simultaneous measurement of up to six (6) key IAQ indicators with one probe; VOCs, CO2 (dilution ventilation), CO, %RH, °C/°F plus an additional toxic gas sensor (from a broad choice of specific gases)
Optional particle concentration or particle count module Up to 4 GrayWolf probes (20+ sensors), plus a particulate sensor may be connected
simultaneously to any platform Data Logging
Manual "snapshot" or automatic "trend" data logging Store enhanced survey information on-site; data plus text, audio notes, photos, videos, drawings
and more... Back-lit color display
Clearly displays numerous readings simultaneously; auto-scrolls for >8 parameters Automatically updates as probes are plugged in View data in tabular or graphic formats
Reporting Download logged data and notes to WolfSense® PC software (included) for analysis and efficient,
detailed reporting Optional "Advanced Report Generator: IAQ Edition" software automates comprehensive IAQ
report generation Optional GrayWolfLive™ allows remote access to data and notes via WiFi
Not adaptable to “On Demand” ventilation needshttp://www.wolfsense.com/pdf/GrayWolf-Indoor-Air-Quality-IAQ-Meter-Brochure-lo.pdf
Professional Grade Monitoring Systems
PPM Technologies Wireless IAQ Profile MonitorEach unit can monitor 3-7 parameters
ParametersFormaldehyde, Glutaraldehyde, Temperature, Humidity, Nitrogen Dioxide (NO2), Carbon Monoxide (CO), Carbon Dioxide (CO2), Sulphur Dioxide (SO2), Total Volatile Organic Compounds (TVOC's), Methane (CH4), Ammonia (NH3), Ozone (O3), Water (H20) single zone sensing cable, Smoke Sensor
The Manager PC connects to the mesh network via a special node which is capable of receiving and transmitting information to the IAQ Profile Monitor. The Manager PC can view, run and control the real time monitoring and data logging of air quality in a building at the click of a button.
The PPMonitor software enables the data to be viewed graphically, produce reports and statistical data, run schedules as well as alarm functions and notifications for more effective and economical building management.
Not adaptable to “On Demand” ventilation needs
http://www.ppm-technology.com/IAQ%20Profile%20Monitor.htm

7/28/2013
5
Professional Grade Monitoring SystemsVAISALA
GMD/W20 Carbon Dioxide Transmitters
Developed Specifically for
Demand Controlled Ventilation
Applications
Professional Grade Monitoring Systems
Designed for use in ventilation-related applications
Transmitters can be used independently, or incorporated into building energy management systems
Duct or Wall mount
1 transmitter per HVAC Zone
Measurement Capabilities 0-20,000 ppm
Accuracy +/- 2%
Response Time 1 minute
Power Consumption < 2.5 W
Several configuration options available (ie: Display types and output options)
Data logging options available
Cost: Approximately $410 per room/HVAC Zone
VAISALAGMD/W20
Carbon Dioxide Transmitters
http://www.vaisala.com/en/products/carbondioxide/Pages/GM20.aspx
7/28/2013
6
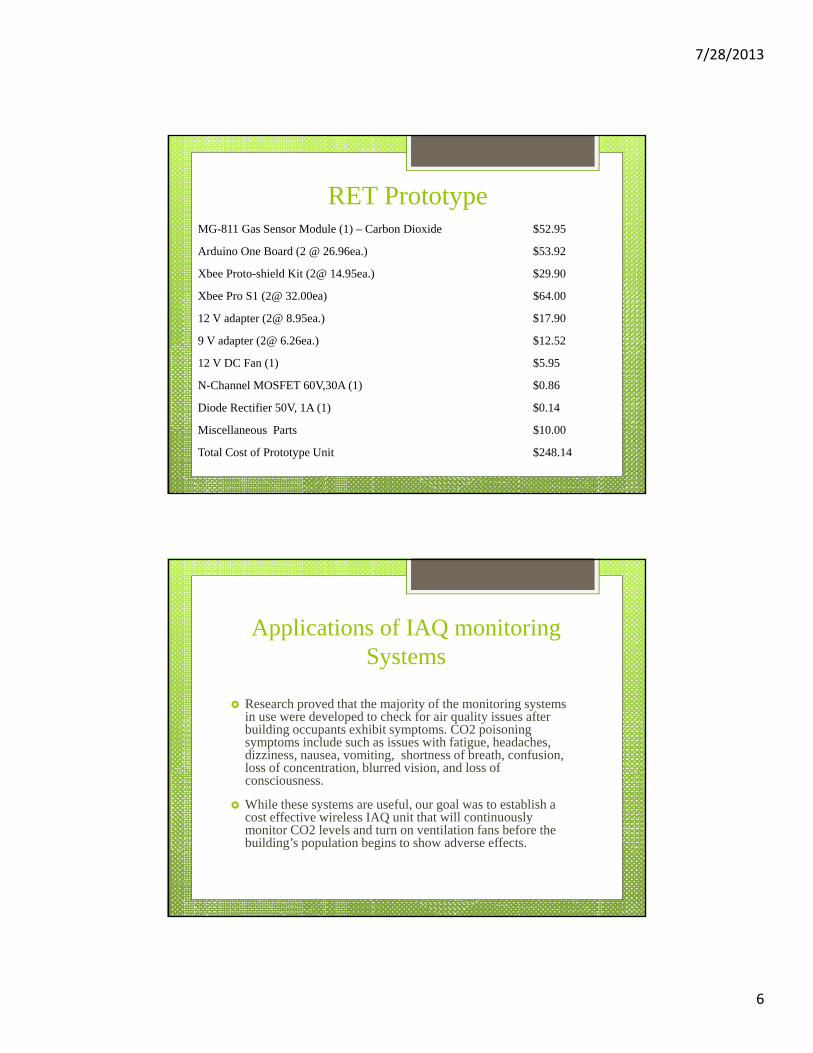
RET PrototypeMG-811 Gas Sensor Module (1) – Carbon Dioxide $52.95
Arduino One Board (2 @ 26.96ea.) $53.92
Xbee Proto-shield Kit (2@ 14.95ea.) $29.90
Xbee Pro S1 (2@ 32.00ea) $64.00
12 V adapter (2@ 8.95ea.) $17.90
9 V adapter (2@ 6.26ea.) $12.52
12 V DC Fan (1) $5.95
N-Channel MOSFET 60V,30A (1) $0.86
Diode Rectifier 50V, 1A (1) $0.14
Miscellaneous Parts $10.00
Total Cost of Prototype Unit $248.14
Applications of IAQ monitoring Systems
Research proved that the majority of the monitoring systems in use were developed to check for air quality issues after building occupants exhibit symptoms. CO2 poisoning symptoms include such as issues with fatigue, headaches, dizziness, nausea, vomiting, shortness of breath, confusion, loss of concentration, blurred vision, and loss of consciousness.
While these systems are useful, our goal was to establish a cost effective wireless IAQ unit that will continuously monitor CO2 levels and turn on ventilation fans before the building’s population begins to show adverse effects.

7/28/2013
7
SourcesASHRAE Position Document on Indoor Air Quality Discusses the relationship between energy efficient buildings while still
maintaining proper IAQ Investigates sick building syndrome, which is the collection of several
symptoms related to poor IAQ, including nausea, fatigue, itchy eyes and skin, headaches, and upper respiratory symptoms
Gives guidelines for acceptable IAQ, including CO2 levels ASHRAE Standard 62: Optimizing Energy Use and Ventilation
National Institute of Standards and Technology- Emmerich, Persily State-of-the-Art Review of CO2 Demand Controlled Ventilation (DCV) Oxygen depletion cited as cause of poor IAQ Emission rate of occupant generated CO2 is relevant to IAQ DCV Sensors located close to doors/windows give inaccurate CO2 readings Building features influence CO2 DCV effectiveness
Existence of unpredictable occupant variations Building/climate requiring year round heating/air conditioning Low pollutant emissions from non-occupant sources
SourcesEPA Has established the
“IAQ tools for schools program” which provides products and materials to schools to help them implement an IAQ management program http://www.epa.gov/iaq/schools/actionkit.html
Posted several sources linking poor IAQ to poor student performance, mainly due to absences related to asthma
7/28/2013
8
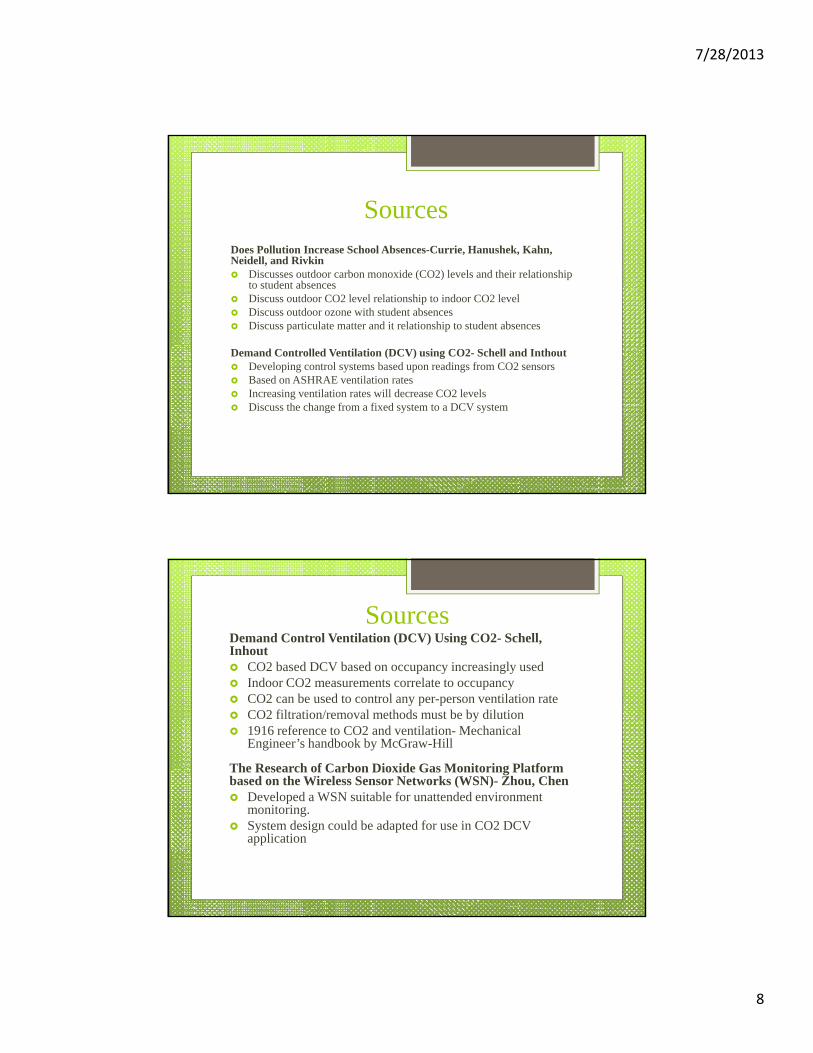
SourcesDoes Pollution Increase School Absences-Currie, Hanushek, Kahn, Neidell, and Rivkin Discusses outdoor carbon monoxide (CO2) levels and their relationship
to student absences Discuss outdoor CO2 level relationship to indoor CO2 level Discuss outdoor ozone with student absences Discuss particulate matter and it relationship to student absences
Demand Controlled Ventilation (DCV) using CO2- Schell and Inthout Developing control systems based upon readings from CO2 sensors Based on ASHRAE ventilation rates Increasing ventilation rates will decrease CO2 levels Discuss the change from a fixed system to a DCV system
SourcesDemand Control Ventilation (DCV) Using CO2- Schell, Inhout CO2 based DCV based on occupancy increasingly used Indoor CO2 measurements correlate to occupancy CO2 can be used to control any per-person ventilation rate CO2 filtration/removal methods must be by dilution 1916 reference to CO2 and ventilation- Mechanical
Engineer’s handbook by McGraw-Hill
The Research of Carbon Dioxide Gas Monitoring Platform based on the Wireless Sensor Networks (WSN)- Zhou, Chen Developed a WSN suitable for unattended environment
monitoring. System design could be adapted for use in CO2 DCV
application
7/28/2013
9
WSN Benefits Wireless sensor network technology promises a wide
range of applications such as monitoring moisture levels in soil to applying Demand Controlled Ventilation (DCV) technology to alleviate CO2 levels in a structure. The benefits include reduced installation & system costs, increased flexibility, and simplification of deployment.
With the addition of an Ethernet Access Point a wireless network can then be accessed from any location in the world via the internet.
Open source programming (such as used with Arduino) reduces costs incurred by proprietary software.
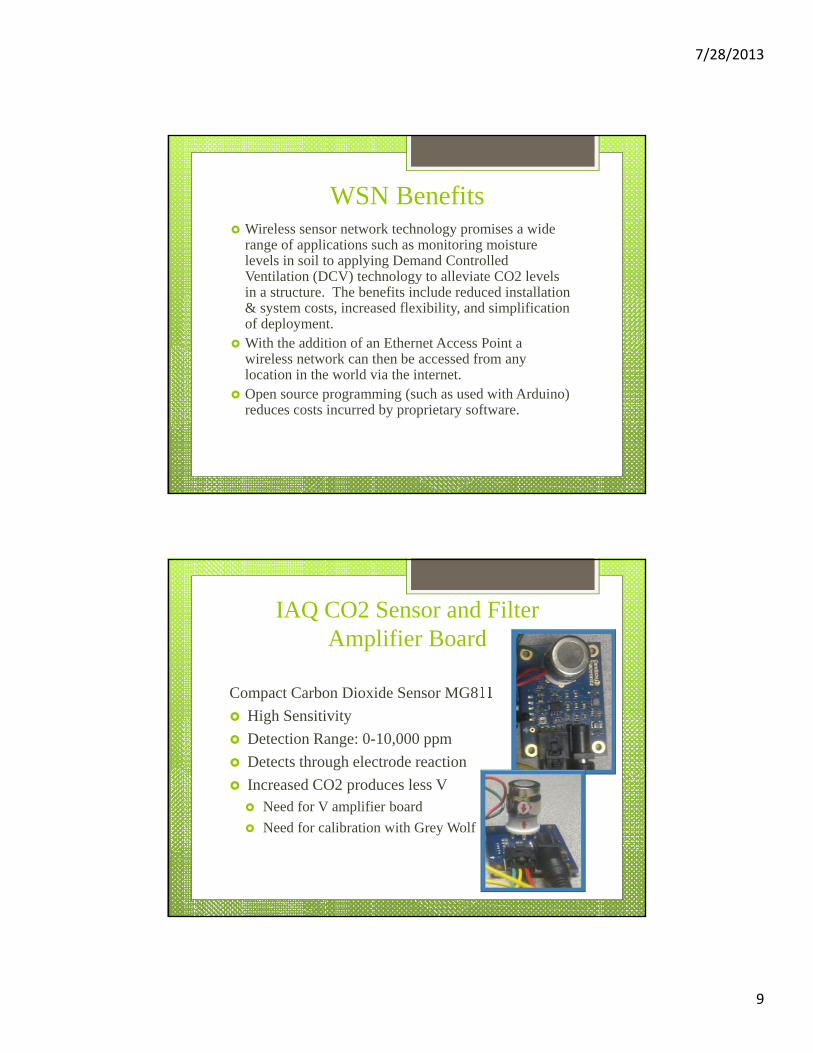
IAQ CO2 Sensor and Filter Amplifier Board
Compact Carbon Dioxide Sensor MG811
High Sensitivity
Detection Range: 0-10,000 ppm
Detects through electrode reaction
Increased CO2 produces less V Need for V amplifier board
Need for calibration with Grey Wolf
7/28/2013
10
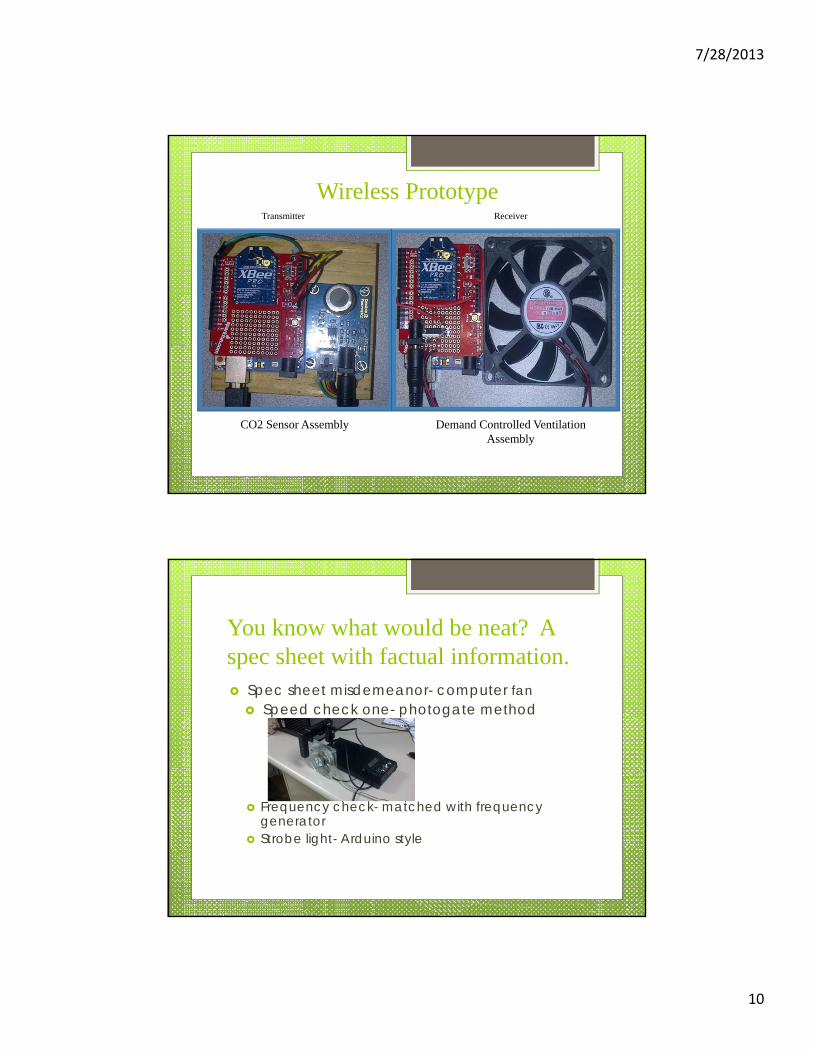
Wireless Prototype
CO2 Sensor Assembly Demand Controlled Ventilation Assembly
Transmitter Receiver
You know what would be neat? A spec sheet with factual information. Spec sheet misdemeanor- computer fan
Speed check one- photogate method
Frequency check- matched with frequency generator
Strobe light- Arduino style
7/28/2013
11
Air flow measurements
Fancy way- Bernoulli’s Principle
http://hyperphysics.phy-astr.gsu.edu/hbase/pber.html
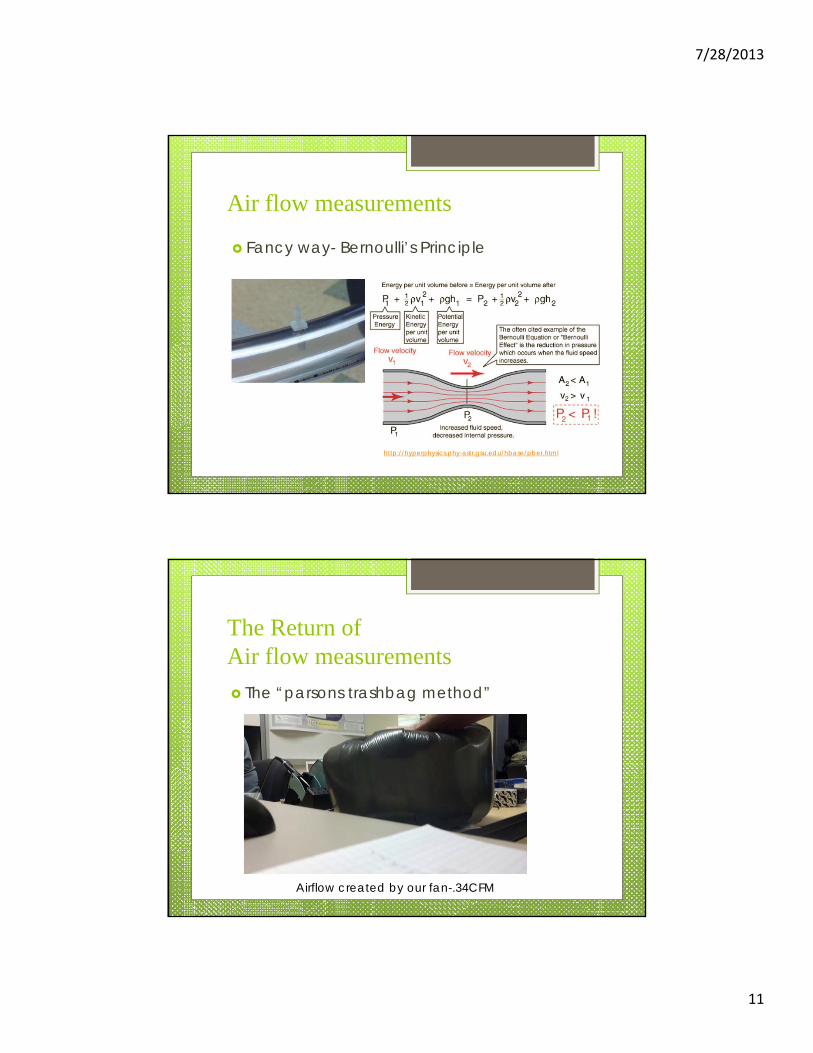
The Return of Air flow measurements
The “parsons trashbag method”
Airflow created by our fan-.34CFM
7/28/2013
12
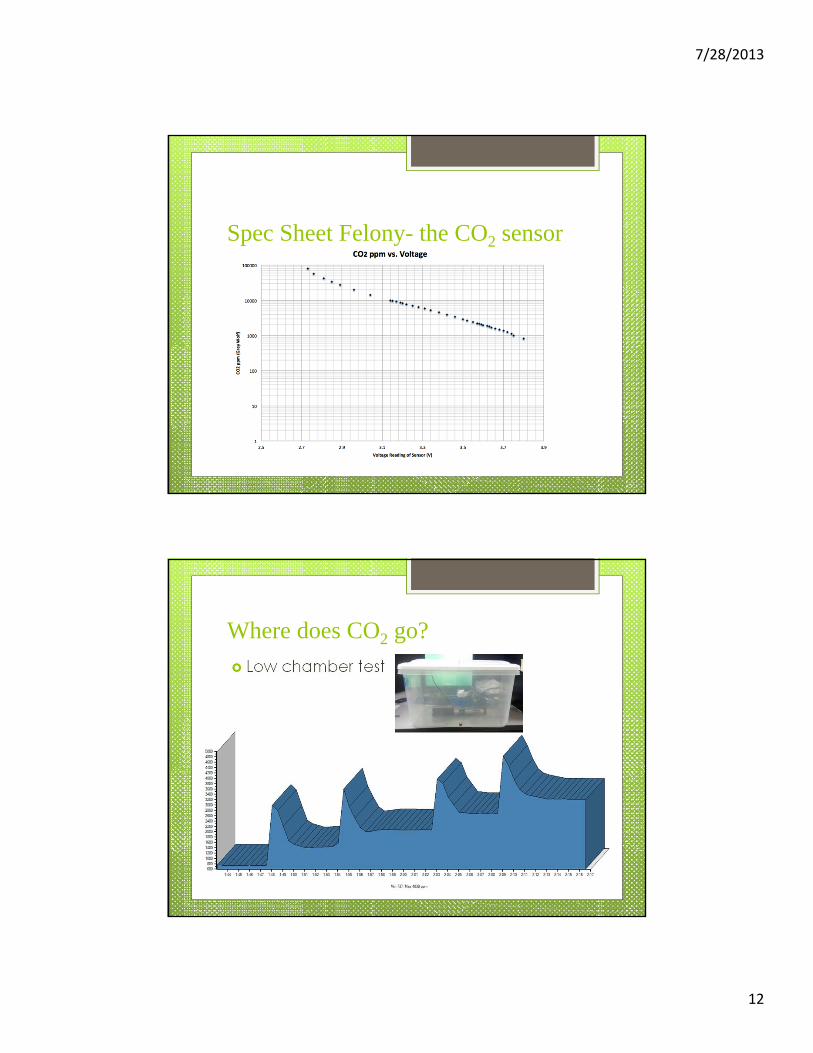
Spec Sheet Felony- the CO2 sensor
Where does CO2 go?
Low chamber test
7/28/2013
13
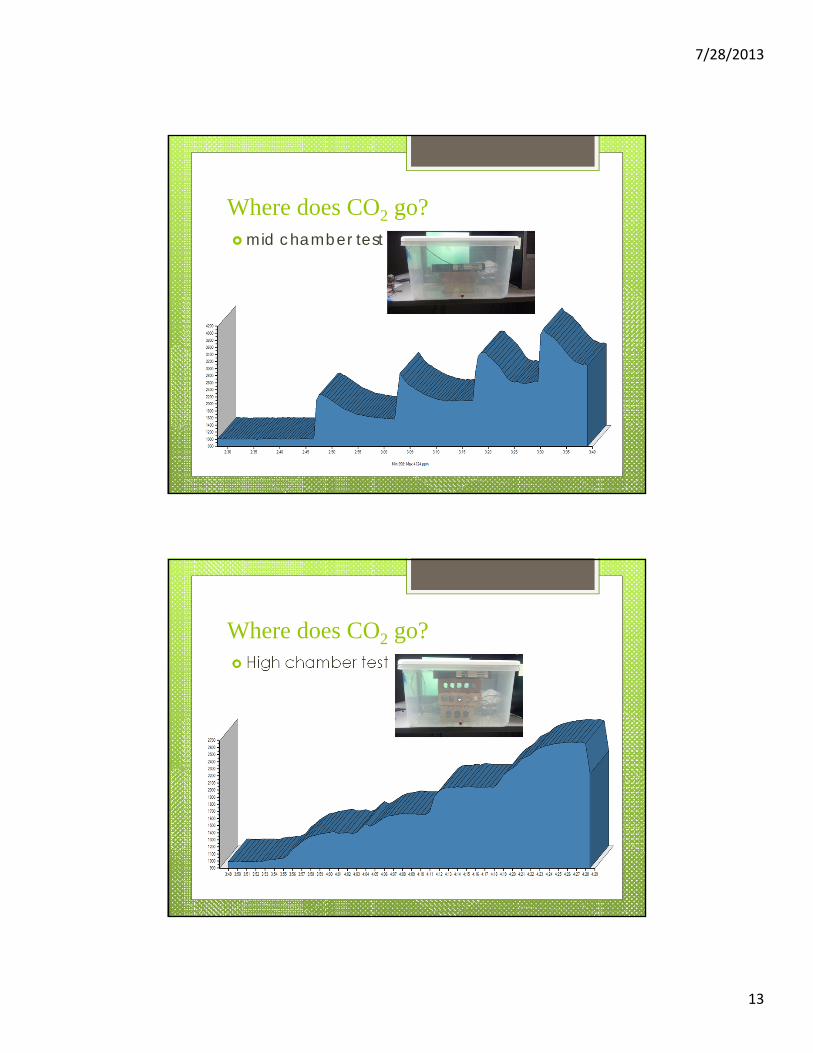
Where does CO2 go? mid chamber test
High chamber test
Where does CO2 go?
7/28/2013
14
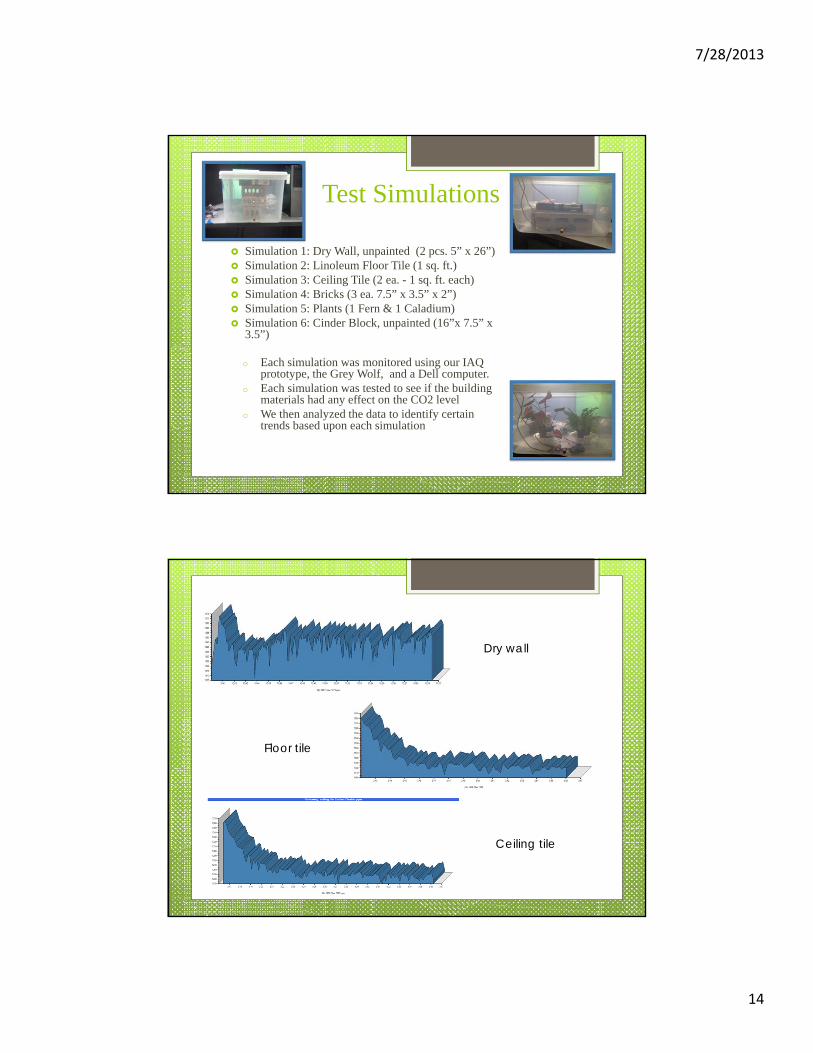
Test Simulations
Simulation 1: Dry Wall, unpainted (2 pcs. 5” x 26”) Simulation 2: Linoleum Floor Tile (1 sq. ft.) Simulation 3: Ceiling Tile (2 ea. - 1 sq. ft. each) Simulation 4: Bricks (3 ea. 7.5” x 3.5” x 2”) Simulation 5: Plants (1 Fern & 1 Caladium) Simulation 6: Cinder Block, unpainted (16”x 7.5” x
3.5”)
o Each simulation was monitored using our IAQ prototype, the Grey Wolf, and a Dell computer.
o Each simulation was tested to see if the building materials had any effect on the CO2 level
o We then analyzed the data to identify certain trends based upon each simulation
Dry wall
Floor tile
Ceiling tile
7/28/2013
15
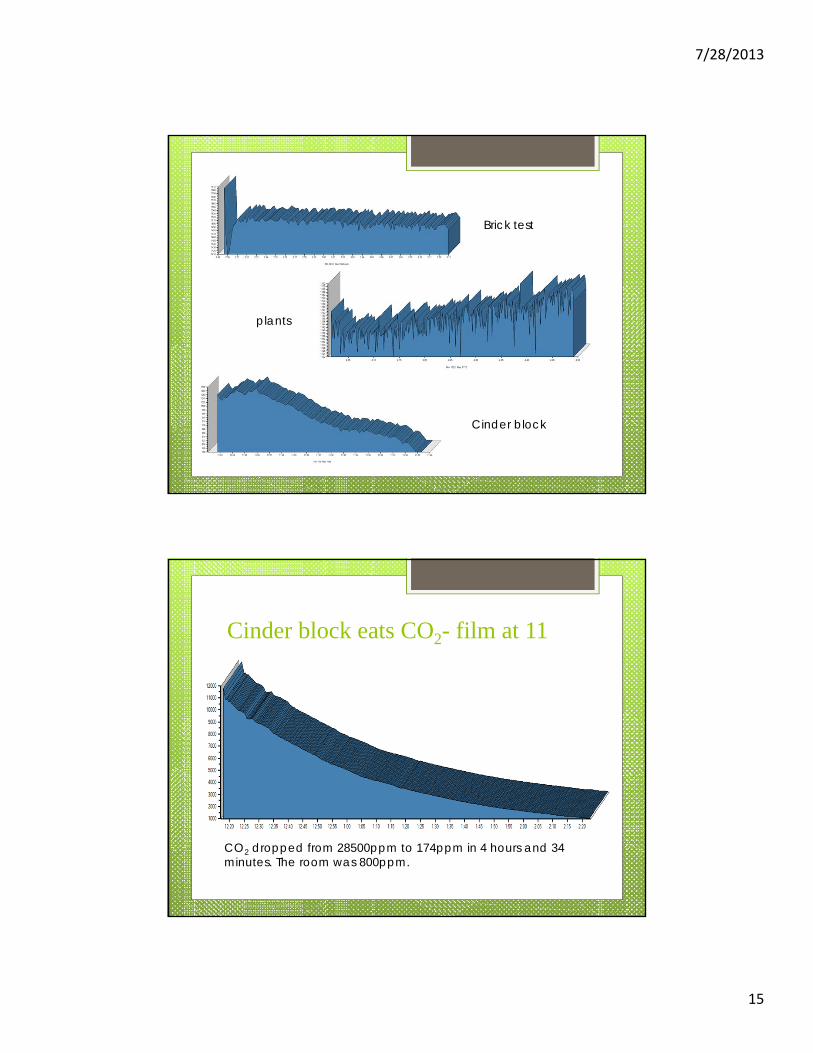
Brick test
plants
Cinder block
Cinder block eats CO2- film at 11
CO2 dropped from 28500ppm to 174ppm in 4 hours and 34 minutes. The room was 800ppm.
7/28/2013
16
Possible Mechanism Cinder block is largely composed of di-
and tri- calcium silicate, or2CaOSiO2 and 3CaOSiO2
CaCO3 (s) → CaO(s) + CO2 (g) Typically accomplished between 500 and
600 Celcius. The reaction is reversible
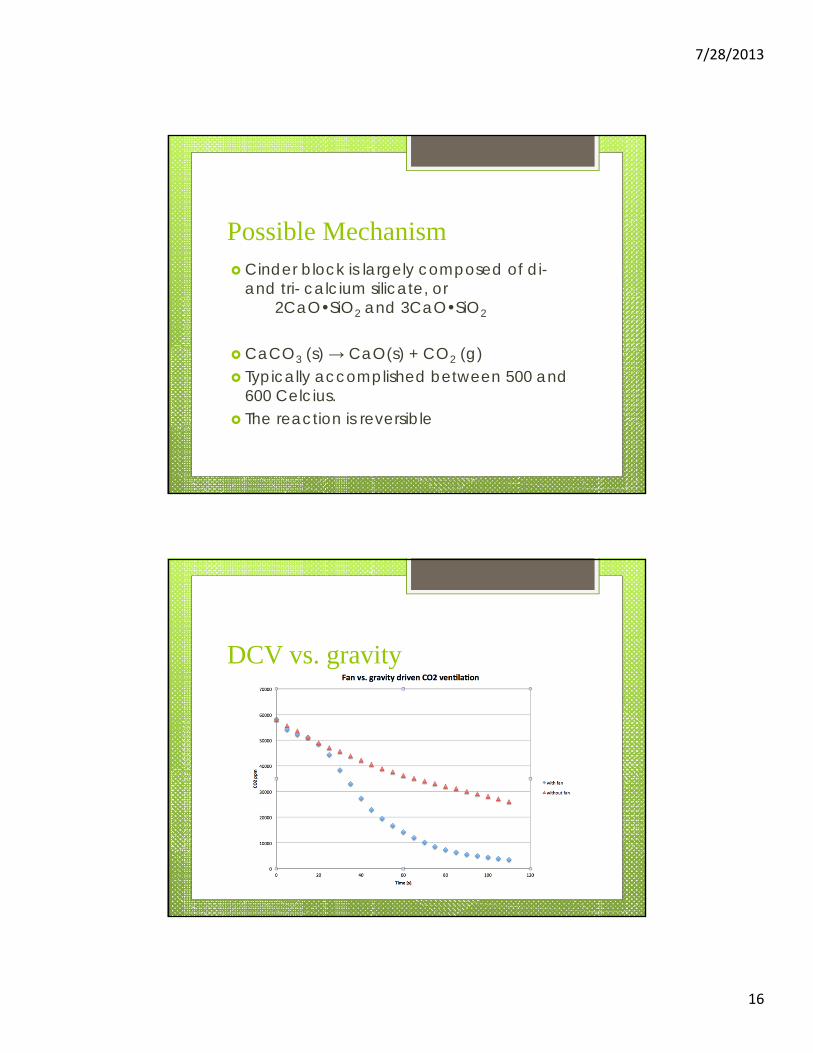
DCV vs. gravity
7/28/2013
17
Further Work
Larger scale tests with a room and a fan that will vent to the outside.
Chemical tests to definitively determine the mechanism for CO2 absorption.
A more controllable environment (humidity, temperature) because the CO2 sensor is sensitive to both.
Conclusion Potential hazardous gases in the work place are a critical issue. Too often,
these gases are undetected until the employee becomes ill or a foul odor is reported by building occupants. By the time this occurs, occupants will have suffered exposure to poor air quality. The next step is to test the building with an expensive sensor unit to determine the source of the problem. With an on-demand venting system in place, IAQ issues could be dealt with immediately.
While running the Grey Wolf and the prototype board, there seemed to be a lag in the data acquisition for the prototype. As far as room ventilation is concerned, a few seconds shouldn’t matter at all, so this doesn’t seem to be a concern. The prototype reading seemed more stable while the Grey Wolf readings were “noisier.” This could be due to the fact that the prototype simply doesn’t have the resolution capability of the Grey Wolf. This is potentially a benefit, as a noisy signal near the fan activation criterion could cause the fan to stop and start at small intervals. This could be mitigated with proper coding.
7/28/2013
18
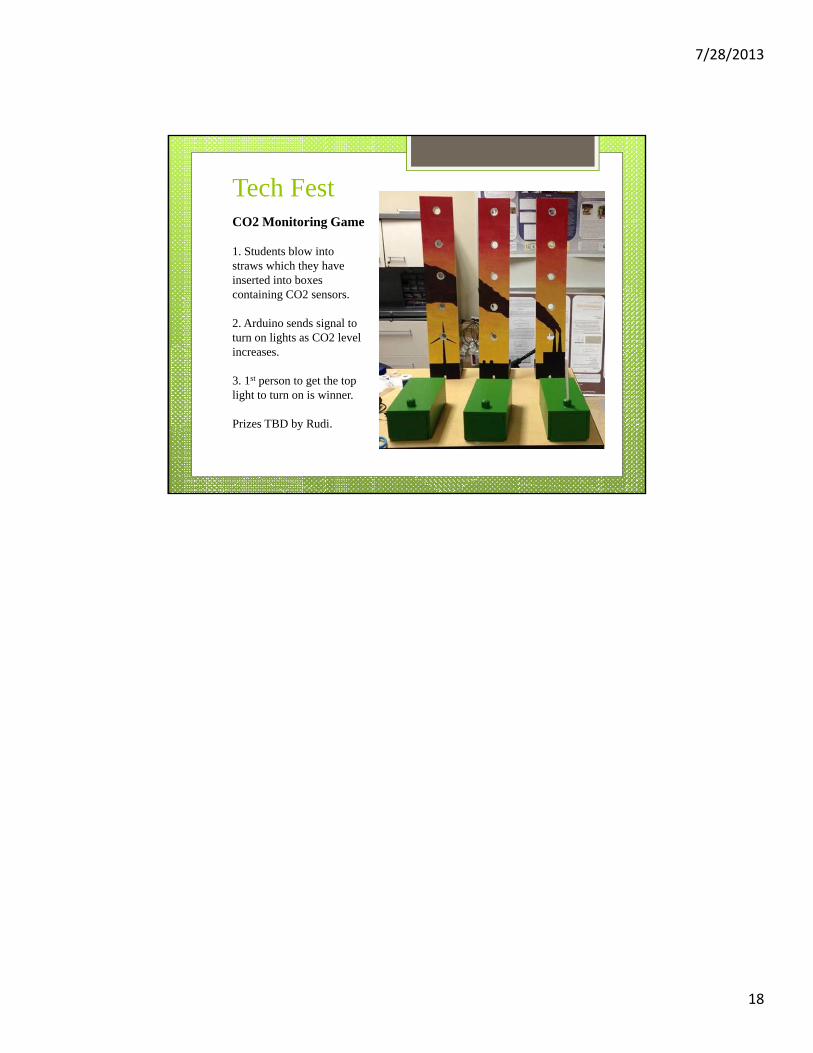
Tech FestCO2 Monitoring Game
1. Students blow into straws which they have inserted into boxes containing CO2 sensors.
2. Arduino sends signal to turn on lights as CO2 level increases.
3. 1st person to get the top light to turn on is winner.
Prizes TBD by Rudi.


![Indoor Air Pollution - WordPress.com · Chapter 1 Indoor Air Pollution “Indoor air pollutant levels are 25-62% greater [in our homes] ... poor indoor air quality is to install a](https://img.pdfslide.us/doc/110x75/5b511fb87f8b9a7b648b9e83/indoor-air-pollution-chapter-1-indoor-air-pollution-indoor-air-pollutant.jpg)