Embed Size (px)
Citation preview
1
Experimental investigation of brickwork behaviour under shear, compression
and flexure
J.Wanga, A.Heath
a, P.Walker
a
aBRE Centre for Innovative Construction Materials, Department of Architecture and
Civil Engineering, University of Bath, Bath, UK.
Abstract
This paper presents the basic material performance data for an engineering blue brick and a hydraulic
premixed mortar which can be used to validate numerical models. The shear behaviour of brickwork
mortar joints under normal compression was studied and the influence of specimen moisture content
at the time of testing on strength was investigated. Tests were performed on brickwork walls to study
the shear failure under flexure and different shear loading configurations. A linear relationship
between the shear strength and applied normal stress has been established, with different parameters
defined for the mortar and the brick/mortar interface. The experimental results are compared to
Eurocode 6 predictions and theoretical calculations. It is concluded that Eurocode 6 is conservative
for this masonry type.
Key Words
Brick masonry
Material testing
Shear strength
Compressive strength
Flexural strength
2
1. Introduction
Masonry’s strength, durability and resilience to water and fire have contributed to its widespread and
continued use throughout history. The relative ease of construction was particularly important before
the development of a highly mechanised construction industry. Today historic masonry structures
continue to play an important role in transportation infrastructure; it is estimated that there are over
40,000 masonry arch bridges still in service in UK [1]. The primary function of structural masonry is
to carry the compressive loads, although it is also capable of resisting lateral forces derived from wind,
earthquake or other applied loading. Masonry can resist relatively high compressive stresses, but it
has lower shear and flexural capacity, both of which are a function of applied normal stress. In recent
decades, some historic masonry transportation infrastructure, including masonry arch bridges, have
exhibited shear failure [2].
The results presented in this paper are from an on-going study to investigate the spandrel wall failure
in masonry arch bridges. The present work focuses on the contact behaviour between brick and mortar
units under compression, flexure and shear, and the deformations associated with this loading in
compression and shear. The mechanical properties of the brick and mortar materials are presented.
Triplet shear test were performed to access the behaviour of brick/mortar interface, the cohesion and
internal friction angle are then derived from the Mohr-Coulomb criterion. Small masonry walls were
constructed and tested under compressive load until failure to determine their stiffness and strength.
Two unreinforced masonry walls with dimensions of 665 mm × 740 mm × 102 mm were prepared
and tested for shear failure in different loading conditions. Flexural strength tests were performed on
masonry walls with planes of failure parallel and perpendicular to the bed joints.
Although some previous research work has been completed investigating the shear wall failure [3]
and [4], there is a general scarcity of high quality published data on the mechanical properties of
bricks, mortar and masonry under simple loading states that can be used to validate numerical
modelling work. Because of the nature of masonry, deformations are often localised to mortar joints,
particularly when high strength engineering bricks are used with weak lime mortars. The
measurement methodologies in standard tests can ignore this and measure deformations across a
number of mortar joints. In order to validate numerical models, simple tests are required as many real
structures contain a combination of loading conditions which complicates validation. The presented
data can be used for future numerical studies of traditional masonry structures such as masonry arch
bridges and retaining walls.
2. Material testing
The materials used in this study were solid (unperforated) Staffordshire Engineering blue bricks and
premixed hydraulic lime mortar. Preliminary laboratory tests were performed on these materials to
determine their mechanical properties. These were selected as they are representative of the products
3
used in some masonry arch bridges with a very high strength brick and a weak lime mortar. The fired
clay bricks were of standard size (215 mm × 102 mm × 65 mm) supplied by Ibtock Brick Ltd. The
following material properties were tested in the lab: compressive and flexural strength, modulus of
elasticity, thermal expansion and water absorption.
2.1 Brick properties
Three brick specimens were tested for both vertical and horizontal direction according to the BS EN
771-1[5] until crushing. The average normalized compressive strength was 145.0 N/mm2. Four
engineering bricks were fully immersed in water to determine 24hrs water absorption according to BS
EN 772-11[6]; the average value of 1.5% was obtained. Four brick specimens were also used for the
determination of thermal expansion. A temperature range from 20 ℃ to 100 ℃ was used and a
mechanical strain gauge was used to measure the change in length. The whole test consisted of three
cycles until stable results were obtained, each time three readings were taken for each specimen. An
average value of 8.22 × 10⁻⁶
/℃ was found for the thermal expansion coefficient of the bricks, and this
is a little higher compared with the value reported by Ross [7], where the thermal expansion
coefficient of 90% tested bricks ranged between 5 × 10⁻⁶
and 7 × 10⁻⁶
/℃.
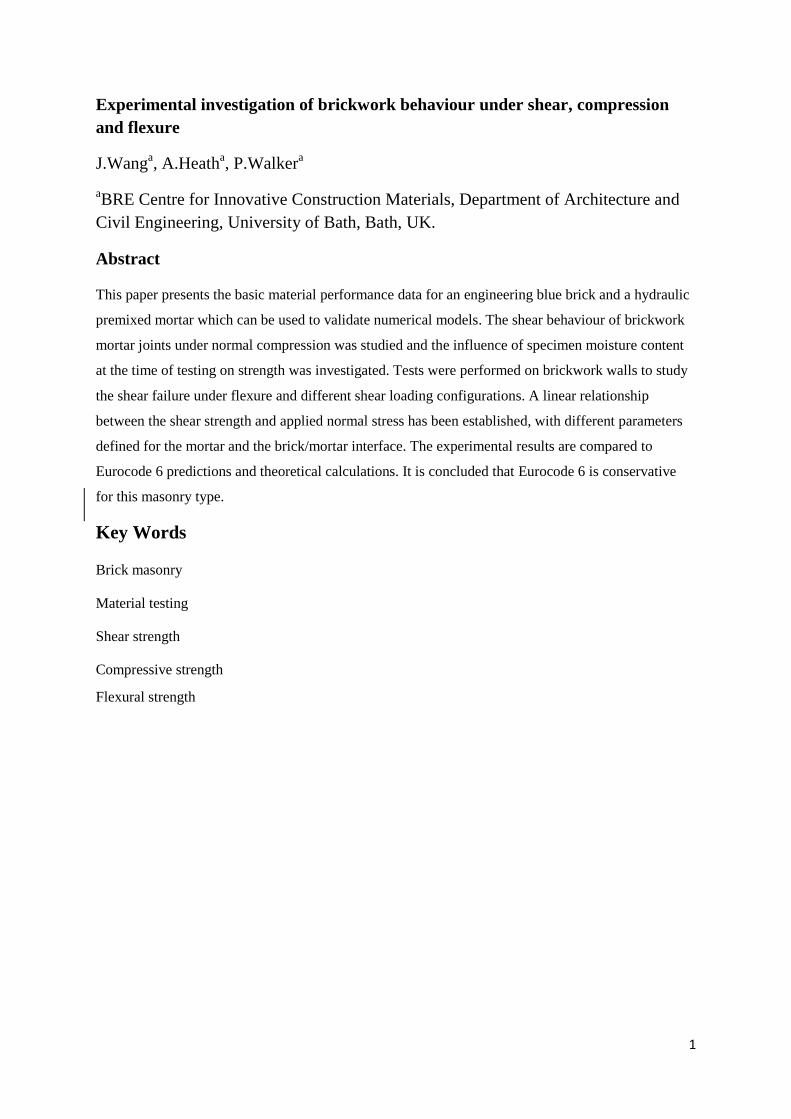
Four specimens were tested under uniaxial compression load to investigate the elastic properties of
the brick. Linearly Variable Differential Transducers (LVDTs) were attached onto the face of units to
measure the longitudinal displacement (Fig. 1). Load was applied using a 100 kN compressive
machine in three load cycles for two of the specimens with a 0.1 kN/s loading rate, while the other
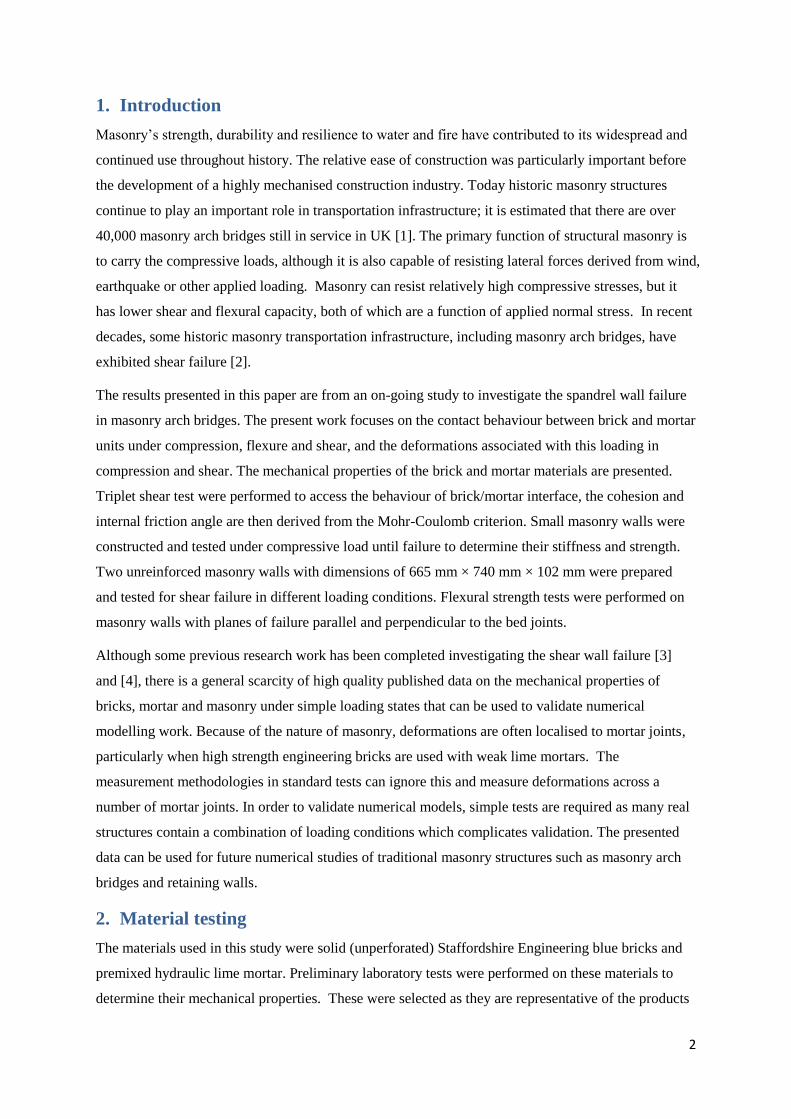
two specimens experienced only one load cycle. Test results (Fig. 2) indicated a linear relationship
between the stress and strain in the range of stresses tested up to 15 N/mm2, an average Young’s
modulus of 2.5×10⁴ N/mm
2 was calculated from the tests.
Figure 1 Experimental set up showing brick strain measurement
4
Figure 2 Stress strain relationship of brick unit
The flexural resistance ability of the brick unit was studied by three point bending test with a span of
175 mm. Ten specimens were prepared and tested and the flexural strengths ranged from 4.5 to 9.5
N/mm2, with an average value of 7.2 N/mm
2.
2.2 Mortar tests
The mortar used in the study is premixed hydraulic lime mortar which supplied by Lime Technology
Ltd. Advantages of this mortar are its consistent quality, and its long working life. A water/mortar
ratio of 0.19 was maintained throughout during the production of the specimens, and it gave a flow
value between 170 and 180 mm, the standard value for a mortar of this density, when measured in
accordance with BS EN 1015-3 [8]. After 28 days storage in the laboratory conditions (20 ℃, 65%
relative humidity), the specimens were tested for compressive and flexural strength, modulus of
elasticity and also subjected to triaxial tests. The influence of moisture content on the strength of
mortar at time of testing was also studied using 91 days old mortar specimens; 91 day strength has
become the widely accepted ‘28 day’ equivalent used widely for Portland cement materials.
Three prisms measuring 40 mm × 40 mm × 160 mm were cast in steel moulds for the compressive
and flexural strength test in accordance with BS EN 1015-11 [9]. They were tested after 28 days
storage under 20 ℃ and 65 % relative humidity. The loading rates for compression and flexural were
0.5 mm/min and 0.2 mm/min respectively. Average compressive and flexural strengths were 0.74
N/mm2 and 0.44 N/mm
2 respectively. Two prisms (135 mm × 75mm × 75mm) were made for testing
of elastic properties, the same set up for the bricks were applied to the mortar. The test was carried out
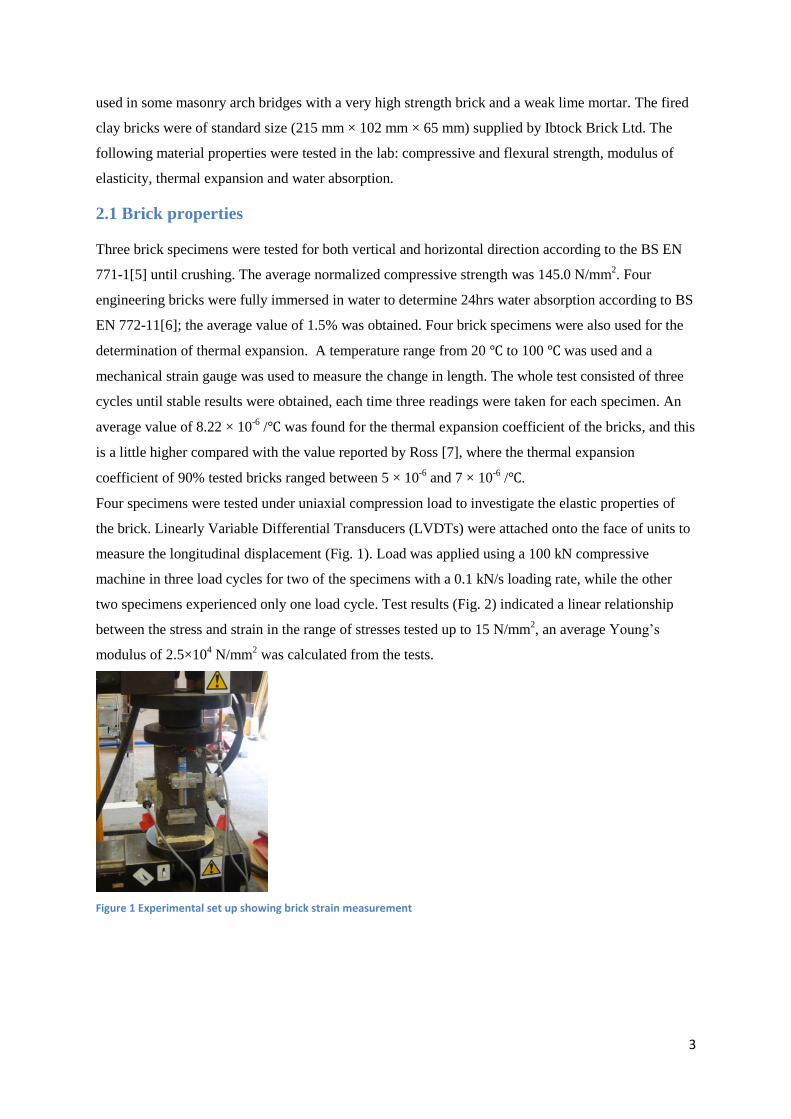
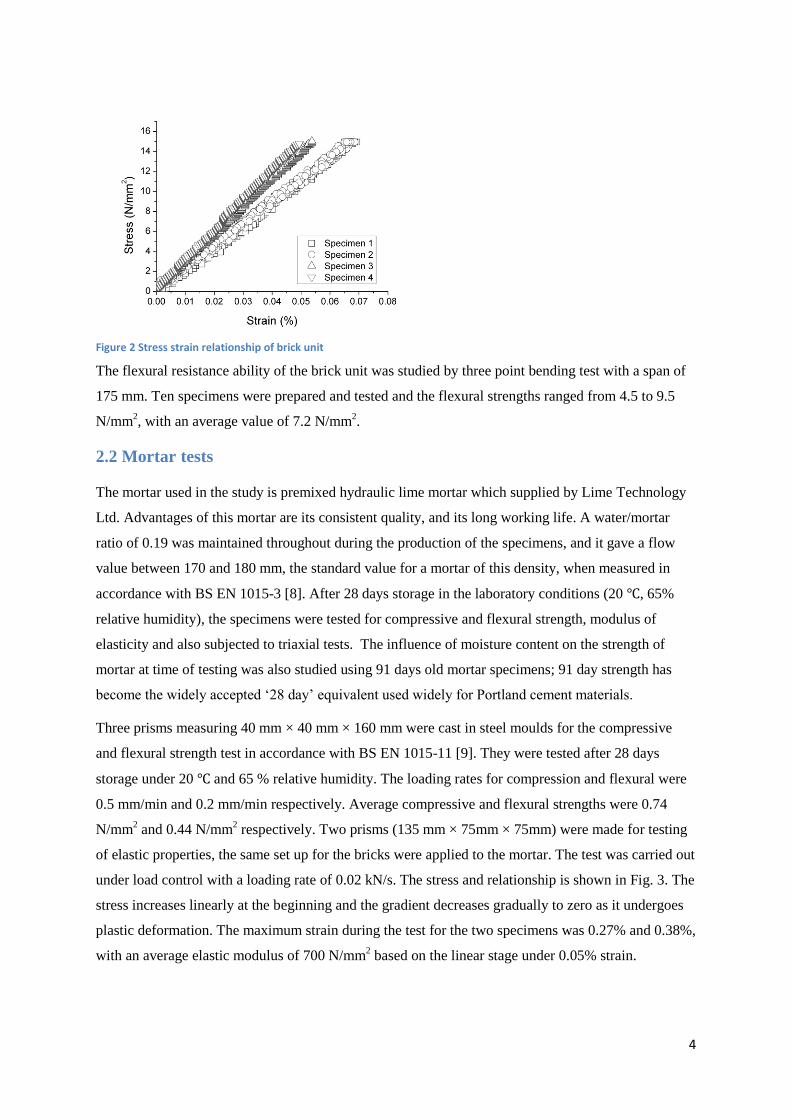
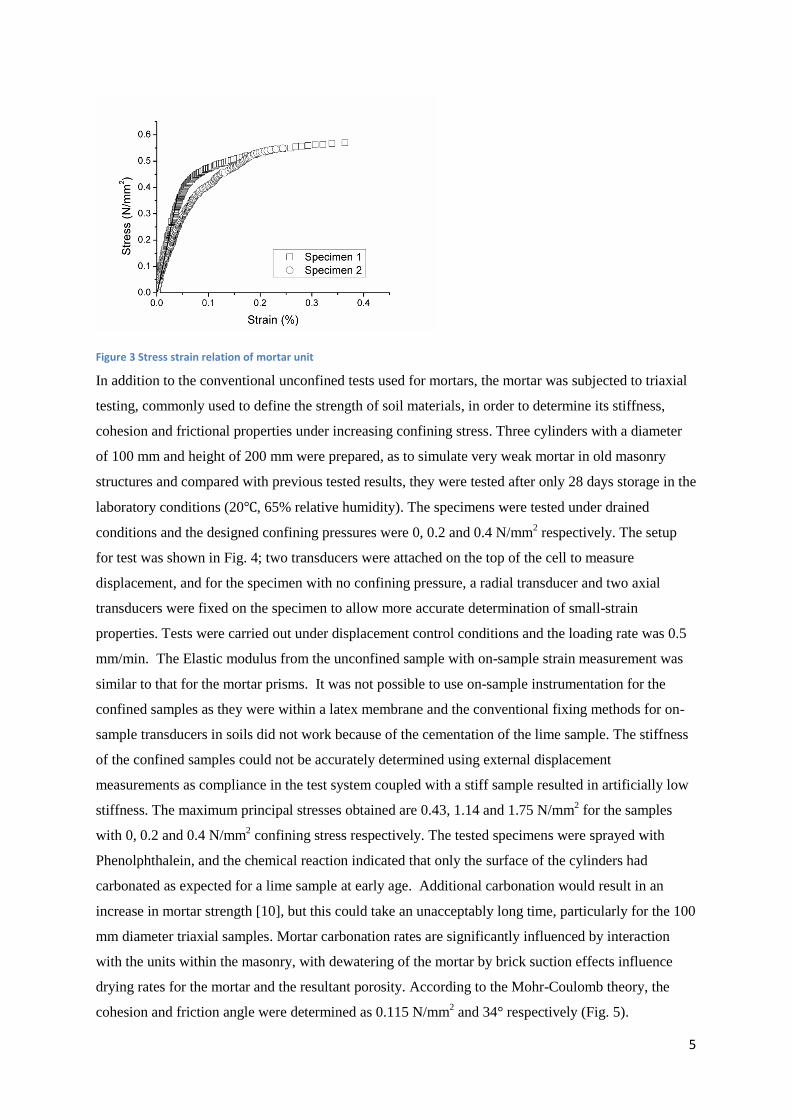
under load control with a loading rate of 0.02 kN/s. The stress and relationship is shown in Fig. 3. The
stress increases linearly at the beginning and the gradient decreases gradually to zero as it undergoes
plastic deformation. The maximum strain during the test for the two specimens was 0.27% and 0.38%,
with an average elastic modulus of 700 N/mm2 based on the linear stage under 0.05% strain.
5
Figure 3 Stress strain relation of mortar unit
In addition to the conventional unconfined tests used for mortars, the mortar was subjected to triaxial
testing, commonly used to define the strength of soil materials, in order to determine its stiffness,
cohesion and frictional properties under increasing confining stress. Three cylinders with a diameter
of 100 mm and height of 200 mm were prepared, as to simulate very weak mortar in old masonry
structures and compared with previous tested results, they were tested after only 28 days storage in the
laboratory conditions (20℃, 65% relative humidity). The specimens were tested under drained
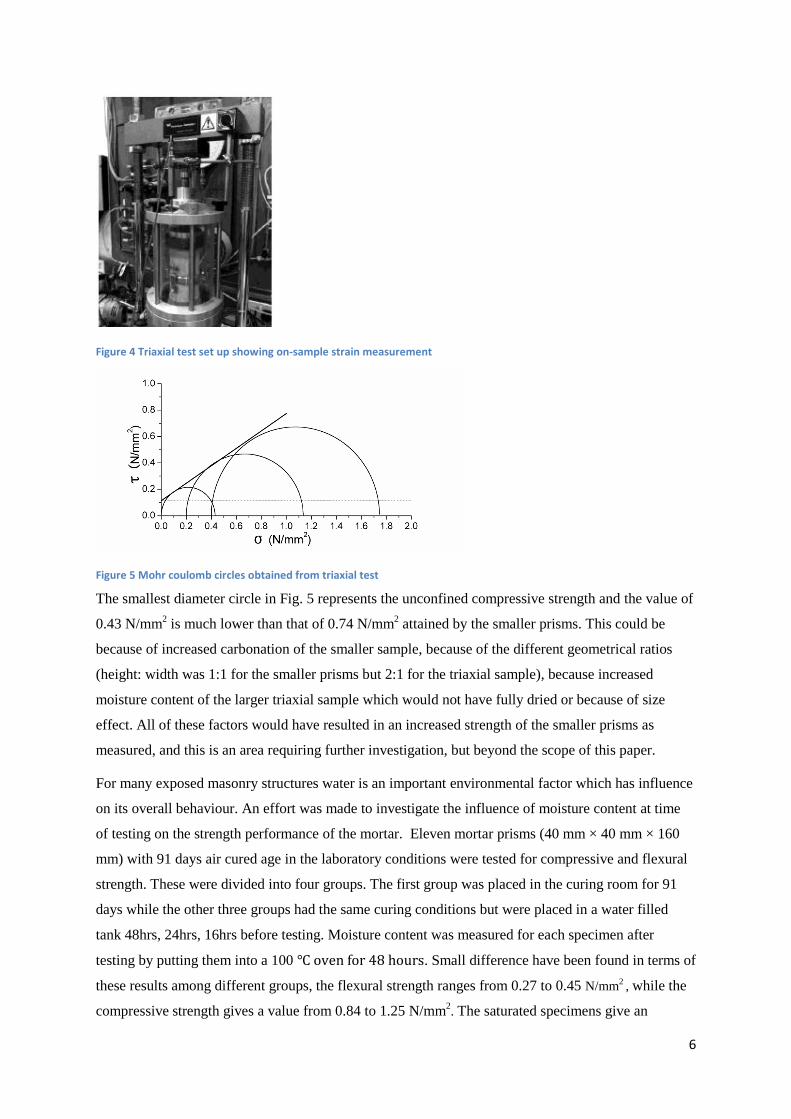
conditions and the designed confining pressures were 0, 0.2 and 0.4 N/mm2 respectively. The setup
for test was shown in Fig. 4; two transducers were attached on the top of the cell to measure
displacement, and for the specimen with no confining pressure, a radial transducer and two axial
transducers were fixed on the specimen to allow more accurate determination of small-strain
properties. Tests were carried out under displacement control conditions and the loading rate was 0.5
mm/min. The Elastic modulus from the unconfined sample with on-sample strain measurement was
similar to that for the mortar prisms. It was not possible to use on-sample instrumentation for the
confined samples as they were within a latex membrane and the conventional fixing methods for on-
sample transducers in soils did not work because of the cementation of the lime sample. The stiffness
of the confined samples could not be accurately determined using external displacement
measurements as compliance in the test system coupled with a stiff sample resulted in artificially low
stiffness. The maximum principal stresses obtained are 0.43, 1.14 and 1.75 N/mm2 for the samples
with 0, 0.2 and 0.4 N/mm2 confining stress respectively. The tested specimens were sprayed with
Phenolphthalein, and the chemical reaction indicated that only the surface of the cylinders had
carbonated as expected for a lime sample at early age. Additional carbonation would result in an
increase in mortar strength [10], but this could take an unacceptably long time, particularly for the 100
mm diameter triaxial samples. Mortar carbonation rates are significantly influenced by interaction
with the units within the masonry, with dewatering of the mortar by brick suction effects influence
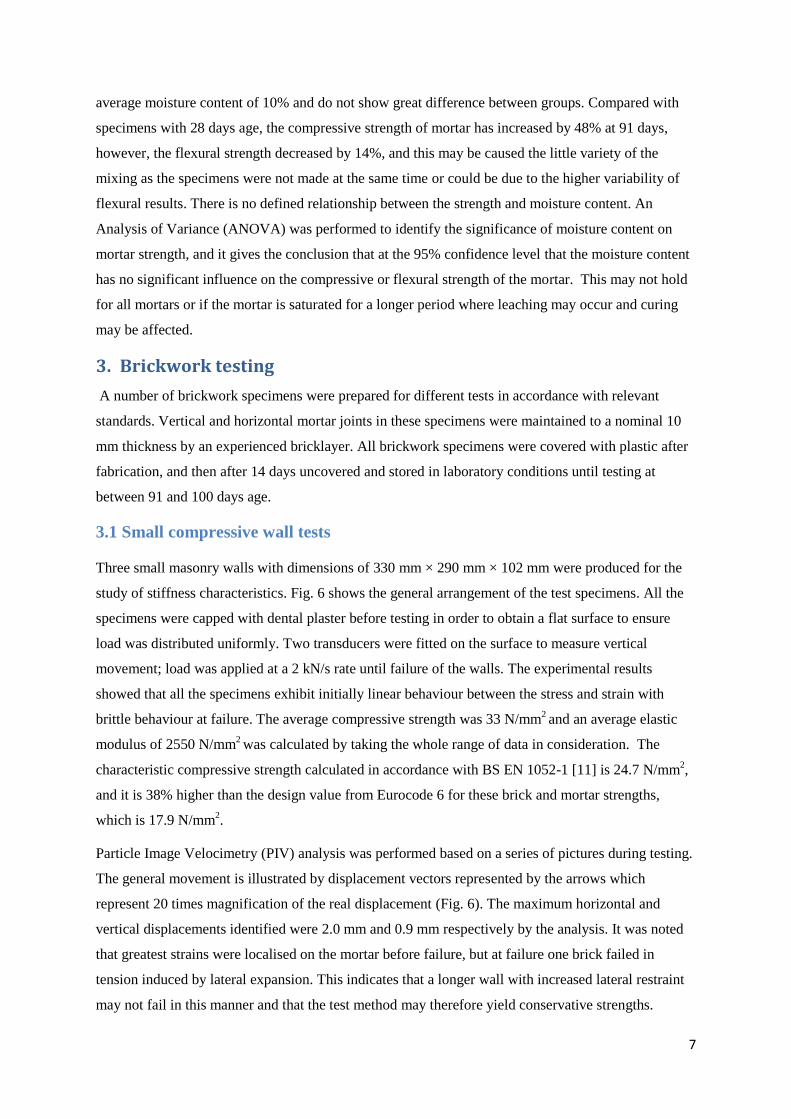
drying rates for the mortar and the resultant porosity. According to the Mohr-Coulomb theory, the
cohesion and friction angle were determined as 0.115 N/mm2 and 34° respectively (Fig. 5).
6
Figure 4 Triaxial test set up showing on-sample strain measurement
Figure 5 Mohr coulomb circles obtained from triaxial test
The smallest diameter circle in Fig. 5 represents the unconfined compressive strength and the value of
0.43 N/mm2 is much lower than that of 0.74 N/mm
2 attained by the smaller prisms. This could be
because of increased carbonation of the smaller sample, because of the different geometrical ratios
(height: width was 1:1 for the smaller prisms but 2:1 for the triaxial sample), because increased
moisture content of the larger triaxial sample which would not have fully dried or because of size
effect. All of these factors would have resulted in an increased strength of the smaller prisms as
measured, and this is an area requiring further investigation, but beyond the scope of this paper.
For many exposed masonry structures water is an important environmental factor which has influence
on its overall behaviour. An effort was made to investigate the influence of moisture content at time
of testing on the strength performance of the mortar. Eleven mortar prisms (40 mm × 40 mm × 160
mm) with 91 days air cured age in the laboratory conditions were tested for compressive and flexural
strength. These were divided into four groups. The first group was placed in the curing room for 91
days while the other three groups had the same curing conditions but were placed in a water filled
tank 48hrs, 24hrs, 16hrs before testing. Moisture content was measured for each specimen after
testing by putting them into a 100 ℃ oven for 48 hours. Small difference have been found in terms of
these results among different groups, the flexural strength ranges from 0.27 to 0.45 N/mm2 , while the
compressive strength gives a value from 0.84 to 1.25 N/mm2. The saturated specimens give an
7
average moisture content of 10% and do not show great difference between groups. Compared with
specimens with 28 days age, the compressive strength of mortar has increased by 48% at 91 days,
however, the flexural strength decreased by 14%, and this may be caused the little variety of the
mixing as the specimens were not made at the same time or could be due to the higher variability of
flexural results. There is no defined relationship between the strength and moisture content. An
Analysis of Variance (ANOVA) was performed to identify the significance of moisture content on
mortar strength, and it gives the conclusion that at the 95% confidence level that the moisture content
has no significant influence on the compressive or flexural strength of the mortar. This may not hold
for all mortars or if the mortar is saturated for a longer period where leaching may occur and curing
may be affected.
3. Brickwork testing
A number of brickwork specimens were prepared for different tests in accordance with relevant
standards. Vertical and horizontal mortar joints in these specimens were maintained to a nominal 10
mm thickness by an experienced bricklayer. All brickwork specimens were covered with plastic after
fabrication, and then after 14 days uncovered and stored in laboratory conditions until testing at
between 91 and 100 days age.
3.1 Small compressive wall tests
Three small masonry walls with dimensions of 330 mm × 290 mm × 102 mm were produced for the
study of stiffness characteristics. Fig. 6 shows the general arrangement of the test specimens. All the
specimens were capped with dental plaster before testing in order to obtain a flat surface to ensure
load was distributed uniformly. Two transducers were fitted on the surface to measure vertical
movement; load was applied at a 2 kN/s rate until failure of the walls. The experimental results
showed that all the specimens exhibit initially linear behaviour between the stress and strain with
brittle behaviour at failure. The average compressive strength was 33 N/mm2 and an average elastic
modulus of 2550 N/mm2 was calculated by taking the whole range of data in consideration. The
characteristic compressive strength calculated in accordance with BS EN 1052-1 [11] is 24.7 N/mm2,
and it is 38% higher than the design value from Eurocode 6 for these brick and mortar strengths,
which is 17.9 N/mm2.
Particle Image Velocimetry (PIV) analysis was performed based on a series of pictures during testing.
The general movement is illustrated by displacement vectors represented by the arrows which
represent 20 times magnification of the real displacement (Fig. 6). The maximum horizontal and
vertical displacements identified were 2.0 mm and 0.9 mm respectively by the analysis. It was noted
that greatest strains were localised on the mortar before failure, but at failure one brick failed in
tension induced by lateral expansion. This indicates that a longer wall with increased lateral restraint
may not fail in this manner and that the test method may therefore yield conservative strengths.
8
Figure 6 Small compressive wall test set up
3.2 Triplet shear test
The friction and cohesion properties between the brick and mortar are of great importance. Fifteen
triplet stacks were prepared and tested in accordance with BS EN 1052-3 [12] to study the friction
properties before and after initial failure, and the influence of specimen moisture content on shear
strength was also investigated. The failure load and load displacement relationships obtained from
these tests are intended for use in computer modelling work.
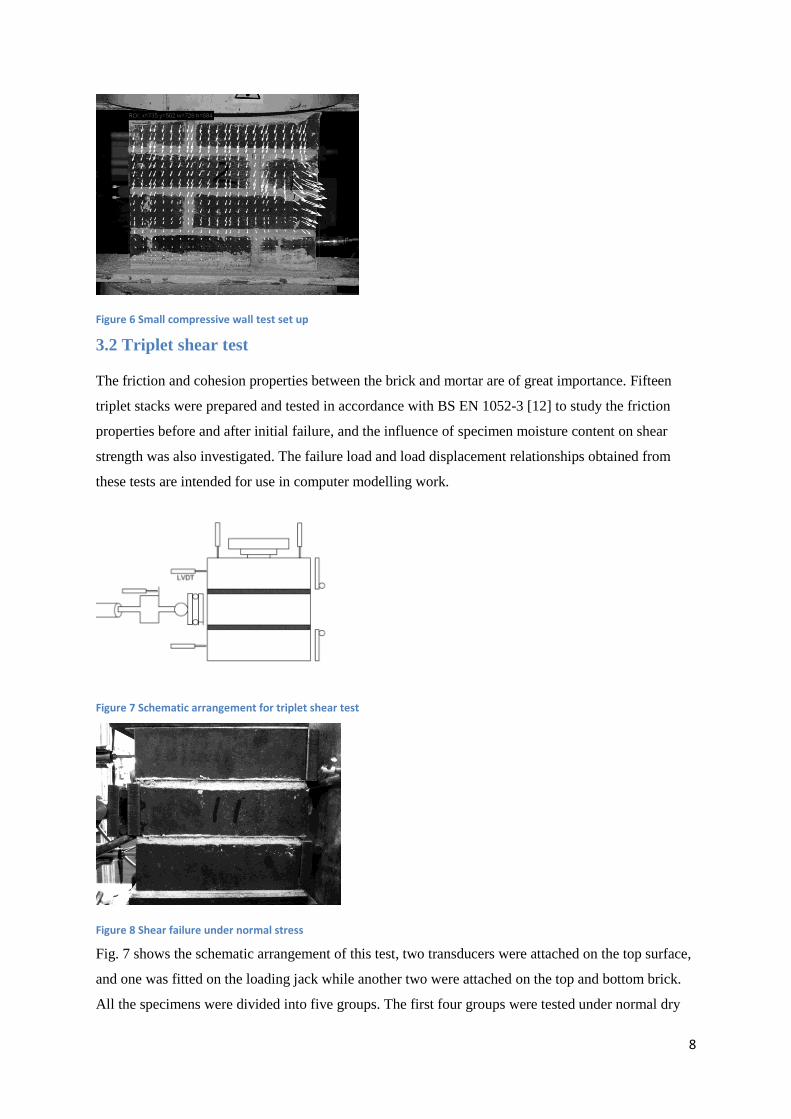
Figure 7 Schematic arrangement for triplet shear test
Figure 8 Shear failure under normal stress
Fig. 7 shows the schematic arrangement of this test, two transducers were attached on the top surface,
and one was fitted on the loading jack while another two were attached on the top and bottom brick.
All the specimens were divided into five groups. The first four groups were tested under normal dry
9
conditions with different compressive stresses which are 0 N/mm2, 0.2 N/mm
2, 0.6 N/mm
2 and 1
N/mm2 respectively. There was one specimen in each group which load was applied through three
loading cycles to about 33% of expected failure load and then loaded to failure (except for the 0
N/mm2 normal stress condition). The specimens in the final group were put into water to achieve a
saturated condition, and they were then tested under 0 N/mm2, 0.2 N/mm
2 and 0.6 N/mm
2 normal
stresses respectively. The main failure mode observed was delamination at the interface, accompanied
with some cracking of mortar at the corner (Fig. 8) and test results are listed in Table 1.
Table 1 Shear strength under different normal stress levels
Applied normal pre-
compressive stress
[N/mm2]
Mean shear
strength
[N/mm2]
Characteristic value
of initial shear
strength [N/mm2]
Water content
of mortar
[%]
Dry
specimen
0 0.09
0.07
0.2 0.21
0.6 0.46
1 0.71
Saturated
specimen
0 0.08
9.3 0.2 0.2
0.6 0.43
The results show that there is no remarkable decrease of the shear strength for the saturated specimens
compared with corresponding dry ones. The relationship between shear strength and normal stress
was linear for both the dry and saturated specimens, and it has also been proved by the work carried
out by Capozacca [13]. The characteristic angles of friction determined in accordance with BS EN
1052-3[12] are 26.6° and 25° (coefficient between normal stress and shear strength of 0.50 and 0.47
respectively). The average initial shear strengths were 0.084 N/mm2 and 0.082 N/mm
2 respectively
for the dry and saturated samples. This equates to a reduction in initial shear strength of
approximately 26% from the cohesion measured during triaxial testing, and a reduction of masonry
friction angle of approximately 22% (reduction of tangent of friction angle of 26%). Reductions in
strength are attributed to the weaker brick/mortar interface compared with the mortar [14]. As a result,
the failure by delamination at the interface was the most likely failure mechanism. The characteristic
initial shear strength gives a value of 0.07 N/mm2, which is 50% of the figure reported by Zhou [15],
while the designed value recommended by Eurocode 6 [16] is 0.1 N/mm2. The variation between
these figures and those by Zhou are likely because although the same engineering bricks were used by
Zhou, they had different geometry with the brick for this study having no perforations and those used
by Zhou having three holes with a total of 18% perforations. The presence of perforations means
some of the mortar has to shear as well as the brick/mortar interface, potentially increasing the shear
capacity. The coefficient between normal stress and shear strength are significantly higher than the
0.40 used in Eurocode 6, indicating the equations Eurocode 6 will overpredict strength at low normal
stresses and underpredict strength at higher normal stresses in this particular case. The partial factors
10
for actions and resistances in the Eurocode will, however, ensure shear failure is not achieved for
these materials.
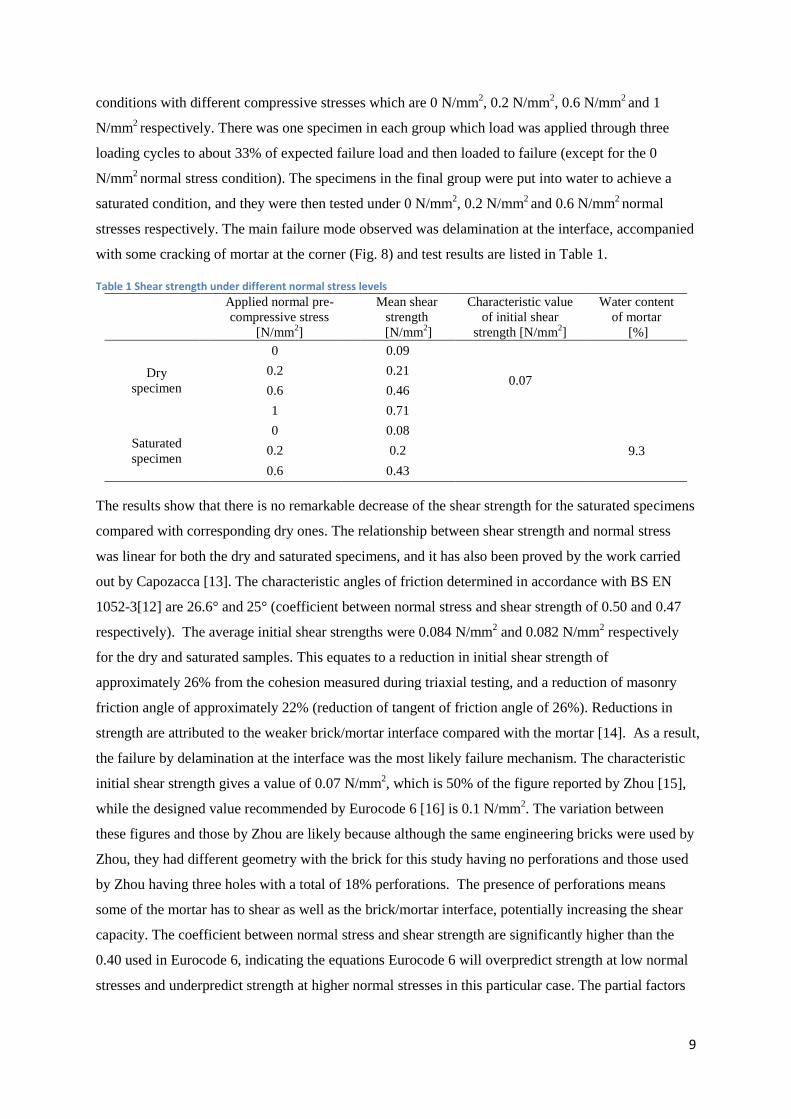
Figure 9 Load displacement curves under different normal stress levels
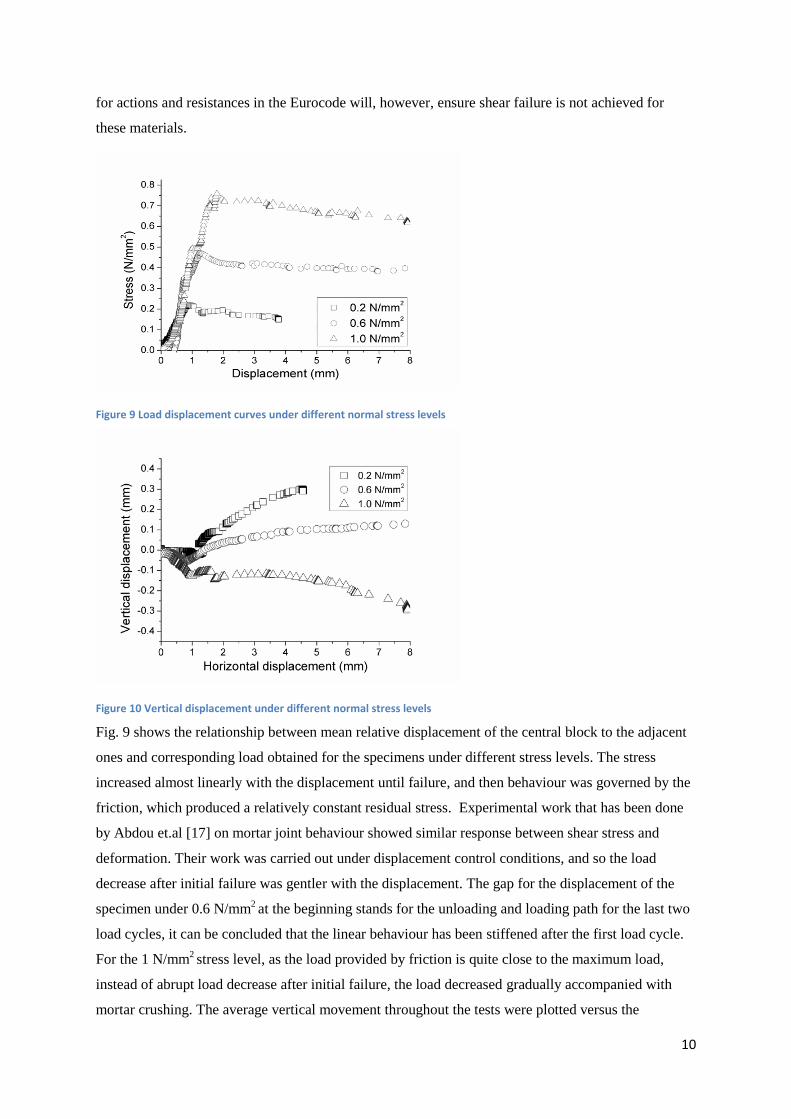
Figure 10 Vertical displacement under different normal stress levels
Fig. 9 shows the relationship between mean relative displacement of the central block to the adjacent
ones and corresponding load obtained for the specimens under different stress levels. The stress
increased almost linearly with the displacement until failure, and then behaviour was governed by the
friction, which produced a relatively constant residual stress. Experimental work that has been done
by Abdou et.al [17] on mortar joint behaviour showed similar response between shear stress and
deformation. Their work was carried out under displacement control conditions, and so the load
decrease after initial failure was gentler with the displacement. The gap for the displacement of the
specimen under 0.6 N/mm2 at the beginning stands for the unloading and loading path for the last two
load cycles, it can be concluded that the linear behaviour has been stiffened after the first load cycle.
For the 1 N/mm2 stress level, as the load provided by friction is quite close to the maximum load,
instead of abrupt load decrease after initial failure, the load decreased gradually accompanied with
mortar crushing. The average vertical movement throughout the tests were plotted versus the
11
horizontal displacement in Fig. 10. As the normal stress applied, these specimens experienced an
initial compression of 0.6 mm, 0.9 mm and 1.2 mm respectively. It can be seen from the chart that the
specimens under 0.2 N/mm2 and 0.6 N/mm
2 normal stresses dilated by 0.3 mm and 0.1 mm
respectively after both joints opened, while the specimen under 1.0 N/mm2 stress level behave in the
opposite way, it was compressed with a final displacement of 0.3 mm accompanied with the mortar
cracking near the brick/mortar interface. This behaviour of increasing dilation under lower normal
stresses is common in shear box tests on sands which have similar stress conditions to the triplet shear
test.
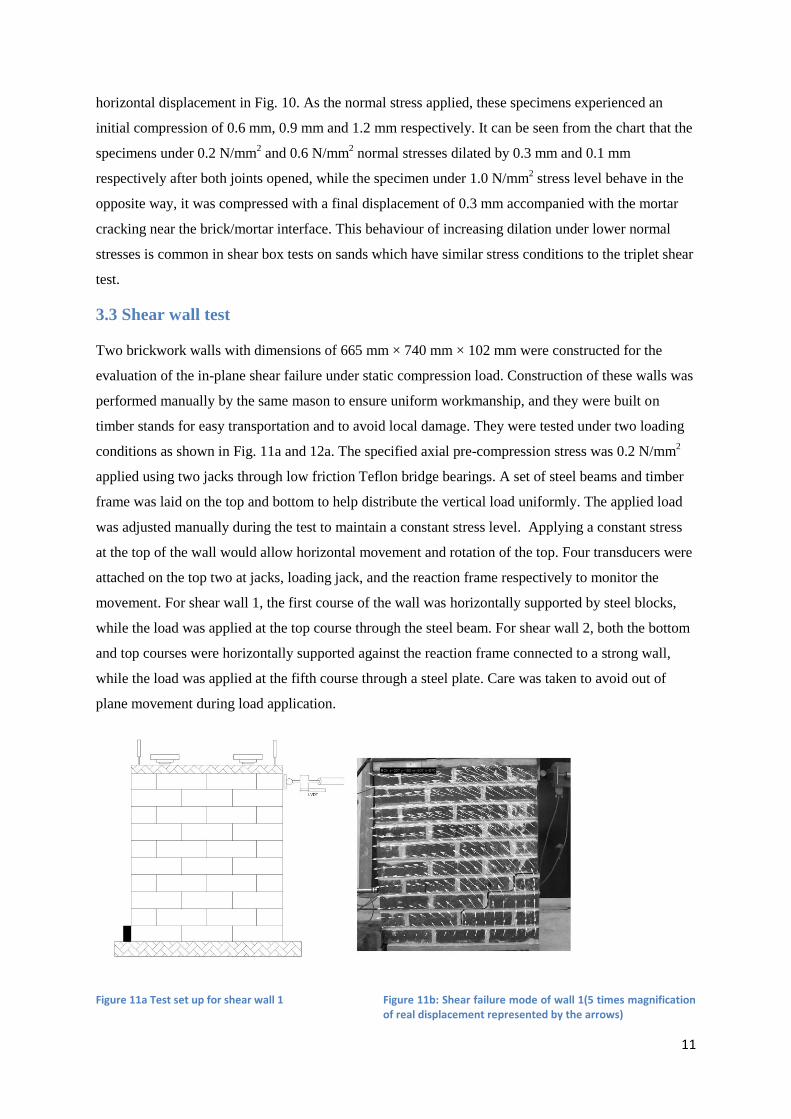
3.3 Shear wall test
Two brickwork walls with dimensions of 665 mm × 740 mm × 102 mm were constructed for the
evaluation of the in-plane shear failure under static compression load. Construction of these walls was
performed manually by the same mason to ensure uniform workmanship, and they were built on
timber stands for easy transportation and to avoid local damage. They were tested under two loading
conditions as shown in Fig. 11a and 12a. The specified axial pre-compression stress was 0.2 N/mm2
applied using two jacks through low friction Teflon bridge bearings. A set of steel beams and timber
frame was laid on the top and bottom to help distribute the vertical load uniformly. The applied load
was adjusted manually during the test to maintain a constant stress level. Applying a constant stress
at the top of the wall would allow horizontal movement and rotation of the top. Four transducers were
attached on the top two at jacks, loading jack, and the reaction frame respectively to monitor the
movement. For shear wall 1, the first course of the wall was horizontally supported by steel blocks,
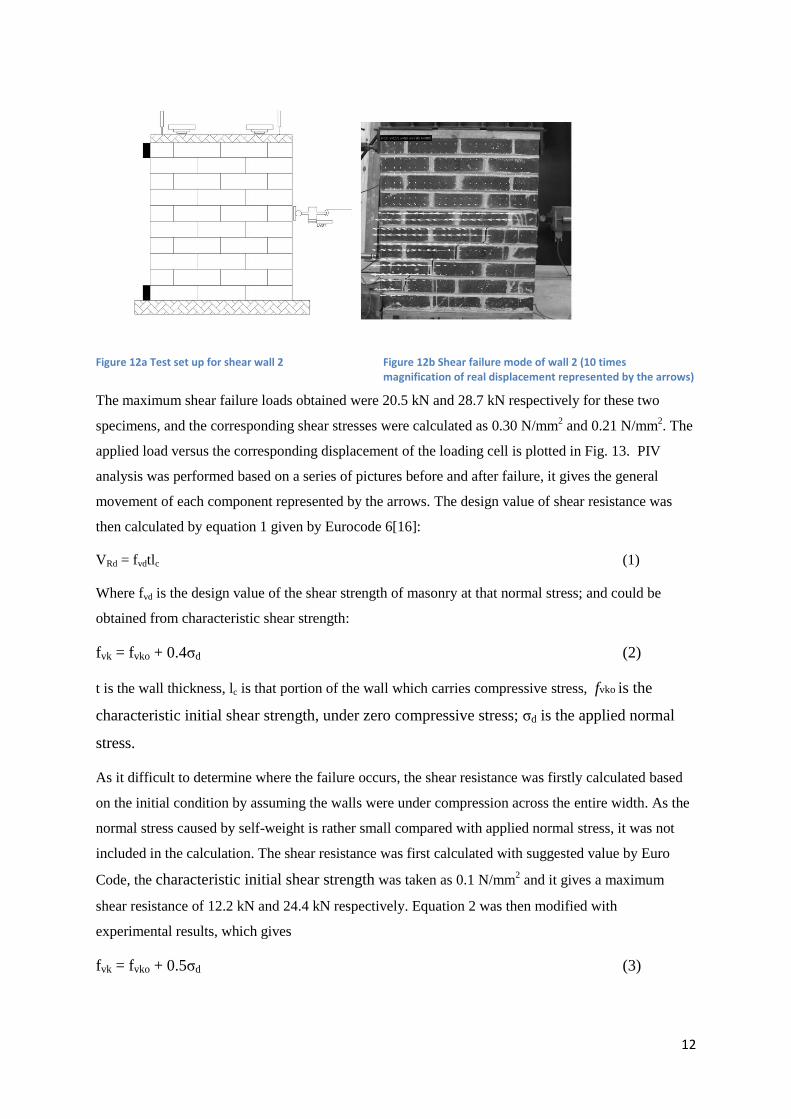
while the load was applied at the top course through the steel beam. For shear wall 2, both the bottom
and top courses were horizontally supported against the reaction frame connected to a strong wall,
while the load was applied at the fifth course through a steel plate. Care was taken to avoid out of
plane movement during load application.
Figure 11a Test set up for shear wall 1 Figure 11b: Shear failure mode of wall 1(5 times magnification of real displacement represented by the arrows)
12
Figure 12a Test set up for shear wall 2 Figure 12b Shear failure mode of wall 2 (10 times magnification of real displacement represented by the arrows)
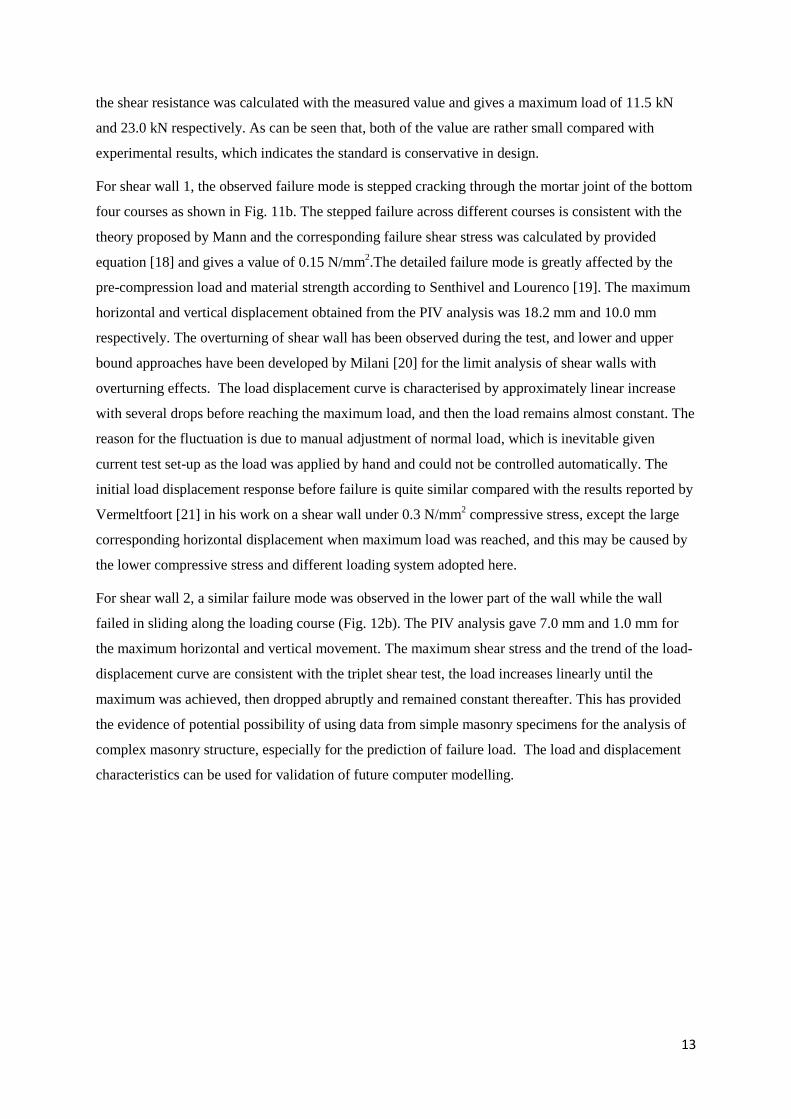
The maximum shear failure loads obtained were 20.5 kN and 28.7 kN respectively for these two
specimens, and the corresponding shear stresses were calculated as 0.30 N/mm2 and 0.21 N/mm
2. The
applied load versus the corresponding displacement of the loading cell is plotted in Fig. 13. PIV
analysis was performed based on a series of pictures before and after failure, it gives the general
movement of each component represented by the arrows. The design value of shear resistance was
then calculated by equation 1 given by Eurocode 6[16]:
VRd = fvdtlc (1)
Where fvd is the design value of the shear strength of masonry at that normal stress; and could be
obtained from characteristic shear strength:
fvk = fvko + 0.4σd (2)
t is the wall thickness, lc is that portion of the wall which carries compressive stress, fvko is the
characteristic initial shear strength, under zero compressive stress; σd is the applied normal
stress.
As it difficult to determine where the failure occurs, the shear resistance was firstly calculated based
on the initial condition by assuming the walls were under compression across the entire width. As the
normal stress caused by self-weight is rather small compared with applied normal stress, it was not
included in the calculation. The shear resistance was first calculated with suggested value by Euro
Code, the characteristic initial shear strength was taken as 0.1 N/mm2 and it gives a maximum
shear resistance of 12.2 kN and 24.4 kN respectively. Equation 2 was then modified with
experimental results, which gives
fvk = fvko + 0.5σd (3)
13
the shear resistance was calculated with the measured value and gives a maximum load of 11.5 kN
and 23.0 kN respectively. As can be seen that, both of the value are rather small compared with
experimental results, which indicates the standard is conservative in design.
For shear wall 1, the observed failure mode is stepped cracking through the mortar joint of the bottom
four courses as shown in Fig. 11b. The stepped failure across different courses is consistent with the
theory proposed by Mann and the corresponding failure shear stress was calculated by provided
equation [18] and gives a value of 0.15 N/mm2.The detailed failure mode is greatly affected by the
pre-compression load and material strength according to Senthivel and Lourenco [19]. The maximum
horizontal and vertical displacement obtained from the PIV analysis was 18.2 mm and 10.0 mm
respectively. The overturning of shear wall has been observed during the test, and lower and upper
bound approaches have been developed by Milani [20] for the limit analysis of shear walls with
overturning effects. The load displacement curve is characterised by approximately linear increase
with several drops before reaching the maximum load, and then the load remains almost constant. The
reason for the fluctuation is due to manual adjustment of normal load, which is inevitable given
current test set-up as the load was applied by hand and could not be controlled automatically. The
initial load displacement response before failure is quite similar compared with the results reported by
Vermeltfoort [21] in his work on a shear wall under 0.3 N/mm2 compressive stress, except the large
corresponding horizontal displacement when maximum load was reached, and this may be caused by
the lower compressive stress and different loading system adopted here.
For shear wall 2, a similar failure mode was observed in the lower part of the wall while the wall
failed in sliding along the loading course (Fig. 12b). The PIV analysis gave 7.0 mm and 1.0 mm for
the maximum horizontal and vertical movement. The maximum shear stress and the trend of the load-
displacement curve are consistent with the triplet shear test, the load increases linearly until the
maximum was achieved, then dropped abruptly and remained constant thereafter. This has provided
the evidence of potential possibility of using data from simple masonry specimens for the analysis of
complex masonry structure, especially for the prediction of failure load. The load and displacement
characteristics can be used for validation of future computer modelling.
14
Figure 13 Load displacement curves for shear walls
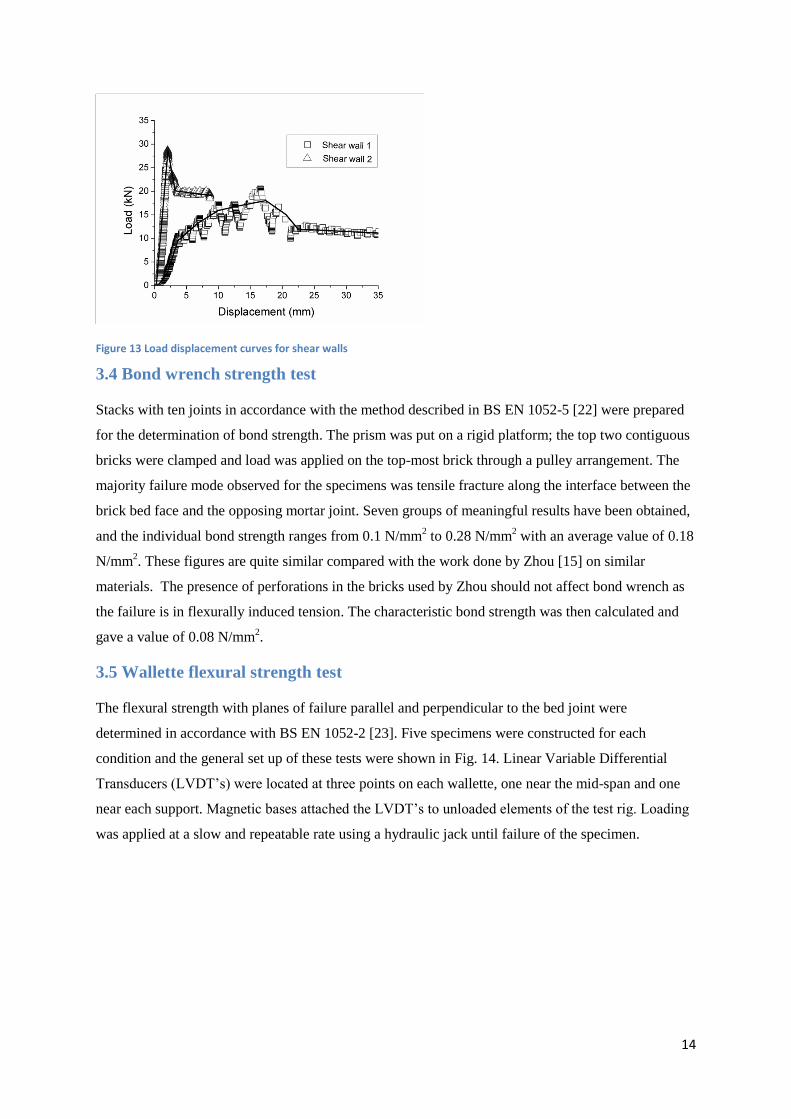
3.4 Bond wrench strength test
Stacks with ten joints in accordance with the method described in BS EN 1052-5 [22] were prepared
for the determination of bond strength. The prism was put on a rigid platform; the top two contiguous
bricks were clamped and load was applied on the top-most brick through a pulley arrangement. The
majority failure mode observed for the specimens was tensile fracture along the interface between the
brick bed face and the opposing mortar joint. Seven groups of meaningful results have been obtained,
and the individual bond strength ranges from 0.1 N/mm2 to 0.28 N/mm
2 with an average value of 0.18
N/mm2. These figures are quite similar compared with the work done by Zhou [15] on similar
materials. The presence of perforations in the bricks used by Zhou should not affect bond wrench as
the failure is in flexurally induced tension. The characteristic bond strength was then calculated and
gave a value of 0.08 N/mm2.
3.5 Wallette flexural strength test
The flexural strength with planes of failure parallel and perpendicular to the bed joint were
determined in accordance with BS EN 1052-2 [23]. Five specimens were constructed for each
condition and the general set up of these tests were shown in Fig. 14. Linear Variable Differential
Transducers (LVDT’s) were located at three points on each wallette, one near the mid-span and one
near each support. Magnetic bases attached the LVDT’s to unloaded elements of the test rig. Loading
was applied at a slow and repeatable rate using a hydraulic jack until failure of the specimen.
15
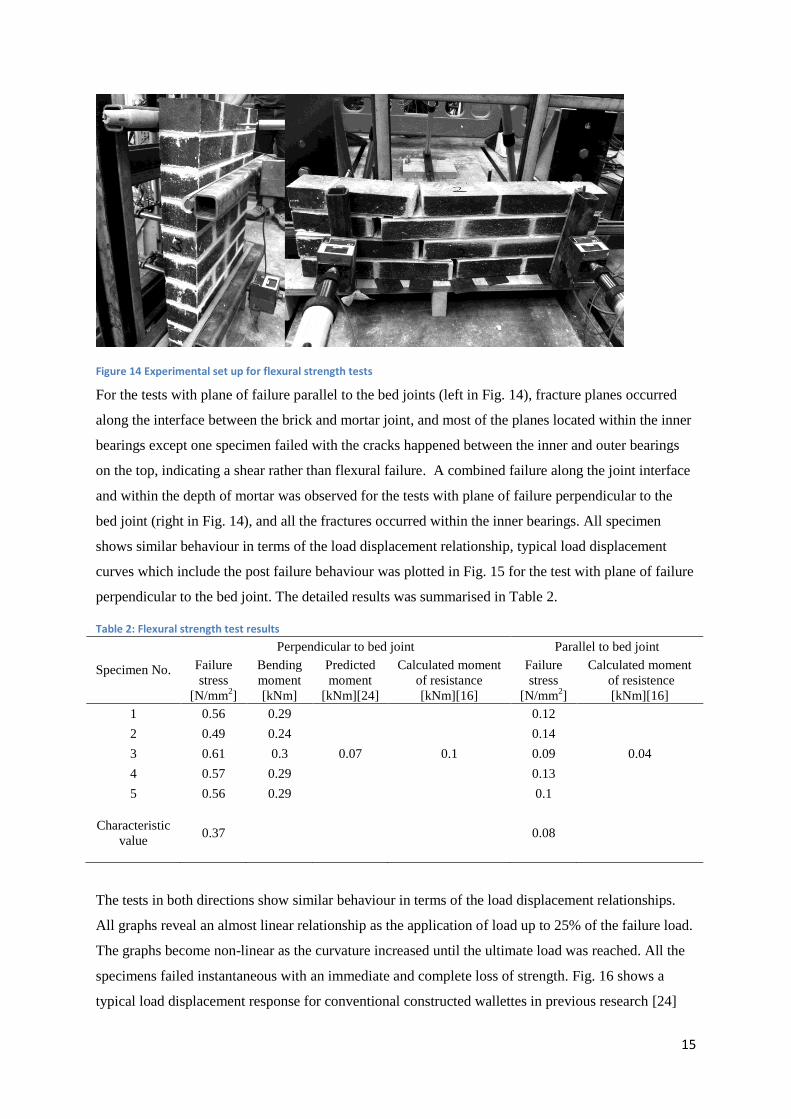
Figure 14 Experimental set up for flexural strength tests
For the tests with plane of failure parallel to the bed joints (left in Fig. 14), fracture planes occurred
along the interface between the brick and mortar joint, and most of the planes located within the inner
bearings except one specimen failed with the cracks happened between the inner and outer bearings
on the top, indicating a shear rather than flexural failure. A combined failure along the joint interface
and within the depth of mortar was observed for the tests with plane of failure perpendicular to the
bed joint (right in Fig. 14), and all the fractures occurred within the inner bearings. All specimen
shows similar behaviour in terms of the load displacement relationship, typical load displacement
curves which include the post failure behaviour was plotted in Fig. 15 for the test with plane of failure
perpendicular to the bed joint. The detailed results was summarised in Table 2.
Table 2: Flexural strength test results
Specimen No.
Perpendicular to bed joint Parallel to bed joint
Failure
stress
[N/mm2]
Bending
moment
[kNm]
Predicted
moment
[kNm][24]
Calculated moment
of resistance
[kNm][16]
Failure
stress
[N/mm2]
Calculated moment
of resistence
[kNm][16]
1 0.56 0.29
0.07 0.1
0.12
0.04
2 0.49 0.24 0.14
3 0.61 0.3 0.09
4 0.57 0.29 0.13
5 0.56 0.29 0.1
Characteristic
value 0.37 0.08
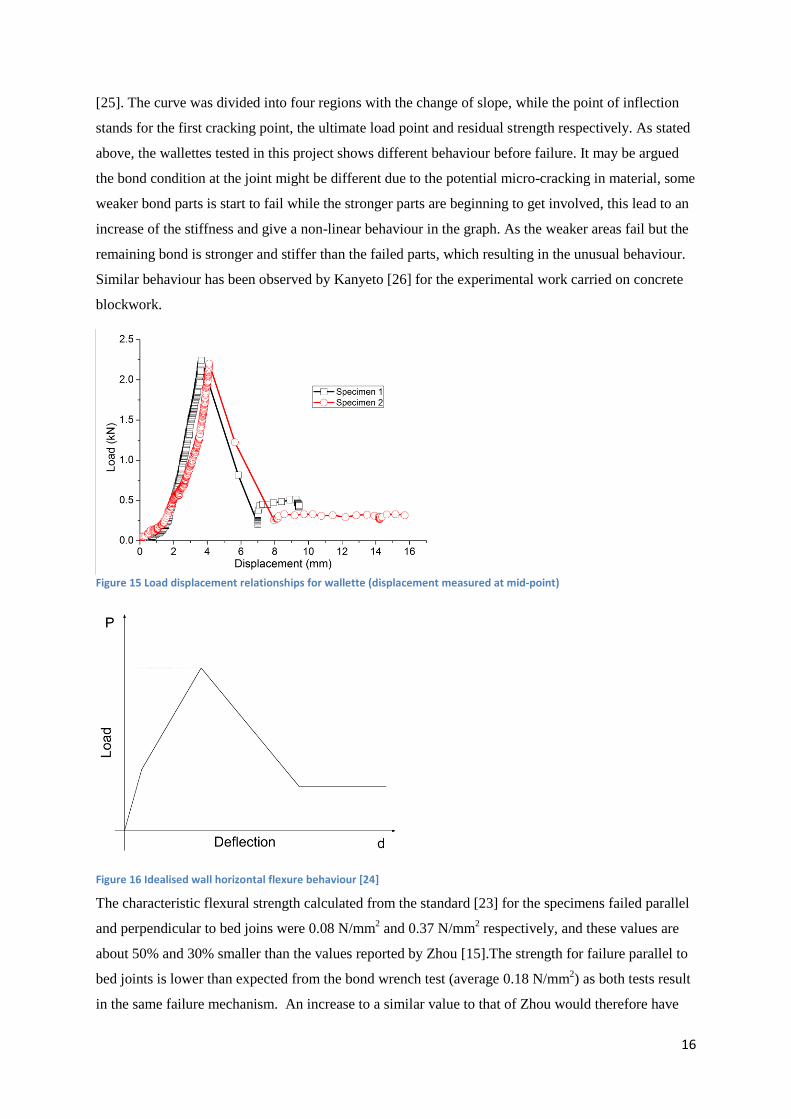
The tests in both directions show similar behaviour in terms of the load displacement relationships.
All graphs reveal an almost linear relationship as the application of load up to 25% of the failure load.
The graphs become non-linear as the curvature increased until the ultimate load was reached. All the
specimens failed instantaneous with an immediate and complete loss of strength. Fig. 16 shows a
typical load displacement response for conventional constructed wallettes in previous research [24]
16
[25]. The curve was divided into four regions with the change of slope, while the point of inflection
stands for the first cracking point, the ultimate load point and residual strength respectively. As stated
above, the wallettes tested in this project shows different behaviour before failure. It may be argued
the bond condition at the joint might be different due to the potential micro-cracking in material, some
weaker bond parts is start to fail while the stronger parts are beginning to get involved, this lead to an
increase of the stiffness and give a non-linear behaviour in the graph. As the weaker areas fail but the
remaining bond is stronger and stiffer than the failed parts, which resulting in the unusual behaviour.
Similar behaviour has been observed by Kanyeto [26] for the experimental work carried on concrete
blockwork.
Figure 15 Load displacement relationships for wallette (displacement measured at mid-point)
Figure 16 Idealised wall horizontal flexure behaviour [24]
The characteristic flexural strength calculated from the standard [23] for the specimens failed parallel
and perpendicular to bed joins were 0.08 N/mm2 and 0.37 N/mm
2 respectively, and these values are
about 50% and 30% smaller than the values reported by Zhou [15].The strength for failure parallel to
bed joints is lower than expected from the bond wrench test (average 0.18 N/mm2) as both tests result
in the same failure mechanism. An increase to a similar value to that of Zhou would therefore have
17
been expected, with an anticipated decrease in strength for failure perpendicular to bed joints as a
result of Zhou’s tests being undertaken on bricks with 18% perforations, resulting in both interface
and mortar failure. The corresponding ultimate bending moment Mult was studied and compared with
the value calculated from the mathematical model proposed by Willis et al [24] for tests with plane of
failure perpendicular to the bed joint. The ultimate horizontal bending moment is mainly governed by
torsional capacity of the bed joints, which could be calculated by the following equation:
Mult = nbτbkb0.5(lu+tm)t2 (4)
Where nb = number of bed joint in failure
τb = ultimate shear stress on a bed joint
kb = numerical factor used in calculation of τb (for (lu+tm)=225mm, t=102mm, kb = 0.21 [27])
lu = length of brick unit
tm = thickness of mortar joint
t = thickness of masonry section
As shown in Table 2, the predicted value by equation 1 is 0.07 kNm which is only 25% of the
measured value from the tests. The mathematical model has greatly underestimated the failure load; it
gives much conservative value in design and might not be applicable for the masonry structures with
weak mortar. The bending moment is also compared with the value given by Eurocode 6 [16] by
assuming NHL lime mortar as a ‘general mortar’, the experimental value is about three times higher
than the code value.
4. Conclusions
This paper has presented material properties from on-going research study on masonry arch bridges.
It presents data on the mechanical properties of engineering blue brick unit and premixed hydraulic
lime mortar, as well as the shear behaviour between the bricks and mortar under different stress levels
and different loading conditions. The following conclusions could be drawn from the experimental
study.
Compressive test on brickwork specimen shows linear behaviour between stress and strain
under compressive load, and the failure was caused by crushing of the brick, indicating a
linear elastic material model for the bricks may not be applicable, even at stress levels below
20% of the brick compressive strength.
A highly linear relationship between the shear strength and normal stresses has been found for
both the mortar and the brick/mortar interface, and a reduction in initial shear strength has
been found for the brick/mortar interface.
18
Shear failure of brickwork wall is characterised with stepped cracking and sliding through
mortar joint. The magnitude of the decrease is higher than the initial shear strength, indicating
there is a breaking of the bond as well as a decrease in friction once failure commences.
Comparison between the experimental results and design values given by relevant standard
shows that the standard is quite conservative in design, particularly at higher normal stress
levels.
Failure planes occurred along the interface between the brick and mortar joint. For the
flexural test, the proposed mathematical model [24] and Eurocode 6 both give conservation
value for design. The load displacement relationship of NHL mortar brickwork reveals
different behaviour compared with conventional masonry wall panel under lateral load and
more research work is needed to compare with the results obtained in this study.
Based on results of this testing and on previous tests by Zhou [15] with similar mortars and
bricks but containing perforations, the presence of perforations appears to increase shear
strength by forcing failure to be both along the brick/mortar interface and through the mortar
in the perforation.
The material properties and masonry stresses and deformations presented in this paper could be used
by researchers for validation of future computer modelling work.
Acknowledgements
The support of Network Rail and the University of Bath for this PhD study is gratefully
acknowledged by the authors.
19
References
[1] McKibbins L, Melbourne C, Sawar N, Sicilia Gaillard C. Masonry arch bridges: conditions
appraisal and remedial treatment. London: CIRIA; 2006.
[2] Sowden A. The maintenance of brick and stone masonry structures. Southport: Witwell Ltd;
1990.
[3] Zimmermann T, Strauss A, Bergmeister K. Numerical investigation of historic masonry walls
under normal and shear load. Constr Build Mater 2010; 24(8): 1385-91.
[4] Vasconcelos G, Lourenço PB. Experimental characterization of stone masonry in shear and
compression. Constr Build Mater 2009; 23(11): 3337-45.
[5] BS 771Part 1: 2011. Methods of test for masonry units: Determination of compressive strength.
London: British Standards Institution; 2011.
[6] BS 772 Part 11: 2000. Methods of Test for Masonry Units: Determination of Water Absorption
of Aggregate Concrete, Autoclaved Aerated Concrete, Manufactured Stone and Natural Stone
Masonry Units due to Capillary Action and the Initial Rate of Water Absorption of Clay
Masonry Units. London: British Standards Institution; 2000.
[7] Ross CW. Thermal expansion of clay building bricks. J Research NBS. 1941; 27(2): 197-216.
[8] BS 1015 Part 3: Methods of test for mortar for masonry: Determination of consistence of fresh
mortar (by flow table). London: British Standards Institution; 1999.
[9] BS 1015 Part 11: Methods of test for mortar for masonry: Determination of flexural and
compressive strength of hardened mortar. London: British Standards Institution; 1999.
[10] Lanas J, Alvarez-Galindo, JI. Masonry repair lime-based mortars: factors affecting the
mechanical behaviour. Cement Concrete Res 2003; 33(11): 1867-76.
[11] BS 1052 Part 1: 1999. Methods of test for masonry: Determination of compressive strength.
London: British Standards Institution; 1999.
[12] BS 1052 Part 3: 2002. Methods of test for masonry: Determination of initial shear strength.
London: British Standards Institution; 2002.
[13] Capozucca R. Shear Behaviour of Historic Masonry Made of Clay Bricks. Constr Build
Technol 2011; 5: 89-96.
[14] Roca P, González J, Oñate E, Lourenço PB. Experimental and numerical issues in the
modelling of the mechanical behaviour of masonry. In: P. Roca et al. (ed) Structural Analysis of
Historical Constructions, Barcelona: CIMNE; 1998. p. 57-91,
[15] Zhou Z, Walker P, D’Ayala D. Strength characteristics of hydraulic lime mortared brickwork.
P I Civil Eng: Constr Mater 2008; 161(4): 139-46.
[16] BS 1996 Part 1-1: 2005. Euro code 6. Design of Masonry Structures: General Rules for
Reinforced and Unreinforced Masonry Structures. London: British Standards Institution; 2005.
[17] Abdou L, Saada, R A, Meftah F, Mebarki A. Experimental investigations of the joint-mortar
behaviour. Mech Res Commun 2006; 33(3): 370-84.
20
[18] Mann W, Muller H. Failure of shear-stressed masonry: an enlarged theory, tests and
application to shear walls, P Brit Ceramic Soc 1982; 30: 223-35.
[19] Senthivel R, Lourenco P B. Finite element modelling of deformation characteristics of
historical stone masonry shear walls. Eng Struct 2009; 31: 1930-43.
[20] Milani G., Lourenco P.B., Tralli A. Homogenised limit analysis of masonry walls. Part II:
structural examples. Comput and Struct 2006; 84(3-4): 181-195.
[21] Vermeltfoort A, Raijmakers T, Janssen H. Shear tests on masonry walls. Proceeding of the
6th North American masonry conference, Philadelphia, 1993.
[22] BS 1052 Part 5. 2005. Methods of Test for Masonry: Determination of Bond Strength by the
Bond Wrench Method. London: British Standards Institution; 2005.
[23] BS 1052 Part 2. 1999. Methods of Test for Masonry: Determination of Flexural Strength.
London: British Standards Institution; 1999.
[24] Willis C R, Griffith M C, Lawrence S J. Horizontal bending of unreinforced clay brick
masonry. Masonry Int 2004; 17(3):109-21
[25] Lourenco PB, Rots JD, van der Pluijm R. Understanding the tensile behaviour of masonry
parallel to the bed joints: a numerical approach. Masonry Int; the British Masonry Society
winter 1998/1999; 12(3): 96–103.
[26] Kanyeto O, Fried A. Flexural behaviour of thin joint concrete blockwork: Experimental
results. Constr Build Mater 2011; 25:3639-47.
[27] Timoshenko S P, Goodier J N. Theory of elasticity. New York: McGraw-Hill; 1970.