Embed Size (px)
Citation preview

Garrick J. ForkenbrockW. Riley GarrottNHTSA / VRTC
Experimental Examination ofTest Maneuvers That May Induce
On-Road, Untripped Light Vehicle Rollover
SAE Papers 2003-01-1008 and 2003-01-1009
Mark HeitzBryan C. O’HarraTRC Inc.
05 Mar 03, page 2
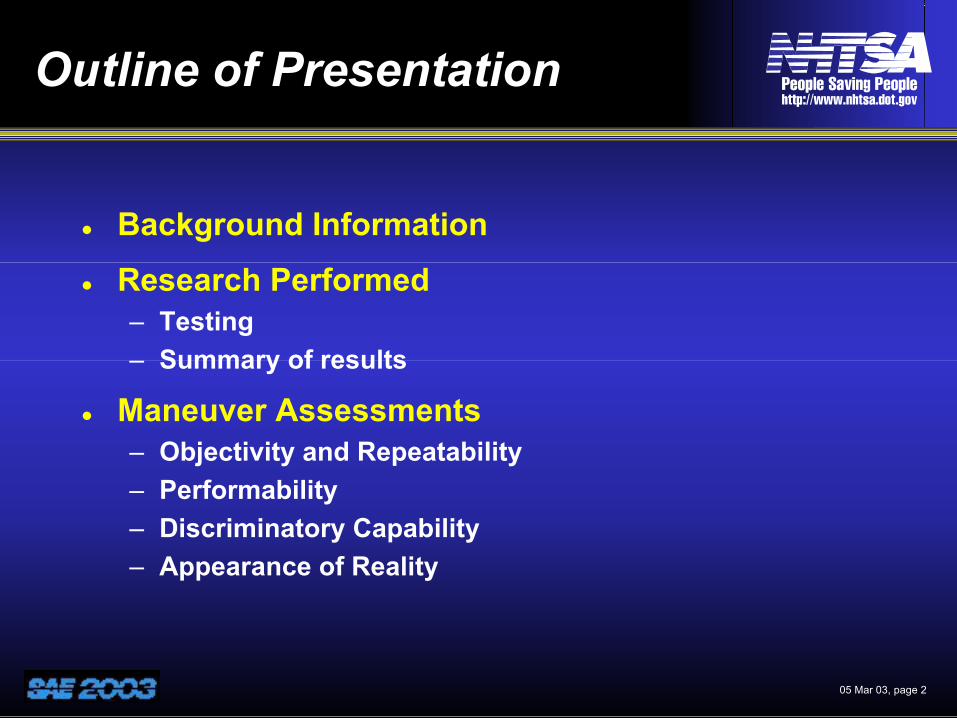
Outline of Presentation
Background InformationResearch Performed– Testing – Summary of results
Maneuver Assessments– Objectivity and Repeatability– Performability– Discriminatory Capability– Appearance of Reality

05 Mar 03, page 3
Overview of NHTSA’s Rollover Research Phases
Phase I-A– Spring 1997– Exploratory in nature– Emphasized maneuver
selection and procedure development
Phase I-B– Fall 1997– Evaluation of test driver
variability– Introduction of the
programmable steering machine
Phase II– Spring 1998– Evaluation of 12 vehicles
using maneuvers researched in Phase I
Phase IV– Spring 2001– Response to TREAD Act– Consideration of many
maneuversPhase V
– Spring 2002– Research factors that
may affect dynamic rollover propensity tests
– Rollover and handling rating development
Phase VI– Summer 2002– Evaluation of 26 vehicles
using Phase IV recommendations
Phase III-A– Spring 2000– Introduction of
“Roll Rate Feedback”
Phase III-B– Summer 2000– Pulse brake
automation
Discussed in this presentation

05 Mar 03, page 4
Phase IV Background
TREAD Act Requirement:Develop dynamic rollover propensity tests tofacilitate a consumer information program
National Academy of Sciences:
“NHTSA should vigorously pursue the development of dynamic testing to supplement the informationprovided by SSF.”
05 Mar 03, page 5
Phase IV Objectives
Test many maneuvers with a limited number of vehicles
Select maneuvers appropriate for use in a Government rollover resistance rating system

05 Mar 03, page 6
Maneuver Recommendations
Recommendations received from Government and industryNHTSA– VRTC– Safety Performance Standards
Alliance of Automobile ManufacturersConsumers Union Ford Motor CompanyHeitz Automotive, Inc.
ISO 3888 Part 2 Consortium– VW– BMW– DiamlerChysler– Porsche– Mitsubishi
MTS Systems CorporationNissan MotorsToyota Motor CompanyUMTRI

05 Mar 03, page 7
Test Conditions
Test vehicles– 2001 Chevrolet Blazer– 2001 Ford Escape– 2001 Toyota 4Runner– 1999 Mercedes ML320
Fully fuelledFront and rear mounted aluminum outriggersPerformed with and without stability control, if applicable
All tests performed on a dry, high-mu asphalt surface– TRC VDA– Peak mu: 0.94 to 0.98– Slide mu: 0.81 to 0.88
Multiple configurations– Nominal vehicle– Reduced rollover
resistance

05 Mar 03, page 8
Reduced Rollover Resistance(RRR)
Roof-mounted ballastDesigned to reduce SSF by 0.05– SSF-based rollover rating
reduction of 1-star for 3 of 4 Phase IV vehicles
Increased roll inertia from Nominal condition– Escape = 8.0 %– Blazer = 11.5%
Longitudinal C.G. preservedUseful as a maneuver sensitivity check
Up to 180 lbs

05 Mar 03, page 9
Tires
OEM specification (as installed on vehicle when delivered)– Make– Model– DOT Code– Inflation pressure
Frequent tire changesInnertubes used during some maneuvers to prevent debeadingManeuver speed iterations selected to minimize tire wear within a given test series
Test surface damage due to debeading

05 Mar 03, page 10
Test Maneuvers
Characterization– Constant Speed, Slowly Increasing Steer (SAE J266)
Rollover Resistance Assessment– NHTSA J-Turn– Fishhooks
— Fixed Timing Fishhook (Fixed Dwell Time)*— Roll Rate Feedback Fishhook (Variable Dwell Time)*— Nissan Fishhook
– Double Lane Changes— Ford Path-Corrected Limit Lane Change (PCL LC)— Consumers Union Short Course*— ISO 3888 Part 2*— Open-loop Pseudo Double Lane Change
*discussed in this presentation

05 Mar 03, page 11
Use of Slowly Increasing Steer Data
Steering magnitude based on vehicle response1. Determine the handwheel
angle at 0.3 g from Slowly Increasing Steer results
2. Multiply by a scalar (derived with Phase II data)– J-Turn = 8.0– Fishhook = 6.5
Steering rate based on successful Phase II testing– J-Turn = 1000 deg/sec– Fishhook = 720 deg/sec
0 500 1000 1500 2000 25000
50
100
150
200
250
300
Han
dwhe
el A
ngle
(deg
rees
)
Count Number
0 500 1000 1500 2000 2500-0.1
0
0.1
0.2
0.3
0.4
0.5
0.6
0.7
Late
ral A
ccel
erat
ion
(g)
Count Number
R2 = 0.99281
actuallinear fit

05 Mar 03, page 12
J-Turn
310ML320
3544Runner
287Escape
401Blazer
Handwheel Input
(degrees)Vehicle

05 Mar 03, page 13
Fixed Timing Fishhook(Symmetric)
252ML320
2874Runner
233Escape
326Blazer
Handwheel Input
(degrees)Vehicle

05 Mar 03, page 14
Roll Rate Feedback Fishhook(Symmetric)
252ML320
2874Runner
233Escape
326Blazer
Handwheel Input
(degrees)Vehicle

05 Mar 03, page 15
Closed-loop, Path-Following Double Lane Changes
ISO 3888 Part 2
Consumers Union Short Course

Questions?

05 Mar 03, page 17
Evaluation Technique
Each maneuver evaluated in 4 categories– Objectivity and
Repeatability– Performability– Discriminatory Capability– Appearance of Reality
Ratings assigned as follows– Excellent– Good– Satisfactory– Bad– Very Bad

05 Mar 03, page 18
Objectivity and Repeatability

05 Mar 03, page 19
Objectivity and Repeatability(Example: Steering Inputs)
Driver-Based ISO 3888 Part 2Double Lane Change
Nine tests are presented
Steering Machine-BasedFixed Timing Fishhook
Six tests are presented

05 Mar 03, page 20
Objectivity and Repeatability(Example: Steering Inputs)
ISO 3888 Part 2Double Lane Change
CU Short CourseDouble Lane Change

05 Mar 03, page 21
Objectivity and Repeatability(Example: DLC Output Repeatability)
CU Short CourseDouble Lane Change
ISO 3888 Part 2Double Lane Change

05 Mar 03, page 22
Objectivity and Repeatability(Example: Fishhook Output Repeatability)

05 Mar 03, page 23
Objectivity and Repeatability(Summary)
One of the largest disadvantages of the ISO and CU Double Lane Changes– Driver input variability unavoidable
Use of a steering machine insures accurate, repeatable, reproducible inputsOperating vehicles at two-wheel lift threshold is a concern for all maneuver that endeavor to measure dynamic rollover resistance

05 Mar 03, page 24
Performability

05 Mar 03, page 25
Performability(Example: Means of Adaptation)
Dwell Time Comparison Handwheel Angle Comparison
Each test performed at 40 mph

05 Mar 03, page 26
Performability(Summary)
Each procedure was well developedISO and CU Double Lane Changes – Simplest to perform– Require little instrumentation
CU Short Course does not adapt course layout to vehicle RRF Fishhook offers better adaptability than does the FT Fishhook

05 Mar 03, page 27
Discriminatory Capability
*Especially when stability control is disabled

05 Mar 03, page 28
Discriminatory Capability (Metric Comparison)
Roll Rate Feedback Fishhook
Minimum two-wheel lift entrance speeds
ISO 3888 Part 2 Double Lane Change
Maximum “clean” run entrance speeds

05 Mar 03, page 29
Discriminatory Capability (Two-Wheel Lift Summary, Nominal Load)
47.8
40.2
46.4
40.1
43.5
49.9

05 Mar 03, page 30
Discriminatory Capability (Two-Wheel Lift Summary, RRR)
38.9
50.9
46.147.6
36.2
45.1
36.2
49.6
38.4
48.4
37.7
46.0

05 Mar 03, page 31
Discriminatory Capability (Video Comparison)

05 Mar 03, page 32
Discriminatory Capability (Summary)
Lack of discriminatory capability is the largest disadvantage of using ISO or CU Double Lane Changes– Entire range of max entrance speeds no more than 5.7 mph– Driver variability accounts for up to 70% of this range
ISO and CU Double Lane Changes were not capable of producing two-wheel lift during “clean” runs

05 Mar 03, page 33
Discriminatory Capability (Summary)
J-Turn required reduce rollover resistance loading to produce two-wheel lift in Phase IVJ-Turn and Fishhooks sensitive to changes that reduce rollover resistance RRF Fishhook very close to “worst case” scenario

05 Mar 03, page 34
Appearance of Reality

05 Mar 03, page 35
Appearance of Reality (Summary)
Each rollover resistance maneuver related to a real driving scenarioISO and CU Double Lane Changes emulate emergency crash avoidance maneuversFishhooks emulate road edge recovery maneuvers– Also very similar to first two steering inputs of the double
lane changes
J-Turn steering least likely to actually be used, but possible

05 Mar 03, page 36
Question:
Are the steering angles and steering rates used for the NHTSA J-Turn and Fishhook maneuvers beyond driver capabilities?

05 Mar 03, page 37
Steering Angles and Rates
Handwheel inputs of J-Turn and Fishhooks compared to those recorded during ISO and CU Double Lane Changes– Angles– Rates
ISO and CU Double Lane Change data filtered with various “Running Average” filters– 500 ms– 750 ms– 1000 ms
Running average data used to quantify the steering ability of the human driver

05 Mar 03, page 38
Peak Steering Angles

05 Mar 03, page 39
Peak Steering Rates
J-Turn Steering Durations: 287 – 401 msFishhook Steering Durations: 647 – 906 ms

05 Mar 03, page 40
Overall Assessment
Roll Rate Feedback Fishhook deemed the best overall maneuver (see below)J-Turn the most basic maneuver, can be a useful compliment to the Roll Rate Feedback FishhookBoth maneuvers selected for use in Phases V and VI
*When limited to vehicles with low rollover resistance and/or disadvantageous load configurations

05 Mar 03, page 41
Concluding Remarks
“Fishhook” gives the impression that the maneuver not performed during actual driving– Approximates steering performed by a driver after
dropping two-wheels off edge of road– Handwheel inputs within ranges established during ISO
and CU double lane change testing
For the sake of clarity, the Roll Rate Feedback Fishhook has been renamedNow known as the “NHTSA Road Edge Recovery”

05 Mar 03, page 42
Additional Information
Phase IV Technical Report (DOT HS 809 513)SAE Papers– 2003-01-1008– 2003-01-1009
http://www-nrd.nhtsa.dot.gov/vrtc/ca/rollover.htm