Embed Size (px)
Citation preview
Experimental Characterization and Modeling of PEM Fuel Cells under
Dynamic Load Variations
GIOVANNI BUCCI(1), EDOARDO FIORUCCI(1), FABRIZIO CIANCETTA(1), FRANCESCO VEGLIO’(2)
(1)Department of Electrical and Information Engineering – (2)Department of Chemical Engineering University of L’Aquila
Loc. Monteluco di Roio – L’Aquila ITALY
[email protected] http://www.ing.univaq.it
Abstract: - The adoption of fuel cells (FCs) for industrial applications, transportations and home power generation is widely increased during recent years. Because FCs are still in the development stage, to evaluate and validate fuel cell technologies suitable test systems are needed. In a fuel cell both chemical and electric sections can be founded, so to control its behaviour the measurement of different parameters, as current, voltage, flow rate of the reactants and cell temperature is required. The performance evaluation of a fuel cell requires both static and dynamic characterizations, especially for the automotive applications, in which there is a dynamic variation of electric load. To better design this kind of applications, a FC mathematical model is required, to evaluate the performance at different working conditions. The synthesis of a dynamic model describing the FC behavior should be performed starting form the real system configuration, including pipes, flow and pressure regulators and valves. To this aim an automatic measurement system for the characterization of PEM (Polymer Electrolyte Membrane) fuel cells has been developed, and in this paper a dynamic model of a fuel cells stack is proposed, which has been validated through experimental measures. Key-Words: - Fuel cells, Test system, Characterization, Data acquisition system, Dynamic testing, Supercapacitor 1 Introduction Fuel cells are electrochemical devices that convert a fuel’s chemical energy directly to electrical energy, with no internal moving parts; the main advantages of using systems are: i) the zero- or near-zero-emission of pollutants and very low noise emissions; ii) the high efficiency in the fuel-to-electricity conversion, ranging from 30% to 60% and up to 85% (considering the cogeneration of the heat); iii) the absence of moving parts that suggests a less instances of failure than mechanical systems; iv) the good power quality for supplying electronic systems such as computers, due to a potential freedom from troublesome frequency variations, voltage transients, dips, and surges; v) the inherently modularity, that permits the configuration in a wide range of electrical outputs, at near constant efficiency, independent of size and load. In recent years different types of technologies have been developed [1] [2], such as the: i) Alkaline Fuel Cell (AFC); ii) Proton Exchange Membrane (PEM) Fuel Cell; iii) Phosphoric Acid Fuel Cell (PAFC);
iv) Molten Carbonate Fuel Cell (MCFC); v) Solid Oxide Fuel Cell (SOFC) and vi) Direct Methanol Fuel Cell (DMFC). One of the most diffused, the PEM fuel cell, has a high proton conductivity membrane as electrolyte that allows protons to be transmitted from one face to the other. Each single cell produces about 0.6 V and can be combined in a fuel cell stack to obtain the required electrical voltage and power. The operating temperature is in the range of 70 °C -100 °C. The fuel cells have different applications, ranging from some watt, up to 250 kW. It is particularly interesting to replace the internal combustion engine in transportation systems, mainly to reduce pollution and increase efficiency. In stationary applications, fuel cells can supply single and two-family homes with electricity and heat. Further opportunities for applications include back-up power generation systems, for example, in hospitals, or telecommunication systems. Recently they have been applied in micro-systems, such as to supply
WSEAS TRANSACTIONS on POWER SYSTEMSGiovanni Bucci, Edoardo Fiorucci, Fabrizio Ciancetta, Francesco Veglio
ISSN: 1790-5060 75 Issue 2, Volume 5, April 2010
power to mobile telephones, CD players and laptop computers. The fuel cells are an attractive alternative to uninterruptible power supplies (UPS), power-line filters, or energy storage systems used to condition the grid electricity. To evaluate and validate fuel cell technologies, suitable test systems must be adopted in the research, development, or manufacturing activities. They must help comparing fuel cell performance to that of conventional power technologies. In electricity generation applications the efficiency at the different functioning conditions is the most important parameter, together with the responses to the faults that can happen both on chemical and electrical part of the plant. For transportation and variable speed drive applications the dynamic response to variable power request is another important parameter [3]. To this aim in this paper we propose an automatic test system for the characterization of PEM fuel cell in both static and dynamic conditions. The data obtained during experimetal tests has been used for the synthesis of a dynamic mathematical model of the FCs, that has been applied to simulate a FC system with a parallel connected supercapacitor, in order to supply a suitable design of the overall system. 2 The proposed Test System
A fuel cell test systems must provide flexible data acquisition, monitoring and control, to precisely handle fuel cell operations, such as: 1) the fuel utilization; 2) the air/oxygen utilization; 3) the cell
temperature and pressure; 4) the electrical load (current-voltage behavior). The control of parameters of reactants is required for the performance testing of a fuel cell based electric power generator [4]. The most important parameters of the gases are: mass flow rate, pressure, temperature and stoichiometry.
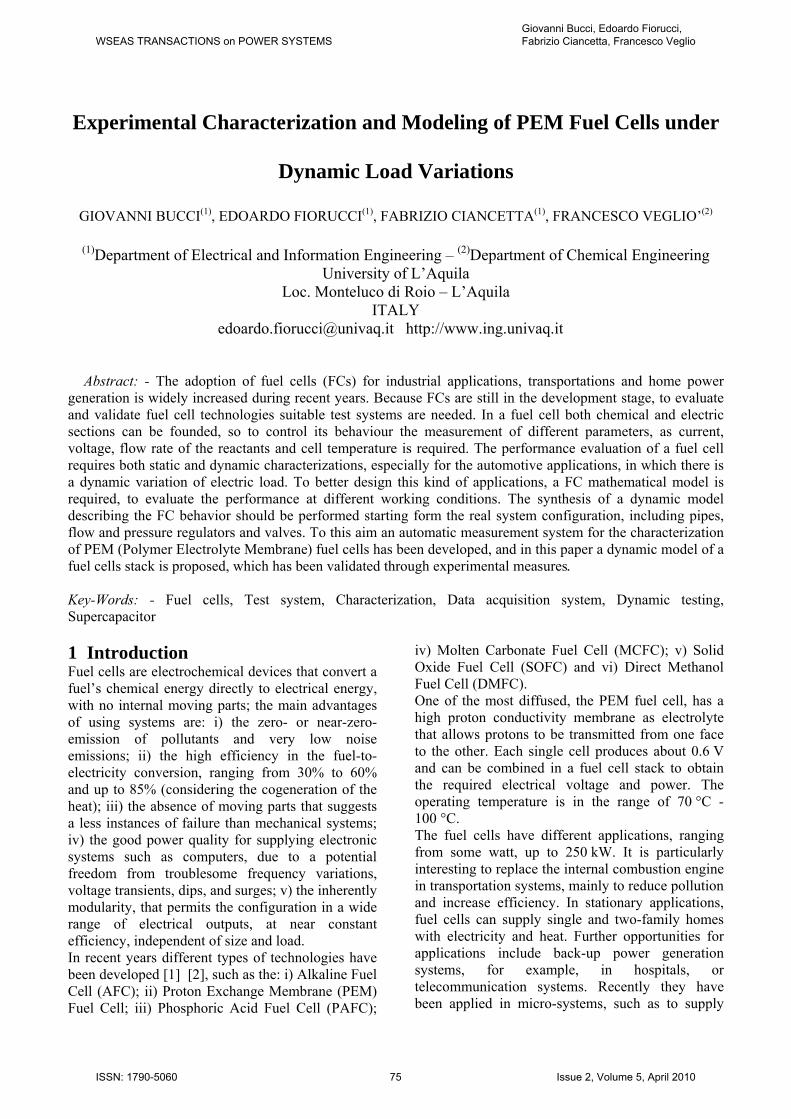
The Fig.1 shows the setup of the developed testing system. We supplied the cells with three gases: H2, N2 and filtered air, through three digital mass flow meters-controllers Bronkhorst DMFC Mod. F-201C-RAB-22V. These are micro controller based devices that measure and control the gas flow, ranging from 3 ml/min up to 1250 l/min; the accuracy is ± 0.5 % of reading plus ± 0.1 % of FS, the settling time 1 s. In a gas mixer the N2 can be mixed with H2 for testing the response to different stoichiometric values of reactants. Two electronic back-pressure controllers regulate the pressure of filtered air and H2-N2 mixture. A distilled water pump is used for the stack cooling; it requires about a 4 l/min water flow rate, for a supplied current of 25 A at 45 °C. All the described controllers are connected to a PC using RS-485 links and a RS-485 to RS-232 adapter. We measured the temperature of both the stacks and the reaction products with four J-type thermocouples, connected to a Fluke Hydra 2625A data logger. The communication with the host PC is performed via the RS-232 interface. The electric load at the fuel cell output was
Sw
itch
Boa
rd
Prog
ram
mab
leE
lect
roni
c Lo
ad--A
gile
nt N
3301
A--
Fig.1 The developed automatic testing system for two PEM stacks
WSEAS TRANSACTIONS on POWER SYSTEMSGiovanni Bucci, Edoardo Fiorucci, Fabrizio Ciancetta, Francesco Veglio
ISSN: 1790-5060 76 Issue 2, Volume 5, April 2010
implemented using the Agilent N3301A mainframe, with two N3302A electronic load modules. Each module has a current range of 0-30 A, a voltage range of 0-60 V and a maximum power of 150 W, @ 40 °C. This system allows constant current, constant voltage, constant resistance and transient modes to be implemented. The electronic load allows both current and voltage to be measured by the PC during the tests, by means of the IEEE 488 interface. The control and measurement software has been developed in the NI LabVIEW environment. It performs the following tasks: i) communication with the gas controllers via a DDE server, for both measurement and control of flow rate and pressure of the reactants; ii) serial communication with the Hydra data logger for the temperature measurement; iii) IEEE 488 communication with the Agilent electronic load for control and acquisition of current and voltage data; iv) definition of the testing procedures in terms of acquisition time, sampling rate, current shape; v) acquired data visualization and storage. Using this system we can carry out measurements in both stationary and transient conditions. We can also carry out endurance (life) tests. Through a simple user interface, the operator acts a precise control of reactant flow. In addition, fuel cell temperature, voltage, current and safety parameters are monitored. The safety is an important aspect to be considered in the design of a fuel cell application. Hydrogen is highly flammable and explosive and in high concentrations may cause asphyxiation and death, so there are hazards associated with its use, even if it has been utilized for decades in a wide variety of industrial applications. The autoignition temperature in air is relatively high (560°C), the volume concentrations for flammability in air is 4.1 – 74 %. Its risk level as a fuel at atmospheric pressure is similar to that of fuels such as natural gas and propane, however, it is a potentially dangerous substance because its low volumetric energy density requires high pressure and liquid storage. In designing the system we adopted some measures to minimize the safety hazards during the test activities. The gas cylinders were placed at the outside the laboratory, in a wide open cabinet, to avoid hazardous concentration of hydrogen and oxygen. A pipe transfers the gas to the lab, where Zellweger Analitycs gas monitors when detect a gas leakage, close the valve on the cabinet. 3 The PEM Fuel Cells Under Test The fuel cells can be linked in serial/parallel mode to implement high-power systems. To verify the
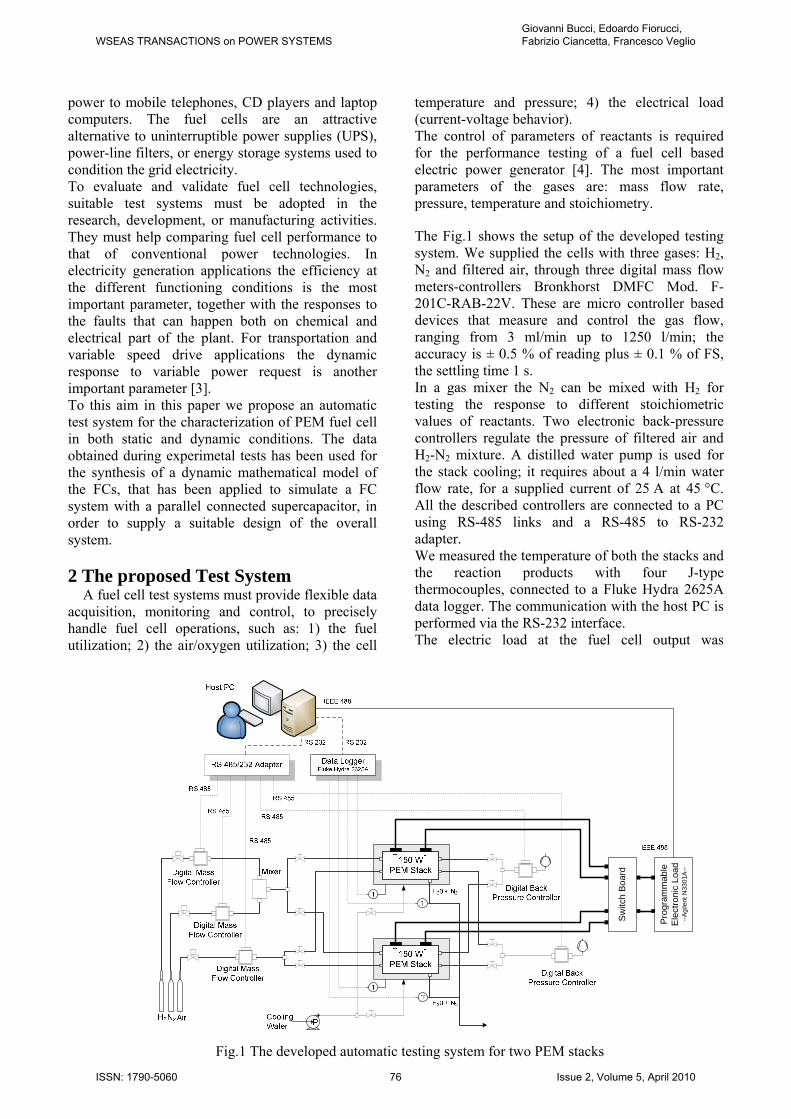
performance of the proposed measuring system we adopted two PEM stacks. PEM fuel cells require hydrogen and oxygen as inputs, though the oxidant may also be ambient air. Input gases must be humidified. They operate at a temperature lower than other FCs (limitations imposed by the thermal properties of the membrane), so they require cooling and management of the exhaust water to function properly. The PEM FCs can be contaminated by carbon monoxide, reducing the performance and damaging catalytic materials within the cell. Their main features of the cells under test,shown in Fig.2, are: i) 10 cells for each stack, ii) electrode area of 64 cm2, iii) nominal power of 150 W, iv) nominal voltage of 6 V, v) nominal current of 25 A, vi) reactants H2/air, reformate/air, H2/O2; vii) max operating temperature of 70 °C; viii) operating air pressure of 0-34.4 kPa; ix) operating H2 pressure of 0-34.4 kPa; x) self-humidified stack (no addition of outside water is required).
Fig. 2 One of the PEM FC stack under test
The electric power output of the stacks can be linked in both parallel and serial modes by a switch board, in order to evaluate the overall performance of a variable configuration FC system feeding a configurable electrical load. We carried out some measuremnt on the implemented test system in order to verify the overall system performance in terms of speed of operation. Specifically we measured the time required to measure or set up a test parameters, such as the H2 flow rate.
WSEAS TRANSACTIONS on POWER SYSTEMSGiovanni Bucci, Edoardo Fiorucci, Fabrizio Ciancetta, Francesco Veglio
ISSN: 1790-5060 77 Issue 2, Volume 5, April 2010
4 The Proposed Testing Procedures and the Experimental Results
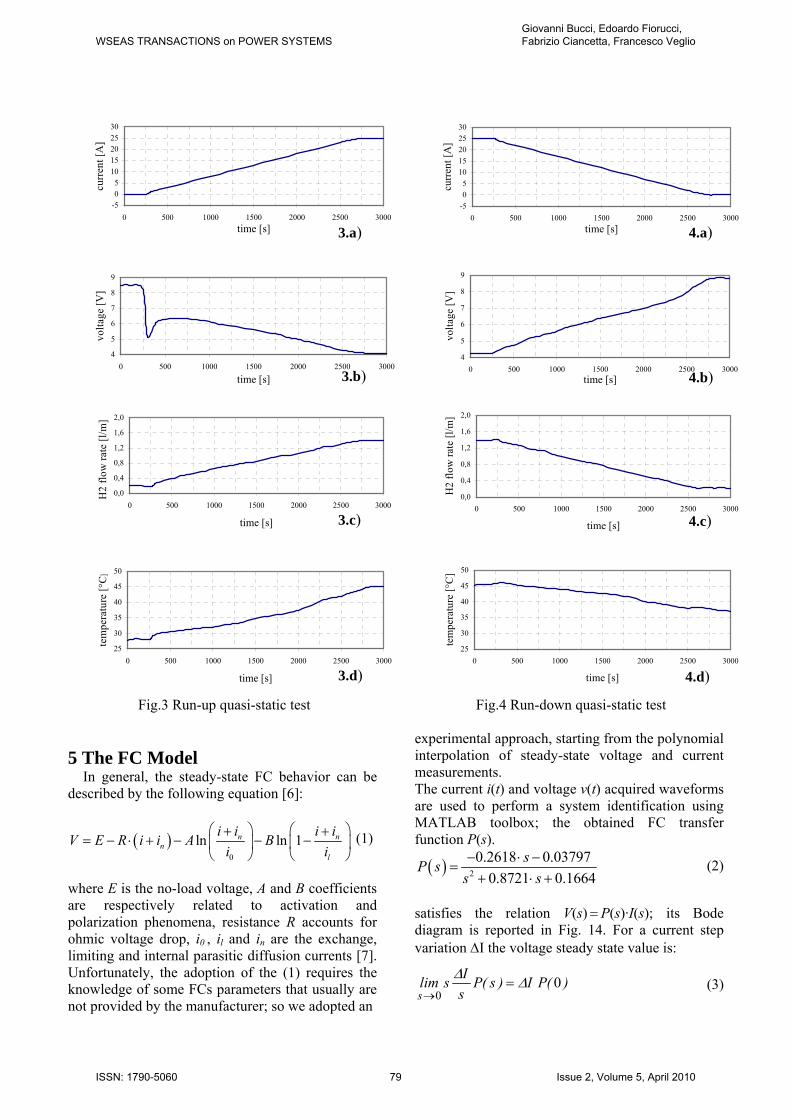
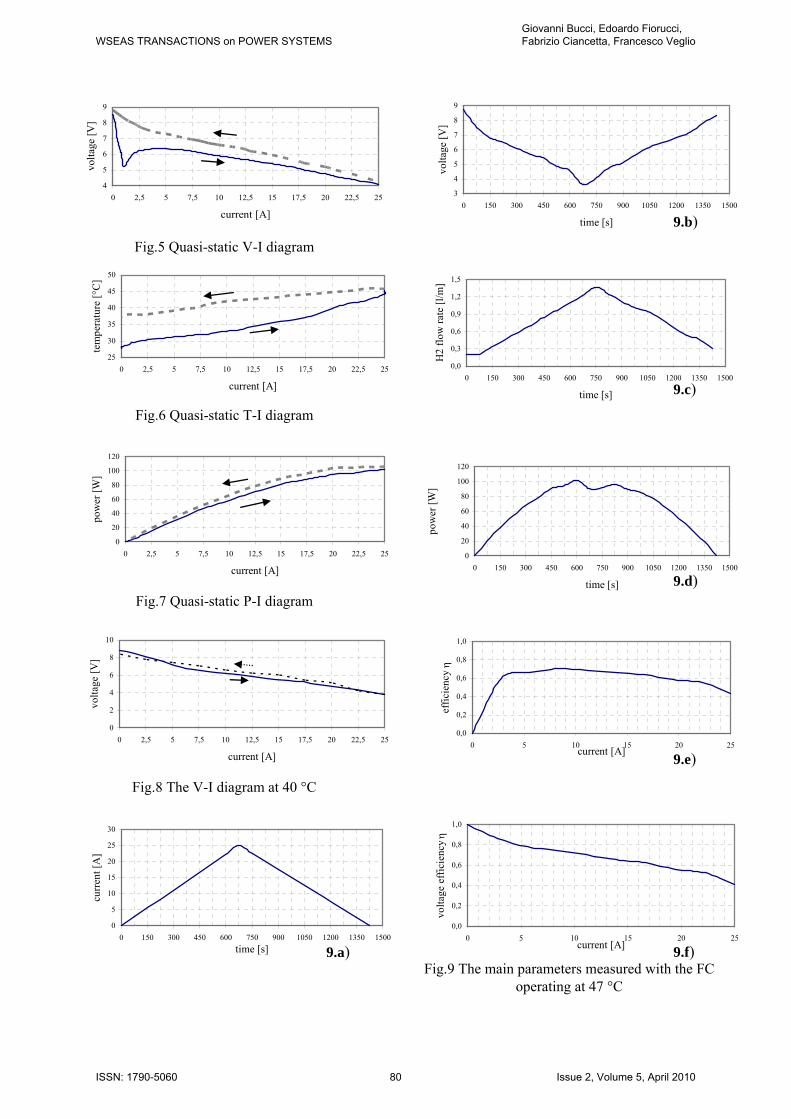
Today the testing procedures for the performance evaluation of the FCs are still matter of discussion, especially in transitory conditions. As an example, in the NIST Proposed Test Methodology and Performance Rating Standard for Residential Fuel Cell Systems [5], the transient electrical power testing is required only for grid-independent residential FC systems. On detail, the transitory testing procedures in [5] consist of reducing the electrical load in a step change (< 1 s) to minimum power and operating the system at minimum power for 15 min. The electrical load is then increased in a step change (< 1 s) to maximum power, operating at maximum power for 15 min. The cycle must be repeated 8 times for a total test duration of 4 h. This testing procedure can be considered as a first approach for the experimental characterization of FC systems, outlining a valid measuring method based on step-up and step-down load variations. In this paper, we decided to evaluate the performance of the fuel cells in heavier conditions, as required for automotive applications. Because fuel cells are still in the development stage, the automotive industry has not established standard testing procedure or equipment yet. Some tests have been proposed and conducted to characterize the described PEM fuel cells, investigating about both the steady state and transient features. Firstly we performed quasi-static run-up and run-down experiments for each stack, with the following test parameters: i) total observation time of 3000 s; ii) rising and falling ramps with a slew rate of 10 mA/s; iii) minimum current value of 0 A; iii) maximum current value of 25 A; iv) pressure and temperature of both air and H2 respectively of 15 kPa and 22 °C; v) constant air flow rate of 6 l/min; vi) dead-ended H2 operation. In the Figs. 3 and 4 an example of the measured current, voltage, H2 flow rate and temperature is reported. As expected, the H2 consumption waveform has a shape similar to the current one, with a delay due to the chemical kinetics. The voltage diagrams show an interesting difference between the increasing and decreasing waveforms, this hysteresis effect is evidenced in the diagram of Fig.5. Investigating about this effect we verified that it mainly depends on the temperature variation during the test (Fig.6) that influences the FC efficiency and, as a result, the amount of generated power (Fig.7). After fixing the FC temperature, by regulating the cooling water flow, the FC exhibited a similar behaviour during both the run-up and run-down tests (Fig.8). The Fig.9 shows
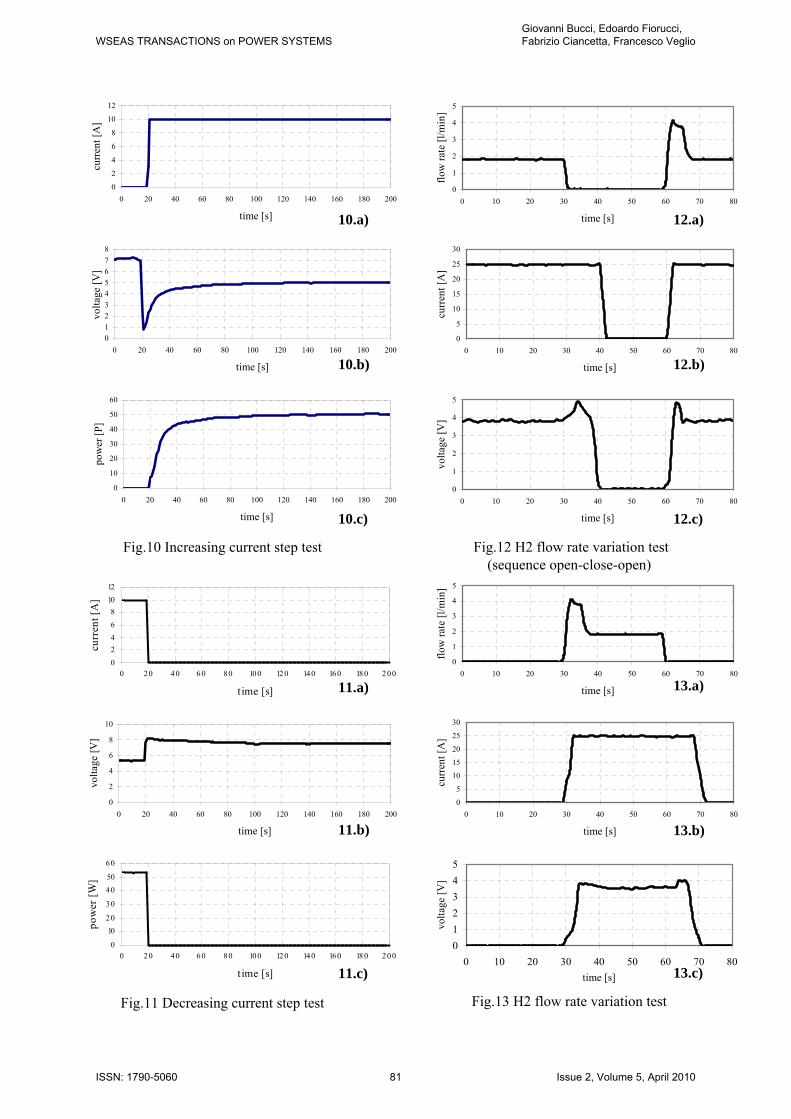
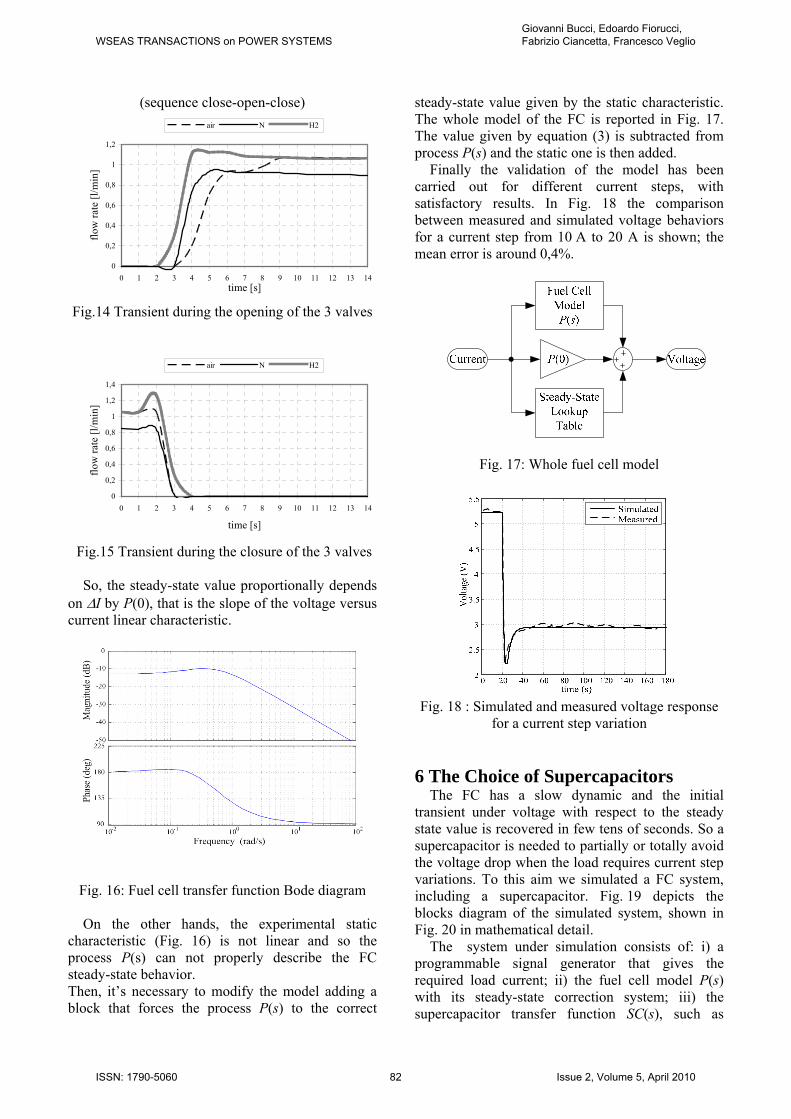
an example of the main parameters measured with the FC working at a temperature of 47°C. We reported also the fuel cell efficiency η, given by the ratio of the generated electric power to the supplied chemical power (Fig.9e). Another measure of the fuel cell efficiency is the voltage efficiency ε =Vstack / Vmax the ratio of the actual voltage under operating conditions Vstack to the theoretical maximum cell voltage Vmax (Fig.9f). Tests were conducted to simulate transient events. As first dynamic testing procedure, we performed sequential increasing and decreasing current steps. The pressure and temperature of both air and H2 were 30 kPa and 22 °C, respectively; the test was conducted in 200 s. The Fig. 10 shows a graph of the FC voltage and power, measured at 40 °C, for a current switching from 0 A to 10 A. The graph shows a fast reduction in the FC voltage after the current increase and then a slower successive increase, when the FC reacts to the load variation. The power increases to around 50 W, with a rise time of about 26 s. The undervoltage is about 4 V, with reference to the steady state value. Successively we conducted tests with a stepwise current reduction, as in the example of Fig.11, that shows a current switching from 10 A to 0 A. By considering the voltage amplitude, the FC behaviour is better than in the current increase, with an overvoltage of only about 1.5 V. We also performed other tests with full scale incresing and decreasing current pulses, programming different pulse widths, simulating the effect of an electronic load, such as an inverter. We performed dynamic tests with a variation of reactant flow rates, even if, for safety requirements, significative reductions of air flow rate with a full H2 consumption were avoided. The H2 flow rate variation test has been developed also for the evaluation of the cells beaviour in occurrence with fault in H2 control system. Two operating conditions have been implemented for the H2 flow control valve: the sequence open-close-open (Fig 12) and the sequence close-open-close (Fig.13). The duration of both the test was set to be 80 s; the duration of each valve state was 30 s; the air flow rate was 6.1 l/min. The electronic load was set to sinking a constant current of 25 A. The delay between the valve closure and the current drop is due to the H2 remaining in the pipes. We measured the delay time during the opening and closing of the valves to analyze the effects produced at each flow rate variation. The Figs 14-15 show the transient during the valves opening. The maximum flow rate is achieved after 2 s for the first valve (H2), and after 6 s for all. During the valve closing we measured lower delay times: 2 s for the first and 3 for all.
WSEAS TRANSACTIONS on POWER SYSTEMSGiovanni Bucci, Edoardo Fiorucci, Fabrizio Ciancetta, Francesco Veglio
ISSN: 1790-5060 78 Issue 2, Volume 5, April 2010
-505
1015202530
0 500 1000 1500 2000 2500 3000time [s]
curr
ent [
A]
4
5
6
7
8
9
0 500 1000 1500 2000 2500 3000
time [s]
volta
ge [V
]
0,0
0,4
0,8
1,2
1,6
2,0
0 500 1000 1500 2000 2500 3000
time [s]
H2
flow
rate
[l/m
]
25
30
35
40
45
50
0 500 1000 1500 2000 2500 3000
time [s]
tem
pera
ture
[°C ]
Fig.3 Run-up quasi-static test 5 The FC Model
In general, the steady-state FC behavior can be described by the following equation [6]:
( )0
ln ln 1n nn
l
i i i iV E R i i A Bi i
⎛ ⎞ ⎛+= − ⋅ + − − −⎜ ⎟ ⎜
⎝ ⎠ ⎝
⎞+⎟⎠
(1)
where E is the no-load voltage, A and B coefficients are respectively related to activation and polarization phenomena, resistance R accounts for ohmic voltage drop, i0 , il and in are the exchange, limiting and internal parasitic diffusion currents [7]. Unfortunately, the adoption of the (1) requires the knowledge of some FCs parameters that usually are not provided by the manufacturer; so we adopted an
-505
1015202530
0 500 1000 1500 2000 2500 3000time [s]
curre
nt [A
]
4
5
6
7
8
9
0 500 1000 1500 2000 25
3.a) 4.a)
00 3000time [s]
volta
ge [V
]
0,0
0,4
0,8
1,2
1,6
2,0
0 500 1000 1500 2000 25
3.b) 4.b)
00 3000
time [s]
H2
flow
rate
[l/m
]
25
30
35
40
45
50
0 500 1000 1500 2000 2500 3000
time [s]
tem
pera
ture
[°C
]
Fig.4 Run-down quasi-static test
3.c) 4.c)
3.d) 4.d)
experimental approach, starting from the polynomial interpolation of steady-state voltage and current measurements. The current i(t) and voltage v(t) acquired waveforms are used to perform a system identification using MATLAB toolbox; the obtained FC transfer function P(s).
( ) 2
0.2618 0.037970.8721 0.1664
sP ss s− ⋅ −
=+ ⋅ +
(2)
satisfies the relation V(s) = P(s)·I(s); its Bode diagram is reported in Fig. 14. For a current step variation ∆I the voltage steady state value is:
)(PI)s(PsIslim
s0
0∆∆
=→
(3)
WSEAS TRANSACTIONS on POWER SYSTEMSGiovanni Bucci, Edoardo Fiorucci, Fabrizio Ciancetta, Francesco Veglio
ISSN: 1790-5060 79 Issue 2, Volume 5, April 2010
4
5
6
7
8
9
0 2,5 5 7,5 10 12,5 15 17,5 20 22,5 25
current [A]
volta
ge [V
]
Fig.5 Quasi-static V-I diagram
25
30
35
40
45
50
0 2,5 5 7,5 10 12,5 15 17,5 20 22,5 25
current [A]
tem
pera
ture
[°C
]
Fig.6 Quasi-static T-I diagram
0
20
40
60
80
100
120
0 2,5 5 7,5 10 12,5 15 17,5 20 22,5 25
current [A]
pow
er [W
]
Fig.7 Quasi-static P-I diagram
0
2
4
6
8
10
0 2,5 5 7,5 10 12,5 15 17,5 20 22,5 25
current [A]
volta
ge [V
]
Fig.8 The V-I diagram at 40 °C
0
5
10
15
20
25
30
0 150 300 450 600 750 900 1050 1200 1350 1500time [s]
curre
nt [A
]
3
4
5
6
7
8
9
0 150 300 450 600 750 900 1050 1200 1350 1500
time [s]
volta
ge [V
]
9.b)
0,0
0,3
0,6
0,9
1,2
1,5
0 150 300 450 600 750 900 1050 1200 1350 1500
time [s]
H2
flow
rate
[l/m
]
9.c)
0
20
40
60
80
100
120
0 150 300 450 600 750 900 1050 1200 1350 1500
time [s]
pow
er [W
]
0,0
0,2
0,4
0,6
0,8
1,0
0 5 10 15 20 25current [A]
effic
ienc
y η
9.d)
9.e)
0,0
0,2
0,4
0,6
0,8
1,0
0 5 10 15 20 25current [A]
volta
ge e
ffici
ency
η
Fig.9 The main parameters measured with the FC operating at 47 °C
9.f) 9.a)
WSEAS TRANSACTIONS on POWER SYSTEMSGiovanni Bucci, Edoardo Fiorucci, Fabrizio Ciancetta, Francesco Veglio
ISSN: 1790-5060 80 Issue 2, Volume 5, April 2010
0
2
4
6
8
10
12
0 20 40 60 80 100 120 140 160 180 200
time [s]
curre
nt [A
]
012345678
0 20 40 60 80 100 120 140 160 180 200
time [s]
volta
ge [V
]
0
10
20
30
40
50
60
0 20 40 60 80 100 120 140 160 180 200
time [s]
pow
er [P
]
Fig.10 Increasing current step test
02468
1012
0 20 4 0 6 0 80 100 12 0 140 160 18 0 20 0
time [s]
curr
ent [
A]
0
2
4
6
8
10
0 20 40 60 80 100 120 140 160 180 200
time [s]
volta
ge [V
]
0
1020
30
4050
60
0 20 4 0 6 0 80 100 12 0 140 160 18 0 20 0
time [s]
pow
er [W
]
Fig.11 Decreasing current step test
0
1
2
3
4
5
0 10 20 30 40 50 60 70 80
time [s]
flow
rate
[l/m
in]
0
5
10
15
20
25
30
0 10 20 30 40 50 60 70 80
time [s]
curr
ent [
A]
0
1
2
3
4
5
0 10 20 30 40 50 60 70 80
time [s]
volta
ge [V
]
Fig.12 H2 flow rate variation test
10.a) 12.a)
10.b) 12.b)
10.c) 12.c)
(sequence open-close-open)
0
1
2
3
4
5
0 10 20 30 40 50 60 70 80
time [s]
flow
rate
[l/m
in]
0
5
10
15
20
25
30
0 10 20 30 40 50 60 70 80
time [s]
curr
ent [
A]
012345
0 10 20 30 40 50 60 70 80time [s]
volta
ge [V
]
Fig.13 H2 flow rate variation test
13.a) 11.a)
11.b) 13.b)
13.c) 11.c)
WSEAS TRANSACTIONS on POWER SYSTEMSGiovanni Bucci, Edoardo Fiorucci, Fabrizio Ciancetta, Francesco Veglio
ISSN: 1790-5060 81 Issue 2, Volume 5, April 2010
(sequence close-open-close)
0
0,2
0,4
0,6
0,8
1
1,2
0 1 2 3 4 5 6 7 8 9 10 11 12 13 14time [s]
flow
rate
[l/m
in]
air N H2
Fig.14 Transient during the opening of the 3 valves
0
0,2
0,4
0,6
0,8
1
1,2
1,4
0 1 2 3 4 5 6 7 8 9 10 11 12 13 14
time [s]
flow
rate
[l/m
in]
air N H2
Fig.15 Transient during the closure of the 3 valves So, the steady-state value proportionally depends
on ∆I by P(0), that is the slope of the voltage versus current linear characteristic.
Fig. 16: Fuel cell transfer function Bode diagram
On the other hands, the experimental static
characteristic (Fig. 16) is not linear and so the process P(s) can not properly describe the FC steady-state behavior. Then, it’s necessary to modify the model adding a block that forces the process P(s) to the correct
steady-state value given by the static characteristic. The whole model of the FC is reported in Fig. 17. The value given by equation (3) is subtracted from process P(s) and the static one is then added.
Finally the validation of the model has been carried out for different current steps, with satisfactory results. In Fig. 18 the comparison between measured and simulated voltage behaviors for a current step from 10 A to 20 A is shown; the mean error is around 0,4%.
Fig. 17: Whole fuel cell model
Fig. 18 : Simulated and measured voltage response
for a current step variation 6 The Choice of Supercapacitors
The FC has a slow dynamic and the initial transient under voltage with respect to the steady state value is recovered in few tens of seconds. So a supercapacitor is needed to partially or totally avoid the voltage drop when the load requires current step variations. To this aim we simulated a FC system, including a supercapacitor. Fig. 19 depicts the blocks diagram of the simulated system, shown in Fig. 20 in mathematical detail.
The system under simulation consists of: i) a programmable signal generator that gives the required load current; ii) the fuel cell model P(s) with its steady-state correction system; iii) the supercapacitor transfer function SC(s), such as
WSEAS TRANSACTIONS on POWER SYSTEMSGiovanni Bucci, Edoardo Fiorucci, Fabrizio Ciancetta, Francesco Veglio
ISSN: 1790-5060 82 Issue 2, Volume 5, April 2010
ISC(s) = SC(s) · VSC(s), placed on the feedback of the whole system.
Fig. 19: Blocks diagram of the simulated system
The supercapacitor model is defined by the
transfer function
( )1
C sSC sR C s
⋅=
⋅ ⋅ +, (4)
where C and R are respectively the capacitance and the equivalent series resistance of the supercapacitor. The simulation of a real supercapacitor has been performed by adopting the parameters in the data sheet of a commercial supercapacitor. The results show that the time constant RC is slightly affected by the capacitance values. The FC model has been utilized to evaluate the dynamic behaviour of the whole system when a supercapacitor is parallel connected. As an example of the dynamic system response, we performed a simulation in which the capacitance value was undersized (C = 5 F) for the analyzed current step variation (IS = 10 A), causing a transient under voltage for the fuel cell (Fig. 21) and a consequent negative transient current of the supercapacitor with a peak value ∆I (Fig. 22).
Fig. 20: Whole simulated system Implementing an automatic routine, we performed some simulations to correlate the fuel cell transient
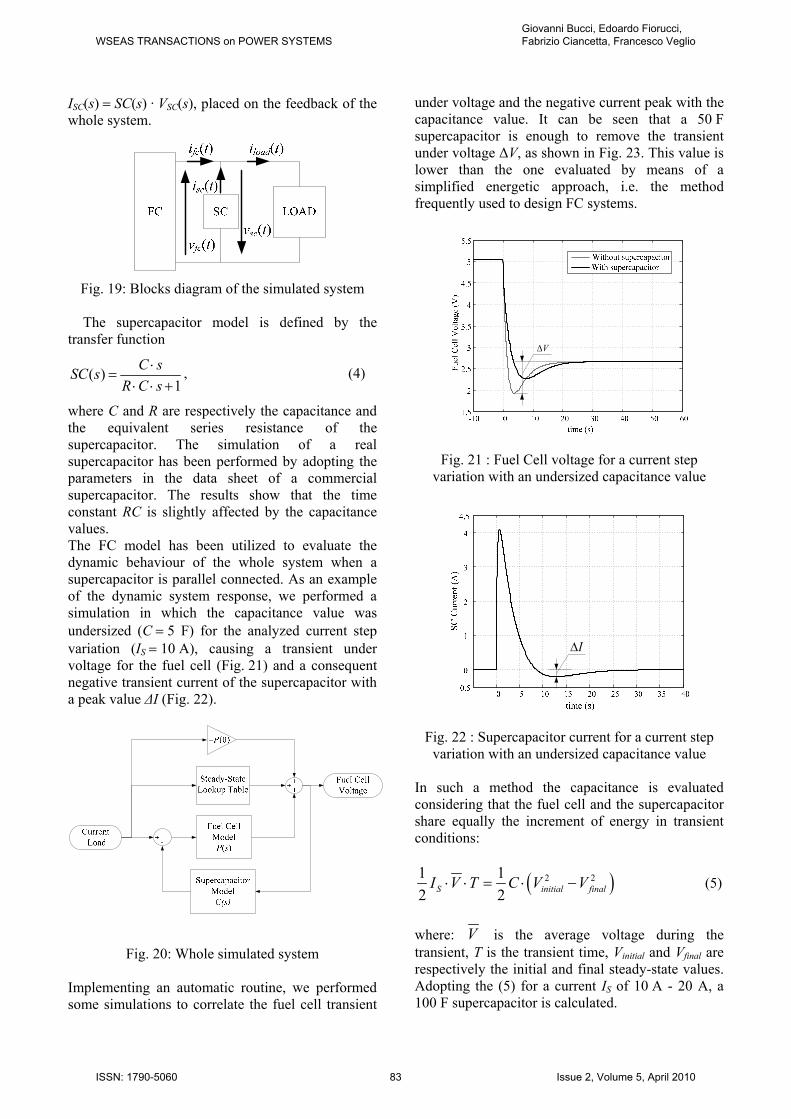
under voltage and the negative current peak with the capacitance value. It can be seen that a 50 F supercapacitor is enough to remove the transient under voltage ∆V, as shown in Fig. 23. This value is lower than the one evaluated by means of a simplified energetic approach, i.e. the method frequently used to design FC systems.
V∆
Fig. 21 : Fuel Cell voltage for a current step variation with an undersized capacitance value
I∆
Fig. 22 : Supercapacitor current for a current step variation with an undersized capacitance value
In such a method the capacitance is evaluated considering that the fuel cell and the supercapacitor share equally the increment of energy in transient conditions:
( 2 21 12 2S initial finalI V T C V V⋅ ⋅ = ⋅ − ) (5)
where: V is the average voltage during the transient, T is the transient time, Vinitial and Vfinal are respectively the initial and final steady-state values. Adopting the (5) for a current IS of 10 A - 20 A, a 100 F supercapacitor is calculated.
WSEAS TRANSACTIONS on POWER SYSTEMSGiovanni Bucci, Edoardo Fiorucci, Fabrizio Ciancetta, Francesco Veglio
ISSN: 1790-5060 83 Issue 2, Volume 5, April 2010
7 Conclusions The PEM fuel cells can be successfully adopted
for distributed generation of electric power, UPS and electric transportation applications. A high number of parameters have to be monitored for the complete control of a fuel cell based system. A static characterization is not exhaustive for applications like variable speed drives, when the duty cycle of the cells is heavy. We propose the described testing system for the dynamic characterization of PEM fuel cells, to obtain dynamic response diagrams adoptable in automatic control applications [8]. The data obtained during experimetal tests has been used for the synthesis of a dynamic numerical model of a stack of PEM fuel cells, and it has been used to simulate a FC system with a parallel connected supercapacitor in order to correlate the transient under voltage and the supercapacitor parameters, when the load requires current step variations [9]. In this it is possible to accurately estimate the minimum value of capacitance needed to obtain a given transient under voltage. Such a value is generally lower than that one evaluated by means of a simplified energetic approach, i.e. the method frequently utilized to design FC systems. References [1] M. W. Ellis, M. R. Von Spakovsky and D. J.
Nelson, “Fuel cell systems: efficient, flexible energy conversion for the 21st century”, Proceedings of the IEEE, Volume: 89 Issue: 12, Dec. 2001, pp. 1808-1818.
[2] M. A. Laughton, “Fuel cells”, Power Engineering Journal, Volume: 16 Issue: 1, Feb. 2002, pp.37-47.
[3] J. M. Correa, F. A. Farret and L. N. Canha, “An Analysis of the Dynamic Performance of Proton Exchange Membrane Fuel Cells Using an Electrochemical Model”, Proceedings of IEEE IECON’01, Vol.1, pp.141– 146.
[4] Yaw Chung Cheng, Win Hsiao Yuen, A. S. Lin and Jiann Tsarng Tsay, “Automation and control for the PAFC fuel cell components and the power plant”, Proc. of International IEEE/IAS Conference on Industrial Automation and Control: Emerging Technologies, 1995, pp.66-71.
[5] M. W. Davis, M. W. Ellis, B. P. Dougherty, Proposed Test Methodology and Performance Rating Standard for Residential Fuel Cell Systems, NIST, June 2006, NISTIR 7131.
[6] M. Andriollo, F. Castelli Dezza, M. Tamburrino, “Converter control strategies for
the power flow management in a fuel-cell supplied vehicle for the public city transportation”, Proc. of Symp. on Power Electronics, Electrical Drives, Automation and Motion, Speedam 2004, Capri, IT, June, 16-18 2004, Page(s):1801-1808.
[7] U.S. Dept. of Energy – Nat.l Energy Techn. Lab., Fuel Cell Handbook (5th ed.), October 2000.
[8] J. T. Pukrushpan, A. G. Stefanopoulou and Huei Peng, “Modeling and control for PEM fuel cell stack system”, Proc. of the American Control Conference, Anchorage (USA), May 8-10, 2002, Volume: 4M, pp.3117-3122.
[9] G. Bucci, F. Ciancetta, E. Fiorucci and F. Vegliò, “An Experimental Approach to the Modeling of PEM Fuel Cells in Dynamic Conditions”, Proc.of the IEEE Powertech, July, 1-5, Lausanne, Switzerland, pp.1094-1099.
WSEAS TRANSACTIONS on POWER SYSTEMSGiovanni Bucci, Edoardo Fiorucci, Fabrizio Ciancetta, Francesco Veglio
ISSN: 1790-5060 84 Issue 2, Volume 5, April 2010