Embed Size (px)
Citation preview
Chapter 2
Experimental Aspects of Laser Plasma Studies
This chapter deals with the general experimental methods followed in the study of laser
produced plasma. Details of the experimental setup used for the spectroscopic as well as
time resolved studies are discussed separately. The details of the various subsystems like
laser source, plasma chamber, monochromator, photomultiplier tube, boxcar averager
and storage oscilloscope used for the above measurements are also presented.
2.1 Introduction
The high power laser-material interaction initiates a luminous plasma in front of the
solid surface [1-3]. For the characterization of the photofragmented species in a plasma,
many spectroscopic tools are used including Laser Induced Fluorescence [4], Absorption
Spectroscopy [5], Mass Spectroscopy [6], Optical Emission Spectroscopy [7], Time Re
solved Spectroscopy [8] etc .. Of these the nonrestrictive methods to study the the laser
plasmas are mass spectrometry and optical emission spectroscopy. Compositional anal
ysis of the sample can be obtained directly by measuring the optical emission spectra
of the laser induced plasma (LIP). Optical emission spectroscopy technique is concerned
with the light emitted by electronically excited species in LIP produced in front of a
target surface. Also optical emission measurements are useful for species identification
and in situ monitoring during deposition [3]. Useful information about the elemental
composition of the target material can be obtained from the analysis of the emissions
emanating from the plasma plume.
In the present work, studies on plasma formed by the interaction of a focused Nd:YAG
laser beam on the graphite and YBa2Cu307 targets are described. LIP emission spec
tra consist of neutral atom and ionic lines superimposed on a spectrally broad band
continuum of radiation. The goal of the work was to obtain some understanding of the
processes occurring in the generation and expansion of the plasma. The plasma was char
acterized by emission spectra through space and time resolved techniques. The spectra
emitted by the laser ablated plasma vary depending upon the location of the region of
observation as well as the period of time after the impact of the laser pulse [9]. Thus
time and space resolved analysis of the LIP offer an excellent means to investigate their
evolution and dynamics.
In this chapter a comprehensive account of experimental technique for the optical
emission spectroscopic analysis of the laser produced plasma and the various subsystems
needed for the experiments are given. These experimental details are divided into two
sections. In the first section, the description of the various sub-systems like excitation
source, plasma chamber, detection and other setup for the recording the plasma spectrum
are described. In the second section, the experimental set-up for the space and time
resolved studies are mentioned.
57
2.2 Sub-systems used for the present studies
2.2.1 Laser Source
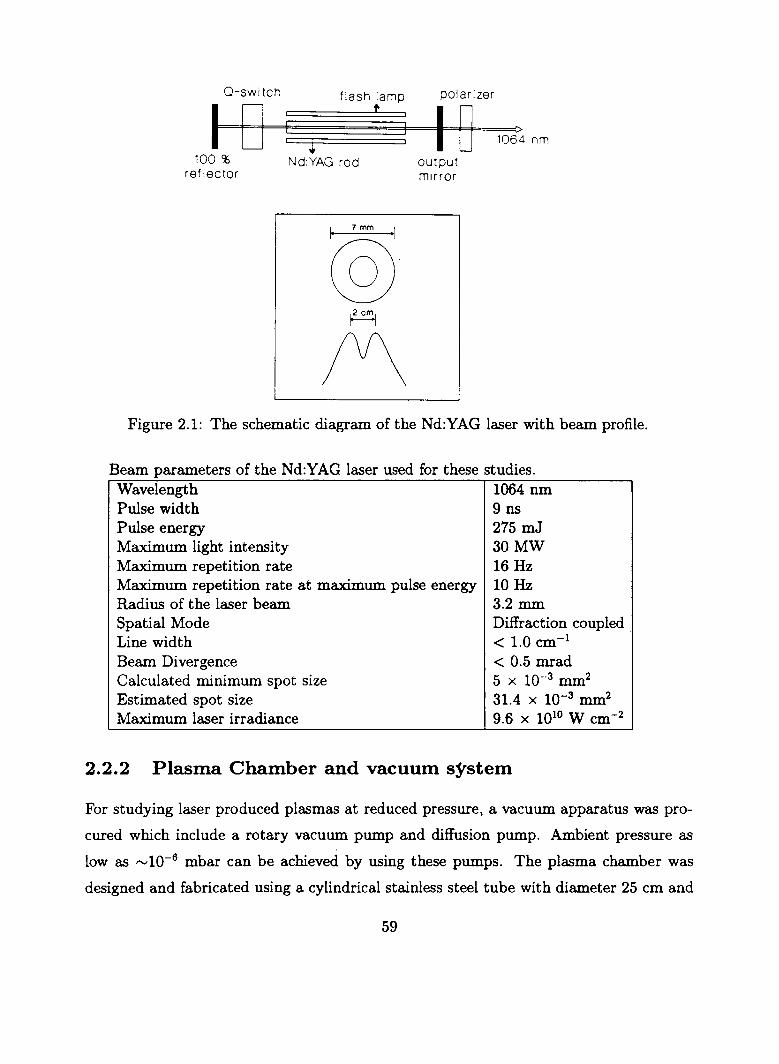
The laser used in our experiment is an electro-optically Q-switched Nd:YAG laser (Quanta
Ray DCR 11) having a fundamental out put of 1.06 J..Lm.
The optical cavity in the DCR-11 is an unstable resonator. In a stable resonator
the ray of light is traveling close to the optical axis and is reflected toward the optical
axis by its cavity mirrors, so it is always contained along the primary axis of the laser.
By contrast, a ray traveling in an unstable resonator can be reflected away from the
axis by one of the cavity mirrors. Stable resonators can only extract energy from a
small volume near the optical axis of the resonator, which limits the energy of the
output. Conversely, unstable resonators can have large beam diameters. Thus they
can efficiently extract energy from active media whose cross-sectional area is large, like
that of typical Nd:YAG laser rods. The output coupler in an unstable resonator is a
small high reflector mounted on a clear substrate which lies on the optical axis of the
resonator. Energy escapes from the resonator by diffracting around this dot, which
gives the "diffraction coupled resonator" (DCR) its name [10]. The diffraction coupled
resonator delivers a 'doughnut' shaped beam profile at 9 ns pulse width (FWHM) with
a power stability of ±4%. The laser beam has a typical lie width of < 1 cm-1 with 220
MHz spacing between the longitudinal modes and a beam divergence of < 0.5 mrad. Fig.
2.1 show the schematic diagram of the Nd:YAG laser with beam profile. The high peak
power of the Q-switched pulses permit frequency conversion in nonlinear crystals like
KD·P. By introducing appropriate crystals in the beam path, higher order harmonics
can be obtained. The 1064 nm fundamental interacts with the crystal to produce 532
nm wavelength. The resultant 532 nm wave can be doubled again by passing it through
a second crystal, which yields a 266 nm wave. It can also be mixed in KD' P with the
residual 1064 run to produce a 355 run wave.
When the fundamental wavelength 1.06 J..Lm is emitted in 9 ns pulses with pulse en
ergies up to 275 mJ is focused on a solid target, it produces power densities of the order
of 1010 Wcm-2 at the focal spot. This enormous amount of power density creates tran
sient plasma from the target surface. The laser provides trigger outputs to synchronize
oscilloscope, energy meter, boxcar etc ..
58
Q-switch flash lamp polarizer
I D t
I 0 :>
~ 1064 nm
100 % Nd:YAG rod output reflector mirror
r2 cm,
Figure 2.1: The schematic diagram of the Nd:YAG laser with beam profile.
Beam parameters of the Nd:YAG laser used for these studies. Wavelength 1064 nm Pulse width 9 ns Pulse energy 275 mJ Maximum light intensity 30 MW Maximum repetition rate 16 Hz Maximum repetition rate at maximum pulse energy 10 Hz Radius of the laser beam 3.2 mm Spatial Mode Diffraction coupled . Line width < 1.0 cm-1
Beam Divergence < 0.5 mrad Calculated minimum spot size 5 x 10⁻³ mm2
Estimated spot size 31.4 x 10⁻³ mm2
Maximum laser irradiance 9.6 x 10¹⁰ W cm-2
2.2.2 Plasma Chamber and vacuum system
For studying laser produced plasmas at reduced pressure, a vacuum apparatus was pro
cured which include a rotary vacuum pump and diffusion pump. Ambient pressure as
low as ",10-6 mbar can be achieved by using these pumps. The plasma chamber was
designed and fabricated using a cylindrical stainless steel tube with diameter 25 cm and
59
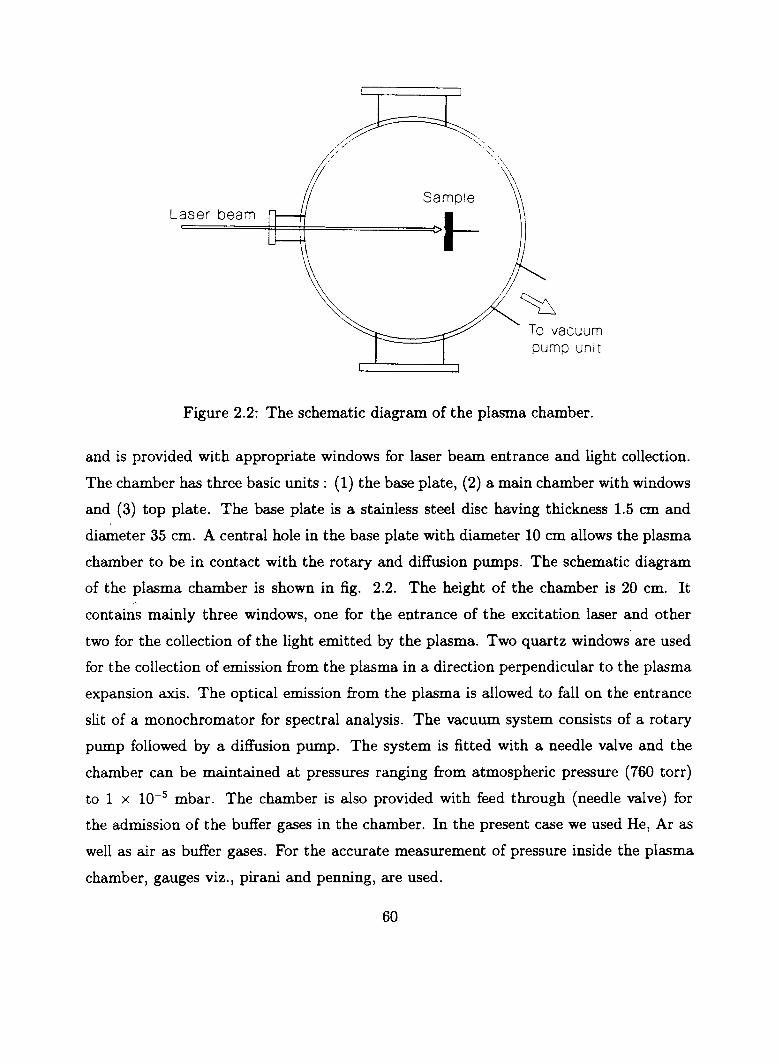
Sample Laser beam L =H===#=======C>,-
To vacuum pump unit
Figure 2.2: The schematic diagram of the plasma chamber.
and is provided with appropriate windows for laser beam entrance and light collection.
The chamber has three basic units: (1) the base plate, (2) a main chamber with windows
and (3) top plate. The base plate is a stainless steel disc having thickness 1.5 cm and
diameter 35 cm. A central hole in the base plate with diameter 10 cm allows the plasma
chamber to be in contact with the rotary and diffusion pumps. The schematic diagram
of the plasma chamber is shown in fig. 2.2. The height of the chamber is 20 cm. It
contains mainly three windows, one for the entrance of the excitation laser and other
two for the collection of the light emitted by the plasma. Two quartz windows are used
for the collection of emission from the plasma in a direction perpendicular to the plasma
expansion axis. The optical emission from the plasma is allowed to fall on the entrance
slit of a monochromator for spectral analysis. The vacuum system consists of a rotary
pump followed by a diffusion pump. The system is fitted with a needle valve and the
chamber can be maintained at pressures ranging from atmospheric pressure (760 torr)
to 1 X 10⁻⁵ mbar. The chamber is also provided with feed through (needle valve) for
the admission of the buffer gases in the chamber. In the present case we used He, Ar as
well as air as buffer gases. For the accurate measurement of pressure inside the plasma
chamber, gauges viz., pirani and penning, are used.
60
2.2.3 Target Holder
The solid target used in the present investigations were glued onto a sample holder which
itself is mounted on to a externally controlled DC motor. The rotation of the sample
about an axis parallel to the laser beam avoid errors due to local heating and drilling by
providing fresh surface for ablation.
2.2.4 Monochromators
Monochromators are widely used for analyzing the light emitted from another device or
process, and for observing the effects of specific wavelengths of light transmitted through
various materials. The specifications for the performance of a monochromator include the
dispersion and the stray light levels. Generally the dispersion is given in nm/mm, where
the slit width is expressed in mm. In selecting monochromator for emission spectroscopy,
one looks for low stray light levels to avoid problems due to scattered stray light. Stray
light is defined as any light which passes through the monochromator besides that of
the desired wavelength. In addition, monochromators are chosen for high efficiency to
maximize the ability to detect low light levels. The slit widths are generally variable and
a typical monochromator will have both an entrance and an exit slit. The light intensity
which passes through a monochromat or is approximately proportional to the square of
the slit width. Larger slit widths yield increased signal levels, and therefore higher signal
to noise (SIN) ratios. Smaller slit widths yield higher resolution, but at the expense
of light intensity. A small slit width is used to increase precision of the wavelength
determination and to decrease the light intensity. Grating monochromators may have
planar or concave gratings. Planar gratings are usually produced mechanically and may
contain imperfections in some of the grooves. Concave gratings are usually produced
by holographic and photoresist methods, and imperfections are rare. Imperfections of
the gratings are major source of stray light transmission by the monochromators, and of
ghost images from the grating. For this reason the holographic gratings are preferable for
emission spectroscopy. Another important characteristic of the grating monochromators
is that the transmission efficiency depends upon polarization of the light. Therefore
the emission spectrum of the sample can be shifted in wavelength and altered in shape,
depending upon the polarization conditions chosen to record. In the present work we
used the following two monochromators:
61
2.2.4.1. Spex
Spex Model 1704 is a 1 meter scanning spectrometer having a maximum resolution I"v
0.05 AO [11]. The monochromator covers a spectral range 350 - 950 nm using a grating
with 1200 grooves per mm blazed at 500 nm and spectral band pass 0.1 AO. The entrance
and exit slits on the front of the spectrometer are controlled by micrometer type knob
above the slits. The scan rate of the monochromator is adjusted by using microprocessor
controlled Spex compudrive (CD2A) arrangement. Spex compudrive has got a key board
control over the spectrometer which not only provides repeat scan over the spectral
regions but also gives the scan status and spectrometer position. So using this system
one can easily tie into a dialog with the detector electronics system. The main advantages
of CD2A compudrive are, we can programme the start and end positions of the scan,
rate, repetitions, delay between repetitions, recorder scale and marker frequency [12].
The output of the Spex monochromat or is coupled to a thermoelectrically cooled
photomultiplier tube (Thorn EMI, model KQB 9863, rise time 2 ns).
2.2.4.2. Jarrell Ash
Jarrell-Ash 82-000 is a 0.5 meter Ebert scanning monochromator having a maximum
resolution of 0.02 nm [13]. The monochromator covers a spectral range of 200 nm to 1600
nm with tree interchangeable grating blazed at 180 nm, 500 nm and 750 nm respectively.
This instrument provides a smooth scanning motion in eight speeds ranging from 0.2
nm/minute to 50 nm/min. The output from the Jarrell-Ash monochromator is detected
by an EMI, model 9683 KQB photomultiplier tube that can be directly mounted at the
exit face of the monochromator. Model 9683 is a head-on type PMT having an S-20
cathode, and performs well in the 300-800 region.
2.2.5 The Photomultiplier Tube
The photomultiplier tube (PMT) is a very versatile and sensitive detector of radiant
energy in the ultra-violet, visible, and near-infrared regions of the electromagnetic spec
trum. Among the oldest detector technologies (first developed in the mid 1930s), PMTs
use vacuum rather than solid-state techniques to multiply electrons generated by pho
tons. They are widely used in research activities ranging from biomedicine to astronomy
as well as in medical diagnostic technology, environmental monitoring and aerospace.
62
For a large number of applications the PMT is the most practical sensitive detector
available. The basic reason for the superiority of the PMT is the secondary-emission am
plification which makes them uniquely sensitive among photosensitive devices currently
used. The basic radiation sensor is the photocathode which is located inside a vacuum
envelope. Light passes through an input window and strikes the photocathode, leading to
the emission of photoelectrons into an evacuated tube. Photoelectrons are emitted and
directed by an appropriate electric field to an electrode or dynode within the envelope.
A number of secondary electrons are emitted at this dynode for each impinging primary
photoelectron. These secondary electrons in turn are directed to a second dynode and so
on until a final gain of perhaps 106 is achieved [14]. The electrons from the last dynode
are collected by an anode which provides the signal current that is read out.
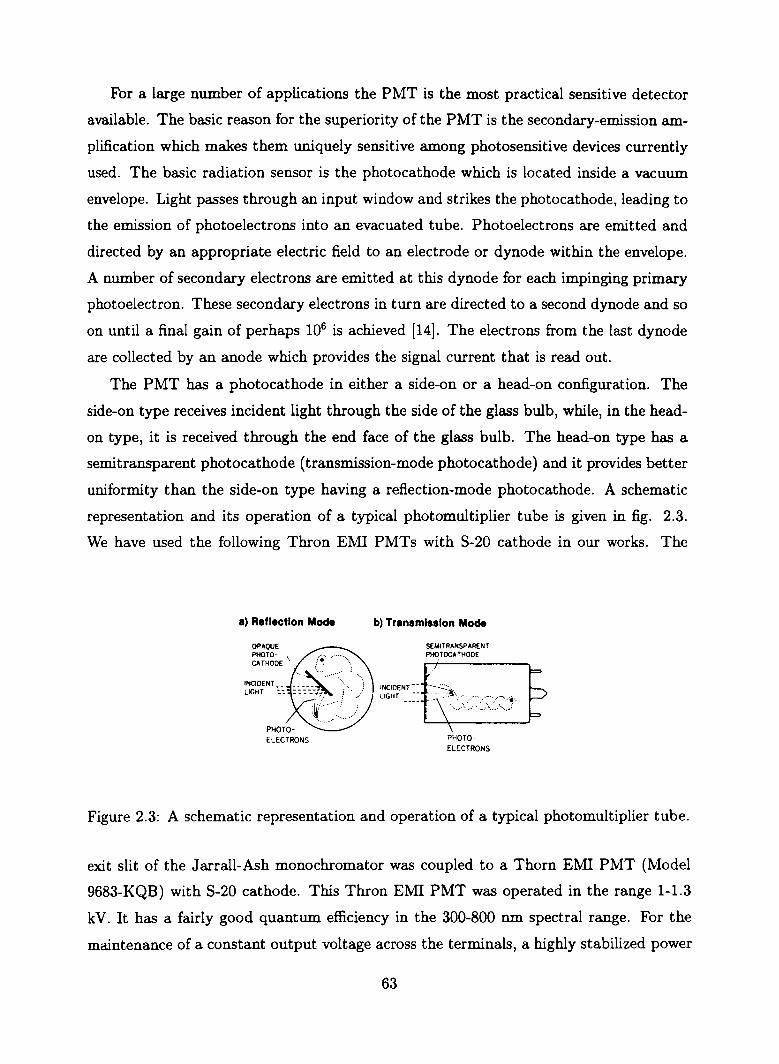
The PMT has a photocathode in either a side-on or a head-on configuration. The
side-on type receives incident light through the side of the glass bulb, while, in the head
on type, it is received through the end face of the glass bulb. The head-on type has a
semi transparent photocathode (transmission-mode photocathode) and it provides better
uniformity than the side-on type having a reflection-mode photocathode. A schematic
representation and its operation of a typical photomultiplier tube is given in fig. 2.3.
We have used the following Thron EM! PMTs with S-20 cathode in our works. The
a) Reflection Mode
oPAQUE PHOTOCATHODE \
PHOTOELECTRONS
b) Transmission Mode
INCIDENT LIGHT
SEMITRANsPARENT PHOTOCA THODE
......... /- .. / .. ' ...... . .......... ~ ......... \.: ........... .
PHOTOELECTRONS
Figure 2.3: A schematic representation and operation of a typical photomultiplier tube.
exit slit of the Jarrall-Ash monochromator was coupled to a Thorn EMI PMT (Model
9683-KQB) with S-20 cathode. This Thron EMI PMT was operated in the range 1-1.3
kV. It has a fairly good quantum efficiency in the 300-800 nm spectral range. For the
maintenance of a constant output voltage across the terminals, a highly stabilized power
63
supply (Thron EMI PM 28B) was fed to the PMT. The tube has an air-cooled, RF
shielded housing.
The Spex monochromator was coupled to a thermoelectrically cooled (- 50 OC) Thron
EMI photon counting PMT with S20 cathode (quantum efficiency 22 %). The operating
voltage for this PMT was 1.7-2.1 kV.
2.2.6 Energy Meter
It is important to measure the energy incident on the target surface accurately. The
Energy meter used in the present work is the Delta Developments Pulsed Laser Energy
Monitor. This on-line energy monitor uses a polarization compensated beam splitter to
sample the beam, 90 % of which is transmitted [15]. The sampled beam strikes a retro
reflecting diffuser and reaches the photo-diode via a "Range Plate" which attenuates
the light appropriately for the range of energies being measured. The geometry of the
energy meter is such that all positions on the diffuser give equal signals. Different Range
Plates can be used for different energies or laser wavelengths. Each range plate gives
a factor of 30 in the energy giving full scale deflection. A switch allows readings to be
referred to either the energy entering or the energy leaving the instrument. BNC sockets
provide pulse shape, pulse energy, trigger input, trigger output etc.. The energy meter
can be triggered externally with laser pulses or internally. The wavelength response of
the energy meter is from 200 nm to 1100 nm.
2.2.7 Digital Storage Oscilloscope
A digital storage oscilloscope (DSO, 200 MHz, Iwatsu Model DS-8621) was used to
monitor the signal from the photomultiplier tube. The oscilloscope can be triggered both
internally and externally. In the present work it was triggered externally using Nd:YAG
laser pulses. It is provided with averaging facility. The pulse shapes can be digitally
stored and plotted. The oscilloscope is necessary for measuring time delays of different
species in the laser produced plasma. The oscilloscope trace of the PMT response of the
plasma emission from the target shows a definite time delay between the incident laser
pulse and the onset of emission from a particular species. The storage oscilloscope is also
required while setting the gate width and delay of the gated integrator. The DSO has
facilities to capture and store the pulse shapes for later analysis and to obtain a hard
copy using a plotter/printer [16].
64
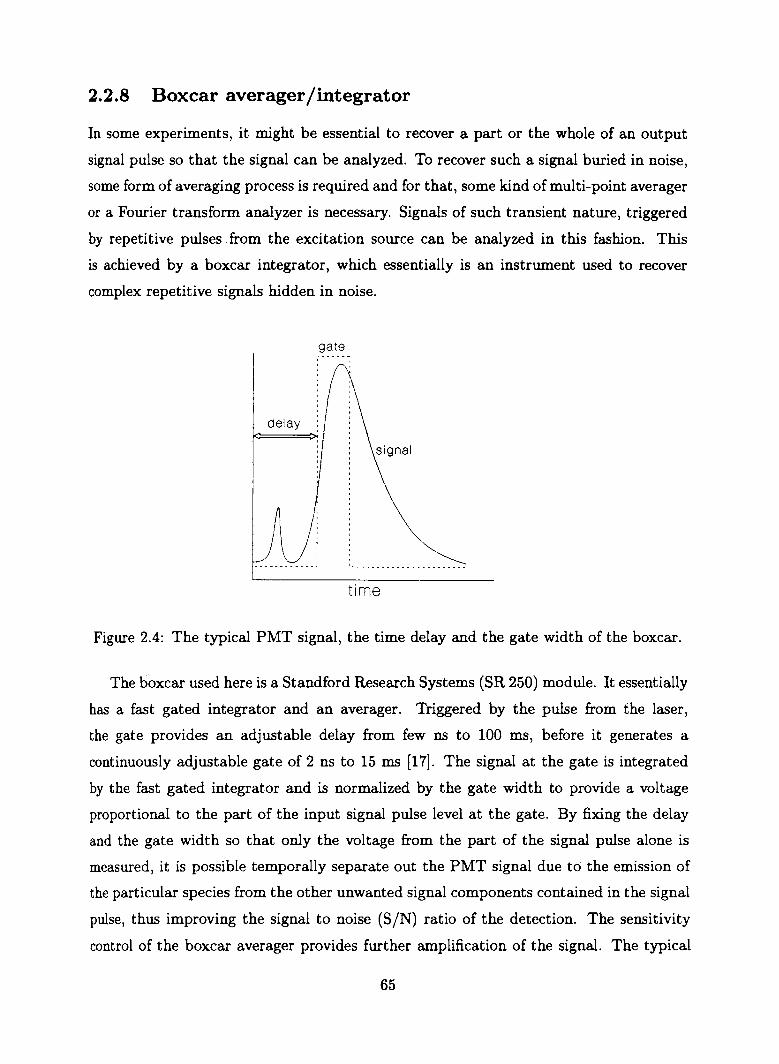
2.2.8 Boxcar aver age r /integrator
In some experiments, it might be essential to recover a part or the whole of an output
signal pulse so that the signal can be analyzed. To recover such a signal buried in noise,
some form of averaging process is required and for that, some kind of multi-point averager
or a Fourier transform analyzer is necessary. Signals of such transient nature, triggered
by repetitive pulses. from the excitation source can be analyzed in this fashion. This
is achieved by a boxcar integrator, which essentially is an instrument used to recover
complex repetitive signals hidden in noise.
gate
time
Figure 2.4: The typical PMT signal, the time delay and the gate width of the boxcar.
The boxcar used here is a Standford Research Systems (SR 250) module. It essentially
has a fast gated integrator and an averager. Triggered by the pulse from the laser,
the gate provides an adjustable delay from few ns to 100 ms, before it generates a
continuously adjustable gate of 2 ns to 15 ms [17]. The signal at the gate is integrated
by the fast gated integrator and is normalized by the gate width to provide a voltage
proportional to the part of the input signal pulse level at the gate. By fixing the delay
and the gate width so that only the voltage from the part of the signal pulse alone is
measured, it is possible temporally separate out the PMT signal due to the emission of
the particular species from the other unwanted signal components contained in the signal
pulse, thus improving the signal to noise (SjN) ratio of the detection. The sensitivity
control of the boxcar averager provides further amplification of the signal. The typical
65
PMT signal, the time delay and the gate width of the boxcar are shown in fig. 2.4.
A moving exponential average over 1 to 10,000 samples is available at the averaged
output. This traditional averaging technique is useful for pulling out small signals from
noisy backgrounds. Typically the signals are averaged over 10 pulses. Averaging over
very large number of pulses does increase SIN ratio, but makes the system very sluggish
in response to fast variation in the signal. In addition to the traditional technique, the
averaging circuitry may be used to actively subtract a baseline drift or background from
the signal.
2.2.9 Chart Recorder
The Analog - Digital X - Y plotter used in these experiments was manufactured by
Rikadenki Kogyoco Ltd., Japan. This is a high performance DC Servo system X-Y
recorder with added digital plotter function [18]. In digital mode, title, scale, data etc.
can be added to this recording. We used the Chart recorder with its analog mode. In
analog mode, the input analog signal is recorded directly by a pen writing.
In analog mode, the Chart recorder provides high performance, high-speed X-Y
recorder function. The X-output and the averaged output sockets of the boxcar av
erager lintegrator were connected to the X and Y terminals of the chart recorder respec
tively for recording the plasma emission spectrum..
2.3 Emission Spectroscopy
When high intensity laser light is focused on a solid target surface, the target surface
will get vapourized and a plasma is formed at the surface. The distribution of the
plasma is due to the shock wave propagation. The shock wave is created initially at the
sample surface and propagated along the axial direction [19]. A block diagram of the
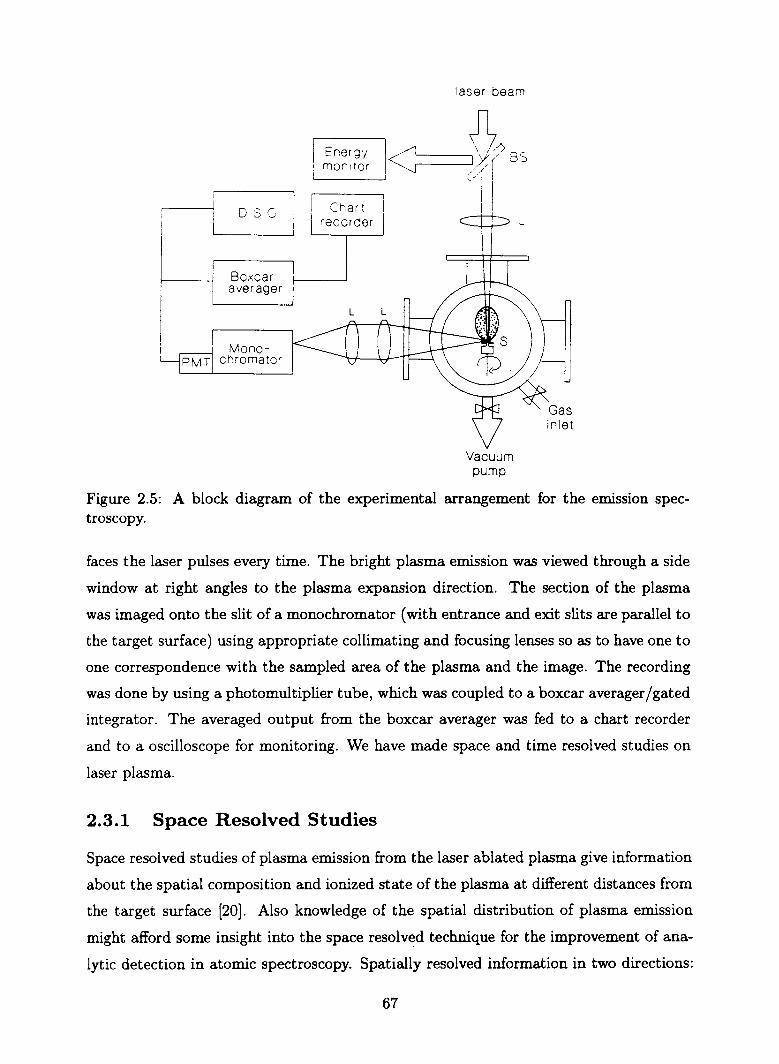
experimental arrangement for the emission spectroscopy is shown in fig. 2.5. The laser
pulse used in the experiment was produced by a Q-switched Nd:YAG laser system with
a pulse duration (FWHM) of 9 ns. By focusing the laser pulses onto the sample surface,
it is possible to get a transient plasma above the sample surface. The target in the
form of a disc is placed in an evacuated chamber provided with optical windows for laser
irradiation and spectroscopic observation of the plasma produced from the target. The
target was continuously rotated with an external motor so that the fresh solid surface
66
DSC
Boxcar averager
Monochromator
laser beam
Vacuum pump
Figure 2.5: A block diagram of the experimental arrangement for the emission spectroscopy.
faces the laser pulses every time. The bright plasma emission was viewed through a side
window at right angles to the plasma expansion direction. The section of the plasma
was imaged onto the slit of a monochromator (with entrance and exit slits are parallel to
the target surface) using appropriate collimating and focusing lenses so as to have one to
one correspondence with the sampled area of the plasma and the image. The recording
was done by using a photomultiplier tube, which was coupled to a boxcar averager/gated
integrator. The averaged output from the boxcar averager was fed to a chart recorder
and to a oscilloscope for monitoring. We have made space and time resolved studies on
laser plasma.
2.3.1 Space Resolved Studies
Space resolved studies of plasma emission from the laser ablated plasma give information
about the spatial composition and ionized state of the plasma at different distances from
the target surface [20]. Also knowledge of the spatial distribution of plasma emission
might afford some insight into the space resolv~d technique for the improvement of ana
lytic detection in atomic spectroscopy. Spatially resolved information in two directions:
67
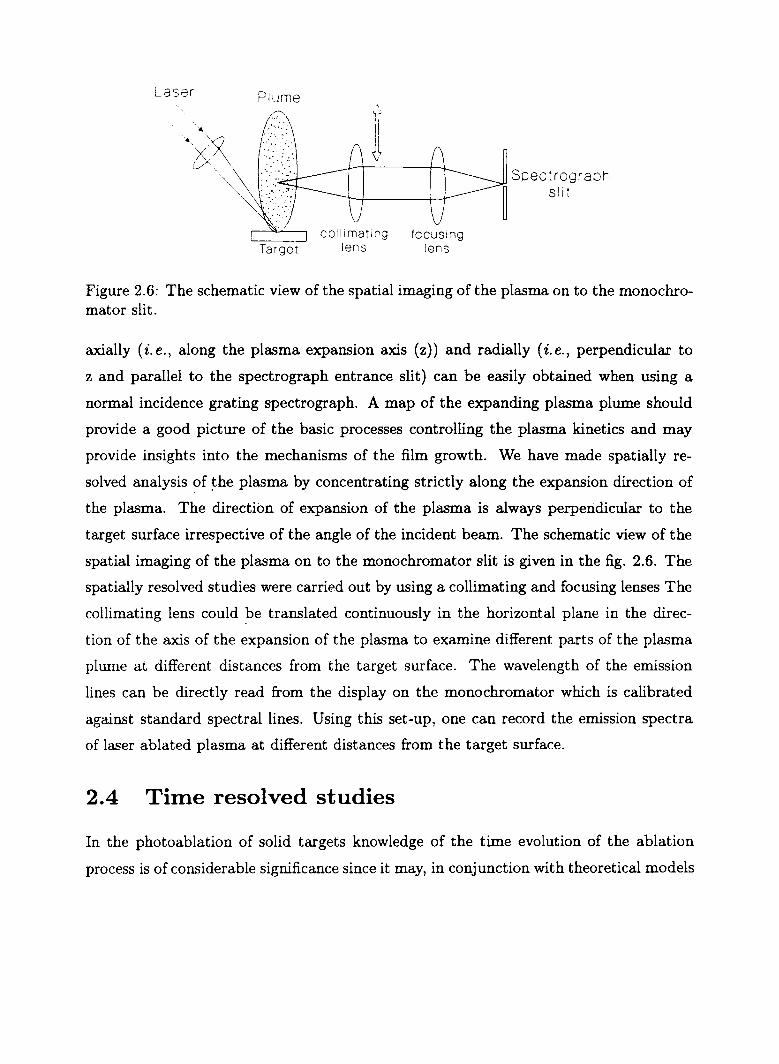
Laser Plume
Spectrograprl
~ slit
COllimatl0Q focuSing Target lens lens
Figure 2.6: The schematic view of the spatial imaging of the plasma on to the monochromator slit.
axially (i. e., along the plasma expansion axis (z)) and radially (i. e., perpendicular to
z and parallel to the spectrograph entrance slit) can be easily obtained when using a
normal incidence grating spectrograph. A map of the expanding plasma plume should
provide a good picture of the basic processes controlling the plasma kinetics and may
provide insights into the mechanisms of the film growth. We have made spatially re
solved analysis of ~he plasma by concentrating strictly along the expansion direction of
the plasma. The direction of expansion of the plasma is always perpendicular to the
target surface irrespective of the angle of the incident beam. The schematic view of the
spatial imaging of the plasma on to the monochromator slit is given in the fig. 2.6. The
spatially resolved studies were carried out by using a collimating and focusing lenses The
collimating lens could ?e translated continuously in the horizontal plane in the direc
tion of the axis of the expansion of the plasma to examine different parts of the plasma
plume at different distances from the target surface. The wavelength of the emission
lines can be directly read from the display on the monochromator which is calibrated
against standard spectral lines. Using this set-up, one can record the emission spectra
of laser ablated plasma at different distances from the target surface.
2.4 Time resolved studies
In the photoablation of solid targets knowledge of the time evolution of the ablation
process is of considerable significance since it may, in conjunction with theoretical models
[21] helps to resolve uncertainties in the interaction mechanism and thus lead to improved
understanding of this phenomenon which has importance in practical applications [22].
The results throw much light on the complex recombination process in a laser ablated
plasma. Time resolved emission spectroscopy can be used to measure the expansion
velocities of atomic, molecular and ionic species. Measurement of the number density and
internal energy as well as the kinetic energy distributions of the evaporants is important
in understanding the fundamental physics of the epitaxial film formation process.
In the present studies, time resolved analysis of the plasma emission spectra were
carried out by scanning the gate of the boxcar averager through the required temporal
regions by adjusting the delay.
2.4.1 Time of flight (TOF) spectroscopic studies
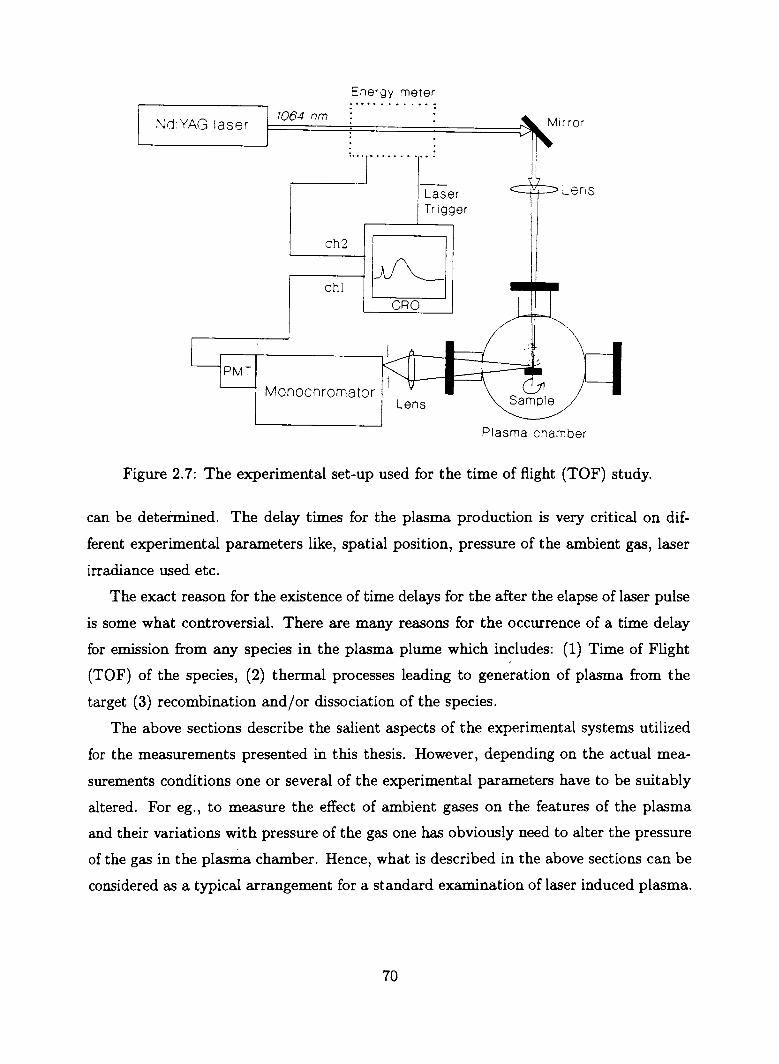
The experimental set-up for the time of flight study is given in fig. 2.7. For these studies,
the output from the PMT is directly connected to a digital storage oscilloscope with 50
n termination. In order to study the time evolution of a particular species produced
during the laser ablation process, the characteristic lines were easily selected using a
monochromator and the PMT output was fed to a fast storage oscilloscope. This setup
essentially provides delay as well as decay times for emission from constituent species at
a specific point within the plasma and these are extremely important parameters related
to the evolution of laser ablated materials in a direction normal to the target surface.
The time resolved studies of the plasma give vital information regarding the time taken
fqr a particular state of the constituent to evolve after the plasma is formed. Thus this
measurement is important for obtaining knowledge of complicated ablation and trans
port processes occurring in the plasma produced by the laser ablation technique [22].
The oscilloscope trace of the PMT response of the emission from different species in the
plasma shows a noticeable time delay between the incident laser pulse on the target and
the onset of emission from a particular species. All time delays are measured with respect
to the laser trigger pulse which coincides with the incident laser pulse. Each temporal
profile represents a complex convolution of different factors that govern the temporal
history of the emitting species viz. its production mechanism and rate, its flight past
the viewing region and its radiative and collisional decay rates. With the knowledge of
spatial separation from the target surface, one can directly convert the time of flight
distribution of any species into velocity distribution from which translation temperature
69
NdYAG laser
Energy meter
1064 nm
Laser Tr igger
ch2 ~ .---------4 ~
ch! eRO
Monochromator Lens
-j.4-~Lens
Plasma chamber
Figure 2.7: The experimental set-up used for the time of flight (TOF) study.
can be deteimined. The delay times for the plasma production is very critical on dif
ferent experimental parameters like, spatial position, pressure of the ambient gas, laser
irradiance used etc.
The exact reason for the existence of time delays for the after the elapse of laser pulse
is some what controversial. There are many reasons for the occurrence of a time delay
for emission from any species in the plasma plume which includes: (1) Time of Flight
(TOF) of the species, (2) thermal processes leading to generation of plasma from the
target (3) recombination and/or dissociation of the species.
The above sections describe the salient aspects of the experimental systems utilized
for the measurements presented in this thesis. However, depending on the actual mea
surements conditions one or several of the experimental parameters have to be suitably
altered. For eg., to measure the effect of ambient gases on the features of the plasma
and their variations with pressure of the gas one has obviously need to alter the pressure
of the gas in the plasma chamber. Hence, what is described in the above sections can be
considered as a typical arrangement for a standard examination of laser induced plasma.
70
2.5 References
[1] J. F. Ready, Effect of High Power Laser Radiation (Academic press, New York,
1971).
[2] L. J. Radziemski and D. A. Cremers, Laser-Induced Plasm as and Applications
(Marcel Decker, Inc., New York, 1989).
[3J T. P. Hughes, Plasmas and Laser Light (Adam Hilger, England, 1975).
[4] K. Muraoka and M. Maeda, Plasma Phys. Control. Fusion, 35 633 (1993).
[5] R. Mitzner, A. Rosenfeld and R. Konig, Appl. Surf. Sci., 69 180 (1993).
[6J R. C. Estler and N. S. Nogar, J. Appl. Phys., 69 1654 (1991).
[7J S. S. Harilal, P. Radakrishnan, V. P. N. Nampoori and C. P. G. Vallabhan, Appl.
Phys. Lett. 63 3377 (1994).
[8] S. S. Harilal, R. C. Issac, C. V. Bindhu, V. P. N. Nampoori and C. P. G. Vallabhan,
Jpn. J. Appl. Phys. 36 134 (1997).
[9J S. S. Harilal, R. C. Issac, C. V. Bindhu, V. P. N. Nampoori and C. P. G. Vallabhan,
Spectrochimica Acta A, (in press) (1997).
[10] Instruction Manual, Quanta Ray DCR 11, Nd:YAG laser
[11] Instruction Manual, Spex 1704 Spectrometer (Spex, USA)
[12] Instruction Manual, Spex CD 2A Compudrive (Spex, USA)
[13] Instruction Manual, Jarrell-Ash monochromator
[14] Photomultiplier tubes, Construction and operating charecteristics (Hamamatsu,
Japan)
[15J Instruction Manual, Delta Developments Laser Energy Meter
[16] Instruction Manual, Iwatsu DS 8651 Oscilloscope, (Iwatsu, Japan).
[17] Instruction Manual, Standford Research Systems Boxcar Averager and Gated Inte
grator.
71
[18] Instruction Manual, Rikadenki Chart Recorder.
[19] Y. B. Zeldovich and Y. P. Raizer, Physics and Shock Waves and High
Temperature Phenomena (Academic, New York, 1966).
[20] S. S. Harilal, R. C. Issac, C. V. Bindhu, V. P. N. Nampoori and C. P. G. Vallabhan,
J. Appl. Phys. 80 3561 (1996).
[21] Z. W. Gortel, H. J. Kreuzer, M. Schaff and G. Wedler, Sur. Sci., 134 577 (1983).
[22] D. B. Chrisey and G. K. Hubler (eds.) Pulsed laser deposition of thin films (John
Wiley and sons, New York, 1994).