Embed Size (px)
Citation preview
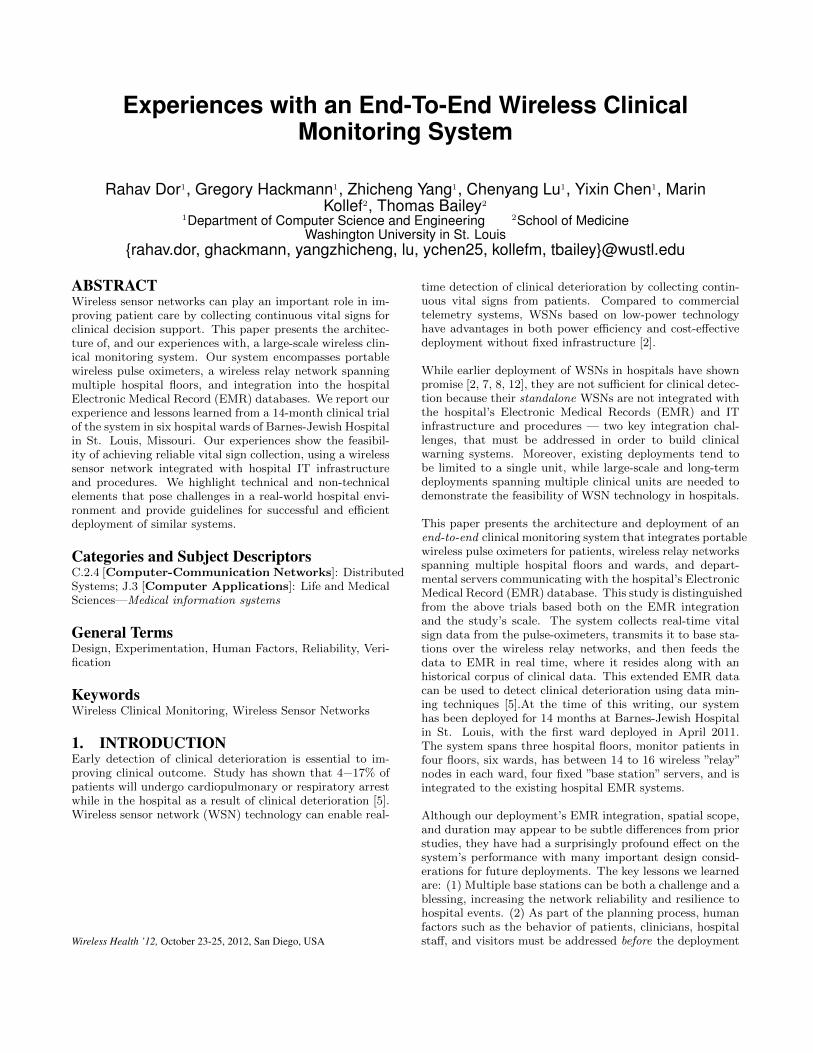
Experiences with an End-To-End Wireless ClinicalMonitoring System
Rahav Dor1, Gregory Hackmann1, Zhicheng Yang1, Chenyang Lu1, Yixin Chen1, Marin
Kollef2, Thomas Bailey2
1Department of Computer Science and Engineering
2School of Medicine
Washington University in St. Louis
{rahav.dor, ghackmann, yangzhicheng, lu, ychen25, kollefm, tbailey}@wustl.edu
ABSTRACTWireless sensor networks can play an important role in im-proving patient care by collecting continuous vital signs forclinical decision support. This paper presents the architec-ture of, and our experiences with, a large-scale wireless clin-ical monitoring system. Our system encompasses portablewireless pulse oximeters, a wireless relay network spanningmultiple hospital floors, and integration into the hospitalElectronic Medical Record (EMR) databases. We report ourexperience and lessons learned from a 14-month clinical trialof the system in six hospital wards of Barnes-Jewish Hospitalin St. Louis, Missouri. Our experiences show the feasibil-ity of achieving reliable vital sign collection, using a wirelesssensor network integrated with hospital IT infrastructureand procedures. We highlight technical and non-technicalelements that pose challenges in a real-world hospital envi-ronment and provide guidelines for successful and efficientdeployment of similar systems.
Categories and Subject DescriptorsC.2.4 [Computer-Communication Networks]: DistributedSystems; J.3 [Computer Applications]: Life and MedicalSciences—Medical information systems
General TermsDesign, Experimentation, Human Factors, Reliability, Veri-fication
KeywordsWireless Clinical Monitoring, Wireless Sensor Networks
1. INTRODUCTIONEarly detection of clinical deterioration is essential to im-proving clinical outcome. Study has shown that 4−17% ofpatients will undergo cardiopulmonary or respiratory arrestwhile in the hospital as a result of clinical deterioration [5].Wireless sensor network (WSN) technology can enable real-
Wireless Health ’12, October 23-25, 2012, San Diego, USA
time detection of clinical deterioration by collecting contin-uous vital signs from patients. Compared to commercialtelemetry systems, WSNs based on low-power technologyhave advantages in both power efficiency and cost-effectivedeployment without fixed infrastructure [2].
While earlier deployment of WSNs in hospitals have shownpromise [2, 7, 8, 12], they are not sufficient for clinical detec-tion because their standalone WSNs are not integrated withthe hospital’s Electronic Medical Records (EMR) and ITinfrastructure and procedures — two key integration chal-lenges, that must be addressed in order to build clinicalwarning systems. Moreover, existing deployments tend tobe limited to a single unit, while large-scale and long-termdeployments spanning multiple clinical units are needed todemonstrate the feasibility of WSN technology in hospitals.
This paper presents the architecture and deployment of anend-to-end clinical monitoring system that integrates portablewireless pulse oximeters for patients, wireless relay networksspanning multiple hospital floors and wards, and depart-mental servers communicating with the hospital’s ElectronicMedical Record (EMR) database. This study is distinguishedfrom the above trials based both on the EMR integrationand the study’s scale. The system collects real-time vitalsign data from the pulse-oximeters, transmits it to base sta-tions over the wireless relay networks, and then feeds thedata to EMR in real time, where it resides along with anhistorical corpus of clinical data. This extended EMR datacan be used to detect clinical deterioration using data min-ing techniques [5].At the time of this writing, our systemhas been deployed for 14 months at Barnes-Jewish Hospitalin St. Louis, with the first ward deployed in April 2011.The system spans three hospital floors, monitor patients infour floors, six wards, has between 14 to 16 wireless ”relay”nodes in each ward, four fixed ”base station” servers, and isintegrated to the existing hospital EMR systems.
Although our deployment’s EMR integration, spatial scope,and duration may appear to be subtle differences from priorstudies, they have had a surprisingly profound effect on thesystem’s performance with many important design consid-erations for future deployments. The key lessons we learnedare: (1) Multiple base stations can be both a challenge and ablessing, increasing the network reliability and resilience tohospital events. (2) As part of the planning process, humanfactors such as the behavior of patients, clinicians, hospitalstaff, and visitors must be addressed before the deployment
starts. (3) Hospital deployments must be treated fundamen-tally differently from lab (and even small scale real) deploy-ments, which typically focus on system issues. They mustbe engineered from the ground up to consider organizationIT and hospital procedures. The lessons learned during thisdeployment can serve as guidelines for future clinical de-ployments of WSN-based systems, and more generally toany large WSN deployment around people’s daily lives.
The rest of this paper is organized as follows. Section 2 de-scribes the study that provides the context of the clinicalmonitoring system. Section 3 discusses the system archi-tecture. Section 4 presents our findings about the system’sreliability during the clinical trial, in terms of both networkperformance and reliability of vital signs delivery. Section 5articulates the lessons we learned and how the overall per-formance of such a system can be improved by following afew simple guidelines. We end this paper with a short reviewof similar efforts in the community and our conclusions.
2. CLINICAL TRIAL OVERVIEWThis fourteen month clinical trial is a joint project amongWashington University Schools of Engineering and Medicine,and Barnes Jewish Hospital (BJH). The system deployedduring this trial collects blood oxygenation and heart ratereadings from consented patients every minute. These read-ings are collected with the ultimate goal of predicting patientdeterioration by combining real-time vital signs of a patientwith traditional clinical data from EMR.
The system discussed in this paper is part of a long-term ef-fort to improve hospital care through prediction of imminentclinical deterioration and enabling physicians and nurses torender information-guided timely attention to their patients.In order to achieve these goals we envision a novel two-tiersystem for clinical early warning [5]. The first tier uses datamining algorithms on existing hospital data records to iden-tify patients at risk of clinical deterioration. Those identifiedpatients will wear low-power, compact sensing devices whichwill collect and communicate real-time vital signs througha WSN. The second tier combines both the real-time sensordata and traditional clinical data to predict clinical deterio-ration, as well as suggest the most relevant clinical reasonsbased on data mining algorithms.
High-level description of the two-tier system architectureand preliminary results on the early warning based on tradi-tional clinical data (tier-1) was presented in [5], followed byan in-depth study of data mining algorithms for traditionalclinical data presented in [10]. The success of such systemsdepends on the availability of a reliable real-time feed ofpatients’ vital signs integrated into existing EMR systems.This paper presents a clinical trial of a real-time clinicalmonitoring system that collects vital sign data from wire-less sensors, transport, and feeds it to EMR. Once in EMRthe real-time vital signs along with the traditional clinicaldata of multiple patients can be used for detecting imminentclinical deterioration. This phase of the deployment focuseson gathering sufficient data to determine if this can be doneusing WSNs. Data collected during this trial was not usedto predict patient outcomes or manage patient care. In thefollowing sub-section we provide some details on the partic-ipant sample and anecdotal field observations.
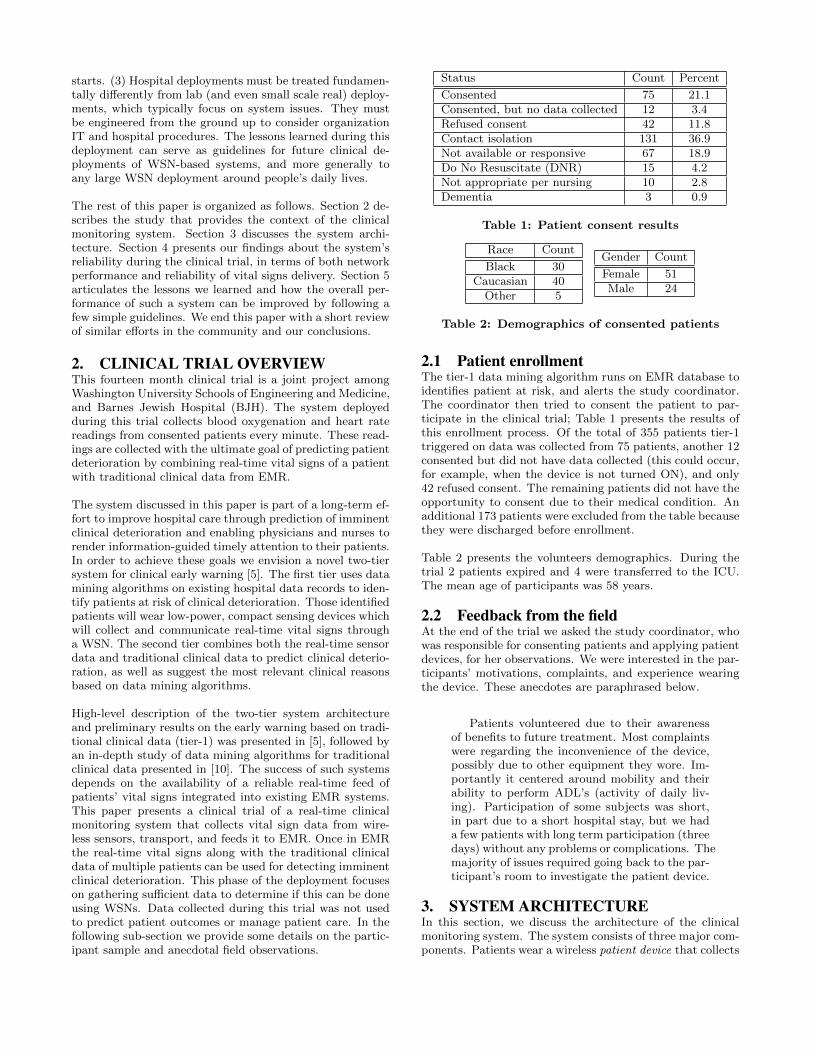
Status Count Percent
Consented 75 21.1Consented, but no data collected 12 3.4Refused consent 42 11.8Contact isolation 131 36.9Not available or responsive 67 18.9Do No Resuscitate (DNR) 15 4.2Not appropriate per nursing 10 2.8Dementia 3 0.9
Table 1: Patient consent results
Race Count
Black 30Caucasian 40Other 5
Gender Count
Female 51Male 24
Table 2: Demographics of consented patients
2.1 Patient enrollmentThe tier-1 data mining algorithm runs on EMR database toidentifies patient at risk, and alerts the study coordinator.The coordinator then tried to consent the patient to par-ticipate in the clinical trial; Table 1 presents the results ofthis enrollment process. Of the total of 355 patients tier-1triggered on data was collected from 75 patients, another 12consented but did not have data collected (this could occur,for example, when the device is not turned ON), and only42 refused consent. The remaining patients did not have theopportunity to consent due to their medical condition. Anadditional 173 patients were excluded from the table becausethey were discharged before enrollment.
Table 2 presents the volunteers demographics. During thetrial 2 patients expired and 4 were transferred to the ICU.The mean age of participants was 58 years.
2.2 Feedback from the fieldAt the end of the trial we asked the study coordinator, whowas responsible for consenting patients and applying patientdevices, for her observations. We were interested in the par-ticipants’ motivations, complaints, and experience wearingthe device. These anecdotes are paraphrased below.
Patients volunteered due to their awarenessof benefits to future treatment. Most complaintswere regarding the inconvenience of the device,possibly due to other equipment they wore. Im-portantly it centered around mobility and theirability to perform ADL’s (activity of daily liv-ing). Participation of some subjects was short,in part due to a short hospital stay, but we hada few patients with long term participation (threedays) without any problems or complications. Themajority of issues required going back to the par-ticipant’s room to investigate the patient device.
3. SYSTEM ARCHITECTUREIn this section, we discuss the architecture of the clinicalmonitoring system. The system consists of three major com-ponents. Patients wear a wireless patient device that collects
vital sign data (specifically, blood oxygenation and pulsedata) during their hospital stay. As vitals are collected, thepatient device transmits them to a wireless relay networkdeployed throughout the hospital wards where our clinicaltrial is running. The relays form a low-power wireless meshnetwork which carries the vital sign data from the patientdevices to servers (referred to as base stations). The basestations act as an interface between the WSN and the hospi-tal’s IT systems (via wired Ethernet) and feed real-time vitalsign data to the EMR database. They also provide networkmonitoring and logging services that have been invaluableto system maintenance during our clinical trial.
The patient device and wireless relay networks reuse thesame design from an earlier clinical trial detailed in [2], whilethe base station software has been extended substantiallywith new services to support the EMR integration and net-work monitoring services. The key distinctions between thisstudy and the earlier study reported in [2] are two-fold: (1)the integration with the hospital IT infrastructure and EMRcompared to standalone WSN. (2) a large-scale, multi-floorand multi-unit deployment compared to single-unit deploy-ment. Each of these characteristics lead to important newchallenges and insights which we report in this paper.
3.1 Patient deviceEach patient device integrates a TelosB mote with a Nell-cor pulse oximeter sensor attached to the patient’s finger tocollect pulse rate and blood oxygenation level (SpO2). Afterreceiving a sensor reading the TelosB routes the data to therelay infrastructure discussed in the following subsection, us-ing its onboard CC2420 [11] radio. The patient locate relaysusing the Dynamic Relay Association Protocol (DRAP) [1],a one-hop protocol specifically designed to locate a largerrouting infrastructure under mobility.
3.2 Relays network infrastructureWSN network coverage is achieved by plugging TelosB nodesinto electrical outlets in patients’ rooms, offices, and else-where when it is spatially reasonable. The relay devicesuse their onboard radios to form a mesh network based onthe IEEE 802.15.4 low-power wireless networking standard[11]. Figure 1 presents a high-level view of the resultingnetwork topology. The Collection Tree Protocol (CTP) [4]is employed on these relay nodes to establish data collec-tion trees rooted at a base station. 802.15.4 wireless linksare highly dynamic, due to factors such as external inter-ference. Hence, CTP is a dynamic routing protocol whichuses periodic beacon messages to maintain the routing in-frastructure, autonomously changing the links used to routepackets as their reliability varies over time.
In addition to patient data, relay nodes send “beacon” pack-ets to a base station at a rate of one packet per minute.These beacons provide diagnostic information about the net-work’s operation even when no patients are enrolled.
A subtle but important feature of CTP is that each relayaims to find a high-quality path to some base station, notany base station in particular. Multiple base stations maybe deployed in the same network to provide redundancy, afeature we exploited in our deployment. As we will discuss
11-‐1 ward
EMR
MQ
11-‐2 ward
12-‐2 ward
14-‐5 ward14-‐4 ward
MQ
MQ MQ
802.15.4 network
Base stationPatient Legacy
Legend:MQ
Message Queue
Figure 1: A high-level view of the network architec-
ture. The figure shows the ward floor and number,
e.g. 11-1 is ward 1 on the 11th floor.
later in this paper this decision had a profound (and some-times surprising) impact on our network’s behavior.
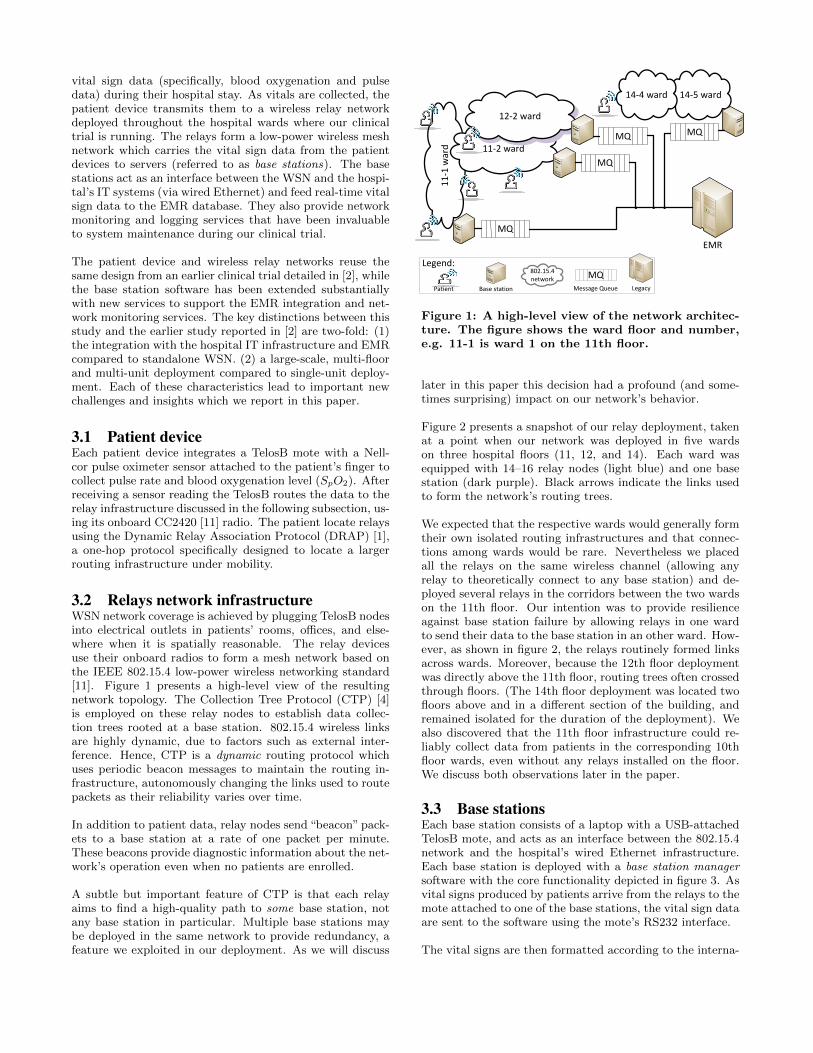
Figure 2 presents a snapshot of our relay deployment, takenat a point when our network was deployed in five wardson three hospital floors (11, 12, and 14). Each ward wasequipped with 14–16 relay nodes (light blue) and one basestation (dark purple). Black arrows indicate the links usedto form the network’s routing trees.
We expected that the respective wards would generally formtheir own isolated routing infrastructures and that connec-tions among wards would be rare. Nevertheless we placedall the relays on the same wireless channel (allowing anyrelay to theoretically connect to any base station) and de-ployed several relays in the corridors between the two wardson the 11th floor. Our intention was to provide resilienceagainst base station failure by allowing relays in one wardto send their data to the base station in an other ward. How-ever, as shown in figure 2, the relays routinely formed linksacross wards. Moreover, because the 12th floor deploymentwas directly above the 11th floor, routing trees often crossedthrough floors. (The 14th floor deployment was located twofloors above and in a different section of the building, andremained isolated for the duration of the deployment). Wealso discovered that the 11th floor infrastructure could re-liably collect data from patients in the corresponding 10thfloor wards, even without any relays installed on the floor.We discuss both observations later in the paper.
3.3 Base stationsEach base station consists of a laptop with a USB-attachedTelosB mote, and acts as an interface between the 802.15.4network and the hospital’s wired Ethernet infrastructure.Each base station is deployed with a base station manager
software with the core functionality depicted in figure 3. Asvital signs produced by patients arrive from the relays to themote attached to one of the base stations, the vital sign dataare sent to the software using the mote’s RS232 interface.
The vital signs are then formatted according to the interna-
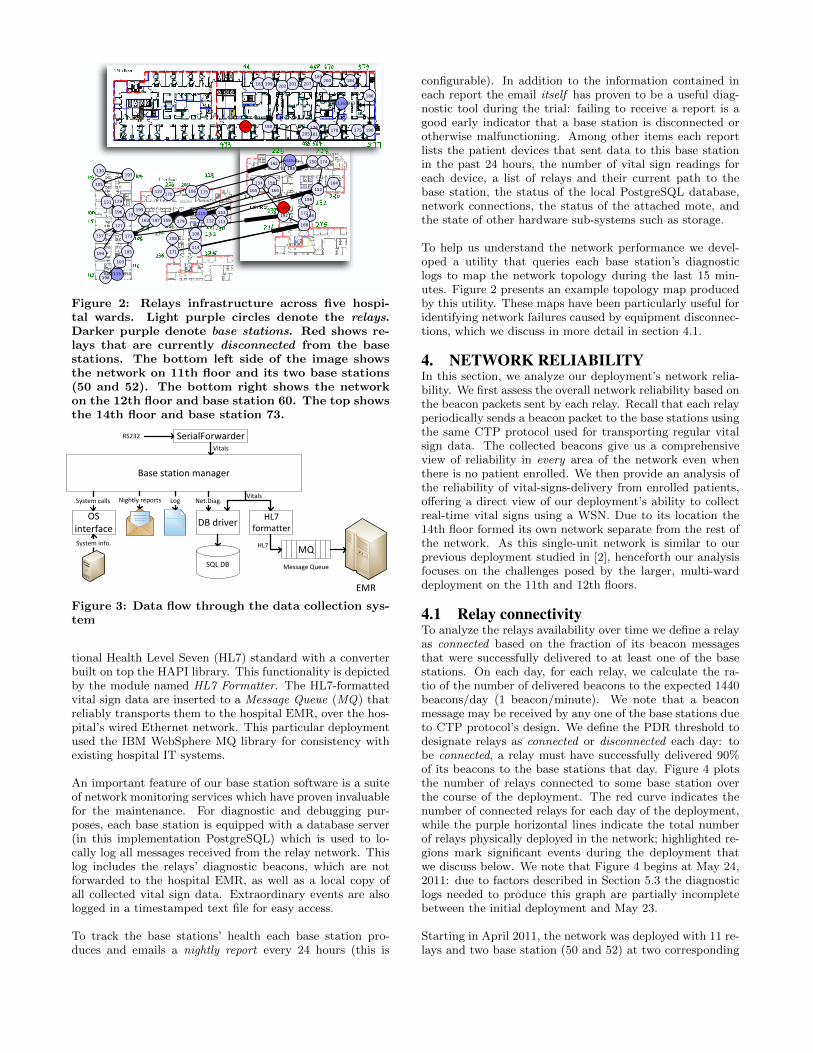
Figure 2: Relays infrastructure across five hospi-
tal wards. Light purple circles denote the relays.Darker purple denote base stations. Red shows re-
lays that are currently disconnected from the base
stations. The bottom left side of the image shows
the network on 11th floor and its two base stations
(50 and 52). The bottom right shows the network
on the 12th floor and base station 60. The top shows
the 14th floor and base station 73.
Base station manager
SerialForwarderRS232
HL7 formatterDB driver
SQL DB
MQ
EMR
Log
OS interface
System calls
System info.
Nightly reports
Message Queue
Vitals
Vitals
HL7
Net.Diag.
Figure 3: Data flow through the data collection sys-
tem
tional Health Level Seven (HL7) standard with a converterbuilt on top the HAPI library. This functionality is depictedby the module named HL7 Formatter. The HL7-formattedvital sign data are inserted to a Message Queue (MQ) thatreliably transports them to the hospital EMR, over the hos-pital’s wired Ethernet network. This particular deploymentused the IBM WebSphere MQ library for consistency withexisting hospital IT systems.
An important feature of our base station software is a suiteof network monitoring services which have proven invaluablefor the maintenance. For diagnostic and debugging pur-poses, each base station is equipped with a database server(in this implementation PostgreSQL) which is used to lo-cally log all messages received from the relay network. Thislog includes the relays’ diagnostic beacons, which are notforwarded to the hospital EMR, as well as a local copy ofall collected vital sign data. Extraordinary events are alsologged in a timestamped text file for easy access.
To track the base stations’ health each base station pro-duces and emails a nightly report every 24 hours (this is
configurable). In addition to the information contained ineach report the email itself has proven to be a useful diag-nostic tool during the trial: failing to receive a report is agood early indicator that a base station is disconnected orotherwise malfunctioning. Among other items each reportlists the patient devices that sent data to this base stationin the past 24 hours, the number of vital sign readings foreach device, a list of relays and their current path to thebase station, the status of the local PostgreSQL database,network connections, the status of the attached mote, andthe state of other hardware sub-systems such as storage.
To help us understand the network performance we devel-oped a utility that queries each base station’s diagnosticlogs to map the network topology during the last 15 min-utes. Figure 2 presents an example topology map producedby this utility. These maps have been particularly useful foridentifying network failures caused by equipment disconnec-tions, which we discuss in more detail in section 4.1.
4. NETWORK RELIABILITYIn this section, we analyze our deployment’s network relia-bility. We first assess the overall network reliability based onthe beacon packets sent by each relay. Recall that each relayperiodically sends a beacon packet to the base stations usingthe same CTP protocol used for transporting regular vitalsign data. The collected beacons give us a comprehensiveview of reliability in every area of the network even whenthere is no patient enrolled. We then provide an analysis ofthe reliability of vital-signs-delivery from enrolled patients,offering a direct view of our deployment’s ability to collectreal-time vital signs using a WSN. Due to its location the14th floor formed its own network separate from the rest ofthe network. As this single-unit network is similar to ourprevious deployment studied in [2], henceforth our analysisfocuses on the challenges posed by the larger, multi-warddeployment on the 11th and 12th floors.
4.1 Relay connectivityTo analyze the relays availability over time we define a relayas connected based on the fraction of its beacon messagesthat were successfully delivered to at least one of the basestations. On each day, for each relay, we calculate the ra-tio of the number of delivered beacons to the expected 1440beacons/day (1 beacon/minute). We note that a beaconmessage may be received by any one of the base stations dueto CTP protocol’s design. We define the PDR threshold todesignate relays as connected or disconnected each day: tobe connected, a relay must have successfully delivered 90%of its beacons to the base stations that day. Figure 4 plotsthe number of relays connected to some base station overthe course of the deployment. The red curve indicates thenumber of connected relays for each day of the deployment,while the purple horizontal lines indicate the total numberof relays physically deployed in the network; highlighted re-gions mark significant events during the deployment thatwe discuss below. We note that Figure 4 begins at May 24,2011: due to factors described in Section 5.3 the diagnosticlogs needed to produce this graph are partially incompletebetween the initial deployment and May 23.
Starting in April 2011, the network was deployed with 11 re-lays and two base station (50 and 52) at two corresponding
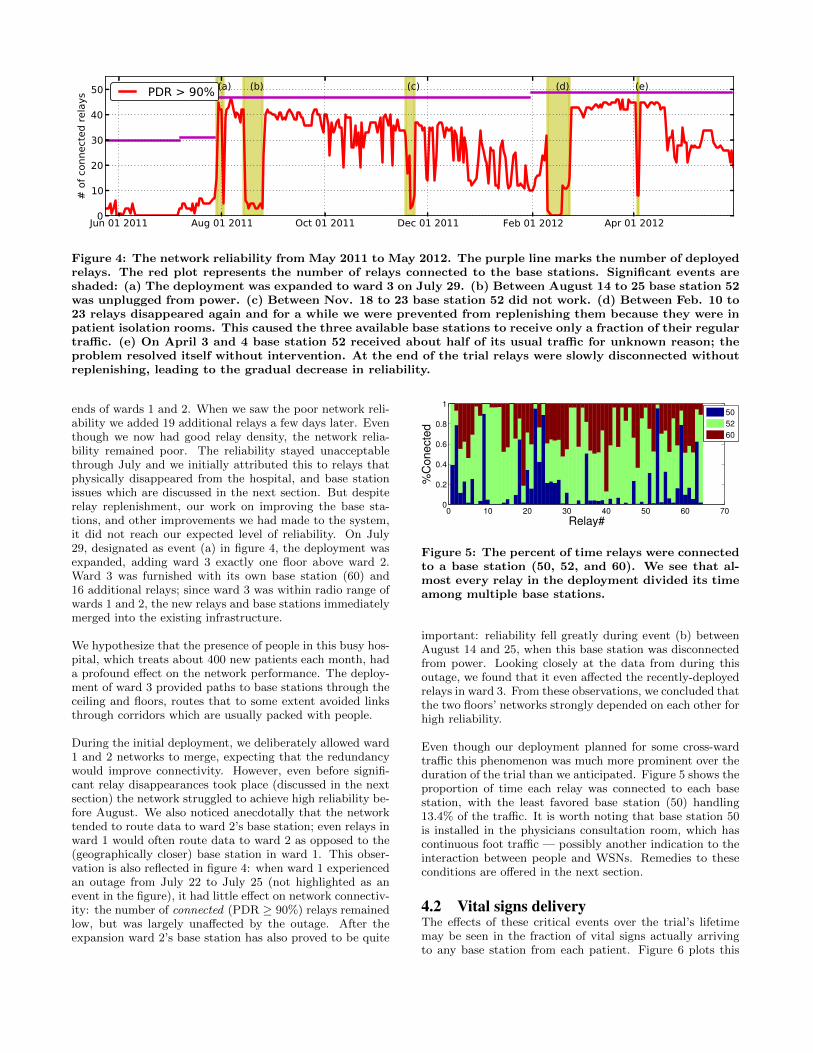
Figure 4: The network reliability from May 2011 to May 2012. The purple line marks the number of deployed
relays. The red plot represents the number of relays connected to the base stations. Significant events are
shaded: (a) The deployment was expanded to ward 3 on July 29. (b) Between August 14 to 25 base station 52
was unplugged from power. (c) Between Nov. 18 to 23 base station 52 did not work. (d) Between Feb. 10 to
23 relays disappeared again and for a while we were prevented from replenishing them because they were in
patient isolation rooms. This caused the three available base stations to receive only a fraction of their regular
traffic. (e) On April 3 and 4 base station 52 received about half of its usual traffic for unknown reason; the
problem resolved itself without intervention. At the end of the trial relays were slowly disconnected without
replenishing, leading to the gradual decrease in reliability.
ends of wards 1 and 2. When we saw the poor network reli-ability we added 19 additional relays a few days later. Eventhough we now had good relay density, the network relia-bility remained poor. The reliability stayed unacceptablethrough July and we initially attributed this to relays thatphysically disappeared from the hospital, and base stationissues which are discussed in the next section. But despiterelay replenishment, our work on improving the base sta-tions, and other improvements we had made to the system,it did not reach our expected level of reliability. On July29, designated as event (a) in figure 4, the deployment wasexpanded, adding ward 3 exactly one floor above ward 2.Ward 3 was furnished with its own base station (60) and16 additional relays; since ward 3 was within radio range ofwards 1 and 2, the new relays and base stations immediatelymerged into the existing infrastructure.
We hypothesize that the presence of people in this busy hos-pital, which treats about 400 new patients each month, hada profound effect on the network performance. The deploy-ment of ward 3 provided paths to base stations through theceiling and floors, routes that to some extent avoided linksthrough corridors which are usually packed with people.
During the initial deployment, we deliberately allowed ward1 and 2 networks to merge, expecting that the redundancywould improve connectivity. However, even before signifi-cant relay disappearances took place (discussed in the nextsection) the network struggled to achieve high reliability be-fore August. We also noticed anecdotally that the networktended to route data to ward 2’s base station; even relays inward 1 would often route data to ward 2 as opposed to the(geographically closer) base station in ward 1. This obser-vation is also reflected in figure 4: when ward 1 experiencedan outage from July 22 to July 25 (not highlighted as anevent in the figure), it had little effect on network connectiv-ity: the number of connected (PDR ≥ 90%) relays remainedlow, but was largely unaffected by the outage. After theexpansion ward 2’s base station has also proved to be quite
0 10 20 30 40 50 60 700
0.2
0.4
0.6
0.8
1
Relay#
%C
onect
ed
50
52
60
Figure 5: The percent of time relays were connected
to a base station (50, 52, and 60). We see that al-
most every relay in the deployment divided its time
among multiple base stations.
important: reliability fell greatly during event (b) betweenAugust 14 and 25, when this base station was disconnectedfrom power. Looking closely at the data from during thisoutage, we found that it even affected the recently-deployedrelays in ward 3. From these observations, we concluded thatthe two floors’ networks strongly depended on each other forhigh reliability.
Even though our deployment planned for some cross-wardtraffic this phenomenon was much more prominent over theduration of the trial than we anticipated. Figure 5 shows theproportion of time each relay was connected to each basestation, with the least favored base station (50) handling13.4% of the traffic. It is worth noting that base station 50is installed in the physicians consultation room, which hascontinuous foot traffic — possibly another indication to theinteraction between people and WSNs. Remedies to theseconditions are offered in the next section.
4.2 Vital signs deliveryThe effects of these critical events over the trial’s lifetimemay be seen in the fraction of vital signs actually arrivingto any base station from each patient. Figure 6 plots this
Jul 01 2011 Oct 01 2011 Jan 01 2012 Apr 01 20120
0.2
0.4
0.6
0.8
1%
Deliv
ere
d
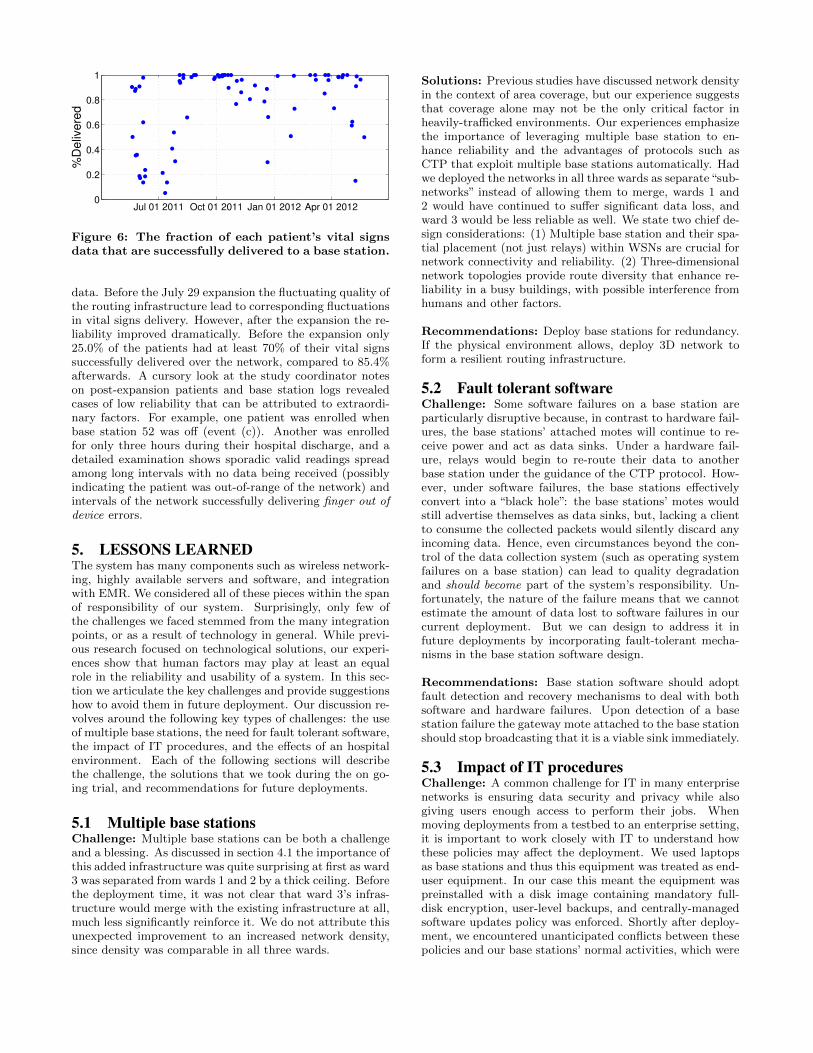
Figure 6: The fraction of each patient’s vital signs
data that are successfully delivered to a base station.
data. Before the July 29 expansion the fluctuating quality ofthe routing infrastructure lead to corresponding fluctuationsin vital signs delivery. However, after the expansion the re-liability improved dramatically. Before the expansion only25.0% of the patients had at least 70% of their vital signssuccessfully delivered over the network, compared to 85.4%afterwards. A cursory look at the study coordinator noteson post-expansion patients and base station logs revealedcases of low reliability that can be attributed to extraordi-nary factors. For example, one patient was enrolled whenbase station 52 was off (event (c)). Another was enrolledfor only three hours during their hospital discharge, and adetailed examination shows sporadic valid readings spreadamong long intervals with no data being received (possiblyindicating the patient was out-of-range of the network) andintervals of the network successfully delivering finger out of
device errors.
5. LESSONS LEARNEDThe system has many components such as wireless network-ing, highly available servers and software, and integrationwith EMR. We considered all of these pieces within the spanof responsibility of our system. Surprisingly, only few ofthe challenges we faced stemmed from the many integrationpoints, or as a result of technology in general. While previ-ous research focused on technological solutions, our experi-ences show that human factors may play at least an equalrole in the reliability and usability of a system. In this sec-tion we articulate the key challenges and provide suggestionshow to avoid them in future deployment. Our discussion re-volves around the following key types of challenges: the useof multiple base stations, the need for fault tolerant software,the impact of IT procedures, and the effects of an hospitalenvironment. Each of the following sections will describethe challenge, the solutions that we took during the on go-ing trial, and recommendations for future deployments.
5.1 Multiple base stationsChallenge: Multiple base stations can be both a challengeand a blessing. As discussed in section 4.1 the importance ofthis added infrastructure was quite surprising at first as ward3 was separated from wards 1 and 2 by a thick ceiling. Beforethe deployment time, it was not clear that ward 3’s infras-tructure would merge with the existing infrastructure at all,much less significantly reinforce it. We do not attribute thisunexpected improvement to an increased network density,since density was comparable in all three wards.
Solutions: Previous studies have discussed network densityin the context of area coverage, but our experience suggeststhat coverage alone may not be the only critical factor inheavily-trafficked environments. Our experiences emphasizethe importance of leveraging multiple base station to en-hance reliability and the advantages of protocols such asCTP that exploit multiple base stations automatically. Hadwe deployed the networks in all three wards as separate“sub-networks” instead of allowing them to merge, wards 1 and2 would have continued to suffer significant data loss, andward 3 would be less reliable as well. We state two chief de-sign considerations: (1) Multiple base station and their spa-tial placement (not just relays) within WSNs are crucial fornetwork connectivity and reliability. (2) Three-dimensionalnetwork topologies provide route diversity that enhance re-liability in a busy buildings, with possible interference fromhumans and other factors.
Recommendations: Deploy base stations for redundancy.If the physical environment allows, deploy 3D network toform a resilient routing infrastructure.
5.2 Fault tolerant softwareChallenge: Some software failures on a base station areparticularly disruptive because, in contrast to hardware fail-ures, the base stations’ attached motes will continue to re-ceive power and act as data sinks. Under a hardware fail-ure, relays would begin to re-route their data to anotherbase station under the guidance of the CTP protocol. How-ever, under software failures, the base stations effectivelyconvert into a “black hole”: the base stations’ motes wouldstill advertise themselves as data sinks, but, lacking a clientto consume the collected packets would silently discard anyincoming data. Hence, even circumstances beyond the con-trol of the data collection system (such as operating systemfailures on a base station) can lead to quality degradationand should become part of the system’s responsibility. Un-fortunately, the nature of the failure means that we cannotestimate the amount of data lost to software failures in ourcurrent deployment. But we can design to address it infuture deployments by incorporating fault-tolerant mecha-nisms in the base station software design.
Recommendations: Base station software should adoptfault detection and recovery mechanisms to deal with bothsoftware and hardware failures. Upon detection of a basestation failure the gateway mote attached to the base stationshould stop broadcasting that it is a viable sink immediately.
5.3 Impact of IT proceduresChallenge: A common challenge for IT in many enterprisenetworks is ensuring data security and privacy while alsogiving users enough access to perform their jobs. Whenmoving deployments from a testbed to an enterprise setting,it is important to work closely with IT to understand howthese policies may affect the deployment. We used laptopsas base stations and thus this equipment was treated as end-user equipment. In our case this meant the equipment waspreinstalled with a disk image containing mandatory full-disk encryption, user-level backups, and centrally-managedsoftware updates policy was enforced. Shortly after deploy-ment, we encountered unanticipated conflicts between thesepolicies and our base stations’ normal activities, which were
to be performed continuously and in real-time. For example,the end-user level backup software would block the databaseserver from its real-time work. As another example, after ev-ery patch update (e.g. OS, security) that required a reboot,the base station would wait for the user to input a passwordto “unlock” the encrypted hard drive.
Solutions: We worked with IT to clarify that patient in-formation on these base stations was sanitized according toHIPAA rules. The base stations were exempted from full-disk encryption and backups 1, and reboots were reducedto once a month for critical patches. We also changed oursoftware to run as an OS service so it will be started auto-matically after a reboot.
Recommendations: The integration to the hospital in-frastructure and policies are two different objectives, and theintegration-design process could be lengthy. These policieswill affect the system operational logic; hence it is impor-tant start these discussions during the system design. Thismay lead to selection of alternate equipment such as non-portable or server-class machines, which falls under differentpolicies and often use server-class software that is more suit-able for continuous server work. It is also important to testthe system on-site with the software functionality that ac-commodates the hospital policies, as such integration issueswould not manifest themselves in standalone WSNs testbed.Some policies should be incorporated into the network de-sign as well, e.g., proactively recomputing routes to avoidmachines that are under temporary scheduled maintenance.
5.4 Hospital environment5.4.1 Relay disconnections
Challenge: The relay devices and base station were ini-tially deployed without any labels that indicate they werepart of a clinical monitoring system. In the beginning ofthe deployment our relays, base stations, and base stationsmotes were repeatedly disconnected. The staff indicatedthat some devices were unplugged and set aside out of curios-ity or suspicion. We also believe that some devices have beenunplugged by cleaning staff who needed the power outletssince there was no indication that the device was important,nor was it plugged to the hospital medical-class power out-lets. It is worth noting that our experience contradicts thecommon assumption that power is an unlimited resource inindoor WSN deployments because we may leverage availablepower outlets. Relying on power outlets involves the trade-off of making the deployment susceptible to disconnections;similar issues were experienced in a residential study [6].
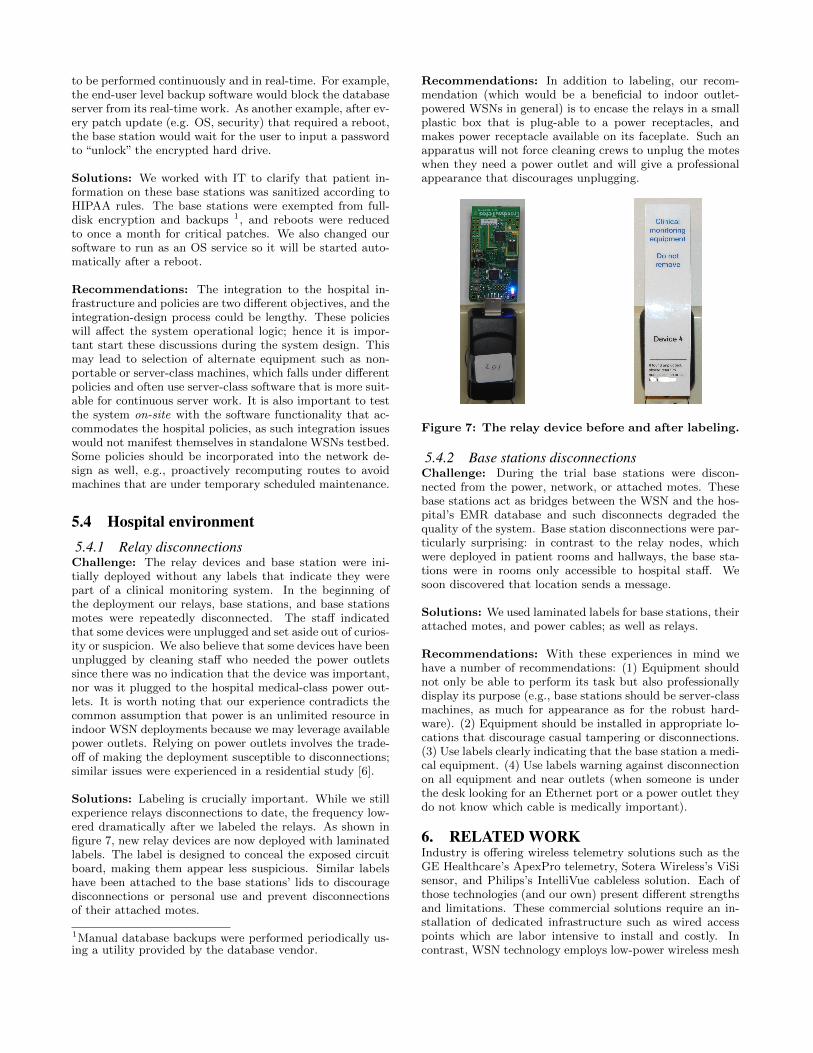
Solutions: Labeling is crucially important. While we stillexperience relays disconnections to date, the frequency low-ered dramatically after we labeled the relays. As shown infigure 7, new relay devices are now deployed with laminatedlabels. The label is designed to conceal the exposed circuitboard, making them appear less suspicious. Similar labelshave been attached to the base stations’ lids to discouragedisconnections or personal use and prevent disconnectionsof their attached motes.
1Manual database backups were performed periodically us-ing a utility provided by the database vendor.
Recommendations: In addition to labeling, our recom-mendation (which would be a beneficial to indoor outlet-powered WSNs in general) is to encase the relays in a smallplastic box that is plug-able to a power receptacles, andmakes power receptacle available on its faceplate. Such anapparatus will not force cleaning crews to unplug the moteswhen they need a power outlet and will give a professionalappearance that discourages unplugging.
Figure 7: The relay device before and after labeling.
5.4.2 Base stations disconnections
Challenge: During the trial base stations were discon-nected from the power, network, or attached motes. Thesebase stations act as bridges between the WSN and the hos-pital’s EMR database and such disconnects degraded thequality of the system. Base station disconnections were par-ticularly surprising: in contrast to the relay nodes, whichwere deployed in patient rooms and hallways, the base sta-tions were in rooms only accessible to hospital staff. Wesoon discovered that location sends a message.
Solutions: We used laminated labels for base stations, theirattached motes, and power cables; as well as relays.
Recommendations: With these experiences in mind wehave a number of recommendations: (1) Equipment shouldnot only be able to perform its task but also professionallydisplay its purpose (e.g., base stations should be server-classmachines, as much for appearance as for the robust hard-ware). (2) Equipment should be installed in appropriate lo-cations that discourage casual tampering or disconnections.(3) Use labels clearly indicating that the base station a medi-cal equipment. (4) Use labels warning against disconnectionon all equipment and near outlets (when someone is underthe desk looking for an Ethernet port or a power outlet theydo not know which cable is medically important).
6. RELATED WORKIndustry is offering wireless telemetry solutions such as theGE Healthcare’s ApexPro telemetry, Sotera Wireless’s ViSisensor, and Philips’s IntelliVue cableless solution. Each ofthose technologies (and our own) present different strengthsand limitations. These commercial solutions require an in-stallation of dedicated infrastructure such as wired accesspoints which are labor intensive to install and costly. Incontrast, WSN technology employs low-power wireless mesh

networking that can be easily deployed without any fixedinfrastructure (other than readily available power outlets).The cost-effectiveness and ease of deployment makes WSNsparticularly attractive for resource constrained clinical set-tings such as field hospitals, rural areas, and developingcountries. Lastly, these wireless technologies require morepower than WSNs, which is based on low-power wirelessstandards such as IEEE 802.15.4 [2]; hence portable devicesbased on low-power WSNs may be deployed with slimmerbatteries or may require less frequent charging.
Previous studies have found great promise inWSNs for emerg-ing medical applications such as emergency care in disasterareas [3, 9, 7], assisted living and residential monitoring [12],and early detection of clinical deterioration [7, 2]. In con-trast to the study described in this paper, these prior studieswere deployed as standalone WSNs and were not integratedwith the legacy hospital systems. Moreover, these deploy-ments were limited to a single unit or a relatively small area.
7. CONCLUSIONWireless sensor networks have shown promise for real-timeclinical monitoring in hospitals. This paper presents thelessons and insights learned from a 14-month deploymentof a large-scale WSN for vital sign monitoring in a majorhospital. Salient features of our system are scale (spanningfour hospital floors) and integration with existing IT infras-tructure and EMR systems in a hospital. We present im-portant and sometimes surprising findings that were not re-ported in previous WSN deployments in hospitals and otherenvironments. (1) While previous deployment studies usu-ally focused on WSNs as a standalone network, our systemexperienced a significant number of failures caused by in-teractions with enterprise IT methods and regulations. (2)Base station placements is crucial for reliable data collectionand multiple subnetworks can effectively increase reliability.(3) Network reliability can be increased by 3D topologies.(4) It is crucial to deal with equipment disconnections evenin a well controlled hospital environment, and to establishprotocols that recover and proactively discourage these dis-connections. Our results lead to guidance and best practicesof deploying large-scale WSNs in hospital environments andother large-scale WSNs.
AcknowledgmentsWe would like to acknowledge the study coordinators EmilyKuo and Pam Kemp for their tireless and caring work withpatients, Kevin Heard for superior programming on EMRand for providing us with invaluable data, and Kelly Faulknerfor great analysis and keeping us honest to our tasks. Specialthanks we send to all the nurses who supported the project.
This publication was made possible by Grant Number UL1RR024992 from the National Center for Research Resources(NCRR), part of the National Institutes of Health (NIH)and NIH Roadmap for Medical Research. Its contents aresolely the responsibility of the authors. Additional fund-ing was provided by the Barnes-Jewish Hospital Foundationand NSF through grants CNS-1035773 (CPS), CNS-1144552(NeTS), and CNS-0708460 (CRI).
8. REFERENCES
[1] O. Chipara, C. Brooks, S. Bhattacharya, C. Lu, R. D.Chamberlain, G.-C. Roman, and T. C. Bailey.Reliable real-time clinical monitoring using sensornetwork technology. In AMIA, 2009.
[2] O. Chipara, C. Lu, T. C. Bailey, and G.-C. Roman.Reliable clinical monitoring using wireless sensornetworks: Experience in a step-down hospital unit. InSenSys, 2010.
[3] T. Gao, T. Massey, L. Selavo, D. Crawford, B. rongChen, K. Lorincz, V. Shnayder, L. Hauenstein,F. Dabiri, J. Jeng, A. Chanmugam, D. White,M. Sarrafzadeh, and M. Welsh. The advanced healthand disaster aid network: a light-weight wirelessmedical system for triage. IEEE Transactions on
Biomedical Circuits and Systems, 1(3):203–216, Sept.2007.
[4] O. Gnawali, R. Fonseca, K. Jamieson, D. Moss, andP. Levis. Collection tree protocol. In SenSys, 2009.
[5] G. Hackmann, M. Chen, O. Chipara, C. Lu, Y. Chen,M. Kollef, and T. Bailey. Toward a two-tier clinicalwarning system for hospitalized patients. AMIA, 2011.
[6] T. Hnat, V. Srinivasan, J. Lu, T. Sookoor, R. Dawson,J. Stankovic, and K. Whitehouse. The hitchhiker’sguide to successful residential sensing deployments. InSenSys, 2011.
[7] J. Ko, J. H. Lim, Y. Chen, R. Musvaloiu-E, A. Terzis,G. M. Masson, T. Gao, W. Destler, L. Selavo, andR. P. Dutton. Medisn: medical emergency detection insensor networks. ACM Trans. Embed. Comput. Syst.,10(1):11:1–11:29, Aug 2010.
[8] K. Lorincz, D. Malan, T. Fulford-Jones, A. Nawoj,A. Clavel, V. Shnayder, G. Mainland, M. Welsh, andS. Moulton. Sensor networks for emergency response:challenges and opportunities. IEEE Pervasive
Computing, 3(4):16–23, 2004.[9] D. Malan, T. Fulford-jones, M. Welsh, and
S. Moulton. Codeblue: An ad hoc sensor networkinfrastructure for emergency medical care. In In
International Workshop on Wearable and Implantable
Body Sensor Networks, 2004.[10] Y. Mao, Y. Chen, G. Hackmann, M. Chen, C. Lu,
M. Kollef, and T. Bailey. Early deterioration warningfor hospitalized patients by mining clinical data.International Journal of Knowledge Discovery in
Bioinformatics, 2(3):1–20, 2012.[11] Texas Instruments. 2.4 GHz IEEE 802.15.4 /
ZigBee-ready RF Transceiver.[12] A. Wood, G. Virone, T. Doan, Q. Cao, L. Selavo,
Y. Wu, L. Fang, Z. He, S. Lin, and J. Stankovic.Alarm-net: Wireless sensor networks forassisted-living and residential monitoring. TechnicalReport CS-2006-11, University of Virginia, Dec 2006.