Embed Size (px)
Citation preview
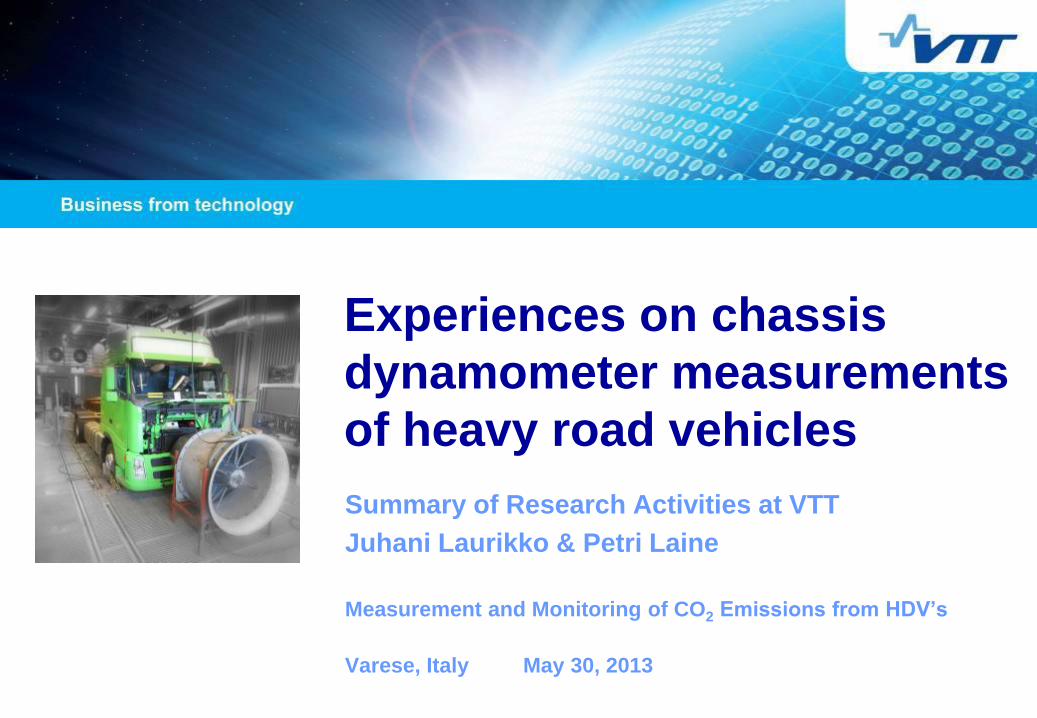
Experiences on chassis
dynamometer measurements
of heavy road vehicles
Summary of Research Activities at VTT
Juhani Laurikko & Petri Laine
Measurement and Monitoring of CO2 Emissions from HDV’s
Varese, Italy May 30, 2013
07/06/2013 2
BACKGROUND
In the early 00’s growing need to address fuel
consumption and exhaust emissions of HDV’s
A large number of measures were available, but no
methodology to assess their performance
No ”common grounds” for information from OEM’s
A novel way to measure performance of a complete
HDV’s was necessary
07/06/2013 3
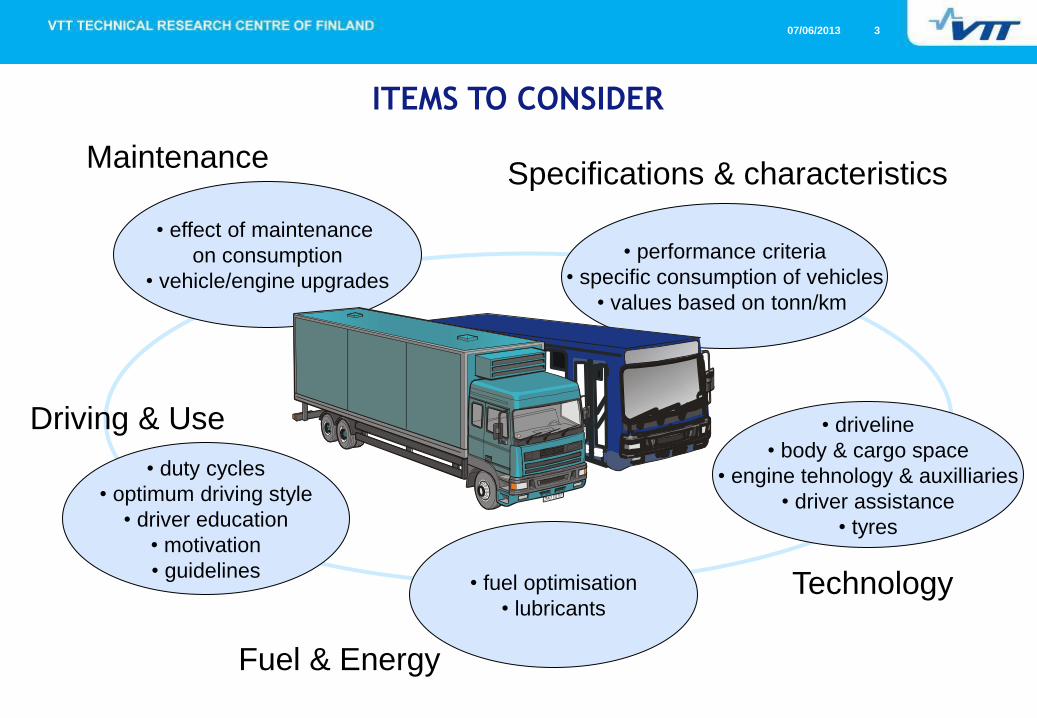
ITEMS TO CONSIDER
• fuel optimisation
• lubricants
Fuel & Energy
• effect of maintenance
on consumption
• vehicle/engine upgrades
Maintenance
• duty cycles
• optimum driving style
• driver education
• motivation
• guidelines
Driving & Use • driveline
• body & cargo space
• engine tehnology & auxilliaries
• driver assistance
• tyres
Technology
• performance criteria
• specific consumption of vehicles
• values based on tonn/km
Specifications & characteristics
07/06/2013 4
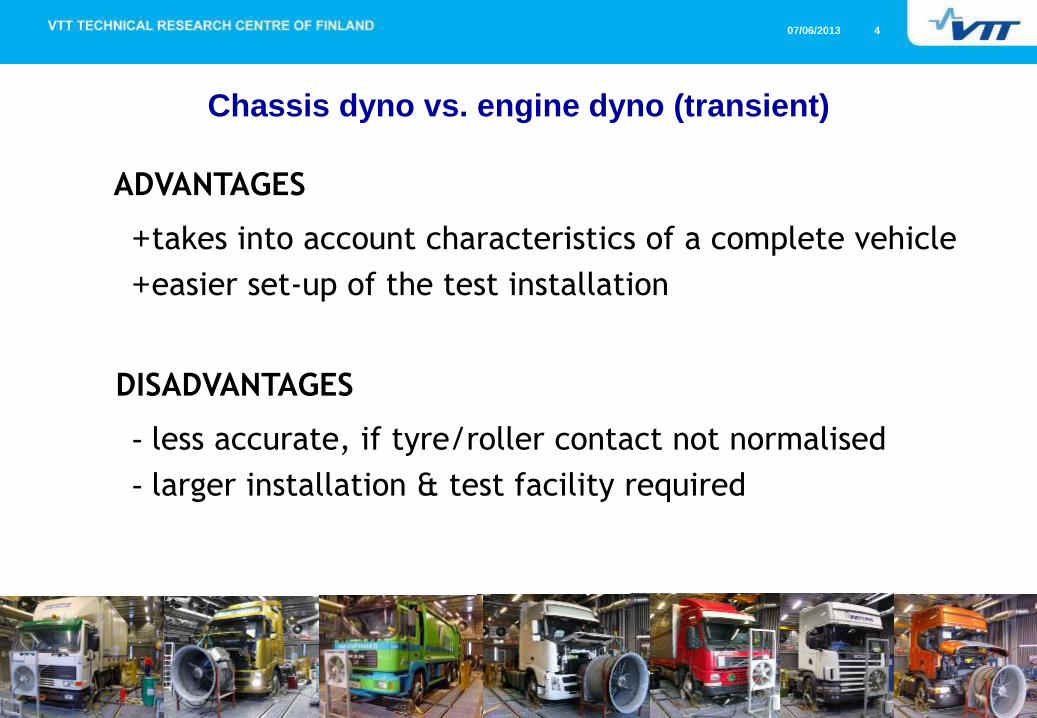
Chassis dyno vs. engine dyno (transient)
ADVANTAGES
+takes into account characteristics of a complete vehicle
+easier set-up of the test installation
DISADVANTAGES
- less accurate, if tyre/roller contact not normalised
- larger installation & test facility required
07/06/2013 5
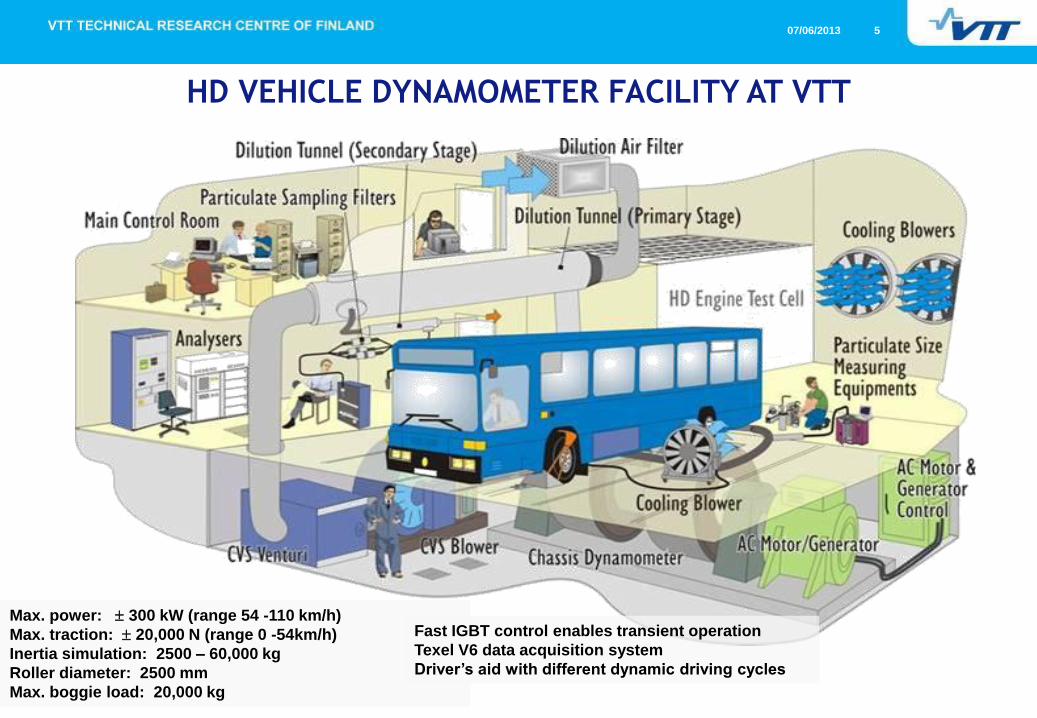
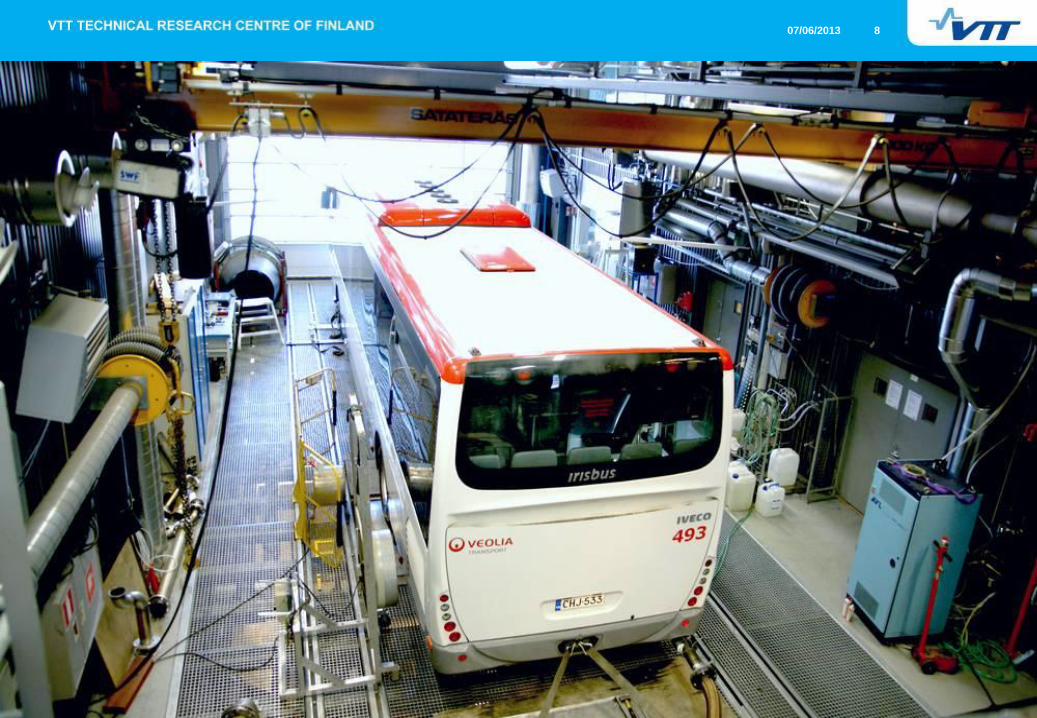
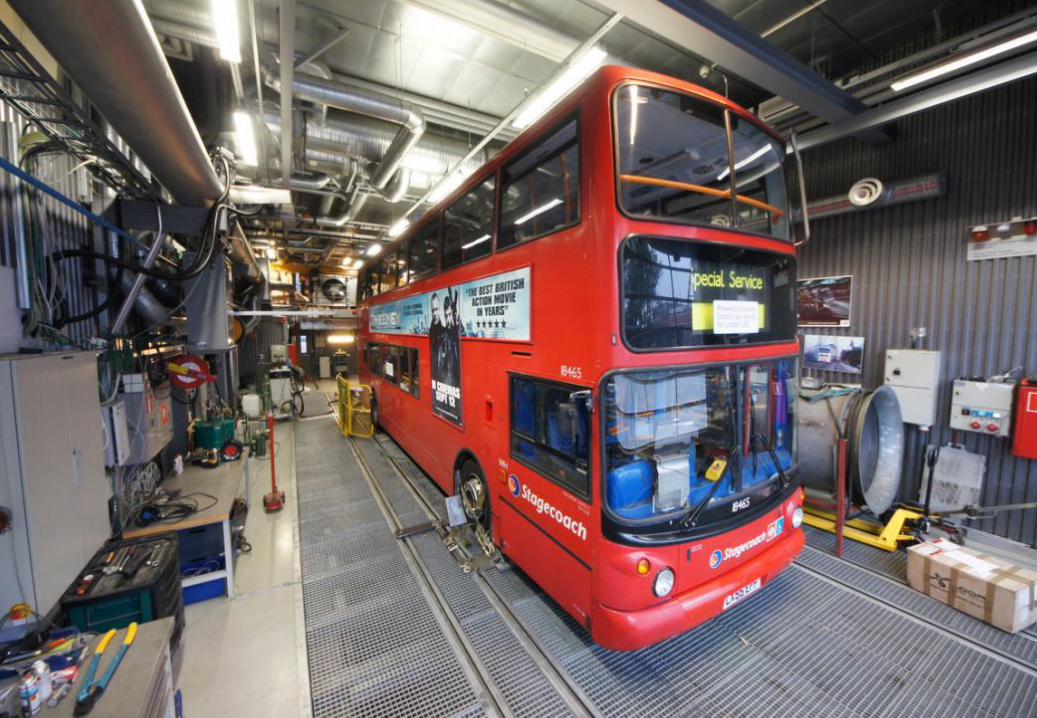
HD VEHICLE DYNAMOMETER FACILITY AT VTT
Max. power: 300 kW (range 54 -110 km/h)
Max. traction: 20,000 N (range 0 -54km/h)
Inertia simulation: 2500 – 60,000 kg
Roller diameter: 2500 mm
Max. boggie load: 20,000 kg
Fast IGBT control enables transient operation
Texel V6 data acquisition system
Driver’s aid with different dynamic driving cycles
07/06/2013 6 7.6.2013 6
07/06/2013 7
07/06/2013 8
07/06/2013 9
07/06/2013 10
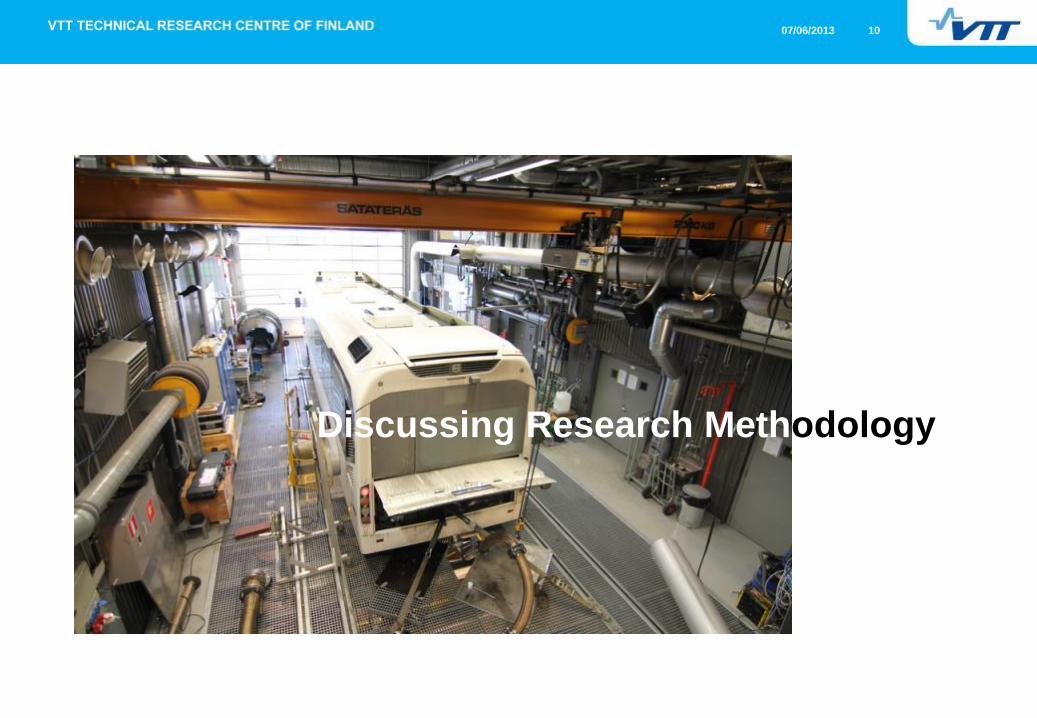
Discussing Research Methodology
07/06/2013 11
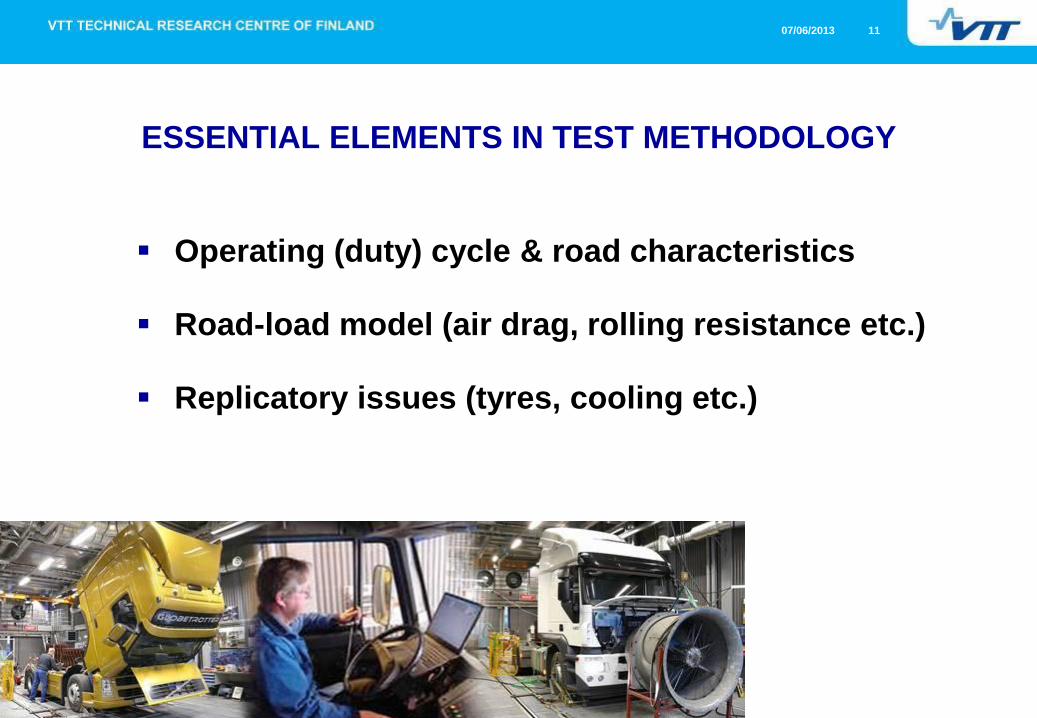
ESSENTIAL ELEMENTS IN TEST METHODOLOGY
Operating (duty) cycle & road characteristics
Road-load model (air drag, rolling resistance etc.)
Replicatory issues (tyres, cooling etc.)
07/06/2013 12
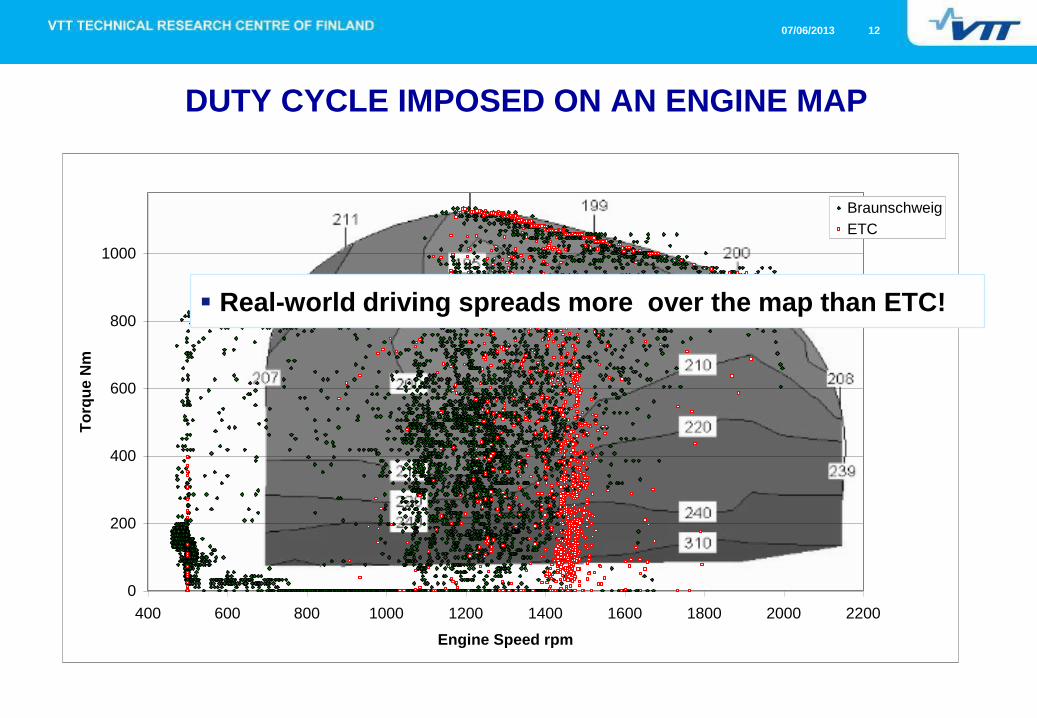
DUTY CYCLE IMPOSED ON AN ENGINE MAP
0
200
400
600
800
1000
400 600 800 1000 1200 1400 1600 1800 2000 2200
Engine Speed rpm
To
rqu
e N
m
Braunschweig
ETC
Real-world driving spreads more over the map than ETC!
07/06/2013 13
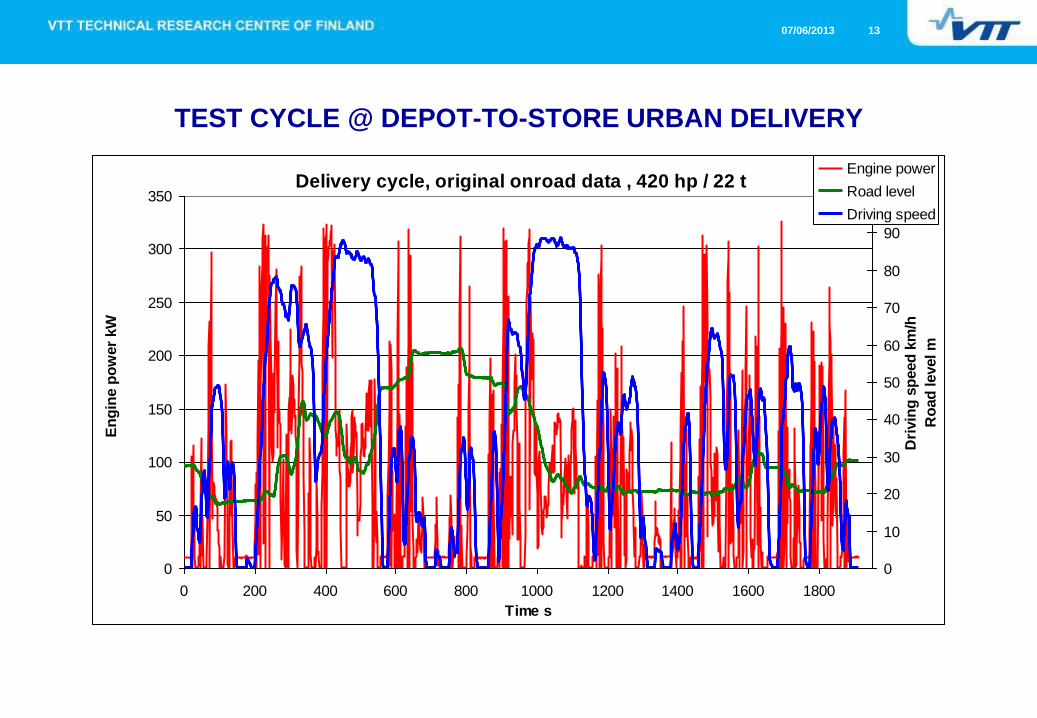
TEST CYCLE @ DEPOT-TO-STORE URBAN DELIVERY
Delivery cycle, original onroad data , 420 hp / 22 t
0
50
100
150
200
250
300
350
0 200 400 600 800 1000 1200 1400 1600 1800
Time s
En
gin
e p
ow
er
kW
0
10
20
30
40
50
60
70
80
90
100
Dri
vin
g s
peed
km
/h
Ro
ad
level m
Engine power
Road level
Driving speed
07/06/2013 14
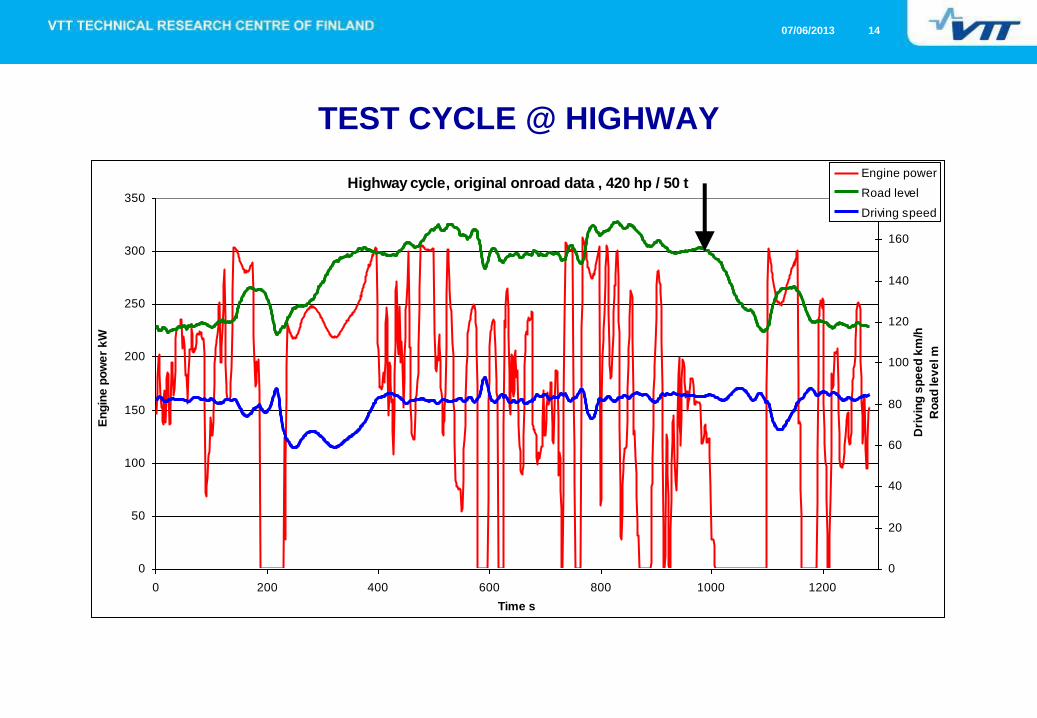
TEST CYCLE @ HIGHWAY
Highway cycle, original onroad data , 420 hp / 50 t
0
50
100
150
200
250
300
350
0 200 400 600 800 1000 1200
Time s
En
gin
e p
ow
er
kW
0
20
40
60
80
100
120
140
160
180
Dri
vin
g s
pe
ed
km
/h
Ro
ad
le
ve
l m
Engine power
Road level
Driving speed
07/06/2013 15
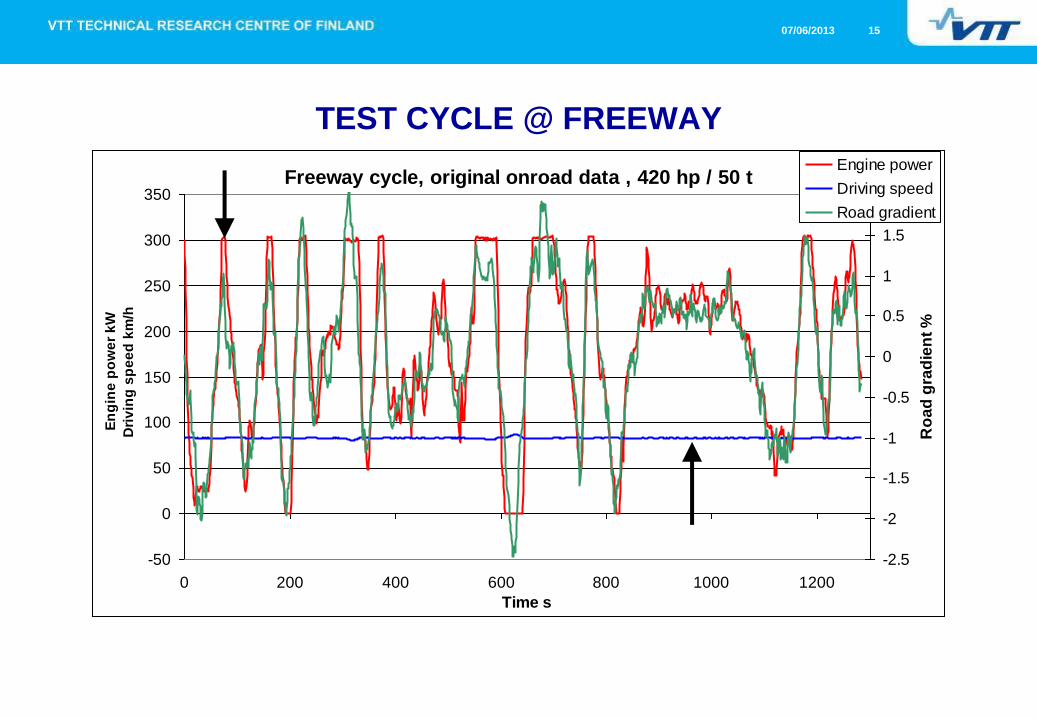
TEST CYCLE @ FREEWAY
Freeway cycle, original onroad data , 420 hp / 50 t
-50
0
50
100
150
200
250
300
350
0 200 400 600 800 1000 1200
Time s
En
gin
e p
ow
er
kW
Dri
vin
g s
pe
ed
km
/h
-2.5
-2
-1.5
-1
-0.5
0
0.5
1
1.5
2
Ro
ad
gra
die
nt
%
Engine power
Driving speed
Road gradient
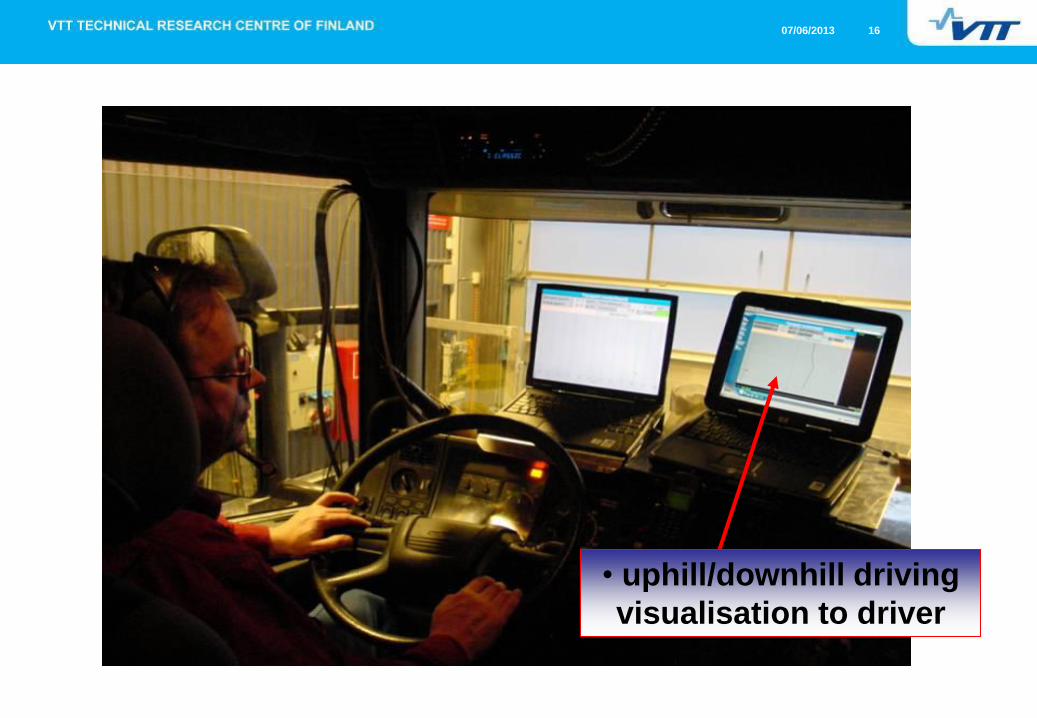
07/06/2013 16
• uphill/downhill driving
visualisation to driver
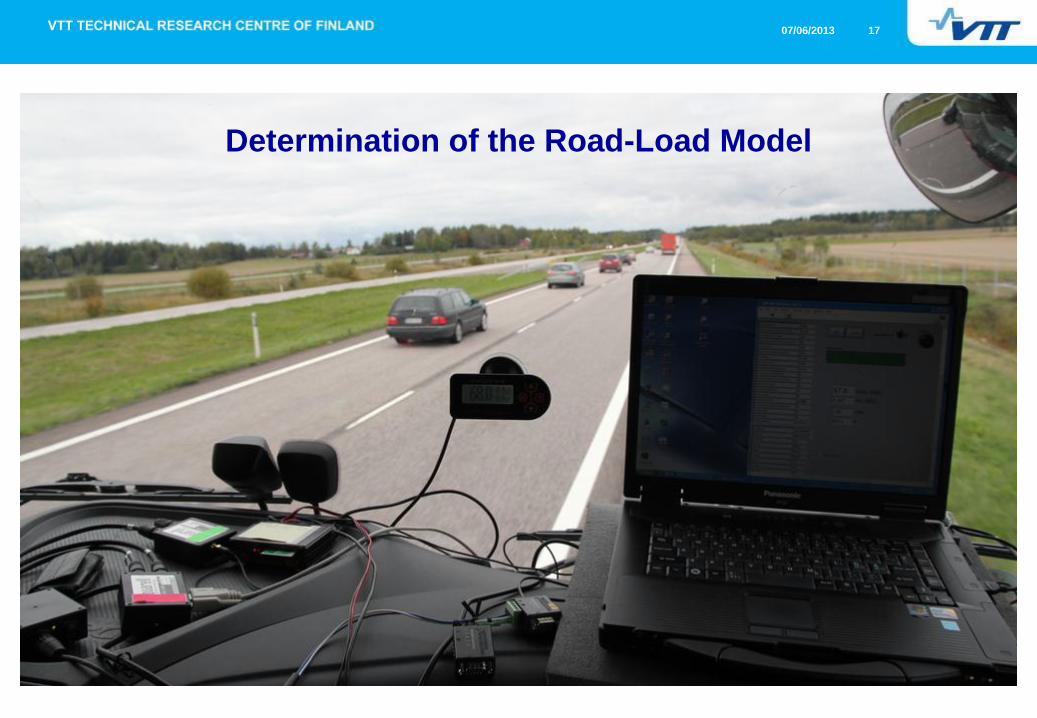
07/06/2013 17
Determination of the Road-Load Model
07/06/2013 18
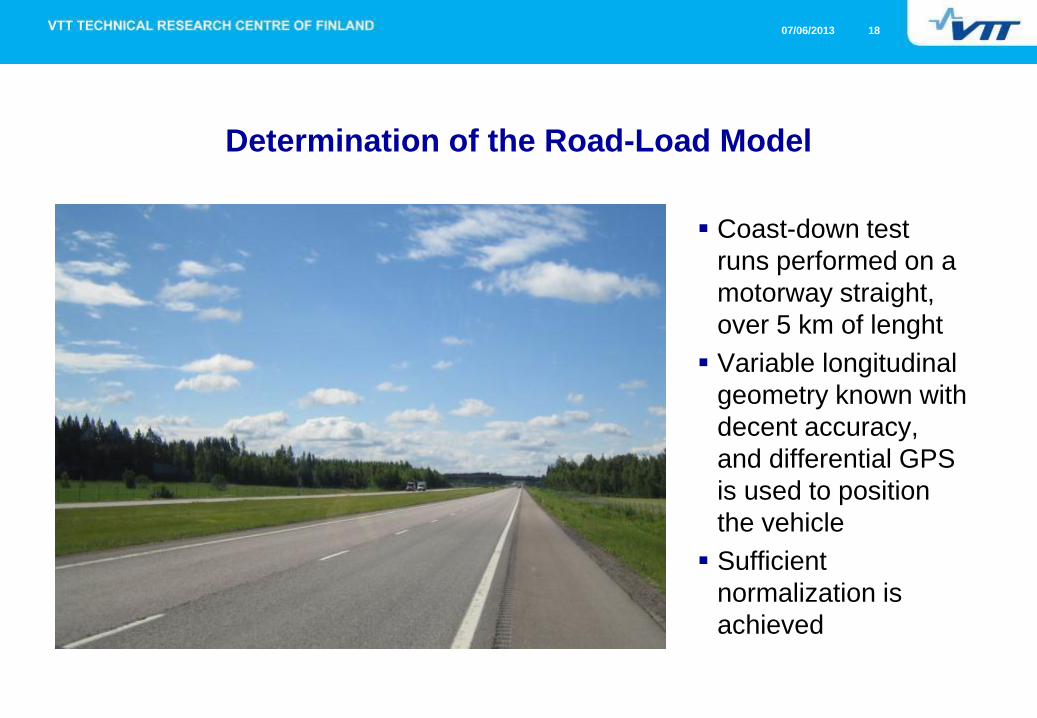
Determination of the Road-Load Model
Coast-down test
runs performed on a
motorway straight,
over 5 km of lenght
Variable longitudinal
geometry known with
decent accuracy,
and differential GPS
is used to position
the vehicle
Sufficient
normalization is
achieved
07/06/2013 19
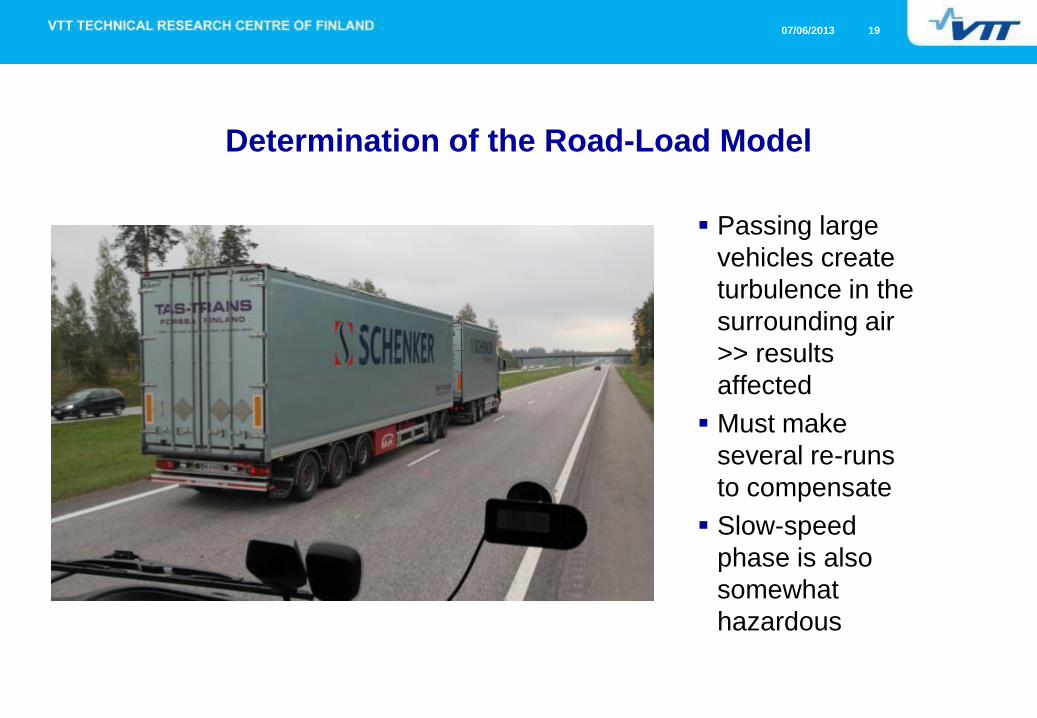
Determination of the Road-Load Model
Passing large
vehicles create
turbulence in the
surrounding air
>> results
affected
Must make
several re-runs
to compensate
Slow-speed
phase is also
somewhat
hazardous
07/06/2013 20
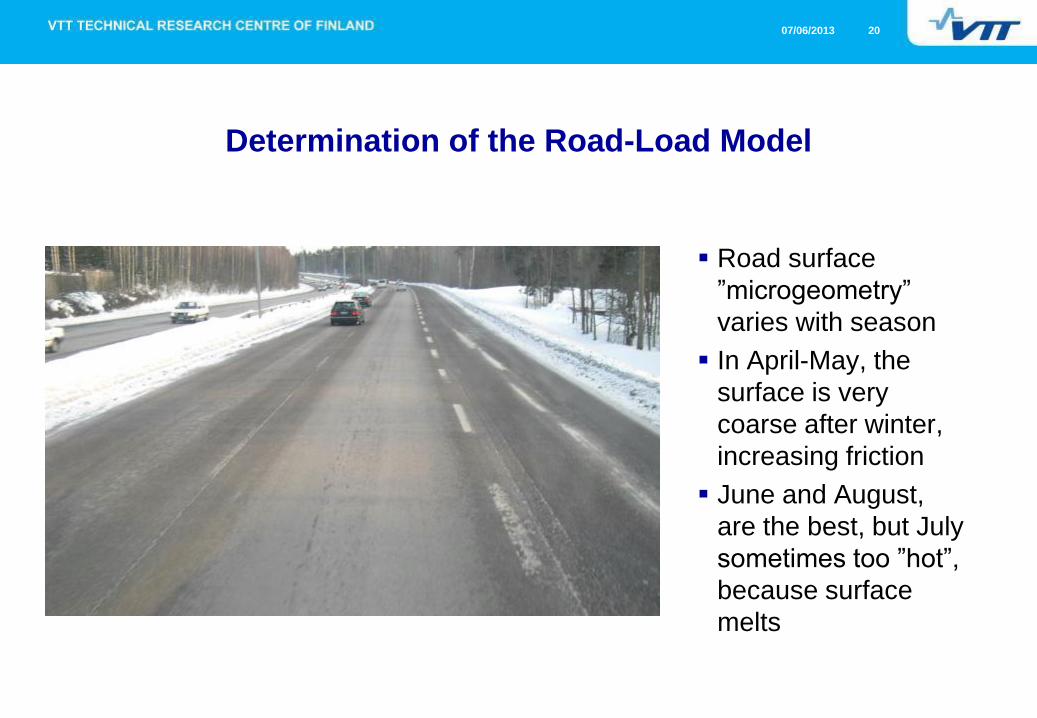
Determination of the Road-Load Model
Road surface
”microgeometry”
varies with season
In April-May, the
surface is very
coarse after winter,
increasing friction
June and August,
are the best, but July
sometimes too ”hot”,
because surface
melts
07/06/2013 21
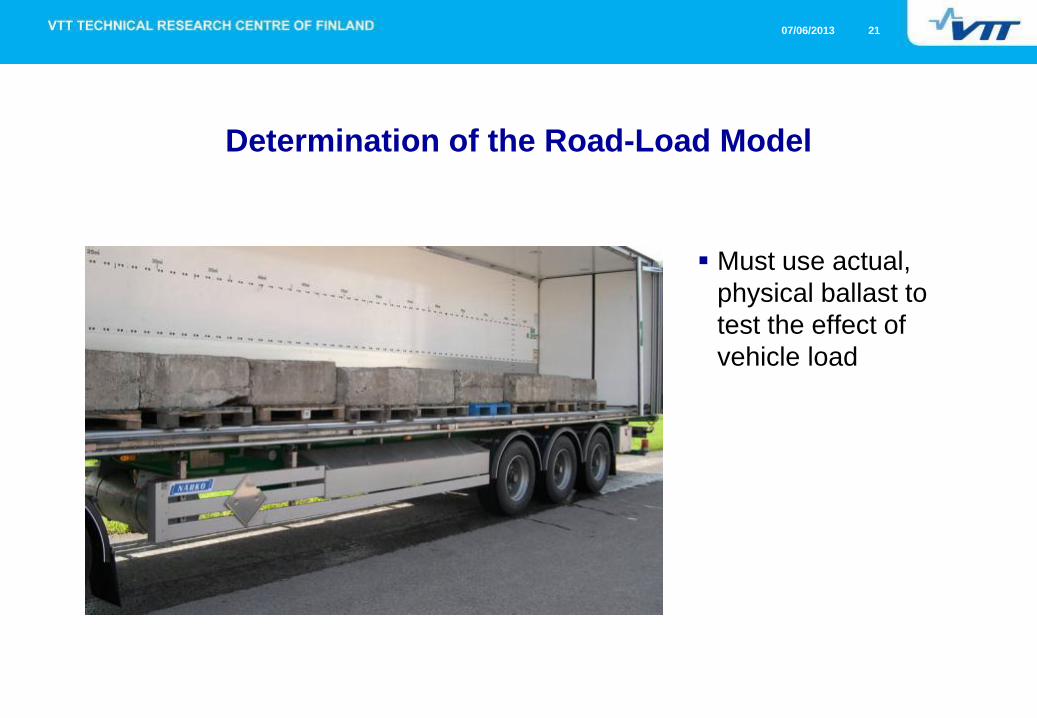
Determination of the Road-Load Model
Must use actual,
physical ballast to
test the effect of
vehicle load
07/06/2013 22
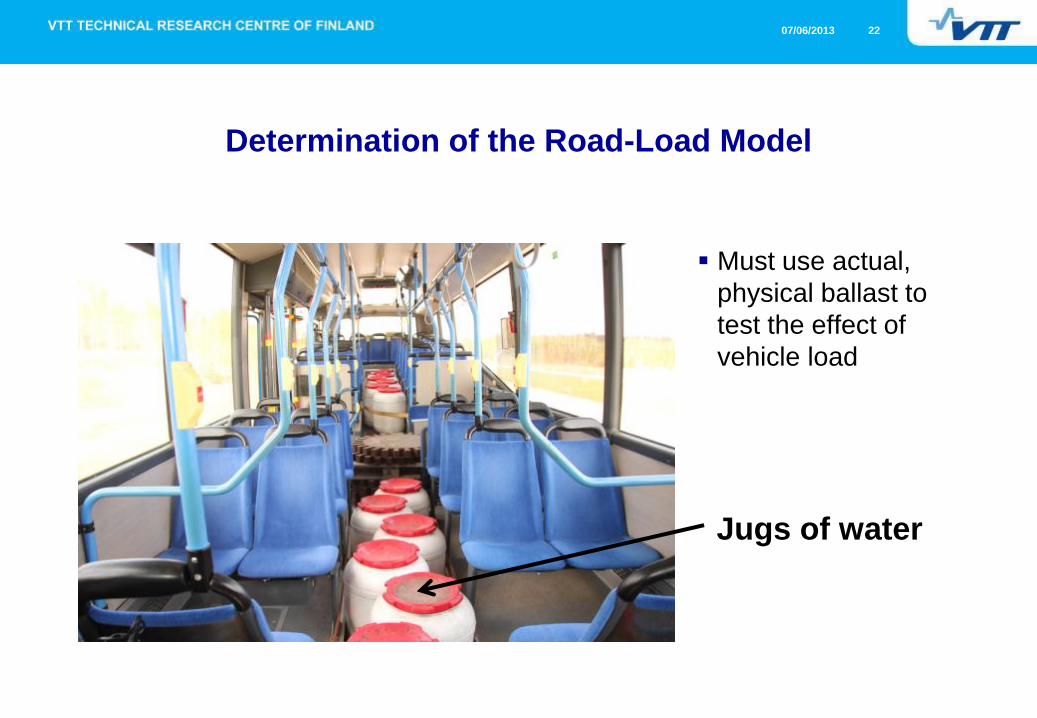
Determination of the Road-Load Model
Must use actual,
physical ballast to
test the effect of
vehicle load
Jugs of water
07/06/2013 23
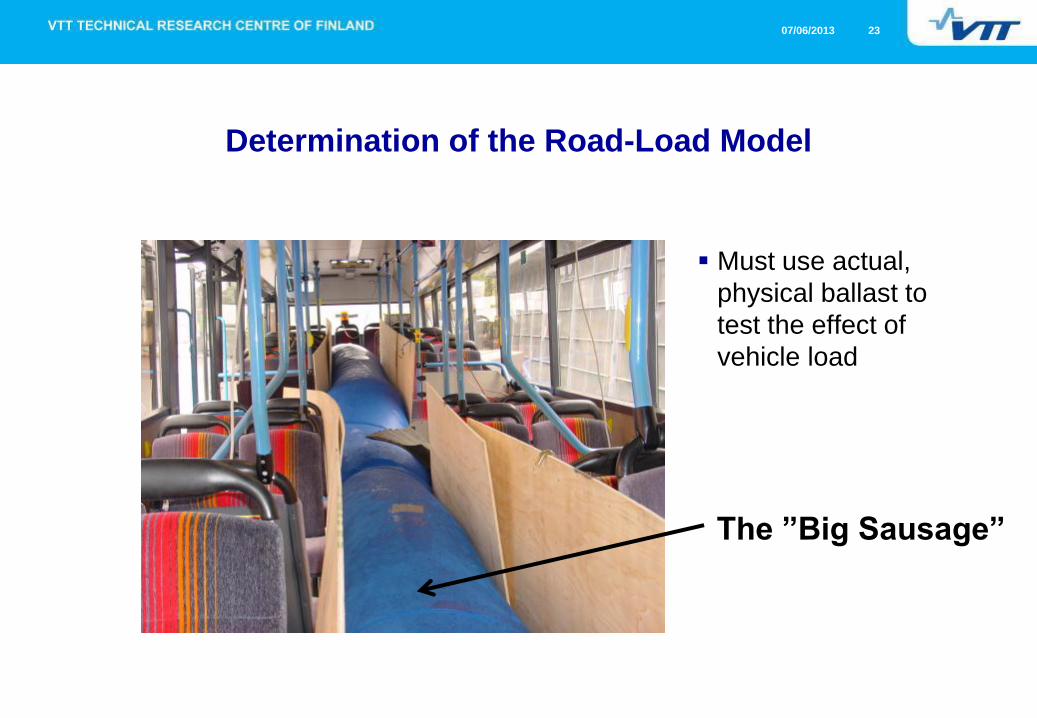
Determination of the Road-Load Model
Must use actual,
physical ballast to
test the effect of
vehicle load
The ”Big Sausage”
07/06/2013 24
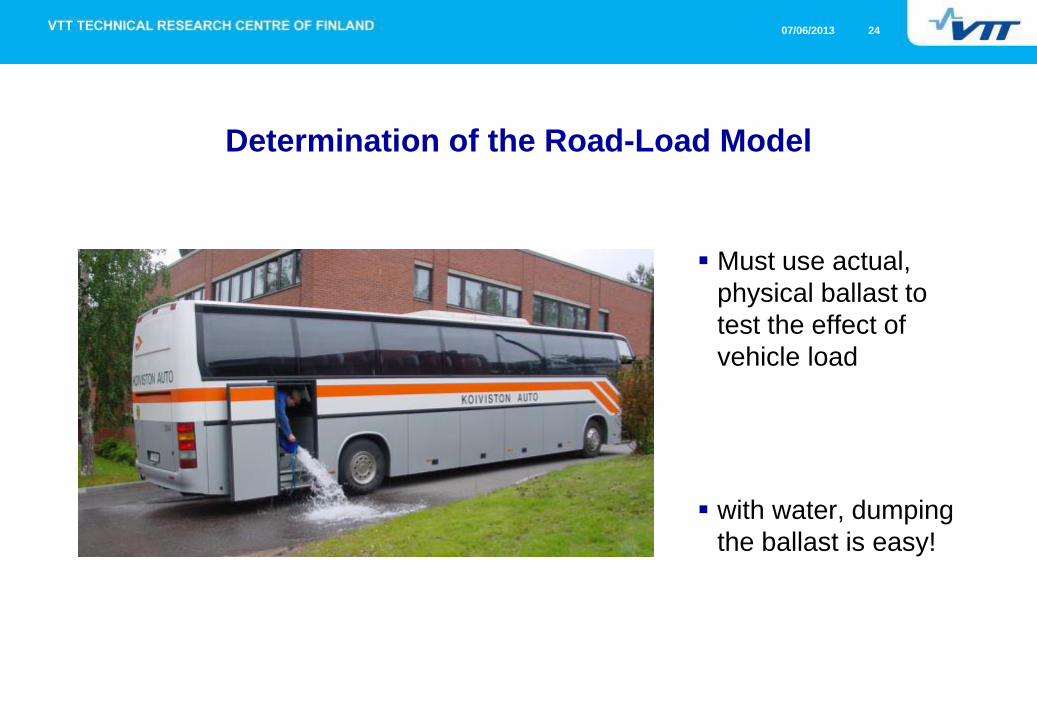
Determination of the Road-Load Model
Must use actual,
physical ballast to
test the effect of
vehicle load
with water, dumping
the ballast is easy!
07/06/2013 25
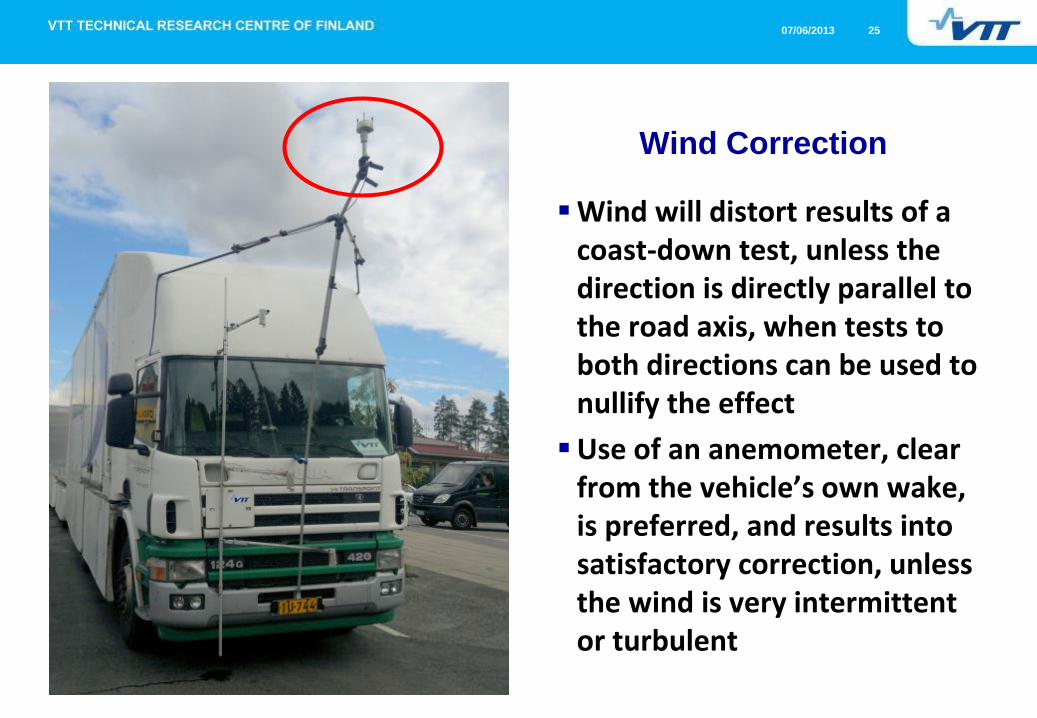
Wind Correction
Wind will distort results of a coast-down test, unless the direction is directly parallel to the road axis, when tests to both directions can be used to nullify the effect
Use of an anemometer, clear from the vehicle’s own wake, is preferred, and results into satisfactory correction, unless the wind is very intermittent or turbulent
07/06/2013 26
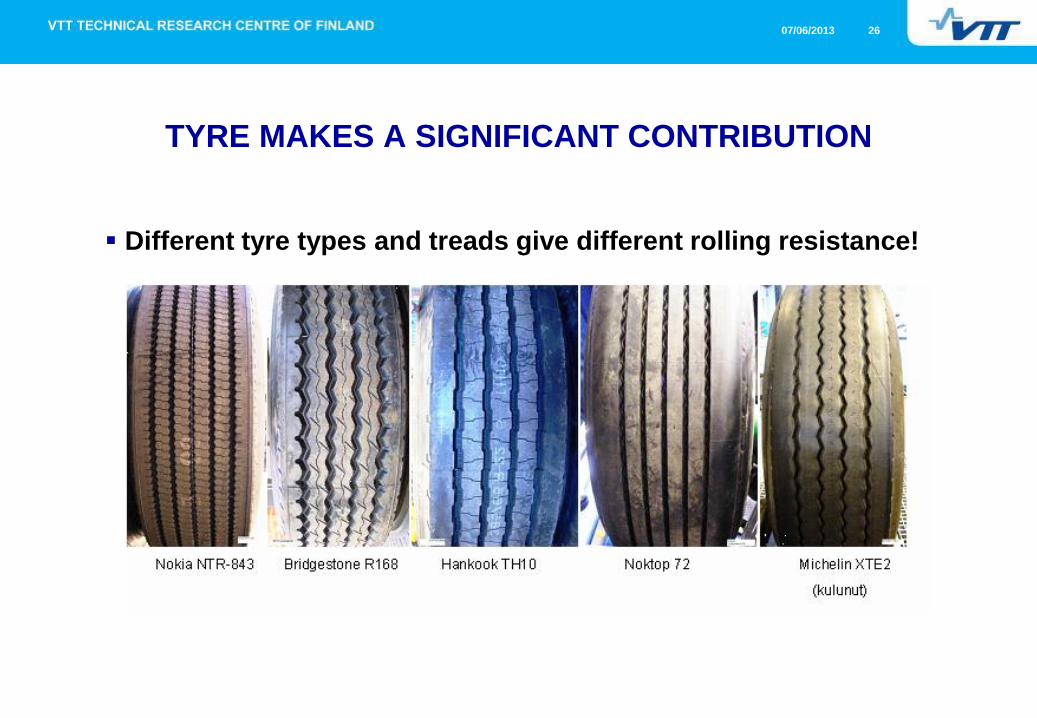
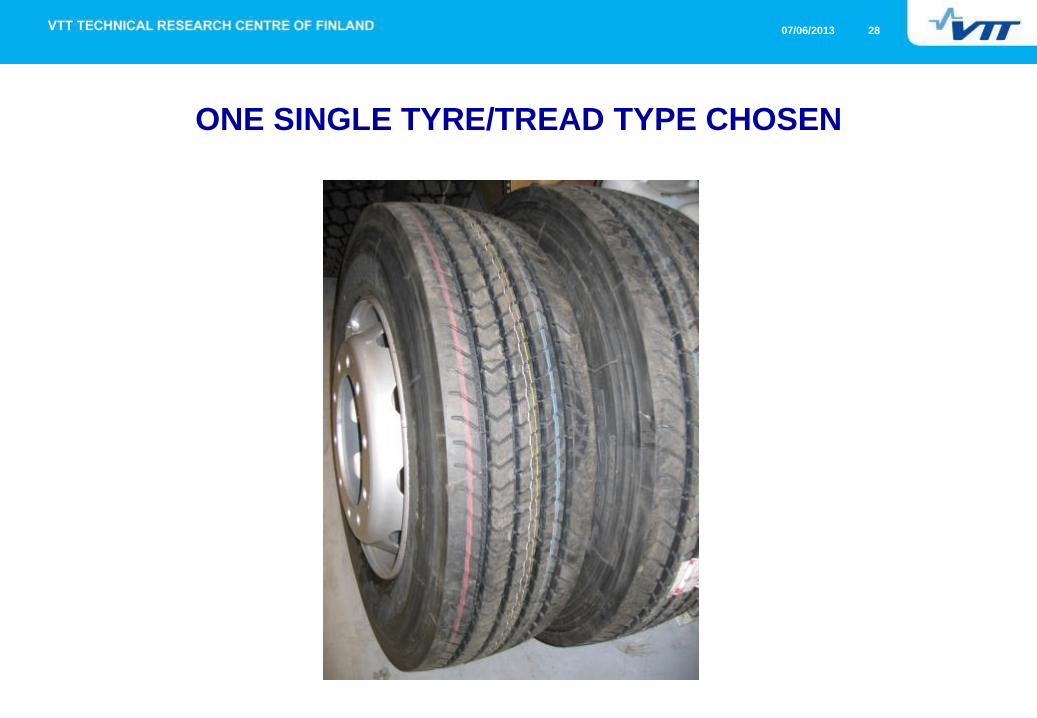
TYRE MAKES A SIGNIFICANT CONTRIBUTION
Different tyre types and treads give different rolling resistance!
07/06/2013 27
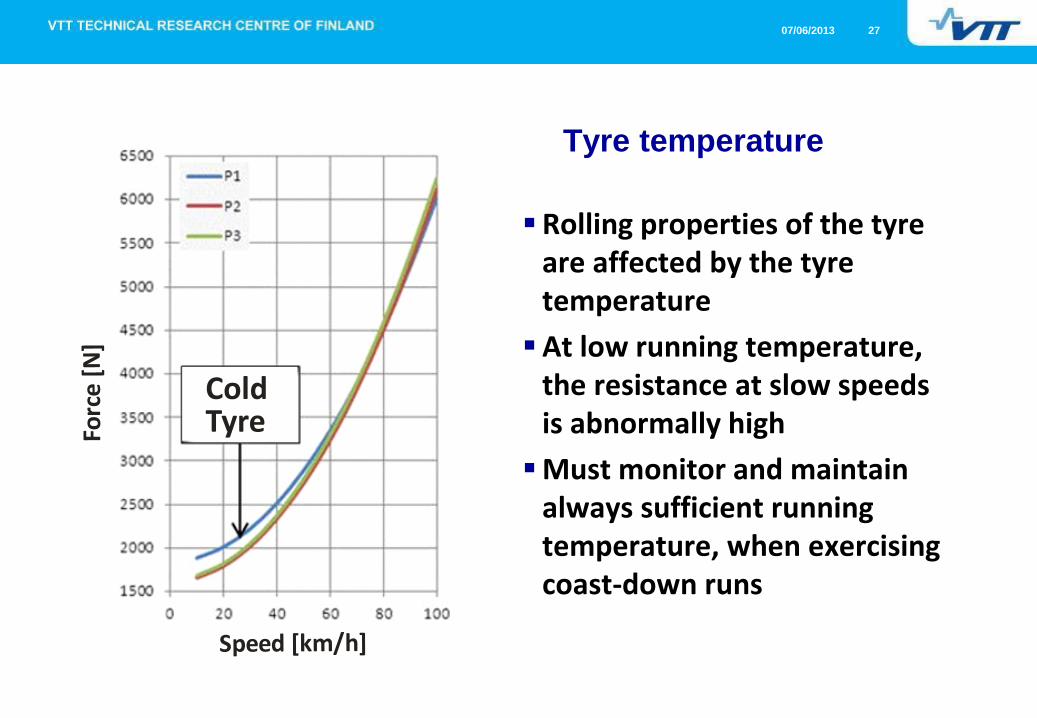
Tyre temperature
Rolling properties of the tyre are affected by the tyre temperature
At low running temperature, the resistance at slow speeds is abnormally high
Must monitor and maintain always sufficient running temperature, when exercising coast-down runs
ColdTyre
Speed [km/h]
Forc
e [N
]
07/06/2013 28
ONE SINGLE TYRE/TREAD TYPE CHOSEN
07/06/2013 29
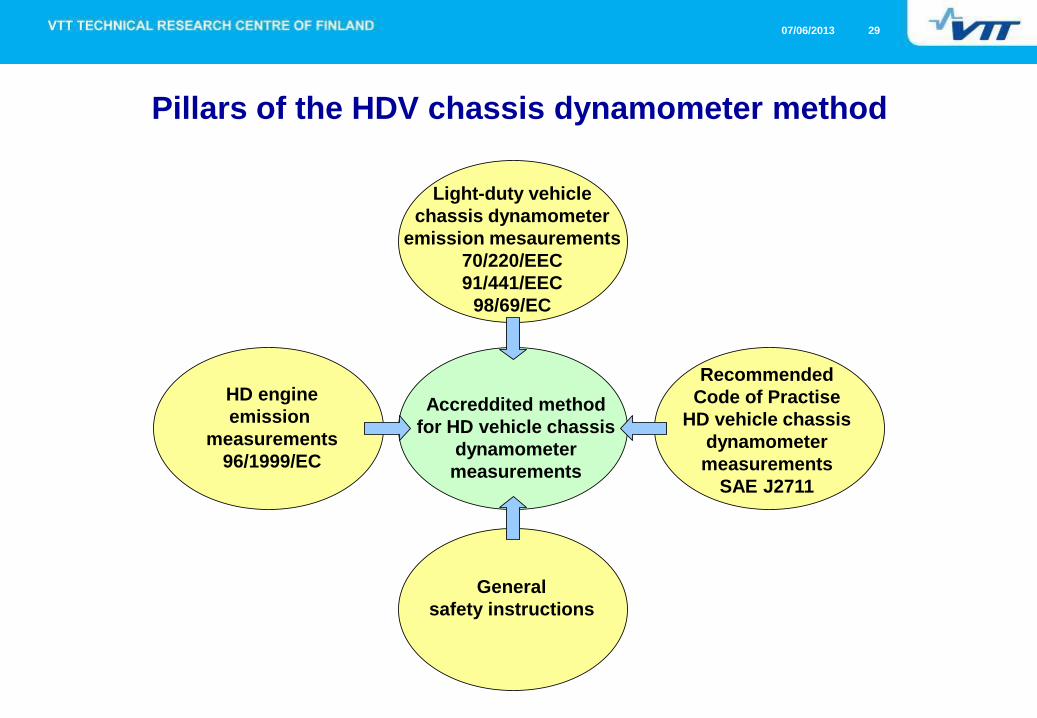
Light-duty vehicle
chassis dynamometer
emission mesaurements
70/220/EEC
91/441/EEC
98/69/EC
HD engine
emission
measurements
96/1999/EC
Accreddited method
for HD vehicle chassis
dynamometer
measurements
Recommended
Code of Practise
HD vehicle chassis
dynamometer
measurements
SAE J2711
General
safety instructions
Pillars of the HDV chassis dynamometer method
07/06/2013 30
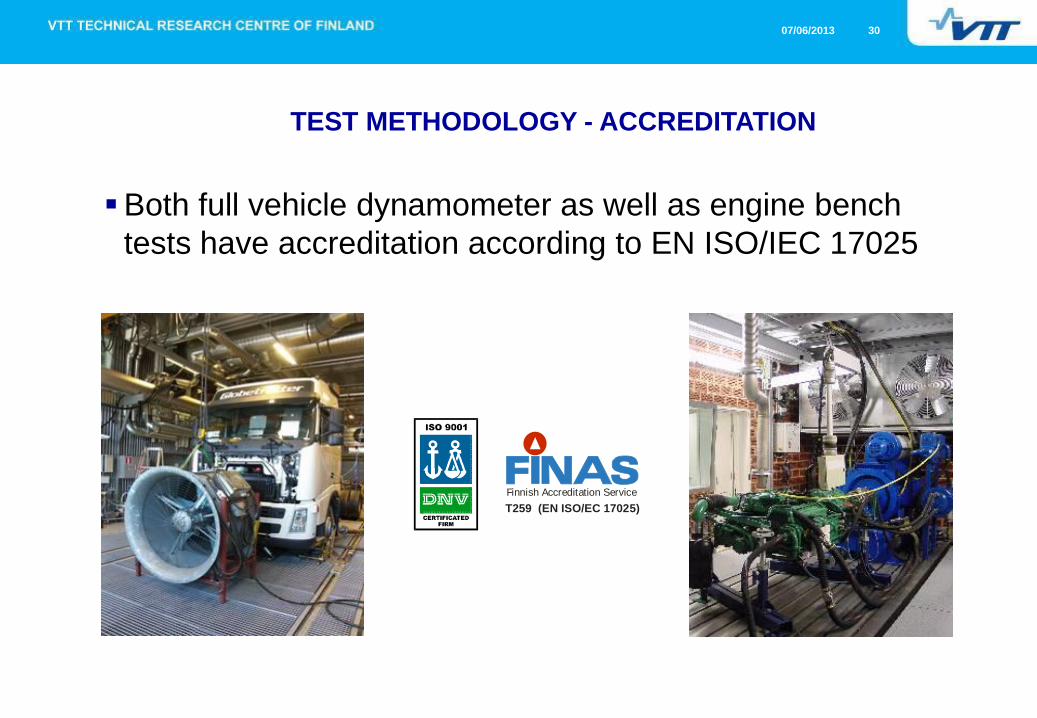
Both full vehicle dynamometer as well as engine bench
tests have accreditation according to EN ISO/IEC 17025
TEST METHODOLOGY - ACCREDITATION
T259 (EN ISO/EC 17025)
Finnish Accreditation Service
07/06/2013 31
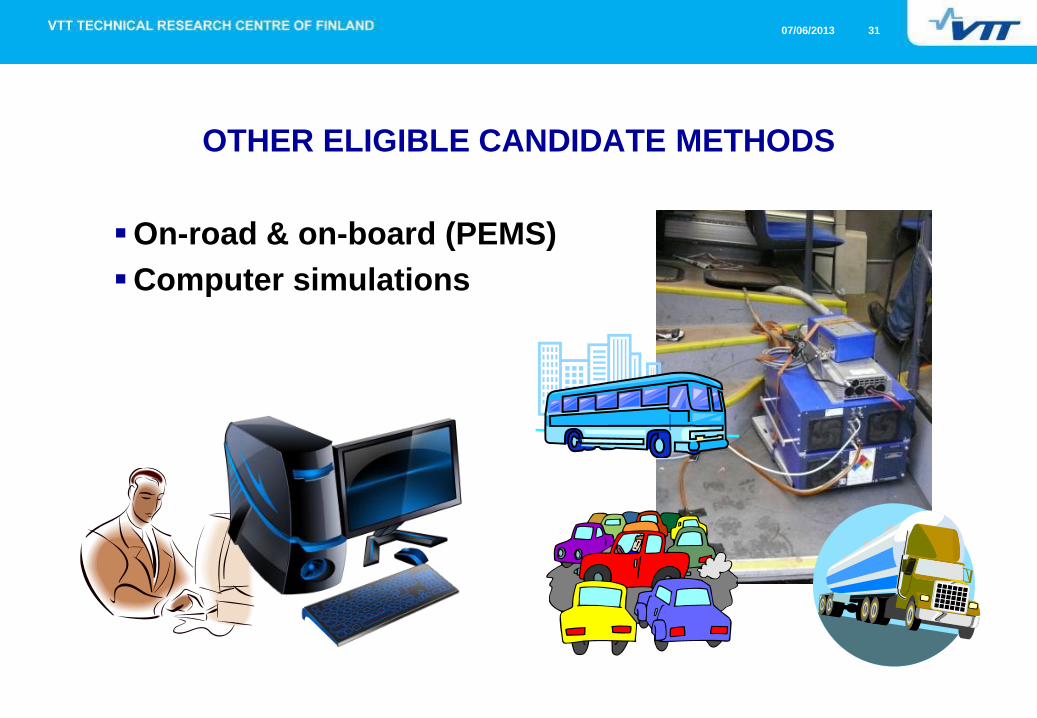
OTHER ELIGIBLE CANDIDATE METHODS
On-road & on-board (PEMS)
Computer simulations
07/06/2013 32
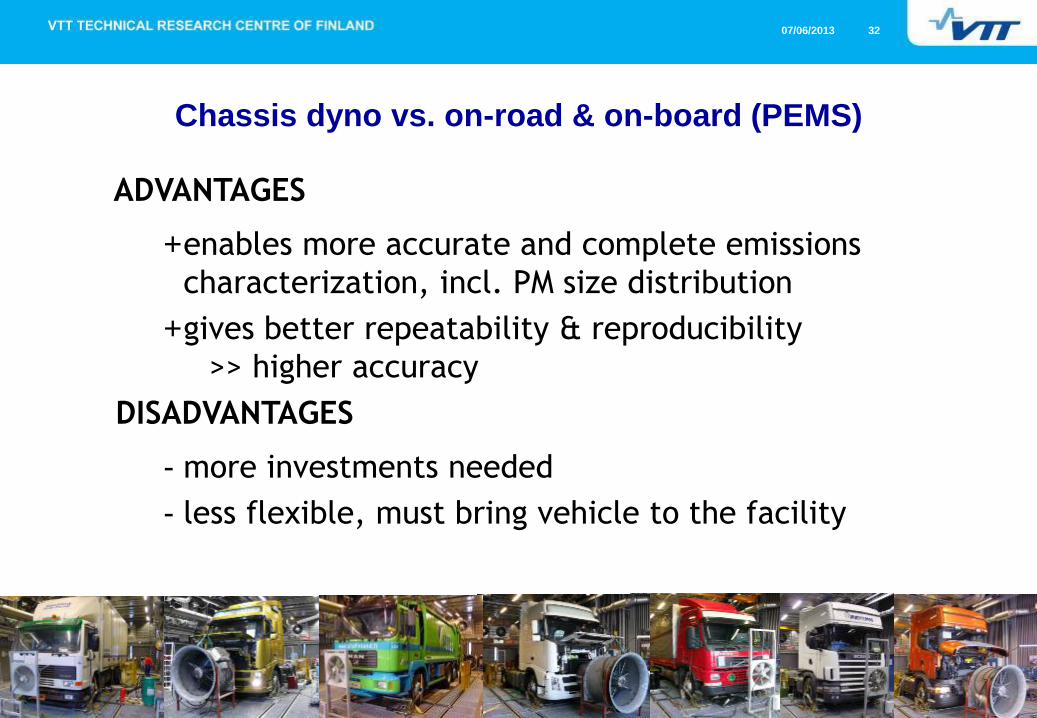
Chassis dyno vs. on-road & on-board (PEMS)
ADVANTAGES
+enables more accurate and complete emissions
characterization, incl. PM size distribution
+gives better repeatability & reproducibility
>> higher accuracy
DISADVANTAGES
- more investments needed
- less flexible, must bring vehicle to the facility
07/06/2013 33
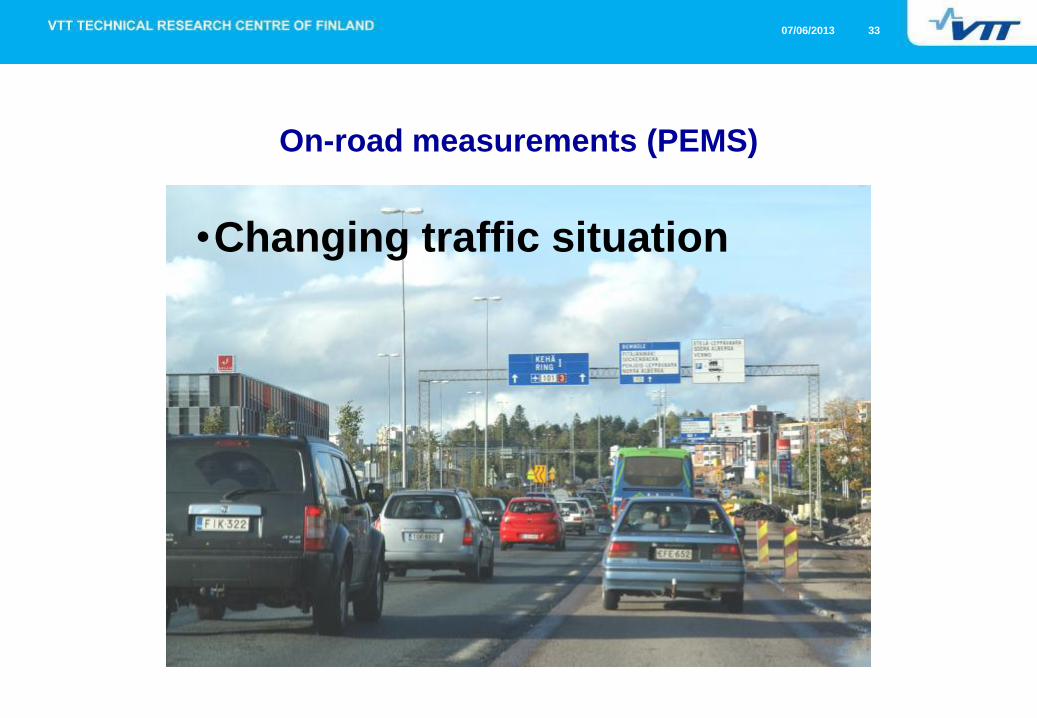
On-road measurements (PEMS)
•Changing traffic situation
07/06/2013 34
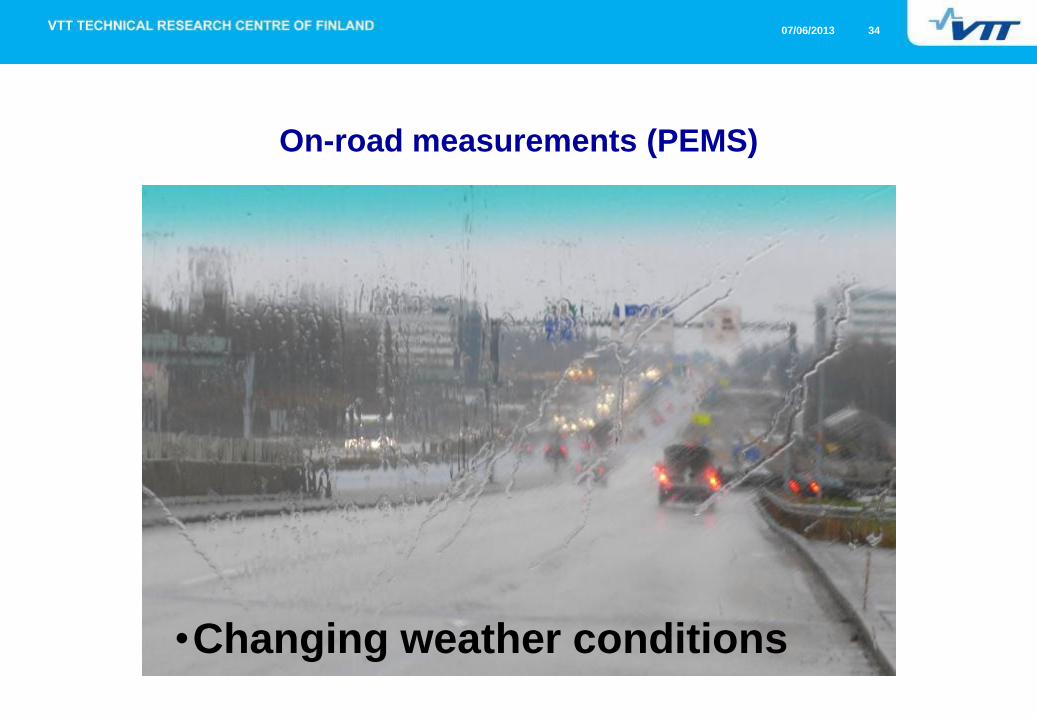
On-road measurements (PEMS)
•Changing weather conditions
07/06/2013 35
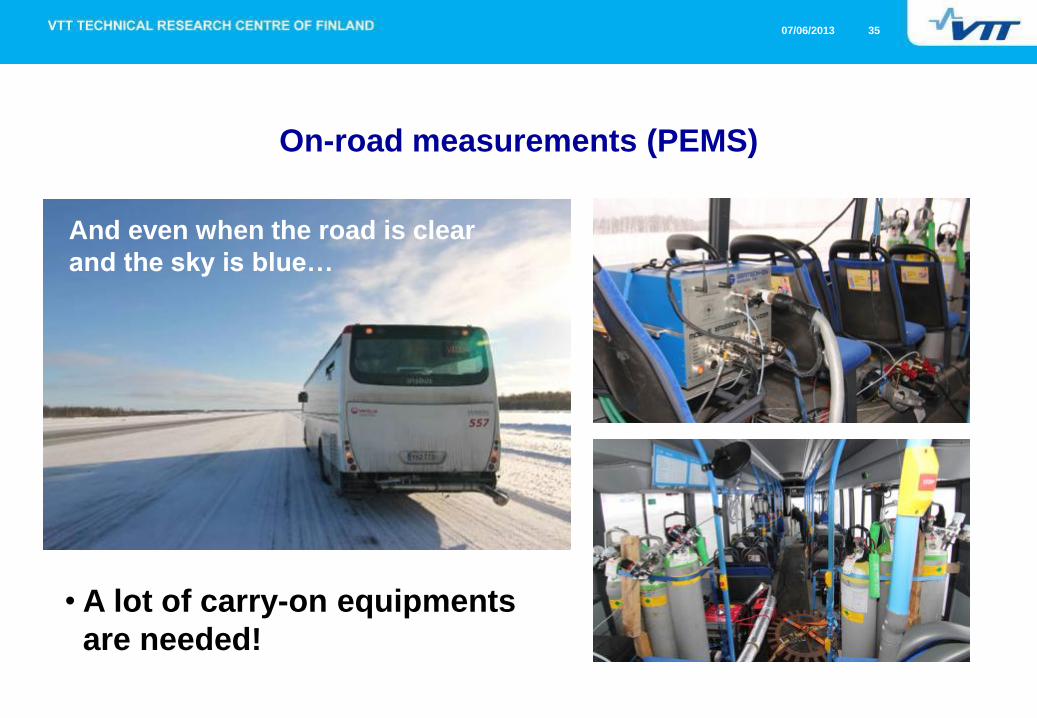
On-road measurements (PEMS)
• A lot of carry-on equipments
are needed!
And even when the road is clear
and the sky is blue…
07/06/2013 36
Chassis dyno vs. computer simulations
ADVANTAGES
+enables quicker, more direct approach
+results are usually “in the ballpark”
DISADVANTAGES
- more investments are needed
- less flexible, must produce vehicle before testing can
be imposed >> not an early design choice tool
07/06/2013 37
Challenges - Computer Simulations
Must develop models for each vehicle type
Must know the boundaries of the model
Must be able to calibrate the models
07/06/2013 39
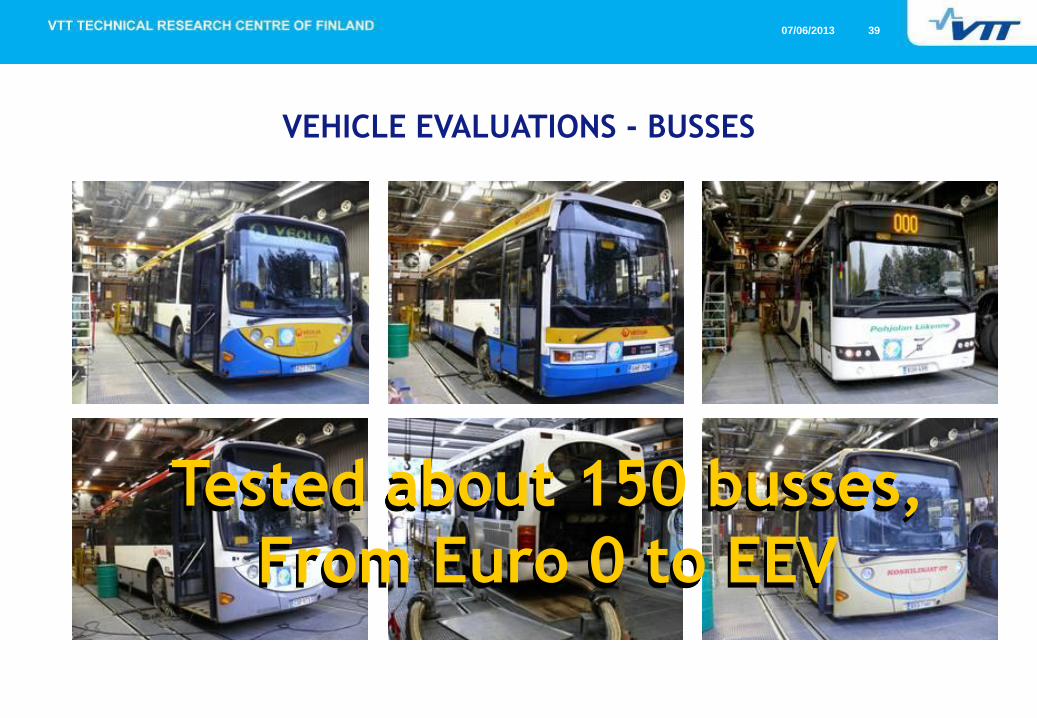
VEHICLE EVALUATIONS - BUSSES
Tested about 150 busses,
From Euro 0 to EEV
07/06/2013 40
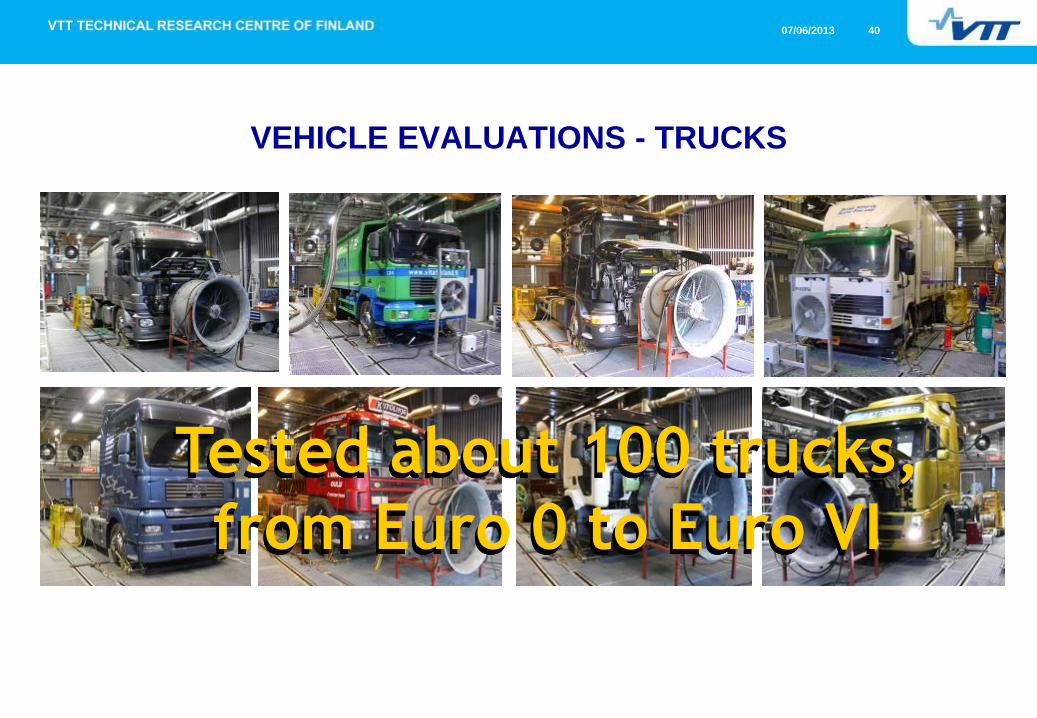
VEHICLE EVALUATIONS - TRUCKS
Tested about 100 trucks,
from Euro 0 to Euro VI
07/06/2013 41
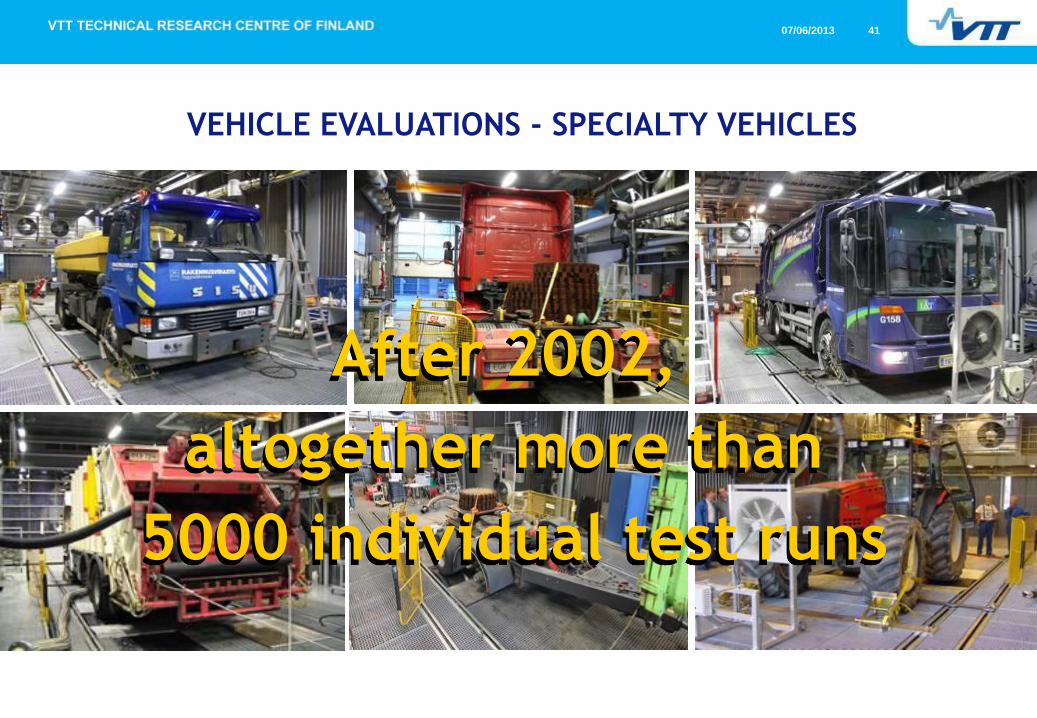
VEHICLE EVALUATIONS - SPECIALTY VEHICLES
After 2002,
altogether more than
5000 individual test runs
07/06/2013 42
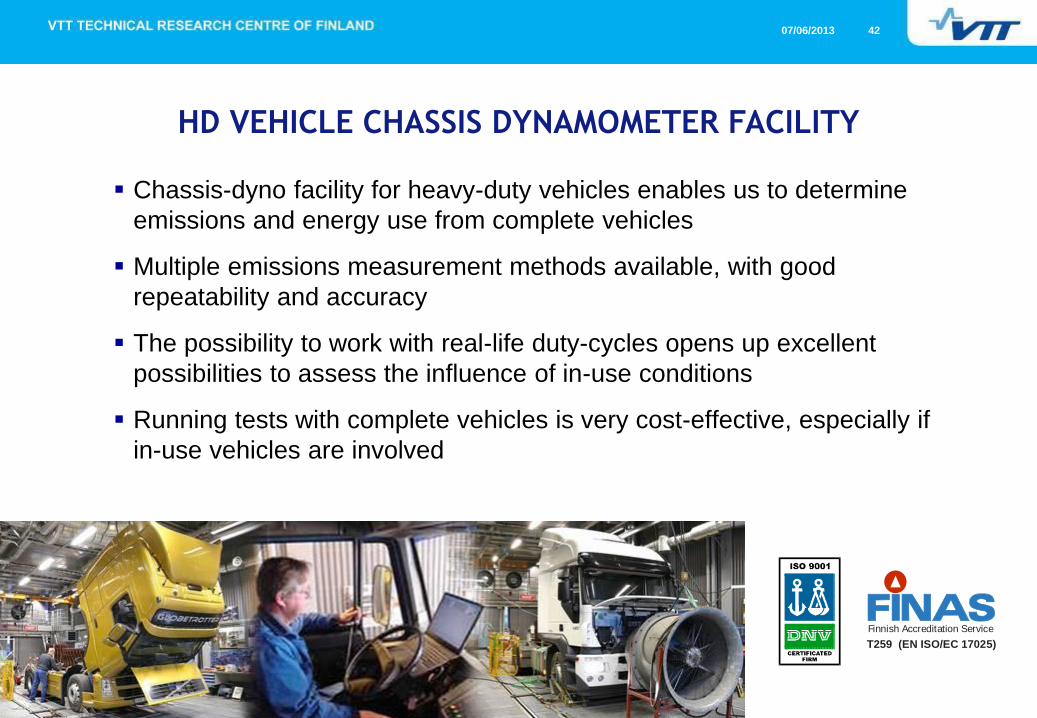
Chassis-dyno facility for heavy-duty vehicles enables us to determine
emissions and energy use from complete vehicles
Multiple emissions measurement methods available, with good
repeatability and accuracy
The possibility to work with real-life duty-cycles opens up excellent
possibilities to assess the influence of in-use conditions
Running tests with complete vehicles is very cost-effective, especially if
in-use vehicles are involved
HD VEHICLE CHASSIS DYNAMOMETER FACILITY
T259 (EN ISO/EC 17025)
Finnish Accreditation Service

07/06/2013 43
The End
Thank You for your Attention!
112
2
3
4
56
7
8
9
10
11
Contact me at [email protected]