Embed Size (px)
Citation preview
This volume is a product of the staff of the International Bank for Reconstruction and Development / The World Bank. The World Bank does not guarantee the accuracy of the data included in this work. The findings, interpretations, and conclusions expressed in this paper do not necessarily reflect the views of the Executive Directors of the World Bank or the governments they represent.
The material in this publication is copyrighted.
FINANCIAL SECTOR ASSESSMENT PROGRAM UPDATE
MEXICO
TECHNICAL NOTE: RISK MANAGEMENT PRACTICES AND STRESS TESTS OF COMMERCIAL BANKS, THE INSURANCE SECTOR, AND THE DERIVATIVES EXCHANGE
NOVEMBER 2006 THE WORLD BANK FINANCIAL AND PRIVATE SECTOR DEVELOPMENT VICE PRESIDENCY LATIN AMERICA & THE CARIBBEAN REGION VICE PRESIDENCY
INTERNATIONAL MONETARY FUNDMONETARY AND CAPITAL MARKETS
DEPARTMENT
Pub
lic D
iscl
osur
e A
utho
rized
Pub
lic D
iscl
osur
e A
utho
rized
Pub
lic D
iscl
osur
e A
utho
rized
Pub
lic D
iscl
osur
e A
utho
rized
2
Contents
Glossary .....................................................................................................................................3
I. Overview ................................................................................................................................4
II. Banking Sector ......................................................................................................................4 A. Institutions and their Risk Management Practices....................................................4 B. The Supervisors.........................................................................................................5 C. Risks Assessment ......................................................................................................5
III. Insurance Sector...................................................................................................................9
IV. The Derivatives Exchange.................................................................................................10 Tables 1. Interest Rate, Exchange Rate, Credit Risk Sensitivity Tests, and Credit Risk Tequila
Scenario, Effects on the Capital Adequacy Ratio............................................................11 2. Interest Rate, Exchange Rate, Sovereign Risk, Credit Risk Sensitivity Analysis
and Peer Scenario, Effects on the Capital Adequacy Ratio .............................................12 3a. Assumptions for Market Risk, Tequila Scenario ...............................................................13 3b. Assumptions for Market Risk, Oil Crisis Scenario............................................................14 4a. Market Risk Under a Tequila Scenario, Effects on the Capital Adequacy Ratio ..............15 4b. Market Risk Under an Oil Crisis Scenario, Effects on the Capital Adequacy Ratio.........15 5. Insurance Sector. Shocks on Premiums, Return, and Loss Rate, and Scenario
Effects on the Solvency Ratio..........................................................................................17 Figures 1. Asset/Liability Ratio for Commercial Banks.......................................................................16

3
GLOSSARY
ASIGNA Mexican Derivatives Exchange Clearinghouse BOM Bank of Mexico CAR Capital adequacy ratio CNBV Comisión nacional bancaria y de valores CNSF Comisión Nacional de Seguros y Fianzas LGD Loss-given-default MEXDER Mexico’s Derivatives Market SENICREB Servicio Nacional de Información de Créditos Bancarios OTC Over the counter UDI Unidad de Inversión VaR Value at risk
4
I. OVERVIEW
1. The note presents an overview of the risk management practices and stress test results carried out for the Mexican commercial banks and the insurance sector.1 The stress test results include the reporting of scenario analyses undertaken as part of the Mexico FSAP update to help in the assessment of the resilience of the financial system to a set of key risks. These scenarios complement other risk management practices such as liquidity risk and contagion analysis carried out by the relevant supervisors. It is important to recognize that scenario analyses are not general equilibrium analysis. Therefore, they are a poor guide to gauge the resilience to the shocks analyzed if macro policy framework, and/or the financial system were to diverge fundamentally from the current one.
2. The tests performed consisted of sensitivity and scenario analyses based on hypothetical and historical events. The bulk of the analysis consisted of bottom up approach. The single shocks attempted to measure the impact of a sudden shift in key relevant variables, such as the interest rate and the exchange rate, on the strength of the banking system, other things equal. The impact of individual shocks (that were assumed to be short-lived) was estimated by revaluing the banks’ balance sheet and tracking their impact on the system’s capital adequacy ratio (CAR). Likewise, the scenarios assessed the effects of a simultaneous proportional shift in a group of macroeconomic variables on the financial position of commercial banks and tracking their impact on the system’s CAR. These scenarios were based on recent and historical stress events in Mexico, as well as on the historical distribution of key macro variables for peer economies. In some simulations, the reverberation of the scenarios was tracked through a 12 to 18-month horizon.
3. What emerges from the analysis is a resilient private banking and insurance system. The stress tests suggest that the banking system is resilient to severe market and credit risk shocks. Although the authorities have accumulated significant knowledge on analyzing corporate credit risk, more needs to be done regarding credit risk arising from consumer and mortgage lending. In addition, it would be advisable to increase coordination between the research and credit risk units of Bank of Mexico (BOM), and between the CNBV and the treasury’s macro unit, in the design of top-down approaches.
4. The remainder of this note presents the methodologies and results of the analysis. Section II focuses on the banking sector, Section III focuses in the insurance sector and Section IV briefly reviews the contingency plans of the Derivatives Exchange.
II. BANKING SECTOR
A. Institutions and their Risk Management Practices
5. The risk management units of the systemically important banks appear to be independent. These risk units appear to be independent of their treasuries and are charged with monitoring liquidity risk under normal and stress scenarios, proposing market and credit
1 Prepared by Marco Espinosa-Vega.

5
exposure limits in VaR terms to their risk committees, reporting to their Boards the results of sensitivity analyses and stress scenarios on a regular basis, supporting risk-adjusted credit pricing, and monitoring their institutions’ operational risks.
6. Each bank is allowed to choose its own risk management methodology. Systemically important banks monitor risk taking, including with Value at Risk (VaR) and backtesting analysis to help in setting limits to lines of business, and early warning systems and triggers. The risk management practices of systemically important commercial banks are supported by internal models, reputable specialized vendors, and their foreign headquarters (where applicable). The risk committees of these banks must report their VaR and stress test results to their Boards.
B. The Supervisors
7. Oversight of banks has evolved significantly from rigid limits toward a risk-based approach. The Bank of Mexico (BOM) sets a liquidity coefficient for commercial banks’ U.S. dollar operations. Increasingly, the evaluation of liquidity risk in local currency and of other risks is guided by the financial institutions’ own risk management practices. In parallel, sensitivity and scenario analyses for credit and market risks are carried out by the BOM and the banks’ supervisor, the Comisión Nacional Bancaria y de Valores (CNBV). These regulators carry out monthly exercises to monitor the risk profile of commercial banks and report their findings (including the results of their VaR analysis) to their Boards. When supervisors detect increases in banks’ risk taking, they contact the relevant institutions to ascertain the nature of such an increase and to discuss the implementation of adequate controls, where appropriate.
C. Risks Assessment
Market risk
8. Stress tests were carried out to assess banks’ resilience to a variety of shocks. The stress tests were carried out for the universe of commercial banks in parallel by BOM and CNBV and the methodologies and shocks were chosen in consultation with the FSAP team. The shocks were based on historical stress scenarios, periods of heightened volatility, and historical distributions of key macro variables for peer economies.
9. The stress tests suggest that the banking system is resilient to market risk shocks. BOM and CNVB performed market risk analysis of the banking system based on large single-factor shocks. Individual shocks included a depreciation and appreciation of the peso exchange rate against the U.S. dollar, parallel shifts in the term structure of interest rates, and an inversion of the yield curve. In addition to these shocks, CNBV tracked the impact of a sovereign risk shock, and a drop in domestic equity prices on commercial bank trading books. The results suggest that, as of December 2005, exchange rate risk is not the main market risk. On average, a shock to sovereign risk which was proxied by a 180 bp increase in the EMBI, did not have an appreciable impact on the system’s CAR either. The most relevant shock to the banking system appears to be a sharp upward parallel shift in the yield curve (Tables 1 and 2) where one bank’s capital drops below the regulatory CAR.

6
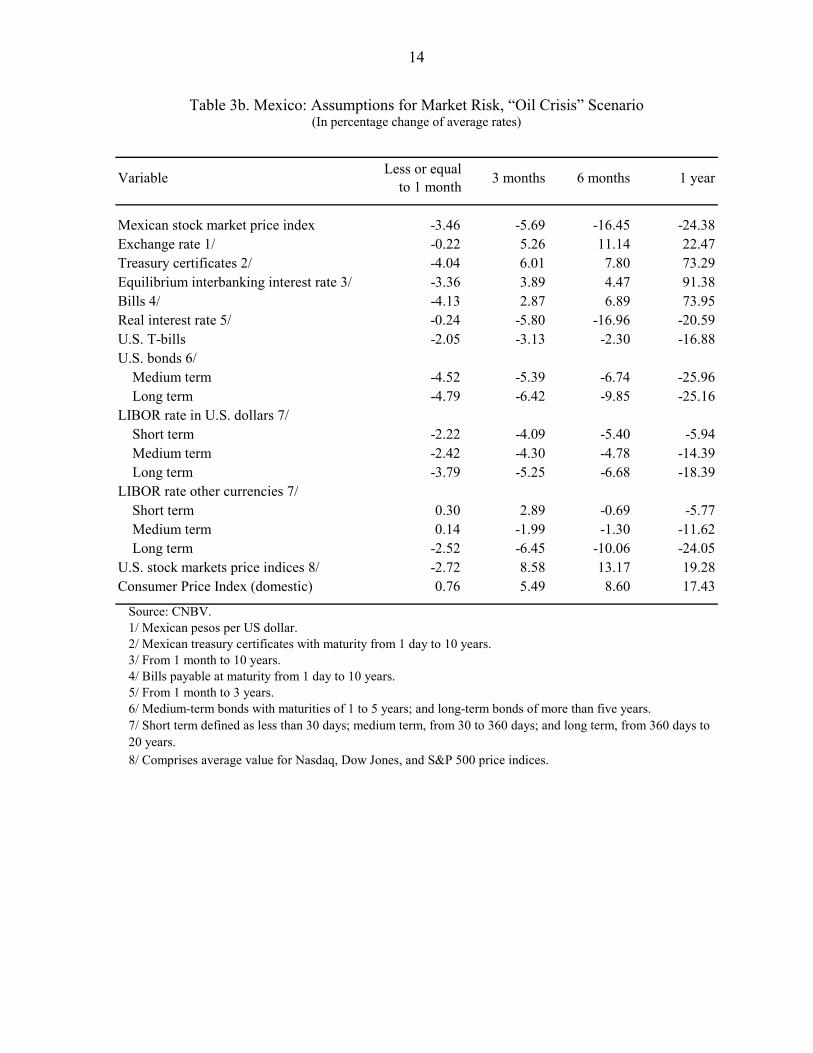
10. Banks were able to withstand “Tequila” and “Oil” scenarios analyzed by CNBV to assess market risk. The exercises consisted of assessing the sensitivity of all of the banking sector’s trading books to valuation changes of simultaneous financial shocks (including inflation, domestic and international equity prices, and interest rates). The shocks were calibrated proportionally to those observed up to 12 months from the onset of the 1994–95 crisis, and the sharp 1997–98 oil price drop (Tables 3a and 3b). Because of the severity of the scenario, bank’s capital would be affected more under the “Tequila” than under the oil scenario. Regardless of the shocks analyzed, the largest (and most profitable) banks would be affected proportionally more than other banks, although their capital adequacy ratio would never drop below the regulatory CAR (due in part to banks’ active use of hedging strategies). In the most extreme scenario, on average, large commercial banks lost 40 percent of regulatory capital (Tables 4a and 4b).
11. Additional stress tests confirm that the system is resilient to market risk shocks. The CNBV performed a “peer” scenario to assess market risk. The exercise consisted of combining a set of single hypothetical shocks. The shocks were based on the historical volatility observed in a set of peer countries’ macro variables that included: country risk, the U.S. dollar bilateral exchange rate, and short-term interest rates. The countries analyzed were those with similar S&P sovereign debt rating (namely BBB-, BBB and BBB+) and comprised Bulgaria, Croatia, Malaysia, Poland, South Africa, and Tunisia. In particular, the peer macro scenario consisted of assessing the sensitivity of the banking sector’s trading books to valuation changes from simultaneous shocks and tracking the resulting impact on the system’s CAR. The shocks included a combination of a 180 EMBI+ spread, a 30 percent depreciation in the exchange rate, an increase of 600 bp in the short term (Cete 28) interest rate, and a drop in the U.S. dollar-peso exchange rate by 30 percent. Under this “peer” scenario, the system’s CAR would go down to about 12.9 percent (Table 2).
Credit risk
12. The assessment of credit risk by BOM was based on a forward-looking methodology developed in house. Although CNBV also performs credit risk analysis for the banking system on a regular basis, this note focuses on BOM’s analysis. BOM’s default model (CyRCE)2 is closed form and assumes that the loan portfolio loss distribution can be characterized by its mean and its variance. This allows for the parameterization of relevant credit risk parameters, including obligor concentration.
Letting fi denote the ith (i = 1,2,....,N ) loan amount in the portfolio F = (f1, ..., fN ), assuming that all loans have different default probabilities p, so that π = (p1 , ..., pN ), with default covariance matrix Mi,j ≡ σ i,j for loans i≠j, the expression for the CyRCE VaR with confidence level α is given by:
2 For a detailed description see Javier Márquez Diez-Canedo, 2005, “A Simplified Credit Risk Model for Supervisory Purposes in Emerging Markets,” BIS paper No. 22.

7
⎟⎟⎠
⎞⎜⎜⎝
⎛+= )(
FFMFFFT
TT
FHzV
VVaR αα π
With the value of the portfolio, ∑=
=n
iifV
1 VFTπ the expected loss relative to the value of the
portfolio the confidence level factor, αz FFMFFT
T
the Rayleigh’s Quotient (loss variance
relative to the size of the portfolio) and H(F) the concentration index. And the VaR with confidence level α for economic activity j is given by:
⎟⎟
⎠
⎞
⎜⎜
⎝
⎛++= ∑
≠ ji j
ii,jT
jjjjα
j
jT
jj VFCF
))H(F,MR(FzV
FπVVaR 2φα
With denoting the value of the loan in segment j, jVj
jT
VFπ
denoting the weighted average
default probability of the loans in segment j, φ the adjustment factor so that = , the Rayleigh’s quotient for segment j . ∑
jjVaRα αVaR ),MR(F jj
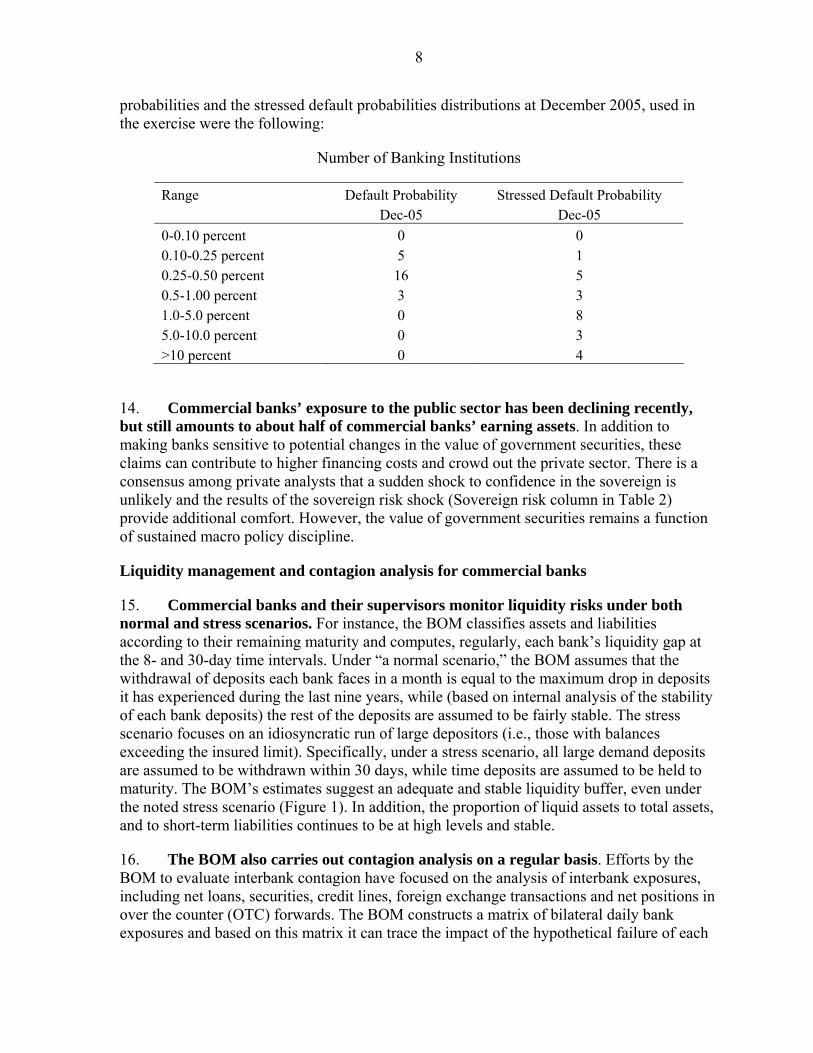
13. BOM’s traced the impact on commercial banks’ CAR of shocks to default rates of the corporate sector. The activities considered comprised: agriculture; commerce; construction; communications and transportation; services; and industrial activity. Relying on data from Servicio Nacional de Información de Créditos Bancarios (SENICREB), default rates for these sectors were estimated for December 2005. These default rates were then stressed proportionally, based on the default rates observed during the 1994–96 crisis, for all economic sectors and within each bank in a cumulative fashion for 18 consecutive months. These stressed corporate default rates were then used to estimate default probabilities and pair-wise correlations for all economic sectors within a bank. A one-month horizon, 99 percent confidence level VaR was then calculated for each of these eighteen months. Assuming that the portfolio loss distribution can be characterized by its mean and its variance and that the vector of default probabilities and the default co-variance matrix are given exogenously, the value at risk of the loan portfolio delivers the expected and unexpected losses. For the calculations of the expected losses, the loss-given-default (LGD) was assumed equal to one hundred percent. Analysis of the CAR computed considering the six month cumulative expected losses (to match the peak of the 1994 crisis) shows that at the peak of the stress event (six months after the initial stress trigger), two small banks could see their CAR falling under the regulatory 8 percent (see Table 1). It is important to note that for these stress tests, no specific assumptions are made regarding exchange rate, interest rates, or stock market value changes. Instead, for these stress tests, the focus is on replicating proportional default rates (or the stressed probabilities of default). Specifically, the estimated default
8
probabilities and the stressed default probabilities distributions at December 2005, used in the exercise were the following:
Number of Banking Institutions
Range Default Probability Stressed Default Probability Dec-05 Dec-05 0-0.10 percent 0 0 0.10-0.25 percent 5 1 0.25-0.50 percent 16 5 0.5-1.00 percent 3 3 1.0-5.0 percent 0 8 5.0-10.0 percent 0 3 >10 percent 0 4
14. Commercial banks’ exposure to the public sector has been declining recently, but still amounts to about half of commercial banks’ earning assets. In addition to making banks sensitive to potential changes in the value of government securities, these claims can contribute to higher financing costs and crowd out the private sector. There is a consensus among private analysts that a sudden shock to confidence in the sovereign is unlikely and the results of the sovereign risk shock (Sovereign risk column in Table 2) provide additional comfort. However, the value of government securities remains a function of sustained macro policy discipline.
Liquidity management and contagion analysis for commercial banks
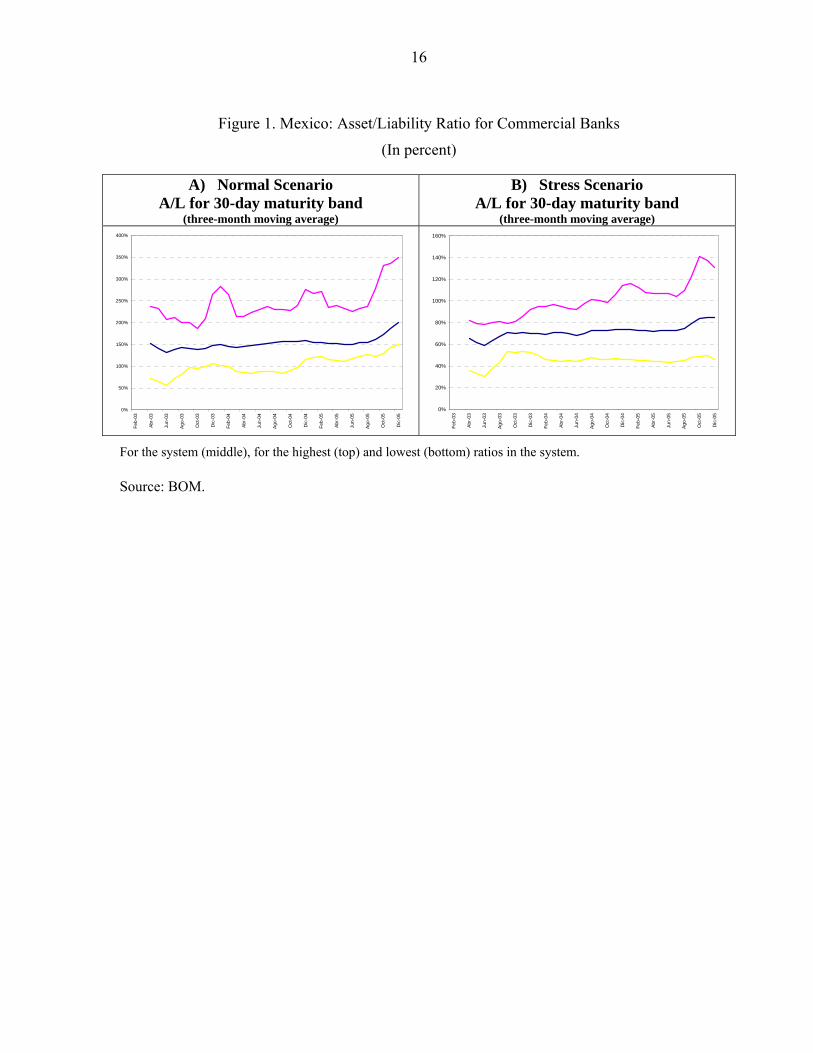
15. Commercial banks and their supervisors monitor liquidity risks under both normal and stress scenarios. For instance, the BOM classifies assets and liabilities according to their remaining maturity and computes, regularly, each bank’s liquidity gap at the 8- and 30-day time intervals. Under “a normal scenario,” the BOM assumes that the withdrawal of deposits each bank faces in a month is equal to the maximum drop in deposits it has experienced during the last nine years, while (based on internal analysis of the stability of each bank deposits) the rest of the deposits are assumed to be fairly stable. The stress scenario focuses on an idiosyncratic run of large depositors (i.e., those with balances exceeding the insured limit). Specifically, under a stress scenario, all large demand deposits are assumed to be withdrawn within 30 days, while time deposits are assumed to be held to maturity. The BOM’s estimates suggest an adequate and stable liquidity buffer, even under the noted stress scenario (Figure 1). In addition, the proportion of liquid assets to total assets, and to short-term liabilities continues to be at high levels and stable.
16. The BOM also carries out contagion analysis on a regular basis. Efforts by the BOM to evaluate interbank contagion have focused on the analysis of interbank exposures, including net loans, securities, credit lines, foreign exchange transactions and net positions in over the counter (OTC) forwards. The BOM constructs a matrix of bilateral daily bank exposures and based on this matrix it can trace the impact of the hypothetical failure of each

9
bank on the rest of the system, assuming different recovery rates. A bank failure is seen as leading to contagion when it triggers the fall in the capital adequacy ratio (CAR) of one or more institutions below 4 percent. Based on daily data for 2005, the degree of contagion in the banking sector did not appear systemic given that a relatively small number of institutions, representing a small share of the sector’s assets, would end up with a CAR below 4 percent.
Recommendations
17. The authorities could introduce some improvements to strengthen their stability analysis. First, it would be advisable to build a macro model that could generate sensible shock and scenarios for use in the financial sector vulnerability analysis. At the same time, this model could incorporate key financial sector variables to capture the feedback effects from the financial system to the real sector. This strengthening of the macrofinancial linkages analysis could be achieved through coordination between the research and credit risk units of BOM, and between the CNBV and the treasury’s macro unit, in the design of top-down approaches. In order to cross-check the stress test results of BOM and CNBV, these institutions could coordinate with commercial banks on the choice of a specific set of shocks and scenarios to be analyzed with the banks’ own methodologies and request the results of these tests. Second, although the authorities have accumulated significant knowledge on analyzing corporate credit risk, more needs to be done regarding credit risk arising from consumer and mortgage lending. For example, it is important to improve these sectors’ default history data. Although consumer and mortgage credit still represents a low share of commercial banks’ assets (on average around 15 percent) and household indebtedness to household disposable income (17 percent) is still moderate, limiting credit risks associated to these sectors. Nevertheless, given these credits’ recent fast growth, the authorities are well aware of the need to analyze these risks more closely. It would also be useful to combine the analysis of the hypothetical run on deposits with a shock on interest rates, given that liquidity stress scenarios are often associated with increases in interest rates. The analysis of liquidity risk under stress scenario could also be strengthened by introducing a less favorable assumption on withdrawals of time deposits.
III. INSURANCE SECTOR
18. The stress tests consisted in a dynamic solvency exercise coordinated with the supervisor Comisión Nacional de Seguros y Fianzas (CNSF). They were performed on the universe of insurance companies’ balance sheet exposures as of December 2005.
19. Solvency regulation in the insurance sector has evolved to include projections of liabilities to better assess the adequacy of reserves. Specifically, the CNSF has completed and implemented a dynamic solvency model, an important step toward the adoption of statutory solvency rules envisioned within the Solvency II framework. The model uses historical data to construct claim distributions for different lines of business. It allows the CNSF to calculate the probability of bankruptcy of each insurance company by stressing variables that affect its underwriting and overall profit. The output of this exercise guides conversations with the industry to monitor adequacy of reserves.

10
20. The insurance sector appears resilient to severe shocks. The CNSF conducted a series of sensitivity tests and scenario analysis based on a forward-looking, dynamic solvency testing models developed internally. Specifically, individual shocks and scenarios included: no premium growth in nominal terms (premium shock); an interest rate drop by 190 basis points in peso rates, 114 basis points in UDI rates and 114 basis points in the reference foreign interest rate; premiums shock plus loss rate increases; and premiums shock plus interest rate shock plus rate shock. Under the combined scenario, the number of insurance institutions with a solvency ratio below 1 percent increases from 4 as of December 2005 to 11, but they represent only about 7 percent of the market solvency requirement (Table 5).
IV. THE DERIVATIVES EXCHANGE
21. MexDer carried out a stress test to estimate the maximum loss associated with a stress scenario. The assumptions in the test included: a 100 percent depreciation of the peso-U.S. dollar exchange rate; a 15 percent drop in the IPC; an increase in Cete 91 by 360 basis points; and an increase in the TIIE by 270 basis points. Assuming different levels of default on this loss, MexDer found that the resources in each clearing trust in default and those belonging to the same financial group, would have sufficed to stem the problem without Mexican Derivatives Exchange Clearinghouse (ASIGNA) having to mutualize any of the losses or to use its own equity. Thus, MexDer’s five-step contingency plan appears adequate. In case of a default on the loss under a stress scenario, MexDer’s contingency plan calls for: (a) drawing from the resources of each of the clearing trusts in default; (b) drawing on the resources of other clearing trusts; (c) ASIGNA using the resources of the clearing fund; (d) ASIGNA requiring the mutualization of the loss using the resources of the rest of the clearing trusts and their minimum equity; and (e) ASIGNA contributing from its own equity, if necessary.

Table 1. Mexico: Interest Rate, Exchange Rate, Credit Risk Sensitivity Tests, and Credit Risk “Tequila” Scenario, Effects on the Capital Adequacy Ratio (CAR)
CAR after shocks
CAR before shocks as of December
2005 1/
Depreciation of the
exchange rate 2/
Appreciation of the
exchange rate 3/
Impact of a parallel shift in the term structure
4/
Impact of a parallel
shift in the term
structure 5/
Impact of a inversion in
the term structure of the interest
rate 6/
Credit risk “Tequila” scenario
7/
(In number of financial institutions) Above the minimum CAR by: more than 50 percent 24 25 24 22 25 25 16 30 to 50 percent 3 1 3 4 2 1 6 20 to 30 percent 0 0 0 0 0 1 3 10 to 20 percent 0 0 0 0 0 0 1 0 to 10 percent 0 0 0 0 0 0 1
11
Below minimum CAR 8/ 0 0 0 1 0 0 2 Total number of institutions 27 27 27 27 27 27 29*
Source: BOM. 1/ Only results for commercial banks are reported. 2/ The depreciation of the exchange rate is equal to 30 percent. 3/ The appreciation of the exchange rate is equal to 30 percent. 4/ A parallel upward shift in the term structure of interest rates is equal to 500 bp. 5/ A parallel downward shift in the term structure of interest rates is equal to 500 bp. 6/ An increase by 500 bp in rates < 1 year; an increase by 200 bp in rates (1-3 years); and an increase by 150 bp in rates > 3 years. 7/ Proportional default probabilities and correlations calibrated to the 1994-95 “Tequila” crisis. 8/ Minimum capital adequacy ratios for banks are 8 percent. * Two merged institutions are considered as separate.

12
Table 2. Mexico: Interest Rate, Exchange Rate, Sovereign Risk, Sensitivity Analysis and “Peer” Scenario, Effects on the Capital Adequacy Ratio (CAR)
CAR after shocks
CAR
Dec 2005
Yield curve shift 1/
Sovereign risk 2/
Exchange rate depreciation
3/ Equity prices
4/
“Peer” scenario
5/ Commercial banks 6/ 14.31 12.98 14.18 14.42 14.28 12.89
Banca Múltiple I 14.16 12.69 14.01 14.25 14.13 12.56 Banca Múltiple II 14.35 13.81 14.34 14.45 14.34 13.87
Source: CNBV. 1/ A 600 parallel shift in the Cetes, TIIE, and PRLV rates. 2/ A 180 bp increase in the EMBI spread Mex. 3/ A 30-percent depreciation in the exchange rate. 4/ A drop in the stock exchange index (IPC) by 30 percent. 5/ “Peer” stress scenario: shocks 1–4 jointly. 6/ Banca Multiple I and II refer to the largest and smallest banks, respectively.

13
Table 3a. Mexico: Assumptions for Market Risk,“Tequila” Scenario (In percentage change of average rates)
VariableLess or equal
to 1 month 3 months 6 months 1 year
Mexican stock market price index 1.49 -28.25 -9.14 28.27Exchange rate 1/ 32.75 77.32 56.41 89.41Treasury certificates 2/ 69.48 413.68 173.22 171.70U.S. T-bills 2.04 -0.02 -0.10 -0.18U.S. bonds 3/ Medium term 0.96 -11.84 -25.81 -31.63 Long term 0.46 -10.99 -27.44 -34.46LIBOR rate in U.S. dollars 4/ Short term 1.40 3.16 2.11 -3.16 Medium term 0.56 -5.75 -13.48 -18.82 Long term 0.76 -13.10 -27.36 -33.83LIBOR rate in other currencies 4/ Short term 2.61 8.03 -6.58 -18.92 Medium term 0.90 -3.37 -20.33 -32.16 Long term 1.43 -7.46 -23.08 -31.88U.S. stock markets price indices 5/ 0.99 8.44 21.47 36.42Consumer Price Index (domestic) 1.25 13.86 32.73 52.75
Source: CNBV.1/ Mexican pesos per U.S. dollar.2/ Mexican treasury certificates with maturity of less than one year. 3/ Medium-term bonds with maturities of 1 to 5 years; and long-term bonds of more than five years.
5/ Comprises average value for Nasdaq, Dow Jones, and S&P 500 price indices.
4/ Short term defined as less than 30 days; medium term, from 30 to 360 days; and long term, above 360 days to 20 years.
14
Variable Less or equal to 1 month 3 months 6 months 1 year
Mexican stock market price index -3.46 -5.69 -16.45 -24.38Exchange rate 1/ -0.22 5.26 11.14 22.47Treasury certificates 2/ -4.04 6.01 7.80 73.29Equilibrium interbanking interest rate 3/ -3.36 3.89 4.47 91.38Bills 4/ -4.13 2.87 6.89 73.95Real interest rate 5/ -0.24 -5.80 -16.96 -20.59U.S. T-bills -2.05 -3.13 -2.30 -16.88U. LoLIBO Sho LoLIBO Sho LoU.Consu
Sou1/2/3/4/5/6/
8/
7/20 y
S. bonds 6/ Medium term -4.52 -5.39 -6.74 -25.96
ng term -4.79 -6.42 -9.85 -25.16R rate in U.S. dollars 7/rt term -2.22 -4.09 -5.40 -5.94
Medium term -2.42 -4.30 -4.78 -14.39ng term -3.79 -5.25 -6.68 -18.39R rate other currencies 7/rt term 0.30 2.89 -0.69 -5.77
Medium term 0.14 -1.99 -1.30 -11.62ng term -2.52 -6.45 -10.06 -24.05
S. stock markets price indices 8/ -2.72 8.58 13.17 19.28mer Price Index (domestic) 0.76 5.49 8.60 17.43
rce: CNBV. Mexican pesos per US dollar. Mexican treasury certificates with maturity from 1 day to 10 years. From 1 month to 10 years. Bills payable at maturity from 1 day to 10 years. From 1 month to 3 years. Medium-term bonds with maturities of 1 to 5 years; and long-term bonds of more than five years.
Comprises average value for Nasdaq, Dow Jones, and S&P 500 price indices.
Short term defined as less than 30 days; medium term, from 30 to 360 days; and long term, from 360 days to ears.
Table 3b. Mexico: Assumptions for Market Risk, “Oil Crisis” Scenario (In percentage change of average rates)

15
Table 4a. Mexico: Market Risk Under a “Tequila” Scenario, Effects on the Capital Adequacy Ratio (CAR)
CAR 1 day 5 days 1 month 3 months 6 months 12 months
Banca Comercial 14.31 14.54 12.91 11.88 9.05 11.59 12.53 Banca Múltiple I 14.16 14.40 12.63 11.54 8.60 11.25 12.27 Banca Múltiple II 14.35 14.32 14.14 13.59 11.96 13.39 13.29
Source: CNBV.
Table 4b. Mexico: Market Risk Under an “Oil Crisis” Scenario,
Effects on the Capital Adequacy Ratio (CAR)
ICAP 1 day 5 days 1 month 3 months 6 months 12 months Banca Comercial 14.31 14.36 14.46 14.45 14.21 14.12 13.18
Banca Múltiple I 14.16 14.21 14.33 14.32 14.04 13.93 12.89 Banca Múltiple II 14.35 14.35 14.40 14.39 14.32 14.34 13.73
Source: CNBV.
16
Figure 1. Mexico: Asset/Liability Ratio for Commercial Banks
(In percent)
A) Normal Scenario A/L for 30-day maturity band
(three-month moving average)
B) Stress Scenario A/L for 30-day maturity band
(three-month moving average)
0%
50%
100%
150%
200%
250%
300%
350%
400%
Feb-
03
Abr-
03
Jun-
03
Ago
-03
Oct
-03
Dic
-03
Feb-
04
Abr-
04
Jun-
04
Ago
-04
Oct
-04
Dic
-04
Feb-
05
Abr-
05
Jun-
05
Ago
-05
Oct
-05
Dic
-05
0%
20%
40%
60%
80%
100%
120%
140%
160%
Feb-
03
Abr-0
3
Jun-
03
Ago-
03
Oct
-03
Dic
-03
Feb-
04
Abr-0
4
Jun-
04
Ago-
04
Oct
-04
Dic
-04
Feb-
05
Abr-0
5
Jun-
05
Ago-
05
Oct
-05
Dic
-05
For the system (middle), for the highest (top) and lowest (bottom) ratios in the system. Source: BOM.

17
Table 5. Mexico: Insurance Sector. Shocks on Premiums, Return, and Loss Rate, and Scenario Effects on the Solvency Ratio 1/
Solvency Ratio After Shocks
Solvency ratio as of
December 2005 Premiums Shock 2/
Interest rate Shock 3/
Loss rate Shock 4/
Scenario 5/
Number of insurance companies Solvency ratio of: More than 1.5 43 44 44 44 41 between 1.3-1.5 4 0 0 0 3 between 1.1-1.3 4 4 2 1 1 between 1.0-1.1 5 4 5 5 4 below 1 4 6/ 8 9 10 11 % of insurance companies below solvency ratio of 1 6.7 13.3 15 16.7 18.3 Capital insufficiency As % of market solvency requirement 1.3 2.7 3.4 5.7 7.3 Source: CNSF. 1/ Solvency ratio is defined as assets covering capital requirement to capital requirement. 2/ No premium growth in nominal terms. 3/ Premiums shock + Interest rate fall from current values to: Pesos (5.5%), Foreign currency (4.0%), and Indexed currency (3.5). 4/ Premiums shock + Loss rate increase: Life (10%), Accidents and Health (13%), Property and Casualty (20%), Automobile (5%), Catastrophic risks (10%). 5/ Premiums shock + Interest rate shock + Loss rate shock. 6/ Insurers with solvency ratio below 1 as of December 2055 are currently subject to regularization plans in order tomeet regulatory requirements.