Embed Size (px)
Citation preview
European Investor Meetings May 9-13, 2005
Exelon CorporationPublic Service Enterprise Group
2
Safe Harbor Language
This presentation includes “forward-looking statements” within the meaning of the Private Securities Litigation Reform Act of 1995. These forward-looking statements include, for example, statements regarding benefits of the proposed merger of Exelon and PSEG, integration plans, and expected synergies, anticipated future financial and operating performance and results, including estimates for growth. There are a number of risks and uncertainties that could cause actual results to differ materially from the forward-looking statements made herein. A discussion of some of these risks and uncertainties, as well as other risks associated with the proposed merger, is included in the preliminary joint proxy statement/prospectus contained in the Registration Statement on Form S-4 (Registration No. 333-122704) that Exelon has filed with the Securities and Exchange Commission. Additional factors that cause actual results to differ materially from the forward-looking statements made herein are included in “Management’s Discussion and Analysis of Financial Condition and Results of Operations – Business Outlook and the Challenges in Managing the Business” in Exelon’s 2004 Annual Report on Form 10-K. Readers are cautioned not to place undue reliance on these forward-looking statements, which speak only as of the date of this presentation. Neither Exelon nor PSEG undertakes any obligation to publicly release any revision to its forward-looking statements to reflect events or circumstances after the date of this presentation.
3
Additional Information
This presentation is not a solicitation of a proxy from any security holder of Exelon or PSEG. The above-referenced Registration Statement on Form S-4 contains a preliminary joint proxy statement/prospectus and other relevant documents regarding the proposed merger of Exelon and PSEG. WE URGE INVESTORS AND SECURITY HOLDERS TO READ THE DEFINITIVE JOINT PROXY STATEMENT/PROSPECTUS REGARDING THE PROPOSED TRANSACTION AND ANY OTHER RELEVANT DOCUMENTS WHEN THEY BECOME AVAILABLE, BECAUSE THEY WILL CONTAIN IMPORTANT INFORMATION ABOUT EXELON, PSEG AND THE PROPOSED MERGER. Investors and security holders will be able to obtain these materials (when they are available) and other documents filed with the SEC free of charge at the SEC's website, http://www.sec.gov. In addition, a copy of the definitive joint proxy statement/prospectus (when it becomes available) may be obtained free of charge from Exelon Corporation, Shareholder Services, 10 South Dearborn Street, P.O. Box 805398, Chicago, Illinois 60680-5398, or from Public Service Enterprise Group Incorporated, Investor Relations, 80 Park Plaza, P.O. Box 1171, Newark, New Jersey 07101-1171.
The respective directors and executive officers of Exelon and PSEG and other persons may be deemed to be participants in the solicitation of proxies in respect of the proposed transaction. Information regarding Exelon’s and PSEG’s directors and executive officers and other participants in the solicitation and a description of their direct and indirect interests, by security holdings or otherwise, is available in the preliminary joint proxy statement/prospectus contained in the above-referenced Registration Statement on Form S-4.
4
Exelon Overview & Update
5
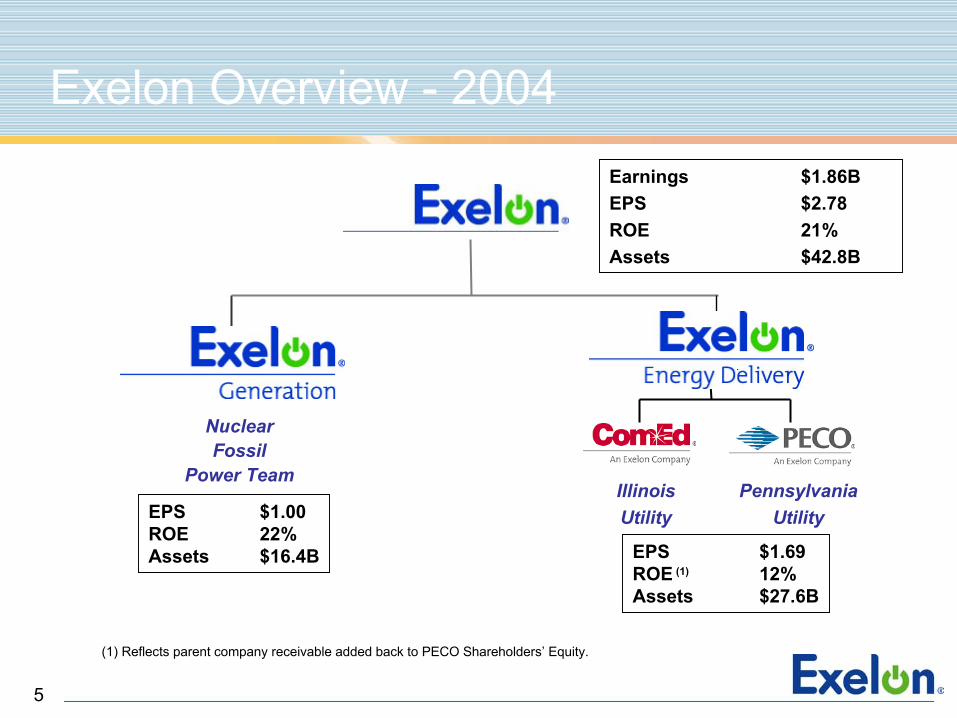
Exelon Overview - 2004Earnings $1.86BEPS $2.78ROE 21%Assets $42.8B
PennsylvaniaUtility
Illinois Utility
NuclearFossil
Power Team
EPS $1.00ROE 22%Assets $16.4B EPS $1.69
ROE (1) 12%Assets $27.6B
(1) Reflects parent company receivable added back to PECO Shareholders’ Equity.
6
2004 Financial Summary
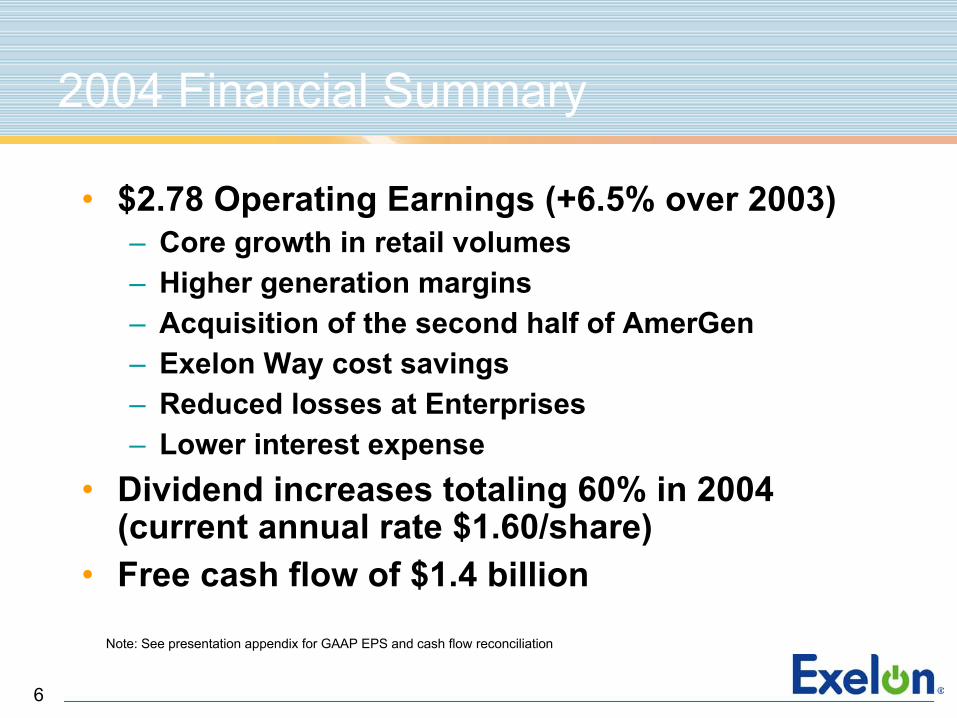
• $2.78 Operating Earnings (+6.5% over 2003)– Core growth in retail volumes– Higher generation margins– Acquisition of the second half of AmerGen– Exelon Way cost savings– Reduced losses at Enterprises– Lower interest expense
• Dividend increases totaling 60% in 2004 (current annual rate $1.60/share)
• Free cash flow of $1.4 billion
Note: See presentation appendix for GAAP EPS and cash flow reconciliation
7
Looking Back: 2000 - 2004
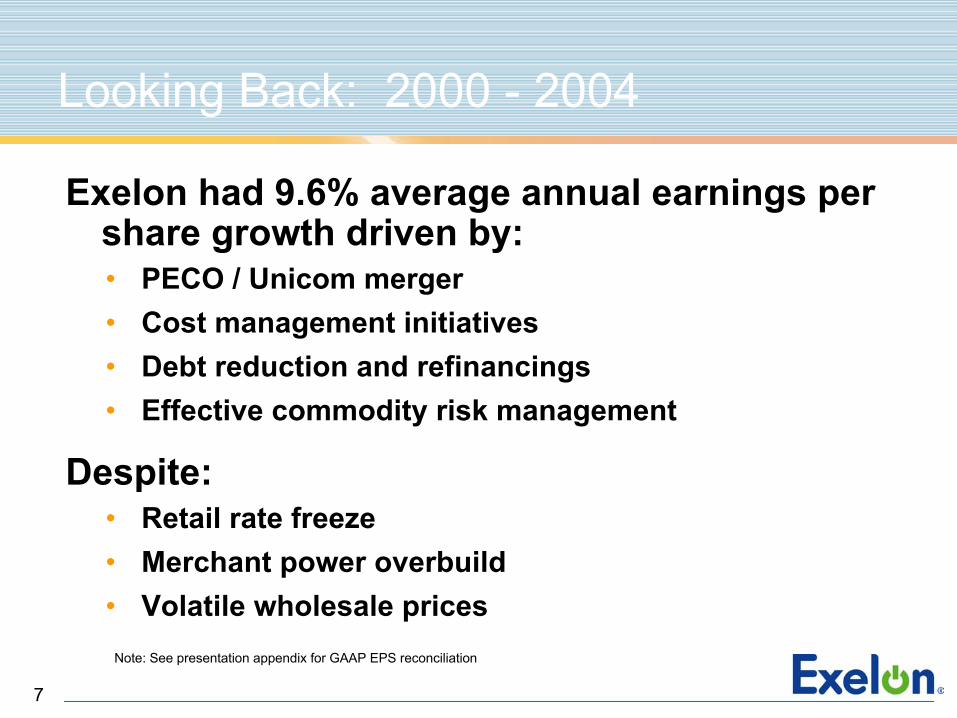
Exelon had 9.6% average annual earnings per share growth driven by:• PECO / Unicom merger• Cost management initiatives• Debt reduction and refinancings• Effective commodity risk management
Despite:• Retail rate freeze• Merchant power overbuild• Volatile wholesale prices
Note: See presentation appendix for GAAP EPS reconciliation
8
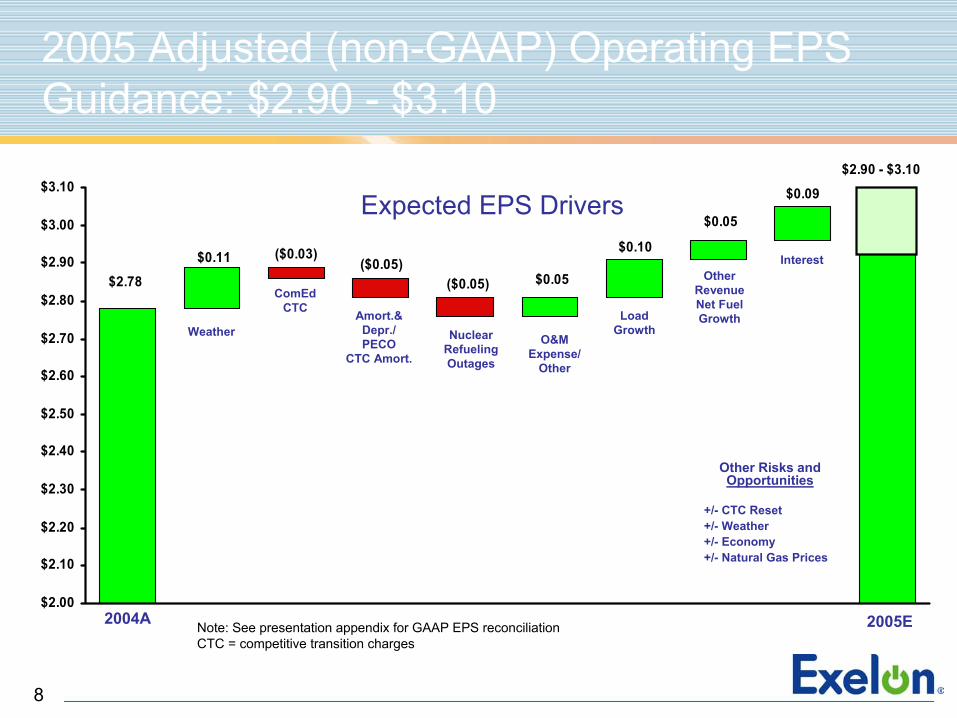
$2.78
$2.90 - $3.10
$0.09
$0.05
$0.10
$0.05($0.05)($0.05)
($0.03)$0.11
$2.00
$2.10
$2.20
$2.30
$2.40
$2.50
$2.60
$2.70
$2.80
$2.90
$3.00
$3.10
2004A 2005E
Interest
O&M Expense/
Other
ComEdCTC
Expected EPS Drivers
Amort.& Depr./PECO
CTC Amort.
2005 Adjusted (non-GAAP) Operating EPS Guidance: $2.90 - $3.10
Nuclear Refueling Outages
WeatherLoad
Growth
Other Revenue Net Fuel Growth
Other Risks and Opportunities
+/- CTC Reset+/- Weather+/- Economy+/- Natural Gas Prices
Note: See presentation appendix for GAAP EPS reconciliationCTC = competitive transition charges
9
PSEG Overview & Update
10
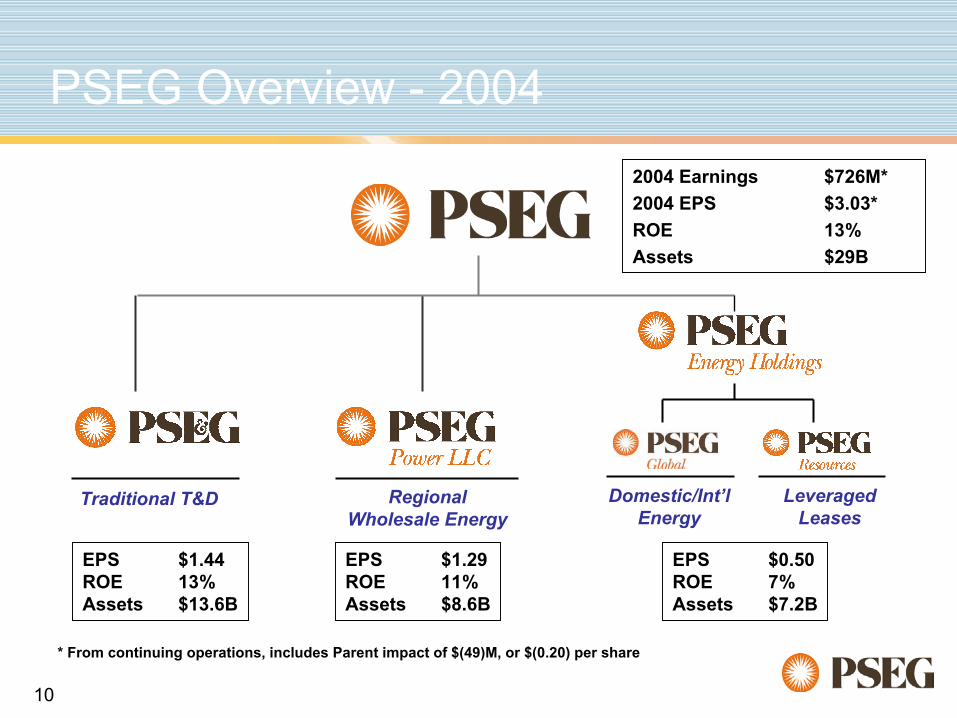
PSEG Overview - 20042004 Earnings $726M*2004 EPS $3.03*ROE 13%Assets $29B
Regional Wholesale Energy
Leveraged Leases
Domestic/Int’l Energy
Traditional T&D
* From continuing operations, includes Parent impact of $(49)M, or $(0.20) per share
EPS $1.44ROE 13% Assets $13.6B
EPS $1.29ROE 11%Assets $8.6B
EPS $0.50ROE 7%Assets $7.2B
11
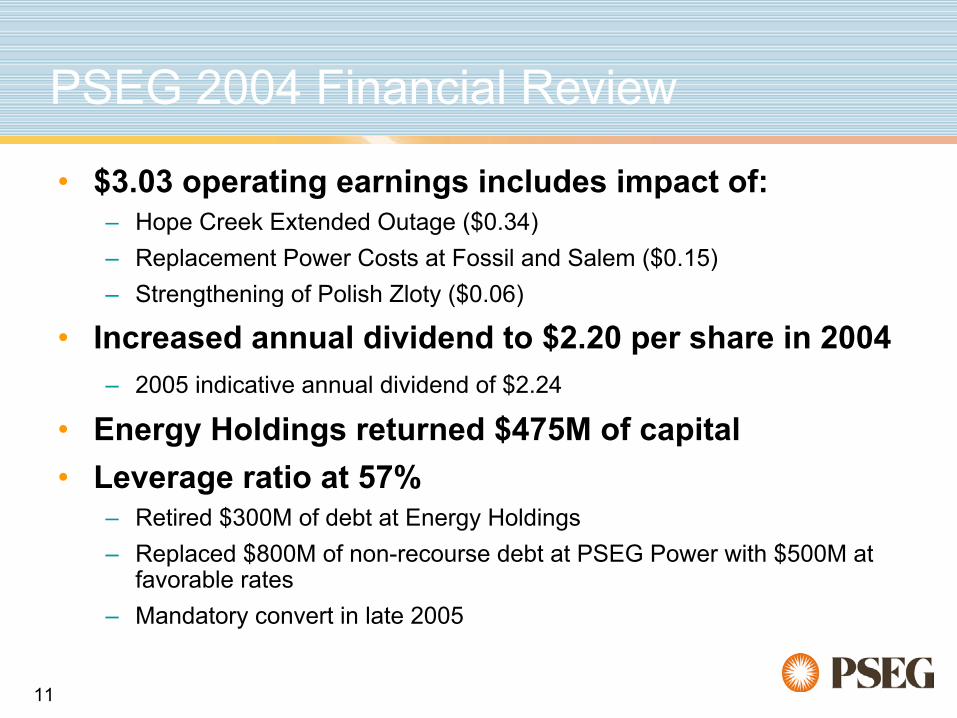
PSEG 2004 Financial Review
• $3.03 operating earnings includes impact of:– Hope Creek Extended Outage ($0.34)– Replacement Power Costs at Fossil and Salem ($0.15)– Strengthening of Polish Zloty ($0.06)
• Increased annual dividend to $2.20 per share in 2004– 2005 indicative annual dividend of $2.24
• Energy Holdings returned $475M of capital• Leverage ratio at 57%
– Retired $300M of debt at Energy Holdings – Replaced $800M of non-recourse debt at PSEG Power with $500M at
favorable rates– Mandatory convert in late 2005
12
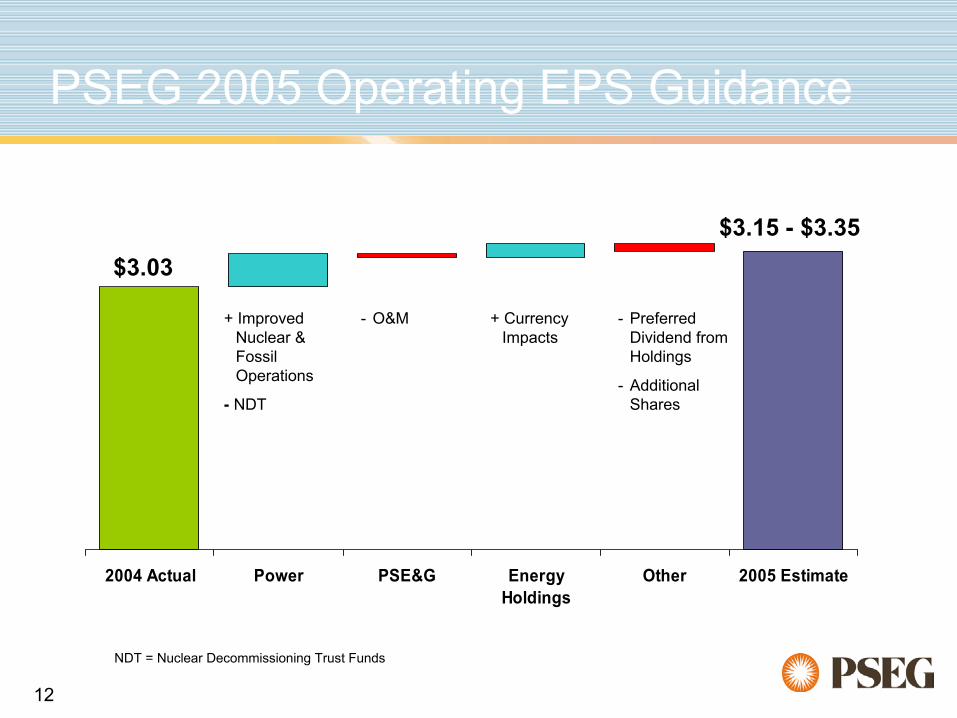
2004 Actual Power PSE&G EnergyHoldings
Other 2005 Estimate
PSEG 2005 Operating EPS Guidance
+ Improved Nuclear & Fossil Operations
- NDT
- O&M
$3.15 - $3.35$3.03
+ Currency Impacts
- Preferred Dividend from Holdings
- Additional Shares
NDT = Nuclear Decommissioning Trust Funds
13
Merger Overview & Update
14
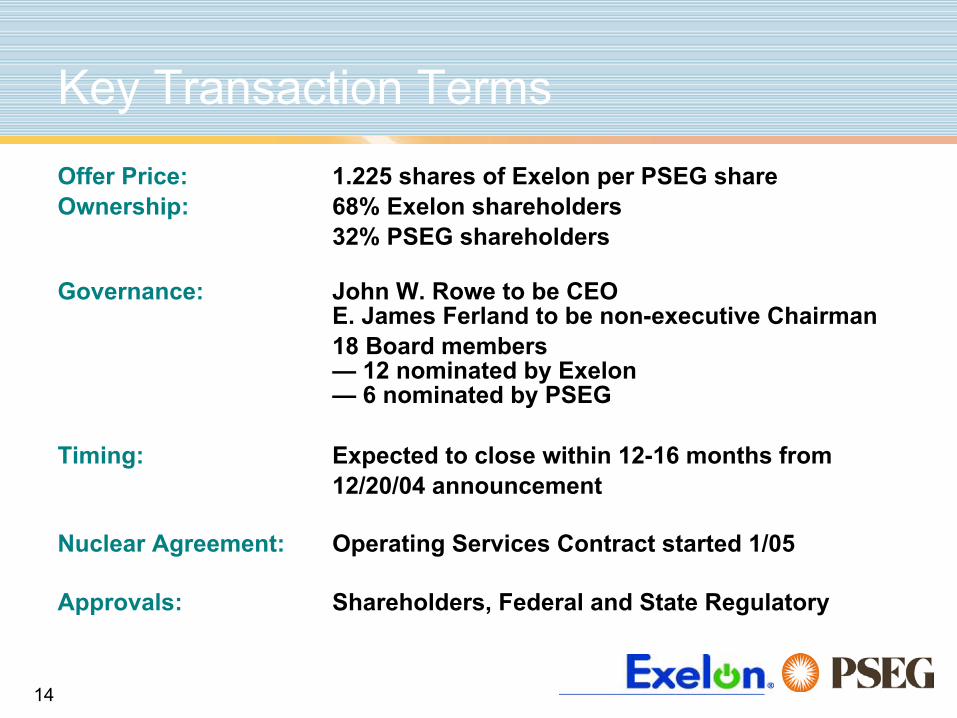
Key Transaction Terms
Offer Price: 1.225 shares of Exelon per PSEG shareOwnership: 68% Exelon shareholders
32% PSEG shareholders
Governance: John W. Rowe to be CEO E. James Ferland to be non-executive Chairman18 Board members— 12 nominated by Exelon— 6 nominated by PSEG
Timing: Expected to close within 12-16 months from12/20/04 announcement
Nuclear Agreement: Operating Services Contract started 1/05
Approvals: Shareholders, Federal and State Regulatory
15
Premier U.S. Utility Company
Generation PEG: EXC:
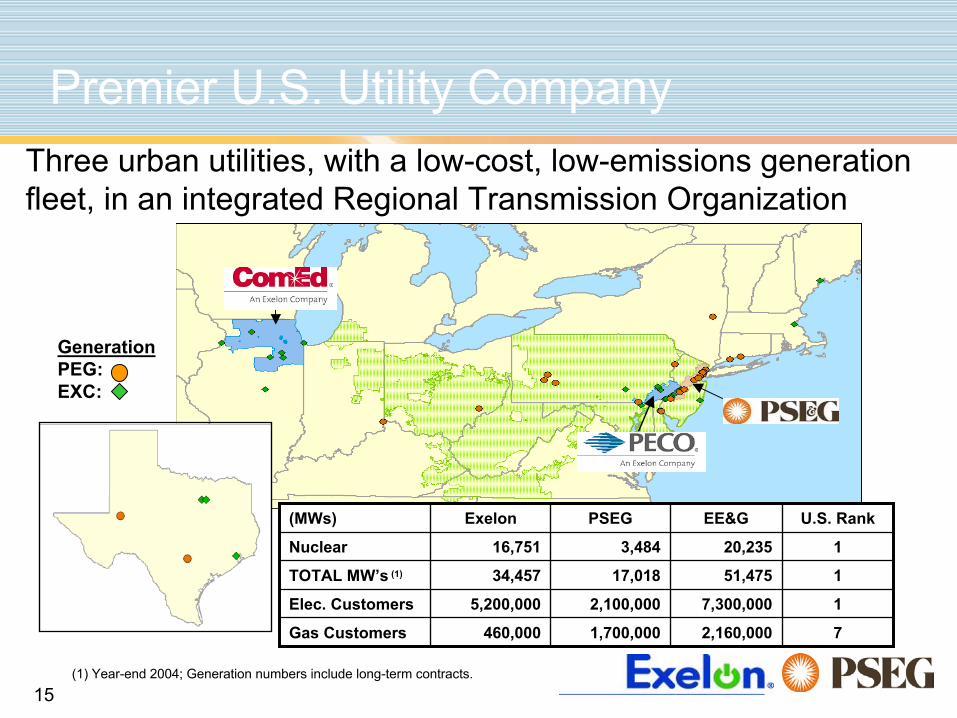
Three urban utilities, with a low-cost, low-emissions generation fleet, in an integrated Regional Transmission Organization
17,300,0002,100,0005,200,000Elec. Customers
2,160,000
51,475
20,235
EE&G
117,01834,457TOTAL MW’s (1)
71,700,000460,000Gas Customers
13,48416,751Nuclear
U.S. RankPSEGExelon(MWs)
(1) Year-end 2004; Generation numbers include long-term contracts.
16
A “Win-Win”Combination
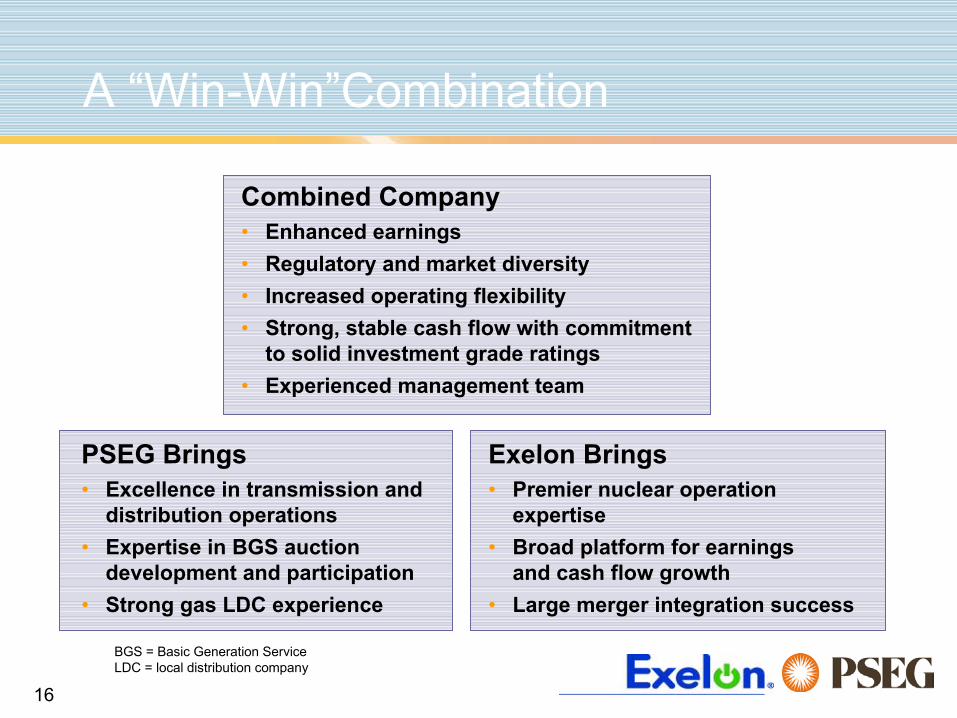
Combined Company• Enhanced earnings• Regulatory and market diversity• Increased operating flexibility• Strong, stable cash flow with commitment
to solid investment grade ratings• Experienced management team
PSEG Brings• Excellence in transmission and
distribution operations• Expertise in BGS auction
development and participation• Strong gas LDC experience
Exelon Brings• Premier nuclear operation
expertise • Broad platform for earnings
and cash flow growth• Large merger integration success
BGS = Basic Generation Service LDC = local distribution company
17
Strong Generation Platform
• Premier nuclear operator, based on consistent top quartile performance
• Balanced and diverse generation portfolio• Reliable and commercially responsive fossil
operations • Experienced leader in wholesale power
marketing and risk management
Complementary Generation Portfolio Positions New Company for Success
Complementary Generation Portfolio Positions New Complementary Generation Portfolio Positions New Company for SuccessCompany for Success
18
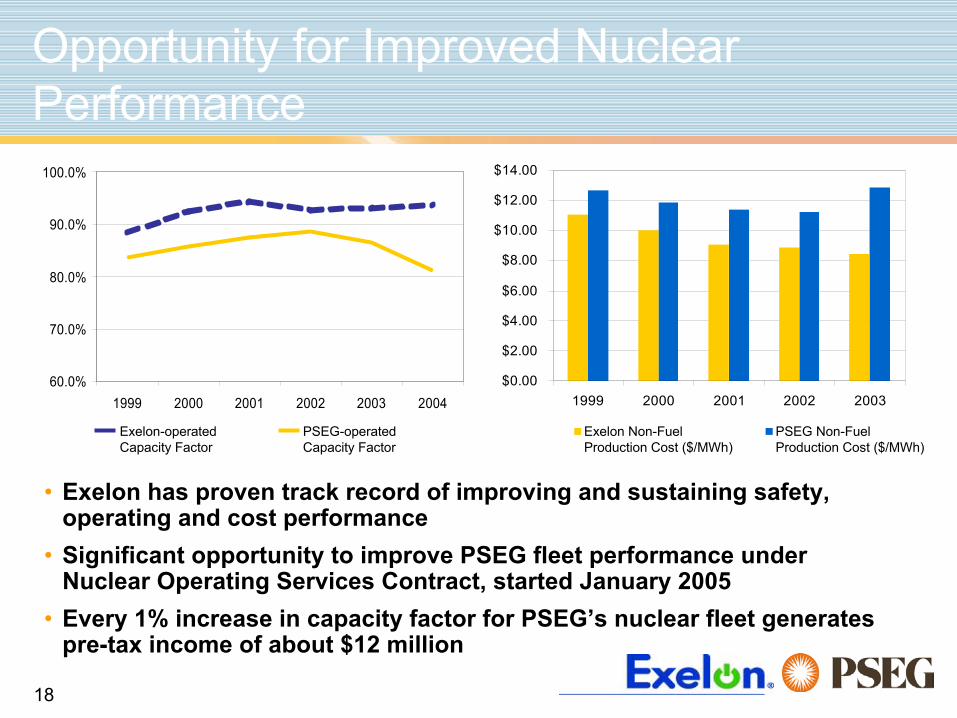
• Exelon has proven track record of improving and sustaining safety, operating and cost performance
• Significant opportunity to improve PSEG fleet performance under Nuclear Operating Services Contract, started January 2005
• Every 1% increase in capacity factor for PSEG’s nuclear fleet generates pre-tax income of about $12 million
60.0%
70.0%
80.0%
90.0%
100.0%
1999 2000 2001 2002 2003 2004$0.00
$2.00
$4.00
$6.00
$8.00
$10.00
$12.00
$14.00
1999 2000 2001 2002 2003
Opportunity for Improved Nuclear Performance
Exelon Non-Fuel Production Cost ($/MWh)
PSEG Non-Fuel Production Cost ($/MWh)
Exelon-operated Capacity Factor
PSEG-operatedCapacity Factor
19
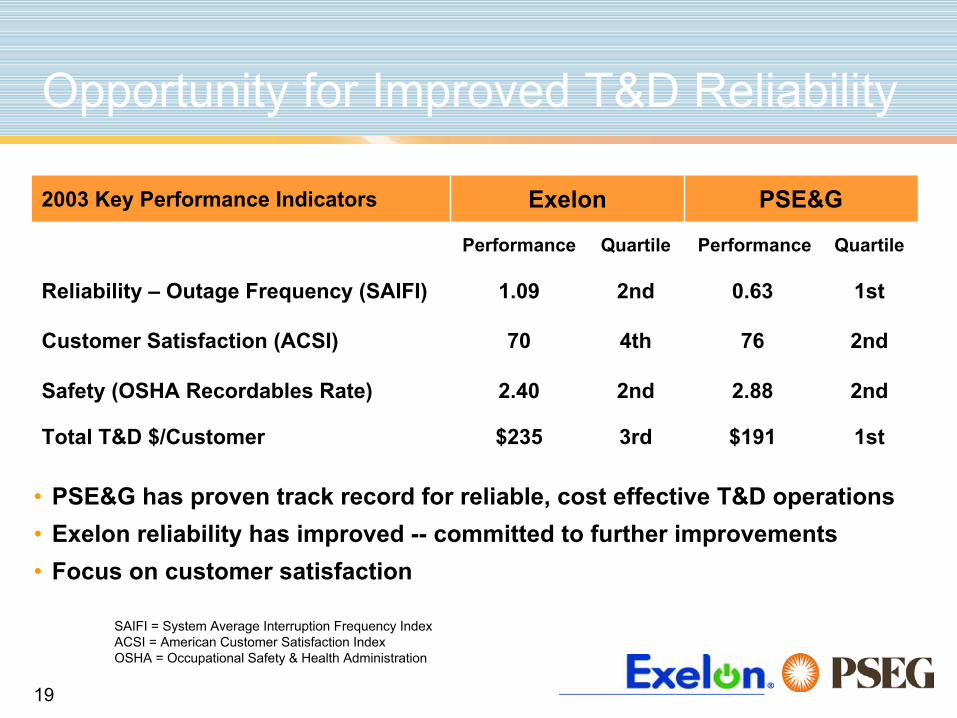
Opportunity for Improved T&D Reliability
$191
2.88
76
0.63
Performance
PSE&G
$235
2.40
70
1.09
Performance
Exelon
QuartileQuartile
2nd2ndSafety (OSHA Recordables Rate)
1st3rdTotal T&D $/Customer
2nd4thCustomer Satisfaction (ACSI)
1st2ndReliability – Outage Frequency (SAIFI)
2003 Key Performance Indicators
• PSE&G has proven track record for reliable, cost effective T&D operations• Exelon reliability has improved -- committed to further improvements• Focus on customer satisfaction
SAIFI = System Average Interruption Frequency IndexACSI = American Customer Satisfaction IndexOSHA = Occupational Safety & Health Administration
20
Financial Benefits
• Stronger platform to achieve consistent earnings growth
• Annual synergies of approximately $400 million in year 1 growing to $500 million by year 2
• Earnings accretion for both companies’ shareholders in year 1
• Nuclear contract provides earnings benefit for both companies starting in 2005
• Secure and growing dividend• Strong balance sheet
21
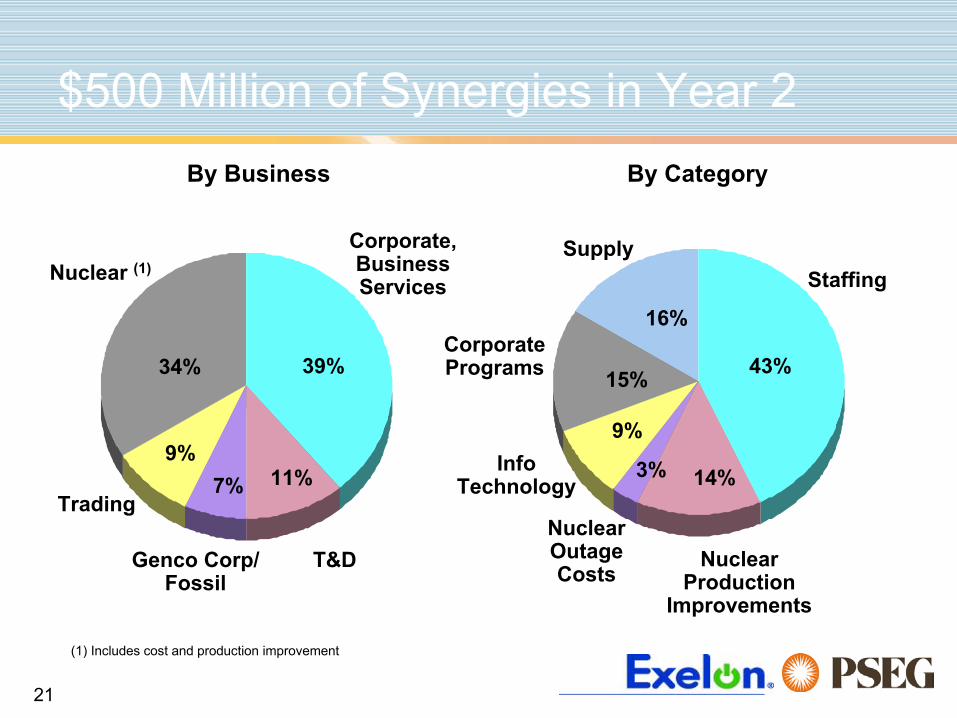
$500 Million of Synergies in Year 2
7%9%
34% 39%
11%Trading
Genco Corp/ Fossil
T&D
Corporate, Business ServicesNuclear (1)
15%
16%
43%
9%
Corporate Programs
Info Technology
StaffingSupply
By Business By Category
Nuclear Production
Improvements
14%3%
Nuclear Outage Costs
(1) Includes cost and production improvement
22
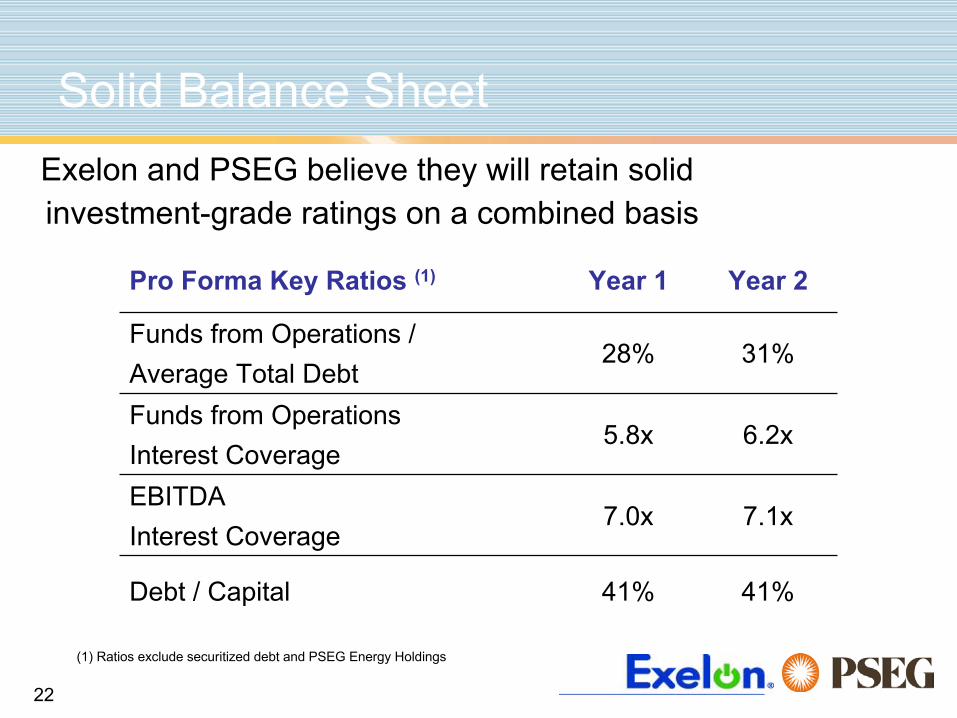
Solid Balance SheetExelon and PSEG believe they will retain solid investment-grade ratings on a combined basis
7.1x7.0xEBITDAInterest Coverage
41%41%Debt / Capital
6.2x5.8xFunds from OperationsInterest Coverage
31%28%Funds from Operations /Average Total Debt
Year 2Year 1Pro Forma Key Ratios (1)
(1) Ratios exclude securitized debt and PSEG Energy Holdings
23
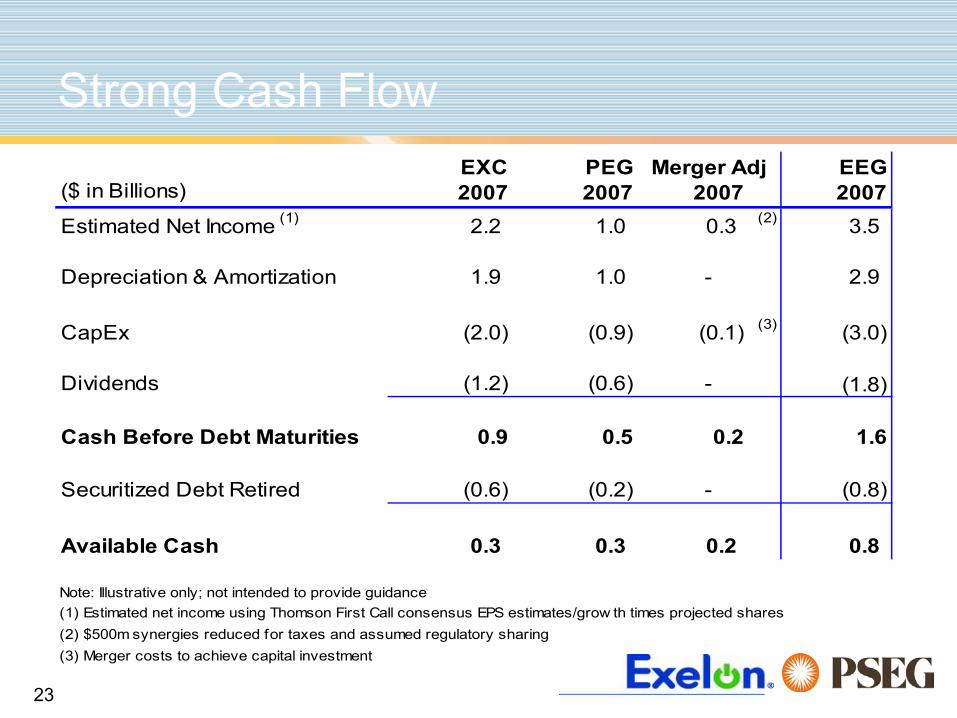
Strong Cash FlowEXC PEG EEG
($ in Billions) 2007 2007 2007 2007Estimated Net Income (1) 2.2 1.0 0.3 (2) 3.5
Depreciation & Amortization 1.9 1.0 - 2.9
CapEx (2.0) (0.9) (0.1) (3) (3.0)
Dividends (1.2) (0.6) - (1.8)
Cash Before Debt Maturities 0.9 0.5 0.2 1.6
Securitized Debt Retired (0.6) (0.2) - (0.8)
Available Cash 0.3 0.3 0.2 0.8
Note: Illustrative only; not intended to provide guidance(1) Estimated net income using Thomson First Call consensus EPS estimates/grow th times projected shares(2) $500m synergies reduced for taxes and assumed regulatory sharing(3) Merger costs to achieve capital investment
Merger Adj
24
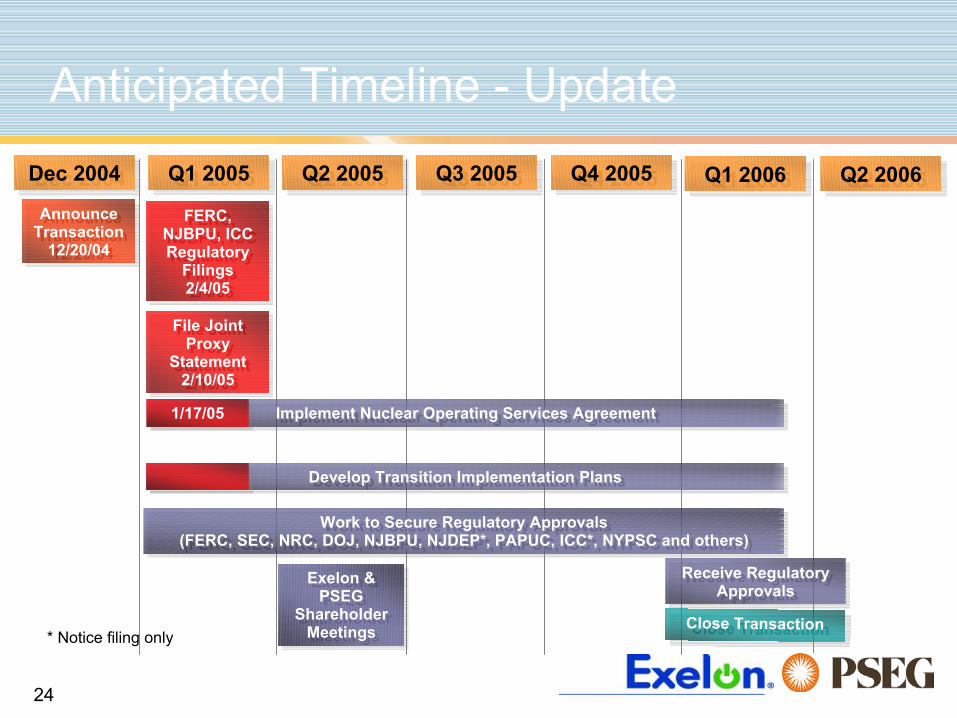
Anticipated Timeline - Update
Dec 2004Dec 2004 Q1 2005Q1 2005 Q2 2005Q2 2005 Q3 2005Q3 2005 Q4 2005Q4 2005 Q1 2006Q1 2006
Announce Transaction
12/20/04
Announce Transaction
12/20/04
Exelon & PSEG
Shareholder Meetings
Exelon & PSEG
Shareholder Meetings
FERC, NJBPU, ICC Regulatory
Filings2/4/05
FERC, NJBPU, ICC Regulatory
Filings2/4/05
File Joint Proxy
Statement2/10/05
File Joint Proxy
Statement2/10/05
Work to Secure Regulatory Approvals(FERC, SEC, NRC, DOJ, NJBPU, NJDEP*, PAPUC, ICC*, NYPSC and others)
Work to Secure Regulatory Approvals(FERC, SEC, NRC, DOJ, NJBPU, NJDEP*, PAPUC, ICC*, NYPSC and others)
Develop Transition Implementation PlansDevelop Transition Implementation Plans
Receive Regulatory Approvals
Receive Regulatory Approvals
Close TransactionClose Transaction
Implement Nuclear Operating Services AgreementImplement Nuclear Operating Services Agreement1/17/051/17/05
Q2 2006Q2 2006
* Notice filing only
25
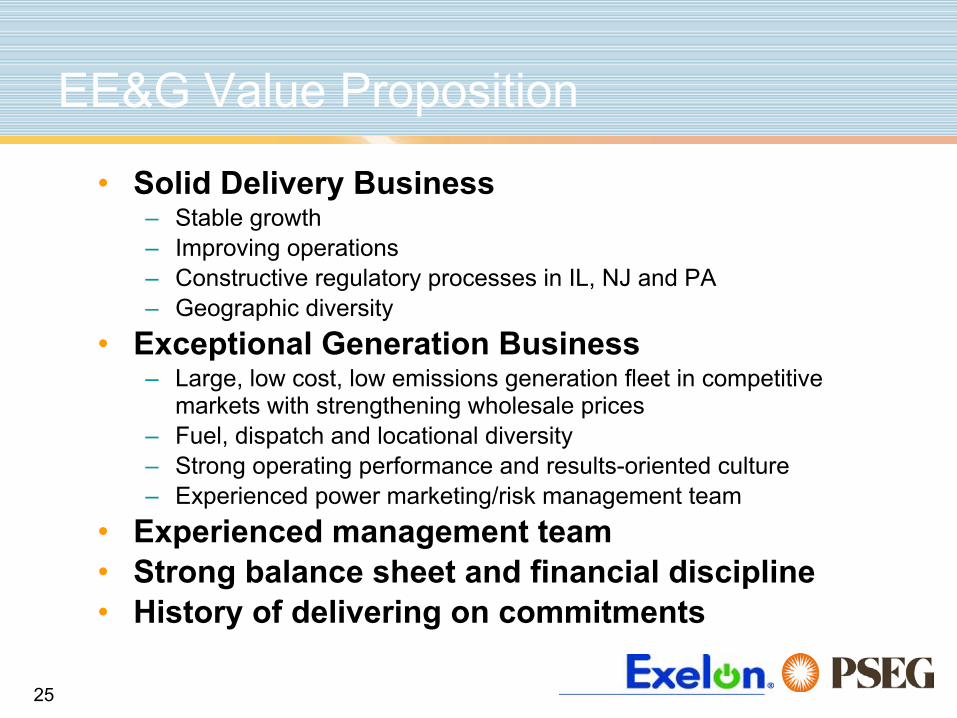
EE&G Value Proposition
• Solid Delivery Business– Stable growth– Improving operations– Constructive regulatory processes in IL, NJ and PA– Geographic diversity
• Exceptional Generation Business– Large, low cost, low emissions generation fleet in competitive
markets with strengthening wholesale prices– Fuel, dispatch and locational diversity – Strong operating performance and results-oriented culture– Experienced power marketing/risk management team
• Experienced management team• Strong balance sheet and financial discipline• History of delivering on commitments
26
Appendix
27
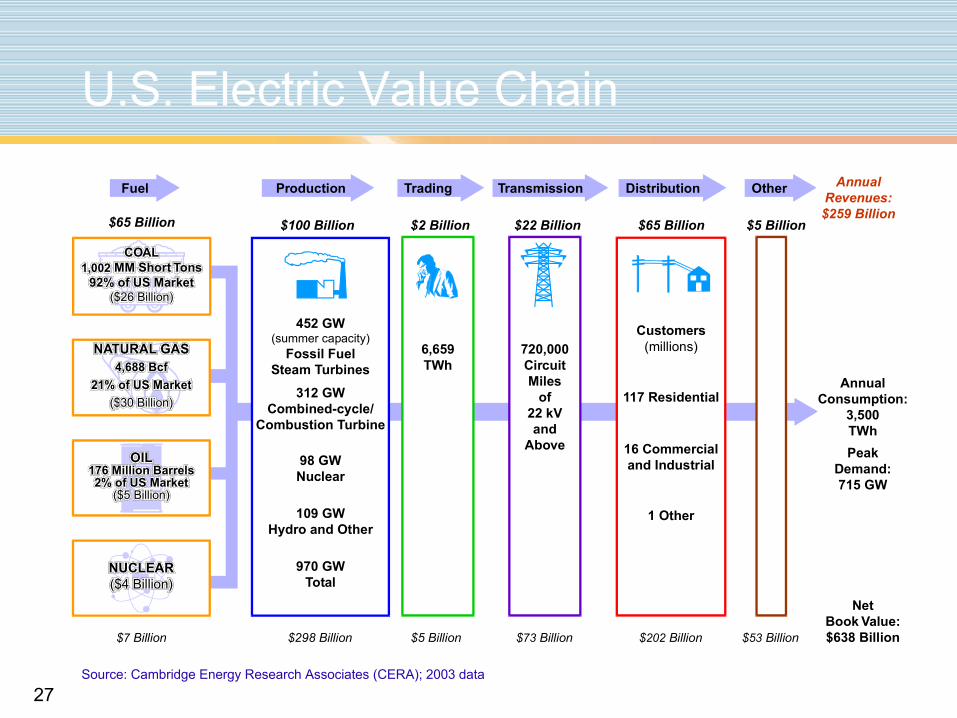
$7 Billion
$65 Billion
AnnualRevenues:$259 Billion
NUCLEAR($4 Billion)
NATURAL GAS4,688 Bcf
21% of US Market($30 Billion)
COAL1,002 MM Short Tons
92% of US Market($26 Billion)
OIL176 Million Barrels2% of US Market
($5 Billion)
Fuel
NetBook Value:$638 Billion
6,659TWh
$5 Billion
$2 Billion
TradingProduction
$298 Billion
$100 Billion
312 GWCombined-cycle/
Combustion Turbine
109 GWHydro and Other
452 GW(summer capacity)
Fossil FuelSteam Turbines
98 GWNuclear
970 GWTotal
720,000CircuitMiles
of22 kVand
Above
$73 Billion
$22 Billion
Transmission
Customers(millions)
AnnualConsumption:
3,500TWh
$202 Billion
$65 Billion
117 Residential
16 Commercialand Industrial
1 Other
Distribution
$5 Billion
$53 Billion
Other
PeakDemand:715 GW
U.S. Electric Value Chain
Source: Cambridge Energy Research Associates (CERA); 2003 data
28
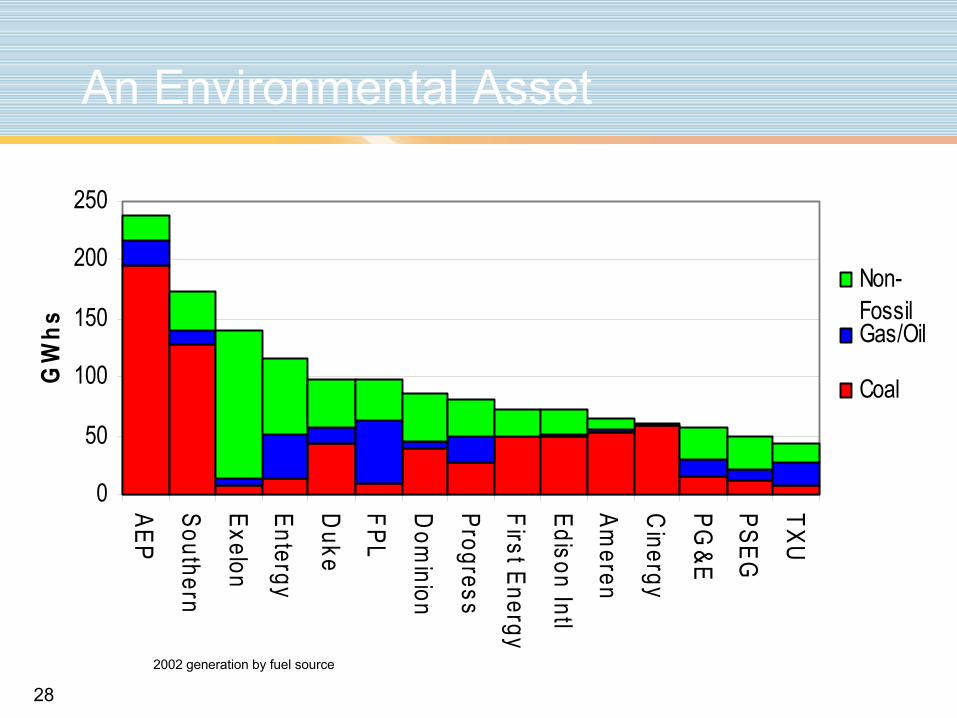
An Environmental Asset
0
50
100
150
200
250
AEP
Southern
Exelon
Entergy
Duke
FPL
Dom
inion
Progress
First Energy
Edison Intl
Ameren
Cinergy
PG&E
PSEG
TXU
GW
hs
Non-FossilGas/Oil
Coal
2002 generation by fuel source
29
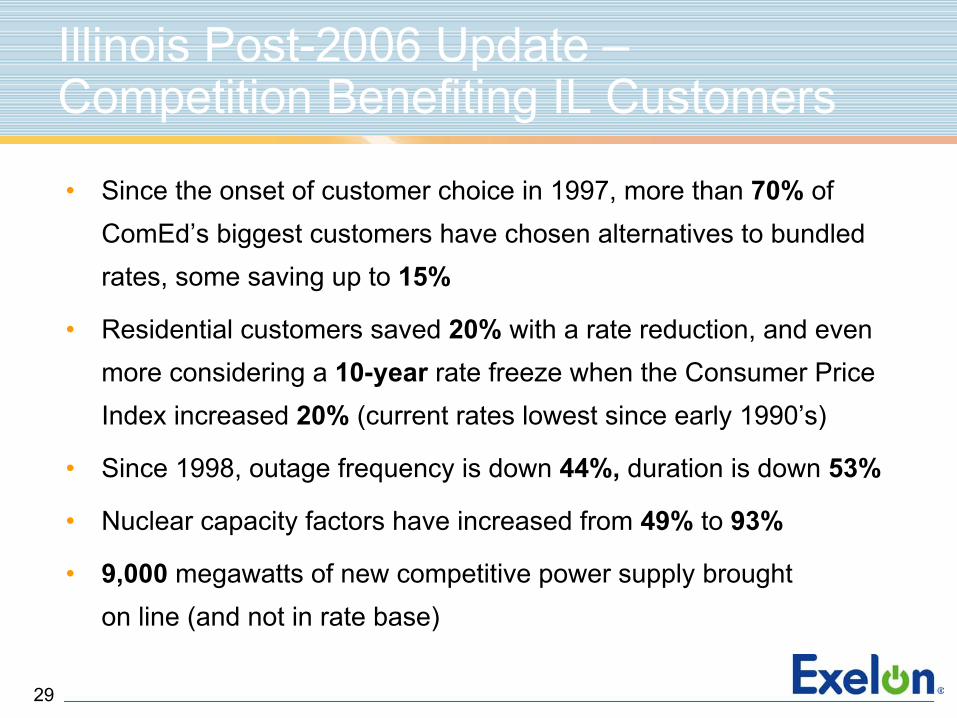
Illinois Post-2006 Update –Competition Benefiting IL Customers
• Since the onset of customer choice in 1997, more than 70% of ComEd’s biggest customers have chosen alternatives to bundled rates, some saving up to 15%
• Residential customers saved 20% with a rate reduction, and even more considering a 10-year rate freeze when the Consumer Price Index increased 20% (current rates lowest since early 1990’s)
• Since 1998, outage frequency is down 44%, duration is down 53%
• Nuclear capacity factors have increased from 49% to 93%
• 9,000 megawatts of new competitive power supply brought on line (and not in rate base)
30
Illinois Post-2006 Update –Process Moving Forward
• 12/3/04 Illinois Commerce Commission (ICC) staff report to General Assembly endorsed an auction process similar to New Jersey’s (best fit with consensus of Procurement Working Group)
• ComEd made filings at the ICC on February 25 proposing an auction process
– Details of the filing and case schedule were previewed with all stakeholders including ICC staff
– Proceeding will likely run through January 2006– Auction has support of a variety of stakeholders
• Bi-partisan House Committee formed to oversee Post-2006 process (Chairman: George Scully)
– Hearing testimony from a broad range of stakeholders before determining General Assembly’s level of involvement and direction to the ICC
• A separate filing for delivery rates and new rate design will be made in the 2nd or 3rd quarter of 2005
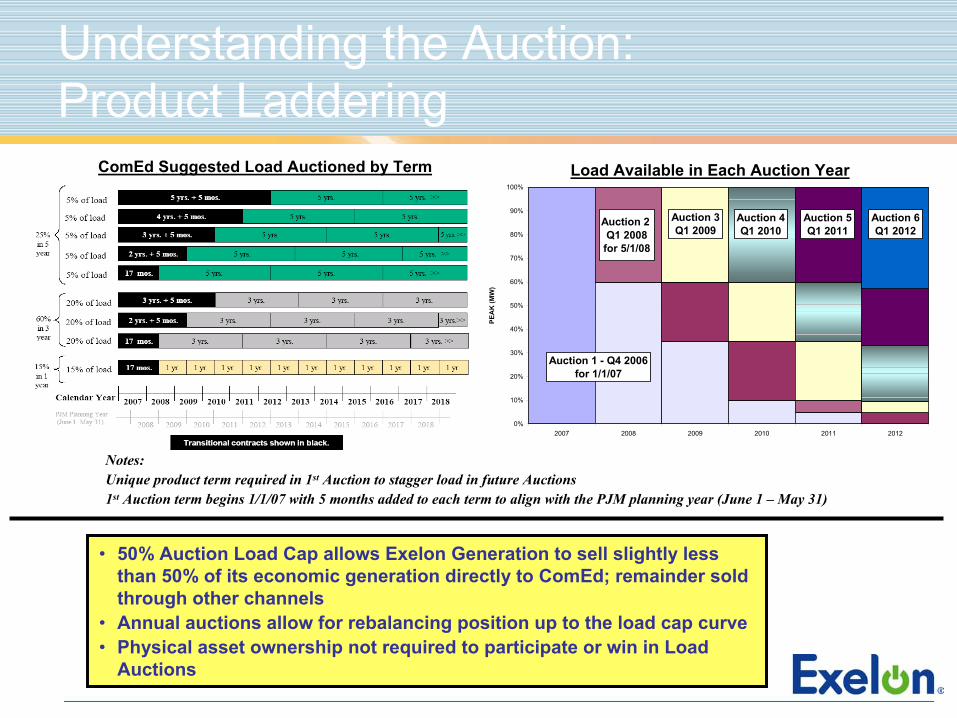
Understanding the Auction: Product Laddering
Load Available in Each Auction Year
0%
10%
20%
30%
40%
50%
60%
70%
80%
90%
100%
2007 2008 2009 2010 2011 2012
PEA
K (M
W)
Auction 1 - Q4 2006for 1/1/07
Auction 2 Q1 2008for 5/1/08
Auction 3Q1 2009
Auction 4Q1 2010
Auction 5Q1 2011
Auction 6Q1 2012
ComEd Suggested Load Auctioned by Term
• 50% Auction Load Cap allows Exelon Generation to sell slightly less than 50% of its economic generation directly to ComEd; remainder sold through other channels
• Annual auctions allow for rebalancing position up to the load cap curve • Physical asset ownership not required to participate or win in Load
Auctions
Notes:Unique product term required in 1st Auction to stagger load in future Auctions1st Auction term begins 1/1/07 with 5 months added to each term to align with the PJM planning year (June 1 – May 31)
32
•Fourth annual reverse auction in NJ completed 2/16/05
•While the wholesale price of energy increased by 18% over last year’s prices, the staggered terms of the auction contracts will result in customers of NJ’s largest utility (PSE&G) seeing an annual increase to total bills of 2.8%
- Only 1/3 of the energy component in the overall bill is put out to bid annually
- The energy component is approximately half of the overall bill (with the delivery and transmission components comprising the remaining half)
- Therefore, in any given year, 1/3 of about 50% (or about 1/6) of the total electric bill is out for bid
•25 suppliers participated in the reverse auction with 7 winning bidders
Basic Generation Service (BGS) Auction Summary
33
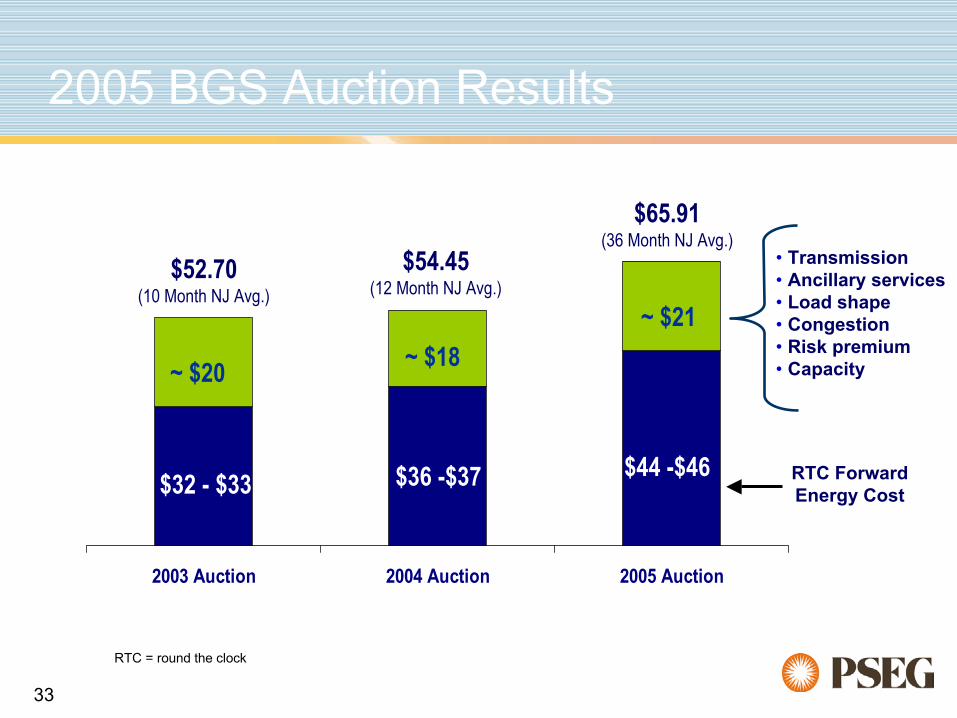
2005 BGS Auction Results
2003 Auction 2004 Auction 2005 Auction
$32 - $33 $36 -$37
$52.70 (10 Month NJ Avg.)
$54.45 (12 Month NJ Avg.)
$65.91 (36 Month NJ Avg.)
$44 -$46
• Transmission • Ancillary services• Load shape • Congestion • Risk premium• Capacity~ $20 ~ $18
~ $21
RTC Forward Energy Cost
RTC = round the clock
34
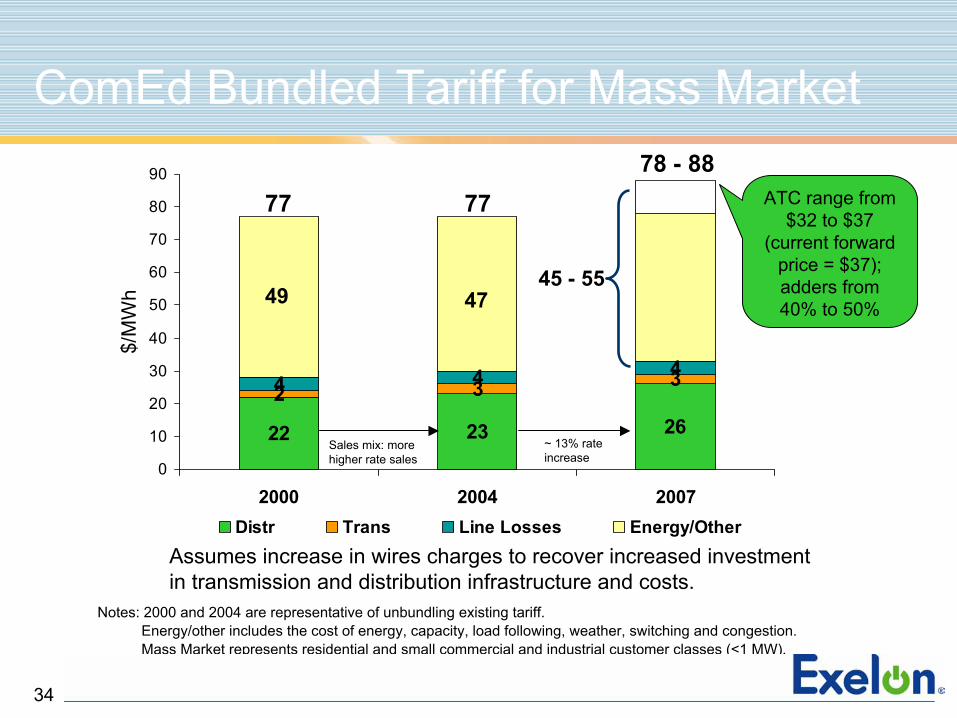
ComEd Bundled Tariff for Mass Market
22
2 34 4 4
2623
3
0
10
20
30
40
50
60
70
80
90
2000 2004 2007
$/M
Wh
Distr Trans Line Losses Energy/Other
77 77
Assumes increase in wires charges to recover increased investment in transmission and distribution infrastructure and costs.
Notes: 2000 and 2004 are representative of unbundling existing tariff.Energy/other includes the cost of energy, capacity, load following, weather, switching and congestion. Mass Market represents residential and small commercial and industrial customer classes (<1 MW).
ATC range from $32 to $37
(current forward price = $37); adders from 40% to 50%
78 - 88
~ 13% rate increase
Sales mix: more higher rate sales
49 4745 - 55
35
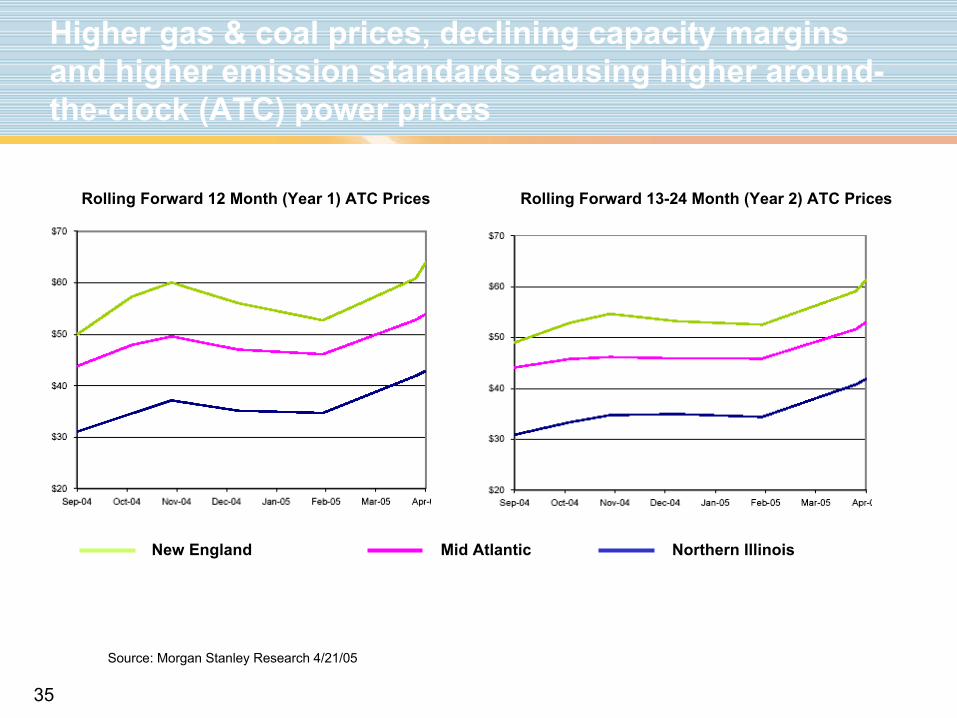
New England Mid Atlantic Northern Illinois
Rolling Forward 12 Month (Year 1) ATC Prices Rolling Forward 13-24 Month (Year 2) ATC Prices
Source: Morgan Stanley Research 4/21/05
Higher gas & coal prices, declining capacity margins and higher emission standards causing higher around-the-clock (ATC) power prices
36
0
10
20
30
40
50
60
70
Nuclear Coal Integrated GasificationCombined Cycle
Combined Cycle GasTurbine
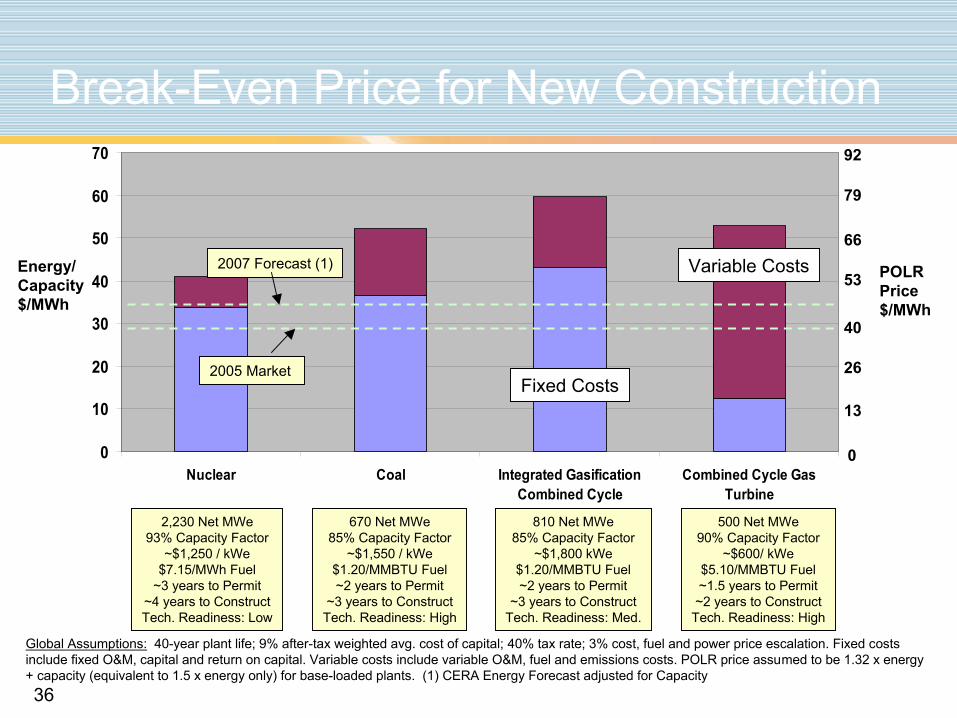
Break-Even Price for New Construction
Energy/Capacity$/MWh
POLRPrice$/MWh
Variable Costs
Fixed Costs
0
13
26
40
53
66
79
92
2,230 Net MWe93% Capacity Factor
~$1,250 / kWe$7.15/MWh Fuel
~3 years to Permit~4 years to ConstructTech. Readiness: Low
670 Net MWe85% Capacity Factor
~$1,550 / kWe$1.20/MMBTU Fuel~2 years to Permit
~3 years to ConstructTech. Readiness: High
810 Net MWe85% Capacity Factor
~$1,800 kWe$1.20/MMBTU Fuel~2 years to Permit
~3 years to ConstructTech. Readiness: Med.
500 Net MWe90% Capacity Factor
~$600/ kWe$5.10/MMBTU Fuel~1.5 years to Permit~2 years to Construct
Tech. Readiness: High
Global Assumptions: 40-year plant life; 9% after-tax weighted avg. cost of capital; 40% tax rate; 3% cost, fuel and power price escalation. Fixed costs include fixed O&M, capital and return on capital. Variable costs include variable O&M, fuel and emissions costs. POLR price assumed to be 1.32 x energy + capacity (equivalent to 1.5 x energy only) for base-loaded plants. (1) CERA Energy Forecast adjusted for Capacity
2007 Forecast (1)
2005 Market
37
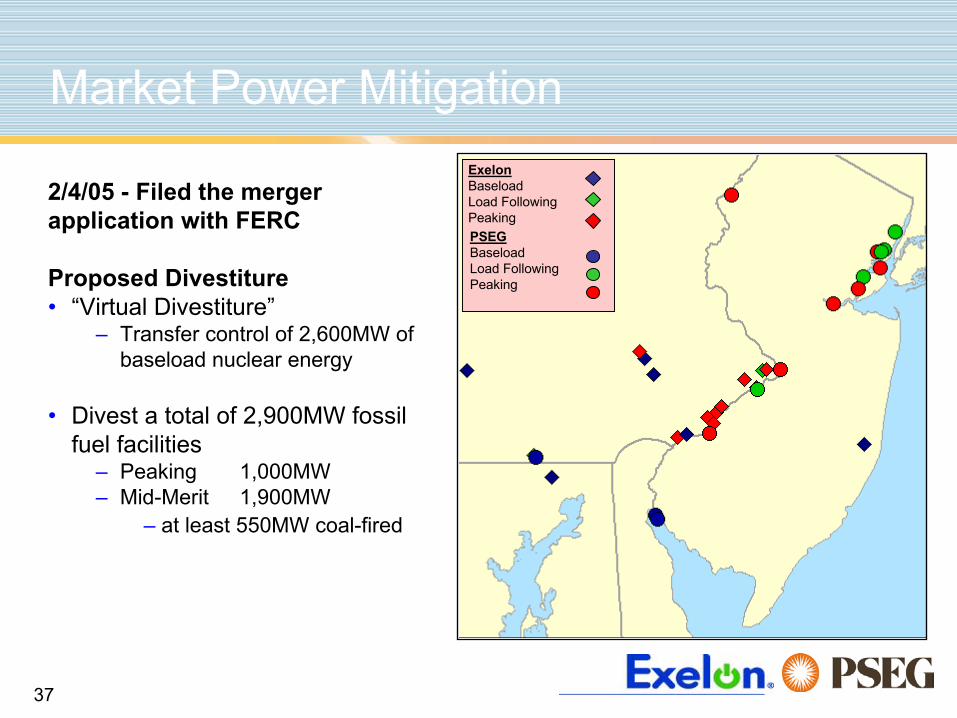
Market Power Mitigation
2/4/05 - Filed the mergerapplication with FERC
Proposed Divestiture• “Virtual Divestiture”
– Transfer control of 2,600MW of baseload nuclear energy
• Divest a total of 2,900MW fossil fuel facilities
– Peaking 1,000MW– Mid-Merit 1,900MW
– at least 550MW coal-fired
ExelonBaseloadLoad FollowingPeakingPSEGBaseload Load Following Peaking
38
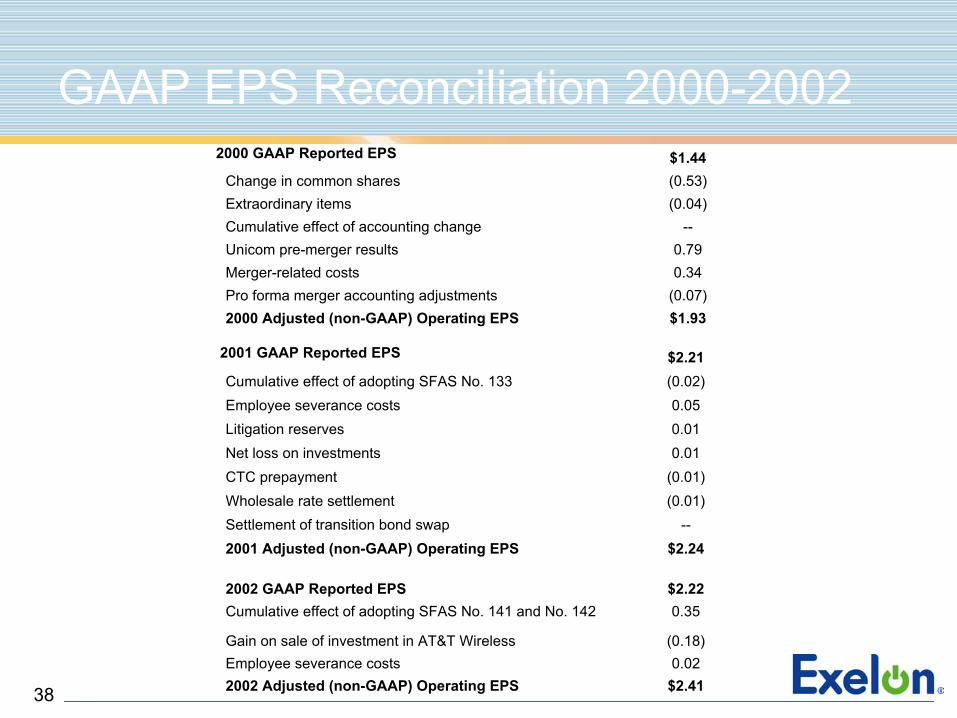
GAAP EPS Reconciliation 2000-20022000 GAAP Reported EPS $1.44
Change in common shares (0.53)Extraordinary items (0.04)Cumulative effect of accounting change --Unicom pre-merger results 0.79Merger-related costs 0.34Pro forma merger accounting adjustments (0.07)2000 Adjusted (non-GAAP) Operating EPS $1.93
2001 GAAP Reported EPS $2.21Cumulative effect of adopting SFAS No. 133 (0.02)Employee severance costs 0.05Litigation reserves 0.01Net loss on investments 0.01CTC prepayment (0.01)Wholesale rate settlement (0.01)Settlement of transition bond swap --2001 Adjusted (non-GAAP) Operating EPS $2.24
2002 GAAP Reported EPS $2.22Cumulative effect of adopting SFAS No. 141 and No. 142 0.35
Gain on sale of investment in AT&T Wireless (0.18)Employee severance costs 0.022002 Adjusted (non-GAAP) Operating EPS $2.41
39
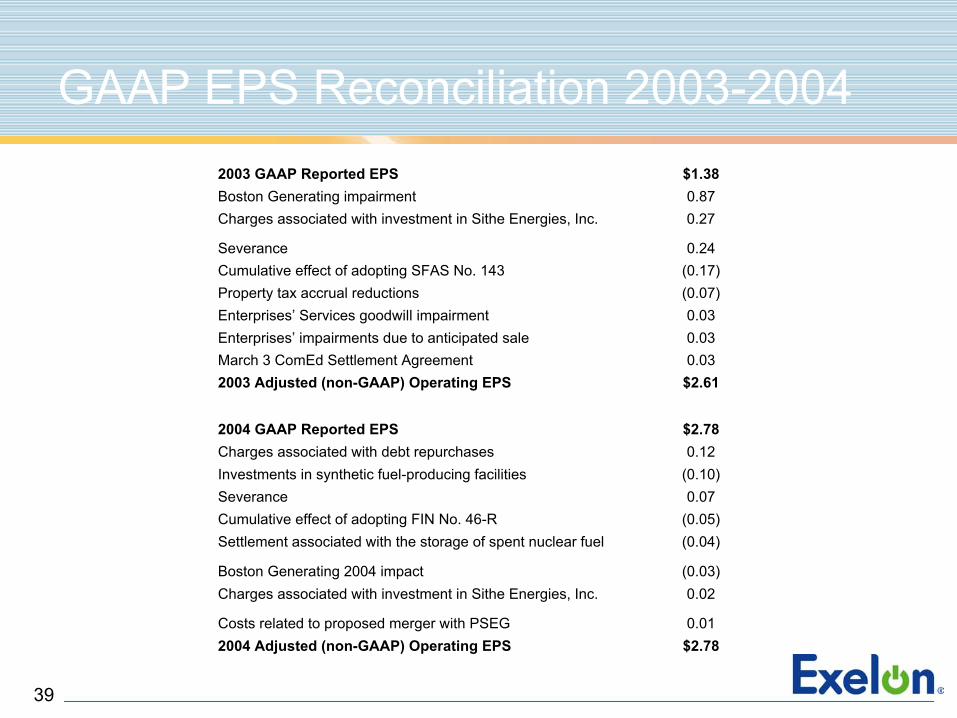
GAAP EPS Reconciliation 2003-2004
2004 GAAP Reported EPS $2.78Charges associated with debt repurchases 0.12Investments in synthetic fuel-producing facilities (0.10)Severance 0.07Cumulative effect of adopting FIN No. 46-R (0.05)Settlement associated with the storage of spent nuclear fuel (0.04)
Boston Generating 2004 impact (0.03)Charges associated with investment in Sithe Energies, Inc. 0.02
Costs related to proposed merger with PSEG 0.012004 Adjusted (non-GAAP) Operating EPS $2.78
2003 GAAP Reported EPS $1.38Boston Generating impairment 0.87Charges associated with investment in Sithe Energies, Inc. 0.27
Severance 0.24Cumulative effect of adopting SFAS No. 143 (0.17)Property tax accrual reductions (0.07)Enterprises’ Services goodwill impairment 0.03Enterprises’ impairments due to anticipated sale 0.03March 3 ComEd Settlement Agreement 0.032003 Adjusted (non-GAAP) Operating EPS $2.61
40
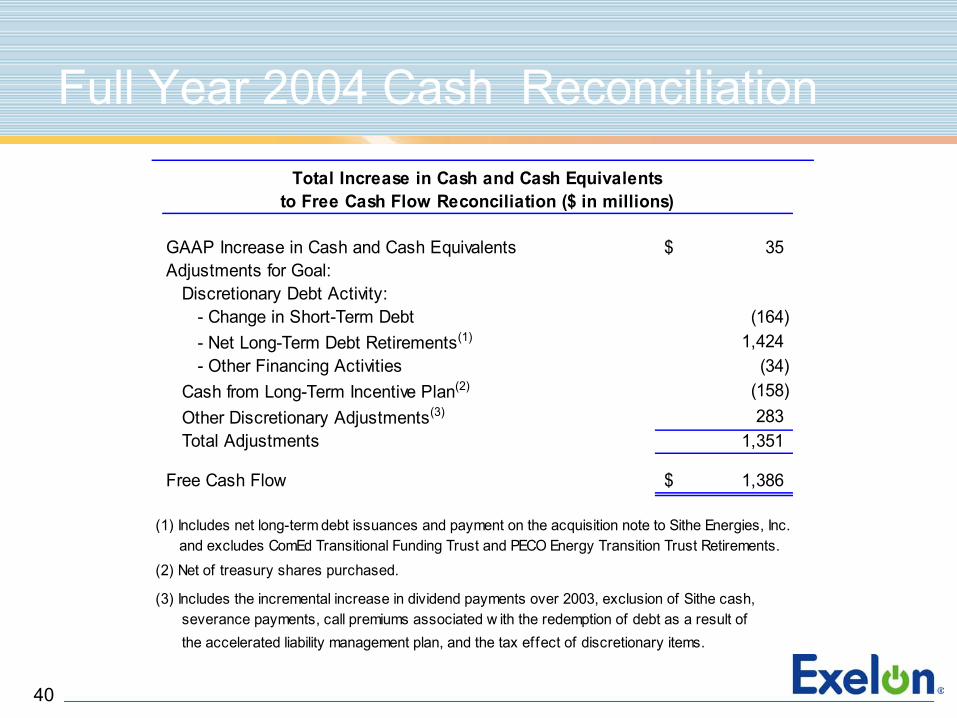
Full Year 2004 Cash Reconciliation
GAAP Increase in Cash and Cash Equivalents 35$ Adjustments for Goal:
Discretionary Debt Activity:- Change in Short-Term Debt (164) - Net Long-Term Debt Retirements(1) 1,424 - Other Financing Activities (34)
Cash from Long-Term Incentive Plan(2) (158) Other Discretionary Adjustments(3) 283 Total Adjustments 1,351
Free Cash Flow 1,386$
the accelerated liability management plan, and the tax effect of discretionary items.
(1) Includes net long-term debt issuances and payment on the acquisition note to Sithe Energies, Inc. and excludes ComEd Transitional Funding Trust and PECO Energy Transition Trust Retirements.
(3) Includes the incremental increase in dividend payments over 2003, exclusion of Sithe cash, severance payments, call premiums associated w ith the redemption of debt as a result of
(2) Net of treasury shares purchased.
to Free Cash Flow Reconciliation ($ in millions)Total Increase in Cash and Cash Equivalents
41
Cash Flow Definitions
We define free cash flow as:•Cash from operations (which includes pension contributions and the benefit of synthetic fuel investments), less•Cash used in investing activities, less
–Transition debt maturities –Common stock dividend payments at 2003 rates–Other routine activities (e.g., severance payments, tax effect of discretionary items, etc.)
We define available cash flow as:•Cash from operations less capital expenditures, less common stock dividend payments, less securitized debt retired