Embed Size (px)
Citation preview
Matthew F. HilzingerChief Financial Officer
Morgan Stanley Global Electricity & Energy ConferenceApril 3, 2008

2
Forward-Looking Statements
This presentation includes forward-looking statements within the meaning of the Private Securities Litigation Reform Act of 1995, that are subject to risks and uncertainties. The factors that could cause actual results to differ materially from these forward-looking statements include those discussed herein as well as those discussed in (1) Exelon’s 2007 Annual Report on Form 10-K in (a) ITEM 1A. Risk Factors, (b) ITEM 7. Management’s Discussion and Analysis of Financial Condition and Results of Operations and (c) ITEM 8. Financial Statements and Supplementary Data: Note 19; and (2) other factors discussed in filings with the Securities and Exchange Commission by Exelon Corporation, Exelon Generation Company, LLC, Commonwealth Edison Company, and PECO Energy Company (Companies). Readers are cautioned not to place undue reliance on these forward-looking statements, which apply only as of the date of this presentation. None of the Companies undertakes any obligation to publicly release any revision to its forward- looking statements to reflect events or circumstances after the date of this presentation.
This presentation includes references to adjusted (non-GAAP) operating earnings that exclude the impact of certain factors. We believe that these adjusted operating earnings are representative of the underlying operational results of the Companies. Please refer to the appendix to the presentation for a reconciliation of adjusted (non-GAAP) operating earnings to GAAP earnings.

3
Key Messages
• 2007 was exceptional – financially and operationally
• Platform for continued strong performance in 2008 and beyond
• Substantial incremental cash flow and balance sheet capacity over next five years
• Executing on Value Return Policy
• Generation benefiting from continued improvements in market fundamentals
• ComEd progressing constructively on distribution case
• Fully engaged in Harrisburg discussion
• Poised to launch low carbon strategy
• Well positioned for current economic environment

4
Exelon Is Uniquely Positioned for Sustainable Value Creation – 12/07 View
~40% EPS Growth (1)
PECOExGen
ComEd
2007
2011
PECO
ExGenComEd
Major Driver:End of below-market contract in PA
2011 Assumptions Used for 12/07 PresentationHenry Hub Gas Price ($/mmBtu) 8.00
Coal (NAPP 3.0) ($/ton) 49.75
PJM W-Hub Implied Heat Rate (mmBtu/MWh) (2) 7.85
NI-Hub Implied Heat Rate (mmBtu/MWh) (2) 6.20
2011 Sensitivities - Current (3)
(Pre-Tax Impact)
+/- $1/mmBtu Gas Price
+/- $15/ton Coal Price (NAPP 3.0)
~$500M
~$150M
+/- 0.5 mmBtu/MWh ATC Heat Rate ~$650M
(1) As published at Exelon’s 12/19/07 investor conference based upon 7/31/07 observable market prices. No assumption for carbon has been made for 2011. (2) Implied heat rate = Assumed ATC price ($/MWh) / Assumed Henry Hub Gas Price ($/mmBtu)(3) Sensitivities are derived by changing one assumption at a time while holding all else constant. Due to correlation of the various assumptions, the pre-tax earnings impact
calculated by aggregating individual sensitivities may not be equal to the pre-tax earnings impact calculated when correlations between the various assumptions are also considered.
Operating EPS Guidance:$4.15 – $4.30

5
5
5.5
6
6.5
7
7.5
8
8.5
9
2008 2009 2010 2011 2012
MM
Btu/
MW
h
45
50
55
60
65
70
75
80
85
90
2008 2009 2010 2011 2012
NAP
P - 3
.0 ($
/ton)
Positively Exposed to Market Dynamics
7
7.5
8
8.5
9
9.5
10
2008 2009 2010 2011 2012
Hen
ry H
ub ($
/MM
Btu)
Henry Hub Gas Price Coal Prices
2011 Capacity Prices
As of 3/27/08
12/07 Investor Conference
12/07 Investor Conference
As of 3/27/08
Price Assumptions
Current($/MW-day)
12/07($/MW-day)
Capacity(MWs)
Est. Pre-Tax Impact (1)
Rest of Market $175 $100 12,700 ~$350M
MAAC $175 $150 11,000 ~$100M
(1) Assumes RPM results for 2011/2012 are the same as 2010/2011 results.
Improving market fundamentals since our December Investor Conference point to additional upside in 2011
Implied ATC Heat RatesPJM West – As of
3/27/08
PJM West - 12/07 Investor
Conference
Ni-Hub – As of 3/27/08
Ni-Hub - 12/07 Investor
Conference

6
ComEd – Rate Case Summary
• ComEd and ICC Staff are in virtual agreement with respect to proper capital structure ~45% equity
• Relatively small difference between ComEd’s requested ROE (10.75%) and Staff’s recommendation (10.30%)
• ComEd and ICC Staff are much closer on administrative and general (A&G) expenses than in the last rate case
• Seeking to reduce regulatory lag by including pro forma capital additions in rate base and pursuing more timely recovery of costs through riders
• About 60% of difference between ComEd’s total revenue requirement and Staff’s recommendation relates to “timing” of recovery for 2007 and 2008 capital additions
• ALJ Order expected: July 2008
• Final ICC Order expected: September 2008
7
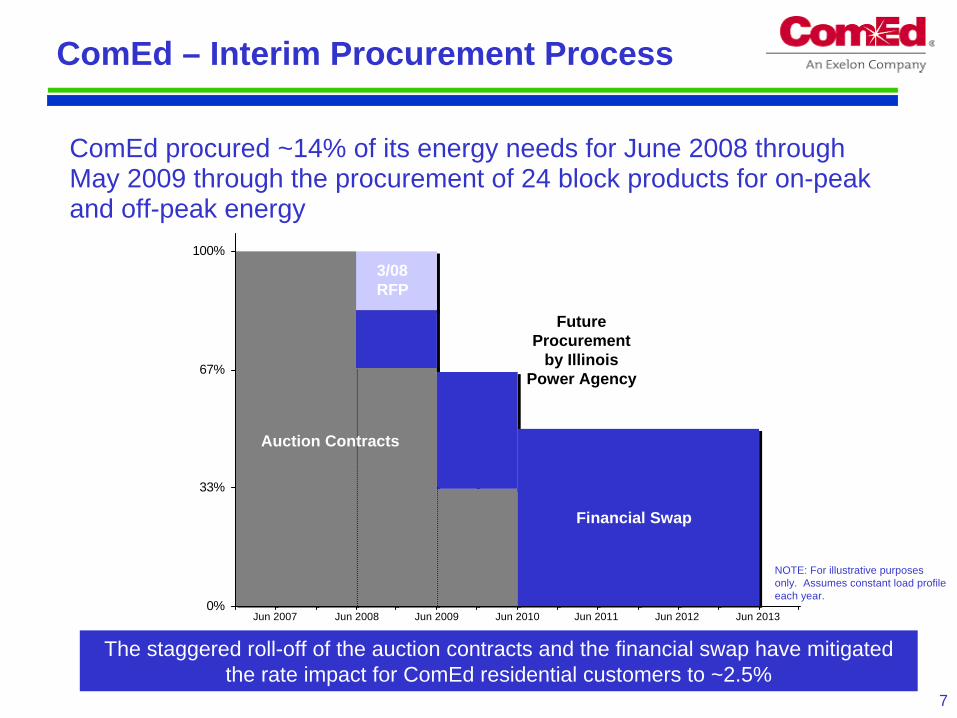
ComEd – Interim Procurement Process
ComEd procured ~14% of its energy needs for June 2008 through May 2009 through the procurement of 24 block products for on-peak and off-peak energy
The staggered roll-off of the auction contracts and the financial swap have mitigated the rate impact for ComEd residential customers to ~2.5%
0%
33%
67%
100%
Auction Contracts
Financial Swap
Future Procurement
by Illinois Power Agency
3/08 RFP
Jun 2007 Jun 2008 Jun 2009 Jun 2010 Jun 2011 Jun 2012 Jun 2013
NOTE: For illustrative purposes only. Assumes constant load profile each year.

8
Pennsylvania Snapshot
Current State of Play• Governor Rendell’s “Energy Independence Strategy”,
introduced in February 2007, continues to be focus of legislative activity.
Legislation aimed at reducing energy costs, increasing clean energy resources, reducing reliance on foreign fuels, expanding energy production in PAComprehensive bills dealing with procurement and rate mitigation remain in committeeModest action on other key bills: Energy Fund bills passed in House and Senate; House passed an Efficiency/Demand-side Response bill.
• Special Session on Energy runs concurrent with Regular Session which continues thru November 2008.
Positions of Stakeholders
• Governor continues to press for “Energy Independence Fund” and measures to mitigate energy prices
• Legislators concerned with cost of Governor's initiatives, no new taxes
• Rate freeze bill being considered in House, but little momentum
• Industry coalition working together to develop a comprehensive package
PECO Actions
• Stakeholder outreach• Working with industry coalition• Negotiating legislative proposals with
Administration and legislative leadership on key provisions:
Procurement rulesRate increase phase-in/deferralSmart meters and real time pricing Energy efficiency and demand-side management programs
• Participating directly or through industry associations in legislative hearings and informational meetings

9
Protect Today’s Value
• Deliver superior operating performance – Assure safety at all times– Keep the lights on– Maintain nuclear excellence– Enhance environmental performance
• Advance competitive markets – Build economic new generation– Provide reliable, affordable, low-carbon
products to customers– Support the continued improvement of
organized competitive wholesale markets • Protect the value of our generation
– Adapt the generation portfolio to a changing marketplace
– Hedge market risk appropriately• Build healthy, self-sustaining delivery
companies– Pursue fair regulatory treatment and restored
financial health for ComEd– Manage PECO’s 2011 transition to market
Grow Long-Term Value
• Drive the organization to the next level of performance
– Continuously improve productivity – Insist on accountability for results and
values – Foster positive employee relations– Acquire, develop and retain key and diverse
talent• Set the industry standard for low carbon
energy generation and delivery through reductions, displacement and offsets
– Aggressively pursue cost effective energy efficiency and demand response
– Develop and deploy reliable and affordable gas-fired and renewable generation
– Increase nuclear production – Become a model of green operations
• Pursue and rigorously evaluate new growth opportunities
+
Exelon’s Strategic Direction

10
Sustainable Value
• Continued strong financial and operating performance, and long- term earnings growth driven by unregulated generation
• Largest, lowest-cost nuclear fleet in competitive markets
• Executing regulatory recovery plan to put ComEd on a path toward appropriate returns and solid credit metrics
• Managing transition to competitive markets in Pennsylvania
• Increasingly strong cash flows and balance sheet
• Implementing Value Return Policy
Exelon is uniquely positioned to create sustainable value

11
Appendix

12
ComEd – Rate Case Summary
Comparison of ComEd revenue request to ICC Staff recommendation:
($ in millions)ComEd Request ICC Staff
Impact on Revenue Increase
Rate Base:
2006 Test Year $5,573 $5,348 $(26)
Pro Forma Adjustments 1,498 358 (130)
Total Rate Base 7,071 5,706 (156)
ROE/Cap Structure10.75% ROE / 45.11% Equity
10.30% ROE / 45.04% Equity (25)
Depreciation and Amortization 359 333 (26)
A&G Expenses 341 315 (26)
Other O&M Expenses 657 640 (16)
Total $(249)

13
ComEd Interim Procurement Results
On-Peak Off-PeakMWs (1) Avg. Price (2) MWs (1) Avg. Price (2)
June 2008 1,060 $81.13 630 $42.15
July 2008 1,640 94.92 960 47.46
August 2008 1,450 94.64 840 47.46
September 2008 870 76.80 470 42.65
October 2008 620 76.01 290 43.70
November 2008 750 74.89 460 44.31
December 2008 1,000 74.71 710 44.28
January 2009 1,000 79.76 720 49.32
February 2009 860 79.72 600 48.99
March 2009 650 76.15 370 44.60
April 2009 450 77.50 190 44.64
May 2009 520 75.70 250 42.99
(1) MWs solicited.(2) Weighted average of the winning bid prices (in $/MWh) for each contract type and each contract term.

14
2.63 2.63
0.48 0.48
2.41
6.00 10.59
PECO Average Electric Rates
(1) System Average Rates based upon Restructuring Settlement Rate Caps on Energy and Capacity increased from original settlement by 1.6% to reflect the roll-in of increased Gross Receipts Tax and $0.02/kWh for Universal Service Fund Charge and Nuclear Decommissioning Cost Adjustment. System Average Rates also adjusted for sales mix based on current sales forecast. Assumes continuation of current Transmission and Distribution Rates.
20112008 – 2010
Energy / Capacity
Competitive Transition Charge (CTC)
Transmission
Distribution
11.52¢ (1)Unit Rates (¢/kWh)
Electric Restructuring Settlement
Electric Restructuring Settlement
+19%
13.70¢
Assumptions
Projected Rate Increase Based on Average PPL Procurement Results
(Illustrative)
Projected Rate Increase Based on Average PPL Procurement Results
(Illustrative)
2011 default service rate will reflect associated full requirements costs and be acquired through multiple procurements
Using the average results of completed PPL procurements for 2010 and assuming a 50/50 weighting of Residential and Small C&I customers produces a proxy of 10.59¢/kWh. This will result in a system average rate increase of ~19%
PECO’s 2011 full requirements price expected to differ from PPL due, in part, to the timing of the procurement (2011 vs. 2010) and locational differences
Rates will vary by customer class and may be impacted by legislation and procurement model
Residential Small C&IRound 1, 7/2007 $101.77 $105.11
Round 2, 10/2007 $105.08 $105.75
Round 3, 3/2008 $108.80 $108.76
Average $105.22 $106.54
PPL Procurement Results ($/MWh)

15
Pennsylvania Legislative Update
• More than 100 bills have been introduced since Governor Rendell launched his Energy Independence Initiative in February 2007.
• H.B. 2200 - Energy Efficiency (EE), Demand Response (DR) & Smart Meters:– Passed by House on 2/20/08– Establishes Program Administrator to oversee development and execution of a state-wide program delivered to
customers by network of 3rd-party service providers – EE target of 1% reduction off of forecasted total deliveries by 2011 and 2.5% by 2013– DR target of 4% reduction in peak load by 2013 – Cost cap set at 2% of total annual revenues– Full deployment of Smart Meters over 10 years
• H.B. 2201 - Comprehensive Energy Bill:– In Committee– Directs distribution companies to procure power using a portfolio approach, including long-term, short-term and
spot market purchases– Portfolio may include up to 20% long-term, but limit excludes long-term AEPS purchases and PAPUC may
waive limit and PAPUC may direct specific purchases– All customers can opt to phase-in increases early and/or over 3 years after caps expire.– Distribution companies must limit initial phase-in to a maximum 15% annual increase over 2010 rates during
the 3-years. May recover deferrals over additional 3 years
– Full deployment of Smart Meters over 10 years, with voluntary time-of-use or real-time pricing rates• H.B. 0001 - Special Session House Bill 1:
– Passed by House on 3/11/08– Establishes an $850 million bond fund through existing gross receipts tax to create a Clean Energy Program – Promotes low-pollution, state-based energy generation and investment to reduce the Pennsylvania’s
dependence on Middle East oil and other foreign energy sources

16
(1) Amounts shown per Exelon share and represent contributions to Exelon's EPS.
ExGen (1) ComEd (1) PECO (1) Other (1) Exelon
2007 GAAP Earnings Per Share $3.01 $0.25 $0.75 $0.04 $4.05
Mark-to-market adjustments from economic hedging activities 0.15 - - - 0.15
2007 Illinois electric rate settlement 0.38 0.03 - - 0.41
Investments in synthetic fuel-producing facilities - - - (0.14) (0.14)
Nuclear decommissioning obligation reduction (0.03) - - - (0.03)
Termination of State Line PPA (0.19) - - - (0.19)
Georgia Power tolling agreement 0.11 - - - 0.11
City of Chicago settlement - 0.02 - - 0.02
Non-cash deferred tax items 0.04 - - (0.08) (0.04)
Settlement of a tax matter at Generation related to Sithe (0.01) - - - (0.01)
Sale of Generation's investments in TEG and TEP (0.01) - - - (0.01)
2007 Adjusted (non-GAAP) Operating Earnings (Loss) Per Share $3.45 $0.30 $0.75 $(0.18) $4.32
GAAP EPS Reconciliation Year Ended December 31, 2007

17
Exelon Investor Relations Contacts
Inquiries concerning this presentation should be directed to:
Exelon Investor Relations10 South Dearborn StreetChicago, Illinois 60603312-394-2345312-394-4082 (Fax)
For copies of other presentations, annual/quarterly reports, or to be added to our email distribution list please contact:
Felicia McGowan, Executive Admin Coordinator312-394-4069 [email protected]
Investor Relations Contacts:
Chaka Patterson, Vice [email protected]
Karie Anderson, [email protected]
Marybeth Flater, [email protected]
Len Epelbaum, Principal [email protected]