Embed Size (px)
Citation preview

Earnings Conference Call 1st Quarter 2017
May 3, 2017
2 Q1 2017 Earnings Release Slides
Cautionary Statements Regarding Forward-Looking Information
This presentation contains certain forward-looking statements within the meaning of the Private Securities
Litigation Reform Act of 1995, that are subject to risks and uncertainties. The factors that could cause actual
results to differ materially from the forward-looking statements made by Exelon Corporation, Exelon Generation
Company, LLC, Commonwealth Edison Company, PECO Energy Company, Baltimore Gas and Electric Company,
Pepco Holdings LLC, Potomac Electric Power Company, Delmarva Power & Light Company, and Atlantic City
Electric Company (Registrants) include those factors discussed herein, as well as the items discussed in (1)
Exelon’s 2016 Annual Report on Form 10-K in (a) ITEM 1A. Risk Factors, (b) ITEM 7. Management’s Discussion
and Analysis of Financial Condition and Results of Operations and (c) ITEM 8. Financial Statements and
Supplementary Data: Note 24, Commitments and Contingencies; (2) Exelon’s First Quarter 2017 Quarterly
Report on Form 10-Q (to be filed on May 3, 2017) in (a) Part II, Other Information, ITEM 1A. Risk Factors; (b) Part
1, Financial Information, ITEM 2. Management’s Discussion and Analysis of Financial Condition and Results of
Operations and (c) Part I, Financial Information, ITEM 1. Financial Statements: Note 17; and (2) other factors
discussed in filings with the SEC by the Registrants. Readers are cautioned not to place undue reliance on these
forward-looking statements, which apply only as of the date of this press release. None of the Registrants
undertakes any obligation to publicly release any revision to its forward-looking statements to reflect events or
circumstances after the date of this presentation.
3 Q1 2017 Earnings Release Slides
Non-GAAP Financial Measures Exelon reports its financial results in accordance with accounting principles generally accepted in the United
States (GAAP). Exelon supplements the reporting of financial information determined in accordance with GAAP
with certain non-GAAP financial measures, including:
• Adjusted operating earnings exclude certain costs, expenses, gains and losses and other specified items, including mark-to-
market adjustments from economic hedging activities, unrealized gains and losses from nuclear decommissioning trust fund
investments, merger and integration related costs, impairments of certain long-lived assets, certain amounts associated with
plant retirements and divestitures, costs related to a cost management program and other items as set forth in the
reconciliation in the Appendix
• Adjusted operating and maintenance expense excludes regulatory operating and maintenance costs for the utility
businesses and direct cost of sales for certain Constellation businesses, decommissioning costs that do not affect profit and
loss, the impact from operating and maintenance expense related to variable interest entities at Generation, and other items
as set forth in the reconciliation in the Appendix
• Total gross margin is defined as operating revenues less purchased power and fuel expense, excluding revenue related to
decommissioning, gross receipts tax, Exelon Nuclear Partners, JExel Nuclear JV, variable interest entities, and net of direct
cost of sales for certain Constellation and Power businesses
• Adjusted cash flow from operations or free cash flow primarily includes net cash flows from operating activities and net
cash flows from investing activities excluding capital expenditures, net merger and acquisitions, and equity investments
• Operating ROE is calculated using operating net income divided by simple equity for the period. The operating income
reflects all lines of business for the utility business (Electric Distribution, Gas Distribution, Transmission).
• EBITDA is defined as earnings before interest, taxes, depreciation and amortization. Includes nuclear fuel amortization
expense.
• Revenue net of purchased power and fuel expense is calculated as the GAAP measure of operating revenue less the GAAP
measure of purchased power and fuel expense
Due to the forward-looking nature of some forecasted non-GAAP measures, information to reconcile the
forecasted adjusted (non-GAAP) measures to the most directly comparable GAAP measure may not be currently
available, as management is unable to project all of these items for future periods
4 Q1 2017 Earnings Release Slides
Non-GAAP Financial Measures Continued
This information is intended to enhance an investor’s overall understanding of period over period financial
results and provide an indication of Exelon’s baseline operating performance by excluding items that are
considered by management to be not directly related to the ongoing operations of the business. In addition, this
information is among the primary indicators management uses as a basis for evaluating performance, allocating
resources, setting incentive compensation targets and planning and forecasting of future periods.
These non-GAAP financial measures are not a presentation defined under GAAP and may not be comparable to
other companies’ presentation. Exelon has provided these non-GAAP financial measure as supplemental
information and in addition to the financial measures that are calculated and presented in accordance with
GAAP. These non-GAAP measures should not be deemed more useful than, a substitute for, or an alternative to
the most comparable GAAP measures provided in the materials presented.
Non-GAAP financial measures are identified by the phrase “non-GAAP” or an asterisk. Reconciliations of these
non-GAAP measures to the most comparable GAAP measures are provided in the appendices and attachments
to this presentation, except for the reconciliation for total gross margin, which appears on slide 27 of this
presentation.
5 Q1 2017 Earnings Release Slides
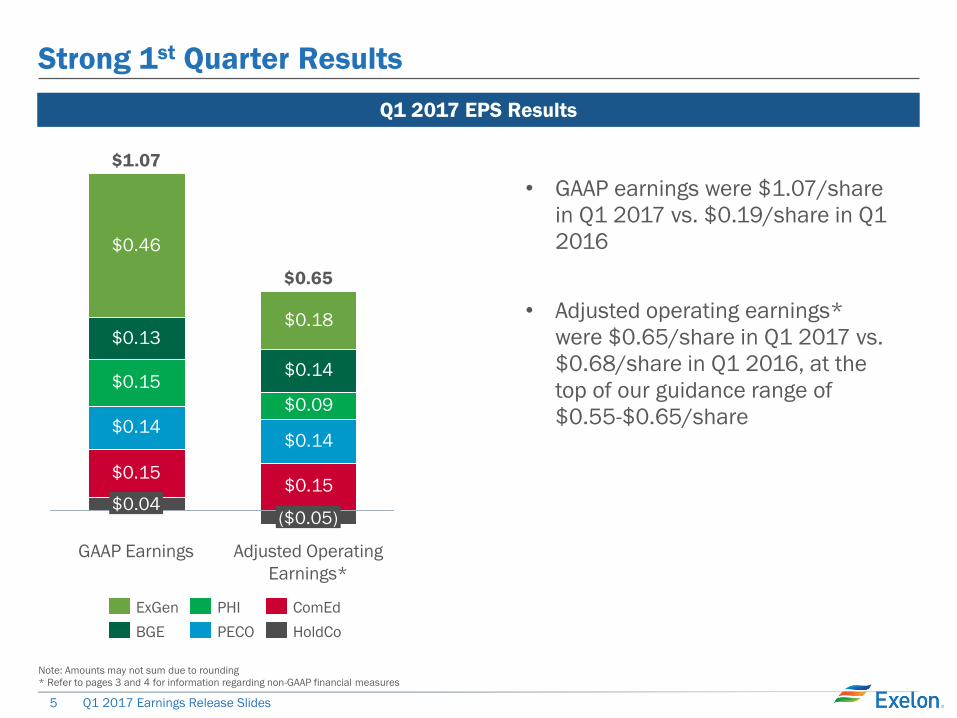
Note: Amounts may not sum due to rounding
* Refer to pages 3 and 4 for information regarding non-GAAP financial measures
Strong 1st Quarter Results
$0.15$0.15
$0.14$0.14
$0.15
$0.09
$0.13
$0.14
$0.46
$0.18
($0.05)
Adjusted Operating
Earnings*
$0.65
$0.04
$1.07
GAAP Earnings
Q1 2017 EPS Results
• GAAP earnings were $1.07/share
in Q1 2017 vs. $0.19/share in Q1
2016
• Adjusted operating earnings*
were $0.65/share in Q1 2017 vs.
$0.68/share in Q1 2016, at the
top of our guidance range of
$0.55-$0.65/share
ComEd ExGen PHI
BGE PECO HoldCo
6 Q1 2017 Earnings Release Slides
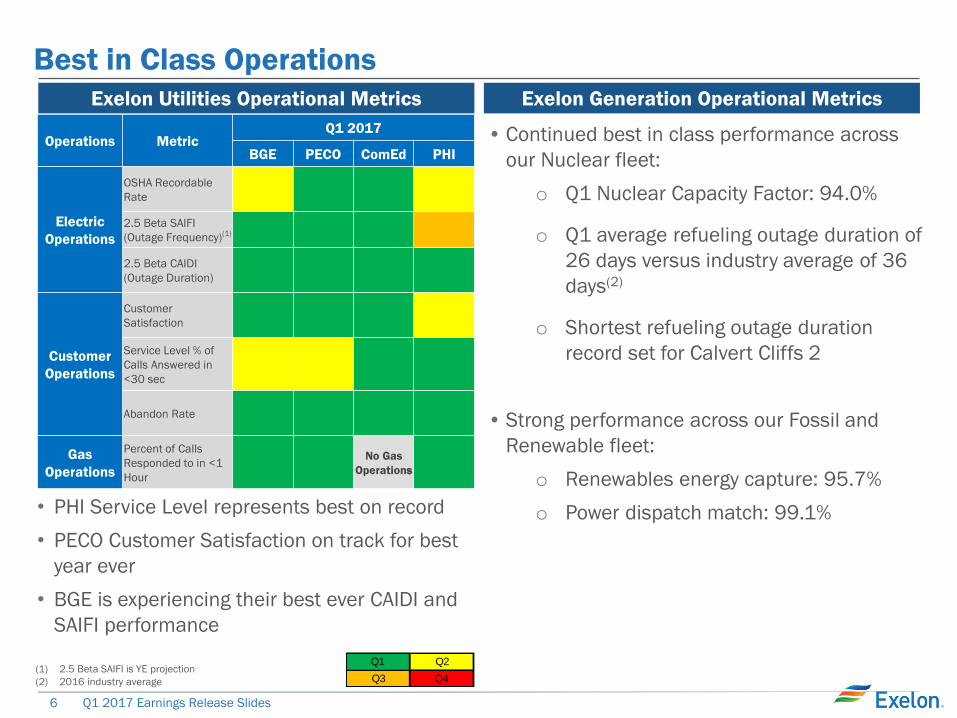
Best in Class Operations
Operations Metric Q1 2017
BGE PECO ComEd PHI
Electric
Operations
OSHA Recordable
Rate
2.5 Beta SAIFI
(Outage Frequency)(1)
2.5 Beta CAIDI
(Outage Duration)
Customer
Operations
Customer
Satisfaction
Service Level % of
Calls Answered in
<30 sec
Abandon Rate
Gas
Operations
Percent of Calls
Responded to in <1
Hour
No Gas
Operations
Q1 Q2
Q3 Q4(1) 2.5 Beta SAIFI is YE projection
(2) 2016 industry average
Exelon Utilities Operational Metrics Exelon Generation Operational Metrics
• Continued best in class performance across
our Nuclear fleet:
o Q1 Nuclear Capacity Factor: 94.0%
o Q1 average refueling outage duration of
26 days versus industry average of 36
days(2)
o Shortest refueling outage duration
record set for Calvert Cliffs 2
• Strong performance across our Fossil and
Renewable fleet:
o Renewables energy capture: 95.7%
o Power dispatch match: 99.1%
• PHI Service Level represents best on record
• PECO Customer Satisfaction on track for best
year ever
• BGE is experiencing their best ever CAIDI and
SAIFI performance
7 Q1 2017 Earnings Release Slides
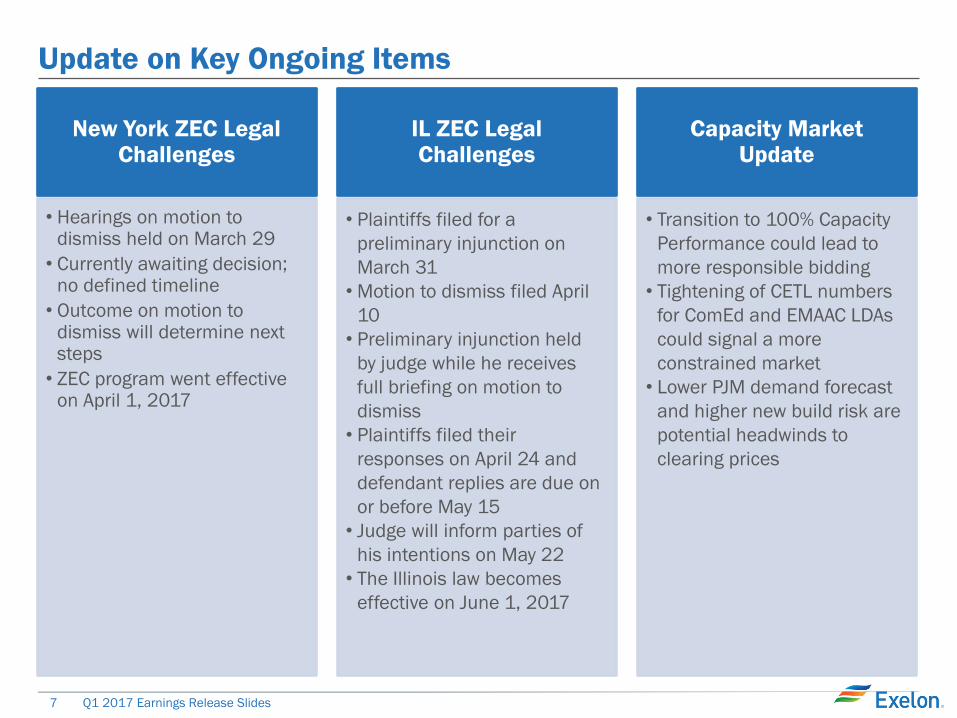
Update on Key Ongoing Items
New York ZEC Legal Challenges
Capacity Market Update
IL ZEC Legal Challenges
• Hearings on motion to dismiss held on March 29
• Currently awaiting decision; no defined timeline
• Outcome on motion to dismiss will determine next steps
• ZEC program went effective on April 1, 2017
• Plaintiffs filed for a
preliminary injunction on
March 31
• Motion to dismiss filed April
10
• Preliminary injunction held
by judge while he receives
full briefing on motion to
dismiss
• Plaintiffs filed their
responses on April 24 and
defendant replies are due on
or before May 15
• Judge will inform parties of
his intentions on May 22
• The Illinois law becomes
effective on June 1, 2017
• Transition to 100% Capacity
Performance could lead to
more responsible bidding
• Tightening of CETL numbers
for ComEd and EMAAC LDAs
could signal a more
constrained market
• Lower PJM demand forecast
and higher new build risk are
potential headwinds to
clearing prices
8 Q1 2017 Earnings Release Slides
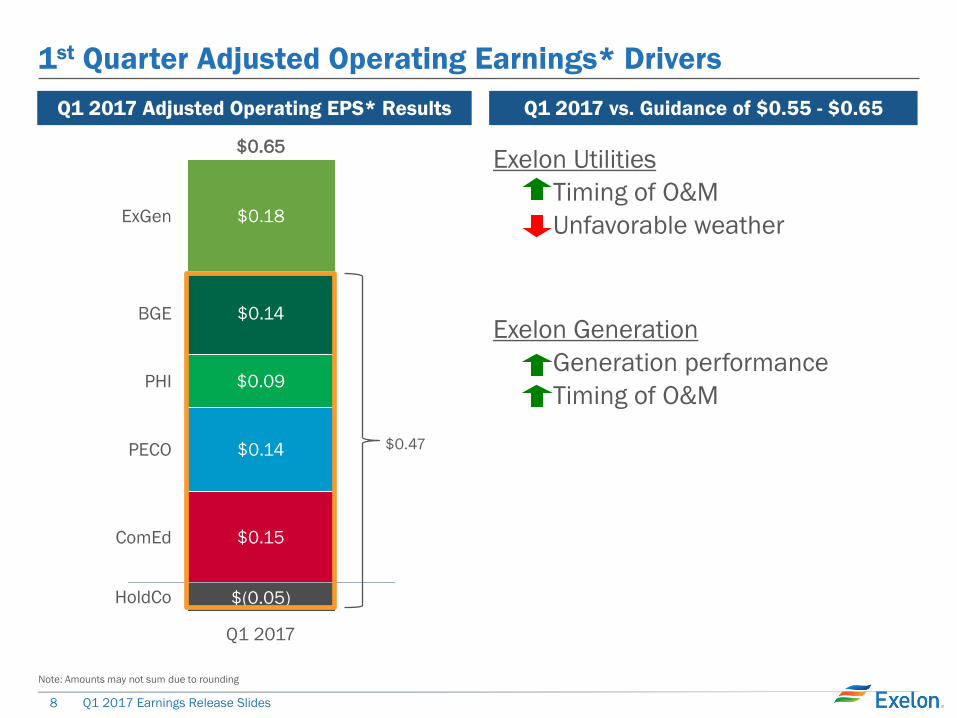
Note: Amounts may not sum due to rounding
HoldCo
ComEd
PECO
PHI
BGE
ExGen
$0.65
$(0.05)
$0.15
$0.14
$0.09
$0.14
$0.18
Q1 2017
Q1 2017 Adjusted Operating EPS* Results
Exelon Utilities
– Timing of O&M
– Unfavorable weather
Exelon Generation
– Generation performance
– Timing of O&M
1st Quarter Adjusted Operating Earnings* Drivers
Q1 2017 vs. Guidance of $0.55 - $0.65
$0.47
9 Q1 2017 Earnings Release Slides
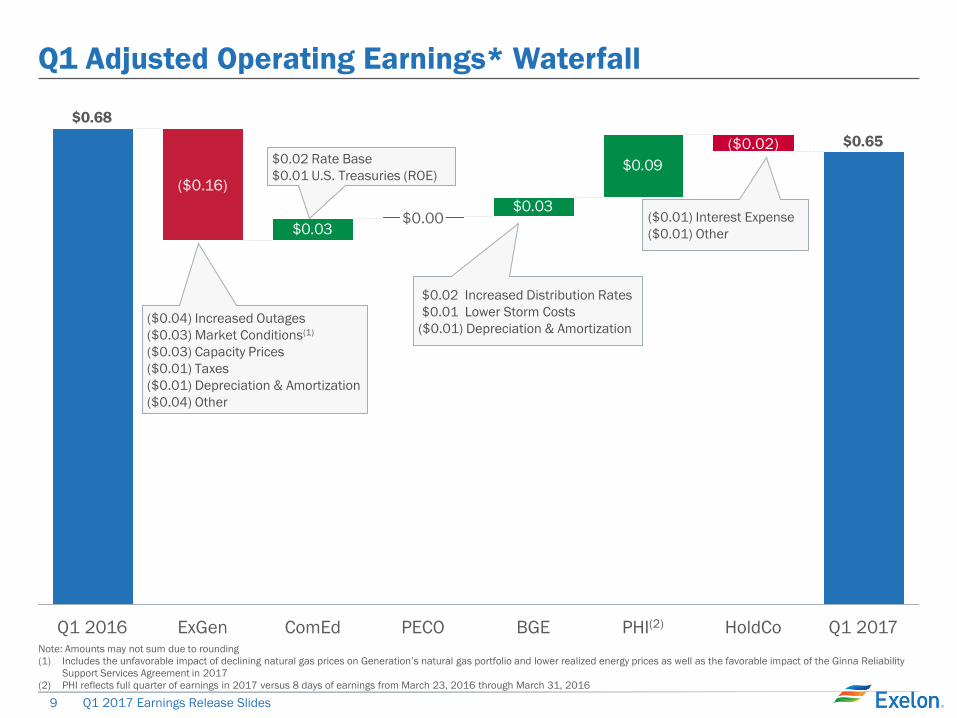
Q1 Adjusted Operating Earnings* Waterfall
$0.03
$0.03
$0.09
$0.65
$0.68
Q1 2017 HoldCo
($0.02)
PHI(2) BGE PECO
$0.00
ComEd ExGen
($0.16)
Q1 2016
($0.04) Increased Outages
($0.03) Market Conditions(1)
($0.03) Capacity Prices
($0.01) Taxes
($0.01) Depreciation & Amortization
($0.04) Other
Note: Amounts may not sum due to rounding
(1) Includes the unfavorable impact of declining natural gas prices on Generation’s natural gas portfolio and lower realized energy prices as well as the favorable impact of the Ginna Reliability
Support Services Agreement in 2017
(2) PHI reflects full quarter of earnings in 2017 versus 8 days of earnings from March 23, 2016 through March 31, 2016
$0.02 Rate Base
$0.01 U.S. Treasuries (ROE)
$0.02 Increased Distribution Rates
$0.01 Lower Storm Costs
($0.01) Depreciation & Amortization
($0.01) Interest Expense
($0.01) Other
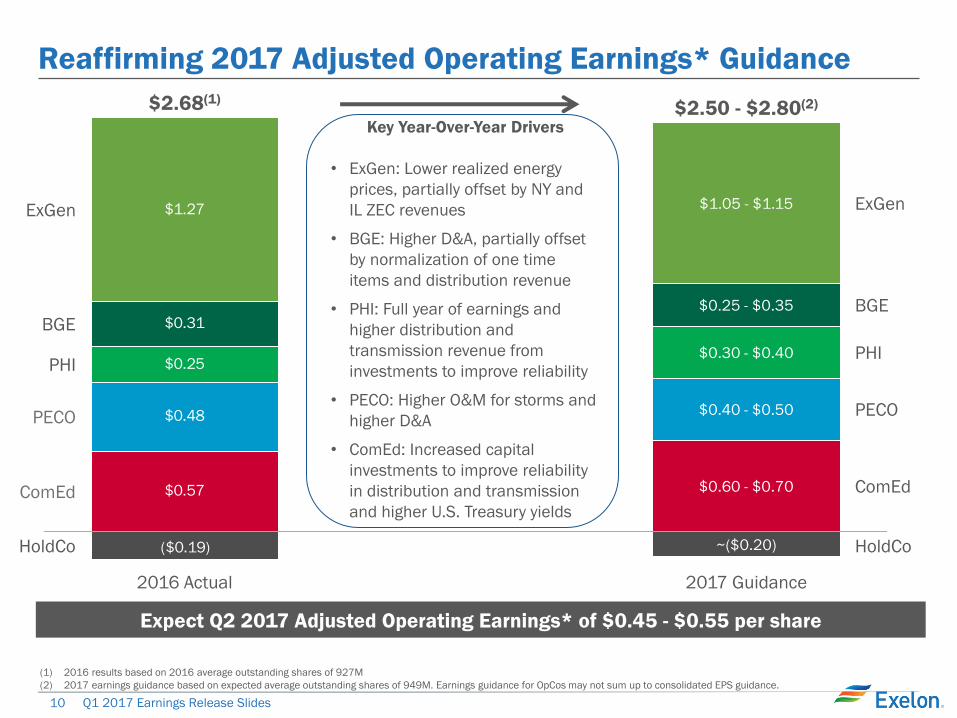
10 Q1 2017 Earnings Release Slides
($0.19)
$0.57
$0.48
$0.25
$0.31
$1.27
HoldCo
ComEd
PECO
PHI
BGE
ExGen
HoldCo
ComEd
PECO
PHI
BGE
ExGen
2017 Guidance
$2.50 - $2.80(2)
~($0.20)
$0.60 - $0.70
$0.40 - $0.50
$0.30 - $0.40
$0.25 - $0.35
$1.05 - $1.15
2016 Actual
$2.68(1)
Reaffirming 2017 Adjusted Operating Earnings* Guidance
(1) 2016 results based on 2016 average outstanding shares of 927M
(2) 2017 earnings guidance based on expected average outstanding shares of 949M. Earnings guidance for OpCos may not sum up to consolidated EPS guidance.
Expect Q2 2017 Adjusted Operating Earnings* of $0.45 - $0.55 per share
Key Year-Over-Year Drivers
• ExGen: Lower realized energy
prices, partially offset by NY and
IL ZEC revenues
• BGE: Higher D&A, partially offset
by normalization of one time
items and distribution revenue
• PHI: Full year of earnings and
higher distribution and
transmission revenue from
investments to improve reliability
• PECO: Higher O&M for storms and
higher D&A
• ComEd: Increased capital
investments to improve reliability
in distribution and transmission
and higher U.S. Treasury yields
11 Q1 2017 Earnings Release Slides
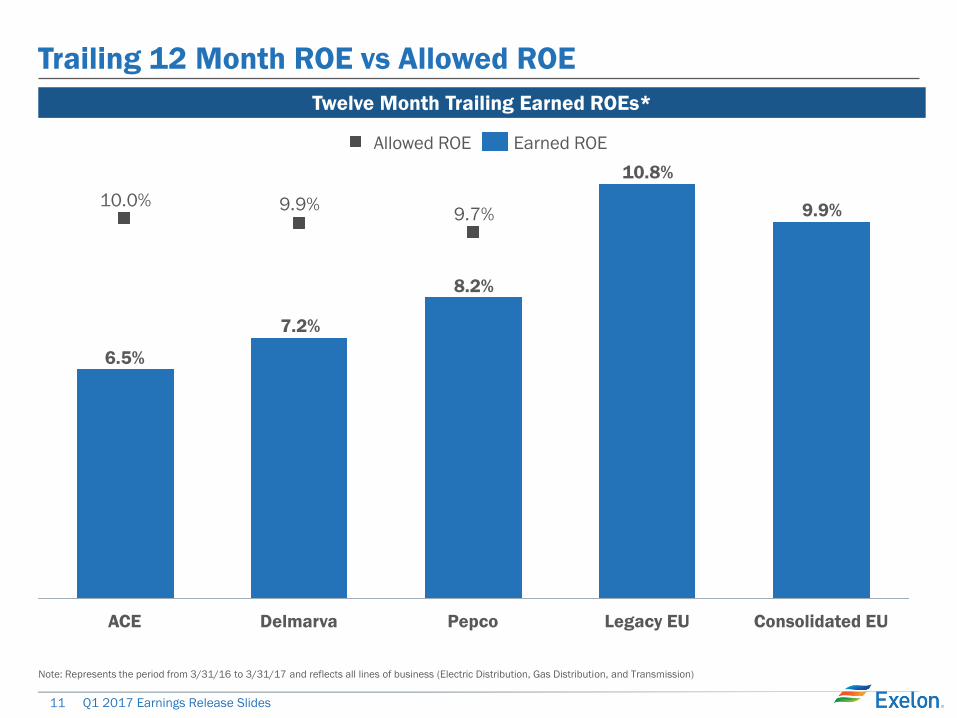
Trailing 12 Month ROE vs Allowed ROE
Twelve Month Trailing Earned ROEs*
9.9%
10.8%
8.2%
7.2%
6.5%
9.7%9.9%10.0%
Consolidated EU Legacy EU Pepco Delmarva ACE
Allowed ROE Earned ROE
Note: Represents the period from 3/31/16 to 3/31/17 and reflects all lines of business (Electric Distribution, Gas Distribution, and Transmission)
12 Q1 2017 Earnings Release Slides
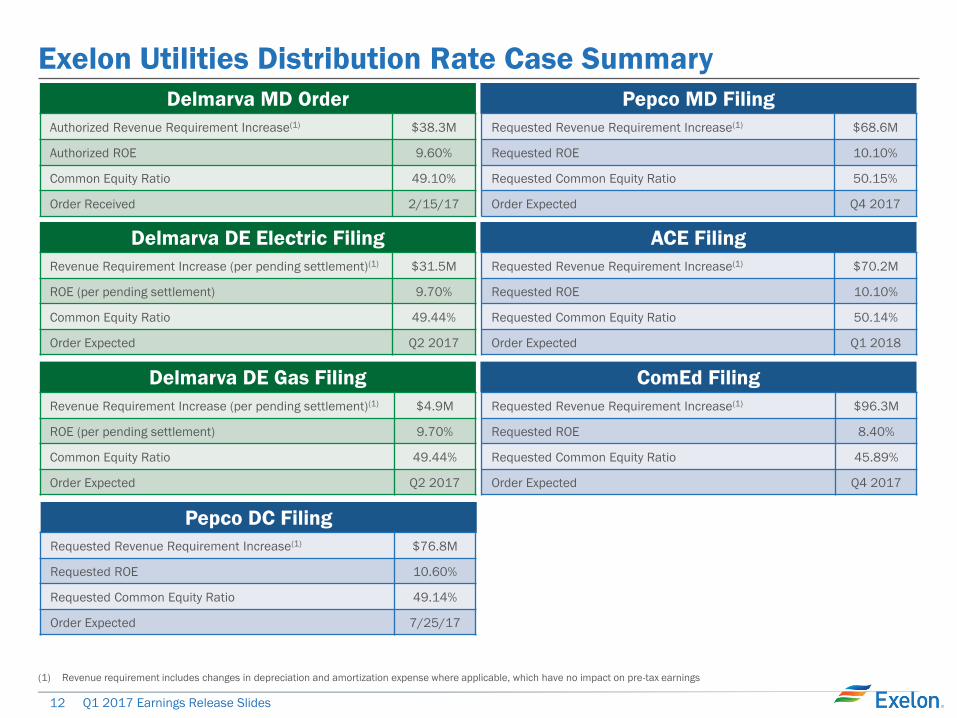
Exelon Utilities Distribution Rate Case Summary
Delmarva DE Electric Filing
Revenue Requirement Increase (per pending settlement)(1) $31.5M
ROE (per pending settlement) 9.70%
Common Equity Ratio 49.44%
Order Expected Q2 2017
Delmarva DE Gas Filing
Revenue Requirement Increase (per pending settlement)(1) $4.9M
ROE (per pending settlement) 9.70%
Common Equity Ratio 49.44%
Order Expected Q2 2017
Delmarva MD Order
Authorized Revenue Requirement Increase(1) $38.3M
Authorized ROE 9.60%
Common Equity Ratio 49.10%
Order Received 2/15/17
Pepco DC Filing
Requested Revenue Requirement Increase(1) $76.8M
Requested ROE 10.60%
Requested Common Equity Ratio 49.14%
Order Expected 7/25/17
(1) Revenue requirement includes changes in depreciation and amortization expense where applicable, which have no impact on pre-tax earnings
Pepco MD Filing
Requested Revenue Requirement Increase(1) $68.6M
Requested ROE 10.10%
Requested Common Equity Ratio 50.15%
Order Expected Q4 2017
ACE Filing
Requested Revenue Requirement Increase(1) $70.2M
Requested ROE 10.10%
Requested Common Equity Ratio 50.14%
Order Expected Q1 2018
ComEd Filing
Requested Revenue Requirement Increase(1) $96.3M
Requested ROE 8.40%
Requested Common Equity Ratio 45.89%
Order Expected Q4 2017
13 Q1 2017 Earnings Release Slides
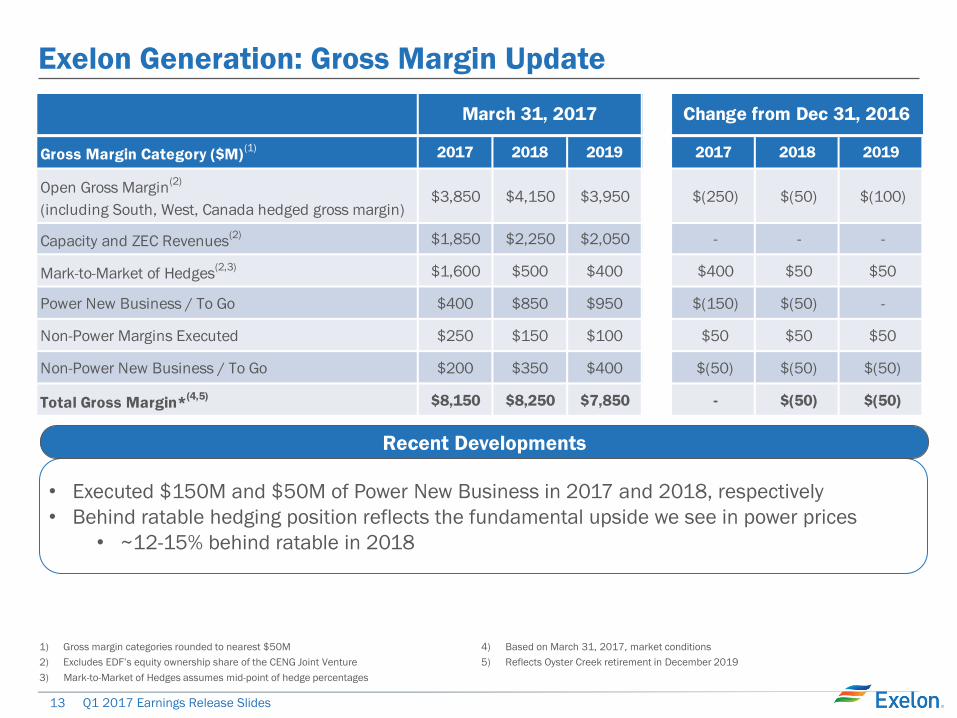
Exelon Generation: Gross Margin Update
1) Gross margin categories rounded to nearest $50M
2) Excludes EDF’s equity ownership share of the CENG Joint Venture
3) Mark-to-Market of Hedges assumes mid-point of hedge percentages
4) Based on March 31, 2017, market conditions
5) Reflects Oyster Creek retirement in December 2019
• Executed $150M and $50M of Power New Business in 2017 and 2018, respectively
• Behind ratable hedging position reflects the fundamental upside we see in power prices
• ~12-15% behind ratable in 2018
Recent Developments
Gross Margin Category ($M)(1) 2017 2018 2019 2017 2018 2019
Open Gross Margin(2)
(including South, West, Canada hedged gross margin)$3,850 $4,150 $3,950 $(250) $(50) $(100)
Capacity and ZEC Revenues(2) $1,850 $2,250 $2,050 - - -
Mark-to-Market of Hedges(2,3) $1,600 $500 $400 $400 $50 $50
Power New Business / To Go $400 $850 $950 $(150) $(50) -
Non-Power Margins Executed $250 $150 $100 $50 $50 $50
Non-Power New Business / To Go $200 $350 $400 $(50) $(50) $(50)
Total Gross Margin*(4,5) $8,150 $8,250 $7,850 - $(50) $(50)
March 31, 2017 Change from Dec 31, 2016
14 Q1 2017 Earnings Release Slides
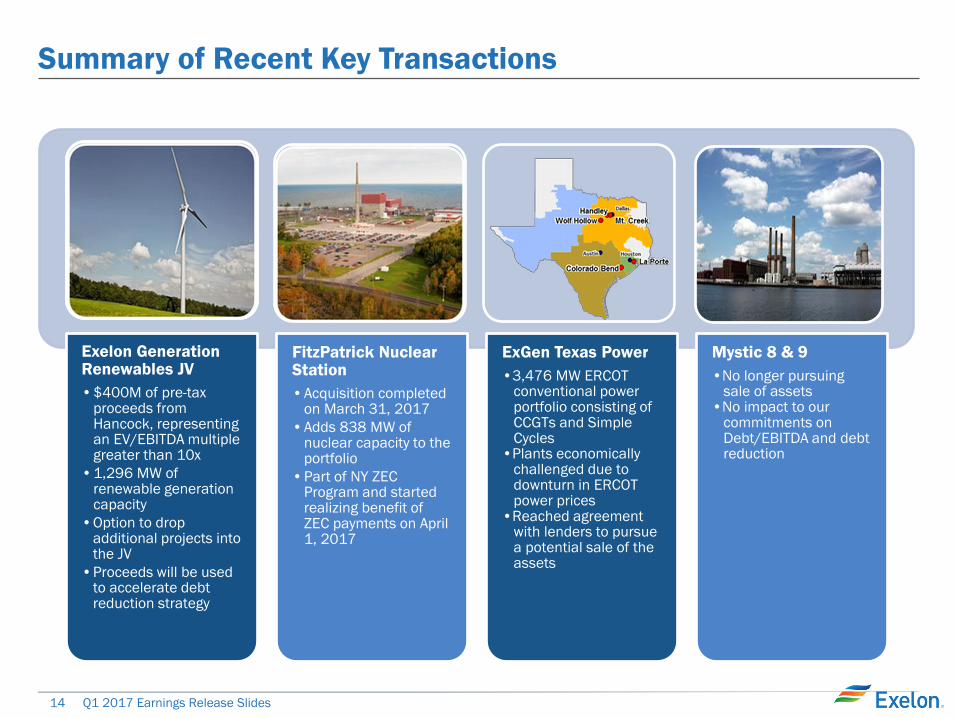
Summary of Recent Key Transactions
Exelon Generation Renewables JV
•$400M of pre-tax proceeds from Hancock, representing an EV/EBITDA multiple greater than 10x
•1,296 MW of renewable generation capacity
•Option to drop additional projects into the JV
•Proceeds will be used to accelerate debt reduction strategy
FitzPatrick Nuclear Station
•Acquisition completed on March 31, 2017
•Adds 838 MW of nuclear capacity to the portfolio
•Part of NY ZEC Program and started realizing benefit of ZEC payments on April 1, 2017
ExGen Texas Power
•3,476 MW ERCOT conventional power portfolio consisting of CCGTs and Simple Cycles
•Plants economically challenged due to downturn in ERCOT power prices
•Reached agreement with lenders to pursue a potential sale of the assets
Mystic 8 & 9
•No longer pursuing sale of assets
•No impact to our commitments on Debt/EBITDA and debt reduction
15 Q1 2017 Earnings Release Slides
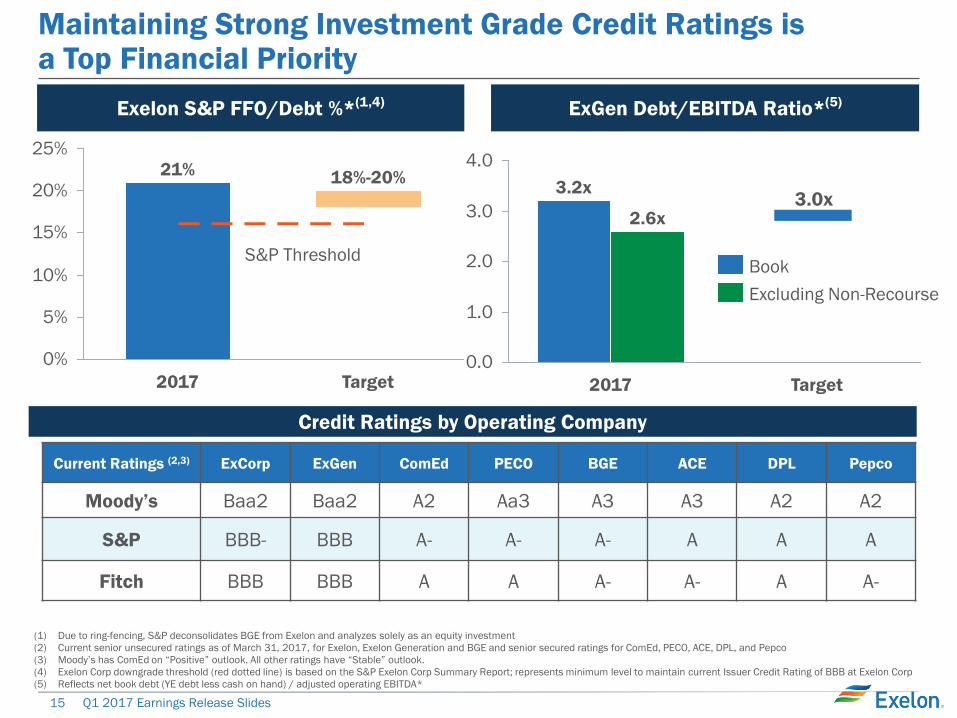
Maintaining Strong Investment Grade Credit Ratings is a Top Financial Priority
Current Ratings (2,3) ExCorp ExGen ComEd PECO BGE ACE DPL Pepco
Moody’s Baa2 Baa2 A2 Aa3 A3 A3 A2 A2
S&P BBB- BBB A- A- A- A A A
Fitch BBB BBB A A A- A- A A-
(1) Due to ring-fencing, S&P deconsolidates BGE from Exelon and analyzes solely as an equity investment
(2) Current senior unsecured ratings as of March 31, 2017, for Exelon, Exelon Generation and BGE and senior secured ratings for ComEd, PECO, ACE, DPL, and Pepco
(3) Moody’s has ComEd on “Positive” outlook. All other ratings have “Stable” outlook.
(4) Exelon Corp downgrade threshold (red dotted line) is based on the S&P Exelon Corp Summary Report; represents minimum level to maintain current Issuer Credit Rating of BBB at Exelon Corp
(5) Reflects net book debt (YE debt less cash on hand) / adjusted operating EBITDA*
ExGen Debt/EBITDA Ratio*(5) Exelon S&P FFO/Debt %*(1,4)
Credit Ratings by Operating Company
0%
5%
10%
15%
20%
25%
18%-20%
2017 Target
21%
0.0
1.0
2.0
3.0
4.0
2.6x
3.2x
2017 Target
3.0x
Excluding Non-Recourse
Book S&P Threshold
16 Q1 2017 Earnings Release Slides
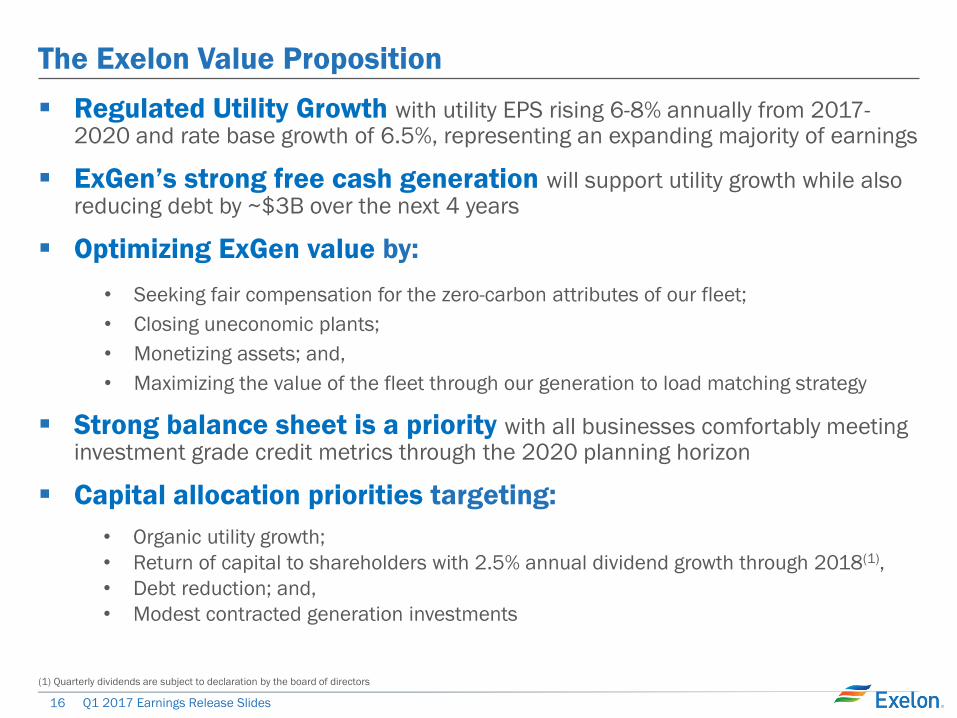
The Exelon Value Proposition
Regulated Utility Growth with utility EPS rising 6-8% annually from 2017-2020 and rate base growth of 6.5%, representing an expanding majority of earnings
ExGen’s strong free cash generation will support utility growth while also reducing debt by ~$3B over the next 4 years
Optimizing ExGen value by:
• Seeking fair compensation for the zero-carbon attributes of our fleet;
• Closing uneconomic plants;
• Monetizing assets; and,
• Maximizing the value of the fleet through our generation to load matching strategy
Strong balance sheet is a priority with all businesses comfortably meeting investment grade credit metrics through the 2020 planning horizon
Capital allocation priorities targeting:
• Organic utility growth;
• Return of capital to shareholders with 2.5% annual dividend growth through 2018(1),
• Debt reduction; and,
• Modest contracted generation investments
(1) Quarterly dividends are subject to declaration by the board of directors
17 Q1 2017 Earnings Release Slides
Additional Disclosures
18 Q1 2017 Earnings Release Slides
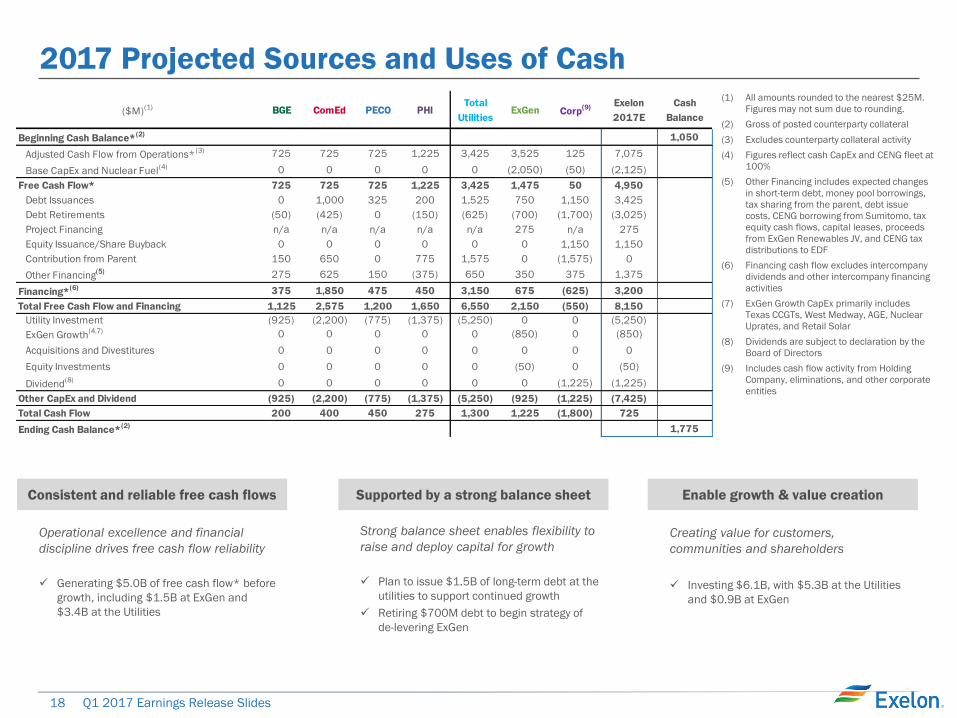
2017 Projected Sources and Uses of Cash
Consistent and reliable free cash flows Enable growth & value creation Supported by a strong balance sheet
Strong balance sheet enables flexibility to
raise and deploy capital for growth
Plan to issue $1.5B of long-term debt at the
utilities to support continued growth
Retiring $700M debt to begin strategy of
de-levering ExGen
Operational excellence and financial
discipline drives free cash flow reliability
Generating $5.0B of free cash flow* before
growth, including $1.5B at ExGen and
$3.4B at the Utilities
Creating value for customers,
communities and shareholders
Investing $6.1B, with $5.3B at the Utilities
and $0.9B at ExGen
(1) All amounts rounded to the nearest $25M.
Figures may not sum due to rounding.
(2) Gross of posted counterparty collateral
(3) Excludes counterparty collateral activity
(4) Figures reflect cash CapEx and CENG fleet at
100%
(5) Other Financing includes expected changes
in short-term debt, money pool borrowings,
tax sharing from the parent, debt issue
costs, CENG borrowing from Sumitomo, tax
equity cash flows, capital leases, proceeds
from ExGen Renewables JV, and CENG tax
distributions to EDF
(6) Financing cash flow excludes intercompany
dividends and other intercompany financing
activities
(7) ExGen Growth CapEx primarily includes
Texas CCGTs, West Medway, AGE, Nuclear
Uprates, and Retail Solar
(8) Dividends are subject to declaration by the
Board of Directors
(9) Includes cash flow activity from Holding
Company, eliminations, and other corporate
entities
($M)(1) BGE ComEd PECO PHI
Total
UtilitiesExGen Corp
(9)Exelon
2017E
Cash
Balance
Beginning Cash Balance*(2) 1,050
Adjusted Cash Flow from Operations*(3) 725 725 725 1,225 3,425 3,525 125 7,075
Base CapEx and Nuclear Fuel(4) 0 0 0 0 0 (2,050) (50) (2,125)
Free Cash Flow* 725 725 725 1,225 3,425 1,475 50 4,950
Debt Issuances 0 1,000 325 200 1,525 750 1,150 3,425
Debt Retirements (50) (425) 0 (150) (625) (700) (1,700) (3,025)
Project Financing n/a n/a n/a n/a n/a 275 n/a 275
Equity Issuance/Share Buyback 0 0 0 0 0 0 1,150 1,150
Contribution from Parent 150 650 0 775 1,575 0 (1,575) 0
Other Financing(5) 275 625 150 (375) 650 350 375 1,375
Financing*(6) 375 1,850 475 450 3,150 675 (625) 3,200
Total Free Cash Flow and Financing 1,125 2,575 1,200 1,650 6,550 2,150 (550) 8,150
Utility Investment (925) (2,200) (775) (1,375) (5,250) 0 0 (5,250)
ExGen Growth(4,7) 0 0 0 0 0 (850) 0 (850)
Acquisitions and Divestitures 0 0 0 0 0 0 0 0
Equity Investments 0 0 0 0 0 (50) 0 (50)
Dividend(8) 0 0 0 0 0 0 (1,225) (1,225)
Other CapEx and Dividend (925) (2,200) (775) (1,375) (5,250) (925) (1,225) (7,425)
Total Cash Flow 200 400 450 275 1,300 1,225 (1,800) 725
Ending Cash Balance*(2) 1,775
19 Q1 2017 Earnings Release Slides
Exelon Generation Disclosures
March 31, 2017
20 Q1 2017 Earnings Release Slides
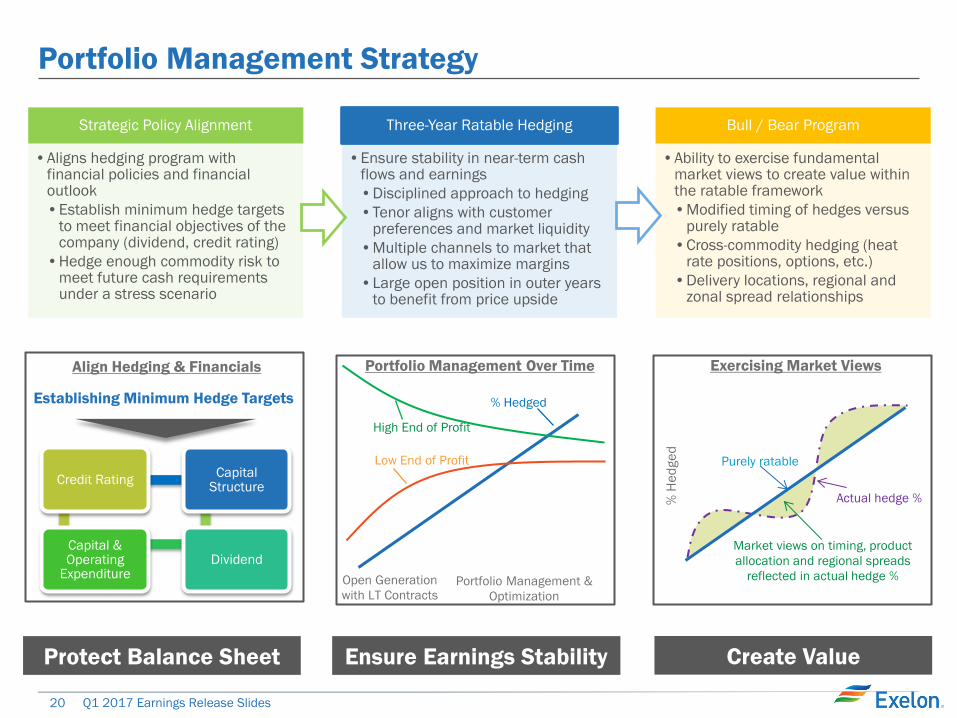
Portfolio Management Strategy
Protect Balance Sheet Ensure Earnings Stability Create Value
Strategic Policy Alignment
•Aligns hedging program with financial policies and financial outlook
•Establish minimum hedge targets to meet financial objectives of the company (dividend, credit rating)
•Hedge enough commodity risk to meet future cash requirements under a stress scenario
Three-Year Ratable Hedging
•Ensure stability in near-term cash flows and earnings
•Disciplined approach to hedging
•Tenor aligns with customer preferences and market liquidity
•Multiple channels to market that allow us to maximize margins
•Large open position in outer years to benefit from price upside
Bull / Bear Program
•Ability to exercise fundamental market views to create value within the ratable framework
•Modified timing of hedges versus purely ratable
•Cross-commodity hedging (heat rate positions, options, etc.)
•Delivery locations, regional and zonal spread relationships
Exercising Market Views
% H
ed
ge
d
Purely ratable
Actual hedge %
Market views on timing, product
allocation and regional spreads
reflected in actual hedge %
High End of Profit
Low End of Profit
% Hedged
Open Generation
with LT Contracts Portfolio Management &
Optimization
Portfolio Management Over Time Align Hedging & Financials
Establishing Minimum Hedge Targets
Credit Rating
Capital & Operating
Expenditure Dividend
Capital Structure
21 Q1 2017 Earnings Release Slides
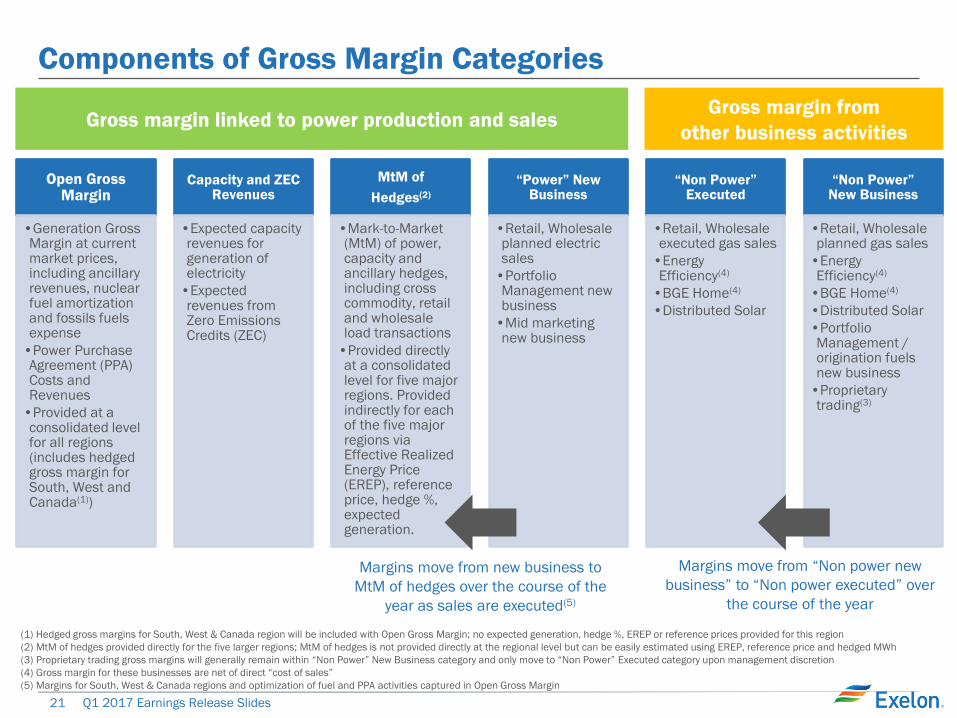
Components of Gross Margin Categories
Open Gross Margin
•Generation Gross Margin at current market prices, including ancillary revenues, nuclear fuel amortization and fossils fuels expense
•Power Purchase Agreement (PPA) Costs and Revenues
•Provided at a consolidated level for all regions (includes hedged gross margin for South, West and Canada(1))
Capacity and ZEC Revenues
•Expected capacity revenues for generation of electricity
•Expected revenues from Zero Emissions Credits (ZEC)
MtM of
Hedges(2)
•Mark-to-Market (MtM) of power, capacity and ancillary hedges, including cross commodity, retail and wholesale load transactions
•Provided directly at a consolidated level for five major regions. Provided indirectly for each of the five major regions via Effective Realized Energy Price (EREP), reference price, hedge %, expected generation.
“Power” New Business
•Retail, Wholesale planned electric sales
•Portfolio Management new business
•Mid marketing new business
“Non Power” Executed
•Retail, Wholesale executed gas sales
•Energy Efficiency(4)
•BGE Home(4)
•Distributed Solar
“Non Power” New Business
•Retail, Wholesale planned gas sales
•Energy Efficiency(4)
•BGE Home(4)
•Distributed Solar
•Portfolio Management / origination fuels new business
•Proprietary trading(3)
Margins move from new business to
MtM of hedges over the course of the
year as sales are executed(5)
Margins move from “Non power new
business” to “Non power executed” over
the course of the year
Gross margin linked to power production and sales Gross margin from
other business activities
(1) Hedged gross margins for South, West & Canada region will be included with Open Gross Margin; no expected generation, hedge %, EREP or reference prices provided for this region
(2) MtM of hedges provided directly for the five larger regions; MtM of hedges is not provided directly at the regional level but can be easily estimated using EREP, reference price and hedged MWh
(3) Proprietary trading gross margins will generally remain within “Non Power” New Business category and only move to “Non Power” Executed category upon management discretion
(4) Gross margin for these businesses are net of direct “cost of sales”
(5) Margins for South, West & Canada regions and optimization of fuel and PPA activities captured in Open Gross Margin
22 Q1 2017 Earnings Release Slides
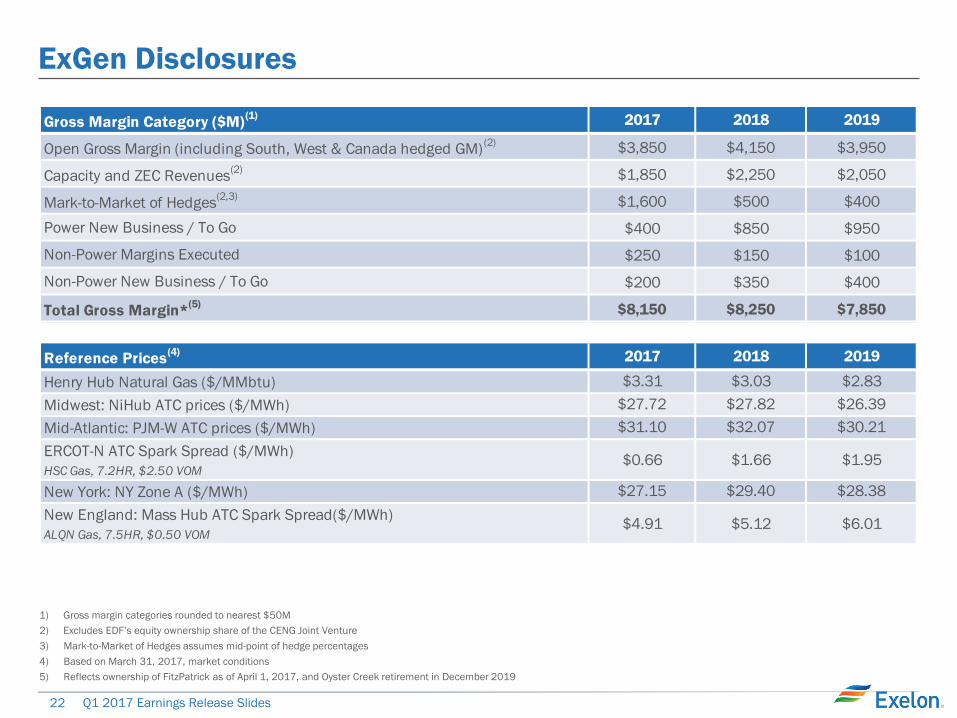
ExGen Disclosures
1) Gross margin categories rounded to nearest $50M
2) Excludes EDF’s equity ownership share of the CENG Joint Venture
3) Mark-to-Market of Hedges assumes mid-point of hedge percentages
4) Based on March 31, 2017, market conditions
5) Reflects ownership of FitzPatrick as of April 1, 2017, and Oyster Creek retirement in December 2019
Gross Margin Category ($M)(1) 2017 2018 2019
Open Gross Margin (including South, West & Canada hedged GM)
(2) $3,850 $4,150 $3,950
Capacity and ZEC Revenues(2) $1,850 $2,250 $2,050
Mark-to-Market of Hedges(2,3) $1,600 $500 $400
Power New Business / To Go $400 $850 $950
Non-Power Margins Executed $250 $150 $100
Non-Power New Business / To Go $200 $350 $400
Total Gross Margin*(5) $8,150 $8,250 $7,850
Reference Prices(4) 2017 2018 2019
Henry Hub Natural Gas ($/MMbtu) $3.31 $3.03 $2.83
Midwest: NiHub ATC prices ($/MWh) $27.72 $27.82 $26.39
Mid-Atlantic: PJM-W ATC prices ($/MWh) $31.10 $32.07 $30.21
ERCOT-N ATC Spark Spread ($/MWh)
HSC Gas, 7.2HR, $2.50 VOM$0.66 $1.66 $1.95
New York: NY Zone A ($/MWh) $27.15 $29.40 $28.38
New England: Mass Hub ATC Spark Spread($/MWh)
ALQN Gas, 7.5HR, $0.50 VOM$4.91 $5.12 $6.01
23 Q1 2017 Earnings Release Slides
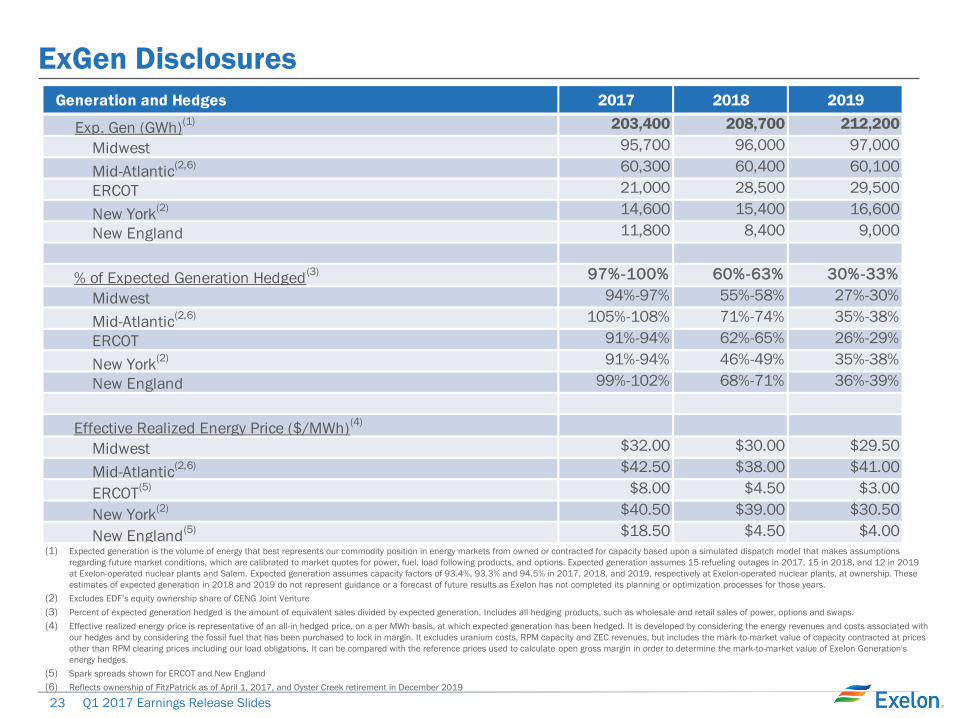
ExGen Disclosures
(1) Expected generation is the volume of energy that best represents our commodity position in energy markets from owned or contracted for capacity based upon a simulated dispatch model that makes assumptions
regarding future market conditions, which are calibrated to market quotes for power, fuel, load following products, and options. Expected generation assumes 15 refueling outages in 2017, 15 in 2018, and 12 in 2019
at Exelon-operated nuclear plants and Salem. Expected generation assumes capacity factors of 93.4%, 93.3% and 94.5% in 2017, 2018, and 2019, respectively at Exelon-operated nuclear plants, at ownership. These
estimates of expected generation in 2018 and 2019 do not represent guidance or a forecast of future results as Exelon has not completed its planning or optimization processes for those years.
(2) Excludes EDF’s equity ownership share of CENG Joint Venture
(3) Percent of expected generation hedged is the amount of equivalent sales divided by expected generation. Includes all hedging products, such as wholesale and retail sales of power, options and swaps.
(4) Effective realized energy price is representative of an all-in hedged price, on a per MWh basis, at which expected generation has been hedged. It is developed by considering the energy revenues and costs associated with
our hedges and by considering the fossil fuel that has been purchased to lock in margin. It excludes uranium costs, RPM capacity and ZEC revenues, but includes the mark-to-market value of capacity contracted at prices
other than RPM clearing prices including our load obligations. It can be compared with the reference prices used to calculate open gross margin in order to determine the mark-to-market value of Exelon Generation's
energy hedges.
(5) Spark spreads shown for ERCOT and New England
(6) Reflects ownership of FitzPatrick as of April 1, 2017, and Oyster Creek retirement in December 2019
Generation and Hedges 2017 2018 2019
Exp. Gen (GWh)(1) 203,400 208,700 212,200
Midwest 95,700 96,000 97,000
Mid-Atlantic(2,6) 60,300 60,400 60,100
ERCOT 21,000 28,500 29,500
New York(2) 14,600 15,400 16,600
New England 11,800 8,400 9,000
% of Expected Generation Hedged(3) 97%-100% 60%-63% 30%-33%
Midwest 94%-97% 55%-58% 27%-30%
Mid-Atlantic(2,6) 105%-108% 71%-74% 35%-38%
ERCOT 91%-94% 62%-65% 26%-29%
New York(2) 91%-94% 46%-49% 35%-38%
New England 99%-102% 68%-71% 36%-39%
Effective Realized Energy Price ($/MWh)(4)
Midwest $32.00 $30.00 $29.50
Mid-Atlantic(2,6) $42.50 $38.00 $41.00
ERCOT(5) $8.00 $4.50 $3.00
New York(2) $40.50 $39.00 $30.50
New England(5) $18.50 $4.50 $4.00
24 Q1 2017 Earnings Release Slides
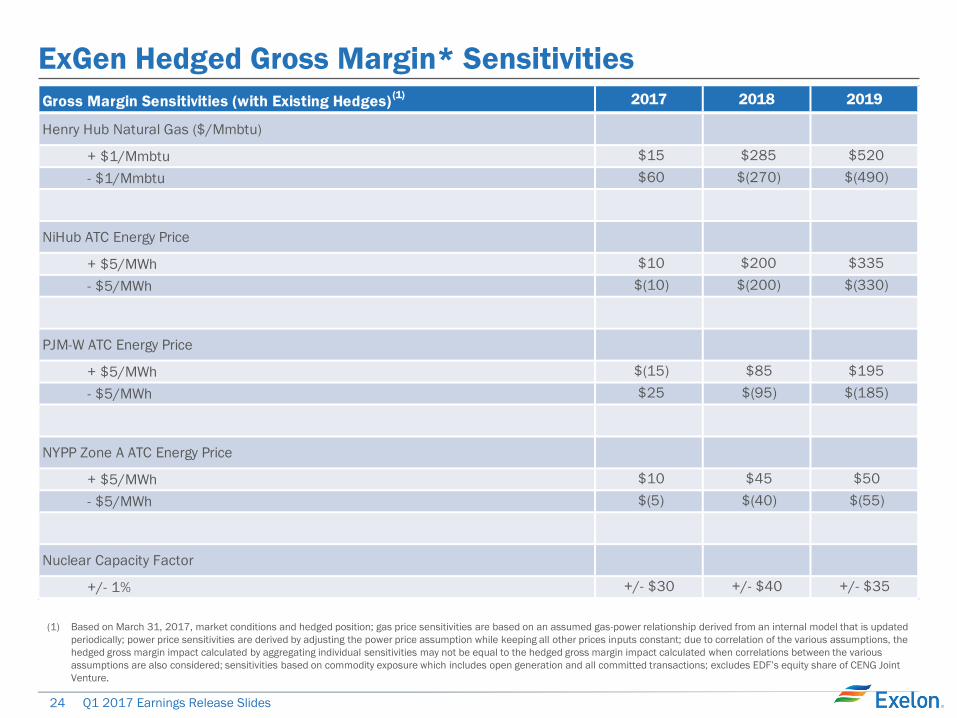
ExGen Hedged Gross Margin* Sensitivities
(1) Based on March 31, 2017, market conditions and hedged position; gas price sensitivities are based on an assumed gas-power relationship derived from an internal model that is updated
periodically; power price sensitivities are derived by adjusting the power price assumption while keeping all other prices inputs constant; due to correlation of the various assumptions, the
hedged gross margin impact calculated by aggregating individual sensitivities may not be equal to the hedged gross margin impact calculated when correlations between the various
assumptions are also considered; sensitivities based on commodity exposure which includes open generation and all committed transactions; excludes EDF’s equity share of CENG Joint
Venture.
Gross Margin Sensitivities (with Existing Hedges)(1) 2017 2018 2019
Henry Hub Natural Gas ($/Mmbtu)
+ $1/Mmbtu $15 $285 $520
- $1/Mmbtu $60 $(270) $(490)
NiHub ATC Energy Price
+ $5/MWh $10 $200 $335
- $5/MWh $(10) $(200) $(330)
PJM-W ATC Energy Price
+ $5/MWh $(15) $85 $195
- $5/MWh $25 $(95) $(185)
NYPP Zone A ATC Energy Price
+ $5/MWh $10 $45 $50
- $5/MWh $(5) $(40) $(55)
Nuclear Capacity Factor
+/- 1% +/- $30 +/- $40 +/- $35
25 Q1 2017 Earnings Release Slides
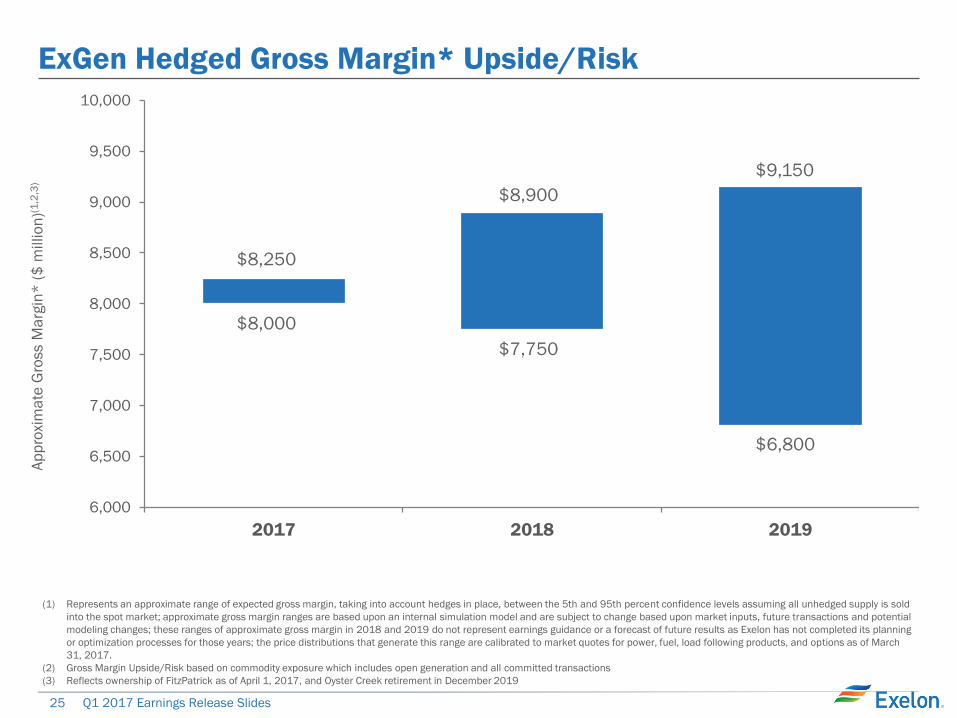
ExGen Hedged Gross Margin* Upside/Risk
6,000
6,500
7,000
7,500
8,000
8,500
9,000
9,500
10,000
2017 2018 2019
Ap
pro
xim
ate
Gro
ss M
arg
in*
($
millio
n)(1
,2,3
)
$8,250
$8,000
$8,900
$7,750
(1) Represents an approximate range of expected gross margin, taking into account hedges in place, between the 5th and 95th percent confidence levels assuming all unhedged supply is sold
into the spot market; approximate gross margin ranges are based upon an internal simulation model and are subject to change based upon market inputs, future transactions and potential
modeling changes; these ranges of approximate gross margin in 2018 and 2019 do not represent earnings guidance or a forecast of future results as Exelon has not completed its planning
or optimization processes for those years; the price distributions that generate this range are calibrated to market quotes for power, fuel, load following products, and options as of March
31, 2017.
(2) Gross Margin Upside/Risk based on commodity exposure which includes open generation and all committed transactions
(3) Reflects ownership of FitzPatrick as of April 1, 2017, and Oyster Creek retirement in December 2019
$6,800
$9,150
26 Q1 2017 Earnings Release Slides
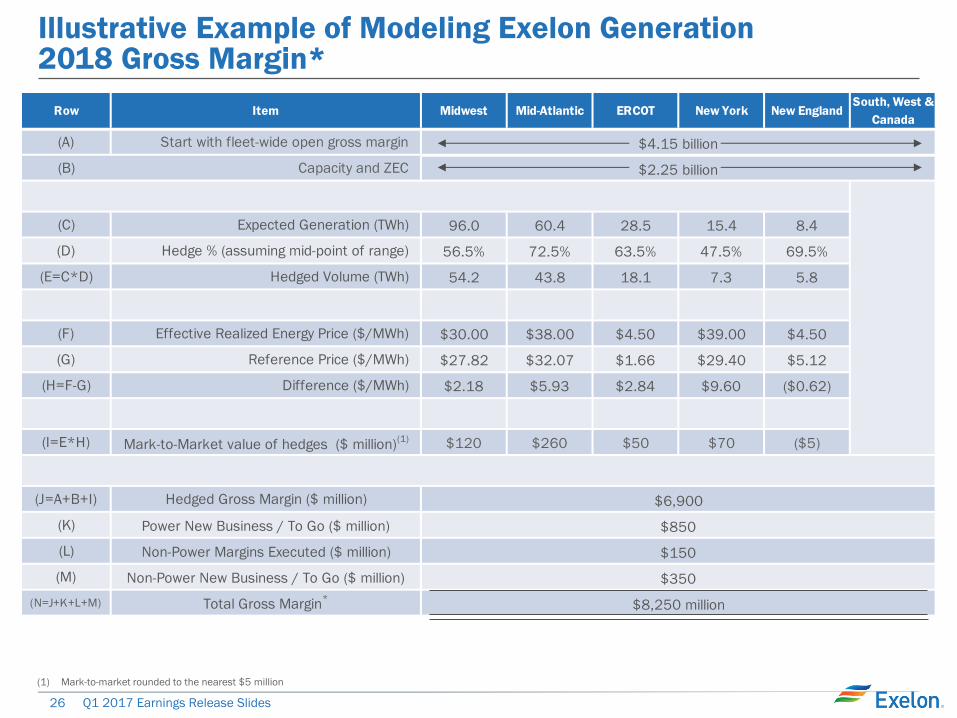
Row Item Midwest Mid-Atlantic ERCOT New York New EnglandSouth, West &
Canada
(A) Start with fleet-wide open gross margin
(B) Capacity and ZEC
(C) Expected Generation (TWh) 96.0 60.4 28.5 15.4 8.4
(D) Hedge % (assuming mid-point of range) 56.5% 72.5% 63.5% 47.5% 69.5%
(E=C*D) Hedged Volume (TWh) 54.2 43.8 18.1 7.3 5.8
(F) Effective Realized Energy Price ($/MWh) $30.00 $38.00 $4.50 $39.00 $4.50
(G) Reference Price ($/MWh) $27.82 $32.07 $1.66 $29.40 $5.12
(H=F-G) Difference ($/MWh) $2.18 $5.93 $2.84 $9.60 ($0.62)
(I=E*H) Mark-to-Market value of hedges ($ million)(1) $120 $260 $50 $70 ($5)
(J=A+B+I) Hedged Gross Margin ($ million)
(K) Power New Business / To Go ($ million)
(L) Non-Power Margins Executed ($ million)
(M) Non-Power New Business / To Go ($ million)
(N=J+K+L+M) Total Gross Margin*
$150
$350
$8,250 million
$4.15 billion
$6,900
$850
$2.25 billion
Illustrative Example of Modeling Exelon Generation 2018 Gross Margin*
(1) Mark-to-market rounded to the nearest $5 million
27 Q1 2017 Earnings Release Slides
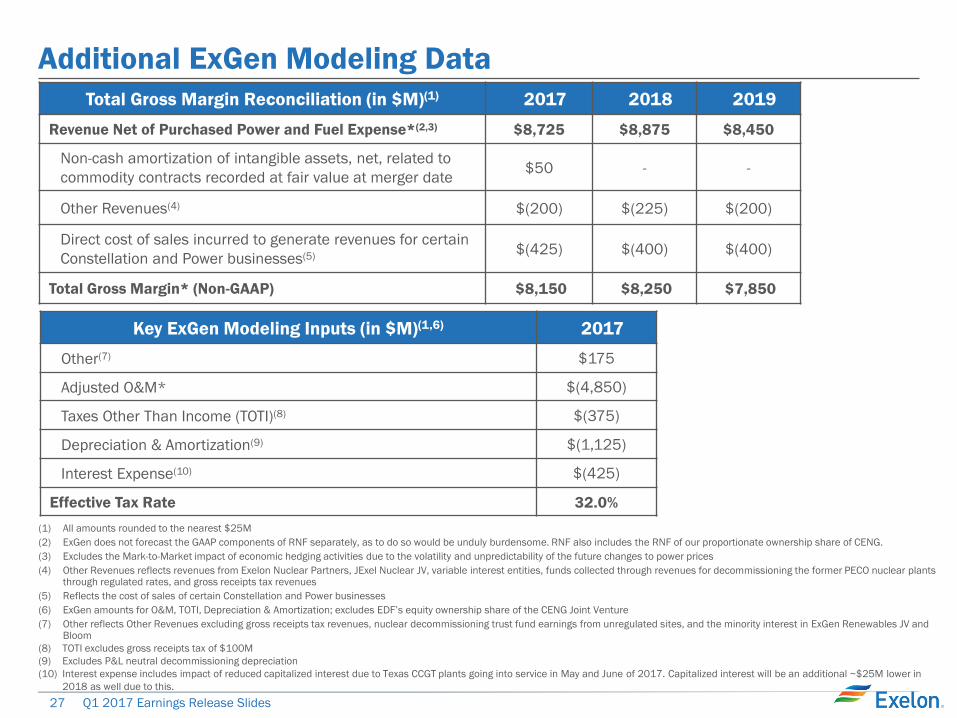
Additional ExGen Modeling Data
Total Gross Margin Reconciliation (in $M)(1) 2017 2018 2019
Revenue Net of Purchased Power and Fuel Expense*(2,3) $8,725 $8,875 $8,450
Non-cash amortization of intangible assets, net, related to
commodity contracts recorded at fair value at merger date $50 - -
Other Revenues(4) $(200) $(225) $(200)
Direct cost of sales incurred to generate revenues for certain
Constellation and Power businesses(5) $(425) $(400) $(400)
Total Gross Margin* (Non-GAAP) $8,150 $8,250 $7,850
(1) All amounts rounded to the nearest $25M
(2) ExGen does not forecast the GAAP components of RNF separately, as to do so would be unduly burdensome. RNF also includes the RNF of our proportionate ownership share of CENG.
(3) Excludes the Mark-to-Market impact of economic hedging activities due to the volatility and unpredictability of the future changes to power prices
(4) Other Revenues reflects revenues from Exelon Nuclear Partners, JExel Nuclear JV, variable interest entities, funds collected through revenues for decommissioning the former PECO nuclear plants through regulated rates, and gross receipts tax revenues
(5) Reflects the cost of sales of certain Constellation and Power businesses
(6) ExGen amounts for O&M, TOTI, Depreciation & Amortization; excludes EDF’s equity ownership share of the CENG Joint Venture
(7) Other reflects Other Revenues excluding gross receipts tax revenues, nuclear decommissioning trust fund earnings from unregulated sites, and the minority interest in ExGen Renewables JV and Bloom
(8) TOTI excludes gross receipts tax of $100M
(9) Excludes P&L neutral decommissioning depreciation
(10) Interest expense includes impact of reduced capitalized interest due to Texas CCGT plants going into service in May and June of 2017. Capitalized interest will be an additional ~$25M lower in
2018 as well due to this.
Key ExGen Modeling Inputs (in $M)(1,6) 2017
Other(7) $175
Adjusted O&M* $(4,850)
Taxes Other Than Income (TOTI)(8) $(375)
Depreciation & Amortization(9) $(1,125)
Interest Expense(10) $(425)
Effective Tax Rate 32.0%
28 Q1 2017 Earnings Release Slides
Exelon Utilities Rate Case Filing
Summaries
29 Q1 2017 Earnings Release Slides
3/17
4/17
5/17 6/17
Pepco Electric
Distribution
Rates - DC
Delmarva
Electric
Distribution
Rates - DE
Pepco Electric
Distribution
Rates - MD
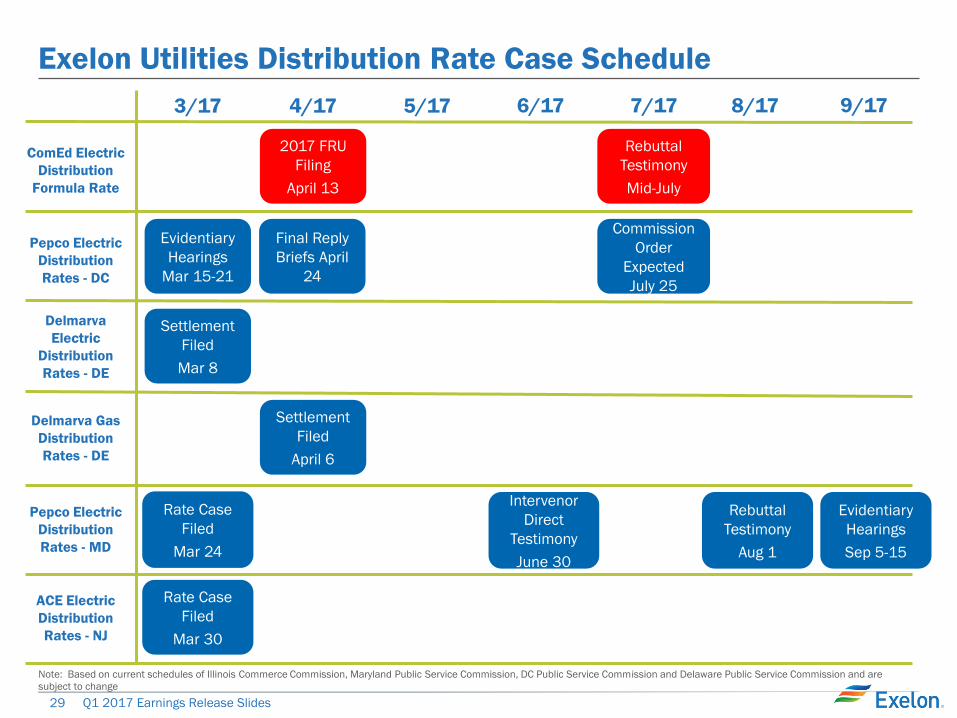
Exelon Utilities Distribution Rate Case Schedule
7/17 8/17
Note: Based on current schedules of Illinois Commerce Commission, Maryland Public Service Commission, DC Public Service Commission and Delaware Public Service Commission and are
subject to change
Delmarva Gas
Distribution
Rates - DE
Settlement
Filed
Mar 8
Settlement
Filed
April 6
Rate Case
Filed
Mar 24
Evidentiary
Hearings
Mar 15-21
Final Reply
Briefs April
24
9/17
Commission
Order
Expected
July 25
ACE Electric
Distribution
Rates - NJ
Rate Case
Filed
Mar 30
ComEd Electric
Distribution
Formula Rate
2017 FRU
Filing
April 13
Rebuttal
Testimony
Mid-July
Intervenor
Direct
Testimony
June 30
Rebuttal
Testimony
Aug 1
Evidentiary
Hearings
Sep 5-15
30 Q1 2017 Earnings Release Slides
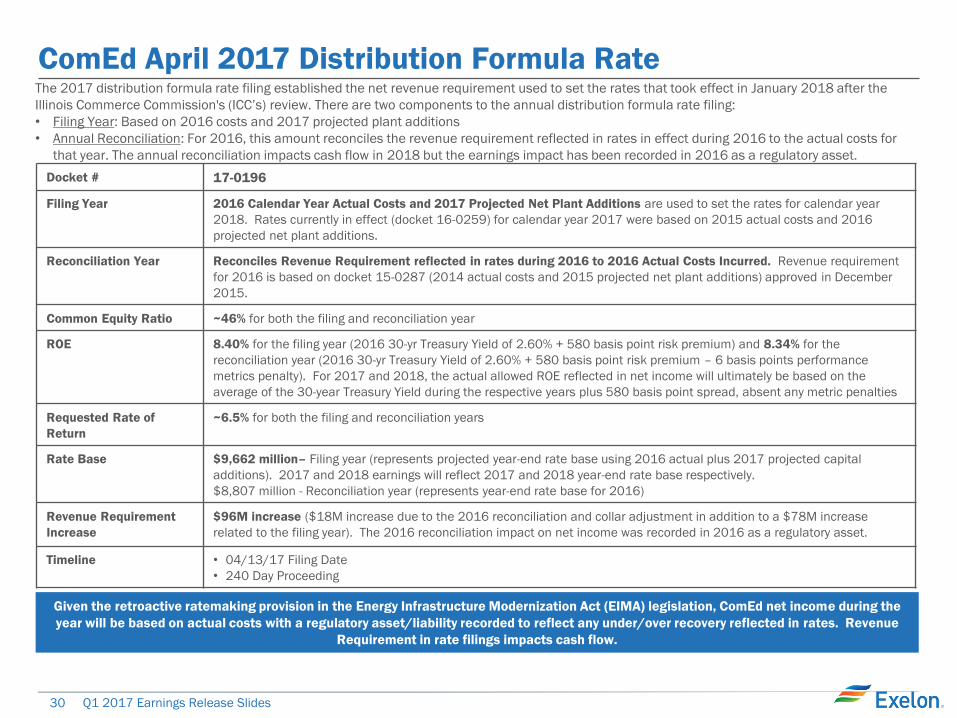
ComEd April 2017 Distribution Formula Rate
Docket # 17-0196
Filing Year 2016 Calendar Year Actual Costs and 2017 Projected Net Plant Additions are used to set the rates for calendar year
2018. Rates currently in effect (docket 16-0259) for calendar year 2017 were based on 2015 actual costs and 2016
projected net plant additions.
Reconciliation Year Reconciles Revenue Requirement reflected in rates during 2016 to 2016 Actual Costs Incurred. Revenue requirement
for 2016 is based on docket 15-0287 (2014 actual costs and 2015 projected net plant additions) approved in December
2015.
Common Equity Ratio ~46% for both the filing and reconciliation year
ROE 8.40% for the filing year (2016 30-yr Treasury Yield of 2.60% + 580 basis point risk premium) and 8.34% for the
reconciliation year (2016 30-yr Treasury Yield of 2.60% + 580 basis point risk premium – 6 basis points performance
metrics penalty). For 2017 and 2018, the actual allowed ROE reflected in net income will ultimately be based on the
average of the 30-year Treasury Yield during the respective years plus 580 basis point spread, absent any metric penalties
Requested Rate of
Return
~6.5% for both the filing and reconciliation years
Rate Base
$9,662 million– Filing year (represents projected year-end rate base using 2016 actual plus 2017 projected capital
additions). 2017 and 2018 earnings will reflect 2017 and 2018 year-end rate base respectively.
$8,807 million - Reconciliation year (represents year-end rate base for 2016)
Revenue Requirement
Increase
$96M increase ($18M increase due to the 2016 reconciliation and collar adjustment in addition to a $78M increase
related to the filing year). The 2016 reconciliation impact on net income was recorded in 2016 as a regulatory asset.
Timeline • 04/13/17 Filing Date
• 240 Day Proceeding
The 2017 distribution formula rate filing established the net revenue requirement used to set the rates that took effect in January 2018 after the
Illinois Commerce Commission's (ICC’s) review. There are two components to the annual distribution formula rate filing:
• Filing Year: Based on 2016 costs and 2017 projected plant additions
• Annual Reconciliation: For 2016, this amount reconciles the revenue requirement reflected in rates in effect during 2016 to the actual costs for
that year. The annual reconciliation impacts cash flow in 2018 but the earnings impact has been recorded in 2016 as a regulatory asset.
Given the retroactive ratemaking provision in the Energy Infrastructure Modernization Act (EIMA) legislation, ComEd net income during the
year will be based on actual costs with a regulatory asset/liability recorded to reflect any under/over recovery reflected in rates. Revenue
Requirement in rate filings impacts cash flow.
31 Q1 2017 Earnings Release Slides
Atlantic City Electric NJ Rate Case Filing
31
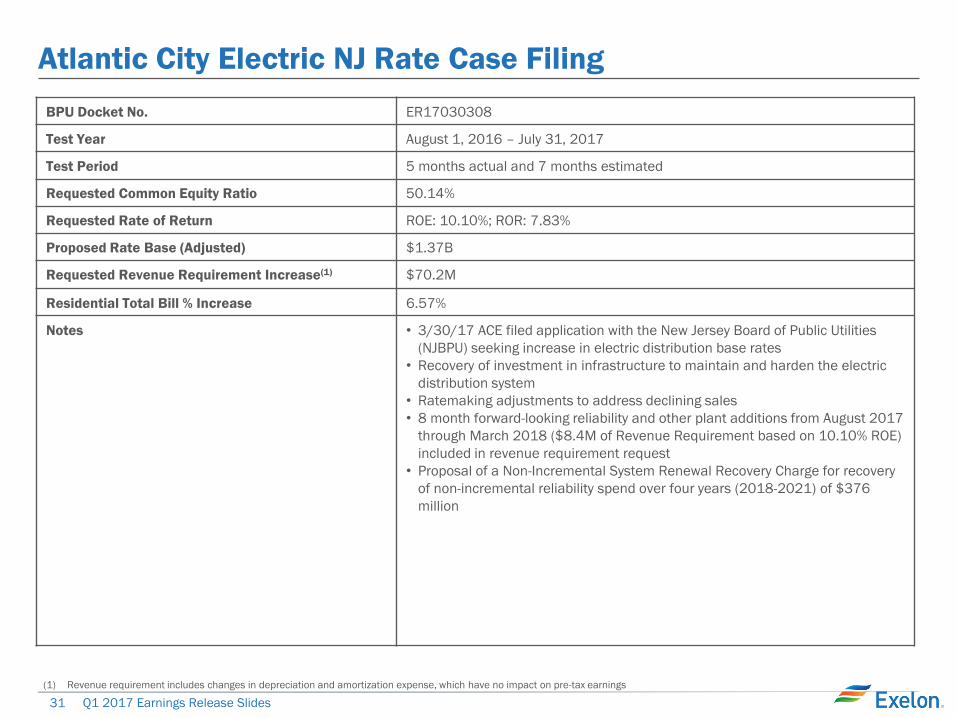
BPU Docket No. ER17030308
Test Year August 1, 2016 – July 31, 2017
Test Period 5 months actual and 7 months estimated
Requested Common Equity Ratio 50.14%
Requested Rate of Return ROE: 10.10%; ROR: 7.83%
Proposed Rate Base (Adjusted) $1.37B
Requested Revenue Requirement Increase(1) $70.2M
Residential Total Bill % Increase 6.57%
Notes • 3/30/17 ACE filed application with the New Jersey Board of Public Utilities
(NJBPU) seeking increase in electric distribution base rates
• Recovery of investment in infrastructure to maintain and harden the electric
distribution system
• Ratemaking adjustments to address declining sales
• 8 month forward-looking reliability and other plant additions from August 2017
through March 2018 ($8.4M of Revenue Requirement based on 10.10% ROE)
included in revenue requirement request
• Proposal of a Non-Incremental System Renewal Recovery Charge for recovery
of non-incremental reliability spend over four years (2018-2021) of $376
million
(1) Revenue requirement includes changes in depreciation and amortization expense, which have no impact on pre-tax earnings
32 Q1 2017 Earnings Release Slides
Pepco MD Rate Case Filing
32
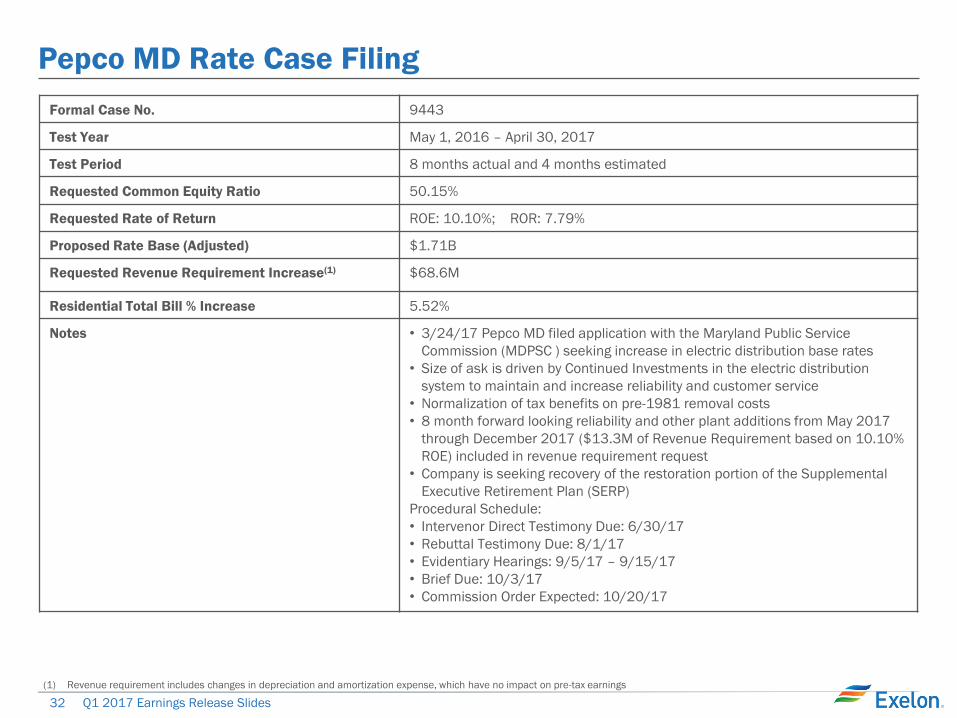
Formal Case No. 9443
Test Year May 1, 2016 – April 30, 2017
Test Period 8 months actual and 4 months estimated
Requested Common Equity Ratio 50.15%
Requested Rate of Return ROE: 10.10%; ROR: 7.79%
Proposed Rate Base (Adjusted) $1.71B
Requested Revenue Requirement Increase(1) $68.6M
Residential Total Bill % Increase 5.52%
Notes • 3/24/17 Pepco MD filed application with the Maryland Public Service
Commission (MDPSC ) seeking increase in electric distribution base rates
• Size of ask is driven by Continued Investments in the electric distribution
system to maintain and increase reliability and customer service
• Normalization of tax benefits on pre-1981 removal costs
• 8 month forward looking reliability and other plant additions from May 2017
through December 2017 ($13.3M of Revenue Requirement based on 10.10%
ROE) included in revenue requirement request
• Company is seeking recovery of the restoration portion of the Supplemental
Executive Retirement Plan (SERP)
Procedural Schedule:
• Intervenor Direct Testimony Due: 6/30/17
• Rebuttal Testimony Due: 8/1/17
• Evidentiary Hearings: 9/5/17 – 9/15/17
• Brief Due: 10/3/17
• Commission Order Expected: 10/20/17
(1) Revenue requirement includes changes in depreciation and amortization expense, which have no impact on pre-tax earnings
33 Q1 2017 Earnings Release Slides
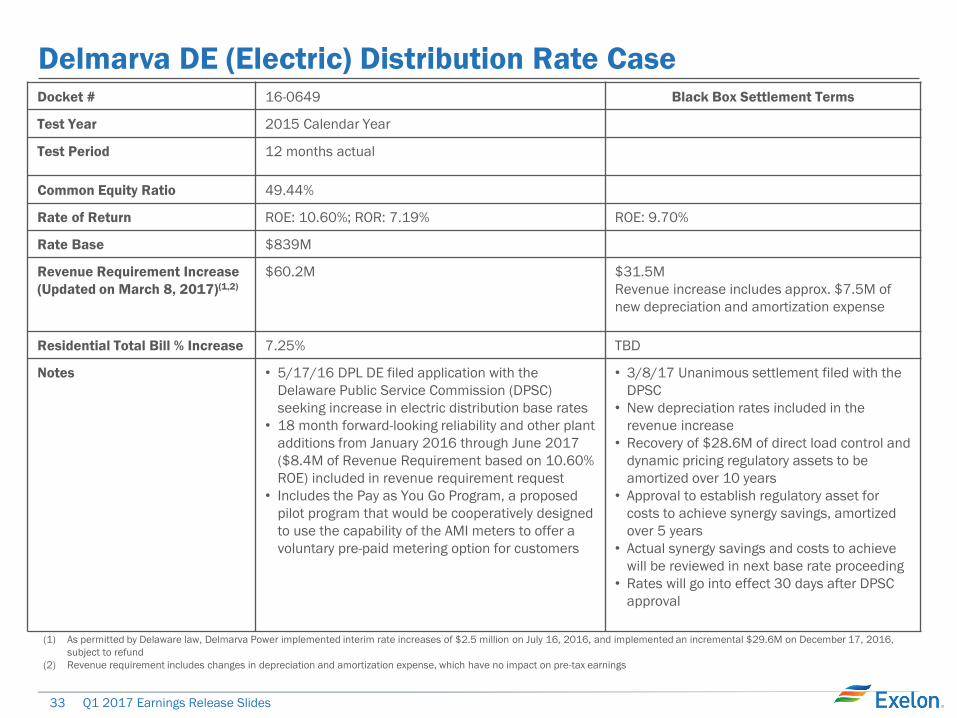
Delmarva DE (Electric) Distribution Rate Case
(1) As permitted by Delaware law, Delmarva Power implemented interim rate increases of $2.5 million on July 16, 2016, and implemented an incremental $29.6M on December 17, 2016,
subject to refund
(2) Revenue requirement includes changes in depreciation and amortization expense, which have no impact on pre-tax earnings
Docket # 16-0649 Black Box Settlement Terms
Test Year 2015 Calendar Year
Test Period
12 months actual
Common Equity Ratio 49.44%
Rate of Return ROE: 10.60%; ROR: 7.19% ROE: 9.70%
Rate Base $839M
Revenue Requirement Increase
(Updated on March 8, 2017)(1,2)
$60.2M $31.5M
Revenue increase includes approx. $7.5M of
new depreciation and amortization expense
Residential Total Bill % Increase 7.25% TBD
Notes • 5/17/16 DPL DE filed application with the
Delaware Public Service Commission (DPSC)
seeking increase in electric distribution base rates
• 18 month forward-looking reliability and other plant
additions from January 2016 through June 2017
($8.4M of Revenue Requirement based on 10.60%
ROE) included in revenue requirement request
• Includes the Pay as You Go Program, a proposed
pilot program that would be cooperatively designed
to use the capability of the AMI meters to offer a
voluntary pre-paid metering option for customers
• 3/8/17 Unanimous settlement filed with the
DPSC
• New depreciation rates included in the
revenue increase
• Recovery of $28.6M of direct load control and
dynamic pricing regulatory assets to be
amortized over 10 years
• Approval to establish regulatory asset for
costs to achieve synergy savings, amortized
over 5 years
• Actual synergy savings and costs to achieve
will be reviewed in next base rate proceeding
• Rates will go into effect 30 days after DPSC
approval
34 Q1 2017 Earnings Release Slides
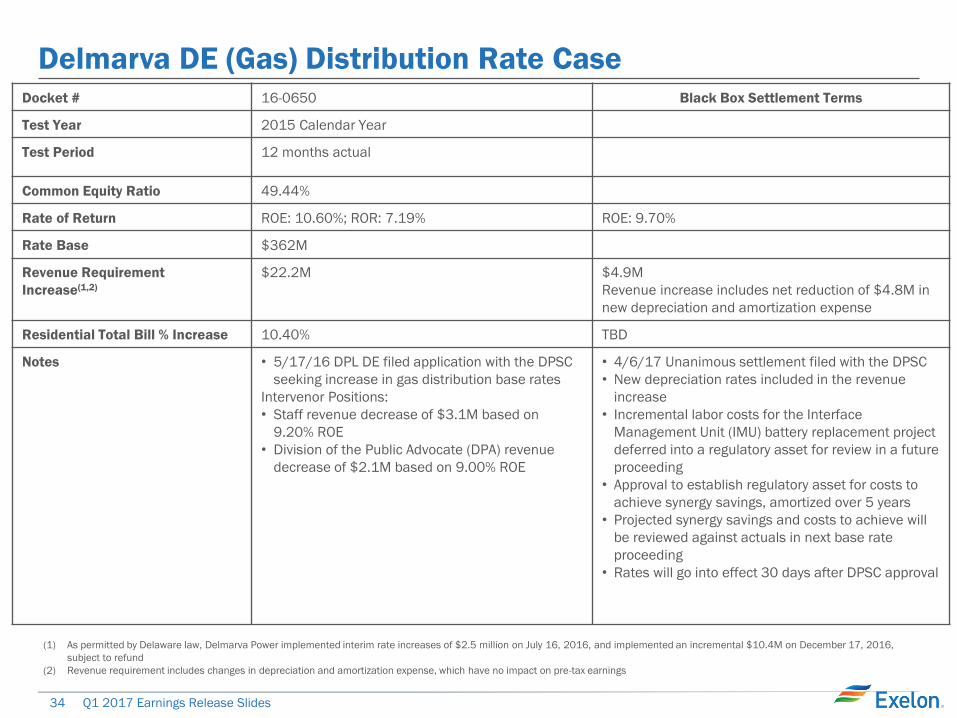
Delmarva DE (Gas) Distribution Rate Case
(1) As permitted by Delaware law, Delmarva Power implemented interim rate increases of $2.5 million on July 16, 2016, and implemented an incremental $10.4M on December 17, 2016,
subject to refund
(2) Revenue requirement includes changes in depreciation and amortization expense, which have no impact on pre-tax earnings
Docket # 16-0650 Black Box Settlement Terms
Test Year 2015 Calendar Year
Test Period
12 months actual
Common Equity Ratio 49.44%
Rate of Return ROE: 10.60%; ROR: 7.19% ROE: 9.70%
Rate Base $362M
Revenue Requirement
Increase(1,2)
$22.2M $4.9M
Revenue increase includes net reduction of $4.8M in
new depreciation and amortization expense
Residential Total Bill % Increase 10.40% TBD
Notes • 5/17/16 DPL DE filed application with the DPSC
seeking increase in gas distribution base rates
Intervenor Positions:
• Staff revenue decrease of $3.1M based on
9.20% ROE
• Division of the Public Advocate (DPA) revenue
decrease of $2.1M based on 9.00% ROE
• 4/6/17 Unanimous settlement filed with the DPSC
• New depreciation rates included in the revenue
increase
• Incremental labor costs for the Interface
Management Unit (IMU) battery replacement project
deferred into a regulatory asset for review in a future
proceeding
• Approval to establish regulatory asset for costs to
achieve synergy savings, amortized over 5 years
• Projected synergy savings and costs to achieve will
be reviewed against actuals in next base rate
proceeding
• Rates will go into effect 30 days after DPSC approval
35 Q1 2017 Earnings Release Slides
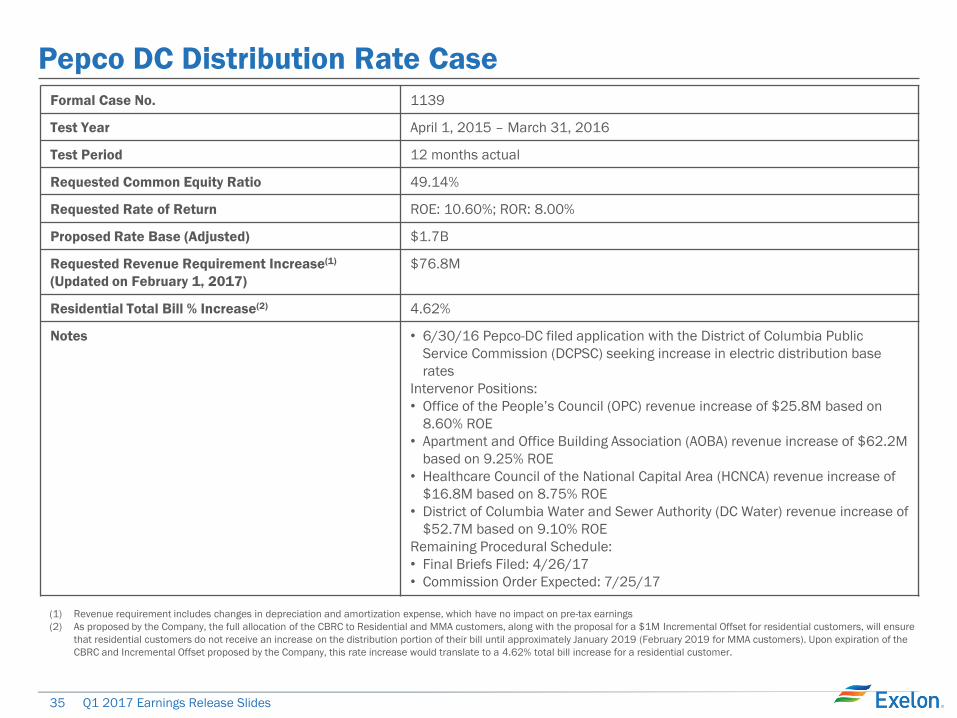
Pepco DC Distribution Rate Case
(1) Revenue requirement includes changes in depreciation and amortization expense, which have no impact on pre-tax earnings
(2) As proposed by the Company, the full allocation of the CBRC to Residential and MMA customers, along with the proposal for a $1M Incremental Offset for residential customers, will ensure
that residential customers do not receive an increase on the distribution portion of their bill until approximately January 2019 (February 2019 for MMA customers). Upon expiration of the
CBRC and Incremental Offset proposed by the Company, this rate increase would translate to a 4.62% total bill increase for a residential customer.
Formal Case No. 1139
Test Year April 1, 2015 – March 31, 2016
Test Period 12 months actual
Requested Common Equity Ratio 49.14%
Requested Rate of Return ROE: 10.60%; ROR: 8.00%
Proposed Rate Base (Adjusted) $1.7B
Requested Revenue Requirement Increase(1)
(Updated on February 1, 2017)
$76.8M
Residential Total Bill % Increase(2) 4.62%
Notes • 6/30/16 Pepco-DC filed application with the District of Columbia Public
Service Commission (DCPSC) seeking increase in electric distribution base
rates
Intervenor Positions:
• Office of the People’s Council (OPC) revenue increase of $25.8M based on
8.60% ROE
• Apartment and Office Building Association (AOBA) revenue increase of $62.2M
based on 9.25% ROE
• Healthcare Council of the National Capital Area (HCNCA) revenue increase of
$16.8M based on 8.75% ROE
• District of Columbia Water and Sewer Authority (DC Water) revenue increase of
$52.7M based on 9.10% ROE
Remaining Procedural Schedule:
• Final Briefs Filed: 4/26/17
• Commission Order Expected: 7/25/17
36 Q1 2017 Earnings Release Slides
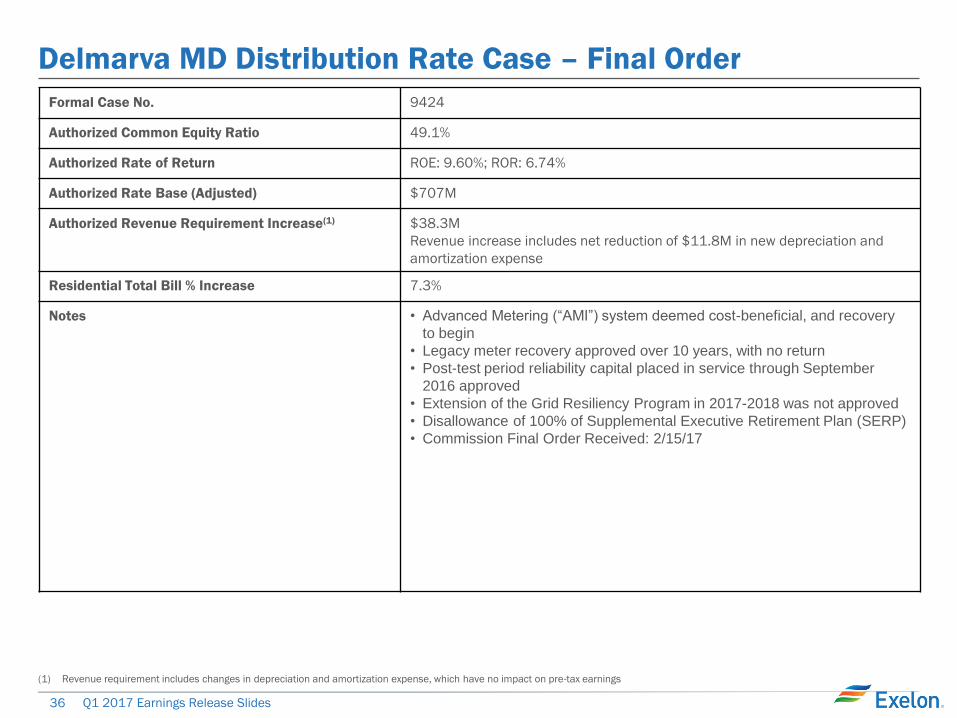
Delmarva MD Distribution Rate Case – Final Order
Formal Case No. 9424
Authorized Common Equity Ratio 49.1%
Authorized Rate of Return ROE: 9.60%; ROR: 6.74%
Authorized Rate Base (Adjusted) $707M
Authorized Revenue Requirement Increase(1) $38.3M
Revenue increase includes net reduction of $11.8M in new depreciation and
amortization expense
Residential Total Bill % Increase 7.3%
Notes • Advanced Metering (“AMI”) system deemed cost-beneficial, and recovery
to begin
• Legacy meter recovery approved over 10 years, with no return
• Post-test period reliability capital placed in service through September
2016 approved
• Extension of the Grid Resiliency Program in 2017-2018 was not approved
• Disallowance of 100% of Supplemental Executive Retirement Plan (SERP)
• Commission Final Order Received: 2/15/17
(1) Revenue requirement includes changes in depreciation and amortization expense, which have no impact on pre-tax earnings
37 Q1 2017 Earnings Release Slides
Appendix
Reconciliation of Non-GAAP
Measures
38 Q1 2017 Earnings Release Slides
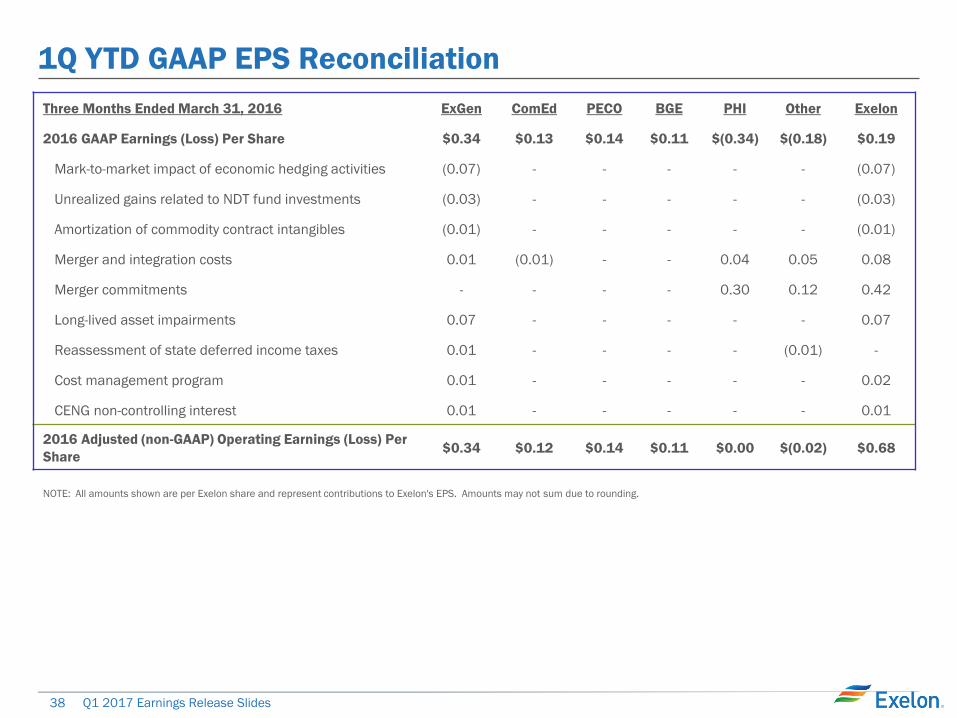
1Q YTD GAAP EPS Reconciliation
Three Months Ended March 31, 2016 ExGen ComEd PECO BGE PHI Other Exelon
2016 GAAP Earnings (Loss) Per Share $0.34 $0.13 $0.14 $0.11 $(0.34) $(0.18) $0.19
Mark-to-market impact of economic hedging activities (0.07) - - - - - (0.07)
Unrealized gains related to NDT fund investments (0.03) - - - - - (0.03)
Amortization of commodity contract intangibles (0.01) - - - - - (0.01)
Merger and integration costs 0.01 (0.01) - - 0.04 0.05 0.08
Merger commitments - - - - 0.30 0.12 0.42
Long-lived asset impairments 0.07 - - - - - 0.07
Reassessment of state deferred income taxes 0.01 - - - - (0.01) -
Cost management program 0.01 - - - - - 0.02
CENG non-controlling interest 0.01 - - - - - 0.01
2016 Adjusted (non-GAAP) Operating Earnings (Loss) Per
Share $0.34 $0.12 $0.14 $0.11 $0.00 $(0.02) $0.68
NOTE: All amounts shown are per Exelon share and represent contributions to Exelon's EPS. Amounts may not sum due to rounding.
39 Q1 2017 Earnings Release Slides
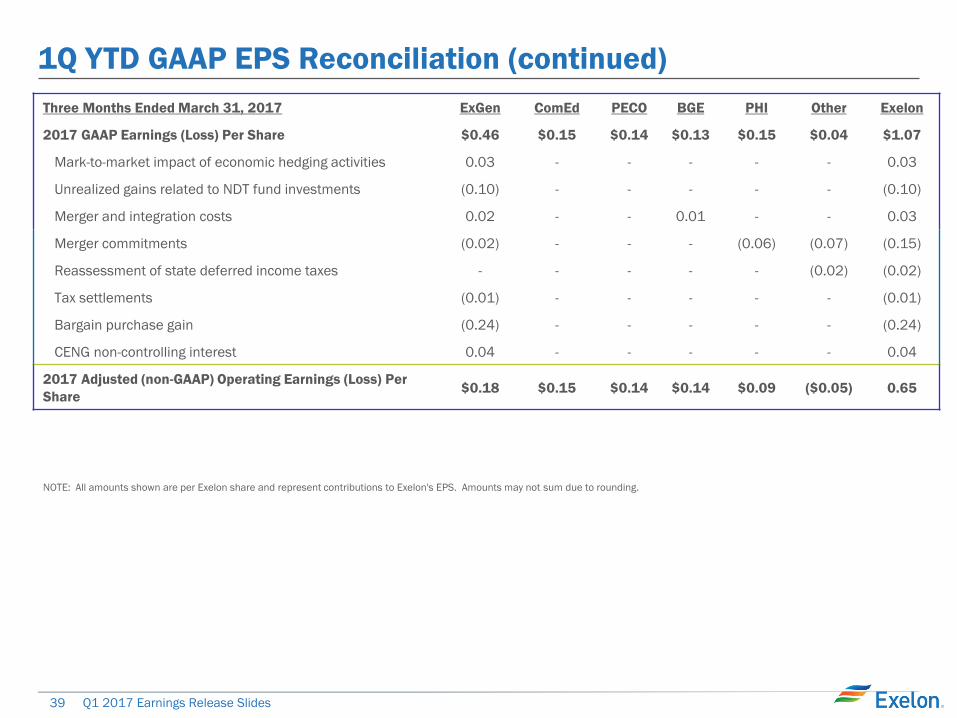
1Q YTD GAAP EPS Reconciliation (continued)
Three Months Ended March 31, 2017 ExGen ComEd PECO BGE PHI Other Exelon
2017 GAAP Earnings (Loss) Per Share $0.46 $0.15 $0.14 $0.13 $0.15 $0.04 $1.07
Mark-to-market impact of economic hedging activities 0.03 - - - - - 0.03
Unrealized gains related to NDT fund investments (0.10) - - - - - (0.10)
Merger and integration costs 0.02 - - 0.01 - - 0.03
Merger commitments (0.02) - - - (0.06) (0.07) (0.15)
Reassessment of state deferred income taxes - - - - - (0.02) (0.02)
Tax settlements (0.01) - - - - - (0.01)
Bargain purchase gain (0.24) - - - - - (0.24)
CENG non-controlling interest 0.04 - - - - - 0.04
2017 Adjusted (non-GAAP) Operating Earnings (Loss) Per
Share $0.18 $0.15 $0.14 $0.14 $0.09 ($0.05) 0.65
NOTE: All amounts shown are per Exelon share and represent contributions to Exelon's EPS. Amounts may not sum due to rounding.
40 2015 1Q Earnings Release Slides
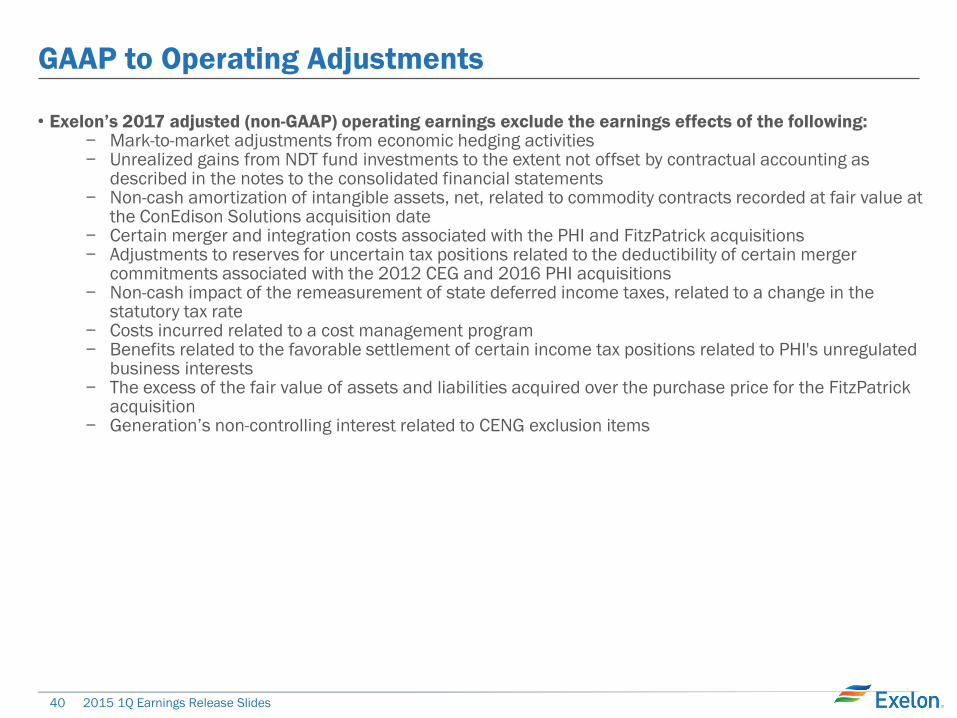
GAAP to Operating Adjustments
• Exelon’s 2017 adjusted (non-GAAP) operating earnings exclude the earnings effects of the following: − Mark-to-market adjustments from economic hedging activities − Unrealized gains from NDT fund investments to the extent not offset by contractual accounting as
described in the notes to the consolidated financial statements − Non-cash amortization of intangible assets, net, related to commodity contracts recorded at fair value at
the ConEdison Solutions acquisition date − Certain merger and integration costs associated with the PHI and FitzPatrick acquisitions − Adjustments to reserves for uncertain tax positions related to the deductibility of certain merger
commitments associated with the 2012 CEG and 2016 PHI acquisitions − Non-cash impact of the remeasurement of state deferred income taxes, related to a change in the
statutory tax rate − Costs incurred related to a cost management program − Benefits related to the favorable settlement of certain income tax positions related to PHI's unregulated
business interests − The excess of the fair value of assets and liabilities acquired over the purchase price for the FitzPatrick
acquisition − Generation’s non-controlling interest related to CENG exclusion items
41 Q1 2017 Earnings Release Slides
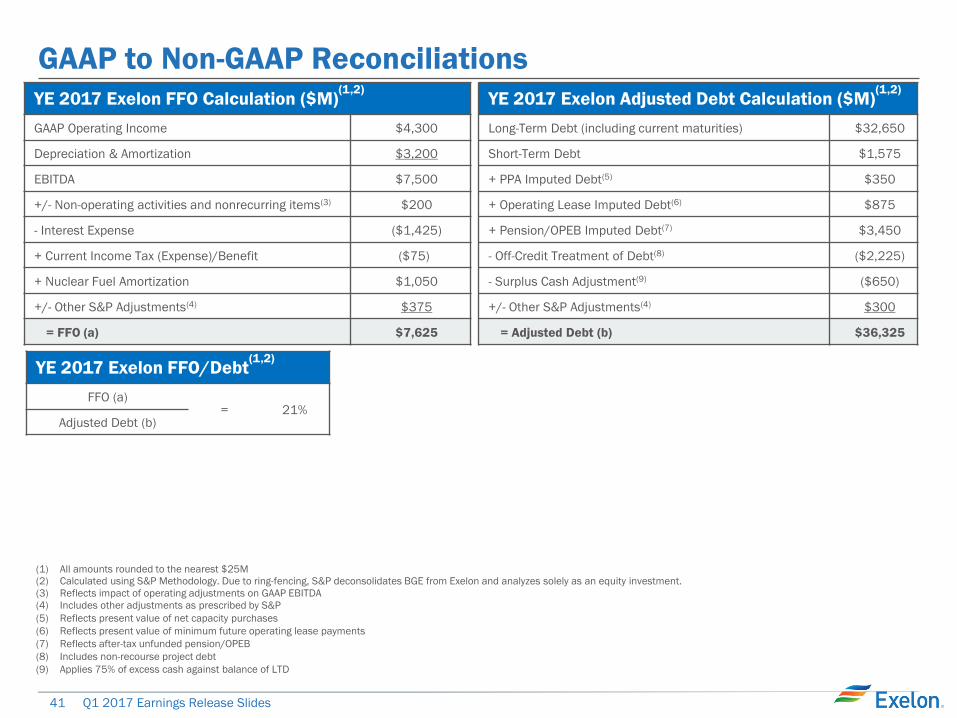
(1) All amounts rounded to the nearest $25M
(2) Calculated using S&P Methodology. Due to ring-fencing, S&P deconsolidates BGE from Exelon and analyzes solely as an equity investment.
(3) Reflects impact of operating adjustments on GAAP EBITDA
(4) Includes other adjustments as prescribed by S&P
(5) Reflects present value of net capacity purchases
(6) Reflects present value of minimum future operating lease payments
(7) Reflects after-tax unfunded pension/OPEB
(8) Includes non-recourse project debt
(9) Applies 75% of excess cash against balance of LTD
YE 2017 Exelon FFO Calculation ($M)(1,2)
GAAP Operating Income $4,300
Depreciation & Amortization $3,200
EBITDA $7,500
+/- Non-operating activities and nonrecurring items(3) $200
- Interest Expense ($1,425)
+ Current Income Tax (Expense)/Benefit ($75)
+ Nuclear Fuel Amortization $1,050
+/- Other S&P Adjustments(4) $375
= FFO (a) $7,625
YE 2017 Exelon Adjusted Debt Calculation ($M)(1,2)
Long-Term Debt (including current maturities) $32,650
Short-Term Debt $1,575
+ PPA Imputed Debt(5) $350
+ Operating Lease Imputed Debt(6) $875
+ Pension/OPEB Imputed Debt(7) $3,450
- Off-Credit Treatment of Debt(8) ($2,225)
- Surplus Cash Adjustment(9) ($650)
+/- Other S&P Adjustments(4) $300
= Adjusted Debt (b) $36,325
YE 2017 Exelon FFO/Debt(1,2)
FFO (a)
= 21% Adjusted Debt (b)
GAAP to Non-GAAP Reconciliations
42 Q1 2017 Earnings Release Slides
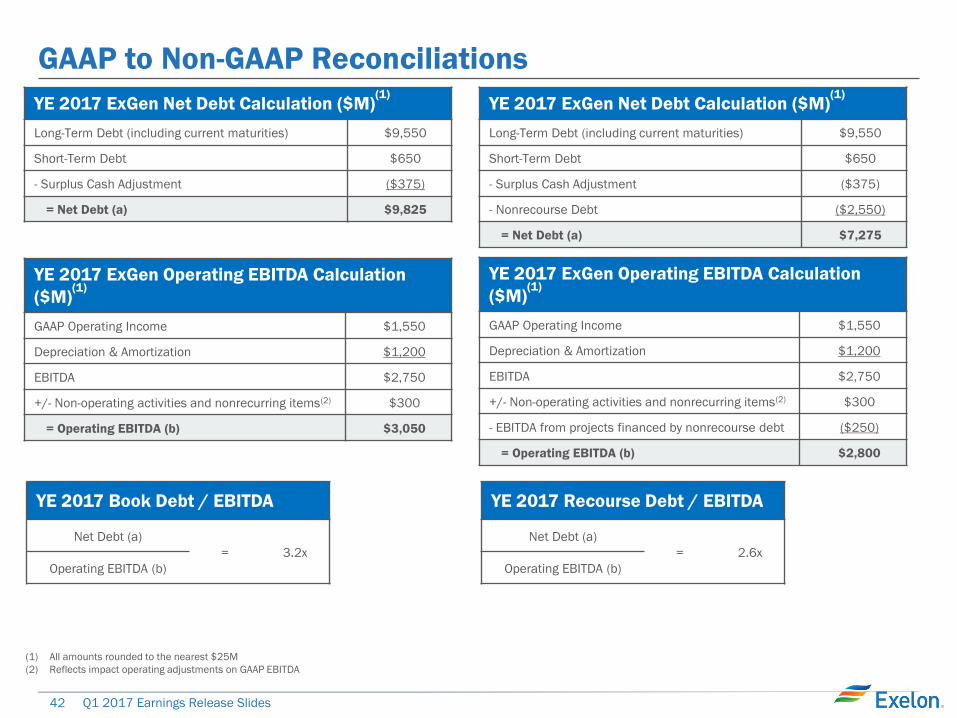
YE 2017 ExGen Net Debt Calculation ($M)(1)
Long-Term Debt (including current maturities) $9,550
Short-Term Debt $650
- Surplus Cash Adjustment ($375)
= Net Debt (a) $9,825
YE 2017 Book Debt / EBITDA
Net Debt (a)
= 3.2x
Operating EBITDA (b)
(1) All amounts rounded to the nearest $25M
(2) Reflects impact operating adjustments on GAAP EBITDA
YE 2017 ExGen Operating EBITDA Calculation
($M)(1)
GAAP Operating Income $1,550
Depreciation & Amortization $1,200
EBITDA $2,750
+/- Non-operating activities and nonrecurring items(2) $300
= Operating EBITDA (b) $3,050
GAAP to Non-GAAP Reconciliations
YE 2017 ExGen Net Debt Calculation ($M)(1)
Long-Term Debt (including current maturities) $9,550
Short-Term Debt $650
- Surplus Cash Adjustment ($375)
- Nonrecourse Debt ($2,550)
= Net Debt (a) $7,275
YE 2017 Recourse Debt / EBITDA
Net Debt (a)
= 2.6x
Operating EBITDA (b)
YE 2017 ExGen Operating EBITDA Calculation
($M)(1)
GAAP Operating Income $1,550
Depreciation & Amortization $1,200
EBITDA $2,750
+/- Non-operating activities and nonrecurring items(2) $300
- EBITDA from projects financed by nonrecourse debt ($250)
= Operating EBITDA (b) $2,800
43 Q1 2017 Earnings Release Slides
GAAP to Non-GAAP Reconciliations
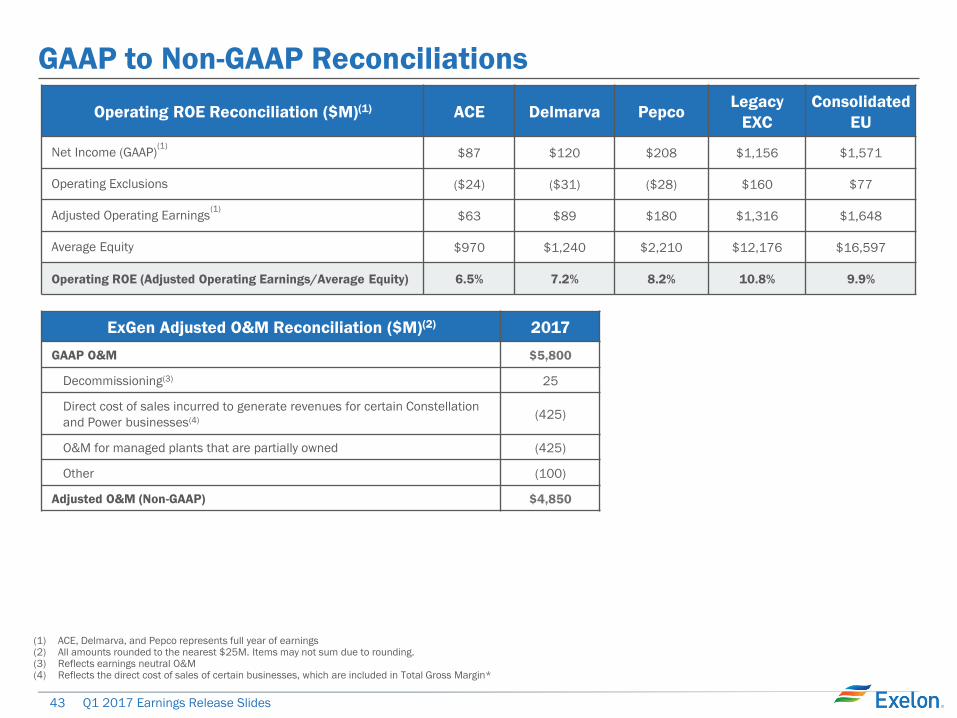
(1) ACE, Delmarva, and Pepco represents full year of earnings (2) All amounts rounded to the nearest $25M. Items may not sum due to rounding. (3) Reflects earnings neutral O&M (4) Reflects the direct cost of sales of certain businesses, which are included in Total Gross Margin*
Operating ROE Reconciliation ($M)(1) ACE Delmarva Pepco Legacy
EXC
Consolidated
EU
Net Income (GAAP)(1)
$87 $120 $208 $1,156 $1,571
Operating Exclusions
($24) ($31) ($28) $160 $77
Adjusted Operating Earnings(1)
$63 $89 $180 $1,316 $1,648
Average Equity
$970 $1,240 $2,210 $12,176 $16,597
Operating ROE (Adjusted Operating Earnings/Average Equity) 6.5% 7.2% 8.2% 10.8% 9.9%
ExGen Adjusted O&M Reconciliation ($M)(2) 2017
GAAP O&M $5,800
Decommissioning(3) 25
Direct cost of sales incurred to generate revenues for certain Constellation
and Power businesses(4) (425)
O&M for managed plants that are partially owned (425)
Other (100)
Adjusted O&M (Non-GAAP) $4,850
44 Q1 2017 Earnings Release Slides
GAAP to Non-GAAP Reconciliations
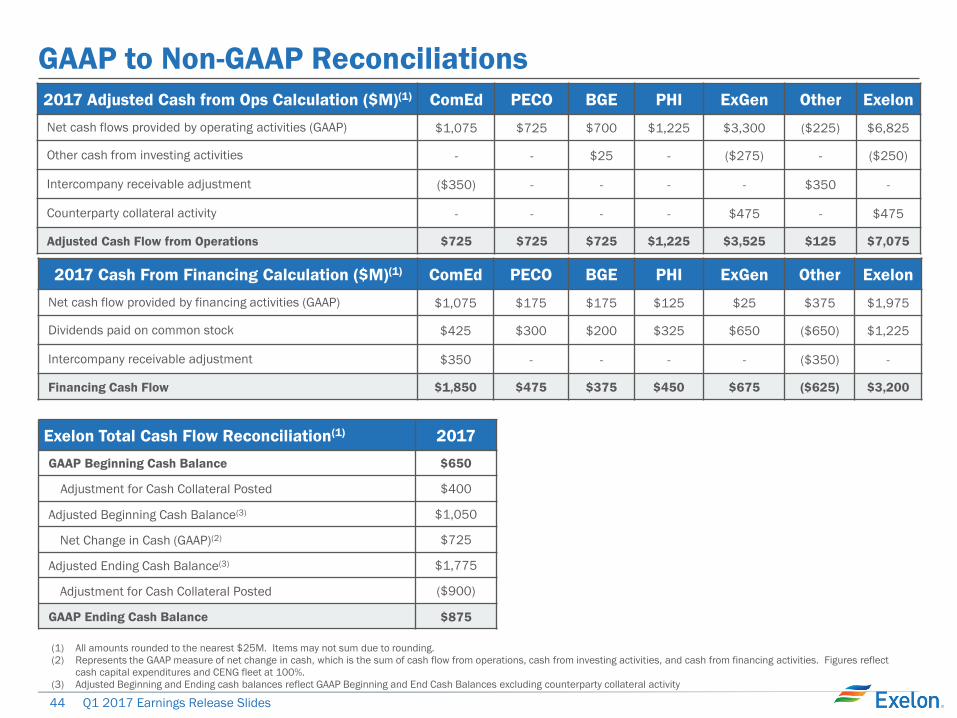
2017 Adjusted Cash from Ops Calculation ($M)(1) ComEd PECO BGE PHI ExGen Other Exelon
Net cash flows provided by operating activities (GAAP)
$1,075 $725 $700 $1,225 $3,300 ($225) $6,825
Other cash from investing activities
- - $25 - ($275) - ($250)
Intercompany receivable adjustment
($350) - - - - $350 -
Counterparty collateral activity
- - - - $475 - $475
Adjusted Cash Flow from Operations $725 $725 $725 $1,225 $3,525 $125 $7,075
2017 Cash From Financing Calculation ($M)(1) ComEd PECO BGE PHI ExGen Other Exelon
Net cash flow provided by financing activities (GAAP)
$1,075 $175 $175 $125 $25 $375 $1,975
Dividends paid on common stock
$425 $300 $200 $325 $650 ($650) $1,225
Intercompany receivable adjustment
$350 - - - - ($350) -
Financing Cash Flow $1,850 $475 $375 $450 $675 ($625) $3,200
Exelon Total Cash Flow Reconciliation(1) 2017
GAAP Beginning Cash Balance $650
Adjustment for Cash Collateral Posted $400
Adjusted Beginning Cash Balance(3) $1,050
Net Change in Cash (GAAP)(2) $725
Adjusted Ending Cash Balance(3) $1,775
Adjustment for Cash Collateral Posted ($900)
GAAP Ending Cash Balance $875
(1) All amounts rounded to the nearest $25M. Items may not sum due to rounding.
(2) Represents the GAAP measure of net change in cash, which is the sum of cash flow from operations, cash from investing activities, and cash from financing activities. Figures reflect
cash capital expenditures and CENG fleet at 100%.
(3) Adjusted Beginning and Ending cash balances reflect GAAP Beginning and End Cash Balances excluding counterparty collateral activity