Embed Size (px)
Citation preview
Finance and Economics Discussion Series Divisions of Research & Statistics and Monetary Affairs
Federal Reserve Board, Washington, D.C.
Executive Financial Incentives and Payout Policy: Firm Responses to the 2003 Dividend Tax Cut
Jeffrey R. Brown, Nellie Liang, and Scott Weisbenner 2006-14
NOTE: Staff working papers in the Finance and Economics Discussion Series (FEDS) are preliminary materials circulated to stimulate discussion and critical comment. The analysis and conclusions set forth are those of the authors and do not indicate concurrence by other members of the research staff or the Board of Governors. References in publications to the Finance and Economics Discussion Series (other than acknowledgement) should be cleared with the author(s) to protect the tentative character of these papers.

Executive Financial Incentives and Payout Policy: Firm Responses to the 2003 Dividend Tax Cut
Jeffrey R. Brown
University of Illinois at Urbana-Champaign and NBER
Nellie Liang Federal Reserve Board
Scott Weisbenner
University of Illinois at Urbana-Champaign and NBER
This version: January 2006
Abstract: Using the 2003 reduction in dividend tax rates to identify an exogenous change in the after-tax value of dividends to shareholders, we test whether stock holdings among company executives is an important determinant of payout policy. We have three primary findings. First, we find that when top executives have greater stock ownership, and thus an incentive to increase dividends for personal liquidity reasons, there is a significantly greater likelihood of a dividend increase following the 2003 dividend tax cut, whereas no such relation existed in the prior decade when the dividend tax rate was much higher. This finding is strongest for dividend initiations, and is robust to a rich set of firm and shareholder characteristics. Second, we provide evidence that approximately one-third of the firms that initiated dividends in 2003, a higher share than in previous years, scaled back share repurchases by an amount sufficient to reduce their total payouts. This offset potentially raised the total tax burden on shareholders at these firms because share repurchases are still tax-advantaged relative to dividends. Third, we find that while dividend-paying firms with a larger fraction of individual shareholders had greater stock price gains in response to the tax cut, the market appears to have at least partially anticipated that executives with high stock ownership might raise dividends at the expense of share repurchases and increase the average tax burden for individuals, which is consistent with the presence of agency conflicts within the firm. JEL Classification: G32, G35. H24 Key Words: Payout policy, Dividends, Share Repurchases, Executive Ownership, Executive Compensation, Agency Costs The views expressed in this paper are those of the authors and not necessarily those of the Federal Reserve Board. We thank Darrell Ashton, Vivek Choudhary, Yoon Sok Lee, and Lizy Mathai for excellent research assistance. We thank John Graham, Paul Harrison, Kevin Hassett, and seminar participants at the University of Illinois, the Federal Reserve Board, the American Enterprise Institute, and the 2006 AFA Meetings for their comments and constructive suggestions.
1. Introduction
Shareholder payouts have changed dramatically over the past two decades, with dividend
payout ratios falling substantially and share repurchases increasing rapidly (Fama and French
2001; Grullon and Michaely, 2002). Following the dividend tax cut in the Jobs and Growth Tax
Relief Reconciliation Act (JGTRRA) of May 2003, however, dividend activity increased sharply,
particularly the number of dividend initiations (e.g., Blouin, Raedy and Shackelford, 2004;
Chetty and Saez, 2005).1 The dividend tax cut represented a large increase in the after-tax value
of dividends to individual investors, as the top marginal tax rate on dividends was cut over 20
percentage points, from 38.6 percent to 15 percent.2 This tax change moved from initial
proposal to signed law in under five months, and was thus largely unanticipated prior to 2003.
Because this tax cut is an exogenous increase in the after-tax value of dividends to individual
investors, it represents a unique laboratory for using actual firm behavior to determine the role of
taxes and other factors that affect dividend policy.
We use this dividend tax change to answer three questions. First, what determines how
firms responded to the dividend tax cut? In particular, can executive stock holdings explain the
cross-sectional pattern of dividend increases? Second, do the dividend increases raise total firm
payouts, or are they partially offset by reduced share repurchases? Third, by examining share
price reactions around key events leading to the tax cut, are we able to shed light on whether
these payout policy decisions reflect possible agency problems within firms?
Why might executive stock holdings influence the firm’s reaction to the dividend tax cut?
The 2003 dividend tax cut raised the after-tax value of a $1 dividend to high-income
shareholders from 61.4 cents to 85 cents, a 38 percent increase. Thus, the cost of initiating or
1 While Julio and Ikenberry (2005) have argued that the up-tick in dividend activity started before the 2003 tax cut, Chetty and Saez (2005) subsequently showed that this result was due to issues with sample construction, and that the tax cut was indeed responsible for an increase in dividend activity in 2003. 2 The 2003 tax change also reduced the top marginal tax rate on ordinary income from 38.6 to 35 percent, and reduced the statutory long-term capital gains tax rate from 20 to 15 percent. Repurchases still are tax-preferred because, though subject to the same rate as dividends, the tax is deferred until the capital gains are realized at the time the shares are sold (and may go untaxed through basis step-up at death). However, this preference shrunk substantially with the dividend tax cut.
1
increasing dividend payments for executives who have large direct stock ownership decreased
substantially in 2003. Moreover, executives who are non-diversified with large company stock
ownership may place additional value on dividends for liquidity reasons, stemming from the fact
that they may face explicit/contractual restrictions (e.g., Core and Guay, 1999) or implicit
restrictions (e.g., insider sales may be viewed as a negative signal by the market) on their ability
to sell shares of stock.3
In contrast, firms whose executives are compensated primarily in the form of cash or
stock options would have no such incentives. Because employee stock options are rarely
dividend-protected (Murphy, 1999), executives compensated with options have a personal
financial incentive to limit dividends because they face a 100 percent implicit “tax” rate on
dividends, both before and after the dividend tax cut. That is, executive options fall in value with
the decline in the share price that results from a cash dividend which is not offset by the receipt
of the dividend to option holders. Thus, while an executive who holds a large share of their
wealth in options would have a personal financial incentive to keep dividend payments low, this
is true both before and after the dividend tax cut. Indeed, several prior studies have found that
when managers have more of their wealth in the form of options, rather than direct shares, they
tend to use dividends less heavily (Lambert, Lanen and Larcker, 1989; Jolls, 1998; Weisbenner,
2000; Fenn and Liang, 2001; Kahle, 2002).
These prior studies, however, did not have any exogenous shift in the relative cost of
distributing cash through dividends or repurchases. Because of this lack of exogenous variation,
the previous literature is subject to the criticism that the cross-sectional correlation between
executive compensation and payout policy may reflect unobservable characteristics, such as
managerial quality or corporate governance, that generate both compensation policy and
dividend policy. A key contribution of our study is that we use the unexpected and exogenous
3 While executives are not allowed to short their own company stock, Bettis, Bizjak, and Lemmon (2001) show that some executives hedge the idiosyncratic risk of their portfolios through collars and equity swaps. Managers also could pre-commit to a regular pattern of stock sales to try to avoid sending a negative signal to the market when their stock is sold. To the extent any of these diversification strategies occur will make it more difficult to find a relation between executive ownership and the likelihood of a dividend increase in 2003.
2
shift in the relative cost of paying dividends that arises from the tax change to address these
criticisms and thus provide stronger econometric identification of the relations of interest.
More recently, in work conducted simultaneously with ours, other authors have also
investigated the effect of the 2003 tax cut on firm payout behavior. While Chetty and Saez
(2005) and Nam, Wang and Zhang (2004) are primarily focused on establishing a causal link
between the tax cut and increased dividend activity, they do provide some cross-sectional
evidence that dividend increases are positively related to share ownership by managers.4 Blouin,
Raedy and Shackelford (2004) also report that dividend increases are positively related to insider
ownership. Our study differs from these studies in several ways. First, our primary focus is on
using the tax cut as a source of exogenous variation in the tax cost of executive ownership as a
way of more definitively testing whether executive ownership influences payout decisions.
Second, we test whether the dividend tax cut resulted in an increase in total firm payouts, or
instead represented a substitution between payout mechanisms for some firms. Grullon and
Michaely (2002) find that some of the increase in share repurchases over the past decade has
come at the expense of a reduction (or lack of increase) in dividends. We provide what we
believe is the first test of whether this pattern occurs in reverse, i.e., whether in response to the
2003 dividend tax cut, an increase in dividends is accompanied by a decrease in share
repurchases. Third, we examine whether excess stock returns around key legislative events
pertaining to the tax cut reflect potential agency costs. Specifically, we are interested in whether
stock prices reacted to the possible agency conflict between executives’ incentives to raise
dividends when their personal ownership stakes are higher and the fact that the overall tax
burden for other individual shareholders may have actually risen if dividends were substituted
for share repurchases (which ought to still be preferred due to their lower effective tax rate).5
4 The Nam, Wang and Zhang (2004) is much more limited in scope, in that it examines only S&P 1500 firms with ongoing dividend programs and thus misses the important effects of the tax cut on dividend initiations. 5 Auerbach and Hassett (2005) and Amromin, Harrison, and Sharpe (2005) find that high dividend-paying stocks earned excess returns of a few percentage points around the period of the tax cut. Neither of these two studies, however, examined the firm-level variation in excess returns.
3
We have three principal findings. First, we provide evidence that executive stock
holdings are an important explanation of which firms chose to respond to the tax cut by
increasing dividends. We show that the substantial variation across firms in the fraction of
shares held by top executives can explain approximately one quarter of the total unexpected
increase in dividends after the May 2003 tax cut, and an even larger share (roughly one-half) of
dividend initiations. In further support of this effect, we find that while there is virtually no
relation between executive stock ownership and the likelihood of a dividend increase in the
decade before the tax cut (when the dividend tax rate, and hence the cost to the stock-owning
executive of paying out dividends, was much higher), not only is the relation quite strong in 2003,
but it is disproportionately concentrated after the passage of the act in late May of that year
(when the tax cost of paying dividends is substantially reduced). While other factors, such as
executive stock option holdings, firm cash flow, leverage, past firm performance, and
institutional ownership are important determinants of dividend policy in general, only the effect
of executive stock holdings substantially changed with the change in tax regime, which is
supportive of a tax effect. These results are quite robust to additional controls and to alternative
specifications.
Our second finding is that, despite the increase in dividends in response to the tax cut,
about one-third of firms that initiated dividends in 2003 scaled back repurchases by an amount
sufficient to reduce total payouts (dividends plus share repurchases). This is in sharp contrast to
prior years, when approximately 10 percent of dividend initiators reduced total payouts in the
year of initiation. Our results further suggest that while the firms with more executive stock
holdings are more likely to increase dividends, they are no more likely to increase total payouts.
This suggests that, among those firms for which executive ownership had a large effect on
dividend initiations, there is some degree of dividend-repurchase substitution occurring. Thus,
while Grullon and Michaely (2002) found that firms with lower-than-expected dividend yields
had larger repurchase programs in the 1990s, we find that many of the firms that initiated
4

dividends in response to the 2003 tax cut were likely to at the same time reduce share
repurchases, suggesting that payout substitution may work in both directions.
Finally, we explore potential agency problems by examining how the market responded
to news of the 2003 tax cut. To the extent that there is some substitution occurring between
dividends and share repurchases, this suggests that the dividend tax cut may have actually
increased the overall tax burden for the typical individual shareholder as, even after the tax cut,
capital gains are likely still tax advantaged relative to dividends. We find that the firms which
historically have paid large dividends and which have a large fraction of individual shareholders
experienced stock price gains in response to the proposal and passage of the tax cut. However,
the market appears to have at least partially anticipated that some firms, in particular those firms
whose executives had large stock holdings, would substitute dividends for tax-advantaged share
repurchases or the retention of earnings, and thus potentially raise the tax burden on total
distributions for individual shareholders.
This paper proceeds as follows. In section 2, we discuss our sample, summary statistics
of the data, and provide more background on the 2003 dividend tax cut. In section 3, we present
our results on the effect of executive share ownership on dividend increases, and test how the
relation between executive holdings and dividend policy has changed over the pre- and post-tax-
change regimes. In section 4, we examine whether firms who increase dividends are increasing
total payouts, or are just substituting dividends for share repurchases, leaving total payouts
unchanged. In section 5, we analyze the market response to news of the tax cut to determine
whether the market anticipated for which firms the tax cut would lead to dividend substitution.
Section 6 concludes.
2. Sample, Summary Statistics, and the 2003 Tax Cut
We begin with approximately 1,700 publicly traded firms in each year from 1993 to 2003
for which we are able to merge the necessary firm characteristic, stock, and executive
5
compensation data from Compustat, CRSP and Execucomp.6 These firms together comprise the
vast majority of total U.S. stock market capitalization. In addition to share ownership and
options outstanding held by the top five executives, as provided by Execucomp, we are also
interested in shares and options held by others. Because institutional investors may face
different tax rates from managers and may serve as important monitors of firm activity, we
collect data on institutional ownership from CDA Spectrum, including a split between mutual
funds and other institutions. We also hand-collect data from company 10-k filings on options
held by employees who are not among the top executive ranks. Specifically, we define options
held by non-executive employees to be the difference between total and top executive holdings.
Table 1 reports summary statistics for our sample in 2002 and 2003. We focus on
ordinary dividend increases in 2003 and contrast them with those in earlier years.7 We use
CRSP data so that we can accurately measure whether the dividend announcement date was
before or after the passage of the tax cut in May 2003. We code a firm as having increased
dividends if, at any time during the period in question, the firm announced a dividend that was
higher than the level of dividends they paid previously. Specifically, an increase in dividends is
defined as an increase in dividends per share (adjusted for stock splits). We also make use of the
Compustat definition of dividends to confirm dividend initiations among firms that previously
did not pay dividends.
In 2003, 28.7 percent of the entire sample increased dividends, which is substantially
larger than the fraction of dividend increasers in 2002 (which was 22.0 percent) and in other
recent years. Particularly striking is the frequency of dividend initiations: 5.9 percent of
previously non-dividend paying firms started paying dividends in 2003, compared to only 1.2
percent in 2002, and it is higher than for any other year since 1980.
Because our primary question of interest is how the executive ownership of company
stock influences firm dividend policy, we highlight executive stock and option holdings in table
6 In our regressions, we have approximately 1,350 firms represented each year because roughly 350 firms are dropped each year due to missing values for some explanatory variables. 7 As we discuss below, our results are robust to the inclusion of special dividends in addition to ordinary dividends.
6
1. Consistent with prior literature, top executive ownership is 0.8 percent of firm shares at the
median firm, and 3.8 percent on average. While the fraction of total shares outstanding held by
top executives is relatively small, this can represent substantial wealth for these individuals. For
example, at the median, the value of stock held by the top executives at the end of 2002 was
almost $12 million, nearly four times the median annual cash salary and bonus for top executives
of $3.3 million. Summary statistics for other variables are provided at the bottom of table 1.
3. Empirical Results on Executive Ownership and Dividend Increases
3.1 Results: Dividend Increases for 2003 Relative to Prior Decade
The May 2003 dividend tax cut represents an ideal experiment for several reasons. First,
it is the first time in 17 years that the market faced a substantial reduction in the tax cost of
paying dividends.8 Second, aside from the reduction in dividend taxes, the legislation was free
of other major changes to the tax law that might confound empirical analysis of its effects. Third,
it came largely as a “surprise” to the market, thus enabling us to treat it as an exogenous event.
Specifically, the May 2003 legislation, which was made retroactive to January 1, 2003, was
completely unanticipated until the days leading up to President Bush’s speech to the Economic
Club of Chicago in early January 2003. The news leakage of this idea prior to this event was
minimal, and fewer than five months elapsed from the time of this announcement until the
legislation passed.9 Therefore, it is virtually certain that firms did not adjust their compensation
structure prior to 2003 in anticipation of a future dividend tax cut, and thus we can treat our
measure of executive ownership (which is based on 2002 data) as pre-determined. This allows
8 We do not examine the dividend tax rate cut in the Tax Reform Act of 1986 for three reasons. First, we lack the extensive data on the stock ownership of top executives during this time period. Second, this act included numerous other changes in the relative tax treatment of corporate and individual income that would make it difficult to isolate the effect of the dividend tax cut. Third, the 1986 Act was the outcome of a much longer political and legislative process, making it less plausible that the 1986 tax cut was a surprise to the market. In addition, the top marginal rate applicable to dividends was cut by the Economic Growth and Tax Relief Reconciliation Act of 2001, but the cut was very small (from 39.6 percent in 2000 to 38.6 percent in 2001, and to 37.6 percent in 2004 if the JGTRRA, which cut the dividend tax rate to 15 percent and is the focus of this study, had not passed in 2003), and likely was not large enough to elicit a noticeable response from firm executives. 9 Auerbach and Hassett (2005) provide a very careful chronology of the events leading to the tax cut and confirm that there was very little, if any, information released prior to the announcement of the tax cut.
7
us to identify the causal effect of executive holdings on changes in dividend policy in response to
the tax cut.
In table 2, we begin by exploring the correlation between the likelihood of a dividend
increase and the fraction of shares held by the top five executives of the company.10 We also
control for a rich set of covariates, including executive holdings of options, the firm’s market-to-
book ratio (a proxy for growth opportunities), free cash flow, cash on hand, leverage, past firm
stock market performance, volatility, firm size, firm age (to control for the “maturity” effect
posited by Julio & Ikenberry, 2005), and industry effects (covering 14 broad groups).11 These
variables are as of year-end 2002, and are related to whether the firm increased ordinary
dividends per share in 2003. Columns 1 through 3 report the results from a linear probability
model, whereas columns 4 through 6 report results for a Probit model.
Our first principal finding is that the fraction of shares held by top five executives is a
very important determinant of dividend policy. As shown in column 1, the coefficient on the
fraction of shares outstanding held by the top executives is positive and highly significant; the
coefficient of 54 indicates that moving from the 25th percentile (0.3 percent) to the 75th percentile
(3.2 percent) of the fraction of shares held by the top executives raises the probability of a
dividend increase by 1.6 percentage points, from a baseline of 28.7 percentage points.12 Further,
a one-standard-deviation increase in executive ownership translates into a 4.2 percentage point
higher likelihood of a dividend increase.
If it is indeed the case that the relation between executive stock ownership and dividend
activity is driven by the change in the tax cost of paying dividends, then such a relation should
not appear in prior years when dividends were taxed at a considerably higher rate (the top
personal rate was nearly 40 percent over the 1993-2002 period). The next two columns, which
10 Unless stated otherwise, when referring to dividend increases we include both initiations as well as increases for prior dividend payers. In table 3 we will analyze initiations as well as increases for prior dividend payers separately. 11 Industry groups are as follows: mining, oil and gas, construction, food, basic materials, biotech/medical, manufacturing, transportation, telecom, utilities, retail/wholesale trade, financial, technology, and other. 12 Throughout the tables, our dependent variable is measured in percentage points, while our explanatory variables are expressed as raw ratios (i.e., not in percentage points).
8
report coefficients from a single regression, provide such a comparison. In column 2, we report
the coefficients on key covariates over the 1993-2002 period pooled, while column 3 reports the
interaction of these covariates with a year 2003 indicator variable.13 This approach allows us to
easily test whether the effect of each covariate is different in 2003 than in prior years.
Focusing again on shares held by top five executives, we immediately see that there is no
correlation between executive share ownership and dividend increases in the prior decade, but a
strong relation in 2003, with the difference in the executive ownership effect highly significant.
This pattern is consistent with the view that the dividend tax cut reduced the cost of paying
dividends and thus raised the probability of a dividend increase for those firms in which
management had the most to gain, such as by obtaining liquidity through dividend payments.
Before discussing other covariates, we also report, in columns 4 through 6, the marginal
effects from a Probit specification. The marginal effect of a change in the fraction of shares held
by the top five executives is nearly identical to that from the linear probability model.14
Turning to the many covariates that might plausibly explain firm payout behavior, we
find a pattern that is quite consistent with our hypothesis. Not surprisingly, most of these
covariates have significant explanatory power in explaining cross-sectional differences in
dividend policy. Starting with the OLS results over the 1993-2002 period, the likelihood of
increasing dividends is increasing with free cash flow, past five-year returns, and (log) market
value of the firm. It is decreasing in the number of options held by top executives, cash on hand,
leverage, and monthly stock price volatility.15
13 The first year we can relate a change in dividend payouts to executive holdings at the prior year-end is 1993 because the Execomp database starts in 1992. 14 Note that, unlike the linear probability model, the marginal effects of 1993-2002 and 2003 separately need not add up to the marginal effect over the entire 1993-2003 period. This is because in a non-linear model, the marginal effects are evaluated at the sample means, which themselves differ slightly in the different time periods. 15 The negative relation with cash on hand likely reflects that firms with greater needs to hold cash balances, because of higher transaction costs or precautionary demands (Boyle and Guthrie, 2003; Almeida, Campello and Weisbach 2004) are less likely to commit to paying or increasing dividends. In addition, firms with greater debt ratios, and likely higher claims from interest expense on their earnings, are less likely to pay dividends as well. Leverage may also substitute for dividends as a way to reduce agency problems (Jensen, 1986).
9
Perhaps most importantly for our hypothesis, the differences in the magnitude of these
effects between 2003 and the earlier decade are all insignificant. In other words, we cannot
reject a zero difference between the effect of these covariates in 2003 versus prior years (the p-
value of the joint test that the differences in the non-ownership coefficients are all zero is 0.85).
Thus, the only effect that has a differential effect in 2003 is executive share ownership, which is
consistent with our tax-motivation hypothesis. The lack of a significant difference on the
executive options variable is particularly notable, because the implicit 100% tax on dividends
faced by executives who own non-dividend protected options did not change with the change in
the tax law. This provides further reassurance that the observed correlations of interest are not
being spuriously driven by some third factor that generally influences both executive
compensation and payout policy.
The results from the Probit are similar. Executive stock option holdings, free cash flow,
cash on hand, leverage, past returns, volatility, and firm market value are all significant
predictors of firm payout behavior in general, but there is again no significant difference between
2003 and prior years. Owing to the non-linear fit of the Probit model, the magnitude of the
marginal effects for many of the covariates are larger in absolute value than in the linear
probability model, but as noted, our primary coefficient of interest (executive shares) is
essentially unaffected. The p-value of the joint test that the differences (i.e., 2003 relative to
1993-2002 period) in the non-ownership coefficients are all zero is 0.53, with only the difference
in the coefficient on market-to-book individually significant at the 10 percent level.
To summarize, the results in table 2 are consistent with our hypothesis that dividend
increases were motivated by executives’ personal financial incentives. Executive share
ownership is a significant determinant of dividend policy in 2003 but not in prior years, which is
consistent with a change in tax rates in 2003. Conversely, other determinants of dividend policy,
while significant in all years, are generally not significantly different in 2003 versus prior years.
This provides assurance that there were not other factors or events changing in 2003 that are
spuriously driving the observed relation. These results suggest that dividend policy was changed
10
in 2003 in response to the fact that the fall in dividend taxes reduces the cost of paying dividends,
and this effect is strongest in firms where the executives’ personal financial incentives are most
affected by the tax cut.
3.2 Further Identification of the Executive Ownership Effect
In order to provide further evidence that the executive ownership effect is due to the tax
cut, in table 3, we extend our analysis in two important ways. First, recognizing that the tax cut
did not occur until late May 2003, we break 2003 into two shorter time periods representing the
part of the year that fell before the tax cut and the part that fell after the tax cut. In other words,
rather than simply focusing on 2003 versus 2002 (or the prior decade), we can focus on: i) the
pre-2003 period, ii) the portion of 2003 through May 23 (when the tax cut was formally passed
by Congress), and iii) the portion of 2003 after May 23 (the period immediately after the tax cut
was passed). The CRSP data allow us to divide dividend increases into these sub-periods based
on the announcement date, rather than the payable date, so that we can be sure of the relevant tax
regime in place at the time the firm made its dividend decisions.
Second, we distinguish between dividend increases that are dividend initiations among
firms that did not pay dividends in the prior year and dividend increases among firms that were
already paying dividends. Among this latter group of firms that were already paying dividends,
we can also look at firms increased dividends by a large amount, which we define as an increase
in dividends per share of more than 25%.
These extensions are potentially important for determining causality. For example,
dividing 2003 into a period before and after the tax cut may provide insight as to whether the tax
cut itself is the reason for the observed strong 2003 correlation between executive ownership and
dividend policy. If the observed correlation occurred mostly in the early part of the year, when
ultimate passage of the tax cut was uncertain, one might be concerned that the observed
correlation is not tax related. Of course, as with any legislative event, there is uncertainty about
the release of information during the period between the initial announcement and the final
passage of the act, and thus how firms will react. As noted earlier, the tax cut was unanticipated
11
before January 2003, but then from January to May, the possibility of a dividend tax cut was in
the news regularly. While the ultimate passage of the tax bill was not a “sure thing” during this
period, some firms may have made changes to their dividend policy in anticipation of the
possible tax cut. In particular, while it is highly unlikely that many firms would make a dramatic
change in payouts, such as initiating a dividend program, solely in anticipation of a possible
future tax cut, it is quite conceivable that a firm that was already paying dividends and already
considering an increase, might go ahead and raise the dividend during the January to May period
in anticipation of the tax cut. If the latter were the case, and if executives with heavy stock
ownership are more likely to push for the increase, then we might expect to see the correlation
between ownership and dividend increases become more important even before the passage of
the Act than in previous years. Such an uptick in the correlation at the start of 2003 should be
less likely for a dividend initiation, however, since the cost of being wrong about the tax cut
would be greater (because the dollar amount of an average dividend initiation is typically much
larger than the size of a dividend increase among prior dividend payers.)
The results, reported in table 3, are consistent with these patterns. Each coefficient
reported in table 3 represents the marginal effect of the percent of shares held by top five
executives on dividend increases from a separate linear probability model.16 In each regression,
we include all of the same control variables from table 2, including the age and industry effects,
but do not report the individual coefficients on those controls in the interest of brevity.17
The first row corresponds to the linear probability model from table 2, where the
dependent variable is defined as any dividend increase (including firms with and without a
previous history of paying dividends). In column 1, the 6.3 coefficient on the probability of
increasing dividends over the 1993 to 2002 period suggests that executive share ownership was
uncorrelated with dividend increases in the decade prior to the tax cut (this is the same 6.3
coefficient from column 2 in table 2). The second column in table 3 shows the result for 2002
16 As with the results of Table 2, the magnitude of the marginal effect of executive share ownership from a Probit model is nearly identical to that of the linear probability model. 17 These coefficient estimates are available from the authors by request.
12
only, and the coefficient is again quite similar and insignificant, as expected. In column 3, we
see the highly significant coefficient of 54 on executive ownership for the year 2003, suggesting
a strong effect of executive ownership on dividend increases (again, this is the same coefficient
that we found in column 1 of table 2). In columns 4 and 5 of table 3, we separate 2003 into pre-
and post-tax cut periods. As can be seen, the significant correlation between executive
ownership and dividend increases is driven almost entirely by the post-tax cut period. The
coefficient in the pre-tax cut period is indeed higher than in prior years, consistent with the
possibility that some firms may have increased dividends in anticipation of the tax cut, but the
effect is not statistically different from zero. In contrast, the coefficient for the post-tax cut
period is 43.3, which is significantly different not only from zero, but also from the coefficient in
prior years. These results provide further evidence that the observed correlation is indeed a tax
effect.
How big is this executive ownership effect? The actual fraction of firms increasing
dividends in the portion of 2003 following the tax cut approval in May was 16.8 percent. If one
estimated a regression of dividend increases on the various explanatory variables during the
same time period in 2002, and used the estimated coefficients to predict the post-May 2003
dividend increases, one would have predicted that only 9.5 percent of firms would have
increased dividends. The difference, approximately 7.4 percent, represents the “unexpected”
increase in dividend activity. The change in the relation between dividend policy and executive
ownership after the tax cut (relative to the same period in 2002) can explain 2.0 of this 7.4
percentage points, or about one-quarter of the overall effect.
The results from row 1 of table 3 represent the combined effect of dividend initiations
and dividend increases among firms already paying dividends. As noted, however, there are
reasons to suspect that firms already paying dividends might be willing to increase their dividend
in anticipation of a possible tax cut, whereas firms are less likely to initiate a new dividend
program for tax reasons until after the tax cut has become law. This is because dividends are
13
“sticky,” in that investors may expect dividends to be paid out regularly once started and rarely
cut (Lintner, 1956).
Turning to the second row of table 3, we focus on the subset of firms that did not pay
dividends in the prior year and examine how executive compensation affects initiations. In the
period prior to 2003, there is no discernable relation between executive compensation and
dividend initiations, with an insignificant coefficient of 6.2 over the prior decade and –3.6 in
2002. In contrast, there is a strong relation in 2003, with a highly significant coefficient of 37.8.
The coefficient of 37.8 indicates that moving from the 25th percentile (0.3 percent) to the 75th
percentile (3.2 percent) of the fraction of shares held by the top executives raises the probability
of a dividend initiation by 1.1 percentage points, while a one-standard-deviation increase in
executive ownership translates into a 2.9 percentage point higher likelihood of a dividend
initiation – both are economically large effects given the baseline initiation rate of 5.9 percentage
points in 2003. An examination of columns 4 and 5 indicate that this correlation with initiations
occurs entirely after the passage of the 2003 dividend tax cut. This result is consistent with our
hypothesis, as a firm is unlikely to initiate a new dividend program for tax reasons until they are
quite confident in the passage of the act.
As above, we can use the regression coefficients from the latter part of 2002 to predict
the level of dividend initiations in the latter part of 2003 had the tax cut not occurred. By
comparing the predicted to the actual, we find an “extra” 3.8 percentage points of firms initiated
dividends after the tax cut. The change in the relation between dividend initiations and executive
ownership after the tax cut (relative to the same period in 2002) can explain approximately half
of this additional initiation activity (specifically, 1.8 percentage points of the 3.8 percentage
point “unexpected” increase.)
In row 3, we turn to dividend increases among firms that already have a prior history of
paying dividends to shareholders. While there is no significant relation between executive share
ownership and dividend increases in the period before 2003, there is a highly significant
coefficient (72.6) for the year 2003. In contrast to initiations, where this effect was concentrated
14
in the post-tax cut months, this effect is more evenly divided over the pre and post tax cut period.
This is not entirely surprising given that firms that already pay dividends and that may be already
considering increasing dividends further may be more willing to go ahead and increase the level
of their dividend in anticipation of the tax cut, because of the lower cost of being wrong about
the tax cut.
Because many firms with dividend programs follow a rather predictable pattern of
slightly increasing dividends every year, it is also of interest to focus on “large” dividend
increases. We therefore examine whether executive ownership is correlated with the probability
of increasing dividends by more than 25 percent over the prior year’s dividend level.18 We
observe a statistically significant relation between executive ownership in the pooled 1993 to
2002 data, although this effect is substantially and significantly smaller than in 2003, with a
coefficient of only 12.9, versus the 64.9 that we observe in 2003. Thus, the overall pattern is
similar to that of any dividend increase among prior payers (i.e., including smaller increases),
with a coefficient for 2003 that is significant and much higher than in prior years, but with the
effect spread much more evenly over 2003 than initiations.
Overall, these results indicate that the correlation between executive share ownership and
dividend activity was uniquely strong in the year 2003. Firms were loathe to start paying
dividends for tax reasons until they had a high degree of confidence that the tax reduction would
become law, and thus the executive ownership effect upon initiations is concentrated almost
entirely in the period following the tax cut. For dividend increases among firms that already pay
dividends, the results suggest that many of the firms with high executive ownership increased
dividends even prior to final passage, during the period in which the President and Republican
members of Congress were moving the tax cut from initial proposal to final legislation.
3.3. Share and Option Ownership by Institutions and Other Individuals
18 While 53.5 percent of prior dividend payers increase ordinary dividends per share in 2003, only 13.8 percent increase them by more than 25% over their prior level. For comparison, in 2002, while 43.3 percent of prior dividend payers increased dividends, only 5.5 percent increasing them by more than 25% over their prior level. Thus, most of the rise in dividend increases among dividend payers following the tax cut seems to be concentrated among the larger increases.
15
Our results provide evidence that the stock ownership of top executives has a significant
effect on a firm’s decision of whether to increase dividends after the tax cut. Of course,
ownership by other groups could also have led to a differential response to the tax cut. For
example, a firm that is owned mostly by individual investors would benefit relatively more from
the tax cut than a firm whose shares are owned primarily by pension funds, whose dividend
income is not subject to tax.19 Further, options held by non-executives, as well as those held by
top executives, have been shown to influence payout policy (Lambert, Lanen and Larcker, 1989;
Jolls, 1998; Weisbenner, 2000; Fenn and Liang, 2001; Kahle, 2002). However, since options are
not dividend-protected, their effect on dividends should not vary with a change in dividend tax
rates. In light of this, we have tested whether these other stock and option holders influence
dividend policy, and if so, whether the effect changed with the tax cut.
In table 4, we re-estimate our primary specifications for the 2003 sample, as well as the
difference in the relevant coefficient for 2003 relative to the pooled period 1993-2002. However,
this time we include additional controls for the fraction of shares held by individual investors
other then the top five executives and the fraction of shares held by non-mutual fund institutional
investors (primarily tax-exempt pension funds). Like top executives, all individuals would face a
higher after-return to dividends in 2003 than earlier years. However, the share of the firm held
by each of the non-executive individuals is less likely to represent a large part of their own
personal wealth, and so the provision of liquidity is not nearly as an important an incentive for
dividend payments as it is for top management. The omitted category in this specification is
mutual funds, which includes both taxable and tax-exempt accounts and which would potentially
benefit more from the tax cut than non-mutual fund institutional investors.
The key finding from this specification is that even after controlling for individual and
institutional ownership, the coefficient on executive ownership shares in 2003 relative to the
prior decade (displayed in column 3 of table 4), is 47.4 and highly significant (little changed
19 While not all stocks held by individuals are in taxable accounts (e.g., some stocks are owned through tax deferred accounts such as IRAs), the fraction of direct stock ownership held in taxable accounts is higher than the fraction of mutual fund assets held in taxable accounts.
16
from the 47.7 in the specification without individual and institutional ownership displayed in
column 3 of table 2).20 Thus, while many of the other ownership variables are themselves
significant, their inclusion does not alter the executive ownership effect, and, unlike executive
stock holdings, their own effect on dividend policy does not change in 2003 with the tax cut.
The effects of the other ownership variables are of some interest in their own right. For
example, we find a positive relation between the fraction of shares held by individuals and the
likelihood of a dividend boost during 2003 which by itself is consistent with the tax motivations.
However, in contrast to the results for executive ownership, the relation for non-executive
individuals was no different in 2003 than it was for the prior decade when dividend tax rates
were much higher.21 Brav, Graham, Harvey, and Michaely (2005) find that only 1/5 of chief
financial officers report that the personal taxes shareholders pay are important when making
dividend decisions. Our results are consistent with this survey evidence; we find that firms with
high individual ownership did not boost dividends in response to the 2003 tax cut, rather what
matters is whether executives themselves owned stock.
In addition, we find a positive and significant coefficient on the fraction of shares held by
non-mutual fund institutions, which presumably have more tax-exempt assets than mutual funds
(the omitted category), throughout the 1993 – 2003 period. The effect is not statistically
different in 2003 than over the prior decade. Of course, the dividend tax cut yields no direct
increase in the after-tax value of dividends paid on shares held by tax-exempt institutions, and a
pure tax story would suggest the opposite sign. This finding, however, is consistent with the
view that institutional investors such as pension funds serve as monitors of firms. Pension funds,
for example, are generally considered to be much more active monitors of corporations, whereas
20 In contrast to the results from Table 2 where the omitted group was total non-executive ownership, here the omitted group is mutual funds. As such, the coefficient on executive ownership during the pre tax cut period (1993-2002) changes from 6.3 to 50.8. What matters for our hypothesis, however, is that the difference in the executive ownership coefficient for 2003 vs. earlier years is nearly identical in each specification. 21 This ongoing demand for dividends by individuals is consistent with Shefrin and Statman (1984) who argue that individuals may prefer dividends despite their tax disadvantage because it helps them to solve a self-control problem. That is, by committing to consume only out of dividends, investors avoid deciding how many shares to sell and how much to consume, and thus commit themselves not to consume too much.
17

mutual funds are thought to “vote with their feet” and simply sell the shares of companies with
poor governance mechanisms (Gillan and Starks, 1998). With skepticism about the quality of
corporate earnings in the post-Enron period, there was a growing perception that firms should be
pressured to pay dividends, because cash distributions cannot be manipulated and make it easier
for investors to verify the cash flows of the firm. In addition, DeAngelo, DeAngelo, and Skinner
(2000) also argue that institutions may like the smoothness of regular dividends because it makes
their task of rebalancing their portfolios more predictable and thus they increase their demand for
dividends when its after-tax cost to other shareholders declines.
In unreported results, we also find that options held by employees outside of the top
senior ranks have a negative effect on dividend increases in 2003, but that the effect is about one-
third the magnitude of that for options held by the top executives. Similar to executive options,
the effect of lower management options on dividend policy is not different in 2003 relative to
2002, as would be expected, given that the dividend “tax rate” on options is 100% both years.22
In sum, the coefficients on the additional ownership variables and the option variables,
both for upper management and lower level employees, suggest that they also influenced the
likelihood of a dividend increase in 2003. However, only the relation with executive stock
ownership is larger in 2003 relative to the pre-tax cut period, indicating that the tax cut did not
influence dividends through these other measures. The inclusion of these other controls has very
little influence on the executive holdings variables, suggesting that our executive holdings results
are not being spuriously driven by the composition of the other owners of the firm.
3.4 Further Robustness Checks
22 Because total options outstanding, and hence the difference between total and top executive option holdings, had to be collected by hand, we collected these data for year-end 2001 and 2002, and related non-executive options, along with other variables, to dividend changes in the next year. Thus, our comparison of 2003 with earlier years is limited to a comparison of 2003 with 2002 when this variable is included in the regression. The coefficient on the variable non-executive options-to-total firm shares outstanding is significantly negative in both years (-36.4 in 2002 and -50.7 in 2003), with the difference in coefficients statistically insignificant.
18
In this section, we briefly discuss the large number of specification checks that we
conducted.23 The key point is that our primary finding – namely, that executive stock ownership
strongly influenced payout policy following the 2003 dividend tax cut – is extremely robust.
Using the CRSP definition of dividends allows us to determine the precise dividend
announcement date, and thus sub-divide the 2003 period into pre- and post-tax cut periods. We
have, however, also tested our hypothesis using annual dividends paid as measured in Compustat,
which includes both ordinary dividends as well as special dividends. In contrast to ordinary
dividends, where the firm has the incentive to increase them only if they are confident that they
continue to pay them in the future, special dividends are a one-time tool and do not necessarily
signal a long-term increase in payouts. Given the prominence of Microsoft’s announcement in
July 2004 that they would pay a special dividend of $3 per share, totaling about $32 billion,24
and the work of Blouin, Raedy, and Shackelford (2004) that finds a rise in special dividends after
the tax cut, one might be interested in whether the results are significantly affected. Using the
Compustat measure of annual total dividends paid to construct dividend increases and initiations,
we find that the results for 2003 are quite similar, with a highly significant coefficient on
executive share ownership of 55.5 in the dividend increase regression and 38.1 in the initiation
regression (the differences between these 2003 coefficients and those from the pre-tax cut period
1993-2002 are 51.4 and 32.6, respectively, and are also highly significant).25
Baker and Hall (2004) argue that for many incentive problems, the dollar amount of
management ownership is a more accurate measure of management’s incentives. Thus, as a
second specification check, we replace our dependent variable with the log of the dollar amount
of shares held. Returning to our CRSP definition of an increase in ordinary dividends, we find a
coefficient on the natural log of the dollar value of shares held by top executive shares of 3.0,
23 In the interest of space, we do not report the coefficients from all the specification checks. These results, and others, are available from the authors upon request. 24 This large special dividend by Microsoft does not fall within our sample period. 25 We also estimated a specification using another possible definition of a “dividend increase,” namely an increase in the amount of dividends paid relative to firm size (e.g., an increase in the dividends-to-assets ratio), and found similar results. For example, the coefficient on executive share ownership is 44.8 in 2003, with a difference of 42.4 between the 2003 coefficient and that from the pre-tax cut period 1993-2002.
19
which is significant at the 1 percent level. Of note, we find that the coefficient in 2003 is also
greater than the coefficient in the 1993-2002 period, and that this difference of 1.8 is significant
at the 5 percent level. Among dividend initiators, we find a similar effect, with a coefficient on
the log of the dollar value of executive shares of 1.8, which is significantly different from both
zero and from the coefficient in the 1993-2002 period at the 1 percent level (difference in
coefficients is 1.7).
Finally, we also break executive ownership into that held by the CEO and that held by
other top executives to see if the holdings of the CEO are a bigger determinant of payout policy
than those of the next four top executives in the firm (CEOs, on average, account for about one-
half of the stock held by the firm’s top five executives at the end of 2002). For both total
dividend increases and dividend initiations, we find that both the share ownership of the CEO as
well as that for the other top executives are important determinants of dividend policy in 2003.
4. Executive Holdings and the Dividend Substitution Hypothesis
The 2003 Economic Report of the President, released in February of that year, provided
the Bush administration’s economic rationale for the dividend tax cut. In the analysis, the
administration highlighted a number of reasons that a cut in dividend tax rates could have
positive economic effects, including the elimination of distortions to investment decisions of
firms, arguing that “the heavier tax burden on dividends can encourage investment in established
businesses with internally generated earnings, because these businesses will tend to have more
retained earnings because of the tax distortion.” Implicit in this claim is that the dividend tax cut
will increase dividends and result in higher total payouts, rather than cause firms to shift the type
of payout towards dividends and away from share repurchases. Grullon and Michaely (2002)
find that firms with large repurchase programs also have a lower than expected dividend yield,
indicating some substitutability between the two. We, on the other hand, wish to test if the
reverse is also true – do firms that increased dividends in response to the tax cut at the same time
reduce share repurchases?
20
In table 5, we examine dividends and share repurchases paid during a given year by firms
in our sample as reported in Compustat. We define share repurchases as funds used to buy back
shares, as reported on cash flow statements, consistent with other studies (e.g., Jagannathan,
Stephens, and Weisbach, 2000; Fenn and Liang, 2001; Grullon and Michaely, 2002). For the
subset of firms that increased/initiated dividends, as well as for firms that did not increase their
dividend payouts, we report three statistics. First, we report the likelihood the firm repurchased
shares in the previous year and thus has a track record of distributing cash through other means.
Second, we report the likelihood that the firm decreased share repurchases (normalized by assets)
conditional on having bought back stock in the prior year. Third, we report the probability that
the firm increased total payouts (dividend plus share repurchases, normalized by assets) relative
to the prior year. We do these calculations for three cohorts of dividend increasers, those that
increased in the periods prior to the tax cut (1993-2002 and 2002) and those that increased
dividends in 2003.26
The first row of table 5 reports results for all firms that increased dividends. It indicates
that the fraction of dividend increasers in 2003 that had previously repurchased shares (67%) was
not significantly different from the prior decade (65%). Just under two-thirds of the firms that
increased dividends in 2003 reduced their level of share repurchases (normalized by assets),
which is slightly higher than in prior years. The net result is that only half (52%) of dividend
increasers actually increased total payouts (normalized by assets). This fraction is in line with
prior years.27
26 We report results for the Execucomp sample (roughly the S&P 1500). An analysis of all firms in Compsutat yields qualitatively similar results. 27 It is possible that an increase in dividends per share need not increase the dividends-to-assets ratio, and thus not increase total payouts. To address this possibility, we also redefined a “dividend increase” as an increase in the amount of dividends paid relative to firm size (i.e., an increase in the dividends-to-assets ratio). With this alternative definition, we find the following patterns in payout policy for those firms that boosted dividends-to-assets: (i) the fraction of dividend increasers in 2003 that had previously repurchased shares (62%) was identical to that of the prior decade; (ii) among those that had repurchased shares in 2002, 65% reduced repurchases in 2003 while only 53% did in the prior decade, a statistically significant difference; (iii) the net result is that 66% of dividend increasers actually increased total payouts in 2003, significantly less than the 73% over the prior pre-tax period. Note that for dividend initiations, the two measures of a “dividend increase” are identical.
21

For dividend initiations, the evidence is strongly suggestive of partial substitution. As
shown in the middle row of the upper panel, we find that among firms that initiated dividends in
2003, 68 percent had repurchased shares in the previous year, significantly greater than the 38
percent in 1993-2002. Among these repurchasing-firms, 78 percent reduced their share
repurchases from the previous year’s level upon initiating dividends in 2003, again significantly
greater than the 56 percent in 1993-2002. The net result is that 66 percent of all the firms that
initiated dividends in 2003 (including those that had not repurchased shares in 2002) also
increased total payouts, with the remaining one-third actually cutting total payouts the year they
started paying dividends. As a benchmark, if no substitution had occurred, 100 percent of the
firms that initiated dividends would have increased total payouts.28 The contrast of the effect of
a dividend initiation on total payouts for 2003 relative to previous years is striking. During the
previous decade (1993 to 2002), 89 percent of firms that initiated dividends increased total
payouts. In 2002, the figure was 92 percent. These are much closer to the 100 percent rate that
we would expect if no substitution had occurred. These results are not driven by what may have
been a lower inclination to repurchase shares in the early to mid-1990s, as the pattern of
increased payouts upon a dividend initiation is also present when we focus only on the year 2002.
Thus, it appears that there are an additional 20 – 25 percent of dividend initiators in 2003 than in
prior years that failed to increase total payouts in the year they initiated dividends.
Another possible reason that repurchases might have fallen in 2003 is that fewer stock
options were being exercised that year, and thus the need to enter the market to acquire stock is
potentially lessened. To test this possibility, we show in row 3 of table 5 that payouts did not
decline to the same degree for firms that did not increase dividends. Specifically, the fraction of
non-dividend increasers in 2003 that repurchased shares in the prior year (50 percent) was
similar in 2003 as in prior years (44% over 1993-2002, 51% in 2002). Similarly, the fraction of
28 We also compared share repurchases and payouts during the year a firm increased dividends to the firm’s average level of dividends and share repurchases over the past three years (as opposed to just the prior year). The results regarding dividend substitution are very similar. For example, only 58% of dividend-initiators in 2003 increased total payouts above their average payout-to-assets ratio over the past three years (79% of dividend-initiators over the period 1993-2002 increased payouts relative to the prior three-year average).
22
firms that did not increase dividends in 2003 that experienced a decline in repurchases / assets in
2003 was quite similar to prior years (64% in 2003, versus 63% over prior decade and 58% in
2002). As such, it does not appear that our substitution result among initiators is driven by a
general decline repurchases across all firms.
To provide perspective on the size of the change in total payouts, the bottom panel of the
table shows the distribution of changes in dividends, share repurchases, and total payouts (all
normalized by assets) for firms that initiated dividends. The normalized size of the dividend
initiation is comparable for the pre-tax cut period (1993-2002) and the post-tax cut (2003), with
no statistical difference in the mean or median. However, the changes in both share repurchases
and total payouts in 2003 are considerably lower than the changes in previous years. The mean
change in share repurchases (normalized by assets) is –1.6 percentage points in 2003, leading to
only a 0.6 percentage point increase in the payout-to-asset ratio, compared to an average of a 4.5
percentage point increase over the period 1993-2002. Median changes in total payouts are also
smaller in 2003, though not significantly different from earlier years. Perhaps most telling is the
negative change in payouts at the 25th percentile in 2003 relative to the slight increase in payouts
at the 25th percentile from 1993 to 2002, owing to the more frequent cutback in share repurchases
that occurred in 2003.
Overall, these tabulations suggest some substitution from repurchases to dividends, at
least among dividend initiators, prompted by the dividend tax cut. The fact that, among about
one third of dividend initiators, there was no increase in total payouts might be somewhat
surprising given that the tax burden of total payouts declined. However, for firms that had relied
more heavily on share repurchases to distribute excess cash flow (which was evidently the case
for many of the dividend initiators in 2003), the reduction in the tax burden is actually somewhat
small. The tax rate on dividends was cut to the statutory rate on long-term capital gains (both are
now 15%), but firms for which the higher tax burden of dividends was important likely had
switched to share repurchases to exploit their tax advantage. With an equalization of statutory
23
rates, these firms became more willing to substitute towards dividends and scale back
repurchases, leaving total payouts little changed.
The analysis in table 5 suggests nontrivial substitution of dividends for share repurchases
among firms initiating dividend programs. In table 6 we more rigorously model the determinants
of the broader payout policy choices firms made in response to the 2003 tax cut. As in the
bottom panel of table 4, we also focus here on the level of payouts, this time using a Tobit
specification. Having established that there is some substitution occurring, we are now
interested in whether the executive-ownership-induced increase in dividends in 2003 translated
directly into higher total payouts or was instead offset, leaving total payouts little changed.
We begin by running a Tobit specification where the dependent variable is equal to the
increase in the amount of dividends paid (again normalized by assets), or zero for firms that did
not increase dividends-to-assets, during the year 2003. Column (1) reports the coefficients for
the specification estimated on all firms. Looking first at the non-ownership control variables in
the Tobit model, the results indicate, not surprisingly, that free cash flow and cash on hand are
positively related to the size of a dividend increase, while the executive option holdings, the
market-to-book ratio, and volatility are negatively related to the amount of the increase. This
holds true both in 2003 and in unreported results for prior years. Turning to the primary
coefficient of interest, we see that greater executive ownership of shares leads to a larger amount
of dividends. Importantly, this effect is not only significantly different from zero, but it is also
significantly different from the effect of executive ownership on the amount of dividend
increases in the earlier decade. Indeed, in unreported results, a Tobit model estimated over the
pre-tax cut period yields a statistically insignificant, close to zero, effect of executive ownership.
In column 2, we report a similar specification, but this time replace the increase in
dividends with the increase in total payouts (dividends plus repurchases) as the dependent
variable, with the increase in payouts normalized by assets. We find that while greater executive
share ownership translates into a higher level of dividends, it does not lead to greater total
payouts. These results suggest that firms with executive-ownership-induced dividend initiations
24
in response to the 2003 tax cut often engaged in dividend substitution (i.e., often did not boost
total payouts to shareholders as a result of the new dividend program). In unreported results, a
Tobit model estimated over the pre-tax cut period also yields a statistically insignificant, close to
zero, effect of executive ownership on total payouts. Thus, unlike the dividends result, the
relation between executive holdings and total payouts do not seem to change in 2003.
In columns 3 and 4, the exercise is repeated for those firms that did not previously pay
dividends. We find a highly significant positive relation between the executive share ownership
variable and the amount of a dividend initiation. This relation does not, however, exist for total
payouts. Again, this is evidence that those firms that initiated dividends due to executive
ownership considerations did not always experience a comparable increase in total payouts.
These findings on dividend substitution complement prior studies that support
substitution between dividends and share repurchases. Grullon and Michaely (2002) find higher
share repurchases by firms whose dividend increases are less than what would be predicted by a
model of firm-level dividend changes, and Dittmar (2000) has similar findings based on an
aggregate-level analysis. Our study, which benefits from the exogenous change in the tax rate on
dividends, provides evidence of payout substitution in the other direction. Specifically, we find
that shareholder taxes are a factor in the choice of payout mechanism and that when the tax rates
are more closely aligned, firms exhibit some substitutability between the two (i.e., increasing
dividends, at least in part, by reducing stock buybacks).
5. Evidence from the Market Reaction to the Dividend Tax Cut Announcement
We have shown that a firm’s ownership structure and the composition of its executive
holdings influenced the change in payout policy following the dividend tax cut. This raises the
possibility that, to the extent that the financial markets anticipated these responses, one might
expect a differential market response to the dividend tax cut based on these characteristics. Here,
we explore whether the market anticipated that at firms with large management stock holdings,
the tax cut would lead to a substitution of dividends for tax-advantaged share repurchases, and
25
thus perhaps raise the average tax burden on total distributions, at least for individual
shareholders. This analysis can be thought of as an indirect test of whether the compensation
contract for executives results in agency problems between executives and shareholders.
As with any event study, the power of the test depends on how accurately one can
identify the actual date on which the value-relevant information was released to the financial
markets. While an ideal event study has a very well defined event window, for legislative events
the release of information is often spread out over a long legislative process, including, at
minimum, an initial announcement of intent, committee hearings and votes, and votes by each
house of Congress prior to final Presidential approval. Despite the difficulties, there is a long
history of research examining the effect of legislative events on stock prices.29 The legislative
process surrounding the 2003 dividend tax cut includes the possible release of information on
multiple dates. For purposes of this section, we focus on eight event windows, each consisting
of five trading days (a +/-2 day window around each event). These eight event windows are
based on the careful analysis of news events between December 2002 and the May 2003 passage
of the dividend tax cut conducted by Auerbach and Hassett (2005).30 These eight event windows,
combined spanning 40 trading days, are meant to capture the market reaction from the initial
announcement of the tax cut proposal by the White House through the final passage of the tax
cut in the House and Senate.31
The average stock return for our sample of firms, compounded over the eight event
windows, is 9.9 percent, with a median of 6.4 percent. Because a standard OLS regression of
returns will be sensitive to outliers (some sample firms had extreme performance over these 40
29 Some examples include the effect of the 1986 tax reform act (Cutler 1988), financial services deregulation (James, 1983; Cornett and Tehranian, 1990), regulation of the market for corporate takeovers (Schumann 1988), and the passage of the Terrorism Risk Insurance Act (Brown, Cummins, Lewis, and Wei 2004). 30 More detail on the eight event windows, and how they were independently constructed by the staff of the House Ways and Means Committee, can be found in Auerbach and Hassett’s paper. 31 By using all eight event windows, we are taking the conservative approach in that we are biasing ourselves against finding a significant effect. This is because a few of the 8 events have been shown by Auerbach and Hassett to be less informative to the market than the others. By restricting ourselves to the more salient news days, our results are even more highly significant.
26
days as returns varied from a high of over 200 percent to a low of –44 percent), we estimate a
robust regression and a median regression.
Given that the dividend tax cut applied only to individual investors, we have two
predictions for the stock price reaction of firms to the dividend tax cut. First, returns should be
higher for those firms with higher individual ownership (the group that gains from the reduction
in individual tax rates) and that also have historically paid more. This implies that the coefficient
on the interaction of individual ownership and the prior year dividends-to-asset ratio should be
positive. This simply reflects the fact that, holding payout policy constant, the dividend tax cut
is more valuable for firms with higher levels of dividends (as opposed to share repurchases).
Our second prediction is the most important for investigating the role of executive share
ownership. To the extent that the markets anticipated that some of the firms that initiated or
increased dividends were more likely to reduce share repurchases (less likely to boost total
payouts) in 2003 than in prior years, thus possibly increasing the overall tax burden for the
typical individual shareholder,32 we would expect a negative coefficient on the interaction of the
level of individual ownership and executive holdings. The intuition is as follows: if a firm has a
higher level of individual ownership, which leads shareholders to care more about dividend taxes,
and also has a higher level of executive ownership, which leads to a greater likelihood of
dividend substitution and greater individual tax burden, then relative to other firms there should
be a negative stock price reaction. In a sense, this interaction of executive holdings with the
share of individual ownership provides a way of quantifying the potential agency issues between
management and shareholders. If the tax cut induces executives with wealth tied up in company
stock to boost or initiate dividend payments, even though the non-executive individual
shareholders with far less concentrated portfolios would still prefer receipt of capital gains via
earnings retention or stock buybacks to dividends even after the tax cut, this would be indicative
32 As mentioned earlier, the 2003 tax change also reduced the statutory long-term capital gains tax rate from 20 to 15 percent, the same as the new top marginal rate on dividends. Repurchases still are tax-preferred because the tax is deferred until the capital gains are realized at the time the shares are sold (and may go untaxed through basis step-up at death), though the preference shrunk substantially with the dividend tax cut.
27
of agency issues. Thus, the more negative is the coefficient on this interaction term, the greater
the agency costs.
As shown in table 7, the results are supportive of both hypotheses. Consistent with the
first hypothesis, we find that the interaction of a firm’s dividend-to-asset ratio in 2002 with the
individual investors’ share of ownership is positive and significant. It indicates that for a firm
with a dividend yield of two percent, a one-standard-deviation increase in individual ownership
corresponds to a 1.0 percentage point higher stock return during the eight tax-cut events. These
results are consistent with Perez-Gonzalez (2003) who finds that dividend valuation increased
when dividends were less tax disadvantaged, but only for firms with large individual
shareholders.
We also find evidence supportive of our second hypothesis. Specifically, the coefficient
on the interaction of executive stock ownership with the individual ownership share is significant
and negative. We find that for firms primarily owned by institutions, the executives’ stock
holdings do not influence how the market reacted to the tax cut (i.e., the executive ownership
coefficient is small in magnitude and insignificant). However, firms with higher individual
ownership and high executive ownership actually declined in value. Specifically, for a firm with
the average level of individual ownership, a one-standard-deviation increase in executive
ownership leads to a 1.7 percentage point lower return.33 This is consistent with the view that
the markets anticipated the potential agency conflicts between executives and other individual
shareholders. Further, this negative price reaction is suggestive that, at least for some firms, the
compensation contract in place for top executives may not lead to optimal payout policy
decisions from the shareholders’ perspective under a lower dividend-tax regime. The right panel
of table 7 repeats these specifications using returns in excess of Fama-French benchmarks and
the results are nearly identical.
33 However, the interaction of the individual ownership share with the amount of executive stock options had no effect on the market reaction to the tax cut (recall that the effect of dividends on stock option value did not change with the tax cut, thus whether the executives had a lot of stock options would not lead to a change in payout policy after the tax cut relative to earlier years, as confirmed in our earlier dividend policy regressions).
28
These results are suggestive of potential agency problems within some firms. Ex post,
we found that firms whose executives had large ownership shares were more apt to increase or
initiate dividends, often by at least partial substitution with share repurchases. Even after the tax
cut, retained earnings and share repurchases, which distribute capital gains, are likely taxed
somewhat less heavily than dividends since the gains are taxed on a realization basis. Thus, at
least in part, the market seems to have capitalized the likely payout-policy response by firms
based on the incentives provided by executives’ share ownership.
6. Summary and Conclusions
The 2003 tax cut provides a unique laboratory to test how a large reduction in the
individual dividend tax rate influences corporate payout policy. We provide evidence that top
executive holdings of company stock significantly influence a firm’s choice of payouts. We find
that top executive holdings of company stock has a substantial impact on whether a firm
increased or initiated dividends in response to the reduction in the tax-cost of paying dividends.
Unlike past studies in this area that identify results off of cross-sectional correlations, the
unexpected and exogenous change in the after-tax value of dividends allows us to directly
address the usual criticism that a cross-sectional relation between executive holdings and payout
policy may simply reflect unobservable characteristics, such as managerial quality or corporate
governance, that generate both option compensation and low dividends.
We find that in 2003, especially in the months following the passage of the May tax cut, a
firm was much more likely to increase dividends if the executives owned a larger fraction of the
outstanding shares. This correlation between executive ownership and payout policy is
significantly different in 2003 than in prior years. In contrast, while other factors, such as cash
flow, leverage, past firm performance, executive stock option holdings, and institutional
ownership are important determinants of dividend policy in general, their effect on dividend
policy did not change in 2003. Because only the effect of executive stock holdings changed
29

significantly with the change in tax regime, we interpret this as strong evidence of a tax effect
upon payout policy.
Our work also indicates that, at least for dividend initiations, taxes are a factor in the
choice of dividends versus share repurchases and that when tax rates are more closely aligned,
firms exhibit some substitutability between the two. We also provide evidence that the markets
may have at least partially anticipated these effects, leading to differential stock price responses
to key events leading up to the passage of the tax cut.
This paper raises a particularly interesting avenue for future research. The main finding
of this paper is that personal financial incentives for executives clearly matter for firm payout
behavior. This finding is consistent with a standard agency theory perspective that, rather than
operating the firm solely in the best interests of shareholders who may still prefer share
repurchases or earnings retention to dividends even after the tax cut, managers are inclined to
also incorporate their own financial incentives in corporate decisions. The results in this paper,
particularly those concerning the stock price reaction to the tax cut, suggest there may be an
agency problem between management and outside shareholders that should be considered when
structuring management compensation contracts. The relation between firm actions (e.g., payout
policy, capital structure, investment decisions, etc.) and the incentives provided by executive
holdings to undertake these actions, and whether the compensation package is structured a priori
by the firm to encourage these reactions by managers remains an interesting area for further
research.
30
References
Almeida, H., M. Campello, and M. Weisbach, 2004, “The Cash Flow Sensitivity of Cash,” Journal of Finance 59, 1777-1804.
Amromin, G., P. Harrison, and S. Sharpe, 2005, “How Did the 2003 Dividend Tax Cut Affect Stock Prices?,” FEDS Working Paper 2005-61.
Auerbach, A., and K. Hassett, 2005, “The 2003 Dividend Tax Cuts and the Value of the Firm: An Event Study,” NBER Working Paper 11449.
Baker, G., and B. Hall, 2004, “CEO Incentives and Firm Size,” Journal of Labor Economics 22 (4), 767-798.
Bettis, C., Bizjak, J., and M. Lemmon, 2001, “Managerial Ownership, Incentive Contracting, and the Use of Zero-Cost Collars and Equity Swaps by Corporate Insiders,” Journal of Financial and Quantitative Analysis 36 (3), 345-370.
Blouin, J. L., J. S. Raedy, and D. Shackelford, 2004, “The Initial Impact of the 2003 Reduction in the Dividend Tax Rate,” unpublished working paper.
Boyle, G. W., and G. A. Guthrie, 2003, “Investment, Uncertainty and Liquidity,” Journal of Finance 58, 2143-2166.
Brav, A., J. Graham, C. Harvey, and R., Michaely, 2005, “Payout Policy in the 21st Century,” Journal of Financial Economics 77 (3), 483-527.
Brown, J. R., J. D. Cummins, C. Lewis, and R. Wei, 2004, “An Empirical Analysis of the Economic Impact of Federal Terrorism Reinsurance,” The Journal of Monetary Economics 51, 861-898.
Chetty, R., and E. Saez, 2005, “Dividend Taxes and Corporate Behavior: Evidence from the 2003 Dividend Tax Cut,” Quarterly Journal of Economics 120 (3), 791-833.
Core, J., and W. Guay, 1999, “The Use of Equity Grants to Manage Optimal Equity Incentive Levels,” Journal of Accounting and Economics 28, 151-184.
Cornett, M. M, and H. Tehranian, 1990, “An Examination of the Impact of the Garn-St. Germain Depository Institutions Act of 1982 on Commercial Banks and Savings and Loans,” Journal of Finance 45, 95-111.
Cutler, D. M., 1988, “Tax Reform and the Stock Market” An Asset Price Approach,” American Economic Review 78, 1107-1117.
DeAngelo, H ., L. DeAngelo and D. Skinner, 2000, “Special Dividends and the Evolution of Dividend Signalling,” Journal of Financial Economics 57, 309-354.
Dittmar, A., 2000, “Why do Firms Repurchase Stock,” Journal of Business 73, 321-356.
Fama, E., and K. French, 1992, “The Cross Section of Expected Returns,” Journal of Finance 47, 427-465.
Fama, E., and K. French, 2001, “Disappearing Dividends: Changing Firm Characteristics of Lower Propensity to Pay?,” Journal of Financial Economics 60, 3-44.
31
Fenn, G., and N. Liang, 2001, “Corporate Payout Policy and Managerial Stock Incentives,” Journal of Financial Economics 60, 45-72.
Gillan, S., and L. T. Starks, 1998, “A Survey of Shareholder Activitism Motivation and Empirical Evidences,” Contemporary Finance Digest 2 (3), 10-34.
Grullon, G., and R. Michaely, 2002, “Dividends, Share Repurchases, and the Substitution Hypothesis,” Journal of Finance 57, 1649-1684.
Jagannathan, M., C. Stephens, and M. Weisbach, 2000, “Financial Flexibility and the Choice Between Dividends and Share Repurchases,” Journal of Financial Economics 57, 355-384.
James, C., 1983, “An Analysis of Intra-Industry Differences in the Effect of Regulation: The Case of Deposit Rate Ceilings,” Journal of Monetary Economics 12, 417-432.
Jensen, M. C., 1986, “Agency Costs of Free Cash Flow, Corporate Finance, and Takeovers,” American Economic Review 76 (2), 323-329.
Jolls, C., 1998, “Stock Repurchases and Incentive Compensation,” NBER Working Paper 6467.
Julio, B., and D. Ikenberry, 2005, “Reappearing Dividends,” forthcoming in Journal of Applied Corporate Finance.
Kahle, K., 2002, “When a Buyback isn’t a Buyback: Open-market Repurchases and Employee Options,” Journal of Financial Economics 63, 235-261.
Lambert, R., W. Lanen and D. Larcker, 1989, “Executive Stock Option Plans and Corporate Dividend Policy,” Journal of Financial Quantitative Analysis 24 409-425.
Lintner, J., 1956, “Distributions of Incomes of Corporations Among Dividends, Retained Earnings, and Taxes,” American Economic Review, 46, 96-114.
Murphy, Kevin, 1999, Executive Compensation, “ In Ashenfelter, O., Card, D., (Eds.), Handbook of Labor Economics, Vol. 3B, North Holland, Amsterdam.
Nam, N., J. Wang, and G. Zhang, 2004, “The Impact of Dividend Tax Cut and Managerial Stock Holdings on Firm’s Dividend Policy,” Working Paper, Lubin School of Business, Pace University.
Perez-Gonzalez, F., 2003, “Large Shareholders and Dividends: Evidence from U.S. Tax Reforms,” Columbia University working paper.
Schumann, L., 1988, “State Regulation of Takeovers and Shareholder Wealth: The Case of New York’s 1985 Takeover Statutes,” RAND Journal of Economics 19, 557-567.
Shefrin, H. M., and M. Statman, 1984, “Explaining Investor Preference for Cash Dividends,” Journal of Financial Economics 13, 253–282.
Weisbenner, S., 2000, “Corporate Share Repurchases in the Mid-1990s: What Role Do Stock Options Play?” Working Paper, University of Illinois at Urbana-Champaign.
32
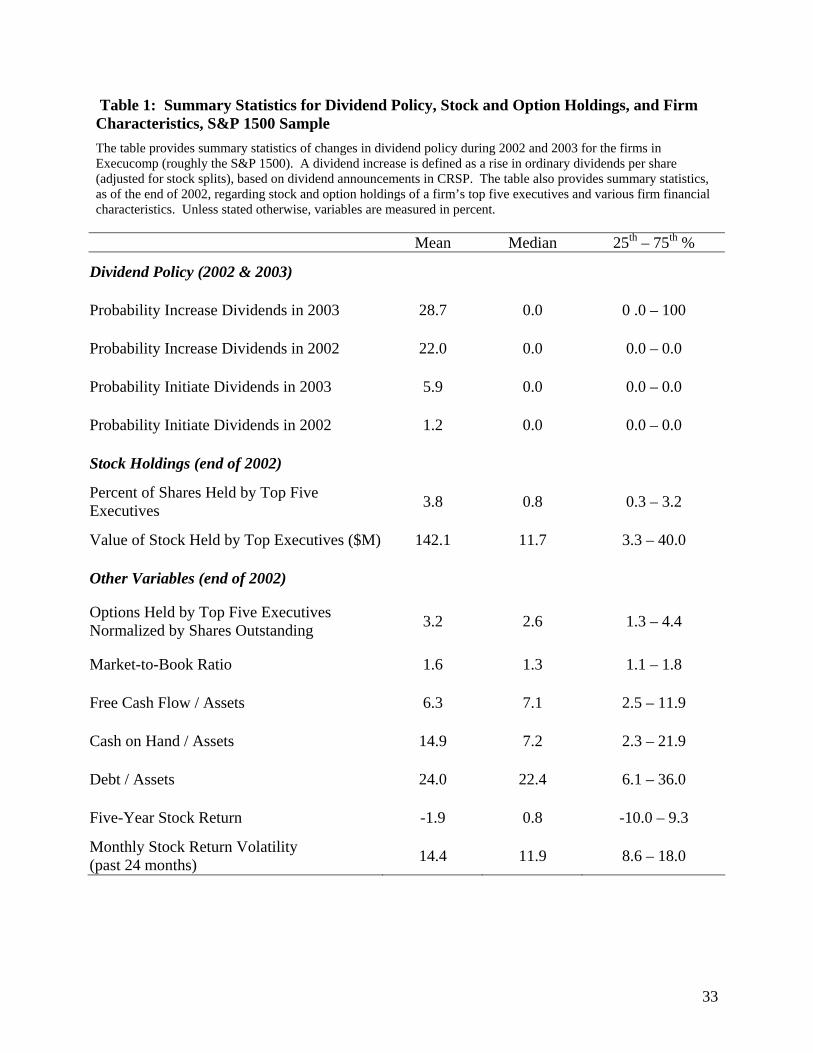
Table 1: Summary Statistics for Dividend Policy, Stock and Option Holdings, and Firm Characteristics, S&P 1500 Sample The table provides summary statistics of changes in dividend policy during 2002 and 2003 for the firms in Execucomp (roughly the S&P 1500). A dividend increase is defined as a rise in ordinary dividends per share (adjusted for stock splits), based on dividend announcements in CRSP. The table also provides summary statistics, as of the end of 2002, regarding stock and option holdings of a firm’s top five executives and various firm financial characteristics. Unless stated otherwise, variables are measured in percent.
Mean Median 25th – 75th %
Dividend Policy (2002 & 2003)
Probability Increase Dividends in 2003 28.7 0.0 0 .0 – 100
Probability Increase Dividends in 2002 22.0 0.0 0.0 – 0.0
Probability Initiate Dividends in 2003 5.9 0.0 0.0 – 0.0
Probability Initiate Dividends in 2002 1.2 0.0 0.0 – 0.0
Stock Holdings (end of 2002)
Percent of Shares Held by Top Five Executives 3.8 0.8 0.3 – 3.2
Value of Stock Held by Top Executives ($M) 142.1 11.7 3.3 – 40.0
Other Variables (end of 2002)
Options Held by Top Five Executives Normalized by Shares Outstanding 3.2 2.6 1.3 – 4.4
Market-to-Book Ratio 1.6 1.3 1.1 – 1.8
Free Cash Flow / Assets 6.3 7.1 2.5 – 11.9
Cash on Hand / Assets 14.9 7.2 2.3 – 21.9
Debt / Assets 24.0 22.4 6.1 – 36.0
Five-Year Stock Return -1.9 0.8 -10.0 – 9.3
Monthly Stock Return Volatility (past 24 months) 14.4 11.9 8.6 – 18.0
33

Table 2: Regression of Likelihood of Dividend Increase (in percent) on Executive Stock Holdings and Firm Characteristics, Comparison of 2003 with Earlier Years The table presents linear model (the left panel) and Probit model (the right panel) regressions of whether a firm increases dividends in 2003. A dividend increase is defined as a rise in ordinary dividends per share (adjusted for stock splits) based on dividend announcements in CRSP. Throughout the tables, the dependent variable is measured in percentage points, while the explanatory variables are expressed as raw ratios (i.e., not in percentage points), unless stated otherwise. Thus, the dependent variable in this table takes on values of either 0 (did not increase dividends) or 100 (did increase dividends). The likelihood of a dividend increase is related to the top five executive stock and options (both normalized by total firm shares outstanding) as well as the firm’s market-to-book ratio, free cash flow-to-assets (where free cash flow is defined as operating income before depreciation minus capital expenditures), cash on hand-to-assets, debt-to-assets (where debt is long-term debt), past five-year stock return, monthly stock volatility (based on the past 24 months), log of market value, firm age indicator variables (1-5, 6-10, 11-15, 16-20, and 21 or more years), and industry indicator variables. The top five executive stock and option variables are obtained from Execucomp, the firm financial characteristics are obtained from Compustat, and the past five-year stock return and monthly stock volatility are obtained from CRSP. The table presents regressions of whether a firm increases dividends in the 2003 (leftmost column of each panel), the 1993-2002 period pooled (middle column of each panel), and the difference between the coefficients over the two time periods (rightmost column of each panel). Specifically, a regression is estimated across the pooled sample 1993-2003, with an indicator variable for 2003 interacted with all the explanatory variables (interaction terms shown in far right column) to test whether the effect of a variable on the likelihood of a dividend increase is different in 2003 relative to earlier years (i.e., the period 1993-2002). Marginal effects evaluated at the sample mean are presented for the Probit model. The standard errors, given in parentheses, account for heteroskedasticity (i.e., robust standard errors), and, in the pooled regressions, correlation across observations of the same firm over time (i.e., clustering on firm).
34

Table 2: Regression of Likelihood of Dividend Increase (in percent) on Executive Stock Holdings and Firm Characteristics, Comparison of 2003 with Earlier Years (continued)
OLS Marginal Effects from Probit
Model 1993-2003
Sample Pooled 1993-2003
Sample Pooled
2003 1993- 2002
2003 relative to 1993-2002
2003 1993- 2002
2003 relative to 1993-2002
Fraction of Shares Held by Top Five Executives 54.0***
(15.5) 6.3
(8.5) 47.7***
(15.3) 57.4***
(15.7) 11.2 (9.6)
56.3***
(17.3)
Options Held by Top Five Executives Normalized by Shares Outstanding
-96.0**
(42.4) -103.0***
(25.7) 7.0
(42.4) -161.9***
(57.2) -171.8***
(44.6) -18.6 (67.3)
Market-to-Book Ratio 0.8 (1.5)
0.1 (0.5)
0.7 (1.4)
-6.1***
(1.9) -2.9***
(0.8) -4.3*
(2.3)
Free Cash Flow / Assets 11.2 (10.7)
22.6***
(6.8) -11.3 (10.2)
107.7***
(23.0) 96.0***
(10.2) 30.7
(29.4)
Cash on Hand / Assets -7.1 (6.9)
-13.5***
(5.2) 6.5
(7.0) -13.9
(8.8) -29.3***
(8.0) 12.9
(10.4)
Debt / Assets -8.7 (5.6)
-12.4***
(4.1) 3.6
(5.7) -14.5**
(6.8) -17.7***
(5.2) 0.6
(8.2)
Past Five-Year Stock Return 16.8**
(7.4) 15.1***
(3.5) 1.7
(7.6) 32.4***
(8.9) 38.2***
(4.5) -0.1
(11.0)
Monthly Stock Volatility -120.6***
(16.9) -121.8***
(12.1) 1.1
(18.4) -184.6***
(31.8) -262.8***
(23.7) 45.7
(44.8)
Log (Market Value) 4.2***
(0.9) 3.9***
(0.6) 0.3
(0.9) 4.3***
(0.9) 3.3***
(0.7) 1.7
(1.1)
p-value for joint test of significance of non-exec ownership coefficients 0.00*** 0.00*** 0.85 0.00*** 0.00*** 0.53
Firm Age and Industry Effects? Yes Yes Yes Yes
Adjusted R2 0.203
0.219 0.262 0.247
Number of Observations 1,356 12,618 1,356 12,618 ***, **, and * denote significance at the 1, 5, and 10 percent levels, respectively.
35

Table 3: Examination of Timing of Relation Between Executive Ownership and Dividend Increases and Initiations The table presents linear regressions of whether a firm increases dividends in 2003. A dividend increase is defined as a rise in ordinary dividends per share (adjusted for stock splits) based on dividend announcements in CRSP. These regressions are estimated over two pre-tax cut periods (1993-2002 pooled and 2002), the full 2003 year, the portion of 2003 prior to the signing of the dividend tax cut on May 23, and the portion of 2003 after the tax cut was signed (after May 23). The analysis is done separately for all firms (row 1), firms that did not pay dividends in the prior year and thus for whom a dividend increase represents an initiation (row 2), and firms that paid dividends in the prior year (rows 3 and 4). Throughout the tables, the dependent variable is measured in percentage points, while the explanatory variables are expressed as raw ratios (i.e., not in percentage points), unless stated otherwise. Thus, the dependent variable in this table takes on values of either 0 (did not increase dividends) or 100 (did increase dividends). Only the coefficients on the stock holdings of the top five executives (normalized by total firm shares outstanding) are reported. Other variables included in the regression, but not reported, are the stock options held by top executives, market-to-book ratio, free cash flow-to-assets, cash on hand-to-assets, debt-to-assets, past five-year stock return, monthly stock volatility, log of market value, and firm age and industry indicator variables (as in the table 2 regressions). The standard errors, given in parentheses, account for heteroskedasticity (i.e., robust standard errors), and, in the pooled regressions, correlation across observations of the same firm over time, i.e., clustering on firm.
Pre-2003 Dividend Tax Cut 2003
LHS Variable
1993 to 2002 (pooled) 2002 Full Year
Portion Prior to Tax Cut
Signed May 23
Portion After Tax Cut
Signed May 23
Probability Increase Dividends 6.3
(8.5) 7.1
(12.0) 54.0***
(15.5) 18.0
(12.1) 43.3***
(15.0)
Probability Initiate Dividends 6.2
(3.9) -3.6 (3.2)
37.8**
(15.6) 1.3
(4.2) 37.1**
(15.5)
Probability Increase Dividends given already pay dividends
13.3 (10.1)
36.0 (26.0)
72.6***
(22.0) 40.6
(25.3) 49.0*
(28.1)
Probability Increase Dividends at least 25% given already pay dividends
12.9***
(5.1) -1.3
(14.0) 64.9***
(22.7) 34.4
(22.5) 37.1*
(22.5)
***, **, and * denote significance at the 1, 5, and 10 percent levels, respectively.
36
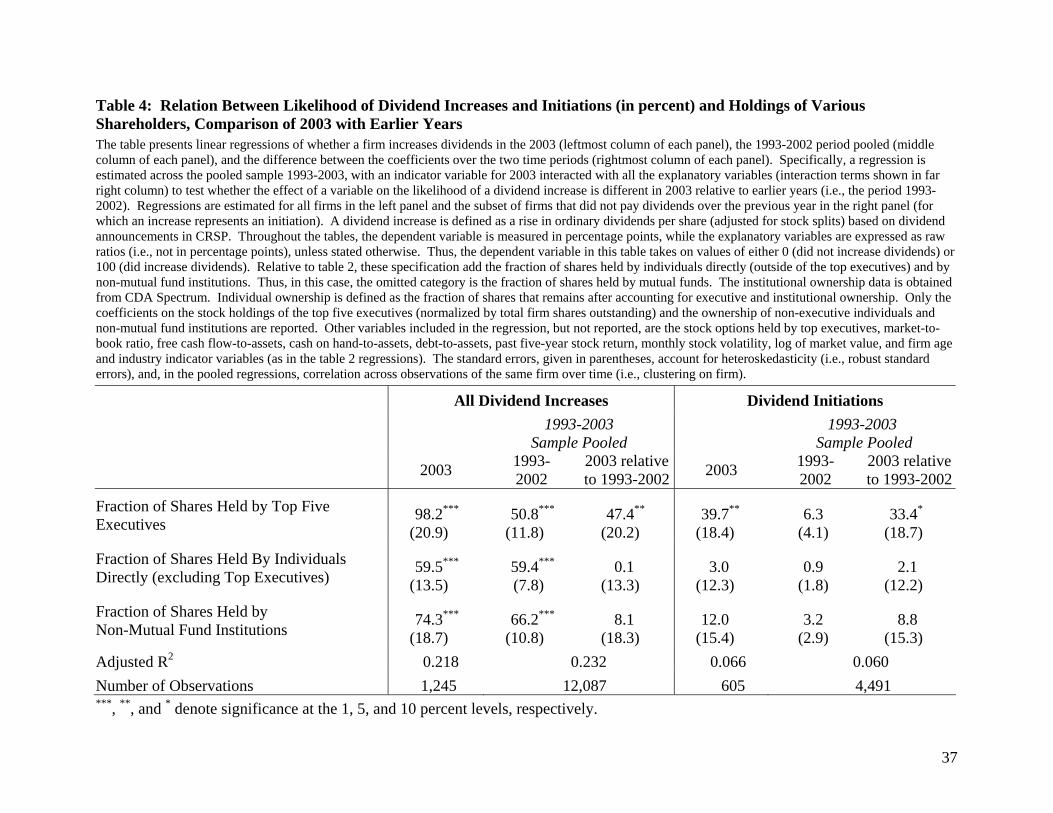
Table 4: Relation Between Likelihood of Dividend Increases and Initiations (in percent) and Holdings of Various Shareholders, Comparison of 2003 with Earlier Years The table presents linear regressions of whether a firm increases dividends in the 2003 (leftmost column of each panel), the 1993-2002 period pooled (middle column of each panel), and the difference between the coefficients over the two time periods (rightmost column of each panel). Specifically, a regression is estimated across the pooled sample 1993-2003, with an indicator variable for 2003 interacted with all the explanatory variables (interaction terms shown in far right column) to test whether the effect of a variable on the likelihood of a dividend increase is different in 2003 relative to earlier years (i.e., the period 1993-2002). Regressions are estimated for all firms in the left panel and the subset of firms that did not pay dividends over the previous year in the right panel (for which an increase represents an initiation). A dividend increase is defined as a rise in ordinary dividends per share (adjusted for stock splits) based on dividend announcements in CRSP. Throughout the tables, the dependent variable is measured in percentage points, while the explanatory variables are expressed as raw ratios (i.e., not in percentage points), unless stated otherwise. Thus, the dependent variable in this table takes on values of either 0 (did not increase dividends) or 100 (did increase dividends). Relative to table 2, these specification add the fraction of shares held by individuals directly (outside of the top executives) and by non-mutual fund institutions. Thus, in this case, the omitted category is the fraction of shares held by mutual funds. The institutional ownership data is obtained from CDA Spectrum. Individual ownership is defined as the fraction of shares that remains after accounting for executive and institutional ownership. Only the coefficients on the stock holdings of the top five executives (normalized by total firm shares outstanding) and the ownership of non-executive individuals and non-mutual fund institutions are reported. Other variables included in the regression, but not reported, are the stock options held by top executives, market-to-book ratio, free cash flow-to-assets, cash on hand-to-assets, debt-to-assets, past five-year stock return, monthly stock volatility, log of market value, and firm age and industry indicator variables (as in the table 2 regressions). The standard errors, given in parentheses, account for heteroskedasticity (i.e., robust standard errors), and, in the pooled regressions, correlation across observations of the same firm over time (i.e., clustering on firm).
All Dividend Increases Dividend Initiations 1993-2003
Sample Pooled 1993-2003 Sample Pooled
2003 1993- 2002
2003 relative to 1993-2002 2003 1993-
2002 2003 relative to 1993-2002
Fraction of Shares Held by Top Five Executives 98.2***
(20.9) 50.8***
(11.8) 47.4**
(20.2) 39.7**
(18.4) 6.3
(4.1) 33.4*
(18.7)
Fraction of Shares Held By Individuals Directly (excluding Top Executives) 59.5***
(13.5) 59.4***
(7.8) 0.1
(13.3) 3.0
(12.3) 0.9
(1.8) 2.1
(12.2)
Fraction of Shares Held by Non-Mutual Fund Institutions 74.3***
(18.7) 66.2***
(10.8) 8.1
(18.3) 12.0
(15.4) 3.2
(2.9) 8.8
(15.3)
Adjusted R2 0.218 0.232 0.066 0.060 Number of Observations 1,245 12,087 605 4,491 ***, **, and * denote significance at the 1, 5, and 10 percent levels, respectively.
37
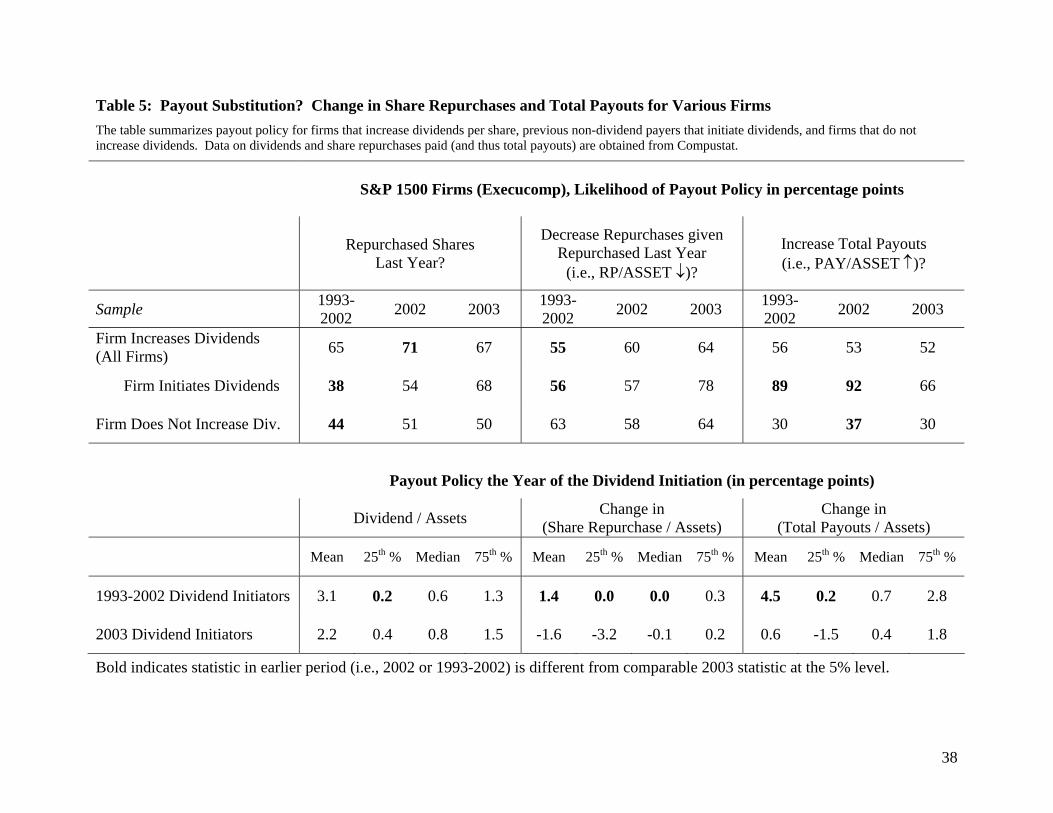
Table 5: Payout Substitution? Change in Share Repurchases and Total Payouts for Various Firms The table summarizes payout policy for firms that increase dividends per share, previous non-dividend payers that initiate dividends, and firms that do not increase dividends. Data on dividends and share repurchases paid (and thus total payouts) are obtained from Compustat.
S&P 1500 Firms (Execucomp), Likelihood of Payout Policy in percentage points
Repurchased Shares Last Year?
Decrease Repurchases given Repurchased Last Year
(i.e., RP/ASSET ↓)?
Increase Total Payouts (i.e., PAY/ASSET ↑)?
Sample 1993-2002 2002 2003 1993-
2002 2002 2003 1993-2002 2002 2003
Firm Increases Dividends (All Firms) 65 71 67 55 60 64 56 53 52
Firm Initiates Dividends 38 54 68 56 57 78 89 92 66
Firm Does Not Increase Div. 44 51 50 63 58 64 30 37 30
Payout Policy the Year of the Dividend Initiation (in percentage points)
Dividend / Assets Change in (Share Repurchase / Assets)
Change in (Total Payouts / Assets)
Mean 25th % Median 75th % Mean 25th % Median 75th % Mean 25th % Median 75th %
1993-2002 Dividend Initiators 3.1 0.2 0.6 1.3 1.4 0.0 0.0 0.3 4.5 0.2 0.7 2.8
2003 Dividend Initiators 2.2 0.4 0.8 1.5 -1.6 -3.2 -0.1 0.2 0.6 -1.5 0.4 1.8
Bold indicates statistic in earlier period (i.e., 2002 or 1993-2002) is different from comparable 2003 statistic at the 5% level.
38
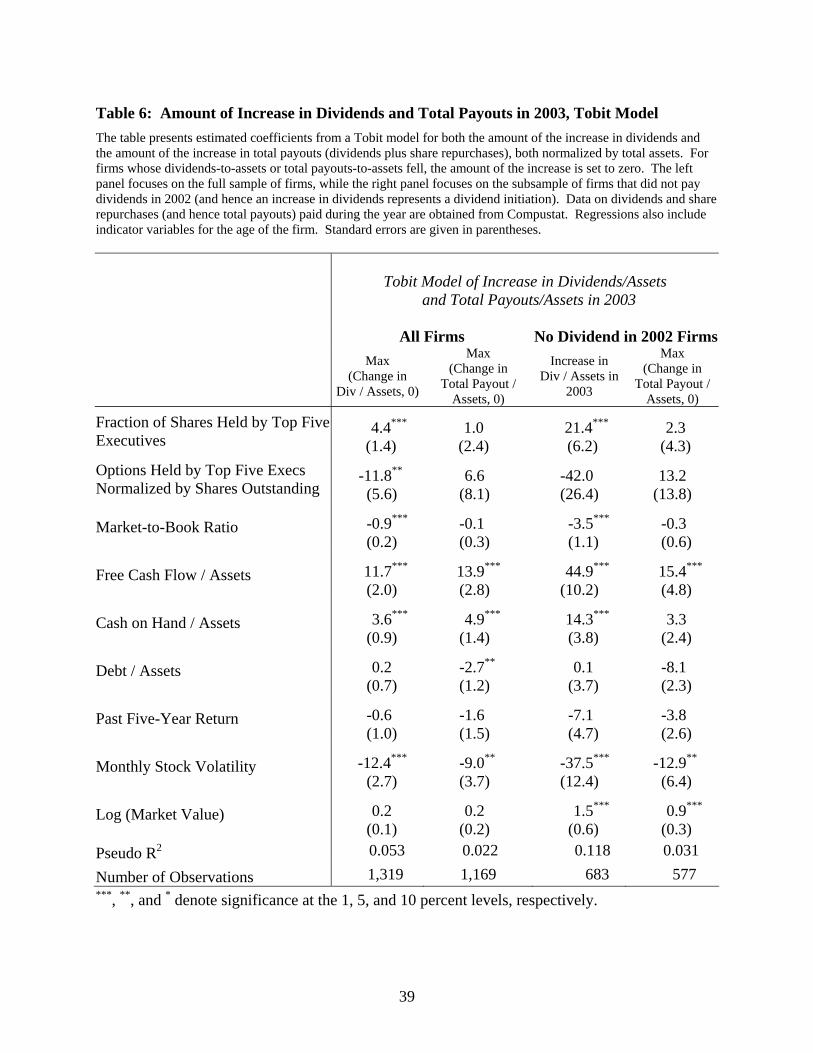
Table 6: Amount of Increase in Dividends and Total Payouts in 2003, Tobit Model The table presents estimated coefficients from a Tobit model for both the amount of the increase in dividends and the amount of the increase in total payouts (dividends plus share repurchases), both normalized by total assets. For firms whose dividends-to-assets or total payouts-to-assets fell, the amount of the increase is set to zero. The left panel focuses on the full sample of firms, while the right panel focuses on the subsample of firms that did not pay dividends in 2002 (and hence an increase in dividends represents a dividend initiation). Data on dividends and share repurchases (and hence total payouts) paid during the year are obtained from Compustat. Regressions also include indicator variables for the age of the firm. Standard errors are given in parentheses.
Tobit Model of Increase in Dividends/Assets and Total Payouts/Assets in 2003
All Firms No Dividend in 2002 Firms
Max (Change in
Div / Assets, 0)
Max (Change in
Total Payout / Assets, 0)
Increase in Div / Assets in
2003
Max (Change in
Total Payout / Assets, 0)
Fraction of Shares Held by Top Five Executives
4.4***
(1.4) 1.0
(2.4) 21.4***
(6.2) 2.3
(4.3)
Options Held by Top Five Execs Normalized by Shares Outstanding
-11.8**
(5.6) 6.6
(8.1) -42.0 (26.4)
13.2 (13.8)
Market-to-Book Ratio -0.9***
(0.2) -0.1 (0.3)
-3.5***
(1.1) -0.3 (0.6)
Free Cash Flow / Assets 11.7***
(2.0) 13.9***
(2.8) 44.9***
(10.2) 15.4***
(4.8)
Cash on Hand / Assets 3.6***
(0.9) 4.9***
(1.4) 14.3***
(3.8) 3.3
(2.4)
Debt / Assets 0.2 (0.7)
-2.7**
(1.2) 0.1
(3.7) -8.1 (2.3)
Past Five-Year Return -0.6 (1.0)
-1.6 (1.5)
-7.1 (4.7)
-3.8 (2.6)
Monthly Stock Volatility -12.4***
(2.7) -9.0**
(3.7) -37.5***
(12.4) -12.9**
(6.4)
Log (Market Value) 0.2 (0.1)
0.2 (0.2)
1.5***
(0.6) 0.9***
(0.3) Pseudo R2 0.053 0.022 0.118 0.031
Number of Observations 1,319 1,169 683 577 ***, **, and * denote significance at the 1, 5, and 10 percent levels, respectively.
39
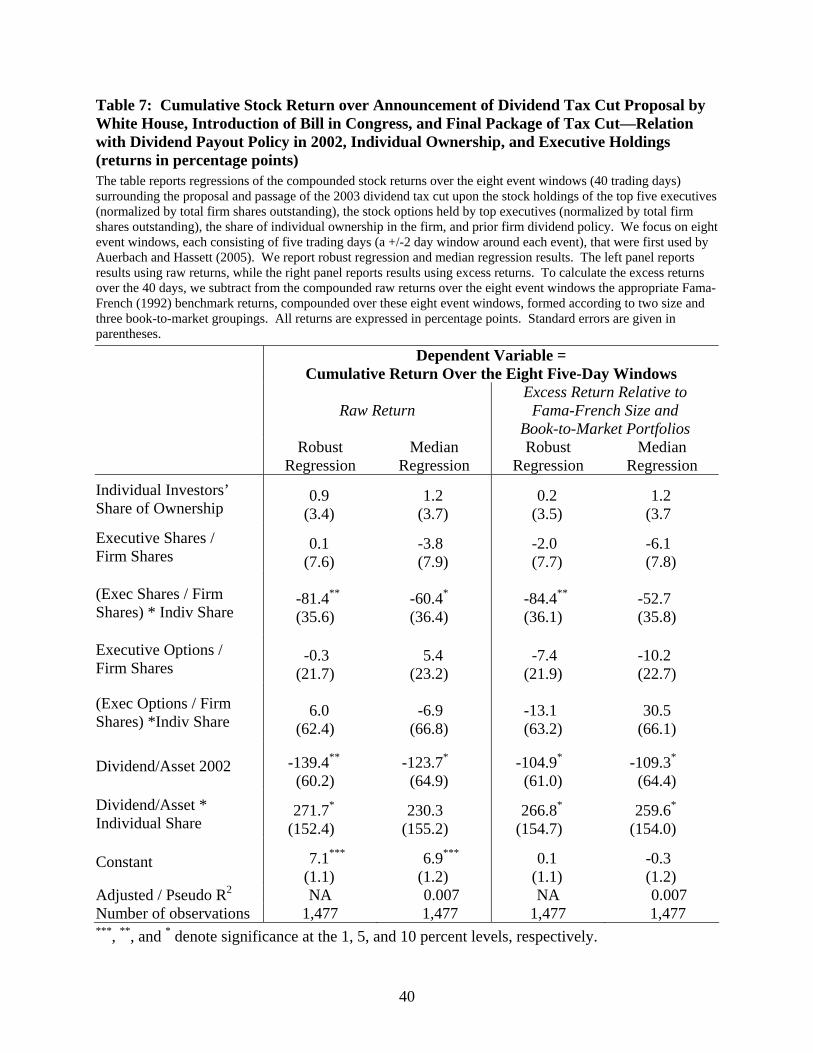
Table 7: Cumulative Stock Return over Announcement of Dividend Tax Cut Proposal by White House, Introduction of Bill in Congress, and Final Package of Tax Cut—Relation with Dividend Payout Policy in 2002, Individual Ownership, and Executive Holdings (returns in percentage points) The table reports regressions of the compounded stock returns over the eight event windows (40 trading days) surrounding the proposal and passage of the 2003 dividend tax cut upon the stock holdings of the top five executives (normalized by total firm shares outstanding), the stock options held by top executives (normalized by total firm shares outstanding), the share of individual ownership in the firm, and prior firm dividend policy. We focus on eight event windows, each consisting of five trading days (a +/-2 day window around each event), that were first used by Auerbach and Hassett (2005). We report robust regression and median regression results. The left panel reports results using raw returns, while the right panel reports results using excess returns. To calculate the excess returns over the 40 days, we subtract from the compounded raw returns over the eight event windows the appropriate Fama-French (1992) benchmark returns, compounded over these eight event windows, formed according to two size and three book-to-market groupings. All returns are expressed in percentage points. Standard errors are given in parentheses.
Dependent Variable = Cumulative Return Over the Eight Five-Day Windows
Raw Return
Excess Return Relative to Fama-French Size and
Book-to-Market Portfolios
Robust Regression
Median Regression
Robust Regression
Median Regression
Individual Investors’ Share of Ownership
0.9 (3.4)
1.2 (3.7)
0.2 (3.5)
1.2 (3.7
Executive Shares / Firm Shares
0.1 (7.6)
-3.8 (7.9)
-2.0 (7.7)
-6.1 (7.8)
(Exec Shares / Firm Shares) * Indiv Share
-81.4**
(35.6)
-60.4*
(36.4)
-84.4**
(36.1)
-52.7 (35.8)
Executive Options / Firm Shares
-0.3 (21.7)
5.4 (23.2)
-7.4 (21.9)
-10.2 (22.7)
(Exec Options / Firm Shares) *Indiv Share
6.0
(62.4)
-6.9
(66.8)
-13.1 (63.2)
30.5
(66.1)
Dividend/Asset 2002 -139.4**
(60.2) -123.7*
(64.9) -104.9*
(61.0) -109.3*
(64.4)
Dividend/Asset * Individual Share
271.7*
(152.4) 230.3
(155.2) 266.8*
(154.7) 259.6*
(154.0)
Constant 7.1***
(1.1) 6.9***
(1.2) 0.1
(1.1) -0.3 (1.2)
Adjusted / Pseudo R2 NA 0.007 NA 0.007 Number of observations 1,477 1,477 1,477 1,477 ***, **, and * denote significance at the 1, 5, and 10 percent levels, respectively.
40