Embed Size (px)
Citation preview

University of RedlandsInSPIRe @ Redlands
Undergraduate Honors Theses Theses, Dissertations, and Honors Projects
2015
Corporate Payout Policy: The Prevalence of StockRepurchase Programs and Earnings Per ShareGram W. LeahyUniversity of Redlands
Follow this and additional works at: https://inspire.redlands.edu/cas_honors
Part of the Accounting Commons, and the Corporate Finance Commons
This work is licensed under a Creative Commons Attribution-Noncommercial 4.0 LicenseThis material may be protected by copyright law (Title 17 U.S. Code).This Open Access is brought to you for free and open access by the Theses, Dissertations, and Honors Projects at InSPIRe @ Redlands. It has beenaccepted for inclusion in Undergraduate Honors Theses by an authorized administrator of InSPIRe @ Redlands. For more information, please [email protected].
Recommended CitationLeahy, G. W. (2015). Corporate Payout Policy: The Prevalence of Stock Repurchase Programs and Earnings Per Share (Undergraduatehonors thesis, University of Redlands). Retrieved from https://inspire.redlands.edu/cas_honors/86
brought to you by COREView metadata, citation and similar papers at core.ac.uk
provided by University of Redlands

!! !Corporate Payout Policy:
The Prevalence of Stock Repurchase Programs and Earnings Per Share !!!!!!Honors Thesis !!!!!!
Gram W. Leahy !!!!
University of Redlands !Bachelors of Science in Accounting !
Spring 2015 !!!!!!!!!Honors Committee Members
Alex Frazin - Chair Laurie Mitchell
Michael MacQueen

Leahy !2
Table of Contents !Chapter 1: Thesis & Background 1. Abstract 2. Introduction & Thesis 3. Key Terms, Ratios Explained 4. Hypotheses !Chapter 2: Authoritative Literature 1. FASB ASC 260: Earnings Per Share 2. SEC Rule 10b-18 !Chapter 3: Prior Research 1. Textbook 2. Earnings Per Share 3. History 4. Prior Scholarly Research Chapter 4: Original Research 1. Stock Repurchases: Earnings Management Device 2. Repurchase Program Excerpts 3. Dilutive Example 4. Data Analysis 5. Data Discrepancies Dissected Chapter 5: Analysis Matrix 1. Enterprise 2. User 3. Auditor Chapter 6: Conclusion 1. Hypotheses Compilation 2. Final Conclusion !Chapter 7: Areas of Further Study Bibliography !Appendix - Data Spreadsheets !!!

Leahy !3
!Chapter 1: Thesis & Background !
1.1 Abstract: ! The goal of this research is to determine the nature of stock repurchase programs and
their susceptibility to manipulation. Through the analysis of five companies known to implement
buybacks (Walmart, Pfizer, Boeing, Wells Fargo, Microsoft) in five different industries, for
multiple years, the research will include examination of specific variables to attempt to
understand the underlying reasons for repurchase programs; what really is taking place when
companies buy back their own shares, especially because the motives can vary drastically. As
earnings per share is the most widely followed valuation, there is concern that it is not the most
accurate for use to compare two (or more) companies when it is susceptible to internal
manipulation.
The significance of this research to the field of accounting is fairly straightforward. The
goal is to isolate and quantify the effects of repurchase programs and provide an alternative to
the Earnings Per Share ratio for the analysis of companies by investors, in hopes of creating a
ratio that manages to stabilize the denominator of the EPS ratio (average shares outstanding),
making it unsusceptible to repurchase manipulation.
!1.2 Introduction & Thesis:
An increasingly popular investing trend among public companies has resulted in the
massive repurchase of their own stock. These repurchases occur when the company buys back its
own “common” stock, reducing their total number of shares outstanding and increasing the
amount of “treasury stock” available; a move often made to either keep a controlling interest in

Leahy !4
the company, prevent a hostile takeover, or to be used to create extra cash if need be. Buybacks
take place for various reasons and regardless of the intent they can have a significant impact on
the financial statement analysis. When done appropriately, such investments can greatly benefit
the remaining stockholders. Investment expert Warren Buffet explains such a scenario: “when
companies with outstanding businesses and comfortable financial positions find their shares
selling far below intrinsic value in the marketplace, no alternative action can benefit shareholders
as surely as repurchases” . The most common reasoning behind repurchases revolves around 1
maximizing shareholder value, a definite goal of the same board of directors that decides to
implement the repurchase program in the first place. Buybacks help maximize shareholder value
through reducing the total number of shares outstanding, increasing the percentage of ownership
each remaining shareholder owns in the company and entitling them to more of the company’s
earnings.
One ratio directly affected by stock repurchases is earnings per share (EPS). One of the
most carefully followed metrics in investing, EPS represents the portion of a company’s profit
allocated to each outstanding share of common stock . Serving as an indicator of profitability, the 2
ratio is calculated as such:
Net Income - Preferred Stock Dividends
Weighted Average Common Shares Outstanding
Warren Buffett. “http://www.valueinvestingworld.com/2012/09/warren-buffett-on-share-repurchases.html"1
Spiceland, J. David, James F. Sepe, and Mark Nelson. Intermediate Accounting. New York: 2
McGraw-Hill Irwin, 2011. Print.

Leahy !5
It is widely considered the focal ratio, the single most important ratio in determining a share’s
price . By repurchasing their own stock, a company can reduce the denominator- the number of 3
shares outstanding- without affecting net income. David Henry emphasizes the importance
placed on earnings per share, the “most widely followed measure of profit growth, which rises as
share counts drop. The math is simple: The fewer the shares, the greater the earnings per share
(EPS), assuming total profit, or net income, stays the same. Huge share-count reductions can
juice EPS growth -- but some investors might not think to check both the net and per-share
figures” . Earnings per share is a ratio that attempts to summarize the performance of business 4
enterprises into a single number. However, one such standalone number is not alway entirely
transparent when repurchases are present due to the susceptibility of the ratio itself. Investors can
be mislead, whether intentionally or not, due to the results of buybacks that manipulate important
ratios, specifically earnings per share. With the increasing frequency with which companies are
implementing share repurchase programs, the importance placed upon the earnings per share
ratio, and that ratio’s mathematical susceptibility to alteration, the reported earnings per share
growth may not be as transparent as perceived.
!!!
“Earnings Per Share.” Investopedia. N.p., 19 Nov. 2003. Web. 16 Feb. 2015. !3
<http://www.investopedia.com/terms/a/earningspershare.asp>.
Henry, David. “The Dirty Little Secret About Buybacks”. Bloomberg Businessweek Magazine. 4
22 January 2006

Leahy !6
!1.3 Key Terms, Ratios Explained
Shares Authorized: The maximum number of shares that a corporation is legally permitted to issue, as specified in its articles of incorporation . 5
Shares Outstanding: A company’s stock currently held by all its shareholders, including share blocks held by institutional investors and restricted shares owned by the company’s officers and insiders . Shares outstanding may fluctuate widely; they can be increased through the issuance of 6
additional shares or the exercising of employee stock options, up to the maximum number of shares authorized.
Common Stock: A security that represents ownership in a corporation. Holders of common stock exercise control by electing a board of directors and voting on corporate policy . 7
Preferred Stock: A class of ownership in a corporation that has a higher claim on assets and earnings than common stock. Preferred stock generally has a dividend that must be paid out before dividends to common shareholders and the shares usually do not have voting rights . 8
Retired Stock: Shares that reassume the same original status as being authorized but unissued, just as if they had never been issued . 9
Treasury Stock: Shares repurchased but not retired. They maintain their issued status but are not available to the public and instead kept in the company “treasury”. They have no voting rights and do not receive cash dividends . 10
"Authorized Stock.” Investopedia. N.p., 19 Nov. 2003. Web. 16 Feb. 2015. !5
<http://www.investopedia.com/terms/a/authorizedstock.asp>.
"Outstanding Shares." Investopedia. N.p., 24 Nov. 2003. Web. 16 Feb. 2015. !6
<http://www.investopedia.com/terms/o/outstandingshares.asp>.
"Common Stock." Investopedia. N.p., 19 Nov. 2003. Web. 15 Feb. 2015.!7
<http://www.investopedia.com/terms/c/commonstock.asp>.
"Preferred Stock." Investopedia. N.p., 25 Nov. 2003. Web. 16 Feb. 2015. !8
<http://www.investopedia.com/terms/p/preferredstock.asp>.
Spiceland, J. David, James F. Sepe, and Mark Nelson. Intermediate Accounting. New York: 9
McGraw-Hill Irwin, 2011. Print.
Ibid10

Leahy !7
Potential Common Stock: A security or other contract that may entitle its holder to obtain common stock during the reporting period or after the reporting period . 11
Weighted-Average Common Shares Outstanding: the arithmetical mean average of shares outstanding and assumed to be outstanding for EPS computations. The most precise average would be the sum of the shares determined on a daily basis divided by the number of days in the period. Less- precise averaging methods may be used, however, as long as they produce reasonable results . 12
Earning Per Share (EPS): The single accounting number that receives the most attention from the media, creditors, and investors; a ratio that attempts to summarize the performance of business enterprises into a single number . EPS represents the amount of earnings allocable to each 13
outstanding share common stock. Sometimes referred to as “basic EPS,” it is calculated by dividing a firm’s net income (loss) minus dividends to preferred shareholders by the weighted average number of shares of common stock outstanding throughout the year.
Diluted Earnings Per Share: A similar calculation to basic EPS, diluted EPS takes convertible/exercisable securities into account that could potentially reduce earnings. For example, convertible bonds or stock options that become exercised increase the total number of shares outstanding, reducing the amount of earnings allocated to each individual share of common stock. Diluted EPS is calculated by dividing income available to common shareholders + the effect of assumed conversions by the weighted number of shares outstanding + dilutive potential shares . 14
1.4 Hypotheses
There are a wide variety of reasons for implementing a stock repurchase program. The
following is a compiled list, created at the advent of this project, that consists of potential
motivations for implementing and executing such a program.
“Financial Reporting Developments - Earnings Per Share. FASB ASC 260”. Ernst & Young. 20 11
May 2014
https://law.resource.org/pub/us/code/bean/fasb.html/fasb.260.2011.html (same as above 12
technically)
Ibid13
Ibid14

Leahy !8
!1. Earnings Per Share “Inflation”
2. Inadequate Disclosures
3. Substitution Hypothesis
4. Anti - Dilutive Purpose
These hypotheses will be independently addressed in the conclusion upon explanation of
the final verdict regarding corporate payout policy.
Hypothesis 1: Earnings Per Share “Inflation”
Earnings Per Share increases are driven by more than just increases in net income. The
Accounting Standards Codification 260 - Earnings Per Share (to be covered in detail in Chapter
2) states that “the objective of EPS is to measure the performance of an entity over the reporting
period ”. Emphasizing the idea of “measuring performance”, in comparing the two ways 15
earnings per share can increase, “performance” undoubtedly refers to a net income figure as
opposed to the act of share count reduction. Net income reflects company performance, the act of
reducing share counts does not.
Hypothesis 2: Inadequate Disclosures
The source of earnings per share increases -repurchase programs - are not being
adequately disclosed in the financial statements. As a result, investors are unaware of these
“mathematical” increases and are thus making not entirely correctly informed investing
decisions.
“Financial Reporting Developments - Earnings Per Share”. FASB ASC 260”. Ernst & Young. 15
20 May 2014

Leahy !9
Hypothesis 3: Substitution Hypothesis
The substitution hypothesis is based on the theory that in regards to corporate payout
policy, dividends and stock repurchases are interchangeable; perfect substitutes, where either can
be implemented to achieve the same desired outcome. Through one study, Harvard business
professor John Lintner determined that there is a negative correlation between dividend forecasts
and the amount spent on repurchases- the difference between actual and expected dividends
becomes increasingly negative as more cash is spent on stock repurchases. Other experts argue
the opposite of this hypothesis. These advocates of the contrary state that dividends are tied to
permanent, established earnings and repurchases are funded with additional, temporary earnings.
Additional contrarians argue that repurchases are simply used to offset reductions in earnings.
Hypothesis 4 - Anti-Dilutive Purposes
Repurchase programs are being implemented to offset the yearly number of shares issued
and exercised as to maintain a general share count. The existence of this fact could be for several
reasons: the company has a general idea of the number of shares they want to have outstanding at
any given time, they want to attempt to maintain ownership percentages, or they might want to
keep a certain amount of treasury stock on hand for employee stock options.
!Chapter 2: Authoritative Literature
There are two major pronouncements that exist regarding the disclosure and
documentation of share repurchases and earnings per share figures. The United States Securities

Leahy !10
and Exchange Commission and Financial Accounting Standards Board, respectively, have issued
these statements in order to achieve a desired level of transparency, addressing regulations that
attempt to standardize such reporting.
2.1 Financial Accounting Standards Board - Accounting Standards Codification 260:
Earnings Per Share (FASB ASC 260)
The FASB Accounting Standards Codification is the source of authoritative generally
accepted accounting principles (GAAP) recognized by the FASB to be applied to
nongovernmental entities . The Codification is effective for interim and annual periods ending 16
after September 15, 2009.
The following information is taken directly from the 2011 issuance of the FASB ASC
260. ASC 260 provides guidance on the computation, presentation, and disclosure requirements
for earnings per share (EPS) for entities with publicly held common stock or potential common
stock (that is, securities such as options, warrants, convertible securities, or contingent stock
agreements) if those securities trade in a public market either on a stock exchange (domestic or
foreign) or in the over-the-counter market, including securities quoted locally or regionally . 17
FASB ASC 260 states that the objective of EPS is to measure the performance of an entity over
the reporting period . Furthermore, entities with simple capital structures (no outstanding 18
“FASB Accounting Standards Codification: About the Codification”. The Financial Accounting 16
Standards Board. January 2014. https://asc.fasb.org/imageRoot/47/49128947.pdf
"ASC 260 - Earnings Per Share." Deloitte - US GAAP Plus. Deloitte, n.d. Web. 11 Jan. 2015. 17
<http://www.iasplus.com/en-us/standards/fasb/presentation/asc260>.
Financial Reporting Developments - Earnings Per Share. FASB ASC 260”. Ernst & Young. 20 18
May 2014

Leahy !11
securities that could potentially dilute EPS), shall present basic per-share amounts for income
from continuing operations and for net income on the face of the income statement . All other 19
entities shall present basic and diluted per-share amounts for income from continuing operations
and for net income on the face of the income statement with equal prominence . EPS data shall 20
be presented for all periods for which an income statement or summary of earnings is
presented . If diluted EPS data are reported for at least one period, they shall be reported for all 21
periods presented, even if they are the same amounts as basic EPS . Shares issued during the 22
period and shares reacquired during the period shall be weighted for the portion of the period that
they were outstanding . 23
In regards to disclosure, ASC 260 states that for each period for which an income
statement is presented, an entity shall disclose all of the following: “
a. A reconciliation of the numerators and the denominators of the basic and diluted per-
share computations for income from continuing operations. The reconciliation shall
include the individual income and share amount effects of all securities that affect
earnings per share…an entity is encouraged to refer to pertinent information about
securities included in the EPS computations that is provided elsewhere in the financial
statements.
“FASB Accounting Standards Codification: About the Codification”.The Financial Accounting 19
Standards Board. January 2014. https://asc.fasb.org/imageRoot/47/49128947.pdf
Ibid20
Ibid21
Ibid22
Ibid23

Leahy !12
b. The effect that has been given to preferred dividends in arriving at income available to
common stockholders in computing basic EPS
c. Securities (including those issuable pursuant to contingent stock agreements) that could
potentially dilute basic EPS in the future that were not included in the computation of
diluted EPS because to do so would have been antidilutive for the period(s) presented.
Full disclosure of the terms and conditions of these securities is required even if a
security is not included in diluted EPS in the current period” . 24
For the latest period for which an income statement is presented, an entity shall provide a
description of any transaction that occurs after the end of the most recent period but before the
financial statements are issued or are available to be issued that would have changed materially
the number of common shares or potential common shares outstanding at the end of the period if
the transaction had occurred before the end of the period . Examples of those transactions 25
include the issuance of common shares; the issuance of warrants, options, or convertible
securities, the resolution of a contingency pursuant to a contingent stock agreement; and the
conversion or exercise of potential common shares outstanding at the end of the period into
common shares . 26
If the number of common shares outstanding increases as a result of a stock dividend or
stock split or decreases as a result of a reverse stock split, the computations of basic and diluted
Ibid24
Ibid25
Ibid26

Leahy !13
EPS shall be adjusted retroactively for all periods presented to reflect the change in capital
structure . 27
FASB ASC 260 mandates that: “if authoritative literature requires that a restatement of
the results of operations of a prior period be included in the income statement or summary of
earnings, then EPS data given for the prior periods shall be restated. The effect of the
restatement, expressed in per-share terms, shall be disclosed in the period of restatement…it is
possible that common stock assumed to be issued upon exercise, conversion, or issuance of
potential common shares may not be included in the computation of restated EPS amounts” . 28
2.2 Securities and Exchange Commission Amendment: Rule 10b-18; Final Ruling:
Purchases of Certain Equity Securities by the Issuer and Others
The United States Securities and Exchange Commission (SEC) is an agency of the
United States federal government. They are primarily responsible for enforcing federal securities
laws, proposing securities rules, and regulating the securities industry, the nation’s stock and
options exchanges, and other activities and organizations, including the electronic securities
markets in the United States with a focus on protecting investors, maintaining fair, orderly, and
efficient markets, and facilitating capital formation . Rule 10b-18 is an SEC rule that provides a 29
“safe harbor” for companies and their affiliated purchasers when the company or affiliates
Ibid27
Ibid28
“The Investors Advocate: How the SEC Protects Investors, Maintains Market Integrity, and 29
Facilitates Capital Formation”. The Securities and Exchange Commission. 10 June 2013. http://www.sec.gov/about/whatwedo.shtml#.VOLDPCmGs20

Leahy !14
repurchase the company’s shares of common stock in order to enable them to perform such
repurchases without violating anti-fraud provisions of the Securities Exchange Act of 1934 . 30
The following is an outline of the four conditions required to meet Rule 10b-18: “
1. Manner of Purchase Condition: the issuer must use a single broker or dealer per day to
bid for or purchase its common stock, applicable only however to purchases solicited by
the issuer.
2. Timing Condition: purchases excluded from the safe harbor condition include
purchases made during the opening and ending half hour of trading because market
activity at such times is considered to be a significant indicator of the direction of trading,
strength of demand, and the current market value of the security.
3. Price Condition: the highest price an issuer may bid or pay for its common stock may
not exceed the highest independent bid or last transaction price quoted.
4. Volume Condition: an issuer may effect daily purchases in an amount up to 25% of the
average daily trading volume in its shares, not including block purchases” . 31
!!
"Rule 10b-18." Investopedia. N.p., 10 Sept. 2006. Web. 16 Feb. 2015. !30
<http://www.investopedia.com/terms/r/rule10b18.asp>.
"Final Rule 10b-18: Purchases of Certain Equity Securities by the Issuer and Others." 31
Sec.gov. The United States Securities and Exchange Commission, n.d. Web. 17 Feb. 2015. <http://www.sec.gov/rules/final/33-8335.htm>.

Leahy !15
Chapter 3: Prior Research
3.1 Background Textbook Research
A stock buyback can take place in two ways: through a tender offer, or over the open
market. A tender offer provides current shareholders with the option to sell back their shares at a
premium, whereas a company would act as a regular investor when purchasing over the open
market. Logically, a company would purchase the stock on the open market if at all possible. In
either instance, the SEC requires details about the repurchase that include the manner, timing,
price, and volume of the stock reacquired . Furthermore, specific disclosures must be included 32
on the 10-Q (Quarterly Report) and 10-K (Yearly Report) reports where the company must
“provide a table showing, on a month-by- month basis: the total number of shares purchased, the
average price paid per share, the total number of shares purchased under publicly announced
repurchase programs, and the maximum number of shares that may be repurchased under these
programs (or maximum dollar amount if the limit is stated in those terms)” . 33
The effects of a repurchase, depending on the magnitude, can have a significant impact
on ratios such as earnings per share. The main reason results from the decrease in shares
outstanding, as well as cash. Upon repurchase, the stocks now remain in the company treasury,
reducing the total number of available shares outstanding. Earnings per share will increase, as the
denominator (weighted average common shares outstanding) decreases.A signifier of this
“manipulation” is comparing the growth of net income and earnings per share. One example is
The Investors Advocate: How the SEC Protects Investors, Maintains Market Integrity, and 32
Facilitates Capital Formation”. The Securities and Exchange Commission. 10 June 2013. http://www.sec.gov/about/whatwedo.shtml#.VOLDPCmGs20
Ibid33

Leahy !16
the net income of companies Dell and Cisco. David Henry explains: “both cut their share counts
sharply -- and as a result, their EPS grew much faster than than their net income...Dell’s EPS
grew 18%, while its net income grew 12%; Cisco's EPS grew 19%, while its net income grew
just 8%” . Earnings per share outpacing net income alerts investors that something does not 34
make sense. Without proper comparison and understanding, EPS might inaccurately reflect the
value of the stock. However, with adequate disclosures it is the duty of the shareholder to
understand the substance of the transaction beyond the change in ratios.
In reference to the earnings per share ratio, diminishing the number of outstanding shares
can create problems in evaluating a company's performance, especially transparency between
years. For example, Maury Randall mentions that, “in order to offset that reduction in earnings
companies have not surprisingly sought ways (such as stock buybacks) to reduce their share
counts and boost earnings” . One hypothetical scenario could result in an EPS value that shows 35
an increase from one year to the next while net income has remained stagnant, or even decreased.
Additionally, it is not uncommon for executives to believe that their stock is undervalued, a not
uncommon bias in the professional world . Implementing a share repurchase in this scenario 36
attempts to signal optimism regarding their stock price to investors. The board of directors can
also manipulate the use of buybacks for their own personal benefit, as the structure of many
executive’s compensation exists in the form of stock options. This provides incentive to
“Division of Market Regulation: Answers to FAQ’s conceding Rule 10b-18”. The United States 34
Securities and Exchange Commission”. 17 Nov. 2004. http://www.sec.gov/divisions/marketreg/r10b18faq0504.htm
Randall, Maury R. "Share Repurchases: The Impact on Stock Valuation." Financial Practice And Education 10, no. 35
1 (Spring-Summer 2000 2000): 256-263. EconLit, EBSCOhost (accessed February 6, 2014).
Ibid36

Leahy !17
inappropriately use repurchases to boost earnings per share - a benchmark used to determine
bonuses. Ben McClure further addresses this problem, “by mopping up extra stock and keeping
EPS up, buybacks are a convenient way for executives to maximize their own wealth. It's a way
for them to maintain the value of the shares and share options. Some executives may even be
tempted to pursue share buybacks to boost the share price in the short term and then sell their
shares” . The issue arises when executives make decisions as a private investor in the capacity 37
of an executive director, creating a deviation from their fundamental duties. "
Despite some potential pit falls whether due to management’s intent or not, one of the
primary motivators of participating in a stock buyback is pure: to reward stockholders. Under
appropriate implementation, share repurchasing can be a very effective use of excess resources.
When in possession of extra cash, companies have a few options: stockpile the cash, buyback
shares, raise dividends, take place in an acquisition, or invest it in an aspect of their own
company (research and development, etc). William Lazonick explains one theory for
participating in a buyback,“top executives often simply argue that in doing stock repurchases,
they, as corporate decision-makers, are ‘signaling’ confidence that their company’s stock price
will rise over the long-term” . In a scenario where executives feel the stock is “down,” 38
exercising a stock repurchase benefits stockholders by granting them a larger portion of the
company, and therefore a bigger portion of its cash flow and earnings. Similarly, a buyback
counteracts dilution that takes place as a result of an increase in outstanding stock from exercised
“6 Bad Stock Buyback Scenarios”. McClure, Ben. Investopedia. http://www.investopedia.com/37
articles/stocks/10/share-buybacks.asp.
Lazonick, William. :The Quest for Shareholder Value: Stock Repurchases in the US Economy.” Louvain 38
Economic Review 74, no. 4 (2008): 479-540. EconLit, EBSCOhot (accessed Feb. 2. 2014).

Leahy !18
employee stock options. Ben McClure reveals another major appeal of this repurchase: “share
buybacks can be a fairly low-risk approach for companies to use extra cash. Re-investing cash
into, say, R&D or a new product can be very risky....Using cash to pay for acquisitions can be
perilous, too. Mergers hardly ever live up to expectations” . An important aspect to consider 39
when analyzing a repurchase is the industry the company is involved in. The key determinants in
deciding whether a repurchase is appropriate is the cost of equity specific to that industry, as well
as “whether a company can use its cash flow to do repurchases and boost stock prices today
without undermining the financial commitment that, particularly in highly competitive global
industries, is required to fund innovation for tomorrow” . Under certain scenarios, a stock 40
buyback can signify to shareholders that the company has optimism that the stock price will rise,
and they are so confident that they are willing to invest their own capital. It is as if they are
believe that it is the “best use of capital at a particular time, [the] best investment is in
ourselves” . When legitimate, repurchases of stock can reinvigorate the stock and increase 41
shareholder value, honest and upfront results as opposed to manipulation. "
Albeit sometimes superficially misleading, share repurchases are not unethical, as
shareholder’s hold an obligation to have an understanding of the financial information their
companies are reporting. Furthermore, the board of directors’ duties include trying to maximize
shareholder value, so such efforts by way of repurchase programs are not necessarily a negative
thing. However, regardless of its moral standing, that does not mean that its implementation does
McClure, Ben. 39
Lazonick, William40
Janssen, Cory. “A Breakdown of Stock Buybacks”. 3 March 2012. www.investopedia.com/41
articles/02/041702.asp

Leahy !19
not skew results. With the increasing frequency with which companies are implementing share
repurchase programs, upon recalculation the reported earnings per share growth may not be as
transparent as perceived.
3.2 Earnings Per Share
The earnings per share ratio receives the most attention from investors, creditors, and the
media because it attempts to condense company performance into a single number. Summarizing
performance in a way that permits such comparisons is difficult because there are a vast number
of differing intricacies within each company that play into one single reported and compared
number . In the most basic setting, earnings per share is simply the firm’s net income divided by 42
the number of shares of common stock outstanding throughout the year - the dollar amount of
earnings attributable to each individual share . 43
Calculating EPS becomes more complex under a few different scenarios: 1) when the
number of shares outstanding has changed during the reporting period, 2) when the earnings
available to common shareholders are diminished by dividends to preferred shareholders, or 3)
when the impending effect of potential common shares (dilutive securities) are taken into
account . 44
Spiceland, J. David, James F. Sepe, and Mark Nelson. Intermediate Accounting. New York: 42
McGraw-Hill Irwin, 2011. Print.
Ibid43
Ibid44

Leahy !20
Issuance of new shares during the reporting period calls for the calculation of the
weighted average of shares outstanding during the period . Shares are weighted based upon the 45
percentage the were outstanding over the year - shares issued and outstanding for 10 months of
the year will be “weighted” by 10/12. The reason for time-weighting the shares issued is that the
resources the stock sale provides the company are available for generating income only after the
date the shares are sold- weighting is necessary to make the shares in the fraction’s denominator
consistent with the income in its numerator . The exact same process takes place for shares that 46
are reacquired - they are time weighted for the fraction of the year they were not outstanding.
Earnings per share can become diluted under a “complex capital structure,” where
securities exist that can be converted into shares, increasing the total number of shares
outstanding and reducing the amount of earnings available to each shareholder . Firm’s with 47
such a structure report two EPS calculations - basic EPS and diluted EPS. Basic ignores the
existence of such securities, while dilutive incorporates the potential dilutive of all “potential”
common shares; it assumes all potential shares have been exercised . Dilutive EPS is extremely 48
important if the conversion of such shares is imminent, as not taking into account the effect of
these shares might mislead investors and creditors . 49
Ibid45
Ibid46
Ibid47
Ibid48
Ibid49

Leahy !21
Examples of dilutive securities include stock options, stock rights, and stock warrants.
Each gives its holder the right to exercise their option to purchase common stock, usually at a
specified exercise price . In the calculation, it is assumed that the options were exercised at the 50
beginning of the period, or when the options were issued if that is later . THEN, it is assumed 51
that the case proceeds from selling the new shares at the exercise price are used to buy back as
many shares as possible at the share’s average market price during the year . While companies 52
have an almost unlimited amount of options to do with the cash proceeds from the exercise of the
options, the single assumption provides a degree of comparability . It is important to note that 53
these securities are deemed dilutive based on the assumption that the number of shares assumed
repurchased are fewer than the number of shares assumed sold - this is the case any time the buy
back (average market) price is higher than exercise price, creating a net increase in number of
shares . For example: 54
In certain instances, the effect of the conversion or exercise of potential common shares
would be to increase, rather than decrease, EPS. In the preceding paragraphs, such securities
Dilutive Scenario
100,000 shares x $4 exercise price $400,000 cash proceeds
$400,000 cash proceeds / $5 average market price 80,000 shares reacquired
100,000 shares issued - 80,000 shares reacquired 20,000 net share INCREASE
Ibid50
Ibid51
Ibid52
Ibid53
Ibid54

Leahy !22
were dilutive because their exercise price was less than the average market (buyback) price.
When the exercise price is higher than the average market price, to assume shares are sold at the
exercise price and repurchased at the market price would mean buying back more shares than
were sold, causing EPS to increase . However, it should be noted that a rational investor would 55
not exercise options at an exercise price higher than the current market price anyway . 56
Basic and diluted EPS data should be reported on the face of the income statement for all
reporting periods presented in in the comparative statements. Businesses without potential
common shares (a simple capital structure as opposed to complex) present basic EPS only . 57
Disclosure notes should provide additional disclosures including: “
1. A reconciliation of the numerator and denominator used in the basic EPS computations
to the numerator and denominator used in the diluted EPS computations.
2. Any adjustments to the numerator for preferred dividends.
3. Any potential common shares that weren't included because they were anti dilutive.
4. Any transactions that occurred after the end of the most recent period that would
materially affect earnings per share.” 58
3.3 Corporate Payout Trends: A History
To begin covering the history of stock repurchases, the transition from companies issuing
dividends to buying back their own stock on the open market will be addressed first. Previous
Ibid55
Ibid56
Ibid57
Ibid58

Leahy !23
studies have covered several related topics, including the nature and substitutability of dividends
and stock repurchases, the rise in stock repurchases over the last half of the twenty first century,
and the earnings management implications of stock repurchases. Studies have disagreed
regarding the nature and substitutability of dividends and repurchases. Prior laws, since
amended, and the relative infancy of repurchases in comparison to dividends might offer
explanations for the disparity in these differing views.
Throughout most of the 20th century, the trend in corporate payout policy favored
offering dividends as opposed to stock repurchase programs. This corporate payout trend was
due in large part to the fact that, prior to 1982, regulatory constraints deterred firms from
aggressively repurchasing shares. Companies ran the risk of violating the antimanipulative
provisions that had been in place since the adoption of the Securities and Exchange Act (SEA) of
1934, and “until 1982, there were no explicit rules directly regulating share repurchase activity in
the United States. This situation exposed repurchasing firms to the risk of triggering a Securities
and Exchange Commission (SEC) investigation and being charged with illegal market
manipulation” . However, in 1982 the SEC adopted rule 10b-18, which established guidelines 59
for repurchasing shares on the open market without violating sections 9(a) (2) or 10(b) of the
SEA of 1934 . Rule 10b-18 requires that firms repurchasing shares on the open market should 60
only use one broker or dealer on any single day, avoid trading on an uptick or during opening or
Ibid59
Ibid60

Leahy !24
the last half hour before the closing of the market, and limit the daily volume of the purchases to
a specified amount . 61
Even before the adoption of rule 10b-18, share repurchase programs were a controversial
topic in the national spotlight. In 1967, the United States’ Senate voiced concern regarding share
repurchases: “corporate repurchases of their own securities may serve a number of legitimate
purposes. For example, they may result from a desire to reduce outstanding capital stock
following the cash sale of operating divisions or subsidiaries, or to have shares available for
options, acquisitions, employee or stock purchase plans, and the like, without increasing the total
number of shares outstanding” . While these programs can be implemented to achieve important 62
business goals, they can also enacted to respond to other pressures, say meeting executive bonus
thresholds. The Senate continued: “repurchase programs, however, may also be utilized by
management to preserve or strengthen their control by counteracting tender offers or other
attempted takeovers, or may be made in order to increase the market price of the company’s
shares. Whatever the motive behind the repurchase program, if the repurchases are substantial
they will have a significant impact on the market” . Even early on, speculation and awareness 63
existed of the misleading qualities of repurchase programs.
After the SEC adopted rule 10b-18, which, under certain conditions, provides a safe
harbor to repurchasing corporations, repurchase activity experienced an upward structural shift.
Finance expert Gustavo Grullon mentions that “one year after approval of rule, aggregate amount
Ibid61
(Senate Report No. 550, 90th Congress, 1967)62
(Senate Report No. 550, 90th Congress, 1967)63

Leahy !25
of cash spent on share repurchase programs tripled” . As Mr. Buffett suggested, when a 64
company feels that the market undervalues their stock, a buyback can signal confidence in their
own stock and simultaneously increase earnings per share via a reduction in outstanding shares.
The biggest issue with this significantly increasing trend is the ability they possess to manipulate
ratios central to financial analysis.
Corporate Payout Policy - The Dividend vs. Repurchase Trend
Below is a graph representing the trend in corporate payout policy from 1972 through
2000. The chart compares total dollar amounts spent on dividends and repurchases during the
time period. The data is derived from a study done by Gustavo Grullon, where Grullon collected
sample data of all companies during the time period that had available information on numerous
variables. For the sake of the focus of the current study, only two variables were used below -
dollars spent on dividends and repurchases. The entire table can be found in the appendix of the
paper. Specifically of note is the trend and drastic increase in dollar amounts spent on
repurchases from the year 1983 forward. Amounts spent on repurchases more than tripled from
(in millions) $9,195 in 1983 to $28,265 in 1984, with the implementation of Rule 10b - 18
playing a significant role in that increase. By 1999, total dollar amounts spent on repurchases
exceeded that of total dollar amount spent on dividends.
The two tables are excerpts from Grullon’s study, illustrating the two significant findings
regarding repurchase trends. As mentioned previously, amounts repurchased more than tripled
from 1983 to 1984, and overtook amounts spent on dividends in 1999.
Grullon, Gustavo and Michaely, Roni. “ Dividends, Share Repurchases, and the Substitution 64
Hypothesis.” The Journal of Finance . Vol. 57, No. 4, Papers and Proceedings of the Sixty-Second Annual Meeting of the American Finance Association, Atlanta, Georgia, January 4-6, 2002 (Aug., 2002) , pp. 1649-1684

Leahy !26
!!!
Corporate Payout Policy
($ in millions) Dividends Repurchases
1983 $59,641 $9,195
1984 $61,508 $28,625
1985 $72,996 $44,104
Corporate Payout Policy
($ in millions) Dividends Repurchases
1998 $208,103 $199,190
1999 $197,782 $202,844
2000 $171,150 $194,263

Leahy !27
!
!!!3.4 Prior Scholarly Research
The basis of the prior scholarly research consisted of two main objectives: to determine
the nature and motives of corporate payout policy, and to look more closely at the ongoing
academic conversation of share repurchase programs as an earnings management device.
Regarding the first objective, one recurring theme came into focus- the idea of the “substitution
hypothesis”. As will be documented below, many scholars have debated over the idea of
Corporate Payout Policy$
Sp
en
t
00
$ 75,000
$ 150,000
$ 225,000
$ 300,000
Year
1980 1982 1984 1986 1988 1990 1992 1994 1996 1998 2000
DividendsRepurchased

Leahy !28
dividends and repurchases being perfect substitutes or not. In relationship to this study, the
importance of this attempted determination rests on the hypothesis that, based on the assumption
that repurchase programs are manipulative, if the substitution hypothesis were disproven than
dividends and repurchases would be implemented based on different desired outcomes, one
outcome from repurchases being improving EPS numbers without improved company
performance.
John Lintner, a Harvard business professor, performed one of the oldest studies on the
topic in 1956, exploring the nature of dividends and dividend payout policy. He argued that
managers target a long-term payout ratio when determining dividend policy, and that dividends
are sticky, tied to long-term sustainable earnings, and paid by mature companies and smoothed
from year to year . Lintner created a dividend model to generate expected future dividend 65
payments and found that dividend forecast errors are negatively correlated with share repurchase
activity. In other words, the difference between actual and expected dividend payments tends to
become more negative as the firm spends more money on share repurchases. This result is
consistent with the predictions of the substitution hypothesis . 66
Gustavo Grullon, another expert and who’s research will be covered later, provides a
brief overview of differing scholarly opinions regarding the substitution hypothesis, “John and
Williams (1985), Bernheim (1991), and Allen, Bernardo and Welch (2000) conclude that
management uses dividends, as opposed to share repurchases, to signal the firm’s quality. Thus,
Lintner, John. “Distribution of incomes of corporations among dividends, retained earnings, 65
and taxes. American Economic Review. 46. 97-113.
Grullon66

Leahy !29
according to these theories, dividends and repurchases are not interchangeable” . A large portion 67
of the basis for these opinions are derived from the timing of when these repurchases and
dividends take place, as well as the quality and type of earnings that are used to fund these
payouts. Proponents of this position cite that these variables reveal a dividend association with
permanent, established earnings and repurchases connected with temporary earnings. This is
especially interesting to keep in mind, as one widely accepted reason for implementing a stock
repurchase program is to signal that their stock is undervalued. Grullon too mentions the general
reasonings for supporting the substitution hypothesis, “Miller and Modigliani (1961),
Bhattacharya (1979), Easterbrook (1984), Miller and Rock (1985), and Jensen (1986) imply that
it is the payout (as either dividends or repurchases) that can be used to signal undervaluation or
to reduce agency conflicts . Thus, substitution of repurchases for dividends would be consistent 68
with those theories” . These experts, as some of them will be covered in more depth in the 69
following paragraphs, attempt to better understand the motivation behind different payout
methods. If any conclusion is reached, it might help determine the aforementioned motives of
executives- if the two are determined to be “equals” or “perfect substitutes,” then that might
dissuade my hypothesis, for as in theory perfect substitutes would yield the exact same desired
outcomes. If it were to be determined that the two are not perfect substitutes, one could logically
conclude that the two would have different desired outcomes, meaning different intentions for
different forms of corporate payouts.
Ibid (Grullon)67
Ibid68
Ibid69

Leahy !30
Allen, Bernardo, and Welch argue that share repurchases and dividends are not substitutes
because the latter payout method primarily, if not completely, attracts institutional investors as
opposed to the common investor . Allen and his colleagues argue that “institutional investors are 70
more likely to discover whether a firm is overvalued or undervalued because institutions have
better information gathering abilities and are also better monitors. Since institutions prefer
dividends, only undervalued firms want to be monitored (or signal they are undervalued), thus,
these are the firms that will pay higher dividends” . By default, since one form of payout 71
satisfies a motive that another does not, repurchases and dividends are not equal. Jagannathan,
Stephens, and Weisbach agree with this outcome, but for differing reasons. Rather than focusing
on the recipient of the payout, these experts focus on the source of the payout and its nature.
They explain that repurchases are responsible for increase in payout policy in excess of the norm,
with the norm generally being made it up of primarily dividends . They state, “repurchases are 72
noticeably more volatile than dividends. They seem to depend to a large extent on the business
cycle…The ‘smoothness’ of the dividend series combined with the volatility and procyclicality
of the repurchase series are consistent with the conventional wisdom suggesting that dividends
are paid out of sustainable cash flows while repurchases are paid out of temporary cash flows” . 73
Instead of perfect substitutes, stock repurchases seem to simply to complement dividends during
Allen, Franklin, Antonio Bernardo, and Ivo Welch, 2000, “A theory of dividends based on!70
tax clientele, Journal of Finance 55, 2499-2536.
Ibid71
Stephens, Clifford P. and Jagannathan, Murali and Weisbach, Michael S., Financial Flexibility 72
and The Choice Between Dividends and Stock Repurchases (February 3, 1999). Available at SSRN: http://ssrn.com/abstract=148548
Stephens, Jagannathan, and Weisbach 73

Leahy !31
periods highlighted by excess income. Their ultimate conclusion being that, “firms with higher
operating cash flows are more likely to increase dividends, while firms with higher non-
operating cash flows are more likely to increase repurchases” . 74
Moving toward previous projects that focus more directly on payout policy and earnings
management, Alon Brav and his colleagues in their research “Payout Policy in the 21st Century:
The Data,” focus more on repurchasing program motivation than substitutability. Concurrent
with arguments against the substitution hypothesis, they found that maintaining dividends is the
main focus of investment decisions, where as repurchase programs are initiated with residual
cash flow after investment spending . Despite this, Brav highlights a previously unaddressed 75
motive for repurchases, “many managers now favor repurchases because they are viewed as
being more flexible than dividends and can be used in an attempt to time the equity market or to
increase earnings per share. Executives believe that payout policies have little impact on their
investor clientele…tax considerations play a secondary role” . Despite that, there is some merit 76
to stock repurchases after all. From time to time, companies must initiate a repurchase in order to
have treasury stock on hand to provide employees with stock options. As these employees
exercise these options, dilution occurs as more stock enters the market. Bens, Nagar, Skinner and
Wong (2003) address this positive result of stock repurchases. They explain the corporate
strategy that “to offset stock option dilution, managers increase the level of their firms’ stock
Ibid74
Brav, Alon and Harvey, Campbell R. and Graham, John R. and Michaely, Roni, Payout Policy 75
in the 21th Century: The Data (November 2005). Johnson School Research Paper Series No. 29-06. Available at SSRN: http://ssrn.com/abstract=850306
Brav, et. al76

Leahy !32
repurchases in years when options-related dilution increases and when annual earnings are below
the level required to sustain past EPS growth rates” . By performing the repurchase, they are 77
removing stock from the market, counteracting the dilution that takes place when stock options
are exercised. This would indicate that executives might have a legitimate reason to implement
buybacks, not just because their company has “temporary earnings” or that they are trying to
attract the “institutional investor”. However, Brav’s research discovered an important fact in his
surveys that proves, yet challenges the hypothesis and belief that while repurchases are definitely
boosting EPS numbers, the board of executives would not admit to that. He reveals “when CFOs
are asked why their firms repurchase stock, the most frequently mentioned reason is ‘improving
EPS numbers” . This fact supports the idea that repurchases are increasingly taking place, 78
management is publicly acknowledging their central motive and furthermore implicitly
demonstrating that they believe buybacks are an (if not the most) effective way to incrementally
maximize shareholder wealth.
In Paul Hribar, Nicole Jenkins, and W. Johnson’s article “Stock Repurchases as an
Earnings Management Device, their findings reveal that inflation of EPS through stock
repurchase does not “fool” the market as severely as I had initially thought. They do admit that
this method of increasing earnings per share is common practice, as they found that a
“disproportionately large number of firms have EPS increasing repurchases when they would
Bens, Daniel A. and Nagar, Venky and Skinner, Douglas J. and Wong, M.H. Franco, 77
Employee Stock Options, EPS Dilution, and Stock Repurchases. Journal of Accounting & Economics, Vol. 36, No. 1-3, pp. 51-90, December 2003.
Brav, et. al78

Leahy !33
have implement marginally missed analysts forecasts without the repurchase” . So yes, this does 79
take place, and from the looks of it quite frequently. However unethical, it does appear that the
benefits are not that extensive as previously thought. Scholars found that “the market appears to
discount the repurchase induced component of earnings surprise relative to the earnings surprise
attributable to operations. Finally, firms that meet or exceeds expectations only because of the
repurchase receive approximately a 60% lower valuation premium than forums that meet or
exceed expectations without a repurchase” . If the market is not fooled, and dividends reflect 80
more permanent earnings, it might appear that dividends are the more effective way of signaling
a positive to shareholders. Further, stock repurchases seem more effective as a proactive solution
to combating dilution than a reactive solution to missing analysts’ forecasts.
Chapter 4: Original Research
4.1 Stock Repurchases: Earnings Management Device !
! Earnings per share is a popular performance metric used in executive compensation
contracts . In structuring these contracts, attempting to align as best as possible the goals of 81
management with the goals of the company is always ideal. With executives owning company
stock, coupled with the more-common-than-not existence of stock options, the presence of a
performance based metric, at a basic level, would seem to create such an alignment. However,
these compensation contracts that tie managerial rewards to EPS also create explicit incentives
Hribar, Paul and Jenkins, Nicole Thorne and Johnson, W. Bruce, Stock Repurchases as an 79
Earnings Management Device (March 2004). Available at SSRN: http://ssrn.com/abstract=524062 or http://dx.doi.org/10.2139/ssrn.524062
Ibid80
Young, Steven. “Stock Repurchases and Executive Compensation Contract Design: The Role 81
of Earnings Per Share Performance Conditions”. Lancaster University Management School

Leahy !34
for executives to manage the EPS denominator through stock repurchases (over and above any
implicit market-based incentives associated with increasing stock-based wealth and improving
job security) . While the motives of each repurchase program could vary on a case by case 82
basis, identifying and isolating these possible rationale allows for a better understanding of the
desired outcome. Steven Young, head of the Accounting and Finance Department at the
Lancaster University School of Management, performed a study investigating the link between
firms’ stock repurchase activity and the presence of earnings per share performance conditions in
executive compensation contracts. Young found that “the predicted odds of a repurchase for
firms where executive compensation depends on EPS performance are almost twice the level
observed for firms where rewards are independent of EPS” . The board of directors is tasked 83
with the duty of maximizing shareholder value. Stock repurchase programs posses the potential
to accomplish such a task. In a recent survey, when asked to expand upon the reasoning behind
their firm’s repurchases , the most frequently mentioned reason is “improving EPS numbers” . 84
Clearly, executives are no longer being shy about their motives. Elaborating on these motives,
Professor Young found that “bonus-based EPS conditions are associated with the strongest effect
on repurchase propensity, followed by share option plans with EPS-based vesting conditions” . "85
" In the event of the exercising of a prevalent amount of employee stock options, share
repurchases do provide a legitimate purpose of reducing the dilution that takes place as a result.
Young found that “stock repurchases represent a managerial response to EPS dilution concerns.
Ibid82
Ibid 83
Hribar, et al. 84
Young, Steven. “Stock Repurchases and Executive Compensation Contract Design: The Role 85
of Earnings Per Share Performance Conditions”. Lancaster University Management School

Leahy !35
Evidence also suggests that managers use repurchases for benchmark-beating purposes,
including meeting or exceeding analysts’ EPS forecasts, preserving a sequence of EPS
improvement, and maintaining historic EPS growth rates” . As previously mentioned in Paul 86
Hribar’s findings, the practice of inflating earnings per share is common. In his further research
he explains that a “disproportionately large number of firms” have EPS increasing repurchases
when they would have marginally missed analysts forecasts without the repurchase . This 87
earnings management practice “dilutes” the meaning and value of the earnings per share ratio."
" Repurchases do significantly affect the meaning and value of the earnings per share ratio.
The meaning of the EPS value is most significant in two scenarios: in comparing the values
between two companies in the same year, or in comparing the values between years at the same
company. This paper is of the belief that the impact is more significant between companies than
between years. Both impacts are significant, but the reasoning for the above statement was
reached due to the fact that as EPS values are relative and investors are looking to see increases
from a company year after year. While the “base” EPS (simply the prior year reported EPS) used
to compare from one year to the next might be inflated, those increases from year to year still
need to take place to satisfy investors and if the increase is not coming from performance, the
amount of stock to be repurchased to satisfy that EPS increase would be too large not to go
unnoticed by investors. "
!!!
Ibid86
Hribar, et al. 87

Leahy !36
4.2 Financial Statement Excerpts
In this section, excerpts from each company’s most recent financial statements will be
provided as examples for understanding the presentation and reasoning for repurchase programs
as they are disclosed. The excerpts derive specifically from both the management’s discussion
and analysis section, along with the accompanying notes to the financial statements. Spacing
changes have been made to accommodate the length of some of the excerpts. A general analysis
will conclude the section.
! !Microsoft - 2014 Financial Report"!
Earnings Per Share"" “Basic earnings per share (“EPS”) is computed based on the weighted average of number of shares of common stock outstanding during the period. Diluted EPS is computed based on the weighted average number of shares of common stock plus the effect of dilutive potential common shares outstanding during the period using the treasury stock method. Dilutive potential common shares include outstanding stock options and stock awards”. "!!Share Repurchases"" “On September 16, 2013, our Board of Directors approved a new share repurchase program authorizing up to $40.0 billion in share repurchases. The share repurchase program became effective on October 1, 2013, has no expiration date, and may be suspended or discontinued at any time without notice. As of June 30, 2014, $35.1 billion remained of the $40.0 billion share repurchase program.”"" “During fiscal year 2014, we repurchased 175 million shares of Microsoft common stock for $6.4 billion; 128 million shares were repurchased for $4.9 billion under the share repurchase program approved by our Board of Directors on September 16, 2013, and 47 million shares were repurchased for $1.5 billion under the share repurchase program that was announced on September 22, 2008 and expired September 30, 2013. During fiscal years 2013 and 2012, we repurchased 158 million shares for $4.6 billion and 142 million share for $4.0 billion, respectively, under the share repurchase program announced on September 22, 2008. All repurchases were made using cash resources.” "!!!!!

Leahy !37
*2011 Microsoft Financial Report Excerpt * "Management’s Discussion and Analysis"!2011 - “earnings per share increased reflecting higher revenue, repurchases of common stock, and lower income tax expense, offset in part by higher operating expenses”"!2010 - “earnings per share increased reflecting increased net income and the repurchase of 380 million shares in 2010”. "!!
Walmart - 2014 Financial Report"!Management’s Discussion and Analysis!!Company Share Repurchase Program “From time to time, the Company repurchases shares of its common stock under share repurchase programs authorized by the Board of Directors. On June 6, 2013, the Company's Board of Directors replaced the previous $15.0 billion share repurchase program, which had approximately $712 million of remaining authorization for share repurchases as of that date, with a new $15.0 billion share repurchase program, which was announced on June 7, 2013. As was the case with the replaced share repurchase program, the current share repurchase program has no expiration date or other restrictions limiting the period over which the Company can make share repurchases. At January 31, 2014, authorization for $11.3 billion of share repurchases remained under the current share repurchase program. Any repurchased shares are constructively retired and returned to an unissued status. The Company considers several factors in determining when to execute share repurchases, including, among other things, current cash needs, capacity for leverage, cost of borrowings and the market price of its common stock. The following table provides, on a settlement date basis, the number of shares repurchased, average price paid per share and total cash paid for share repurchases for fiscal 2014, 2013 and 2012: !Notes to Consolidated Financial Statements !Net Income Per Common Share “Basic income per common share from continuing operations attributable to Walmart is based on the weighted-average common shares outstanding during the relevant period. Diluted income per common share from continuing operations attributable to Walmart is based on the weighted-average common shares outstanding during the relevant period adjusted for the dilutive effect of outstanding stock options and other share-based awards. The Company did not have significant stock options or other share-based awards outstanding that were antidilutive and not included in the calculation of diluted income per common share from continuing operations attributable to Walmart for fiscal 2014, 2013 and 2012. !!

Leahy !38
!Boeing - 2013 Financial Report"!
Management’s Discussion and Analysis!!Financing Activities “During 2013, we repurchased 25.4 million shares totaling $2.8 billion through our open market share repurchase program. There were no shares repurchased through the share repurchase program in 2012 and 2011. In 2013 and 2012, we had 0.8 million and 1 million shares transferred to us from employees for tax withholdings. !!Notes to Consolidated Financial Statements !Note 3 – Earnings Per Share “Basic and diluted earnings per share are computed using the two-class method, which is an earnings allocation method that determines earnings per share for common shares and participating securities. The undistributed earnings are allocated between common shares and participating securities as if all earnings had been distributed during the period. Participating securities and common shares have equal rights to undistributed earnings. Basic earnings per share is calculated by taking net earnings, less earnings available to participating securities, divided by the basic weighted average common shares outstanding. Diluted earnings per share is calculated by taking net earnings, less earnings available to participating securities, divided by the diluted weighted average common shares outstanding. The elements used in the computation of basic and diluted earnings per share were as follows:” !!Note 16 – Shareholders’ Equity “On October 29, 2007, the Board approved the repurchase of up to $7,000 of common stock (the 2007 Program). At December 31, 2013, $810 in shares may still be repurchased under the Program. On December 16, 2013, the Board approved a new repurchase plan (the 2013 Program) for up to $10,000 of common stock that commences following the completion of the 2007 Program. Unless terminated earlier by a Board resolution, the Program will expire when we have used all authorized funds for repurchase. As of December 31, 2013 and 2012, there were 1,200,000,000 shares of common stock and 20,000,000 shares of preferred stock authorized. No preferred stock has been issued.” !! !!!!!!

Leahy !39
Wells Fargo- 2013 Financial Report"!Management’s Discussion and Analysis!!Securities Repurchases “From time to time the Board authorizes the Company to repurchase shares of our common stock. Although we announce when the Board authorizes share repurchases, we typically do not give any public notice before we repurchase our shares. Future stock repurchases may be private or open-market repurchases, including block transactions, accelerated or delayed block transactions, forward transactions, and similar transactions. Additionally, we may enter into plans to purchase stock that satisfy the conditions of Rule 10b5-1 of the Securities Exchange Act of 1934. Various factors determine the amount and timing of our share repurchases, including our capital requirements, the number of shares we expect to issue for employee benefit plans and acquisitions, market conditions (including the trading price of our stock), and regulatory and legal considerations, including the FRB’s response to our capital plan and to changes in our risk profile.
In October 2012, the Board authorized the repurchase of 200 million shares. At December 31, 2013, we had remaining authority under this authorization to purchase approximately 74 million shares, subject to regulatory and legal conditions. For more information about share repurchases during 2013, see Part II, Item 2 in this Report.
Historically, our policy has been to repurchase shares under the “safe harbor” conditions of Rule 10b-18 of the Securities Exchange Act of 1934 including a limitation on the daily volume of repurchases. Rule 10b-18 imposes an additional daily volume limitation on share repurchases during a pending merger or acquisition in which shares of our stock will constitute some or all of the consideration. Our management may determine that during a pending stock merger or acquisition when the safe harbor would otherwise be available, it is in our best interest to repurchase shares in excess of this additional daily volume limitation. In such cases, we intend to repurchase shares in compliance with the other conditions of the safe harbor, including the standing daily volume limitation that applies whether or not there is a pending stock merger or acquisition.
In connection with our participation in the Capital Purchase Program (CPP), a part of the Troubled Asset Relief Program (TARP), we issued to the U.S. Treasury Department warrants to purchase 110,261,688 shares of our common stock with an exercise price of $34.01 per share expiring on October 28, 2018. The Board authorized the repurchase by the Company of up to $1 billion of the warrants. On May 26, 2010, in an auction by the U.S. Treasury, we purchased 70,165,963 of the warrants at a price of $7.70 per warrant. We have purchased an additional 986,426 warrants, all on the open market, since the U.S. Treasury auction. At December 31, 2013, there were 39,108,864 warrants outstanding and exercisable and $452 million of unused warrant repurchase authority. Depending on market conditions, we may purchase from time to time additional warrants in privately negotiated or open market transactions, by tender offer or otherwise.
We do not have a specific policy on repurchasing shares to satisfy share option exercises. Rather, we have a general policy on repurchasing shares to meet common stock issuance

Leahy !40
requirements for our benefit plans (including share option exercises), conversion of our convertible securities, acquisitions and other corporate purposes. Various factors determine the amount and timing of our share repurchases, including our capital requirements, the number of shares we expect to issue for acquisitions and employee benefit plans, market conditions (including the trading price of our stock), and regulatory and legal considerations. These factors can change at any time, and there can be no assurance as to the number of shares we will repurchase or when we will repurchase them.”" !
Pfizer - 2013 Financial Report"!Management’s Discussion and Analysis!!Capital Allocation and Expense Management" “On June 27, 2013, our Board of Directors authorized a new $10 billion share-purchase plan, to be utilized over time. Also, on December 16, 2013, our Board of Directors declared a first-quarter 2014 dividend of $0.26 per share, an increase from the $0.24 per-share quarterly dividend paid during 2013.” !Adjusted Income" “The Adjusted income measure is an important internal measurement for Pfizer. We measure the performance of the overall Company on this basis in conjunction with other performance metrics. The following are examples of how the Adjusted income is utilized: !**Senior management’s annual compensation is derived, in part, using this Adjusted income measure. Adjusted income is the performance metric utilized in the determination of bonuses under the Pfizer Inc. Executive Annual Incentive Plan that is designed to limit the bonuses payable to the Executive Leadership Team (ELT) for purposes of Internal Revenue Code Section 162(m). Subject to the Section 162(m) limitation, the bonuses are funded from a pool based on the performance measured by three financial metrics, including adjusted diluted earnings per share, which is derived from Adjusted income. This metric accounts for 40% of the bonus pool. The pool applies to the bonus plans for virtually all bonus-eligible, non-sales-force employees worldwide, including the ELT members and other members of senior management. !Reconciliation “The following table provides a reconciliation of Reported diluted EPS, as reported under U.S. GAAP, and Non-GAAP Adjusted diluted EPS: !**As part of a footnote in minute font underneath the supplemental data, Pfizer mentions: "" "" “(a) Reported and Adjusted diluted earnings per share in all periods presented were significantly impacted by the decrease in the number of shares outstanding, due to the Company's ongoing share repurchase program and in 2013, the impact of the Zoetis exchange offer”. "!

Leahy !41
!Share-Purchase Plans “On December 12, 2011, we announced that the Board of Directors had authorized a $10 billion share-purchase plan (the December 2011 Stock Purchase Plan), which was exhausted in the first quarter of 2013. On November 1, 2012, we announced that the Board of Directors had authorized an additional $10 billion share-purchase plan, which became effective on November 30, 2012 and was exhausted in October 2013. On June 27, 2013, we announced that the Board of Directors had authorized an additional $10 billion share-purchase plan, and share purchases commenced thereunder in October 2013. In 2013, we purchased approximately 563 million shares of our common stock for approximately $16.3 billion under our publicly announced share-purchase plans. In 2012, we purchased approximately 349 million shares of our common stock for approximately $8.2 billion under our publicly announced share-purchase plans. In 2011, we purchased approximately 459 million shares of our common stock for approximately $9.0 billion under our publicly announce share-purchase plans. After giving effect to share purchases through year-end 2013, our remaining share-purchase authorization was approximately $5.5 billion at December 31, 2013.” !
!Excerpt Analysis
The passages above illustrate the deficiencies that exist in both management and the
financial statements as a whole specifically addressing the impact and alterations specific
accounting treatments can have on earnings numbers. Despite supposed “rules and requirements”
provided by the SEC, a general lack of continuity exists regarding both the depth of both the
writing and accompanying data with which each company is “required” to addresses reported
earnings per share figures and stock repurchase programs. Not only does this lack of continuity
exist between companies, it also is apparent even between years in the same company’s financial
statements.
Each company does, however, provide an adequate job of explaining two things: the
status of the current (and sometimes even its predecessor, if applicable) share repurchase

Leahy !42
program, and the motives and factors taken into account when considering whether or not to
implement a buyback in a given year. In addition to these two basic points of emphasis, these
companies and the transparency of their programs would benefit from implementing similar
information to these excerpts found scattered above: 1) in 2010 and 2011 (excerpts added in for
this very reason), in one brief sentence Microsoft explains that the reason earnings per share
increased was due to both increases in net income, along with a large amount of shares being
repurchased. 2) Wells Fargo addresses in their management discussion section that offsetting
dilution from the exercising of stock (a hypothesis mentioned above) is not a motive for
implementing a repurchase program. 3) Pfizer explains that part of management’s compensation
package is based upon their own adjusted income per share measures, specifically forty percent
of the bonus pool. 4) Pfizer also explains that reported earnings per share values were
significantly impacted by stock repurchases in one year, and the issuance of an enormous amount
of stock in another.
A consensus on the comparability and adequacy of the disclosures in relationship to the
financial statements as a whole will be addressed in the conclusion. However, the overall
takeaway from this section is that a consistency from year to year with what is being reported
and commented on would enhance the comparability of the financial statements.
4.3 Dilutive Example
! Below is an excerpt from ASC 260 regarding the dilutive effects of convertible securities.
While in the context of the codification, the table is supposed to illustrate the difference between "

Leahy !43
basic and diluted EPS. However, it satisfies a similar purpose of simply showing the effects that
the issuance, conversion, or exercising of stock has on EPS figures."
!
Prior to warrants, stock, and “convertible debentures” being exercised, the weighted
average of shares outstanding was 3,991,666 with a reported per share amount of earnings being
$1.87 . Following the effects of those three dilutive securities to both income and the weighted
average of shares outstanding, shares outstanding increase to 4,380,767 and reduced per share
earnings to $1.73. Similarly, were a repurchase of 68,000 shares of stock to take place during that
year instead of dilutive securities being exercised (decreasing shares outstanding to 3,923,684),
without an improvement of net income earnings per share would increase from $1.87 to $1.90 .
!!!
For the Year Ended 20X1
Income !(Numerator)
Shares !(Denominator)
!Per Share Amount
Income before extraordinary item $7,500,000
Less: Preferred stock dividends (45,000)
Basic EPS
Income available to com. stockholders 7,455,000 3,991,666 $1.87
Effect of Dilutive Securities
Warrants 30,768
Convertible preferred stock 45,000 308,333
4% convertible debentures 60,000 50,000
Diluted EPS
Income available to com. stockholders + assumed conversions
7,560,000 4,380,767 $1.73
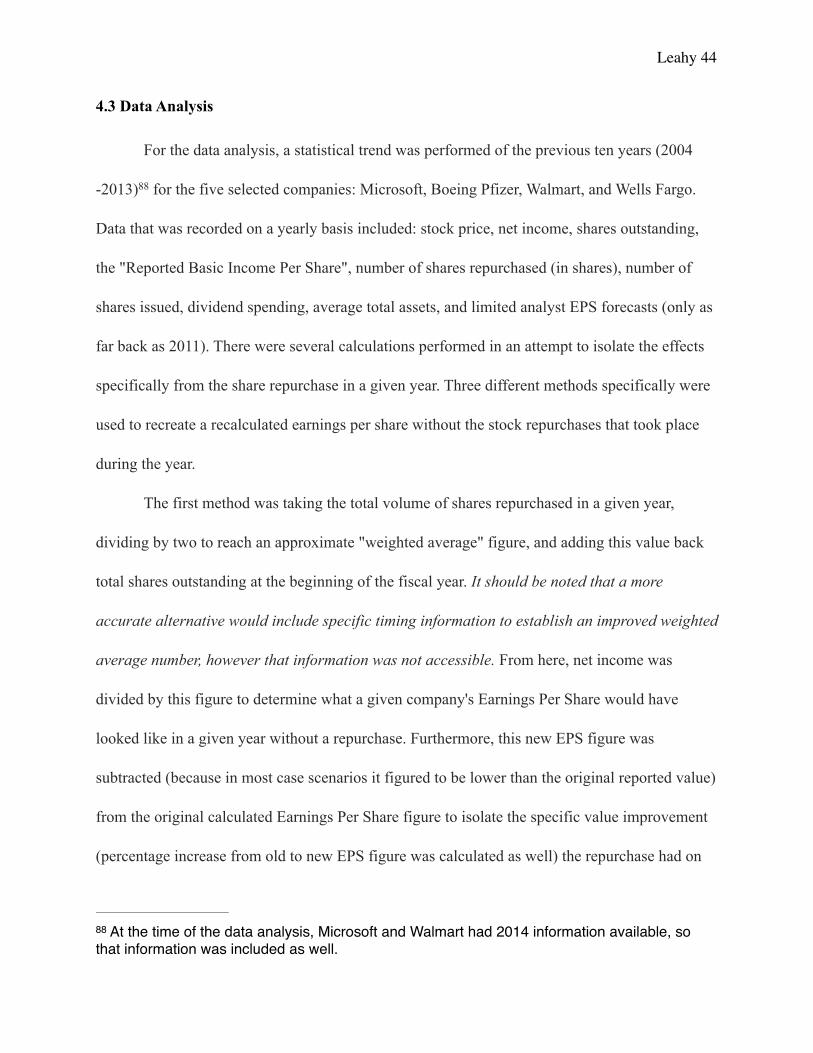
Leahy !44
4.3 Data Analysis !! For the data analysis, a statistical trend was performed of the previous ten years (2004
-2013) for the five selected companies: Microsoft, Boeing Pfizer, Walmart, and Wells Fargo. 88
Data that was recorded on a yearly basis included: stock price, net income, shares outstanding,
the "Reported Basic Income Per Share", number of shares repurchased (in shares), number of
shares issued, dividend spending, average total assets, and limited analyst EPS forecasts (only as
far back as 2011). There were several calculations performed in an attempt to isolate the effects
specifically from the share repurchase in a given year. Three different methods specifically were
used to recreate a recalculated earnings per share without the stock repurchases that took place
during the year.
The first method was taking the total volume of shares repurchased in a given year,
dividing by two to reach an approximate "weighted average" figure, and adding this value back
total shares outstanding at the beginning of the fiscal year. It should be noted that a more
accurate alternative would include specific timing information to establish an improved weighted
average number, however that information was not accessible. From here, net income was
divided by this figure to determine what a given company's Earnings Per Share would have
looked like in a given year without a repurchase. Furthermore, this new EPS figure was
subtracted (because in most case scenarios it figured to be lower than the original reported value)
from the original calculated Earnings Per Share figure to isolate the specific value improvement
(percentage increase from old to new EPS figure was calculated as well) the repurchase had on
At the time of the data analysis, Microsoft and Walmart had 2014 information available, so 88
that information was included as well.

Leahy !45
the ratio. It should be further noted that this recalculation is flawed - only adding back shares
repurchased will consistently result in an EPS value less than the one reported.
The second mathematical calculation took net income from the current year, and divided
it by the total number of shares outstanding at the end of the previous year. This was in response
to the concern that the original mathematical recalculation was always going to result in a
decreased earnings per share, as it was not also taking into account stock issued during the same
year.
The third mathematical calculation was formulated in an attempt to determine whether
the stock repurchase program was the “best investment” that the company could make. After
calculating average total assets for each year, return on assets (net income / average total assets)
was calculated for each year. Then, amount of money spent on repurchases each year was
multiplied by the given ROA value and added back to net income, and the amount of shares
repurchased were added back to the total number of shares outstanding.
In addition, calculations were also made to note the percentage change from year to year
in net income, as well as for both the "old" and "new" EPS calculations. These percentages were
compared in order to derive the source of earnings per share increases from year to year -
corresponding equivalent increases in both net income and earnings per share make sense,
whereas earnings per share increases that outpace increases in net income create concern and
suggest closer scrutiny in those years to determine reasons for this increase. The final phase of
this data analysis included comparing “net figures” of stock issued/exercised and repurchased on
year to year basis to determine reasoning for potential EPS increases and or decreases.
Below are the examples of the three performed EPS recalculations:!

Leahy !46
!- EPS Mathematical Recalculation #1 !
Net Income (Shares O/S) + (1/2)(# Shares Repurchased That Year) !!
- EPS Recalculation #2 - Prior Year Shares Outstanding !Net Income
# of Prior Year End Shares Outstanding !!- ROA EPS Recalculation #3 !
Net Income + ($ on Repo x ROA)!(Shares O/S) + (1/2)(# Shares Repurchased That Year) !
Despite attempts to create a more complex formula to account for repurchases, the most
useful of the recalculations performed was actually the prior year recalculation. In essence, this
was the most effective way to account for both repurchases and issuances throughout the year. Of
the 52 EPS values recalculated, 26 times the previous year recalculated earnings per share value
was lower than the reported value, including every single time for Walmart. Five times it was the
exact same, resulting from little to no change in share balance from the previous year. The trend
of these five researched companies was that shares outstanding was reduced each year, except
for the last six years for Wells Fargo, which is why the recalculation using previous years shares
outstanding would be higher. That is not a flaw in the recalculation, but it rather emphasizes the
trend that companies are reducing their share counts on a yearly basis. The majority of the other
instances resulting in an actual higher value in comparison to what was reported in the current
year were due to rare increases in share count, mostly attributable to the minor acquisitions that
resulted in absorption and increase in shares.

Leahy !47
4.3b - Data Analysis Part 2
The following will included a data analysis of each specific company. Three supplements
will be provided - a bar graph comparing percentage increases in net income and earnings per
share, a chart comparing the reported and recalculated earnings per share values, and a graph
comparing earnings per share values.
Certain “discrepancies” exist in each data set that require further explanation. These
discrepancies will be included and addressed following each original data analysis. For further
reference, more comprehensive spreadsheets for each company can be located in the appendix at
the end of the paper.
4.4a Microsoft!
!

Leahy !48
! !
Between 2004 and 2013, Microsoft’s “Reported Basic Earnings per Share” increased from 0.76
in 2004, to 2.66 in 2014, reaching a high of 2.73 in 2011. Mathematically recalculated EPS saw
an increase from 0.75 in 2004 to 2.63 in 2013. Interestingly enough, recalculation under the
second method using prior year shares outstanding reported a period high EPS in 2014, as
opposed to in 2011. Per the graph above, in every year other than 2005 percentage increases in
net income were outpaced by percentage increases in earnings per share - a recurring theme in
this data analysis - and a signal that increases in earnings per share are being influenced by more
than just increases in net income. Corresponding negative percentages saw the same phenomena
of more extreme decreases in net income than in EPS. Slightly more reassuring, the reported EPS
high in 2011 does at least correspond with the highest net income during the same period.
During the period, net income increased by an average of 12.78%, whereas EPS
increased by an average of 15.7%, and the average difference between original and recalculated
earnings per share was .04 points; earnings per share prior to recalculation was on average 2.04%
higher. During this time, Microsoft had an average of 9,315,272,727 shares outstanding. They
MSFT - Earning Per Share Comparison
2004 2005 2006 2007 2008 2009 2010 2011 2012 2013 2014
Reported 0.76 1.13 1.21 1.44 1.90 1.63 2.13 2.73 2.02 2.61 2.66
Math Recalc**
0.75 1.11 1.16 1.38 1.86 1.60 2.08 2.66 2.01 2.59 2.63
PY Recalc
0.76 1.13 1.16 1.35 1.81 1.56 2.10 2.63 2.00 2.60 2.64
ROA Recalc
0.78 1.24 1.54 2.02 2.24 1.81 2.41 3.01 2.10 2.71 2.77
Forecast - - - - - - - 2.60 2.73 2.75 2.69

Leahy !49
repurchased a total of 4,182,700,000 shares during period, and an average of 380,245,454 shares,
or approximately 4.08% of shares outstanding, a year.
For each year, both methods of earnings per share recalculation resulted in lower values
than the reported basic EPS, except for the 2005 “PY Recalc” which was equal to “reported”. In
comparing the differences between these three values, on average the difference between
reported and either given recalculation was 0.043 (see footnote) . 89
Microsoft Data Discrepancies (2005, 2009, 2012 specifically)!
2004 Low Net Income / EPS - In comparison to 2005 net income, 2004 net income and EPS
appeared low. However, further investigation discovered nothing noteworthy - 2003 NI was
$7,531; ’03 EPS was 0.70 (2004 NI - $8,168, EPS - 0.76). This lead to investigating the increase
in 2005 net income.
2005 Net Income Increase - Investigation revealed the 50% increase in net income was driven
by a 61% increase in operating income, attributable to a $3.29 billion decline in stock-based
compensation expense; increased revenue in Server and Tools, Client and Information Worker
(segments of their business), and strong sales of Halo 2.
2008 Net Income Increase - Microsoft saw their net income increase 26% in 2008, driven
primarily by “increased licensing of the 2007 Microsoft Office System, increased Xbox 360
platform sales, increased revenue associated with Windows Server and SQL Server, and
increased licensing of Windows Vista. Foreign currency exchange rates accounted for a $1.6
billion or three percentage point increase in revenue during fiscal year 2008”.
It is noted that reporting average values for this type of data is not always applicable due to the fluidity 89
of net income and share repurchases on a year to year basis. HOWEVER, in data sets where reported values are more constant/predictable/less fluctuating, average values will be reported when applicable.

Leahy !50
2009 Net Income/ EPS - “revenue declined across most segments primarily driven by weakness
in the global PC market and the unfavorable economic environment”.
2010 Earnings Per Share - “earnings per share increased reflecting increased net income and
the repurchase of 380 million shares in 2010”.
2011 Earnings Per Share - “earnings per share increased reflecting higher revenue,
repurchases of common stock, and lower income tax expense, offset in part by higher operating
expenses”.
2012 EPS Decline - Microsoft’s EPS in 2012 saw a drastic decrease due to “a goodwill
impairment charge related to our previous Online Services Division business segment (related to
Devices and Consumer Other under our current segment structure) which decreased operating
income and net income by $6.2 billion and diluted earnings per share by $0.73
!

Leahy !51
4.4b Walmart!
!WMT - Earning Per Share Comparison
2004 2005 2006 2007 2008 2009 2010 2011 2012 2013 2014
Reported 2.08 2.41 2.68 2.71 3.13 3.40 3.71 4.48 4.54 5.04 4.90
Recalc 2.05 2.39 2.66 2.70 3.07 3.37 3.65 4.32 4.46 4.96 4.84
PY Recalc
2.04 2.35 2.64 2.70 3.06 3.29 3.65 4.24 4.29 4.91 4.75
ROA Recalc
2.09 2.43 2.71 2.73 3.22 3.44 3.81 4.68 4.61 5.15 4.99
Forecast - - - - - - - 4.50 4.93 5.20 5.00

Leahy !52
!! Since 2004, Walmart’s reported basic EPS has increased from a value of 2.08 in 2004 to
4.90 in 2014, reaching a high of 5.04 in 2013. Their mathematically recalculated EPS values saw
a similar increase from 2.05 to 4.84, with a corresponding high in 2013 of 4.96. Recalculation
using previous year shares outstanding saw EPS increase from 2.35 to 4.75. On average, the
difference between the reported EPS and either recalculation differed by a value 0.09 in any
given year."
" In every year throughout the time period, percentage increases in net income on a yearly
basis were outpaced by percentage increases in earnings per share. This causes concern that
Walmart is deriving a portion of their earnings per share increase from somewhere other than an
increase net income. While net income increased by an average of 6.10% , actual unadjusted
earnings per share increased an average of 9.21%. "
" On average, the difference between the original and recalculated EPS values was .06, or
an average increase in EPS attributed to stock repurchases of 1.48%, on a yearly basis. "
During this time period, they had an average of 3,872,636,364 shares of common stock
outstanding, repurchasing a total of 1,255,400,000 shares, and repurchased an average of
114,127,273 shares, or 2.95% of outstanding shares, per year. "
!!Walmart Data Discrepancies!
2005 EPS Increase - While graphically the corresponding percentage increases do not seem
irregular, Walmart’s earnings per share value increased 0.33 from 2004 to 2005. This was due in
part to a 13.4% increase in net income which was driven by a 15.9% increase in income from

Leahy !53
continuing operations. This was in conjunction with an overall net decrease of 84 million shares
outstanding during the fiscal year.
2012 - Percentage Change Graph - Percentage change bar chart values for 2012 suggest they
require further investigation. However, nothing of material value was found in Walmart’s
financial statements. Furthermore, percentage changes of a 4.2% decrease in net income and
1.3% increase in earnings per share are of little consequence.
2013 EPS Increase - Walmart’s earnings per share increased by a value of 0.50 due to a $1.3
billion increase in net income , which was attributable to a $4.0 increase in net sales during the
fiscal year. In addition, Walmart also repurchased 113.2 million shares during the year while
issuing only 9.2 million shares, a net decrease in shares outstanding of 104 million.
!4.4c Boeing!
!

Leahy !54
!
!
! From 2004 to 2013, Boeing saw their earnings per share prior to recalculation increase
from 2.27 to 6.03, with the low during this time period reaching 1.89 in 2009. Recalculated EPS
increased from 2.25 to 6.28 during the same period. Interestingly enough, during the first five
years of research Boeing’s EPS percentage increases “outperformed” net income percentage
increases, only for the trend to switch and stay consistent in 2010 through 2013. This trend was if
not entirely due to the changes in shares outstanding. In the first five years, shares outstanding
decreased each year. Starting in 2009, they incrementally increased each year. Overall the results
were almost identical, as net income saw an average percentage increase of 24.16% over the
span, and earnings per share prior to adjustment saw an increase of 24.10%.
Despite not partaking in repurchases from 2010 to 2012, Boeing repurchased a total of
184,594,867 shares. However, in their financial statements Boeing does mention that “in 2012
and 2011, we had 1,007,706 and 350,778 shares transferred to us from employees for tax
BA - Earning Per Share Comparison
2004 2005 2006 2007 2008 2009 2010 2011 2012 2013
Reported 2.27 3.26 2.88 5.36 3.68 1.89 4.50 5.38 5.15 6.03
Math Recalc
2.25 3.19 2.85 5.30 3.56 1.88 4.50 5.39 5.16 6.28
PY Recalc 2.27 3.20 2.83 5.34 3.54 1.85 4.67 5.46 5.24 6.43
ROA Recalc
2.31 3.44 2.95 5.67 3.88 1.84 4.50 5.39 5.16 6.59
Forecast - - - - - - - 4.44 5.00 5.80

Leahy !55
withholding and did not repurchase any shares through our open market share repurchase
program. In December 2012, we announced the resumption of this program with repurchases
expected to total between 1.5B and 2B in 2013”. Similarly, the following excerpt was taken from
the 2010 set of financial statements: “in 2010, we had 494,939 shares transferred to us from
employees for tax withholding and did not repurchase any shares through our open market share
repurchase program.
Below is recalculated data for the years 2010 through 2012, taking into account shares
transferred from employees. While Boeing mentions the reasoning being “for tax withholding,”
it is impossible to know the true motives, so for the sake of skepticism, the data below will be
treated as if it were part of an implemented repurchase.
As shown above, earnings per share numbers actually slightly increased upon recalculation.
Similarly, in the final four years of EPS value comparison, both methods of EPS recalculation
resulted in increases in earnings per share beyond that of the reported value. One possible
explanation for this could be that throughout these three years, the reduction in shares was offset
Recalculated Earnings Per Share - Share Transfer
2010 2011 2012
NI (millions) $3,311 $4,011 $3,900
Shares O/S (millions) 735 744.1 755.7
Shares Repurchased!(millions)
0.49 0.35 1.01
/ 2 (weighted average) 0.25 0.18 0.50
Recalc Shares O/S 735.25 744.28 756.20
Recalc EPS $4.50 5.39 $5.16
Reported EPS 4.50 5.38 5.15

Leahy !56
by the issuance of stock to the tune of 9.10, 11.60, and 4.60 million shares in comparison to the
minute amount of shares repurchased during the same time frame respectively. !
Boeing Data Discrepancies
2005 EPS Increase - The disparity between 2004 and 2005 net incomes and earnings per share
figures is primarily attributed to the presence of a $555 million charge in 2004 “related to the
United States Air Force 767 tanker program and expenses incurred to end production of the 717
aircraft.
2007 Net Income Increase - In 2007, Boeing saw their net income increase 84%. Interestingly
enough, during the fiscal year their revenue ONLY increased 8%, however their earnings from
operations increased 94%. Their financials mention, “earnings from operations improved by
$2,816 million compared with 2006. The increase is partly due to the $571 million global
settlement with the U.S. Department of Justice. Commercial Airplane earnings increased by $851
million…and lower unallocated expense in 2007 contributed $548 million to the earnings
improvement”.
2008 Net Income Fluctuation - While Boeing’s net income “appears” to be back to a reasonably
predictable figure, Boeing actually experienced $6.4 billion worth of lost revenue during 2008.
This was attributable to “decreases in new airplane deliveries reflecting the effects of the labor
strike…we delivered 104 fewer than expected airplanes due to the IAM strike”.
2009 Net Income Decrease - Boeing’s operating earnings decreased by $1,854 million
compared with 2008. They stated, “Commercial Airplanes earnings decreased by $1,769 million
primarily due to $2,693 million of costs related to the first three 787 flight test craft included in
research and development expense as a result of our determination in August 2009 that these

Leahy !57
aircraft could not be sold”. Also, Boeing absorbed more than twice the amount ($1,352 million
worth to be exact) of “reach forward losses” in 2009 as compared to 2008 on the 747 program.
2010 - Net Income Percentage Increase - In comparison to 2009, Boeing experienced an 148%
increase in net income in 2010. The reason for this is primarily in relation to the losses suffered
by Boeing in the prior two years, specifically the 787 flight test aircraft and the 747 program.
Overall, operating earnings increased by $2,875….
2012 Revenues - Unallocated items and eliminations reduced revenues by $610 million.
2013 EPS - Earnings from operations increased by $1,084 million or 23% due to higher new
airplane deliveries and lower research and development costs…!
!4.4d Wells Fargo!
!

Leahy !58
! !
!! Since 2004, Well’s Fargo’s reported basic EPS has increased from a value of 2.07 in 2004
to 3.95 in 2013, reaching its high during the period in 2013, while hitting a significant low of 0.7
in 2008. Their recalculated EPS values saw a similar increase from 2.06 to 4.09, with a
corresponding high in 2013 and low of .78 in 2008. Unlike Walmart, in certain years net income
increased by percentage more so than a percentage increase in earnings per share. On average,
net income increased 41.56% whereas earnings per share increased only 26.84%. However,
actual EPS was always greater in comparison to the recalculated value by an average of .94%,
or .025 when comparing EPS values. "
" During this time period, they had an average of 4,247,680,000 shares of common stock
outstanding. Wells Fargo repurchased a total of 762,817,231 shares, and repurchased an average
of 76,281,723 shares, or approximately 2% of shares outstanding, on a yearly basis."
" In 2008, the three segments of Wells Fargo’s business collectively reported losses of
approximately 5 billion dollars, attributable to the financial crisis. These results are apparent in
the skewed chart above showing the drastic 2009 percentage increase in EPS and net income. "
Wells Fargo Data Discrepancies!
WFC - Earning Per Share Comparison
2004 2005 2006 2007 2008 2009 2010 2011 2012 2013
Reported 2.07 2.27 2.52 2.41 0.70 1.76 2.23 2.85 3.40 3.95
Recalc 2.06 2.26 2.48 2.33 0.78 2.70 2.36 2.98 3.53 4.09
PY Recalc NA 2.27 2.50 2.39 0.79 3.63 2.72 3.04 3.58 4.14
ROA Recalc
1.57 1.06 1.58 1.25 1.20 1.23 1.03 1.30 2.00 3.39
Forecast - - - - - - - 1.30 1.40 3.20

Leahy !59
2008 Net Income - In 2008, the three segments of Wells Fargo’s business collectively reported
decreases in net income of approximately 5 billion dollars, attributable to a large “pretax credit
reserve build” mostly from home equity losses during the financial crisis. These results are
apparent in the skewed graph showing the drastic 2009 percentage increase in EPS and net
income.
2009 EPS - 2009 saw drastic percentage increases in net income and earnings per share for
Wells Fargo. The reasoning behind this is attributable to two things: significant losses taken in
2008 due to the financial crisis, and equally as important, the acquisition of Wachovia on Dec.
31, 2008. This resulted in both added income and and shares outstanding (1.2 billion net
increase). Net income increased 362%, and earnings per share increased 150%..
In comparing their reported basic earnings per share value with the various recalculated
methods, large value discrepancies suggested further investigation. In 2009, Wells Fargo
recorded $4.3 billion worth of “preferred stock dividends and accretion,” significantly reducing
the amount of earnings available to common stockholders. This reduction approximately
equaled an entire $1 per share of earnings.
2010 EPS - In 2010, net income increased by 0.71%, whereas earnings per share increased by
26.7%, despite total shares outstanding increasing by 680 million. The difference in this and the
prior years EPS is that while again Wells Fargo is recognizing preferred stock dividends, they
only recognized $730 million this year as opposed to the $4.3 billion in the year prior.
Approximate calculations made using “full” net income and without the extreme increase in
shares in 2010 equate to similar 2.70 and 2.71 EPS calculations - the dilution in 2009 coming

Leahy !60
solely from the large amount of preferred dividends, and the 2010 dilution from the smaller
amount of preferred dividends coupled with the large increase in shares outstanding.
2011 EPS Increase - The increase in the earnings per share value from 2010 to 2011 appears
more drastic than it actually is. As mentioned in the addressing of the 2010 EPS discrepancy
above, the approximate calculated value for 2010 was 2.71. An identical recalculation reveals an
EPS of 3.00, but more importantly only an increase of 11%, and not 28% as represented on the
graph. Like 2010, preferred dividends are being taken into account ($844 million), which is
responsible for the 0.15 difference in the reported value.
2012 & 2013 EPS Increases - The sizable increases in EPS are proportionate to the increases in
net income for the two mentioned years. Differences between the percentage increase in net
income and percentage increase in earnings per share are due to preferred dividends, as the
change in net income doesn't take them into account, yet the change in reported earnings per
share does* . 90
This is a flaw in my data analysis. Recalculation shows both NI & EPS improving 16.1%90
Leahy !61
4.4e Pfizer!
! Similar to Boeing, Pfizer saw an unusual trend as their trend in percentage increases
flipped in 2009 from EPS leading net income, to vice versa. In 2009, Pfizer did not repurchase
any shares of stock, however their total number of shares outstanding increased by 1,029 million
shares; a large enough amount of shares issued to cause a dilution trend responsible for such
percentage shifts. In comparing the three EPS values above, it is no coincidence that starting in
2009, recalculated values under the second method resulted in EPS values that exceeded that of
reported basic reported earnings info.
From 2004 to 2013, their earnings per share increased from 1.51 to 1.67, however the
EPS values fluctuated widely during the period. Pfizer repurchased a total of 2,470 million
shares during the period, and on average 274 million a year (2470 / 9 - discounting the tenth year
[2009] where none were made), or 3.77% of total shares outstanding. As seen in the bar graph,
the volatile and fluid nature of percentage changes has played a large hindrance in attempting to
determine trends during the period. !
Pfizer Data Discrepancies
PFE - Earning Per Share Comparison
2004 2005 2006 2007 2008 2009 2010 2011 2012 2013
Reported 1.51 1.03 1.52 1.19 1.19 1.23 1.03 1.00 1.21 1.67
Recalc 1.48 1.02 1.49 1.15 1.19 1.23 1.02 1.24 1.91 3.10
PY Recalc 1.57 1.01 1.50 1.13 1.16 1.28 1.18 1.25 1.86 2.96
ROA Recalc
1.57 1.06 1.58 1.25 1.20 1.23 1.03 1.30 2.00 3.39
Forecast - - - - - - - 1.30 1.40 3.20

Leahy !62
2005 Net Income - Pfizer experienced a 33% decrease in net income in 2005, which Pfizer
mentions was “impacted by the loss of exclusivity in the U.S. of certain key medicines (Diflucan,
Neurontin, Accupril/Accuretic, and Zithromax), uncertainty related to Celebrex and the
suspension of Bextra sales”. Additionally, their net incomes $3.3 billion decrease reflects “in-
process research and development charges of $1.7 billion related to our acquisitions of Vicuron
Pharmaceuticals, Inc. and Idun Pharmaceuticals, Inc; asset impairment and other charges of $1.2
billion associated with the suspension of sales of Bextra; restructuring charges and merger-
related costs”.
2007 Net Income - Pfizer’s 26% decrease in net income was impacted by the “loss of U.S.
exclusivity on Zoloft in August 2006 and Norvasc in March 2007. Zoloft and Norvasc
collectively experienced a decline in revenues of about $3.5 billion in 2007 compared to 2006”.
2010 EPS Reduction - In October 2009, Pfizer acquired all the outstanding equity of the
pharmaceutical company Wyeth in a “cash and stock transaction”. Approximately 1.3 billion
shares of Pfizer common stock, previously held as Pfizer treasury stock, were issued to former
Wyeth shareholders.
2011 & 2012 EPS Discrepancies - Acknowledging the sizable differences between Pfizer’s
reported and the numerous recalculated earnings per share values in the years 2011 and 2012
(approx. “0.25” less and “0.71” less, respectively), further research revealed that Pfizer attributed
value decreases of 0.28 and 0.74 in 2011 and 2012 due to “discontinued operations”.
2013 Net Income Increase - Pfizer’s 2013 revenues decreased 6% in 2013. The 51% increase in
their net income (roughly $7.5 billion) is due to the “full disposition of our Animal Health
business (Zoetis), and recognized a gain of approximately $10.3 billion, net of tax.” The

Leahy !63
associated discrepancy with the difference between the reported and calculated earnings per
share values (reported: 1.67, calculated: 3.23) is entirely a result of the transaction directly
above, as the vast increase in net income is due to “discontinued operations”. In their
supplemental data, Pfizer calculates and mentions an EPS value reduction of 1.54 attributable to
the income from discontinued operations.
!4.6 Overall Analysis
Generally, percentage increases in net income on a year to year basis were outpaced by
percentage increases in Earnings Per Share values - a sign that the EPS increase is not entirely
due to an increase in net income. Recalculated earnings per share were almost always lower than
initially recorded earnings per share. Across all five companies, earnings per share decreases post
adjustment ranged from 1- 2%, on average the value decreased by 1.413% when adjusting for
share repurchases. Furthermore, these companies typically repurchased 2.82% of their shares
outstanding in a given year. A follow up question post analysis includes what percentage is the
threshold for influencing investor decisions. While these percentages certainly indicate that
adjusting for share repurchases has an effect on the final earnings per share value , the
percentages were definitely smaller than initially anticipated, leading to the assumption that the
magnitude of this situation/occurrence is less prevalent.
*There exists a flaw in the first method of recalculating earnings per share that should be
noted, as simply recalculating earnings per share with adding back the shares recalculated will
EVERY TIME increase the denominator, subsequently decreasing earnings per share.
!

Leahy !64
Chapter 5: Analysis Matrix
5.1 Enterprises !
! Stock repurchases affect enterprises in a number of ways. Looking at the enterprises on
an individual, internal level, efforts to modify the earnings per share (EPS) formula in theory
force the ratio to more accurately reflect true, and also ideally current, earnings. This modified
ratio would be able to counteract the effects of repurchase programs that reduce the number of
shares available and boost the EPS ratio by reducing the formula denominator. While the Board
of Directors job is to maximize shareholder value, meaning one cannot blame them for
implementing repurchase programs to achieve just this, one interesting facet of these actions is
when the Board utilizes the programs to reach EPS bonus thresholds. Maximizing shareholder
value is one thing. However, these bonus thresholds are in place to reward directors for improved
company performance throughout the year. If net income does not change between two years, yet
stocks are repurchased boosting EPS, directors are not being rewarded for physical progress but
a simple mathematical manipulation. Implementation of a modified EPS formula keeps
enterprises more “honest” about their own performance. Furthermore, in looking at this effect in
comparing two enterprises to each other, it creates better transparency in comparing the two.
These results then improve operations from the standpoint that it tracks actual progress from year
to year. While management ideally would understand reasoning behind increased or decreased
EPS over time, this modification would remove any doubt that this manipulation affected in any
way at all internal enterprise decisions. By virtue of this theory, it would improve management
decisions were any decisions to ever be made solely on progress or lack thereof in the EPS
formula. "

Leahy !65
2. Users - Of the three components of the matrix, users are most significantly impacted by the
findings of my research. They are impacted in two capacities: users are shareholders, and users as
potential investors. Users as shareholders are impacted as the modified formula allows them to
have a more accurate understanding of the true value of their stock, as well as company
performance. Just like potential investors, it allows these stockholders to make more accurate
decisions regarding their stock - to continue to be a shareholder, to sell, or to even purchase
additional stock. Potential investors benefit in both of these regards as well, as mentioned before,
from increased comparability among companies that perform repurchases when considering
purchasing one stock over another. In both capacities, the users are enabled to make even more
educated decisions. This implementation however extends even beyond the value of one’s own
stock, but to other aspects of a companies actions. For example, increased awareness of a
company’s true performance allows shareholders to vote more accurately in shareholder
meetings. The users are the main recipient of the benefits of a modified EPS formula, whether or
not they are actual shareholders or potential investors."
! The segment of users debatably most important in this case are the analysts. The analysts
base their forecasts off earnings trends. The more transparent the earnings, the more accurate the
forecast. The analysts are actually the most important beneficiary of improved earnings
reporting transparency, because they in turn affect all investors.!
3. Auditors - The implementation of my research and the modification of the earnings per share
formula does not specifically improve the performance of audits on a company. However, it does
affect auditors not so much performing audits, but rather some sorts of advisory services.
Auditors, while obviously have an intense knowledge of company financials and performance,

Leahy !66
would be able to provide even better advice to the companies they advise in all aspects, but none
more specifically than the actions that directly impact stockholder dealings. "
!Chapter 6: Conclusion
6.1 Hypotheses Compilation
1. Earnings Per Share
2. Inadequate Disclosures
3. Substitution Hypothesis
4. Anti - Dilutive Purposes
!Hypothesis 1:
Earnings Per Share increases are driven by more than net income. The Accounting Standards
Codification 260 – Earnings Per Share (to be covered in detail in Chapter 2) states that "the
objective of EPS is to measure the performance of an entity over the reporting period"
Emphasizing the idea of "measuring performance," in comparing the two ways earnings per
share can increase, "performance" undoubtedly refers to a net income figure as opposed to the
act of share count reduction. Net income reflects company performance, the act of reducing share
counts does not.
Taking the assumption that net income is reflective of company performance more so
than share repurchases, changes in net income should be driving the changes in earnings per
share. Mathematically, percentage change in net income in comparison to percentage change in

Leahy !67
the earnings per share value should at the very least be equivalent percentage changes. Two basic
examples provide this theory below:
The existence of scenarios where percentage increases in earnings per share outpace
percentage increases in net income suggest that the increase in earnings per share is due to more
than an improved company "performance" from year to year. It should be noted that this paper is
not stating the existence of this occurrence is negative, it is merely bringing to light that it exists.
The research conducted to examine this hypothesis involved calculating the percentage
changes from one year to the next of both net income and earnings per share. This was done by
taking the current year value (net income; EPS), subtracting the previous year value, and then
dividing the remaining figure by the previous year value to isolate the percent increase.
Additionally, total share amounts of repurchases and stock issued and exercised were
compared to achieve a net figure for the year. This was done by taking the amount “issued/
exercised” for the year and subtracted from that the amount repurchased. Throughout the data
analysis, 33 times out of 47 increases in net income were exceeded by percentage increases in 91
Percentage Increase Example
Scenario 1 Scenario 2Net Income $900 $1,100
Shares Outstanding 100 200
EPS 9 (900/100) 5.5 (1100/200)
Net Income % Increase 990 (10%) 1155 (5%)
Updated EPS 9.9 (10% Increase) 5.775 (5% Increase)
As previously mentioned, the reasons for odd “total” numbers (47) due to fact that since 91
percentage increase comparisons require a previous year value to calculate, 9 data values were calculated for each company instead of 10 (except for MSFT and WMT since their 2014 information was available at the time data analysis was performed.

Leahy !68
earnings per share. Of these 33 occurrences, 25 of them came in years where shares outstanding
decreased from the beginning to the end of the year. The initial hypothesis believed two things:
-that EPS values where being increased by more than company performance
-that stock repurchases played a role in this additional increase.
25 times repurchases at least played a part in this occurrence.
!Hypothesis 2 – Inadequate Disclosures
In many cases it appears that the increase in EPS is due to repurchase programs. The
result of increases to EPS that is caused by share repurchases are note being adequately disclosed
in the financial statements. As a result, investors are unaware of these “mathematical” increases
and are thus not making entirely correctly informed investing decisions.
The data to be disclosed required to make an informed decision regarding repurchase
programs and their effects on earnings per share would include: net income, amount spent on
preferred dividends, weighted average shares outstanding, and changes in total number of shares
outstanding throughout the year (which would include the number of shares repurchased, issued,
and exercised during the year). According to ASC 260, "for each period in which an income
statement is presented, a reconciliation of the numerators and denominators of the basic and
diluted per-share computations for income from continuing operations" shall be disclosed . 92
The financial statements of the five researched companies for the past five years were
closely analyzed to determine the types of disclosures made by each company in comparison to
each other, as well as the consistency of the disclosures within each company on a year to year
“FASB Accounting Standards Codification: About the Codification”. The Financial Accounting 92
Standards Board. January 2014. https://asc.fasb.org/imageRoot/47/49128947.pdf

Leahy !69
basis. The basic findings in the each of the financial statements include brief descriptions of the
status of the current repurchase program, factors considered when considering implementing a
repurchase, and the explanation of how the calculations for basic and diluted EPS values were
achieved.
Addressing more complex data pertinent to specific repurchase and EPS transactions, one
common component found in each set of financial statements was the presence of "Item 5:
Markey for Registrants Common Equity, Related Stockholder Matters and Issuer Purchases of
Equity Securities". This item includes a monthly breakdown of stock repurchases that took place
in the last quarter of the fiscal year. Provided in this monthly breakdown are the total number of
shares repurchased, the average price paid, and approximate dollar value that may yet be
repurchased under the repurchase program.
Present in only two of the five company's sets of financial statements (Boeing and
Microsoft) were reconciliations of the changes in outstanding share balance throughout the year
to account for repurchases, issuances, and stock exercised. These reconciliations were found
consistently on a year to year basis in the two mentioned companies, while not at all in any of the
other three companies' financial statements for any of the years given. Additionally, of these 25
total financial statements closely scrutinized, only 13 of them contained disclosed information
describing specific total repurchases made in the last three years. Only eight specific instances
revealed comments found in Management's Discussion and Analysis directly addressing the
underlying factors for the change in earnings per share from year to year. Only seven of the
twenty-five times were the required "ASC 260 reconciliations" found within the financial
reports.

Leahy !70
At a very basic level, each set of financial statements already consists of the necessary
information needed to identify and calculate factors that could impact earnings per share
calculations. Basic and diluted earnings per share values are provided in each financial report's
income statement, more often than not accompanied by weighted share information. If not,
common stock information regarding shares outstanding is also presented in the balance sheet.
Additional information required to make an informed decision regarding earnings per share
values include the number and dollar value of shares repurchased, as well as the pertaining to
stock issued and exercised during the same period. This information can be found in the
statements of shareholder's equity, along with the statement of cash flows.
However, during the research process the most meaningful comments found regarding
increases and decreases in earnings per share (such as due to increase in net income, reduction in
shares outstanding, etc.) came in either one sentence within the dense body of the financial
statements (8 out of 25), or in microscopic font as part of a footnote . Most of these footnotes
were not even found in notes or sections related to earnings per share or repurchase programs.
Unaudited quarterly information and company specific non-GAAP adjusted income per share
calculations when applicable provided such footnotes explaining the quantified effects of an
unexpected loss or gain on the EPS value as a whole. For example, a loss from the
discontinuance of operations impacted diluted earnings per share by $0.07. Additionally, sparse
comments were made in reference to the existence of using this adjusted form of income per
share as a determinant for executive compensation levels.
The information required to make informed decisions regarding share repurchase
programs and their impact on earnings per share values is already present in the financial

Leahy !71
statements. That being said, the information is scattered, and would benefit from specific
required notes to the financial statements for better comparability. Certain companies, Microsoft
for example, do a very good job of compiling this related information into such specific notes;
one regarding "stockholder's equity/common stock," and the other regarding "earnings per
share". Microsoft includes in the first section a reconciliation of the change in share count during
the year, along with total share count and accompanying dollar figures per quarter of share
repurchases. Their second section includes, as a majority of the companies did on a yearly basis,
a step by step calculation of earnings per share. A suggested additional section to include would
be a short paragraph in management's discussion and analysis devoted to addressing earnings per
share changes from year to year.
Final takeaways from the financial statement disclosure analysis are that companies
prefer to use diluted earnings per share as opposed to basic earnings per share. In all eight of
management's references to the specific underlying reasons for changes in earnings per share,
they referenced the change in diluted earnings per share as opposed to basic. Similarly, when the
seldom comments were made regarding executive compensation, those bonus thresholds were
achieved when hitting a company's own specific adjusted diluted income per share. This simply
could be due to the fact that these companies have complex capital structures and they feel this
value is more indicative, yet the assumption remains that companies would prefer to report a
higher earnings per share (as basic undoubtedly would be) if given the option.
Hypothesis 3 – Substitution Hypothesis
The substitution hypothesis is based on the theory that in regards to corporate payout
policy, dividends and stock repurchases are interchangeable; perfect substitutes, where either can

Leahy !72
be implemented to achieve the same desired outcome. Through one study, Harvard business
professor John Lintner determined that there is a negative correlation between dividend forecasts
and the amount spent on repurchases- the difference between actual and expected dividends
becomes increasingly negative as more cash is spent on stock repurchases. Other experts argue
the opposite of this hypothesis. These advocates of the contrary state that dividends are tied to
permanent, established earnings and repurchases are funded with additional, temporary earnings.
Additional contrarians argue that repurchases are simply used to offset reductions in earnings.
The purpose of testing this hypothesis is to determine the substitutability of these two
corporate payout methods. The current belief prior to testing is that dividends and repurchases
are not interchangeable and that there are different motives for implementing one form of a
payout versus another. If it were to be determined that they are perfect substitutes, then that
finding would disprove the current belief. The testing that was performed included comparing
dollar amounts spent on dividends versus repurchases, and either of these payouts as percentages
of either net income or total dollar amounts spent on payouts during the year. The idea behind the
data analysis was searching for whether there were certain percentages of either net income or
total payouts that a company tried to maintain in respect to either payout form, as well as certain
thresholds of amounts spent on either payout.
Microsoft!$ Earned versus $ Repurchased
(in millions) 2005 - 2006 2008 - 2009 2012 - 2013 2013 - 2014
Change in NI $345 ($3,112) $4,885 $221
Change in $ Repo $11,150 ($3,180) $331 $1,956

Leahy !73
For Microsoft, the trend for the amount of money spent on dividends revealed that
despite positive or negative decreases in net income from year to year, the general amount spent
on dividends remained constant. In regards to repurchases, there does not appear to be a specific
trend, no mathematical basis, percentage of net income or total payout dollars, that fuels the
amount of money spent on repurchases. From 2005 to 2006, net income minutely increased, yet
the amount spent on repurchases increased by $11 billion. This could potentially signal that they
were attempting to hit or maintain an EPS forecast for that year without improved performance
from net income. Yet, from 2008 to 2009 when net income decreased by $3.0 billion, the
percentage amount of dollars spent on repurchases as a part of both the total payout policy dollar
amount ($dividends+ $repurchases) and as a percentage of net income both decreased by 8% and
6% respectively. From 2011 to 2012, net income decreased by $6 billion and the dollar amount
of repurchases was cut in half. In the years 2012 -2014, as net income continuously increased,
the amount spent on dividends exceeded the amount spent on repurchases. These three statistics
reveal that at least for Microsoft, there is no trend either way. In comparable years of stagnant or
decreased earnings, repurchases increased in one instance and decreased in the other, dispelling
the idea of repurchases offset earnings reductions. Similarly, with the final three years of analysis
with an increasing net income, the dollar amount spent on repurchases stayed the same,
discouraging the idea that increased repurchases are fueled with excess earnings.
Boeing!$ Earned versus $ Repurchased
(in millions) 2004 - 2005 2008 - 2009 2010 - 2011
Change in NI $742 ($1,319) $700
Change in $ Repo $2,125 ($2,887) 0

Leahy !74
For Boeing, a lack of trend also exists in regards to amount spent on repurchases. A $0.7
billion increased net income from 2004 to 2005 saw an increase in share repurchases, whereas a
$1.3 billion decrease in net income from 2008 to 2009 saw an increase in share repurchases as
well, and a more than doubling of net income in the year 2010 was coupled with no repurchases
at all. However, similar to Microsoft, Boeing did consistently maintain a similar amount spent on
dividends from year to year.
Pfizer, like the two other companies mentioned to this point, also consistently spent the
same amount on dividends year over year without showing a trend in repurchase spending. A
$3.5 billion decreased net income in 2005 resulted in a similar dollar amount decrease in
repurchases. A $2.8 billion decreased net income in 2007 resulted in a $3 billion increase in
repurchases. $4.5 billion in increased net income in 2012 saw a reduction of $0.8 billion in
repurchases in comparison to the prior year dollar amount.
Pfizer!$ Earned versus $ Repurchased
(in millions) 2004 - 2005 2007 - 2008 2011 - 2012
Change in NI ($3,722) ($187) $4,561
Change in $ Repo ($2,862) ($9,494) ($772)
Walmart!$ Earned versus $ Repurchased
(in millions) 2004 - 2005 2008 - 2009 2012 - 2013
Change in NI $1,213 $650 $1,300
Change in $ Repo ($497) ($4,170) $1,302

Leahy !75
Like clockwork (and the other three companies before them), Walmart spent roughly 30%
of their net income on dividends year after year. What is interesting about this percentage fact in
comparison to the next company, Wells Fargo, is that Wells Fargo reflects a similar trend of
consistently spending the same amount on dividends year over year, while the actual amount
spent on dividends as a percentage of net income fluctuated more so than Walmart's consistent
30%. Similar to the repurchase trend perceived to this point, for both Walmart and Wells Fargo
certain years of increased net income were accompanied with increased repurchases in some
years and decreased repurchases in others.
!
Wells Fargo!$ Earned versus $ Repurchased
(in millions) 2004 - 2005 2005 - 2006 2006 - 2007
Change in NI $657 $749 ($363)
Change in $ Repo $971 ($1,194) $5,453
Microsoft!Percentage Change - Repurchases vs. Dividends
2008 - 2009 2010 - 2011 2012 - 2013 2013 - 2014
Change in Repo. (25.4%) 3% 7% 36%
Change in Div. 11% 13% 17% 19%
Change in NI (17%) 23% 28% 1%
Boeing!Percentage Change - Repurchases vs. Dividends
2004 - 2005 2005 - 2006 2006- 2007 2007 - 2008
Change in Repo. 283% (41%) 63% 6%
Change in Div. 27% 17% 15% 9%
Change in NI 40% (13%) 84% (35%)

Leahy !76
!
Overall, each of the five companies seems to have a general amount – whether the same
dollar amount or same percentage of net income – that they are looking to spend on dividends on
a yearly basis. The five continuous tables above illustrate that while percentage changes in net
income and amount spent on repurchases fluctuated widely, percentage increase in dividends
remained constant. Percentage trends for repurchases were compared both in relationship to net
income as well as total dollar payout and still no correlation was found.
Pfizer!Percentage Change - Repurchases vs. Dividends
2004 - 2005 2006- 2007 2007 - 2008 2011 - 2012
Change in Repo. (43%) 43% (95%) (9%)
Change in Div. 9% 15% 7% 5%
Change in NI (32%) (25%) (2%) 45%
Walmart!Percentage Change - Repurchases vs. Dividends
2005 - 2006 2006- 2007 2009 - 2010 2012 - 2013
Change in Repo. (21%) (52%) 107% 21%
Change in Div. 13% 12% 13% 6%
Change in NI 9% 0.5% 7% 8%
Wells Fargo!Percentage Change - Repurchases vs. Dividends
2004 - 2005 2005- 2006 2006 - 2007 2007 - 2008
Change in Repo. 44% (38%) 278% (78%)
Change in Div. 7% 8% 9% 9%
Change in Ni 9% 10% (4%) (67%)

Leahy !77
These findings dispel both the theories that repurchases are only used to offset reductions
in earnings or that repurchases are funded only with temporary earnings. Despite the fluctuations
in repurchases, the amount spent on dividends did not change. Revisiting the theory that
dividends are funded with “permanent earnings,” while within the scope of this research and the
fluctuations of earnings throughout the time period analyzed it is hard to determine a percentage
of net income in a given year that is permanent as opposed to temporary, the findings do reveal
that there is a definite aspect of permanence to the amount spent on dividends year after year.
Across all five companies, each company individually maintained a general amount of money
spent on dividends. However, this same fact also disproves within the confines of this study that
there is a negative correlation between the amount of money spent on repurchases and the
amount spent on dividends. The amount spent on repurchases fluctuated widely both between
years for the same company, as well as between companies, while the amount spent on dividends
remained constant the entire time.
The only certainties that can be taken away from this research are that dividends are
dependable on a year to year basis, they are not affected by the amount spent on repurchases, and
that the fluctuation in repurchases from year to year is not related to increases or decreases in net
income.
!Hypothesis 4 - Anti-Dilutive Purposes
Repurchase programs are being implemented to offset the yearly number of shares issued
and exercised as to maintain a general share count. The existence of this fact could be for several
reasons: the company has a general idea of the number of shares they want to have outstanding at

Leahy !78
any given time, they want to attempt to maintain ownership percentages, or they might want to
keep a certain amount of treasury stock on hand for employee stock options.
Wells Fargo specifically mentions in their financial statements that, “we do not have a
specific policy on repurchasing shares to satisfy share option exercises. Rather, we have a
general policy on repurchasing shares to meet common stock issuance requirements for our
benefit plans (including share option exercises), conversion of our convertible securities,
acquisitions and other corporate purposes.” While they specifically do not repurchase shares as
an anti-dilutive measure, it is a general policy to attempt to do something of the sort.
The research involved in addressing this hypothesis included a reconciliation of the share
balances of each company from the beginning to end of each year, and creating a net figure of
the amount of shares repurchased versus issued. Of 52 possible years from the five company data
analyzed, in 30 instances the amount of shares repurchased exceeded the amount of stock issue
and exercised. Of these 30 occurrences, each year averaged 107 million more shares of stock
repurchased than issued. Microsoft and Walmart repurchased the most amounts of their own
stock on a yearly basis.
The data reveals that repurchases in fact are not being used as an anti-dilutive measure to
counteract stock issued. If it were being used as such, the net figure of repurchased and issued,
while not necessarily having to equal zero and totally canceling each other out, would at least be
a small number. The fact that in 30 of 52 analyzed fiscal years stock repurchased exceeded stock
issued by an average of 107 million shares more than illustrates that repurchases are not being
used to counteract stock issuance.
!

Leahy !79
6.2 Final Conclusion
The initial basis of this paper was founded on two ideas: that earnings per share values
were being affected by more than just increased net income performance, and that the
supplementary information necessary for investors to base their EPS influenced investing
decisions off of was not adequate.
The first and foremost takeaway from this research is that the trend of these five
researched companies found that shares outstanding were reduced each year, except for the last
six years for Wells Fargo. Below is the total change in share balance, comparing the 2004 count
to 2013 . 93
Addressing the first hypothesis, the findings confirmed that earnings per share increases
were due to more than just increased company performance from year to year. The reason for the
additional increase can be directly attributed to share repurchases, based off of both the data
gathered, as well as the simplicity of the earnings per share formula. Initially, the third basis of
this paper rested on the idea that share repurchases were unethical and that they manipulate
potential investor decisions. As the research for this paper progressed, the widespread prevalence
Change in Share Count: 2004 - 2013!Comparing Shares Outsanding
Microsoft (2,623M)
Boeing (45.8M)
Pfizer (718M)
Walmart (1,094M)
Wells Fargo +1,902M
2014 for Walmart, Microsoft93

Leahy !80
of repurchase program implementation became more well known. In addition, coupled with idea
that it is the board of directors duty to maximize shareholder value, it would appear that
repurchase programs are in fact not unethical. Furthermore, these repurchase programs not only
benefit current investors by maximizing shareholder value, under the assumptions that these
potential investors do decide to invest based on what initially was perceived as “manipulated
decisions” and that since the company has implemented repurchases in the past that they will
implement them in the future, these repurchases are actually benefitting the shareholders (or at
least canceling out the effects of the initial “inflated” value that they based their decision off of
since by virtue of more repurchases in the future that EPS value will continue to rise).
Addressing the second hypothesis that the disclosures are inadequate, this is simply not
the case. All the required information to make an informed decision based on the makeup of the
EPS value is provided in the financial statements. However, this information, while present, is
scattered. It is highly suggested that the additional disclosures in the notes to financial statements
become more regulated to increase comparability. An additional note compiling the necessary
information that illustrates the full picture of how the earnings per share changed from year to
year would greatly enhance investor decision making, with the inclusion of the initial forecasted
EPS. Upon the announcement of a repurchase throughout the year, based on the assumption that
analysts would update their EPS forecast, the company performing the repurchase would have to
report publicly this updated forecast as well. While not likely, a further note to be added would
include what earnings per share for the year would look like without the net effect of the
issuances and repurchases having taken place at all throughout the year. Finally, a mandated
Leahy !81
addressing of earnings per share value changes in an added portion of managements discussion
and analysis is another addition the findings of this research project deem necessary.
This paper initially had a goal of curing the perceived lack of transparency provided by
EPS inflated numbers, a solution that was hoped to be achieved by the creation of a new
mathematical formula. In theory, statistical analysis can be performed to isolate the numerous
factors (EPS forecasts, stock price, executive compensation, dilution from stock options) that
cause EPS increases to recalculate an EPS value deemed to be truly reflective of the company’s
financial situation. Numerous amounts of additional research would be needed to be performed
and at this level, the required information is not accessible. That information would include, for
example, detailed information regarding specific timing of repurchase implementation so as to
compare to stock price reactions, the correlation of percentage increase in EPS to ability to
influence investor decisions, executive compensation structure - specifically any and all
undisclosed bonus thresholds (especially EPS specific), and access to analysts’ EPS forecast
prior to 2011 .
Repurchases do significantly affect the meaning and value of the earnings per share ratio.
The meaning of the EPS value is most significant in two scenarios: in comparing the values
between two companies in the same year, or in comparing the values between years at the same
company. This paper is of the belief that the impact is more significant between companies than
between years. Both impacts are significant, but the reasoning for the above statement was
reached due to the fact that as EPS values are relative and investors are looking to see increases
from a company year after year. While the “base” EPS might be inflated, those increases from

Leahy !82
year to year still need to take place to satisfy investors and if the increase is not coming from
performance, the amount of stock to be repurchased to satisfy that EPS increase would be too
large not to go unnoticed by investors. The issue of comparison between companies still exists
due to the differing amounts of repurchases and overall change in outstanding stock that is taking
place at different times and quantities for different companies. However, since this information is
available in the financial statements the effects should be able to be within reason taken into
account.
This final data table example illustrates the above point regarding ways to increase EPS.
Assuming a projected earnings per share forecast of 2.50 for the year 2014, without an increase
in net income the sample company would have to repurchase 25% of their outstanding stock to
achieve the target EPS - the size of the repurchase being too large to go unnoticed by investors
regardless of the level of disclosure emphasized by the company (when, where, how, and the
number of times in the financial statements the repurchase is mentioned).
Stock repurchase programs do influence earnings per share values. However, the required
information is available for investors to determine whether or not they feel that reported value is
an accurate representation of the true earnings attributable to each share of stock. While the true
earnings attributable to a share of stock, what is being reported, and a company’s performance
Earnings Per Share Increase Example
2013 2014(A) 2014(B)
Net Income $1,000,000 $1,250,000 $1,000,000
Shares Outstanding 500,000 500,000 400,000
EPS 2.00 2.50 2.50

Leahy !83
might not all be the same, this does not remove the fact that they still need to achieve that
increase from year to year to satisfy current and potential investors. Keeping in mind the duty of
the board of directors, the stance of this paper is now that such programs are encouraged.
Chapter 7: Areas of Further Study
7.1 Quantification
-Quantifying the percentage increases threshold that affects investor decision making-
The paper does an adequate job of quantifying the percentage increase caused by a repurchase
program (limited by the ability to accurately determine the weighted amount of shares to add
back, plus the overall net effect when taking into account dilutive securities). However, to
achieve the initial desired outcome, this information would only be pertinent were there to be an
established percentage threshold that would determine investor action or lack thereof.
7.2 Forecast Data
The inability to access analyst EPS forecast data prior to 2011 severely hindered the project.
Undoubtedly hitting forecast marks directly influence EPS - “improving/manipulative”
decisions. Inability to access the forecast trend for more than three years directly inhibited the
ability to establish a trend. Access to such information might be able to narrow, not finalize the
solution to determining when repurchases are implemented to hit forecast data.
7.3 Repurchase Timing

Leahy !84
The inability to access to more specific timing information , along with the ability to isolate and
quantify market reactions to announcements of share repurchase programs (announcement of
repurchase program itself, physical repurchase of stock in days/months/quarters following, etc)
would aid this papers ability to address hypotheses regarding maintaining earnings trends and
offsetting reductions in earnings by “trying” to signal the belief that the stock is undervalued.
7.4 Executive Compensation Payment Structure
Data relevant to attempting to identify scenarios where a company is implementing a repurchase
to hit executive bonus threshold is not accessible. Access to that information would also aid in a
corresponding side project of how to structure executive compensation to truly align the goals of
the executives and the company.
7.5 Theory
It was once theorized that even if the market in fact is too smart for management (*discounting
EPS boosts due to repurchases*), if management believes they in fact are smarter than the
market, they will act on it. It would be almost impossible to see if this were true, how to
determine when that were the case as opposed to another reason, and what it even meant if that
in fact were the case. The existence of this idea does however suggest that it could be true in
certain scenarios.
!!!

Leahy !85
Bibliography
!Allen, Franklin, Antonio Bernardo, and Ivo Welch, 2000, “A theory of dividends based on"tax clientele, Journal of Finance 55, 2499-2536."!"ASC 260 - Earnings Per Share." Deloitte - US GAAP Plus. Deloitte, n.d. Web. 11 Jan. 2015. <http://www.iasplus.com/en-us/standards/fasb/presentation/asc260>.!!Authorized Stock. Investopedia. N.p., 19 Nov. 2003. Web. 16 Feb. 2015. !<http://www.investopedia.com/terms/a/authorizedstock.asp>.!!Bens, Daniel A. and Nagar, Venky and Skinner, Douglas J. and Wong, M.H. Franco, Employee Stock Options, EPS Dilution, and Stock Repurchases. Journal of Accounting & Economics, Vol. 36, No. 1-3, pp. 51-90, December 2003. !!Brav, Alon and Harvey, Campbell R. and Graham, John R. and Michaely, Roni, Payout Policy in the 21th Century: The Data (November 2005). Johnson School Research Paper Series No. 29-06. Available at SSRN: http://ssrn.com/abstract=850306!!Buffett, Warren. “http://www.valueinvestingworld.com/2012/09/warren-buffett-on-share-repurchases.html"!!"Common Stock." Investopedia. N.p., 19 Nov. 2003. Web. 15 Feb. 2015.! <http://www.investopedia.com/terms/c/commonstock.asp>.!!“Division of Market Regulation: Answers to FAQ’s conceding Rule 10b-18”. The United States Securities and Exchange Commission”. 17 Nov. 2004. http://www.sec.gov/divisions/marketreg/r10b18faq0504.htm!!“FASB Accounting Standards Codification: About the Codification”. The Financial Accounting Standards Board. January 2014. https://asc.fasb.org/imageRoot/47/49128947.pdf!!Financial Reporting Developments - Earnings Per Share. FASB ASC 260”. Ernst & Young. May 20 2014. !!"Final Rule 10b-18: Purchases of Certain Equity Securities by the Issuer and Others." Sec.gov. The United States Securities and Exchange Commission, n.d. Web. 17 Feb. 2015. <http://www.sec.gov/rules/final/33-8335.htm>.!!Grullon, Gustavo and Michaely, Roni. “ Dividends, Share Repurchases, and the Substitution Hypothesis.” The Journal of Finance . Vol. 57, No. 4, Papers and Proceedings of the Sixty-Second Annual Meeting of the American Finance Association, Atlanta, Georgia, January 4-6, 2002 (Aug., 2002) , pp. 1649-1684 !!Hribar, Paul and Jenkins, Nicole Thorne and Johnson, W. Bruce, Stock Repurchases as an Earnings Management Device (March 2004). Available at SSRN: http://ssrn.com/abstract=524062 or http://dx.doi.org/10.2139/ssrn.524062!

Leahy !86
!Lintner, John. “Distribution of incomes of corporations among dividends, retained earnings, and taxes. American Economic Review. 46. 97-113. !!"Outstanding Shares." Investopedia. N.p., 24 Nov. 2003. Web. 16 Feb. 2015. !<http://www.investopedia.com/terms/o/outstandingshares.asp>.!!"Preferred Stock." Investopedia. N.p., 25 Nov. 2003. Web. 16 Feb. 2015. !<http://www.investopedia.com/terms/p/preferredstock.asp>.!!Randall, Maury R. "Share Repurchases: The Impact on Stock Valuation." Financial Practice And Education 10, no. 1 (Spring-Summer 2000 2000): 256-263. EconLit, EBSCOhost (accessed February 6, 2014).!!"Rule 10b-18." Investopedia. N.p., 10 Sept. 2006. Web. 16 Feb. 2015. <http://www.investopedia.com/terms/r/rule10b18.asp>.!!Securities and Exchange Commision. “http://www.sec.gov/rules/final/33-8335.htm”!!Spiceland, J. David, James F. Sepe, and Mark Nelson. Intermediate Accounting. New York: McGraw-Hill Irwin, 2011. Print.!!Stephens, Clifford P. and Jagannathan, Murali and Weisbach, Michael S., Financial Flexibility and The Choice Between Dividends and Stock Repurchases (February 3, 1999). Available at SSRN: http://ssrn.com/abstract=148548!!The Investors Advocate: How the SEC Protects Investors, Maintains Market Integrity, and Facilitates Capital Formation”. The Securities and Exchange Commission. 10 June 2013. http://www.sec.gov/about/whatwedo.shtml#.VOLDPCmGs20!!“6 Bad Stock Buyback Scenarios”. McClure, Ben. Investopedia. http://www.investopedia.com/articles/stocks/10/share-buybacks.asp. ! !
!!!!!

Leahy !87
Appendix - Data Sheets
!!!
Corporate Payout Policy
(in millions) Earnings Dividends Repurchased
1982 $104,009 $52,889 $10,561
1983 $130,466 $59,641 $9,195
1984 $151,854 $61,508 $28,625
1985 $144,720 $72,996 $44,104
1986 $133,920 $76,337 $39,371
1987 $185,145 $88,784 $55,039
1988 $219,724 $108,954 $53,640
1989 $226,501 $108,963 $59,845
1990 $211,826 $114,215 $46,759
1991 $168,838 $115,949 $26,126
1992 $171,498 $111,320 $33,296
1993 $210,036 $116,668 $36,378
1994 $303,136 $135,911 $46,589
1995 $335,534 $156,669 $72,467
1996 $438,505 $176,019 $103,337
1997 $461,392 $181,113 $146,753
1998 $438,693 $208,103 $199,190
1999 $516,174 $197,782 $202,844
2000 $464,851 $171,150 $194,263

MICROSOFT (MSFT)
2004 2005 2006 2007 2008 2009 2010 2011 2012 2013 2014
NI (millions) $! 8,168 $! 12,254 $! 12,599 $! 14,065 $! 17,681 $! 14,569 $! 18,760 $! 23,150 $! 16,978 $! 21,863 $! 22,074
Shares O/S (millions) 10,862 10,710 10,062 9,380 9,151 8,908 8,668 8,376 8,381 8,328 8,239
Reported Basic EPS 0.76 1.13 1.21 1.44 1.90 1.63 2.13 2.73 2.02 2.61 2.66
Shares Repurchased (millions) 123.7 312 754 971 402 318 380 447 142 158 175
/ 2 (weighted average) 61.85 156 377 485.5 201 159 190 223.5 71 79 87.5
Recalc Shares OS 10,923.85 10,866 10,439 9,866 9,352 9,067 8,858 8,600 8,452 8,407 8,327
Recalculated EPS** 0.748 1.128 1.207 1.426 1.891 1.607 2.118 2.692 2.009 2.601 2.651
Old EPS - New EPS 0.012 0.002 0.003 0.014 0.009 0.023 0.012 0.038 0.011 0.009 0.009
% Change EPS 1.62% 0.20% 0.25% 0.99% 0.49% 1.42% 0.57% 1.39% 0.56% 0.36% 0.34%
% Change NI - 50.02% 2.82% 11.64% 25.71% -17.60% 28.77% 23.40% -26.66% 28.77% 0.97%
% Change EPS (Reported) - 48.68% 7.08% 19.01% 31.94% -14.21% 30.67% 28.17% -26.01% 29.21% 1.92%
% Change EPS (Recalculated) - 50.82% 7.02% 18.13% 32.61% -15.01% 31.80% 27.11% -25.38% 29.46% 1.94%
B (beg. balance) 10,771 10,862 10,710 10,062 9,380 9,151 8,908 8,668 8,376 8,381 8,328
A (issued/exercised) 214.7 160.0 106.0 289.0 173.0 75.0 140.0 155.0 147.0 105.0 86
S (repurchased) 123.7 312 754 971 402 318 380 447 142 158 175
E (ending balance) 10,862 10,710 10,062 9,380 9,151 8,908 8,668 8,376 8,381 8,328 8,239
Net Change In Shares O/S 91.0 -152.0 -648.0 -682.0 -229.0 -243.0 -240.0 -292.0 5.0 -53.0 -89.0
Prior Year SOS Recalc
Current Year Net Income (Mil) $8,168 $12,254 $12,599 $14,065 $17,681 $14,569 $18,760 $23,150 $16,978 $21,863 $22,074
PY SOS (Mil) 10,771 10,862 10,710 10,062 9,380 9,151 8,908 8,668 8,376 8,381 8,328
Reported EPS 0.76 1.13 1.21 1.44 1.90 1.63 2.13 2.73 2.02 2.61 2.66
New, PY EPS 0.76 1.13 1.18 1.40 1.88 1.59 2.11 2.67 2.03 2.61 2.65
EPS:
Reported 0.76 1.13 1.21 1.44 1.90 1.63 2.13 2.73 2.02 2.61 2.66
Math Recalc** 0.75 1.13 1.21 1.43 1.89 1.61 2.12 2.69 2.01 2.60 2.65
PY Recalc 0.76 1.13 1.18 1.40 1.88 1.59 2.11 2.67 2.03 2.61 2.65
ROA:
Net Income $8,168 $12,254 $12,599 $14,065 $17,681 $14,569 $18,760 $23,150 $16,978 $21,863 $22,074
Average Total Assets (millions) 87,061 81,602 70,206 66,384 67,982 75,341 82,001 97,409 114,988 131,851 157,408
Shares Repurchased ($) 3,383 8,057 19,207 27,575 12,533 9,353 11,269 11,555 5,029 5,360 7,316
Dividends $$ 1729 36112 3545 3805 4015 4468 4578 5180 6385 7455 8879
Total $ $! 5,112 $! 44,169 $! 22,752 $! 31,380 $! 16,548 $! 13,821 $! 15,847 $! 16,735 $! 11,414 $! 12,815 $! 16,195
NET $ (Rep - Div) $! 1,654 $! (28,055) $! 15,662 $! 23,770 $! 8,518 $! 4,885 $! 6,691 $! 6,375 $! (1,356) $! (2,095) $! (1,563)
Repo % 66% 18% 84% 88% 76% 68% 71% 69% 44% 42% 45%
Dividend % 34% 82% 16% 12% 24% 32% 29% 31% 56% 58% 55%
ROA 0.094 0.150 0.179 0.212 0.260 0.193 0.229 0.238 0.148 0.166 0.140
Boost (millions) 317.39 1209.90 3446.84 5842.41 3259.63 1808.63 2578.10 2746.13 742.53 888.77 1025.95
NI + Boost $8,485.39 $13,463.90 $16,045.84 $19,907.41 $20,940.63 $16,377.63 $21,338.10 $25,896.13 $17,720.53 $22,751.77 $23,099.95
Recalc WS O/S 10,923.85 10,866.00 10,439.00 9,865.50 9,352.00 9,067.00 8,858.00 8,599.50 8,452.00 8,407.00 8,326.50
**Recalc EPS *** 0.78 1.24 1.54 2.02 2.24 1.81 2.41 3.01 2.10 2.71 2.77
Final EPS Comparison
Reported 0.76 1.13 1.21 1.44 1.90 1.63 2.13 2.73 2.02 2.61 2.66
PY Recalc 0.76 1.13 1.18 1.40 1.88 1.59 2.11 2.67 2.03 2.61 2.65
ROA Recalc 0.78 1.24 1.54 2.02 2.24 1.81 2.41 3.01 2.10 2.71 2.77
Math Recalc** 0.76 1.13 1.21 1.44 1.90 1.63 2.13 2.73 2.02 2.61 2.66
Analyst Forecast EPS N/A N/A N/A N/A N/A N/A N/A 2.60 2.73 2.75 2.69

Boeing (BA)
2004 2005 2006 2007 2008 2009 2010 2011 2012 2013
NI (millions) $! 1,820 $! 2,562 $! 2,206 $! 4,058 $! 2,654 $! 1,335 $! 3,311 $! 4,011 $! 3,900 $! 4,856
Shares O/S (millions) 793.2 760.5 757.8 736.7 698.1 726.3 735.3 744.7 755.6 747.4
Reported Basic EPS 2.27 3.26 2.88 5.36 3.68 1.89 4.50 5.38 5.15 6.03
Shares Repurchased (total) 14,708,856 45,217,300 24,982,867 29,024,031 43,611,485 1,650,328 0 0 0 25,400,000
/ 2 (weighted avg) 7,354,428 22,608,650 12,491,433.5 14,512,015.5 21,805,742.5 825,164 0 0 0 12,700,000
Recalc Shares OS 800.55 783.11 770.29 751.21 719.91 727.13 735.30 744.70 755.60 760.10
Recalculated EPS** $2.27 $3.27 $2.86 $5.40 $3.69 $1.84 $4.50 $5.39 $5.16 $6.39
Old EPS - New EPS -0.003 -0.012 0.016 -0.042 -0.007 0.054 -0.003 -0.006 -0.011 -0.359
% Change EPS -0.15% -0.36% 0.56% -0.78% -0.18% 2.86% -0.06% -0.11% -0.22% -5.95%
% Change NI - 40.77% -13.90% 83.95% -34.60% -49.70% 148.01% 21.14% -2.77% 24.51%
% Change EPS (Reported) - 43.61% -11.66% 86.11% -31.34% -48.64% 138.10% 19.56% -4.28% 17.09%
% Change EPS (Recalculated) - 43.91% -12.46% 88.62% -31.75% -50.20% 145.26% 19.61% -4.17% 23.78%
B (beg. balance) 800.2 793.2 760.5 757.8 736.7 698.1 726.3 735.3 744.7 755.6
A (issued/exercised) 7.71 12.52 22.28 7.92 5.01 29.85 9.00 9.40 10.90 17
S (repurchased) 14.71 45.22 24.98 29.02 43.61 1.65 0.00 0.00 0.00 25.40
E (ending balance) 793.2 760.5 757.8 736.7 698.1 726.3 735.3 744.7 755.6 747.4
Net Change In Shares OS -7.0 -32.7 -2.7 -21.1 -38.6 28.2 9.0 9.4 10.9 -8.2
Prior Year SOS Recalc
Current Year Net Income $! 1,820 $! 2,562 $! 2,206 $! 4,058 $! 2,654 $! 1,335 $! 3,311 $! 4,011 $! 3,900 $! 4,856
Prior Year Shares Oustanding 800.3 793.2 760.5 757.8 736.7 698.1 726.3 735.3 744.7 755.6
Reported Basic EPS 2.27 3.26 2.88 5.36 3.68 1.89 4.50 5.38 5.15 6.03
New, PY EPS 2.27 3.23 2.90 5.35 3.60 1.91 4.56 5.45 5.24 6.43
ROA:
Net Income $! 1,820 $! 2,562 $! 2,206 $! 4,058 $! 2,654 $! 1,335 $! 3,311 $! 4,011 $! 3,900 $! 4,856
Average Total Assets (millions) 53,475 57,011 55,926 55,390 56,383 57,916 65,309 74,276 84,441 90,780
Shares Repurchased ($) 752 2877 1698 2775 2937 50 0 0 0 2801
Dividends $ 648 820 956 1096 1192 1220 1253 1244 1322 1467
Total $ $! 1,400 $! 3,697 $! 2,654 $! 3,871 $! 4,129 $! 1,270 $! 1,253 $! 1,244 $! 1,322 $! 4,268
NET $ (Rep - Div) $! 104 $! 2,057 $! 742 $! 1,679 $! 1,745 $! (1,170) $! (1,253) $! (1,244) $! (1,322) $! 1,334
Repo % 54% 78% 64% 72% 71% 4% 0% 0% 0% 66%
Dividend % 46% 22% 36% 28% 29% 96% 100% 100% 100% 34%
Assets (millions) 53,963 60,058 51,794 58,986 53,779 62,053 68,565 79,986 88,896 92,663
Average Total 53,475 57,011 55,926 55,390 56,383 57,916 65,309 74,276 84,441 90,780
ROA 0.034 0.045 0.039 0.073 0.047 0.023 0.051 0.054 0.046 0.053
Boost (millions) 25.59 129.29 66.98 203.30 138.25 1.15 0.00 0.00 0.00 149.83
NI + Boost $! 1,845.59 $! 2,691.29 $! 2,272.98 $! 4,261.30 $! 2,792.25 $! 1,336.15 $! 3,311.00 $! 4,011.00 $! 3,900.00 $! 5,005.83
Recalc WS O/S 800.55 783.11 770.29 751.21 719.91 727.13 735.30 744.70 755.60 760.10
**ROA Recalc EPS *** 2.31 3.44 2.95 5.67 3.88 1.84 4.50 5.39 5.16 6.59
Final EPS Comparison:
Reported 2.27 3.26 2.88 5.36 3.68 1.89 4.50 5.38 5.15 6.03
Math Recalc** 2.27 3.27 2.86 5.40 3.69 1.84 4.50 5.39 5.16 6.39
PY Recalc 2.27 3.23 2.90 5.35 3.60 1.91 4.56 5.45 5.24 6.43
ROA Recalc 2.31 3.44 2.95 5.67 3.88 1.84 4.50 5.39 5.16 6.59
Analyst Forecast EPS N/A N/A N/A N/A N/A N/A N/A 4.44 5.00 5.80

PFIZER (PFE)
2004 2005 2006 2007 2008 2009 2010 2011 2012 2013
NI (millions) $! 11,332 $! 7,610 $! 11,024 $! 8,213 $! 8,026 $! 8,635 $! 8,257 $! 10,009 $! 14,570 $! 22,003
Shares O/S (millions) [WTD AVG] 7,531 7,361 7,242 6,917 6,727 7,007 8,036 7,817 7,442 6,813
Reported Basic EPS 1.51 1.03 1.52 1.19 1.19 1.23 1.03 1.00 1.21 1.67
Shares Repurchased (millions) 208 143 266 395 26 0 61 459 349 563/ 2 (weighted average) 104 71.5 133 197.5 13 0 30.5 229.5 174.5 281.5
Recalc. Shares O/S (millions) 7,635 7,432.5 7,375 7,114.5 6,740 7,007 8,066.5 8,046.5 7,616.5 7,094.5
Recalculated EPS 1.484 1.024 1.495 1.154 1.191 1.232 1.024 1.244 1.913 3.101
Old EPS - New EPS 0.026 0.006 0.025 0.036 -0.001 -0.002 0.006 -0.244 -0.703 -1.431
% Change EPS 1.71% 0.59% 1.66% 2.99% -0.07% -0.19% 0.62% -24.39% -58.10% -85.71%
% Change NI - -32.85% 44.86% -25.50% -2.28% 7.59% -4.38% 21.22% 45.57% 51.02%
% Change EPS (Reported) - -31.79% 47.57% -21.71% 0.00% 3.36% -16.26% -2.91% 21.00% 38.02%
% Change EPS (Recalculated) - -31.02% 45.99% -22.77% 3.15% 3.49% -16.94% 21.52% 53.79% 62.13%
Prior Year SOS Recalc
Current Year Net Income $! 11,332 $! 7,610 $! 11,024 $! 8,213 $! 8,026 $! 8,635 $! 8,257 $! 10,009 $! 14,570 $! 22,003
Year Prior SOS 7,213 7,531 7,361 7,242 6,917 6,727 7,007 8,036 7,817 7,442
Reported EPS 1.51 1.03 1.52 1.19 1.19 1.23 1.03 1.00 1.21 1.67
New, PY EPS 1.57 1.01 1.50 1.13 1.16 1.28 1.18 1.25 1.86 2.96
EPS:
Reported 1.51 1.03 1.52 1.19 1.19 1.23 1.03 1.00 1.21 1.67
Math Recalc** 1.48 1.02 1.49 1.15 1.19 1.23 1.02 1.24 1.91 3.10
PY Recalc 1.57 1.01 1.50 1.13 1.16 1.28 1.18 1.25 1.86 2.96
ROA:
Net Income $! 11,332 $! 7,610 $! 11,024 $! 8,213 $! 8,026 $! 8,635 $! 8,257 $! 10,009 $! 14,570 $! 22,003
Average Total Assets (millions) 120,230 120,327 115,904 115,053 113,208 162,049 203,982 191,508 186,900 178,950
Shares Repurchased ($) 6,659 3,797 6,979 9,994 500 0 1,000 9,000 8,228 16,920
Dividends $ 5082 5555 6919 7975 8541 5548 6088 6234 6534 6580
Total $ $! 11,741 $! 9,352 $! 13,898 $! 17,969 $! 9,041 $! 5,548 $! 7,088 $! 15,234 $! 14,762 $! 23,500
NET $ (Rep - Div) $! 1,577 $! (1,758) $! 60 $! 2,019 $! (8,041) $! (5,548) $! (5,088) $! 2,766 $! 1,694 $! 10,340
Repo % 57% 41% 50% 56% 6% 0% 14% 59% 56% 72%
Dividend % 43% 59% 50% 44% 94% 100% 86% 41% 44% 28%
Assets 123,684 116,970 114,837 115,268 111,148 212,949 195,014 188,002 185,798 172,101
Average Total 120,230 120,327 115,904 115,053 113,208 162,049 203,982 191,508 186,900 178,950
ROA 0.094 0.063 0.095 0.071 0.071 0.053 0.040 0.052 0.078 0.123
Boost (millions) 627.629 240.139 663.798 713.420 35.448 0.000 40.479 470.377 641.423 2080.424
NI + Boost $! 11,959.63 $! 7,850.14 $! 11,687.80 $! 8,926.42 $! 8,061.45 $! 8,635.00 $! 8,297.48 $! 10,479.38 $! 15,211.42 $! 24,083.42
Recalc WS O/S 7,635 7,433 7,375 7,115 6,740 7,007 8,067 8,047 7,617 7,095
**Recalc EPS *** 1.57 1.06 1.58 1.25 1.20 1.23 1.03 1.30 2.00 3.39
**SOS = “reported”, not WTD
B (beg. balance) 8,702 8,754 8,784 8,819 8,850 8,863 8,869 8,876 8,902 8,956
A (issued/exercised) 260 173 301 426 39 6 68 485 403 658
S (repurchased) 208 143 266 395 26 0 61 459 349 563
E (ending balance) 8,754 8,784 8,819 8,850 8,863 8,869 8,876 8,902 8,956 9,051
Net Change In SOS 52.00 30.00 35.00 31.00 13.00 6.00 7.00 26.00 54.00 95.00
Final EPS Comparison
Reported 1.51 1.03 1.52 1.19 1.19 1.23 1.03 1.00 1.21 1.67
Math Recalc** 1.48 1.02 1.49 1.15 1.19 1.23 1.02 1.24 1.91 3.10
PY Recalc 1.57 1.01 1.50 1.13 1.16 1.28 1.18 1.25 1.86 2.96
ROA Recalc 1.57 1.06 1.58 1.25 1.20 1.23 1.03 1.30 2.00 3.39
Analyst Forecast EPS N/A N/A N/A N/A N/A N/A N/A 1.30 1.40 3.20

WALMART (WMT)
2004 2005 2006 2007 2008 2009 2010 2011 2012 2013 2014
NI (millions) $! 9,054 $! 10,267 $! 11,231 $! 11,284 $! 12,731 $! 13,381 $! 14,370 $! 16,389 $! 15,699 $! 16,999 $! 16,022
Shares O/S (millions) 4,363 4,259 4,183 4,164 4,066 3,939 3,866 3,656 3,460 3,374 3,269
Reported Basic EPS 2.08 2.41 2.68 2.71 3.13 3.40 3.71 4.48 4.54 5.04 4.90
Shares Repurchased (millions) 91.9 81 74 39 166 61 145 280 115.3 113.2 89/ 2 (weighted average) 45.95 40.50 37.00 19.50 83.00 30.50 72.50 140.00 57.65 56.60 44.50Recalc. Shares O/S 4,408.95 4,299.5 4,220 4,183.5 4,149 3,969.5 3,938.5 3,796 3,517.65 3,430.6 3,313.5
Recalculated EPS 2.054 2.388 2.661 2.697 3.068 3.371 3.649 4.317 4.463 4.955 4.835
Old EPS - New EPS 0.026 0.022 0.019 0.013 0.062 0.029 0.061 0.163 0.077 0.085 0.065
% Change EPS 1.27% 0.91% 0.69% 0.47% 1.97% 0.85% 1.66% 3.63% 1.70% 1.68% 1.32%
% Change NI - 13.40% 9.39% 0.47% 12.82% 5.11% 7.39% 14.05% -4.21% 8.28% -5.75%
% Change EPS (Reported) - 15.87% 11.20% 1.12% 15.50% 8.63% 9.12% 20.75% 1.34% 11.01% -2.78%
% Change EPS (Recalculated)
- 16.28% 11.45% 1.35% 13.76% 9.86% 8.24% 18.33% 3.37% 11.03% -2.42%
Prior Year SOS Recalc
Current Year Net Income (Mil) $! 9,054 $! 10,267 $! 11,231 $! 11,284 $! 12,731 $! 13,381 $! 14,370 $! 16,389 $! 15,699 $! 16,999 $! 16,022
Year Prior SOS 4,430 4,363 4,259 4,183 4,164 4,066 3,939 3,866 3,656 3,460 3,374
Reported EPS 2.08 2.41 2.68 2.71 3.13 3.40 3.71 4.48 4.54 5.04 4.90
New, PY EPS 2.04 2.35 2.64 2.70 3.06 3.29 3.65 4.24 4.29 4.91 4.75
EPS:
Reported 2.08 2.41 2.68 2.71 3.13 3.40 3.71 4.48 4.54 5.04 4.90
Math Recalc** 2.05 2.39 2.66 2.70 3.07 3.37 3.65 4.32 4.46 4.96 4.84
PY Recalc 2.04 2.35 2.64 2.70 3.06 3.29 3.65 4.24 4.29 4.91 4.75
ROA:
Net Income $! 9,054 $! 10,267 $! 11,231 $! 11,284 $! 12,731 $! 13,381 $! 14,370 $! 16,389 $! 15,699 $! 16,999 $! 16,022
Average Total Assets 99,860 112,533 129,171 144,887 157,551 163,472 167,068 175,744 187,094 198,256 203,928
Shares Repurchased ($) 5046 4549 3580 1718 7691 3521 7276 14776 6298 7600 6683Dividends $$ 1569 2214.00 2511.00 2802.00 3586.00 3746.00 4217.00 4437.00 5048.00 5361.00 6139.00
Total $ $! 6,615 $! 6,763 $! 6,091 $! 4,520 $! 11,277 $! 7,267 $! 11,493 $! 19,213 $! 11,346 $! 12,961 $! 12,822
NET $ (Rep - Div) $! 3,477 $! 2,335 $! 1,069 $! (1,084) $! 4,105 $! (225) $! 3,059 $! 10,339 $! 1,250 $! 2,239 $! 544
Repo % 76% 67% 59% 38% 68% 48% 63% 77% 56% 59% 52%
Dividend % 24% 33% 41% 62% 32% 52% 37% 23% 44% 41% 48%
ROA 0.091 0.091 0.087 0.078 0.081 0.082 0.086 0.093 0.084 0.086 0.079
Boost (millions) 457.51 415.03 311.27 133.80 621.48 288.21 625.83 1377.94 528.46 651.64 525.06
NI + Boost $! 9,511.51 $! 10,682.03 $! 11,542.27 $! 11,417.80 $! 13,352.48 $! 13,669.21 $! 14,995.83 $! 17,766.94 $! 16,227.46 $! 17,650.64 $! 16,547.06
Recalc WS O/S 4,409.0 4,299.5 4,220.0 4,183.5 4,149.0 3,969.5 3,938.5 3,796.0 3,517.7 3,430.6 3,313.5
**Recalc EPS *** 2.16 2.48 2.74 2.73 3.22 3.44 3.81 4.68 4.61 5.15 4.99
B (beg balance) 4,395.0 4,311.0 4,234.0 4,165.0 4,131.0 3,973.0 3,925.0 3,786.0 3,516.0 3,418.0 3,314.0
A (issued/exercised) 7.9 4.0 5.0 5.0 8.0 13.0 6.0 10.0 17.3 9.2 -3.0
S (repurchased) 91.9 81.0 74.0 39.0 166.0 61.0 145.0 280.0 115.3 113.2 89.0
E (ending balance) 4,311.0 4,234.0 4,165.0 4,131.0 3,973.0 3,925.0 3,786.0 3,516.0 3,418.0 3,314.0 3,222.0
Net Change In Shares O/S -84.00 -77.00 -69.00 -34.00 -158.00 -48.00 -139.00 -270.00 -98.00 -104.00 -92.00
Final EPS Comparison
Reported 2.08 2.41 2.68 2.71 3.13 3.40 3.71 4.48 4.54 5.04 4.90
Math Recalc** 2.05 2.39 2.66 2.70 3.07 3.37 3.65 4.32 4.46 4.96 4.84
PY Recalc 2.04 2.35 2.64 2.70 3.06 3.29 3.65 4.24 4.29 4.91 4.75
ROA Recalc 2.16 2.48 2.74 2.73 3.22 3.44 3.81 4.68 4.61 5.15 4.99
Analyst Forecast EPS N/A N/A N/A N/A N/A N/A N/A 4.50 4.93 5.20 5.00

WELLS FARGO (WFC)
2004 2005 2006 2007 2008 2009 2010 2011 2012 2013
NI (millions) $! 7,014 $! 7,671 $! 8,420 $! 8,057 $! 2,655 $! 12,275 $! 12,362 $! 15,869 $! 18,897 $! 21,878
Shares O/S (millions) 3,384.4 3,372.5 3,368.3 3,348.5 3,378.1 4,545.2 5,226.8 5,278.1 5,287.6 5,287.3
Reported Basic EPS 2.07 2.27 2.52 2.41 0.70 1.76 2.23 2.85 3.40 3.95
Shares Repurchased (total) 38,172,556 52,798,864 58,534,072 220,327,473 52,154,513 8,274,015 3,010,451 85,779,031 119,586,873 124,179,383
/ 2 (weighted average) 19,086,278 26,399,432 29,267,036 110,163,736.5 26,077,256.5 4,137,007.5 1,505,225.5 42,889,515.5 59,793,436.5 62,089,691.5
Recalc. Shares O/S (millions)
3,403.5 3,398.9 3,397.6 3,458.7 3,404.2 4,549.3 5,228.3 5,321.0 5,347.4 5,349.4
Impact on EPS (NI / New Shares OS)
2.061 2.257 2.478 2.330 0.780 2.698 2.364 2.982 3.534 4.090
Old EPS - New EPS 0.009 0.013 0.042 0.080 -0.080 -0.938 -0.134 -0.132 -0.134 -0.140
% Change EPS 0.44% 0.58% 1.66% 3.34% -11.42% -53.31% -6.03% -4.64% -3.94% -3.54%
% Change NI - 9.37% 9.76% -4.31% -67.05% 362.34% 0.71% 28.37% 19.08% 15.77%
% Change EPS (Reported) - 9.66% 11.01% -4.37% -70.95% 151.43% 26.70% 27.80% 19.30% 16.18%
% Change EPS (Recalculated)
- 9.51% 9.81% -6.00% -66.52% 245.96% -12.37% 26.13% 18.49% 15.73%
B (beg. balance) 3,362.00 3,384.40 3,372.50 3,368.30 3,348.50 3,378.10 4,545.20 5,226.80 5,278.10 5,287.60
A (issued/exercised) 60.57 40.90 54.33 200.53 81.75 1175.37 684.61 137.08 129.09 123.88
S (repurchased) 38.17 52.80 58.53 220.33 52.15 8.27 3.01 85.78 119.59 124.18
E (ending balance) 3,384.40 3,372.50 3,368.30 3,348.50 3,378.10 4,545.20 5,226.80 5,278.10 5,287.60 5,287.30
Net Change in Shares O/S 22.4 -11.9 -4.2 -19.8 29.6 1167.1 681.6 51.3 9.5 -0.3
Prior Year Shares O/S
Current Year Net Income $! 7,014 $! 7,671 $! 8,420 $! 8,057 $! 2,655 $! 12,275 $! 12,362 $! 15,869 $! 18,897 $! 21,878
Year Prior SOS 3,362 3,384.4 3,372.5 3,368.3 3,348.5 3,378.1 4,545.2 5,226.8 5,278.1 5,287.6
Reported EPS 2.07 2.27 2.52 2.41 0.70 1.76 2.23 2.85 3.40 3.95
New, PY EPS 2.09 2.27 2.50 2.39 0.79 3.63 2.72 3.04 3.58 4.14
EPS:
Reported 2.07 2.27 2.52 2.41 0.70 1.76 2.23 2.85 3.40 3.95
Math Recalc** 2.06 2.26 2.48 2.33 0.78 2.70 2.36 2.98 3.53 4.09
PY Recalc 2.09 2.27 2.50 2.39 0.79 3.63 2.72 3.04 3.58 4.14
ROA:
Net Income $! 7,014 $! 7,671 $! 8,420 $! 8,057 $! 2,655 $! 12,275 $! 12,362 $! 15,869 $! 18,897 $! 21,878
Average Total Assets 407,824 454,795 418,869 528,719 942,541 1,276,643 1,250,887 1,285,998 1,368,418 1,474,992
Shares Repurchased ($) 2,188 3,159 1,965 7,418 1,623 220 91 2,416 3,918 5,356
Dividends $ 3150 3375 3641 3955 4312 2125 1045 2537 4565 5953
Total $ $! 5,338 $! 6,534 $! 5,606 $! 11,373 $! 5,935 $! 2,345 $! 1,136 $! 4,953 $! 8,483 $! 11,309
NET $ (Rep - Div) $! (962) $! (216) $! (1,676) $! 3,463 $! (2,689) $! (1,905) $! (954) $! (121) $! (647) $! (597)
Repo % 41% 48% 35% 65% 27% 9% 8% 49% 46% 47%
Dividend % 59% 52% 65% 35% 73% 91% 92% 51% 54% 53%
ROA 0.0172 0.0169 0.0201 0.0152 0.0028 0.0096 0.0099 0.0123 0.0138 0.0148
Boost (millions) 37.631 53.283 39.500 113.041 4.572 2.115 0.899 29.813 54.105 79.444
NI + Boost $! 7,051.63 $! 7,724.28 $! 8,459.50 $! 8,170.04 $! 2,659.57 $! 12,277.12 $! 12,362.90 $! 15,898.81 $! 18,951.11 $! 21,957.44
Recalc WS O/S 3,403.49 3,398.90 3,397.57 3,458.66 3,404.18 4,549.34 5,228.31 5,320.99 5,347.39 5,349.39
**Recalc EPS *** 2.07 2.27 2.49 2.36 0.78 2.70 2.36 2.99 3.54 4.10
Final EPS Comparison
Reported 2.07 2.27 2.52 2.41 0.70 1.76 2.23 2.85 3.40 3.95
Math Recalc** 2.06 2.26 2.48 2.33 0.78 2.70 2.36 2.98 3.53 4.09
PY Recalc 2.09 2.27 2.50 2.39 0.79 3.63 2.72 3.04 3.58 4.14
ROA Recalc 2.07 2.27 2.49 2.36 0.78 2.70 2.36 2.99 3.54 4.10
Analyst Forecast EPS N/A N/A N/A N/A N/A N/A N/A 2.85 3.35 3.9