Embed Size (px)
Citation preview
Exceeding Expectations:
Keys to Alabama's
Student Success
A report prepared for the Business Education Alliance of Alabama
by the Public Affairs Research Council of Alabama
August 6, 2016
Business Education Alliance Board of Directors
Jeremy Arthur, President Chamber of Commerce Association of Alabama
Will Brooke, Managing Partner Harbert Management Corporation
Billy Canary, President & CEO Business Council of Alabama
Carol Gordy, President & CEO Natural Decorations, Inc.
Joe Morton, Ph.D., Chairman and President Business Education Alliance of Alabama
BEA Officers
Joe Morton, Ph.D., Chairman and President Business Education Alliance of Alabama
Jay Love, Co-Chair, Finance Business Education Alliance
Business Education Alliance Advisory Council
Stephanie Alexander, Honda Manufacturing of Alabama, LLC
Jeremy Arthur, Chamber of Commerce Association of Alabama
Hal Brewer, Intuitive Research and Technology Corporation
Will Brooke, Harbert Management Corporation
Jennifer Brown, Teacher of the Year, Vestavia Hills High School
Greg Brown, Chamber of Commerce of Huntsville/Madison County
William Canary, Business Council of Alabama
Chip Cherry, CCE, Chamber of Commerce of Huntsville/Madison County
Dr. Dee Fowler, Madison City School System
Carol Gordy, Natural Decorations, Inc.
Jason Harper, Tennessee Valley Authority
Mary Scott Hunter, Intuitive Research and Technology Corporation & State Board of Education Member District 7
Lauri King, Crestline Elementary School
Debbie Long, Protective Life
Bill Lyons, Lyons HR
KoKo Mackin, Blue Cross and Blue Shield of Alabama
Matt Massey, Madison County School System
Fred McCallum, AT&T Alabama
Dr. Cynthia McCarty, State Board of Education
Jeff Newman, State Board of Education
Caroline Novak, A+ Education Partnership
Paul Pinyan, ALFA
Aimee Rainey, Florence Middle School
Thomas Rains, A+ Education Partnership
Dr. Farrell Seymore, Opelika High School
Thomas Spencer, PARCA
Randy Stevenson, Raytheon
Ken Tucker, Boeing
Joe Vallely, Lockheed Martin Space System Company
Dr. Casey Wardynski, Huntsville City School System
Donna Watts, South Baldwin Chamber of Commerce
Dr. Janet Womack, Florence City Schools
Special Acknowledgements
A special thanks to the AT & T Foundation for their generous financial support of this project and Fred McCallum, AT &T President - Alabama, for his support.
To the A+ Education Partnership, its Executive Director Caroline Novak and Vice President of Operations and Policy Thomas Raines for contributing policy expertise to this project.
Thank you to Leah Garner, Director of Governmental Affairs and Advocacy for the Business Council of Alabama, for her assistance and input.
Table of Contents Introduction .................................................................................................................................................. 1
A Statewide Progress Report ........................................................................................................................ 2
Rising Graduation Rate ............................................................................................................................. 3
Work to do on College and Career Readiness .......................................................................................... 4
The ACT College Entrance Exam ........................................................................................................... 5
Advanced Placement ............................................................................................................................ 5
WorkKeys .............................................................................................................................................. 6
Industry Recognized Credentials........................................................................................................... 7
Remediation .......................................................................................................................................... 8
The Path to Readiness ............................................................................................................................... 8
First Class Pre-K ..................................................................................................................................... 8
ACT Aspire ............................................................................................................................................. 9
Math .................................................................................................................................................... 10
Reading ............................................................................................................................................... 10
How Can We Encourage Improvement in Math and Reading Instruction? ........................................ 11
Success Stories ............................................................................................................................................ 15
Top 10 Systems ....................................................................................................................................... 15
Top 4 Systems ......................................................................................................................................... 18
Excellence in Pre-K: Selma City Schools .................................................................................................. 22
Excellence in a Majority Poverty system (Oxford City Schools) .............................................................. 25
Excellence in a High Poverty system (Pike County) ................................................................................ 28
Most Improved Math (Opp City Schools) ............................................................................................... 31
Most Improved Reading (Muscle Shoals City Schools) ........................................................................... 34
Breaking Down Barriers with Summer Learning (Montgomery) ............................................................ 37
Connecting Students with a Career (Blount County) .............................................................................. 38
Conclusion ................................................................................................................................................... 40

Introduction With its 2012 adoption of a new strategic plan for improving education, Plan 2020, the Alabama State
Board of Education set ambitious new goals for the state’s public schools.
In the interest of increasing understanding of the state’s plan and the potential benefits of achieving its
goals, the Business Education Alliance commissioned PARCA, the Public Affairs Research Council of
Alabama to prepare a report describing Plan 2020’s goals and the strategies devised to move the state
toward achievement of those goals. That 2014 report, Obstacles into Opportunities: A 90% High School
Graduation Rate in Alabama by 2020 Provides the Educated Workforce That is Key to Expanding Our
Economy,1 also included an assessment of the potential economic impact of raising the state’s high
school graduation rate to 90 percent by 2020, Plan 2020’s marquee goal.
According to the models developed in that report, once that 90 percent graduation rate was attained,
each class of graduates would be more than 5,400 students larger than in 2012, and with enhanced
education credentials, each class would produce a direct net increase to the economy of an additional
1,167 jobs. Each graduating class would collectively earn $68 million more annually than a class
graduating at an 80 percent rate. The effect of these educational and economic gains would be similar
to landing an industrial mega-project every year.
In 2015, recognizing the fundamental role teachers play in preparing students to meet the goals in Plan
2020, the BEA asked PARCA to examine policies and practices to support the advancement of quality
teaching, resulting in Teachers Matter: Rethinking How Public Education Recruits, Rewards, and Retains
Great Educators.2 The report recommended raising entry and graduation requirements for teachers and
restoring scholarship support for aspiring teachers willing to teach in high-need fields and hard-to-staff
schools. The report also recommended restoring state support specifically for first-year teachers,
continued development of new teacher evaluation system, and creating professional pathways designed
to keep talented teachers in the field.
This new report, Exceeding Expectations: Keys to Alabama's Student Success, coming at the halfway
point between Plan 2020’s adoption and its goal line year, makes use of new measures of student
achievement adopted to judge progress toward Plan 2020’s goals. The first section of this report takes a
statewide look at Alabama’s results on these measures.
In the second section, the report identifies a sample of school systems that have performed well on key
metrics. We visited those school systems and interviewed teachers and administrators in hopes of
identifying practices and approaches that have helped them achieve positive results.
It is hoped that by identifying those keys to success other systems might learn from and adopt such
measures.
1 https://docs.google.com/file/d/0B5jrmEZadtQoWFNjci1EYWppWUE/edit
2 http://beaalabama.com/wp-content/uploads/2013/07/2015-BEA-Report-Teachers-Matter.pdf
1
A Statewide Progress Report Though it was adopted in 2012, Plan 2020 is still very much a work in progress. Halfway to 2020, higher
educational standards are still in the process of being phased into classrooms. Measures of student
success are still being established, and goals recalibrated. This is not a criticism of the Plan but is instead
a reminder that a plan is only the beginning. Persistent effort must be applied to its refinement and
execution if Plan 2020 is to succeed. Hard work through challenging times is continuing.
The adoption of the Plan roughly coincided with the adoption of a new set of nationally competitive
education standards, Alabama’s College and Career Ready Standards.
Across all grades and all subjects, the new standards are challenging teachers to create more student-
centered classrooms and to lead students toward a deeper understanding of underlying concepts rather
than simply memorizing facts and procedures. All the successful systems profiled in the second section
of this report invested a great deal of time and organized effort to understanding the new standards and
learning to apply them in the classroom. Their administrations and faculty collaborated on improving
teaching and identifying the resources students needed to be successful in mastering the new demands.
And in successful systems, this process is ongoing, learning from year to year from identified successes
and weaknesses.
This effort has been taking place during a time of constrained budgets. Education funding peaked in
2008, and it was not until the current 2017 budget that state support for local schools returned to the
2008 level. At the same time that teachers were being challenged to improve teaching, the state’s two
of primary initiatives for promoting improved instruction, the Alabama Reading Initiative (ARI) and the
Alabama Math, Science, and Technology Initiative (AMSTI), saw cuts. ARI funding went from $64 million
in 2008 to $41 million in 2017; AMSTI from $36 million in 2008 to $29 million in 2017. Both ARI and
AMSTI have had to adjust their approaches in light of diminished resources but have continued to
support schools in the transition to higher standards.
Despite the budget constraints, the Legislature made targeted investments to support priorities of Plan
2020, as identified in BEA’s 2014 report, Obstacles into Opportunities.
Starting Early: In the interest of helping children enter school ready to learn, the State Legislature has
consistently supported the expansion of Alabama’s First Class Pre-K. The 2017 allocation for Pre-K of $64
million is $54 million greater than 2008’s level of support. In 2008, only four percent of 4-year-olds had
public Pre-K available to them. In the coming year, First Class Pre-K should reach 25 percent of 4-year-
olds.
Setting High Expectations: In the past two years, the Legislature has increased state support for student
assessments from $6 million to $16 million, providing a more thorough and honest accounting of the
academic progress through standardized testing from elementary school through high school.
Continuously improving in teaching and leading: Beginning in 2016 and continuing in 2017, the
Legislature has begun to restore funding local systems can use to pay for professional development,
textbooks, technology, and classroom supplies. In 2017, the Legislature added $3 million for the
Alabama Teacher Mentoring Program, helping systems pay veteran teachers to coach and guide new
entrants to the profession. As described in BEA’s 2015 Teachers Matter report, mentoring is nationally-
recognized best practice for increasing teacher success and persistence.
2
Breaking Down Barriers to Learning: In the interest of supporting equal access to high-quality course
offerings across the state regardless of geography or system resources, the Legislature has increased
from $1.3 million in 2011 to $6.3 million in the 2017 budget the state’s support for the expansion of
Advanced Placement courses, college-level courses taught in high school. The 2017 budget also includes
$21 million for ACCESS, the state’s distance learning system, up from $18 million in 2015. The spread of
AP and renewed support for ACCESS gives more students the opportunity to pursue their higher
ambitions.
Connecting K-12 to College and Career: To support Plan 2020’s emphasis on connecting K-12 education
to college and careers, the Legislature has added $10.3 million to support dual enrollment scholarships
in technical education for high school students taking courses at community colleges. In 2016, 8,171
students received these scholarships up from just 343 in 2012. The 2017 budget also includes $1.7
million for career coaches, a level of funding that should allow for each high school in the state to have a
coach on site at least one day a week. These coaches work with local employers to make students aware
of high demand job opportunities and the educational pathways that lead to those jobs.
Considering both the challenges and the investments in recent years, how are our state’s schools
progressing on the journey toward 2020?
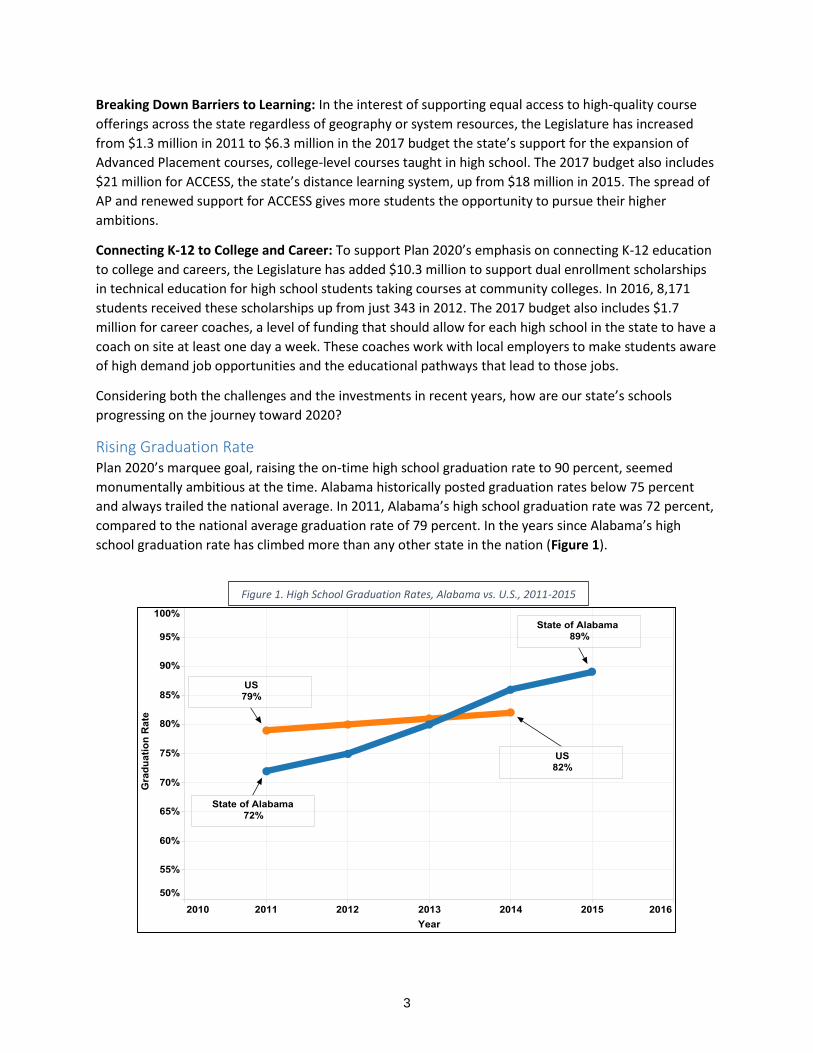
Rising Graduation Rate Plan 2020’s marquee goal, raising the on-time high school graduation rate to 90 percent, seemed
monumentally ambitious at the time. Alabama historically posted graduation rates below 75 percent
and always trailed the national average. In 2011, Alabama’s high school graduation rate was 72 percent,
compared to the national average graduation rate of 79 percent. In the years since Alabama’s high
school graduation rate has climbed more than any other state in the nation (Figure 1).
Figure 1. High School Graduation Rates, Alabama vs. U.S., 2011-2015
3
In 2014, Alabama’s graduation rate surpassed the U.S. average. For the class of seniors who graduated
in 2015, the State Department of Education reported a graduation rate of 89 percent.
While that rising graduation rate has been celebrated, some have questioned whether the graduation
rate has risen only because the bar has been lowered. The state eliminated and did not replace the High
School Graduation Exit Exam. It also changed the graduation requirements for special education
students, allowing more students to receive high school diplomas.
Work to do on College and Career Readiness Fortunately, Plan 2020 does not begin and end with the graduation rate. Plan 2020’s articulated vision is
“Every Child a Graduate. Every Graduate Prepared.” With Plan 2020, the State Board of Education also
adopted metrics that should give us a clearer picture of whether those graduates are leaving high school
prepared.
Since 2015, the State Legislature has increased the support it provides for student assessment from $6
million in 2015 to $16 million in 2017. That has allowed the state to pay for the ACT Aspire, a suite of
tests given to gauge the academic progress of students in grades 3-8 and 10. The state also now pays for
every high school junior to take the ACT, which measures readiness for college-level work. In addition,
high school seniors take WorkKeys, a set of tests meant to determine whether students have the skills
needed to function in the workplace.
These tests, along with other defined benchmarks,
provide measures for how well schools are succeeding in
preparing students for college and career readiness
beyond just measuring the high school graduation rate.
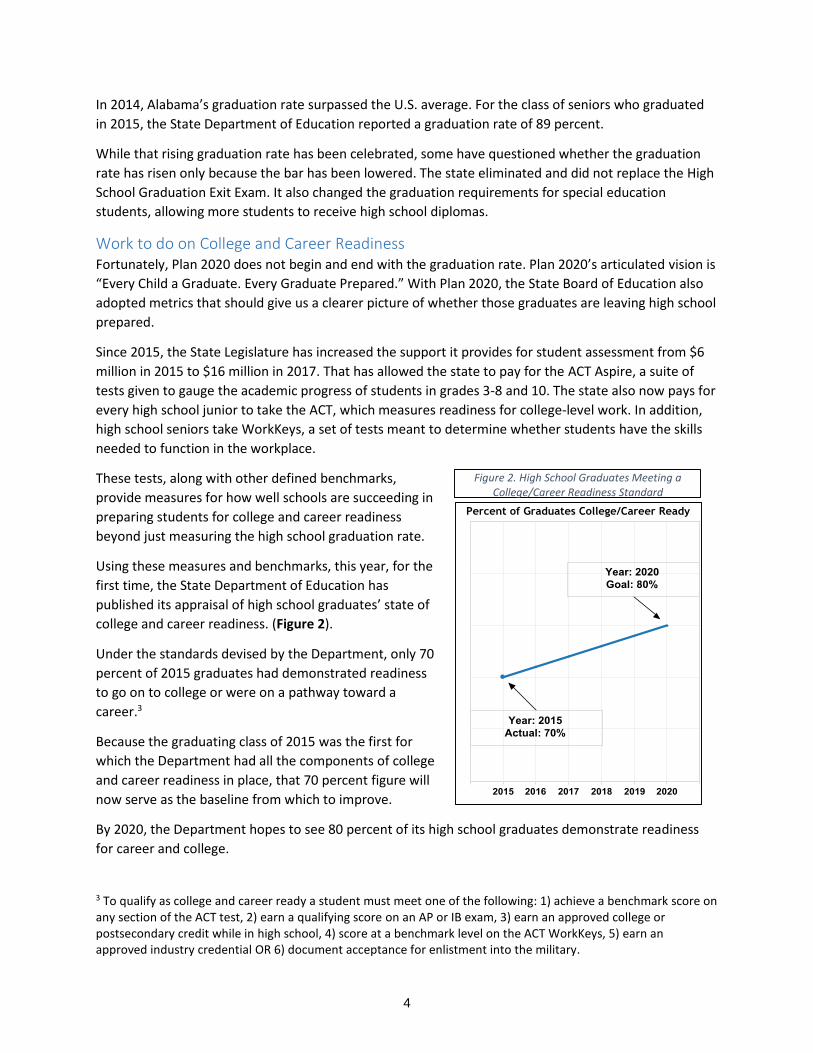
Using these measures and benchmarks, this year, for the
first time, the State Department of Education has
published its appraisal of high school graduates’ state of
college and career readiness. (Figure 2).
Under the standards devised by the Department, only 70
percent of 2015 graduates had demonstrated readiness
to go on to college or were on a pathway toward a
career.3
Because the graduating class of 2015 was the first for
which the Department had all the components of college
and career readiness in place, that 70 percent figure will
now serve as the baseline from which to improve.
By 2020, the Department hopes to see 80 percent of its high school graduates demonstrate readiness
for career and college.
3 To qualify as college and career ready a student must meet one of the following: 1) achieve a benchmark score on any section of the ACT test, 2) earn a qualifying score on an AP or IB exam, 3) earn an approved college or postsecondary credit while in high school, 4) score at a benchmark level on the ACT WorkKeys, 5) earn an approved industry credential OR 6) document acceptance for enlistment into the military.
Figure 2. High School Graduates Meeting a College/Career Readiness Standard
4
The Department has not published a breakdown of the number or percentage of students who qualified
as college and career ready under each of the six available measures. However, there is information
available on three of the six measures.
On these measures of college and career readiness, Alabama certainly has room to grow. While
increasing the graduation rate is a laudable achievement, it is essential that we, as a state, decrease the
number of “gap students,” those students who receive a high school diploma but who have not
demonstrated that they are ready for college or the workforce. Currently, there is a 19-point gap
between the percentage of high school students who graduate and the percentage of those graduates
deemed college and career ready. Ultimately, any student who earns a high school diploma should be
adequately prepared for college or a career.
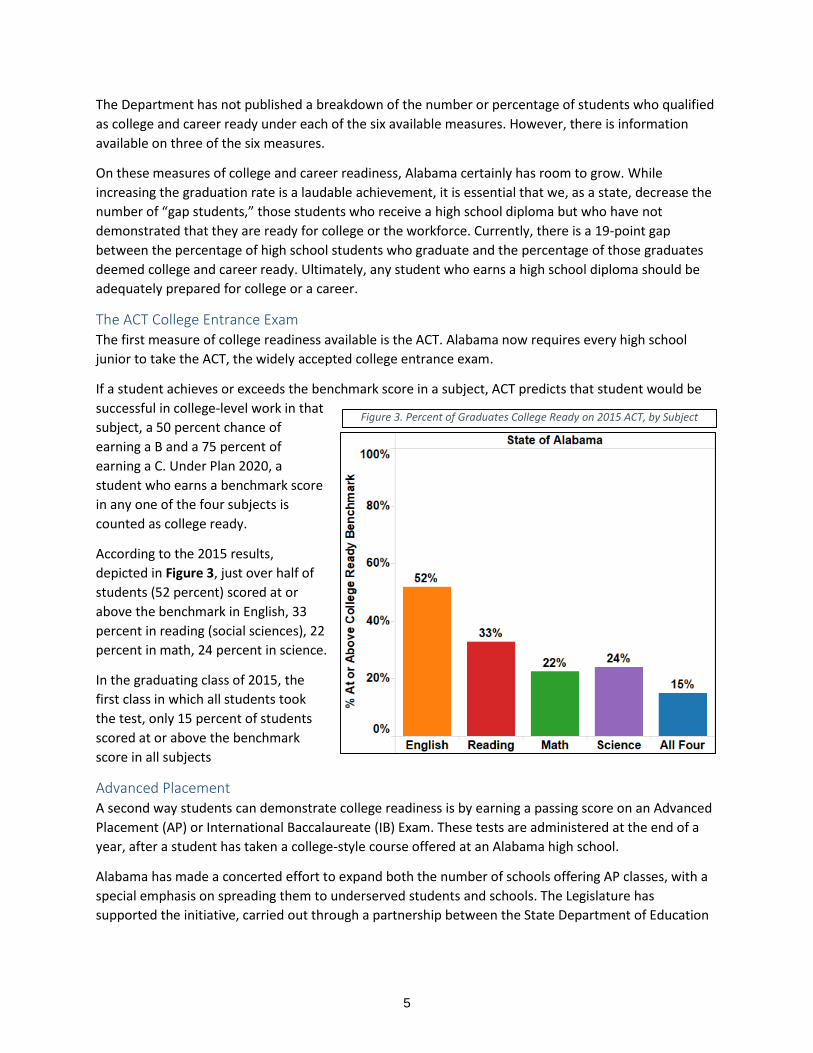
The ACT College Entrance Exam The first measure of college readiness available is the ACT. Alabama now requires every high school
junior to take the ACT, the widely accepted college entrance exam.
If a student achieves or exceeds the benchmark score in a subject, ACT predicts that student would be
successful in college-level work in that
subject, a 50 percent chance of
earning a B and a 75 percent of
earning a C. Under Plan 2020, a
student who earns a benchmark score
in any one of the four subjects is
counted as college ready.
According to the 2015 results,
depicted in Figure 3, just over half of
students (52 percent) scored at or
above the benchmark in English, 33
percent in reading (social sciences), 22
percent in math, 24 percent in science.
In the graduating class of 2015, the
first class in which all students took
the test, only 15 percent of students
scored at or above the benchmark
score in all subjects
Advanced Placement A second way students can demonstrate college readiness is by earning a passing score on an Advanced
Placement (AP) or International Baccalaureate (IB) Exam. These tests are administered at the end of a
year, after a student has taken a college-style course offered at an Alabama high school.
Alabama has made a concerted effort to expand both the number of schools offering AP classes, with a
special emphasis on spreading them to underserved students and schools. The Legislature has
supported the initiative, carried out through a partnership between the State Department of Education
Figure 3. Percent of Graduates College Ready on 2015 ACT, by Subject
5
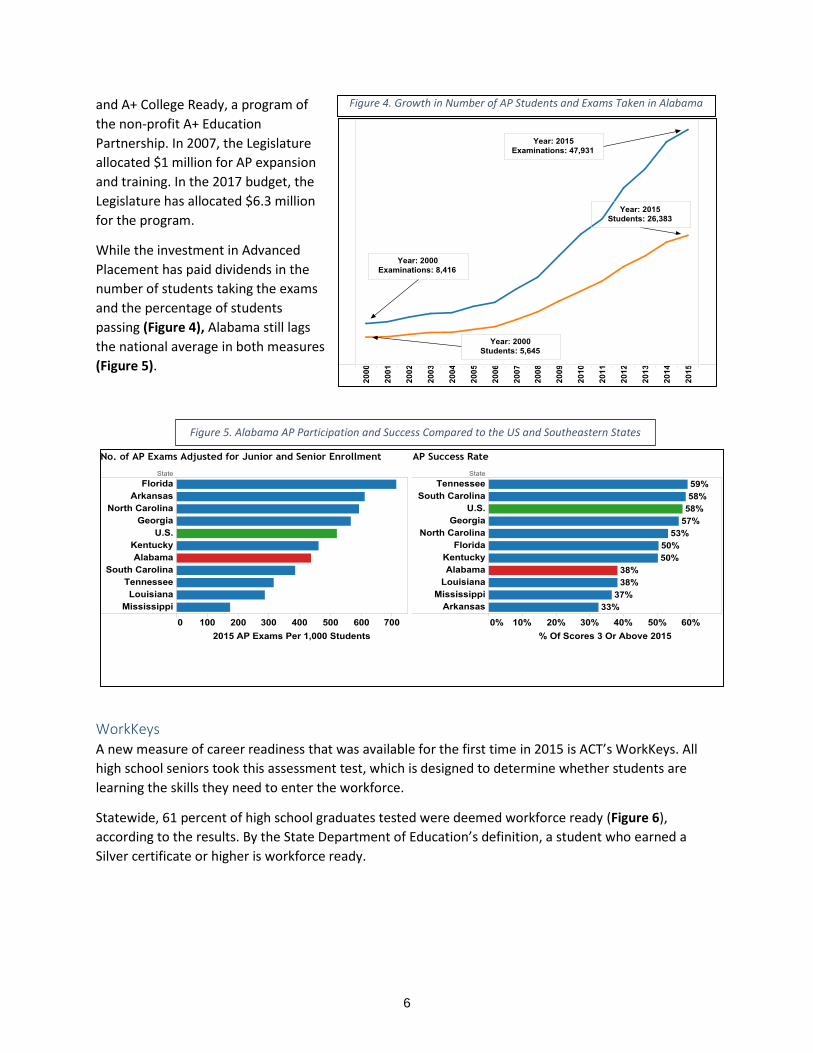
and A+ College Ready, a program of
the non-profit A+ Education
Partnership. In 2007, the Legislature
allocated $1 million for AP expansion
and training. In the 2017 budget, the
Legislature has allocated $6.3 million
for the program.
While the investment in Advanced
Placement has paid dividends in the
number of students taking the exams
and the percentage of students
passing (Figure 4), Alabama still lags
the national average in both measures
(Figure 5).
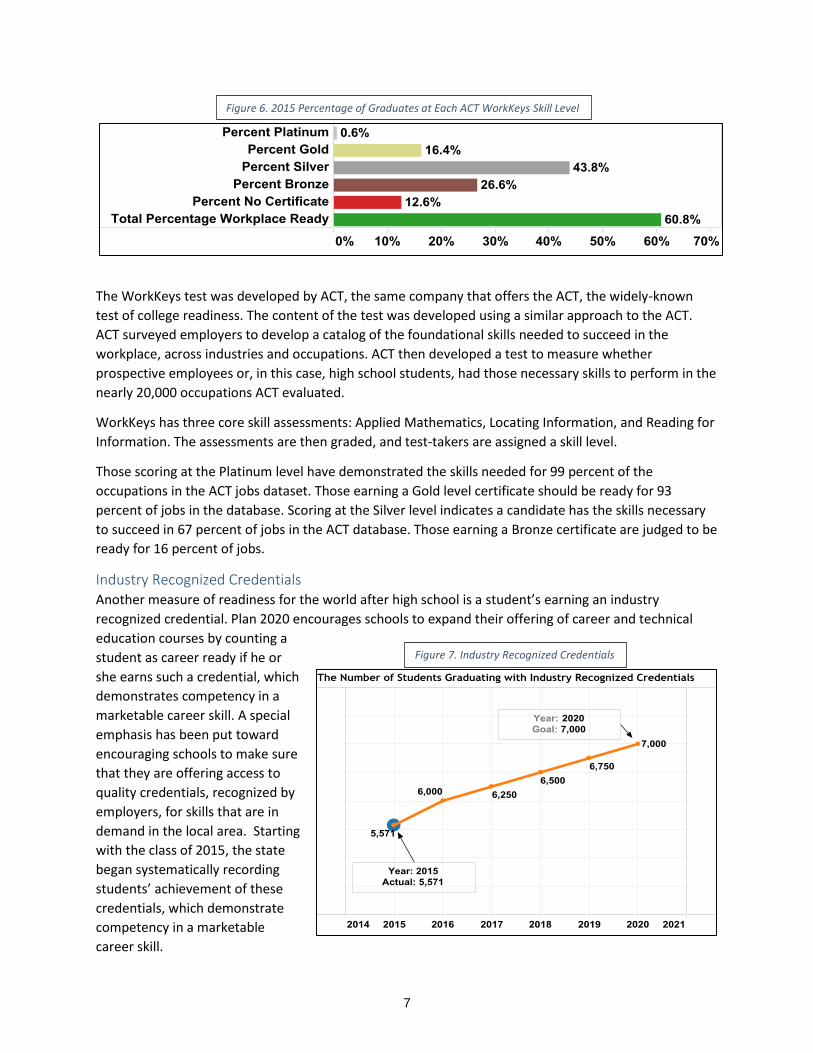
WorkKeys A new measure of career readiness that was available for the first time in 2015 is ACT’s WorkKeys. All
high school seniors took this assessment test, which is designed to determine whether students are
learning the skills they need to enter the workforce.
Statewide, 61 percent of high school graduates tested were deemed workforce ready (Figure 6),
according to the results. By the State Department of Education’s definition, a student who earned a
Silver certificate or higher is workforce ready.
Figure 4. Growth in Number of AP Students and Exams Taken in Alabama
Figure 5. Alabama AP Participation and Success Compared to the US and Southeastern States
6
The WorkKeys test was developed by ACT, the same company that offers the ACT, the widely-known
test of college readiness. The content of the test was developed using a similar approach to the ACT.
ACT surveyed employers to develop a catalog of the foundational skills needed to succeed in the
workplace, across industries and occupations. ACT then developed a test to measure whether
prospective employees or, in this case, high school students, had those necessary skills to perform in the
nearly 20,000 occupations ACT evaluated.
WorkKeys has three core skill assessments: Applied Mathematics, Locating Information, and Reading for
Information. The assessments are then graded, and test-takers are assigned a skill level.
Those scoring at the Platinum level have demonstrated the skills needed for 99 percent of the
occupations in the ACT jobs dataset. Those earning a Gold level certificate should be ready for 93
percent of jobs in the database. Scoring at the Silver level indicates a candidate has the skills necessary
to succeed in 67 percent of jobs in the ACT database. Those earning a Bronze certificate are judged to be
ready for 16 percent of jobs.
Industry Recognized Credentials Another measure of readiness for the world after high school is a student’s earning an industry
recognized credential. Plan 2020 encourages schools to expand their offering of career and technical
education courses by counting a
student as career ready if he or
she earns such a credential, which
demonstrates competency in a
marketable career skill. A special
emphasis has been put toward
encouraging schools to make sure
that they are offering access to
quality credentials, recognized by
employers, for skills that are in
demand in the local area. Starting
with the class of 2015, the state
began systematically recording
students’ achievement of these
credentials, which demonstrate
competency in a marketable
career skill.
Figure 7. Industry Recognized Credentials
Figure 6. 2015 Percentage of Graduates at Each ACT WorkKeys Skill Level
7
In the 2015 class, 5,571 students graduated with industryrecognized credentials. That number serves as
a baseline. With schools around the state placing increased emphasis on career and technical education,
the Department hopes to see this number grow to 7,000 by 2020. See Figure 7.
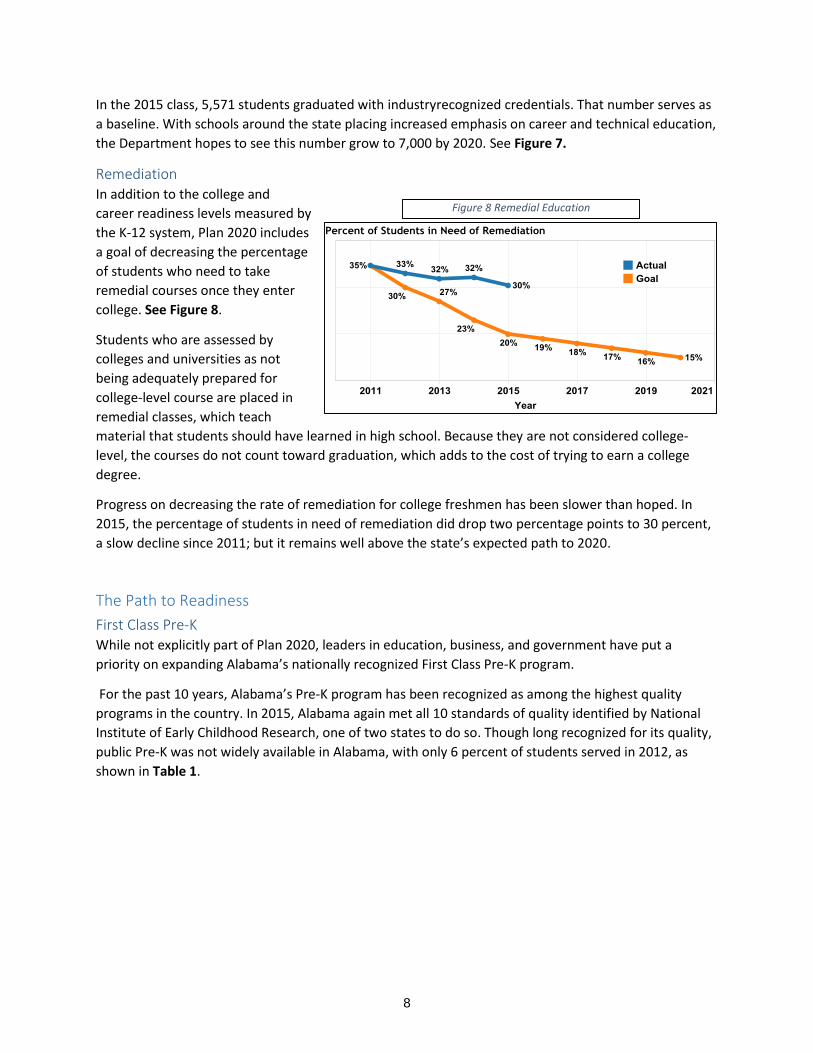
Remediation In addition to the college and
career readiness levels measured by
the K-12 system, Plan 2020 includes
a goal of decreasing the percentage
of students who need to take
remedial courses once they enter
college. See Figure 8.
Students who are assessed by
colleges and universities as not
being adequately prepared for
college-level course are placed in
remedial classes, which teach
material that students should have learned in high school. Because they are not considered college-
level, the courses do not count toward graduation, which adds to the cost of trying to earn a college
degree.
Progress on decreasing the rate of remediation for college freshmen has been slower than hoped. In
2015, the percentage of students in need of remediation did drop two percentage points to 30 percent,
a slow decline since 2011; but it remains well above the state’s expected path to 2020.
The Path to Readiness
First Class Pre-K While not explicitly part of Plan 2020, leaders in education, business, and government have put a
priority on expanding Alabama’s nationally recognized First Class Pre-K program.
For the past 10 years, Alabama’s Pre-K program has been recognized as among the highest quality
programs in the country. In 2015, Alabama again met all 10 standards of quality identified by National
Institute of Early Childhood Research, one of two states to do so. Though long recognized for its quality,
public Pre-K was not widely available in Alabama, with only 6 percent of students served in 2012, as
shown in Table 1.
Figure 8 Remedial Education
8
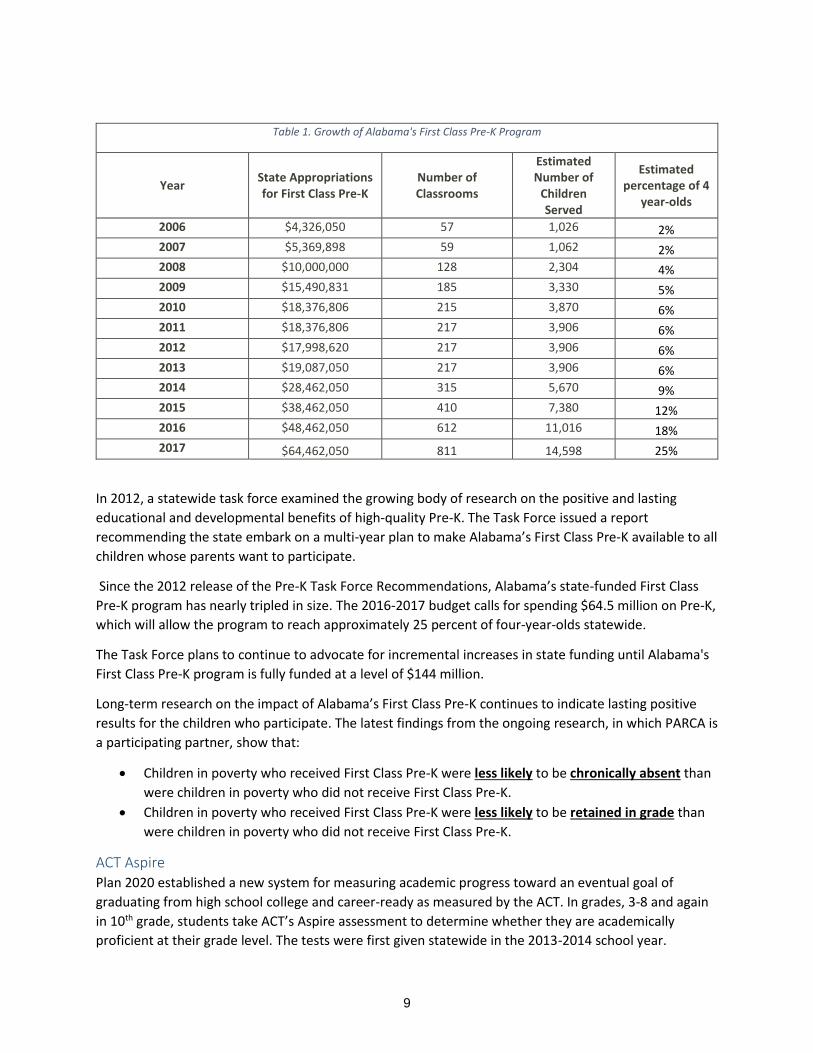
In 2012, a statewide task force examined the growing body of research on the positive and lasting
educational and developmental benefits of high-quality Pre-K. The Task Force issued a report
recommending the state embark on a multi-year plan to make Alabama’s First Class Pre-K available to all
children whose parents want to participate.
Since the 2012 release of the Pre-K Task Force Recommendations, Alabama’s state-funded First Class
Pre-K program has nearly tripled in size. The 2016-2017 budget calls for spending $64.5 million on Pre-K,
which will allow the program to reach approximately 25 percent of four-year-olds statewide.
The Task Force plans to continue to advocate for incremental increases in state funding until Alabama's
First Class Pre-K program is fully funded at a level of $144 million.
Long-term research on the impact of Alabama’s First Class Pre-K continues to indicate lasting positive
results for the children who participate. The latest findings from the ongoing research, in which PARCA is
a participating partner, show that:
Children in poverty who received First Class Pre-K were less likely to be chronically absent than
were children in poverty who did not receive First Class Pre-K.
Children in poverty who received First Class Pre-K were less likely to be retained in grade than
were children in poverty who did not receive First Class Pre-K.
ACT Aspire Plan 2020 established a new system for measuring academic progress toward an eventual goal of
graduating from high school college and career-ready as measured by the ACT. In grades, 3-8 and again
in 10th grade, students take ACT’s Aspire assessment to determine whether they are academically
proficient at their grade level. The tests were first given statewide in the 2013-2014 school year.
Table 1. Growth of Alabama's First Class Pre-K Program
Year State Appropriations for First Class Pre-K
Number of Classrooms
Estimated Number of
Children Served
Estimated percentage of 4
year-olds
2006 $4,326,050 57 1,026 2%
2007 $5,369,898 59 1,062 2%
2008 $10,000,000 128 2,304 4%
2009 $15,490,831 185 3,330 5%
2010 $18,376,806 215 3,870 6%
2011 $18,376,806 217 3,906 6%
2012 $17,998,620 217 3,906 6%
2013 $19,087,050 217 3,906 6%
2014 $28,462,050 315 5,670 9%
2015 $38,462,050 410 7,380 12%
2016 $48,462,050 612 11,016 18%
2017 $64,462,050 811 14,598 25%
9
The ACT Aspire is a more challenging measure of proficiency than the system it replaced, the Alabama
Reading and Math Test (ARMT). However, results from the Aspire indicate that students in Alabama
schools are still following a pattern that was apparent in ARMT results on measures of math and
reading.
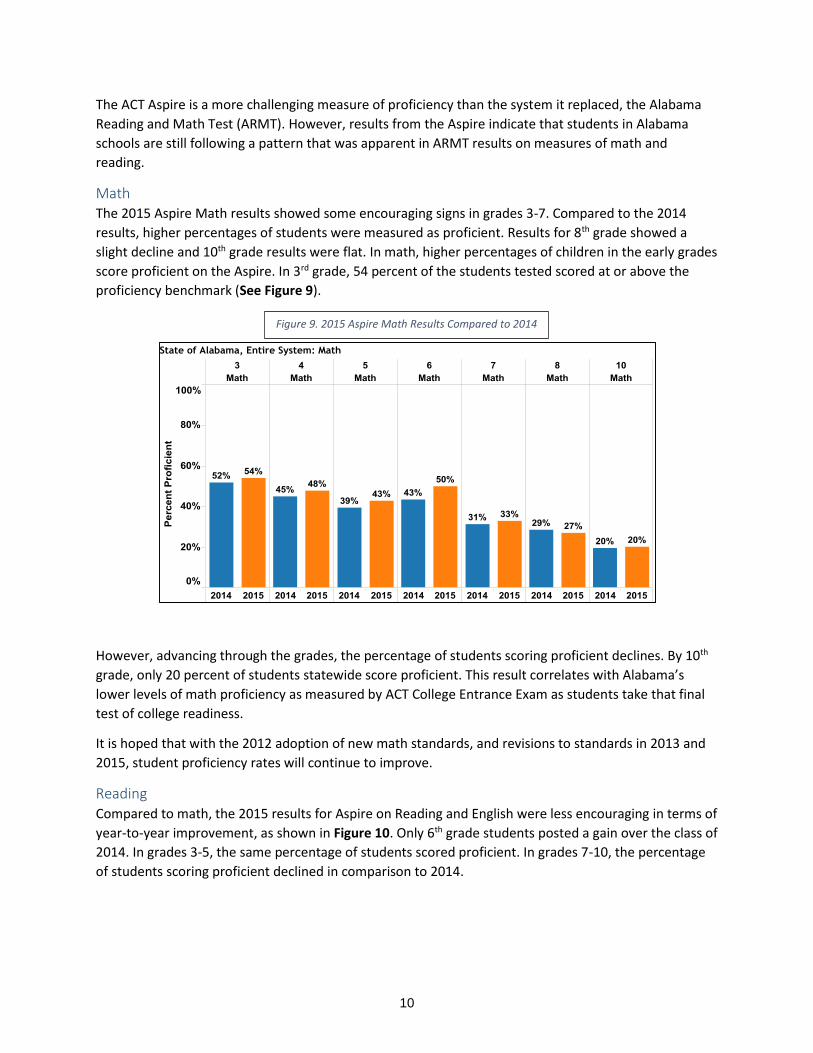
Math The 2015 Aspire Math results showed some encouraging signs in grades 3-7. Compared to the 2014
results, higher percentages of students were measured as proficient. Results for 8th grade showed a
slight decline and 10th grade results were flat. In math, higher percentages of children in the early grades
score proficient on the Aspire. In 3rd grade, 54 percent of the students tested scored at or above the
proficiency benchmark (See Figure 9).
However, advancing through the grades, the percentage of students scoring proficient declines. By 10th
grade, only 20 percent of students statewide score proficient. This result correlates with Alabama’s
lower levels of math proficiency as measured by ACT College Entrance Exam as students take that final
test of college readiness.
It is hoped that with the 2012 adoption of new math standards, and revisions to standards in 2013 and
2015, student proficiency rates will continue to improve.
Reading Compared to math, the 2015 results for Aspire on Reading and English were less encouraging in terms of
year-to-year improvement, as shown in Figure 10. Only 6th grade students posted a gain over the class of
2014. In grades 3-5, the same percentage of students scored proficient. In grades 7-10, the percentage
of students scoring proficient declined in comparison to 2014.
Figure 9. 2015 Aspire Math Results Compared to 2014
10
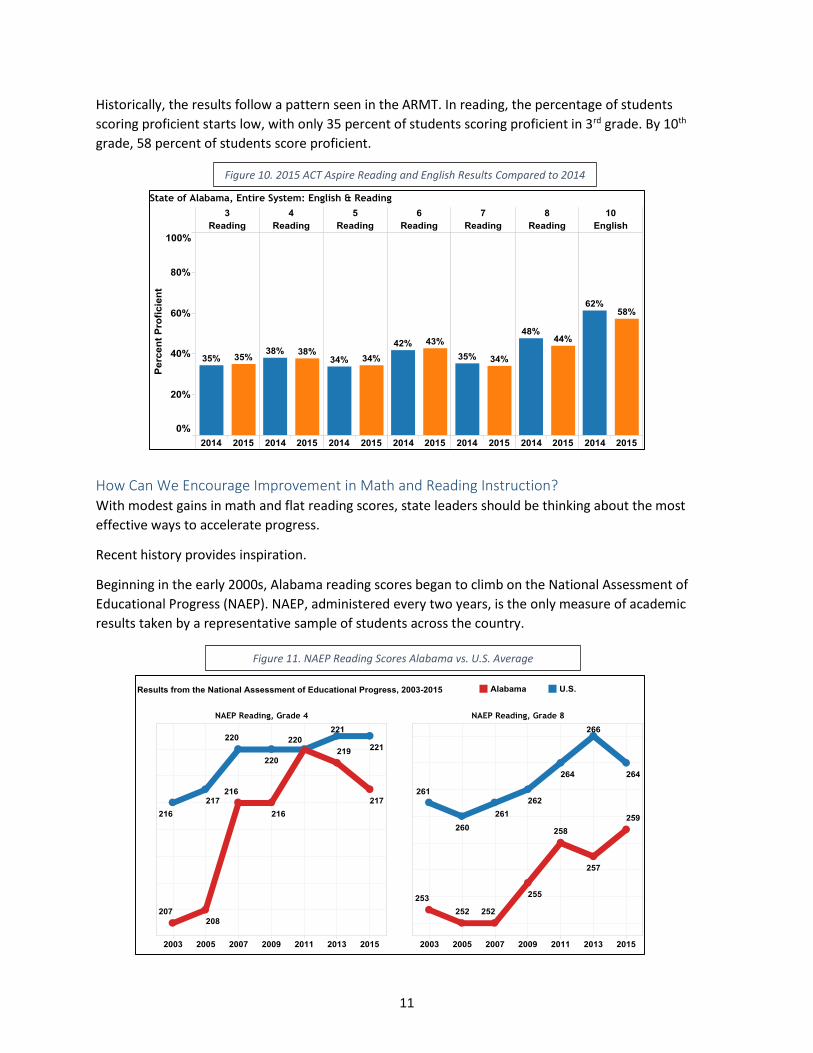
Historically, the results follow a pattern seen in the ARMT. In reading, the percentage of students
scoring proficient starts low, with only 35 percent of students scoring proficient in 3rd grade. By 10th
grade, 58 percent of students score proficient.
How Can We Encourage Improvement in Math and Reading Instruction? With modest gains in math and flat reading scores, state leaders should be thinking about the most
effective ways to accelerate progress.
Recent history provides inspiration.
Beginning in the early 2000s, Alabama reading scores began to climb on the National Assessment of
Educational Progress (NAEP). NAEP, administered every two years, is the only measure of academic
results taken by a representative sample of students across the country.
Figure 11. NAEP Reading Scores Alabama vs. U.S. Average
Figure 10. 2015 ACT Aspire Reading and English Results Compared to 2014
11
Though Alabama had historically ranked near the bottom in reading scores, by 2011, Alabama 4th grade
reading scores had reached the national average (See Figure 11). Alabama’s rise in reading has widely
been attributed to the implementation of the Alabama Reading Initiative (ARI). ARI brought an intense
focus to reading, particularly in the early grades. A state-level team provided data-driven, professional
development aligned with scientifically-based reading research to school faculty. ARI also paid for a
reading coach to staff every elementary school, working with teachers to improve content knowledge,
skills, and strategies necessary to be successful with all students, especially struggling readers.
State funding for the Reading Initiative peaked in 2008 at $64 million. Added on top of that spending
was federal grant money for the Reading Initiative, which also peaked in 2008 at $18 million. In total,
the state had $82 million to spend on reading instruction in 2008. Though funding declined somewhat in
2009, it remained robust with a total of $79 million available to spend in 2009.
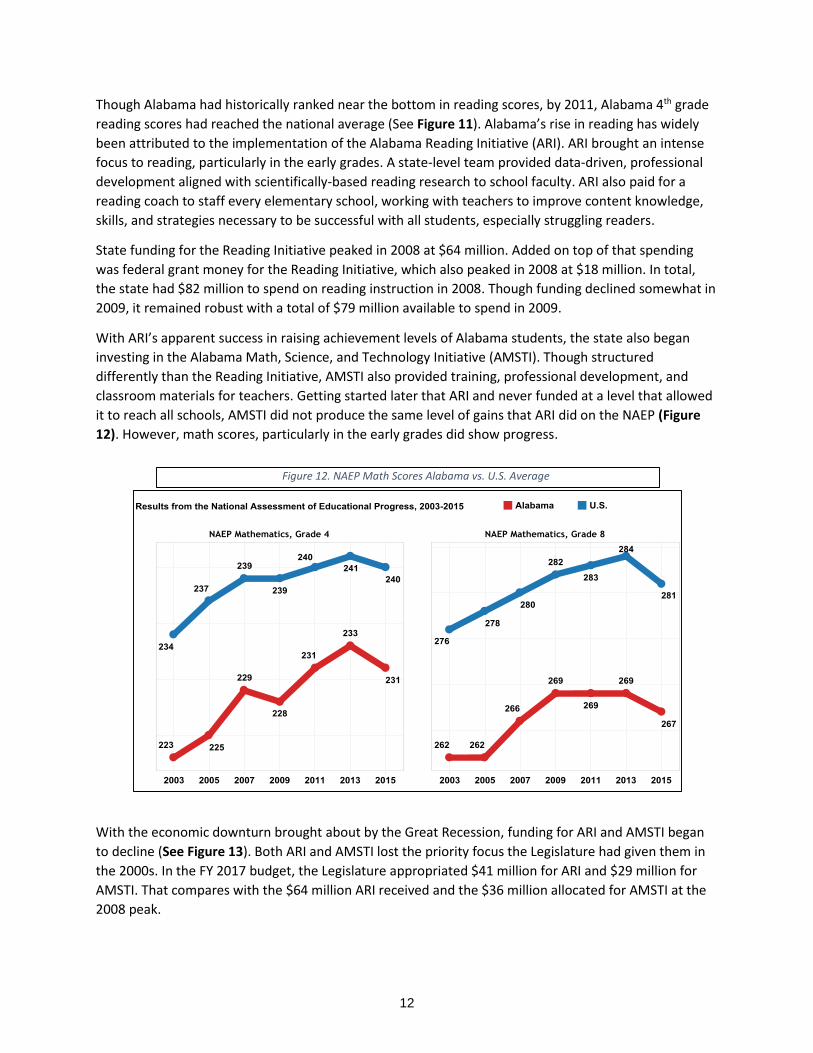
With ARI’s apparent success in raising achievement levels of Alabama students, the state also began
investing in the Alabama Math, Science, and Technology Initiative (AMSTI). Though structured
differently than the Reading Initiative, AMSTI also provided training, professional development, and
classroom materials for teachers. Getting started later that ARI and never funded at a level that allowed
it to reach all schools, AMSTI did not produce the same level of gains that ARI did on the NAEP (Figure
12). However, math scores, particularly in the early grades did show progress.
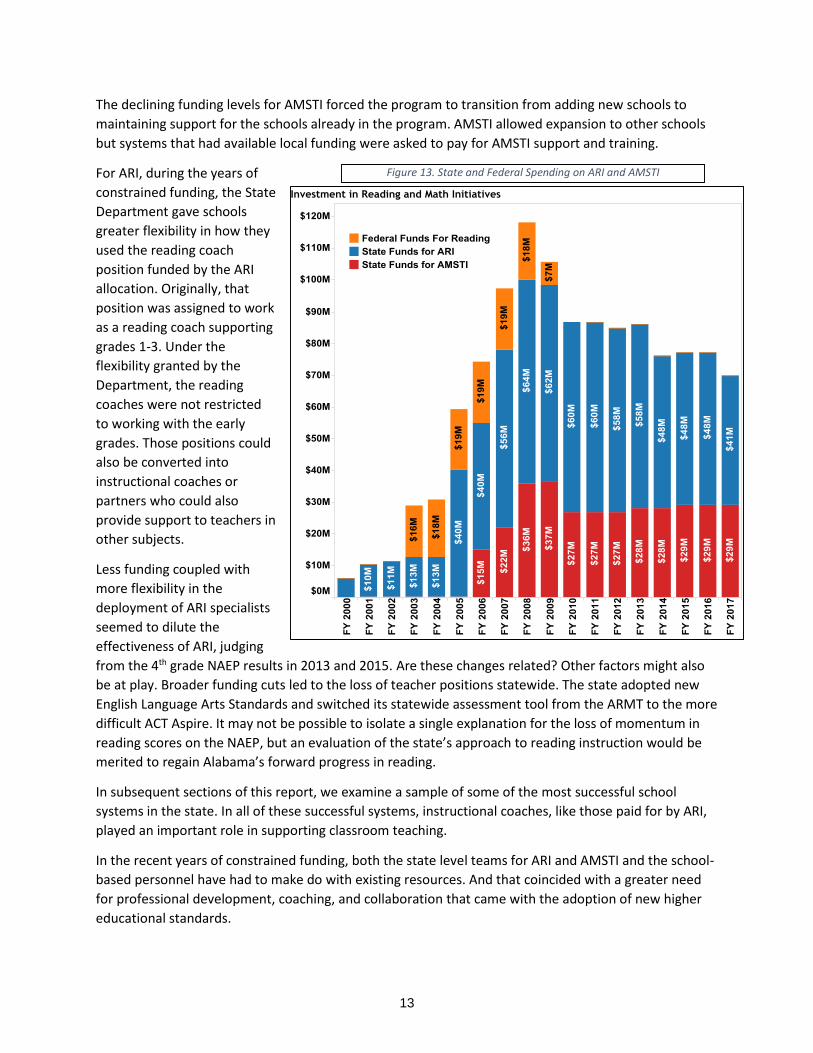
With the economic downturn brought about by the Great Recession, funding for ARI and AMSTI began
to decline (See Figure 13). Both ARI and AMSTI lost the priority focus the Legislature had given them in
the 2000s. In the FY 2017 budget, the Legislature appropriated $41 million for ARI and $29 million for
AMSTI. That compares with the $64 million ARI received and the $36 million allocated for AMSTI at the
2008 peak.
Figure 12. NAEP Math Scores Alabama vs. U.S. Average
12
The declining funding levels for AMSTI forced the program to transition from adding new schools to
maintaining support for the schools already in the program. AMSTI allowed expansion to other schools
but systems that had available local funding were asked to pay for AMSTI support and training.
For ARI, during the years of
constrained funding, the State
Department gave schools
greater flexibility in how they
used the reading coach
position funded by the ARI
allocation. Originally, that
position was assigned to work
as a reading coach supporting
grades 1-3. Under the
flexibility granted by the
Department, the reading
coaches were not restricted
to working with the early
grades. Those positions could
also be converted into
instructional coaches or
partners who could also
provide support to teachers in
other subjects.
Less funding coupled with
more flexibility in the
deployment of ARI specialists
seemed to dilute the
effectiveness of ARI, judging
from the 4th grade NAEP results in 2013 and 2015. Are these changes related? Other factors might also
be at play. Broader funding cuts led to the loss of teacher positions statewide. The state adopted new
English Language Arts Standards and switched its statewide assessment tool from the ARMT to the more
difficult ACT Aspire. It may not be possible to isolate a single explanation for the loss of momentum in
reading scores on the NAEP, but an evaluation of the state’s approach to reading instruction would be
merited to regain Alabama’s forward progress in reading.
In subsequent sections of this report, we examine a sample of some of the most successful school
systems in the state. In all of these successful systems, instructional coaches, like those paid for by ARI,
played an important role in supporting classroom teaching.
In the recent years of constrained funding, both the state level teams for ARI and AMSTI and the school-
based personnel have had to make do with existing resources. And that coincided with a greater need
for professional development, coaching, and collaboration that came with the adoption of new higher
educational standards.
Figure 13. State and Federal Spending on ARI and AMSTI
13
Some of the top performing systems have kept ARI reading specialists focused on early grade reading
and have used local funding to add math and science coaches who can play a similar coaching and
support role.
In other successful systems, the reading specialist positions have been given a broader role as
instructional partners, providing coaching and connecting teachers with available professional
development resources. In those systems, some of those coaches were originally ARI specialists.
However, they were not just handed additional responsibilities. Instead, they received training and
were often involved in statewide networks, like the Alabama Best Practice Center’s Instructional
Partners Network. Through that network, they were able to confer with colleagues in their regions,
learning how to best encourage a climate of continuous improvement among teachers.
There may not be a “one size fits all” approach to improving reading and math instruction across all
school systems, but it is clear that the state should draw lessons from the history of ARI and AMSTI. The
gains made in 4th grade reading on the NAEP through 2011 showed that Alabama students could learn at
nationally competitive levels. However, that achievement was backed by a well-designed and well-
funded initiative at the state level combined with the targeted deployment of resources at the local
level.
At a time when students and teachers are being challenged to meet higher expectations, it is vital that
the state carefully considers how it supports instructional improvement.
14
Success Stories In this section of the report, we move from the state level to a closer examination of local school
systems.
Using a variety of metrics, we looked for systems that have shown high performance or have made
significant gains in performance. Performance metrics can be analyzed in countless ways. The
socioeconomic composition of a school system tends to influence performance on standardized tests,
for instance.
The schools and systems featured in the following sections are examples. By no means are they the only
schools in which positive change is occurring, nor are they the only systems to implement these
highlighted strategies. However, it is hoped that in describing the actions undertaken by these systems,
we might identify clues to improved performance.
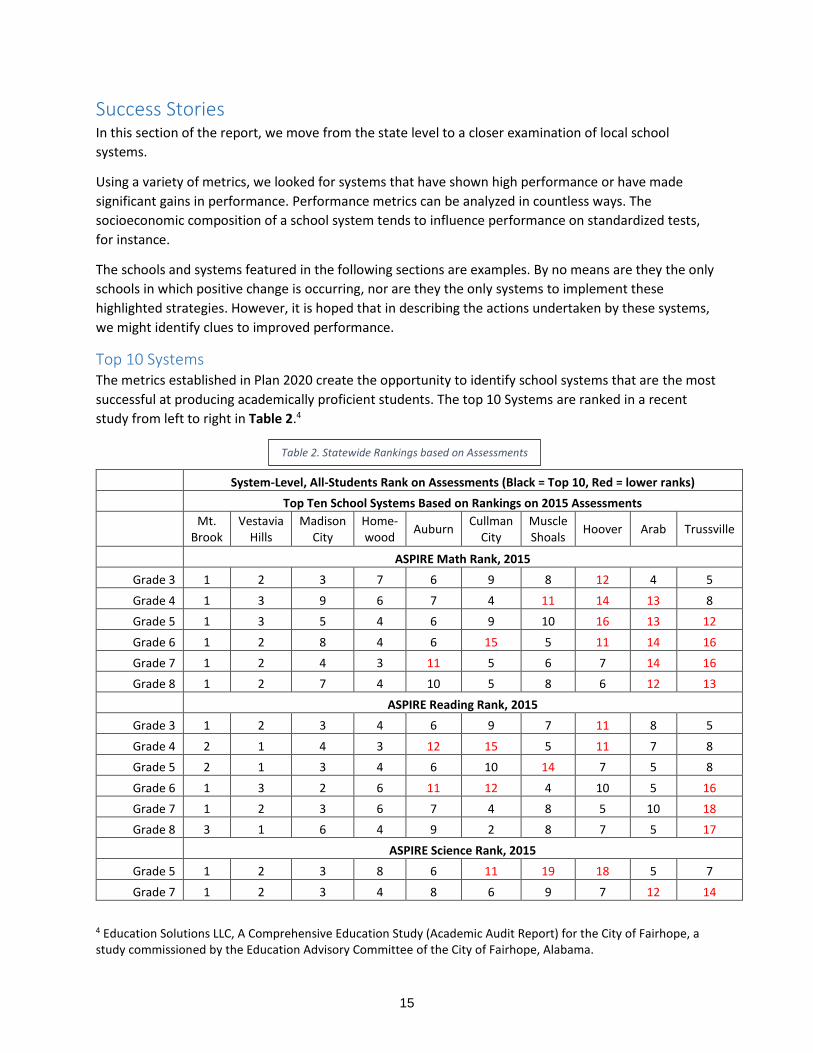
Top 10 Systems The metrics established in Plan 2020 create the opportunity to identify school systems that are the most
successful at producing academically proficient students. The top 10 Systems are ranked in a recent
study from left to right in Table 2.4
System-Level, All-Students Rank on Assessments (Black = Top 10, Red = lower ranks)
Top Ten School Systems Based on Rankings on 2015 Assessments
Mt. Brook
Vestavia Hills
Madison City
Home-wood
Auburn Cullman
City Muscle Shoals
Hoover Arab Trussville
ASPIRE Math Rank, 2015
Grade 3 1 2 3 7 6 9 8 12 4 5
Grade 4 1 3 9 6 7 4 11 14 13 8
Grade 5 1 3 5 4 6 9 10 16 13 12
Grade 6 1 2 8 4 6 15 5 11 14 16
Grade 7 1 2 4 3 11 5 6 7 14 16
Grade 8 1 2 7 4 10 5 8 6 12 13
ASPIRE Reading Rank, 2015
Grade 3 1 2 3 4 6 9 7 11 8 5
Grade 4 2 1 4 3 12 15 5 11 7 8
Grade 5 2 1 3 4 6 10 14 7 5 8
Grade 6 1 3 2 6 11 12 4 10 5 16
Grade 7 1 2 3 6 7 4 8 5 10 18
Grade 8 3 1 6 4 9 2 8 7 5 17
ASPIRE Science Rank, 2015
Grade 5 1 2 3 8 6 11 19 18 5 7
Grade 7 1 2 3 4 8 6 9 7 12 14
4 Education Solutions LLC, A Comprehensive Education Study (Academic Audit Report) for the City of Fairhope, a study commissioned by the Education Advisory Committee of the City of Fairhope, Alabama.
Table 2. Statewide Rankings based on Assessments
15
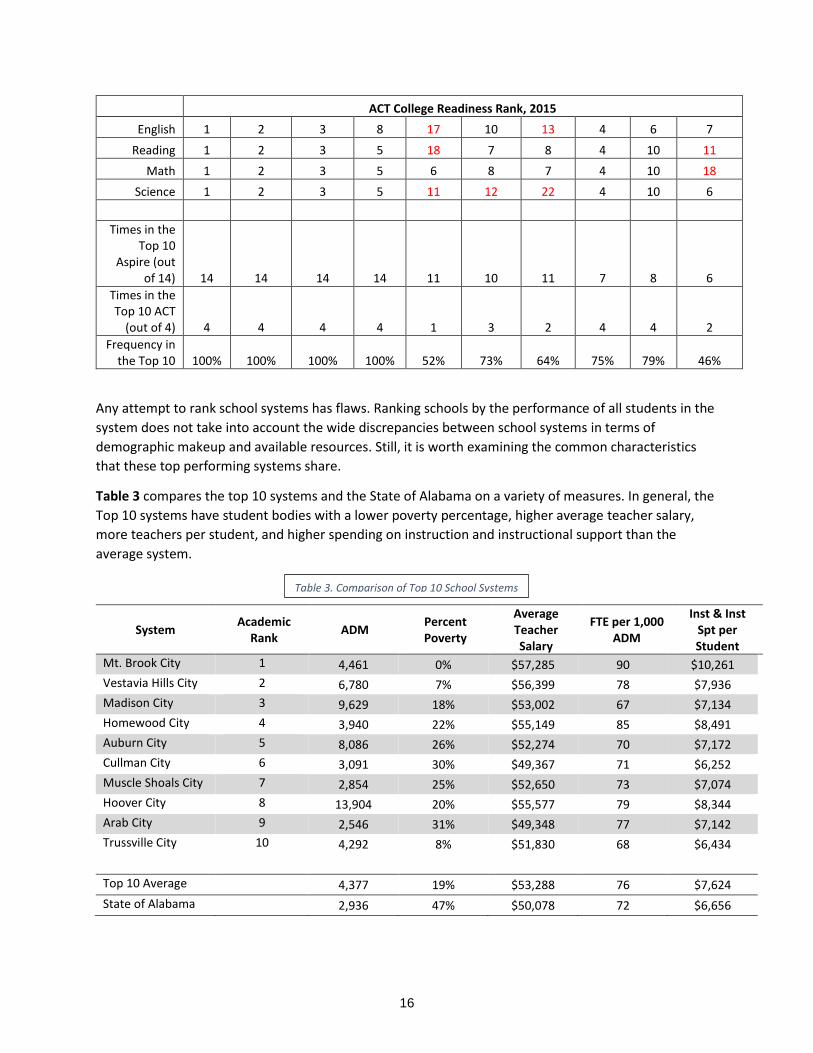
ACT College Readiness Rank, 2015
English 1 2 3 8 17 10 13 4 6 7
Reading 1 2 3 5 18 7 8 4 10 11
Math 1 2 3 5 6 8 7 4 10 18
Science 1 2 3 5 11 12 22 4 10 6
Times in the Top 10
Aspire (out of 14) 14 14 14 14 11 10 11 7 8 6
Times in the Top 10 ACT
(out of 4) 4 4 4 4 1 3 2 4 4 2
Frequency in the Top 10 100% 100% 100% 100% 52% 73% 64% 75% 79% 46%
Any attempt to rank school systems has flaws. Ranking schools by the performance of all students in the
system does not take into account the wide discrepancies between school systems in terms of
demographic makeup and available resources. Still, it is worth examining the common characteristics
that these top performing systems share.
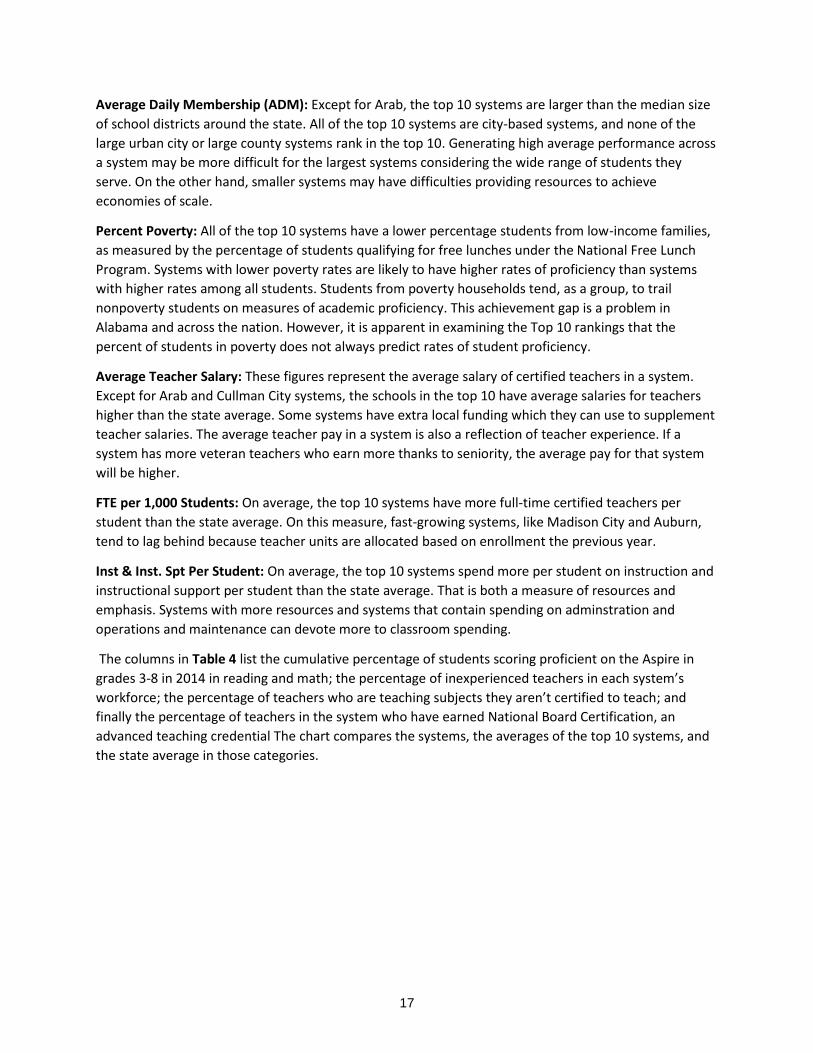
Table 3 compares the top 10 systems and the State of Alabama on a variety of measures. In general, the
Top 10 systems have student bodies with a lower poverty percentage, higher average teacher salary,
more teachers per student, and higher spending on instruction and instructional support than the
average system.
System Academic
Rank ADM
Percent Poverty
Average Teacher Salary
FTE per 1,000 ADM
Inst & Inst Spt per Student
Mt. Brook City 1 4,461 0% $57,285 90 $10,261
Vestavia Hills City 2 6,780 7% $56,399 78 $7,936
Madison City 3 9,629 18% $53,002 67 $7,134
Homewood City 4 3,940 22% $55,149 85 $8,491
Auburn City 5 8,086 26% $52,274 70 $7,172
Cullman City 6 3,091 30% $49,367 71 $6,252
Muscle Shoals City 7 2,854 25% $52,650 73 $7,074
Hoover City 8 13,904 20% $55,577 79 $8,344
Arab City 9 2,546 31% $49,348 77 $7,142
Trussville City 10 4,292 8% $51,830 68 $6,434
Top 10 Average 4,377 19% $53,288 76 $7,624
State of Alabama 2,936 47% $50,078 72 $6,656
Table 3. Comparison of Top 10 School Systems
16
Average Daily Membership (ADM): Except for Arab, the top 10 systems are larger than the median size
of school districts around the state. All of the top 10 systems are city-based systems, and none of the
large urban city or large county systems rank in the top 10. Generating high average performance across
a system may be more difficult for the largest systems considering the wide range of students they
serve. On the other hand, smaller systems may have difficulties providing resources to achieve
economies of scale.
Percent Poverty: All of the top 10 systems have a lower percentage students from low-income families,
as measured by the percentage of students qualifying for free lunches under the National Free Lunch
Program. Systems with lower poverty rates are likely to have higher rates of proficiency than systems
with higher rates among all students. Students from poverty households tend, as a group, to trail
nonpoverty students on measures of academic proficiency. This achievement gap is a problem in
Alabama and across the nation. However, it is apparent in examining the Top 10 rankings that the
percent of students in poverty does not always predict rates of student proficiency.
Average Teacher Salary: These figures represent the average salary of certified teachers in a system.
Except for Arab and Cullman City systems, the schools in the top 10 have average salaries for teachers
higher than the state average. Some systems have extra local funding which they can use to supplement
teacher salaries. The average teacher pay in a system is also a reflection of teacher experience. If a
system has more veteran teachers who earn more thanks to seniority, the average pay for that system
will be higher.
FTE per 1,000 Students: On average, the top 10 systems have more full-time certified teachers per
student than the state average. On this measure, fast-growing systems, like Madison City and Auburn,
tend to lag behind because teacher units are allocated based on enrollment the previous year.
Inst & Inst. Spt Per Student: On average, the top 10 systems spend more per student on instruction and
instructional support per student than the state average. That is both a measure of resources and
emphasis. Systems with more resources and systems that contain spending on adminstration and
operations and maintenance can devote more to classroom spending.
The columns in Table 4 list the cumulative percentage of students scoring proficient on the Aspire in
grades 3-8 in 2014 in reading and math; the percentage of inexperienced teachers in each system’s
workforce; the percentage of teachers who are teaching subjects they aren’t certified to teach; and
finally the percentage of teachers in the system who have earned National Board Certification, an
advanced teaching credential The chart compares the systems, the averages of the top 10 systems, and
the state average in those categories.
17
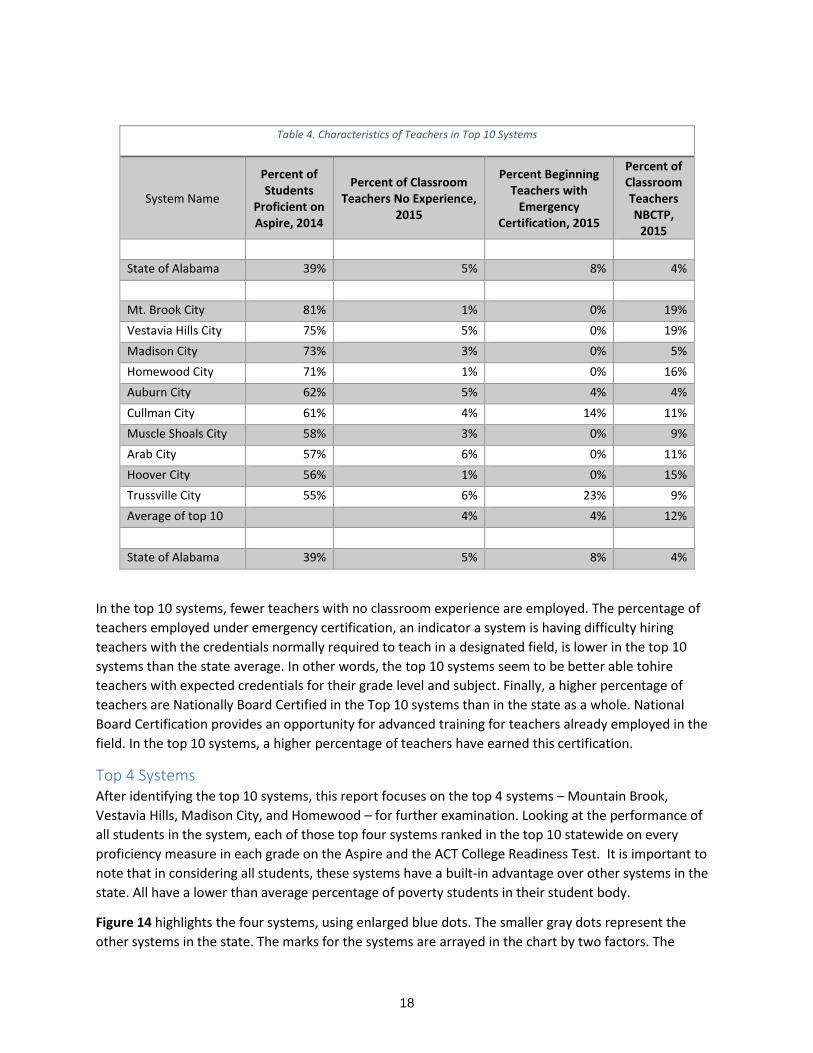
In the top 10 systems, fewer teachers with no classroom experience are employed. The percentage of
teachers employed under emergency certification, an indicator a system is having difficulty hiring
teachers with the credentials normally required to teach in a designated field, is lower in the top 10
systems than the state average. In other words, the top 10 systems seem to be better able tohire
teachers with expected credentials for their grade level and subject. Finally, a higher percentage of
teachers are Nationally Board Certified in the Top 10 systems than in the state as a whole. National
Board Certification provides an opportunity for advanced training for teachers already employed in the
field. In the top 10 systems, a higher percentage of teachers have earned this certification.
Top 4 Systems After identifying the top 10 systems, this report focuses on the top 4 systems – Mountain Brook,
Vestavia Hills, Madison City, and Homewood – for further examination. Looking at the performance of
all students in the system, each of those top four systems ranked in the top 10 statewide on every
proficiency measure in each grade on the Aspire and the ACT College Readiness Test. It is important to
note that in considering all students, these systems have a built-in advantage over other systems in the
state. All have a lower than average percentage of poverty students in their student body.
Figure 14 highlights the four systems, using enlarged blue dots. The smaller gray dots represent the
other systems in the state. The marks for the systems are arrayed in the chart by two factors. The
Table 4. Characteristics of Teachers in Top 10 Systems
System Name
Percent of Students
Proficient on Aspire, 2014
Percent of Classroom Teachers No Experience,
2015
Percent Beginning Teachers with
Emergency Certification, 2015
Percent of Classroom Teachers NBCTP,
2015
State of Alabama 39% 5% 8% 4%
Mt. Brook City 81% 1% 0% 19%
Vestavia Hills City 75% 5% 0% 19%
Madison City 73% 3% 0% 5%
Homewood City 71% 1% 0% 16%
Auburn City 62% 5% 4% 4%
Cullman City 61% 4% 14% 11%
Muscle Shoals City 58% 3% 0% 9%
Arab City 57% 6% 0% 11%
Hoover City 56% 1% 0% 15%
Trussville City 55% 6% 23% 9%
Average of top 10 4% 4% 12%
State of Alabama 39% 5% 8% 4%
18
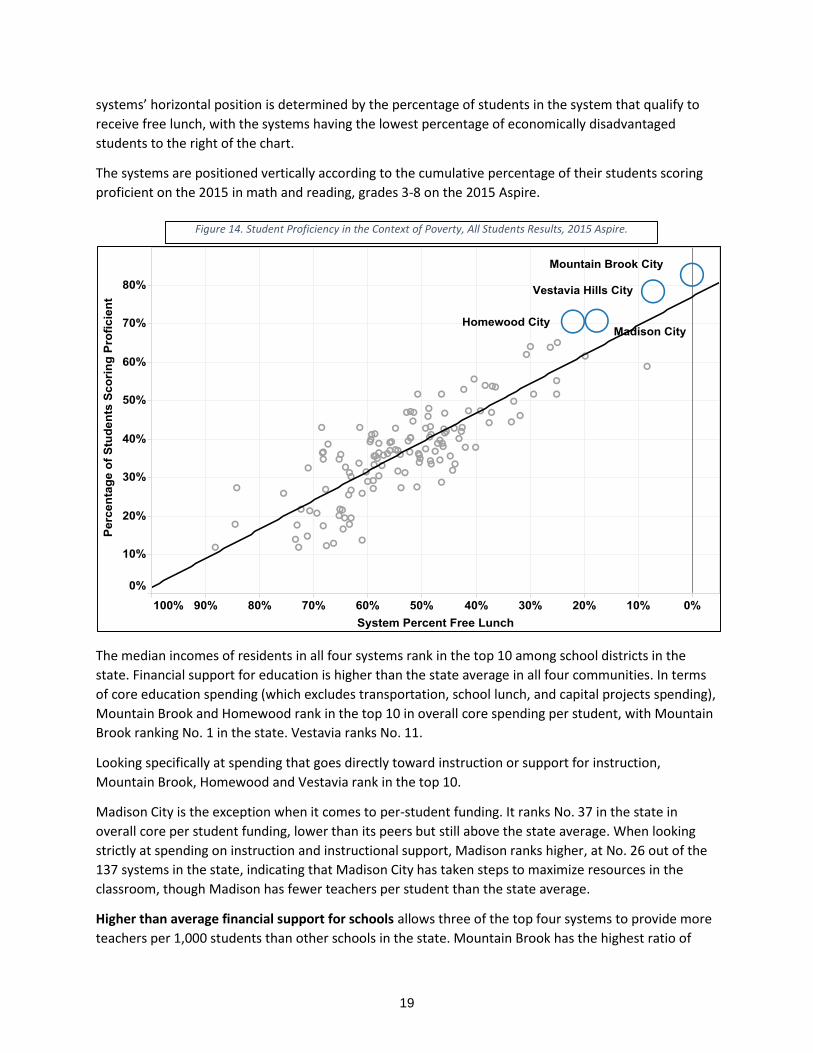
systems’ horizontal position is determined by the percentage of students in the system that qualify to
receive free lunch, with the systems having the lowest percentage of economically disadvantaged
students to the right of the chart.
The systems are positioned vertically according to the cumulative percentage of their students scoring
proficient on the 2015 in math and reading, grades 3-8 on the 2015 Aspire.
The median incomes of residents in all four systems rank in the top 10 among school districts in the
state. Financial support for education is higher than the state average in all four communities. In terms
of core education spending (which excludes transportation, school lunch, and capital projects spending),
Mountain Brook and Homewood rank in the top 10 in overall core spending per student, with Mountain
Brook ranking No. 1 in the state. Vestavia ranks No. 11.
Looking specifically at spending that goes directly toward instruction or support for instruction,
Mountain Brook, Homewood and Vestavia rank in the top 10.
Madison City is the exception when it comes to per-student funding. It ranks No. 37 in the state in
overall core per student funding, lower than its peers but still above the state average. When looking
strictly at spending on instruction and instructional support, Madison ranks higher, at No. 26 out of the
137 systems in the state, indicating that Madison City has taken steps to maximize resources in the
classroom, though Madison has fewer teachers per student than the state average.
Higher than average financial support for schools allows three of the top four systems to provide more
teachers per 1,000 students than other schools in the state. Mountain Brook has the highest ratio of
Figure 14. Student Proficiency in the Context of Poverty, All Students Results, 2015 Aspire.
19
teachers to students in the state, as well as enhanced offerings, like more Advanced Placement courses
and fine arts education and other electives. Not only do students enjoy the benefits of the wider
offerings, but the systems are also able to use those electives to give classroom teachers in the core
disciplines more time for planning, data analysis, and professional development.
While Starting Early through the expansion of Pre-K has been a statewide priority, it has been less of an
emphasis in the top 4 systems. Madison City is the only one of the four that operates a public First Class
Pre–K Early Learning Center. Because private Pre-K is widely available in Homewood, Vestavia, and
Mountain Brook, schools there have not chosen to start their own Pre-Ks. Mountain Brook does offer
professional development in early childhood education during the summer that is open to private Pre-K
providers in the community.
Each of the top 4 systems has high expectations for students. Those high expectations are common to
the teachers and administration and also held by parents and the community at large. Large majorities
of the parents of students in these systems are college educated and expect their children to go to
college as well. All four systems have high school graduation rates of 95 percent or greater. While the
four systems have lower than average poverty populations, all are mindful of challenges faced by
students in poverty and students who are faced with other factors that could be barriers to academic
success.
All four systems have gone beyond simply accepting Alabama’s new College and Career Ready
Standards. Though approaches vary, all four systems have used the standards as a jumping off point to
examine closely what they are teaching at which grade level, and how that learning builds grade level on
grade level. Each has developed a localized version of the standards, involving teams of teachers in that
process of localization and “unpacking” the standards. Homewood, for instance, had independently
developed its own set of learning targets for each grade level and in each subject prior to the state’s
adoption of new standards. Those learning targets were revised and in some instances realigned with
the adoption of the state new standards. Homewood’s learning targets are available on the Web to
parents5 and are translated to students in the form of “I can” statements that describe the skills and
content students should be mastering at each grade level. Each system has invested in extensive
professional development and training for the teachers affected by the new standards.
Though the structure varies, the top four systems prioritize and coordinate instruction across their
schools. School principals are expected to be the chief instructional leader at the school level, but in the
top four systems, each school also has an administrator and whose primary duty is to drive continuous
improvement of instruction. In addition, the systems provide school-based instructional coaches or
partners to support teachers and facilitate professional development.
Homewood and Mountain Brook chose to keep the reading specialists trained under the Alabama
Reading Initiative in the reading specialist position. Those two systems additionally hired math/science
support personnel, shared among schools, who play a role similar to the reading specialists. Madison
City and Vestavia Hills have converted their ARI reading specialists into “Instructional Partners,” who
support and facilitate teacher development across all subjects. In both Madison and Vestavia Hills, this
was not a simply a matter of expanding the role those specialists were expected to play. The transition
was accompanied by extensive training plus participation with the Instructional Partners Network, a
5 http://www.homewood.k12.al.us/?DivisionID=16827&ToggleSideNav=ShowAll
20
statewide initiative supported by Alabama Best Practices Center, a division of the A+ Education
Partnership.
In these systems, the school-based instructional professionals are supported by a system office charged
with system-wide alignment and support of instructional improvement. The school and system-level
instructional personnel are in regular communication to ensure the system-wide vision of high-quality
instruction is maintained.
Though all four systems have obviously achieved high average test scores, all say the focus of instruction
is on getting students to master the standards rather than doing well on tests.
All four systems carefully hire teachers. Each offers summer education and orientation and a system for
providing mentoring support for first-year teachers. As described in Teachers Matter,6 the 2015 BEA
report, mentoring support has been shown to increase teacher success and persistence in the field. The
2017 state education budget includes a $3 million allocation to revive the Alabama Teacher Mentor
program, providing systems across the state the ability to support first-year teachers with mentors.
The most successful systems provide opportunities for their teachers to plan jointly or pursue
professional development in the summer. This comes in the form of system organized workshops and
grants programs through which teachers can be paid a stipend for participating.
The most successful systems make time for professional development and planning embedded in the
school day. These systems construct schedules that give teachers time to plan individually, to plan with
grade level teams, and to meet as a faculty or by department across grades and across schools in the
system to share ideas, analyze student assessment data, and to ensure that there is continuity and
equity in the delivery of standards-based instruction. In addition to the regularly scheduled periods for
planning and learning, there is money set aside for substitute teachers that can be used to fill in when
teachers have specific training and learning opportunities available.
Student assessment data is considered a vital resource. It not just recorded and filed away, it is
analyzed by classroom, by individual student, and by grade level. By identifying patterns in the data,
teachers identify strengths and weaknesses in their teaching and spot specific areas in which students
are struggling. There is not a single magic bullet system of assessments to use. Homewood and Madison
City both use Star Assessments by Renaissance Learning. Mountain Brook uses Global Scholar, the
formative assessment tool paid for by the state. Vestavia uses easyCBM, an assessment tool developed
by educational researchers at the University of Oregon.
Teachers are evaluated on the basis of student growth in test scores. However, the successful systems
take pains to create a system of review that is non-threatening and collaborative, focused on producing
growth and improvement in teaching, not a system of punitive accountability. Instructional coaching
and other support are provided by personnel who are not involved in teacher review and hiring and
firing decisions. Madison City and Vestavia teachers participate in instructional rounds, a process
modeled on the medical field by which teachers visit each other's classrooms as observers. The visiting
teachers look for techniques and approaches they can take back to their classrooms. They can also
provide feedback to teachers they have observed. Both Mountain Brook and Vestavia Hills provide
6 http://beaalabama.com/wp-content/uploads/2013/07/2015-BEA-Report-Teachers-Matter.pdf
21
teachers that opportunity to come together to apply for grants to support summer learning and
planning.
Madison City and Vestavia Hills both make extensive use of surveys to gauge student, parent, teacher,
and community satisfaction. That data is used to identify areas in which the system or teachers need to
improve and informs system strategic planning.
Excellence in Pre-K: Selma City Schools We now look at individual systems that have made notable successes, either in select areas of emphasis
or in general performance that exceeds expectations.
Perhaps no area of emphasis is being more closely watched than the expansion of public Pre-K in
Alabama. A broad-based coalition of educators, government, civic, and business leaders have formed a
powerful coalition, the Alabama School Readiness Alliance, to support the expansion of Alabama’s First
Class Pre-K, viewed as a fundamental building block for improving education in Alabama. The Legislature
has responded, as discussed earlier in this report, by more than tripling the amount spent on Pre-K since
FY 2012.
The ultimate success of expansion depends on the efforts of the state agency that oversees the
program, the Department of Early Childhood Education, and its local providers. It is in those local
communities where the impact of improving the quality of early childhood education can most easily be
witnessed and measured.
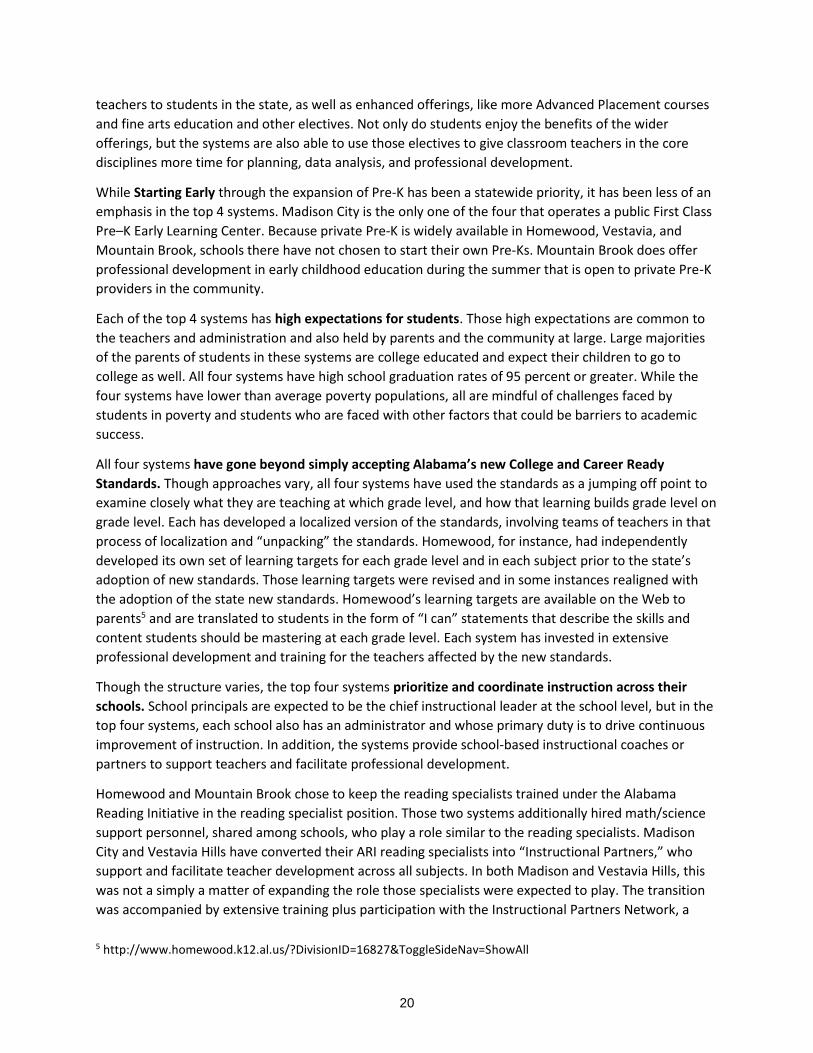
Selma City Schools First Class Pre-K Center provides an example. Prior to 2014, Selma City Schools
offered Pre-K at its elementary schools. The Pre-K classrooms for 4-year olds were paid for with Title I
funds, federal funds intended to provide improved
educational outcomes at high poverty schools. In 2014, all
Selma’s Pre-K’s were relocated to a single Pre-K center,
housed at what had been Byrd Elementary School.
The 97-year-old school was transformed. Entering a
classroom, a visitor is invited by the children to lunch at a play
kitchen and treated to a carefully set table. Another student
presents his artwork. Other groups are assembled listening to
a story or playing in a small sandbox, excavating buried letters
using a magnetic wand and showing off their skills by making
the sound of each letter discovered.
By consolidating Selma’s Pre-K’s at a single site, the system
created a facility focused exclusively on the developmental
needs of early learners. In that setting the system was able to
draw together three sources of support: Title I funding from
Selma City Schools, grants from Alabama’s First Class Pre-K
Initiative, and more federal support from the Federal Head
Start program. The partnership structure offered several
advantages, drawing on the strengths of all three programs.
Children search for letters in one of Selma’s Byrd Early Learning Center's First Class Pre-K classrooms.
22
The affiliation with the K-12 system meant that the Pre-K faculty met teacher certification standards and
already were paid according to the state salary scale. However, in contrast to the prior arrangement, in
which Pre-K education was an add-on to an elementary school, the Byrd facility has been reconfigured
to focus on providing a setting that was developmentally appropriate for early learners. That applied
both to the educational approach and to the facilities: classrooms, lunchrooms, and playgrounds
designed for enrichment, comfort, and safety of young children.
Participation with the First Class Pre-K program brought with it resources and high standards specifically
geared toward Pre-K education. State supported coaches from the First Class Pre-K program provided
professional development and support for teachers at the single site. Byrd’s administrator and its
teachers were able to collaborate around the best approaches to teaching 4 year-olds, rather than
functioning as an appendage to the more academically
focused elementary schools. Byrd provides a single site for
gauging the progress of young children and providing
specialized services when needed.
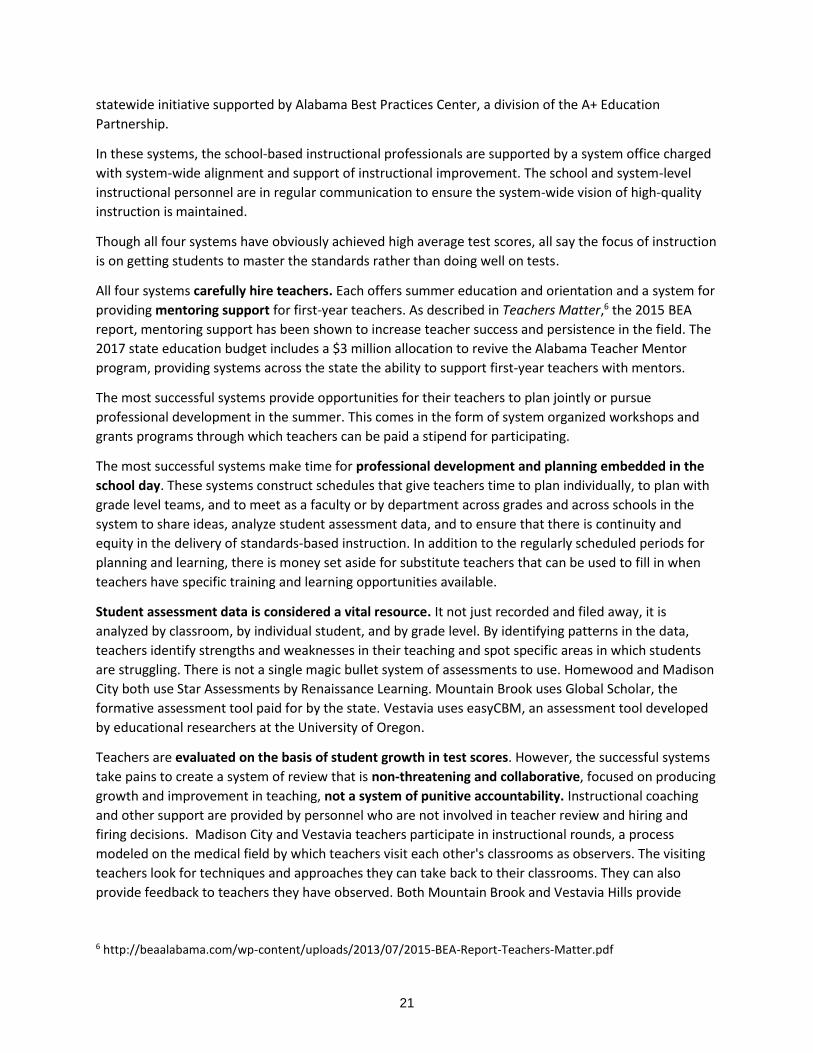
Head Start brought with it a long-standing approach to
parental involvement, and a focus on health and safety.
Head Start classrooms for three-year-olds were also hosted
at the site, making efficient use of the facility. Unlike a K-12
school environment, the Byrd Center had to comply with
Department of Human Resources safety standards for child-
care centers, bringing an added attention to child safety.
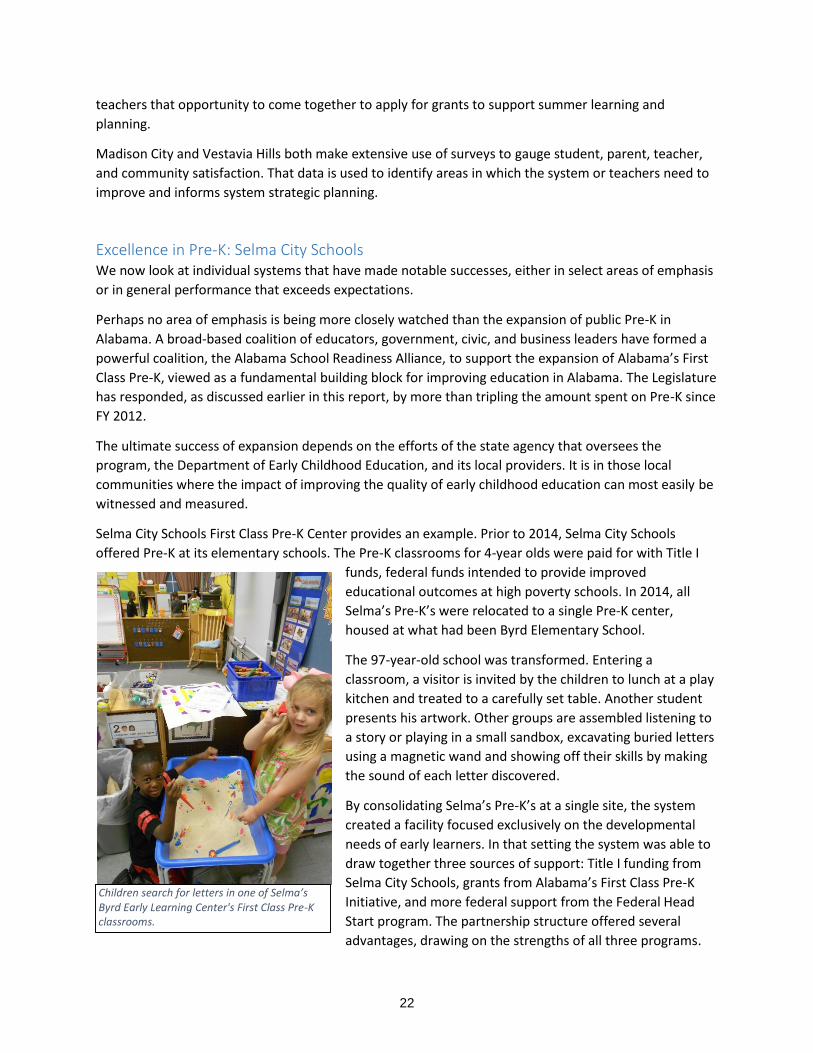
After its first year of operation in the 2014-2015 school year,
Byrd was able to demonstrate positive results. Table 5
compares the DIBELS Assessments of First Class Pre-K Byrd
students who entered kindergarten in the 2015-2016 school
year, with the results from children who entered
Kindergarten in the 2014-2015 school who had attended
Title I Pre-K in the individual schools the prior year.
Pre-K Classes On Track for Literacy At Risk or At Some Risk of Failing to Meet Literacy Benchmarks
2014 Students who attended Pre-K at individual schools
53% 47%
2015 Students from Byrd’s First Class Pre-K
75% 25%
DIBELS (Dynamic Indicators of Basic Early Literacy Skills) is a widely used assessment of student progress
toward reading. These DIBELS assessments were performed by Selma Kindergarten teachers on new
students at the beginning of the school year in both of the comparison years. As indicated in Table 5,
Student shows off his artwork at Byrd ELC.
Table 5. Comparing Children from Pre-K in Individual Schools in 2014 vs. Byrd ELC Children in 2015
23
students who participated in First Class Pre-K at the Byrd Early Learning Center were much more likely to
meet DIBELS literacy benchmarks and much less likely to be assessed as being at risk for failing to
progress. In other words, Byrd students entering kindergarten were better prepared to learn to read.
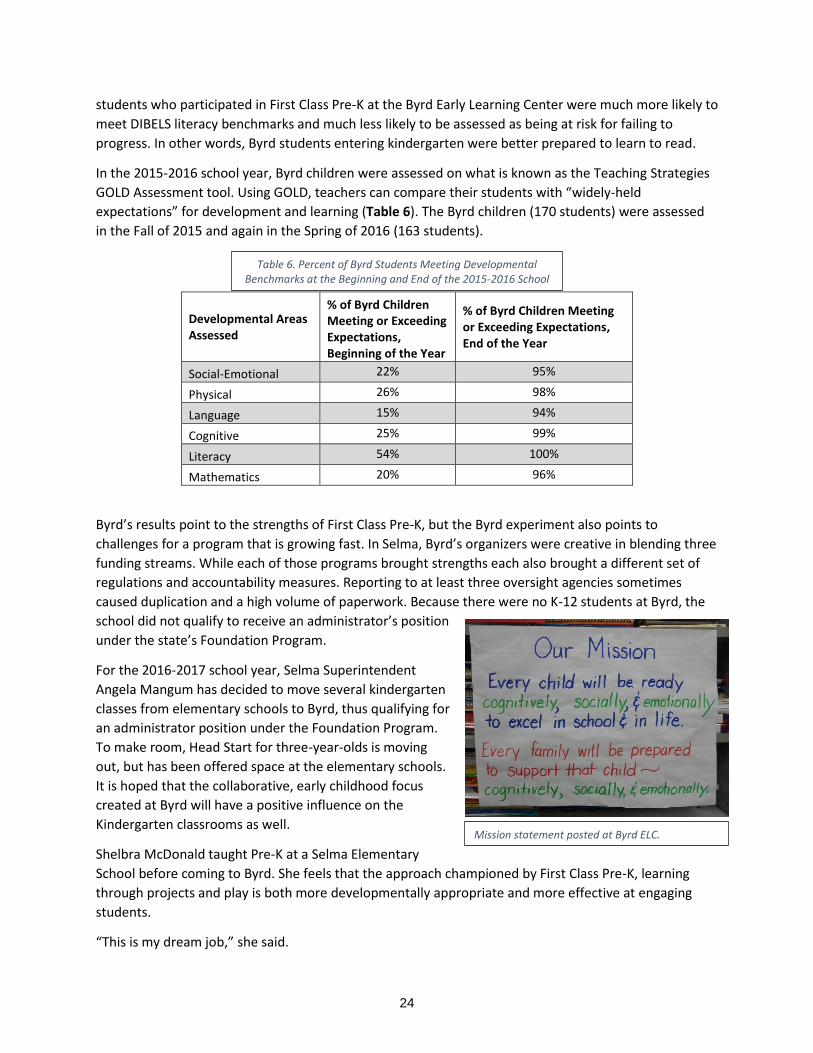
In the 2015-2016 school year, Byrd children were assessed on what is known as the Teaching Strategies
GOLD Assessment tool. Using GOLD, teachers can compare their students with “widely-held
expectations” for development and learning (Table 6). The Byrd children (170 students) were assessed
in the Fall of 2015 and again in the Spring of 2016 (163 students).
Developmental Areas Assessed
% of Byrd Children Meeting or Exceeding Expectations, Beginning of the Year
% of Byrd Children Meeting or Exceeding Expectations, End of the Year
Social-Emotional 22% 95%
Physical 26% 98%
Language 15% 94%
Cognitive 25% 99%
Literacy 54% 100%
Mathematics 20% 96%
Byrd’s results point to the strengths of First Class Pre-K, but the Byrd experiment also points to
challenges for a program that is growing fast. In Selma, Byrd’s organizers were creative in blending three
funding streams. While each of those programs brought strengths each also brought a different set of
regulations and accountability measures. Reporting to at least three oversight agencies sometimes
caused duplication and a high volume of paperwork. Because there were no K-12 students at Byrd, the
school did not qualify to receive an administrator’s position
under the state’s Foundation Program.
For the 2016-2017 school year, Selma Superintendent
Angela Mangum has decided to move several kindergarten
classes from elementary schools to Byrd, thus qualifying for
an administrator position under the Foundation Program.
To make room, Head Start for three-year-olds is moving
out, but has been offered space at the elementary schools.
It is hoped that the collaborative, early childhood focus
created at Byrd will have a positive influence on the
Kindergarten classrooms as well.
Shelbra McDonald taught Pre-K at a Selma Elementary
School before coming to Byrd. She feels that the approach championed by First Class Pre-K, learning
through projects and play is both more developmentally appropriate and more effective at engaging
students.
“This is my dream job,” she said.
Mission statement posted at Byrd ELC.
Table 6. Percent of Byrd Students Meeting Developmental Benchmarks at the Beginning and End of the 2015-2016 School
Year
24
Excellence in a Majority Poverty system (Oxford City Schools) Enrollment: 4,164
Percent of Students Qualifying for Free Lunch: 51
State Rank in Instructional and Instruction Support Spending per Student: 37
In some ways, the Oxford City School system resembles an affluent suburban school system. It has
gleaming new schools. It is rapidly-growing. It enjoys generous financial support from its city. It ranks
among the Top 20 system in the state in terms of overall performance on the ACT Aspire.
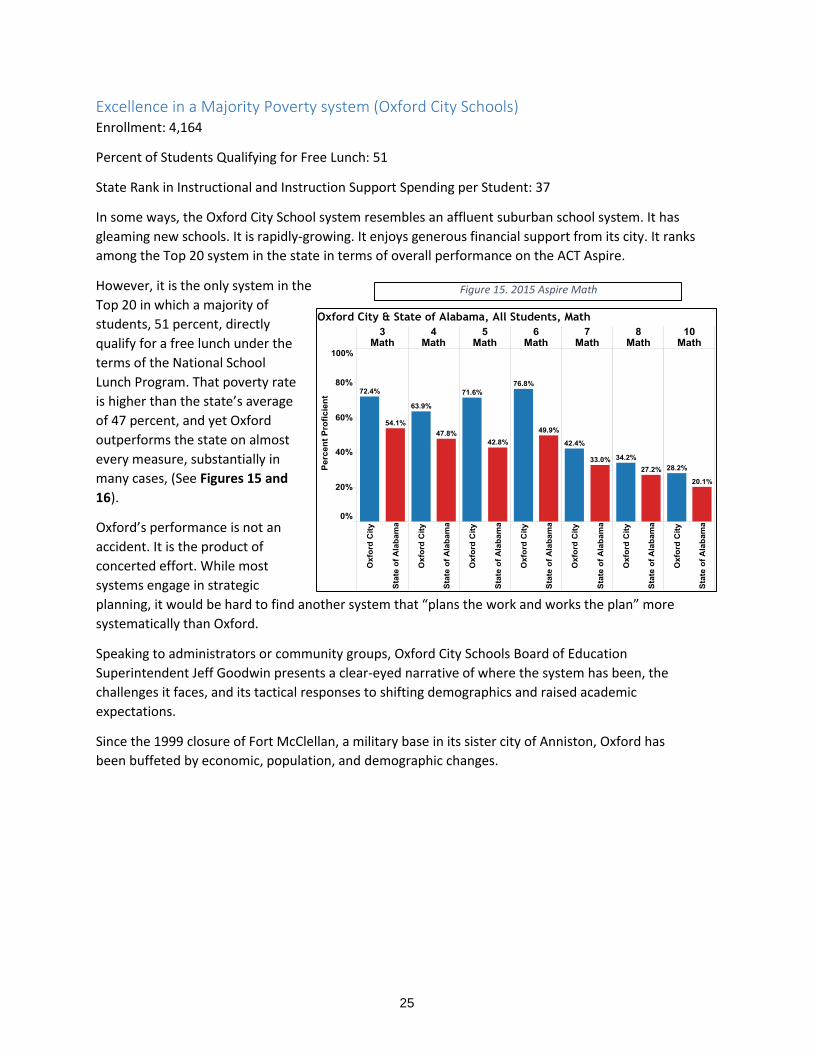
However, it is the only system in the
Top 20 in which a majority of
students, 51 percent, directly
qualify for a free lunch under the
terms of the National School
Lunch Program. That poverty rate
is higher than the state’s average
of 47 percent, and yet Oxford
outperforms the state on almost
every measure, substantially in
many cases, (See Figures 15 and
16).
Oxford’s performance is not an
accident. It is the product of
concerted effort. While most
systems engage in strategic
planning, it would be hard to find another system that “plans the work and works the plan” more
systematically than Oxford.
Speaking to administrators or community groups, Oxford City Schools Board of Education
Superintendent Jeff Goodwin presents a clear-eyed narrative of where the system has been, the
challenges it faces, and its tactical responses to shifting demographics and raised academic
expectations.
Since the 1999 closure of Fort McClellan, a military base in its sister city of Anniston, Oxford has
been buffeted by economic, population, and demographic changes.
Figure 15. 2015 Aspire Math
25
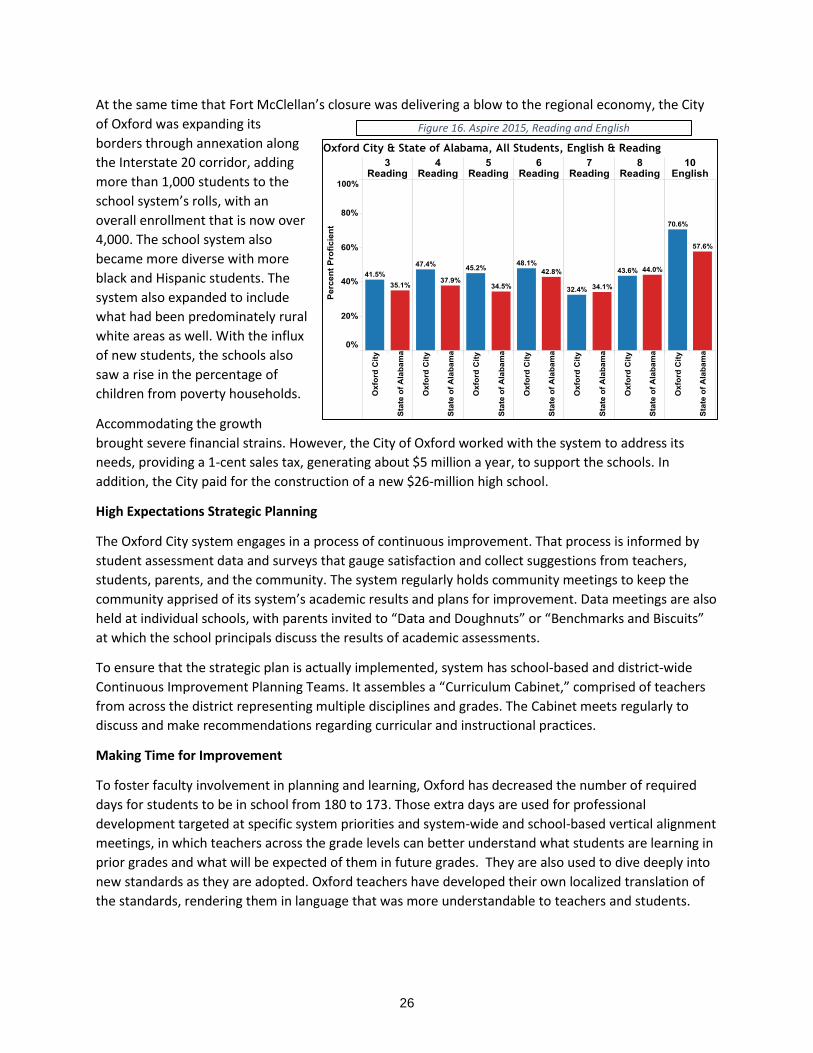
At the same time that Fort McClellan’s closure was delivering a blow to the regional economy, the City
of Oxford was expanding its
borders through annexation along
the Interstate 20 corridor, adding
more than 1,000 students to the
school system’s rolls, with an
overall enrollment that is now over
4,000. The school system also
became more diverse with more
black and Hispanic students. The
system also expanded to include
what had been predominately rural
white areas as well. With the influx
of new students, the schools also
saw a rise in the percentage of
children from poverty households.
Accommodating the growth
brought severe financial strains. However, the City of Oxford worked with the system to address its
needs, providing a 1-cent sales tax, generating about $5 million a year, to support the schools. In
addition, the City paid for the construction of a new $26-million high school.
High Expectations Strategic Planning
The Oxford City system engages in a process of continuous improvement. That process is informed by
student assessment data and surveys that gauge satisfaction and collect suggestions from teachers,
students, parents, and the community. The system regularly holds community meetings to keep the
community apprised of its system’s academic results and plans for improvement. Data meetings are also
held at individual schools, with parents invited to “Data and Doughnuts” or “Benchmarks and Biscuits”
at which the school principals discuss the results of academic assessments.
To ensure that the strategic plan is actually implemented, system has school-based and district-wide
Continuous Improvement Planning Teams. It assembles a “Curriculum Cabinet,” comprised of teachers
from across the district representing multiple disciplines and grades. The Cabinet meets regularly to
discuss and make recommendations regarding curricular and instructional practices.
Making Time for Improvement
To foster faculty involvement in planning and learning, Oxford has decreased the number of required
days for students to be in school from 180 to 173. Those extra days are used for professional
development targeted at specific system priorities and system-wide and school-based vertical alignment
meetings, in which teachers across the grade levels can better understand what students are learning in
prior grades and what will be expected of them in future grades. They are also used to dive deeply into
new standards as they are adopted. Oxford teachers have developed their own localized translation of
the standards, rendering them in language that was more understandable to teachers and students.
Figure 16. Aspire 2015, Reading and English
26
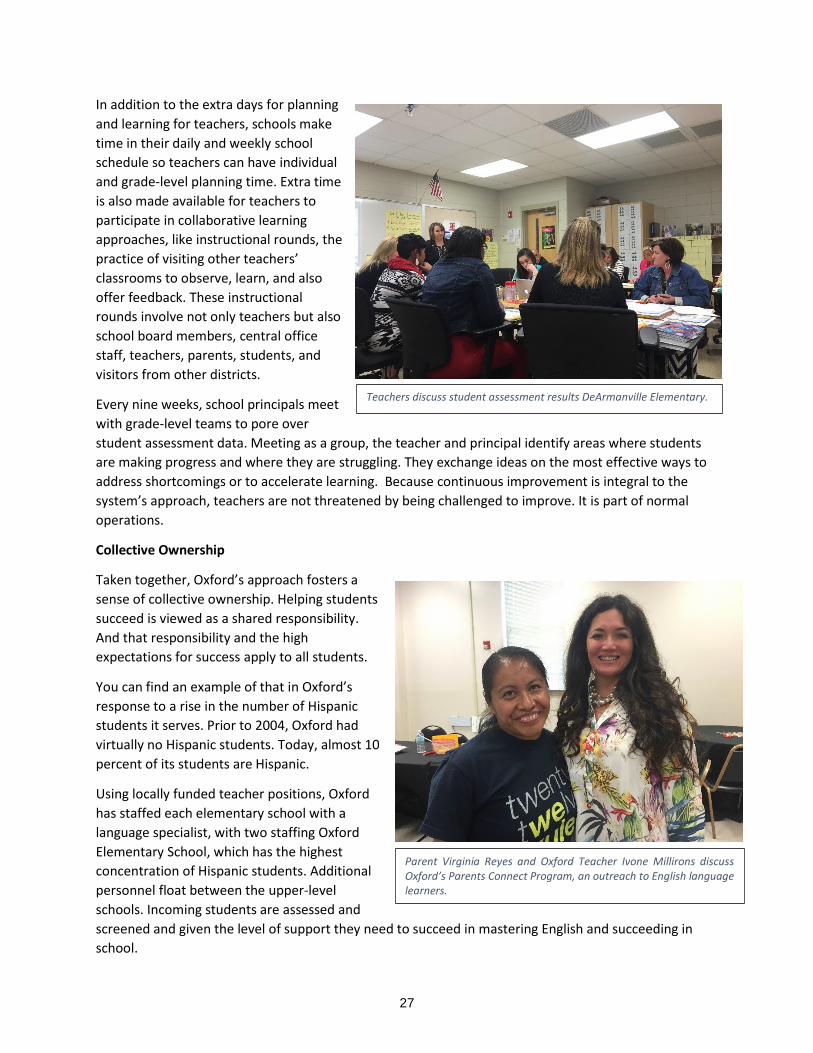
In addition to the extra days for planning
and learning for teachers, schools make
time in their daily and weekly school
schedule so teachers can have individual
and grade-level planning time. Extra time
is also made available for teachers to
participate in collaborative learning
approaches, like instructional rounds, the
practice of visiting other teachers’
classrooms to observe, learn, and also
offer feedback. These instructional
rounds involve not only teachers but also
school board members, central office
staff, teachers, parents, students, and
visitors from other districts.
Every nine weeks, school principals meet
with grade-level teams to pore over
student assessment data. Meeting as a group, the teacher and principal identify areas where students
are making progress and where they are struggling. They exchange ideas on the most effective ways to
address shortcomings or to accelerate learning. Because continuous improvement is integral to the
system’s approach, teachers are not threatened by being challenged to improve. It is part of normal
operations.
Collective Ownership
Taken together, Oxford’s approach fosters a
sense of collective ownership. Helping students
succeed is viewed as a shared responsibility.
And that responsibility and the high
expectations for success apply to all students.
You can find an example of that in Oxford’s
response to a rise in the number of Hispanic
students it serves. Prior to 2004, Oxford had
virtually no Hispanic students. Today, almost 10
percent of its students are Hispanic.
Using locally funded teacher positions, Oxford
has staffed each elementary school with a
language specialist, with two staffing Oxford
Elementary School, which has the highest
concentration of Hispanic students. Additional
personnel float between the upper-level
schools. Incoming students are assessed and
screened and given the level of support they need to succeed in mastering English and succeeding in
school.
Parent Virginia Reyes and Oxford Teacher Ivone Millirons discuss Oxford’s Parents Connect Program, an outreach to English language learners.
Teachers discuss student assessment results DeArmanville Elementary.
27
Every Monday and Thursday for two hours, parents of Hispanic students are invited to school for
sessions, conducted in Spanish, which cover the material their children are learning in school.
Facilitators for Oxford’s Parents Connect also support the parents with instruction on the technological
aids available, like Spanish language digital textbooks. Virginia Reyes said the sessions have been helpful
for her and her children. It has helped her improve her language skills and system personnel have
helped her husband enter classes at Ayers State Technical College to advance his education in auto
mechanics.
“I like Parents Connect. My child learns. I learn. Together we learn,” she said.
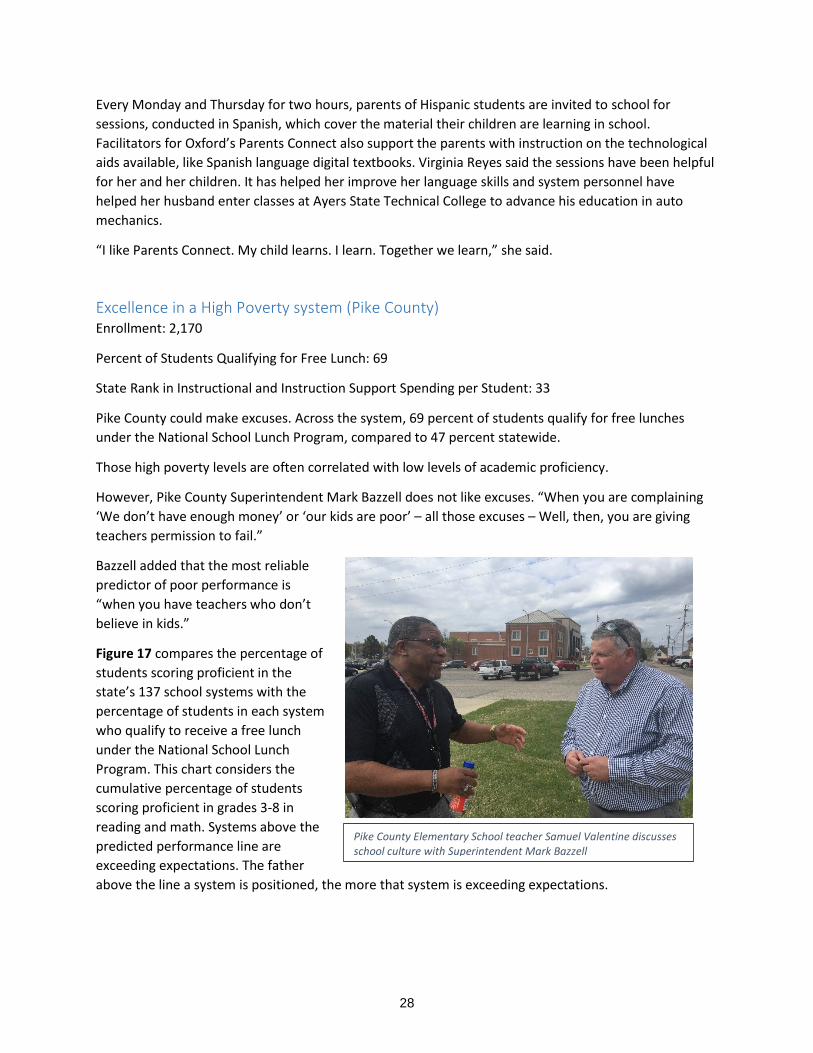
Excellence in a High Poverty system (Pike County) Enrollment: 2,170
Percent of Students Qualifying for Free Lunch: 69
State Rank in Instructional and Instruction Support Spending per Student: 33
Pike County could make excuses. Across the system, 69 percent of students qualify for free lunches
under the National School Lunch Program, compared to 47 percent statewide.
Those high poverty levels are often correlated with low levels of academic proficiency.
However, Pike County Superintendent Mark Bazzell does not like excuses. “When you are complaining
‘We don’t have enough money’ or ‘our kids are poor’ – all those excuses – Well, then, you are giving
teachers permission to fail.”
Bazzell added that the most reliable
predictor of poor performance is
“when you have teachers who don’t
believe in kids.”
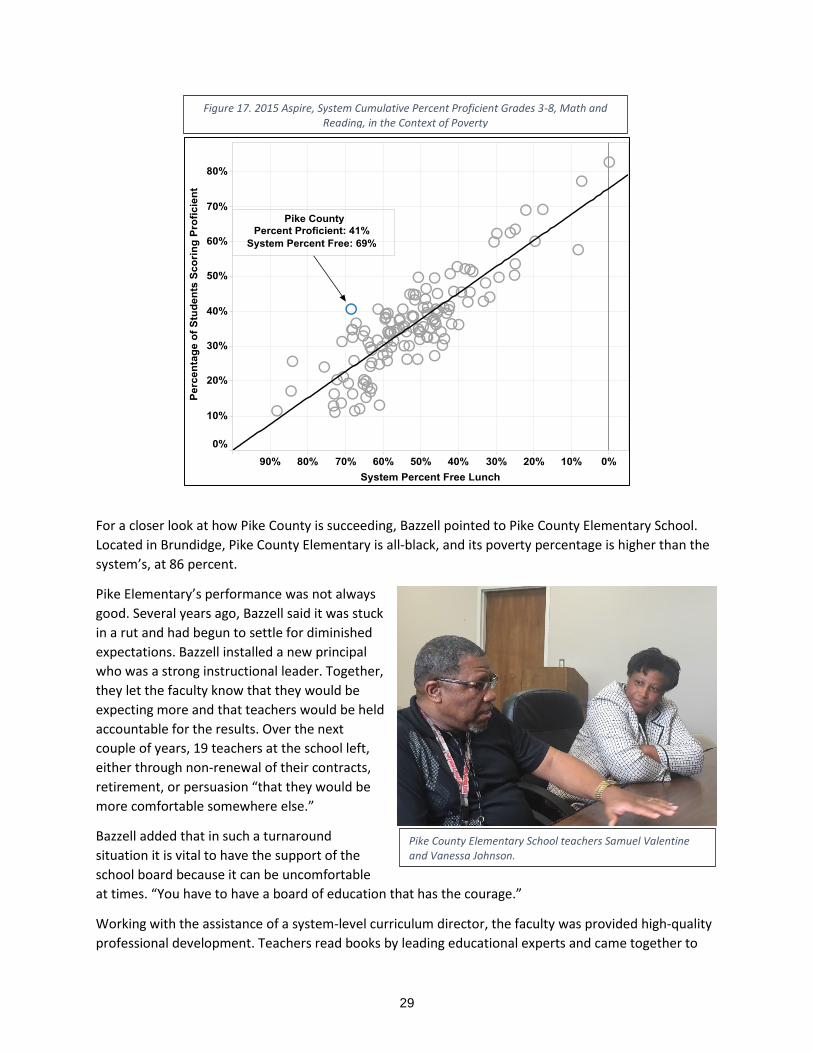
Figure 17 compares the percentage of
students scoring proficient in the
state’s 137 school systems with the
percentage of students in each system
who qualify to receive a free lunch
under the National School Lunch
Program. This chart considers the
cumulative percentage of students
scoring proficient in grades 3-8 in
reading and math. Systems above the
predicted performance line are
exceeding expectations. The father
above the line a system is positioned, the more that system is exceeding expectations.
Pike County Elementary School teacher Samuel Valentine discusses school culture with Superintendent Mark Bazzell
28
For a closer look at how Pike County is succeeding, Bazzell pointed to Pike County Elementary School.
Located in Brundidge, Pike County Elementary is all-black, and its poverty percentage is higher than the
system’s, at 86 percent.
Pike Elementary’s performance was not always
good. Several years ago, Bazzell said it was stuck
in a rut and had begun to settle for diminished
expectations. Bazzell installed a new principal
who was a strong instructional leader. Together,
they let the faculty know that they would be
expecting more and that teachers would be held
accountable for the results. Over the next
couple of years, 19 teachers at the school left,
either through non-renewal of their contracts,
retirement, or persuasion “that they would be
more comfortable somewhere else.”
Bazzell added that in such a turnaround
situation it is vital to have the support of the
school board because it can be uncomfortable
at times. “You have to have a board of education that has the courage.”
Working with the assistance of a system-level curriculum director, the faculty was provided high-quality
professional development. Teachers read books by leading educational experts and came together to
Pike County Elementary School teachers Samuel Valentine and Vanessa Johnson.
Figure 17. 2015 Aspire, System Cumulative Percent Proficient Grades 3-8, Math and Reading, in the Context of Poverty
29
discuss them. They did a through re-evaluation of lesson plans, dove into new state standards, and
concentrated on disaggregating to identify problem areas.
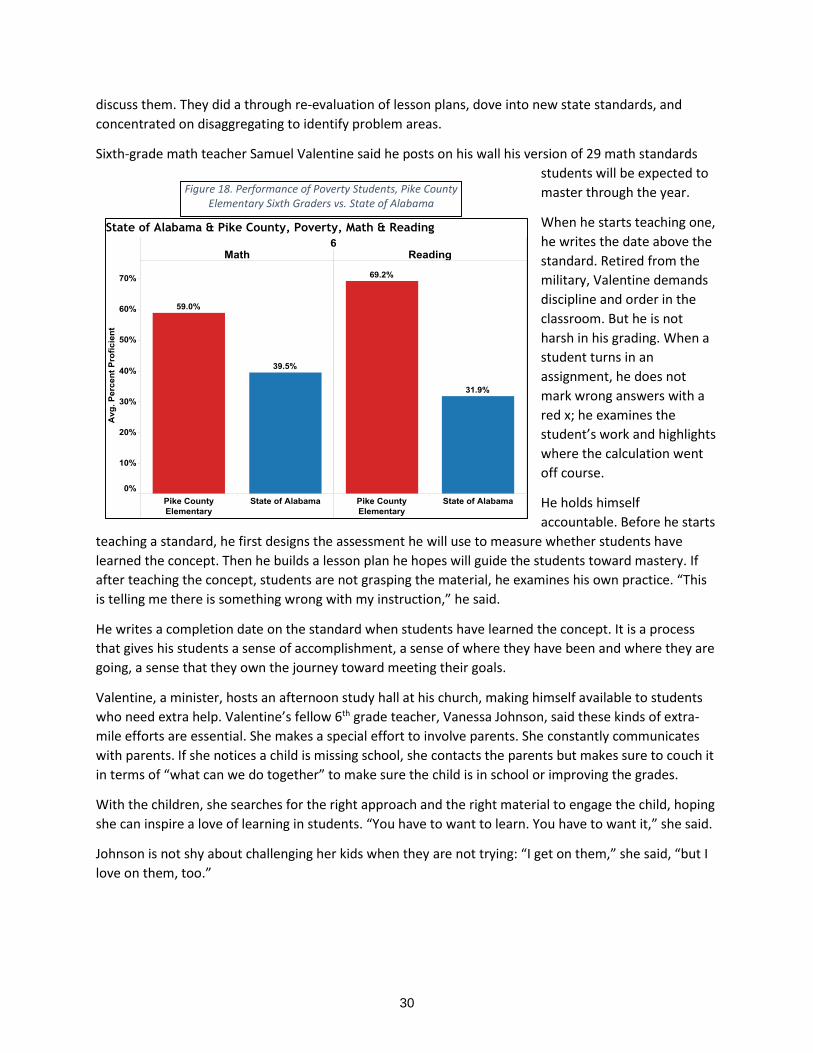
Sixth-grade math teacher Samuel Valentine said he posts on his wall his version of 29 math standards
students will be expected to
master through the year.
When he starts teaching one,
he writes the date above the
standard. Retired from the
military, Valentine demands
discipline and order in the
classroom. But he is not
harsh in his grading. When a
student turns in an
assignment, he does not
mark wrong answers with a
red x; he examines the
student’s work and highlights
where the calculation went
off course.
He holds himself
accountable. Before he starts
teaching a standard, he first designs the assessment he will use to measure whether students have
learned the concept. Then he builds a lesson plan he hopes will guide the students toward mastery. If
after teaching the concept, students are not grasping the material, he examines his own practice. “This
is telling me there is something wrong with my instruction,” he said.
He writes a completion date on the standard when students have learned the concept. It is a process
that gives his students a sense of accomplishment, a sense of where they have been and where they are
going, a sense that they own the journey toward meeting their goals.
Valentine, a minister, hosts an afternoon study hall at his church, making himself available to students
who need extra help. Valentine’s fellow 6th grade teacher, Vanessa Johnson, said these kinds of extra-
mile efforts are essential. She makes a special effort to involve parents. She constantly communicates
with parents. If she notices a child is missing school, she contacts the parents but makes sure to couch it
in terms of “what can we do together” to make sure the child is in school or improving the grades.
With the children, she searches for the right approach and the right material to engage the child, hoping
she can inspire a love of learning in students. “You have to want to learn. You have to want it,” she said.
Johnson is not shy about challenging her kids when they are not trying: “I get on them,” she said, “but I
love on them, too.”
Figure 18. Performance of Poverty Students, Pike County Elementary Sixth Graders vs. State of Alabama
30
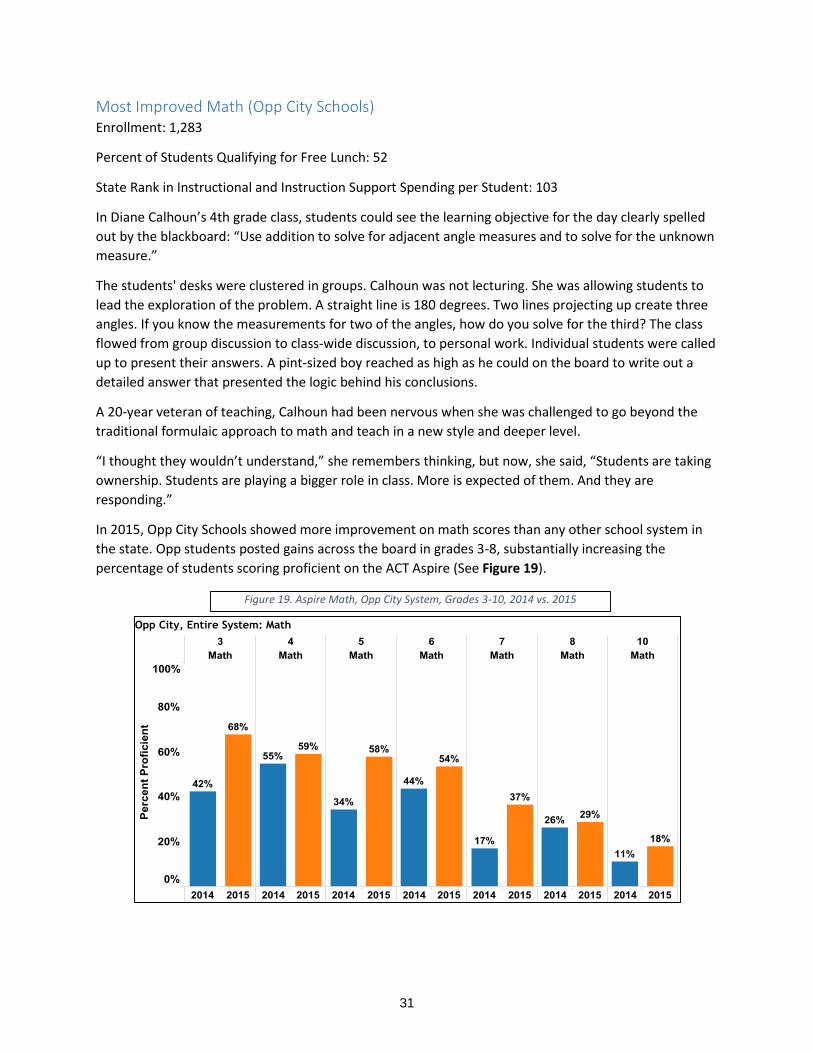
Most Improved Math (Opp City Schools) Enrollment: 1,283
Percent of Students Qualifying for Free Lunch: 52
State Rank in Instructional and Instruction Support Spending per Student: 103
In Diane Calhoun’s 4th grade class, students could see the learning objective for the day clearly spelled
out by the blackboard: “Use addition to solve for adjacent angle measures and to solve for the unknown
measure.”
The students' desks were clustered in groups. Calhoun was not lecturing. She was allowing students to
lead the exploration of the problem. A straight line is 180 degrees. Two lines projecting up create three
angles. If you know the measurements for two of the angles, how do you solve for the third? The class
flowed from group discussion to class-wide discussion, to personal work. Individual students were called
up to present their answers. A pint-sized boy reached as high as he could on the board to write out a
detailed answer that presented the logic behind his conclusions.
A 20-year veteran of teaching, Calhoun had been nervous when she was challenged to go beyond the
traditional formulaic approach to math and teach in a new style and deeper level.
“I thought they wouldn’t understand,” she remembers thinking, but now, she said, “Students are taking
ownership. Students are playing a bigger role in class. More is expected of them. And they are
responding.”
In 2015, Opp City Schools showed more improvement on math scores than any other school system in
the state. Opp students posted gains across the board in grades 3-8, substantially increasing the
percentage of students scoring proficient on the ACT Aspire (See Figure 19).
Figure 19. Aspire Math, Opp City System, Grades 3-10, 2014 vs. 2015
31
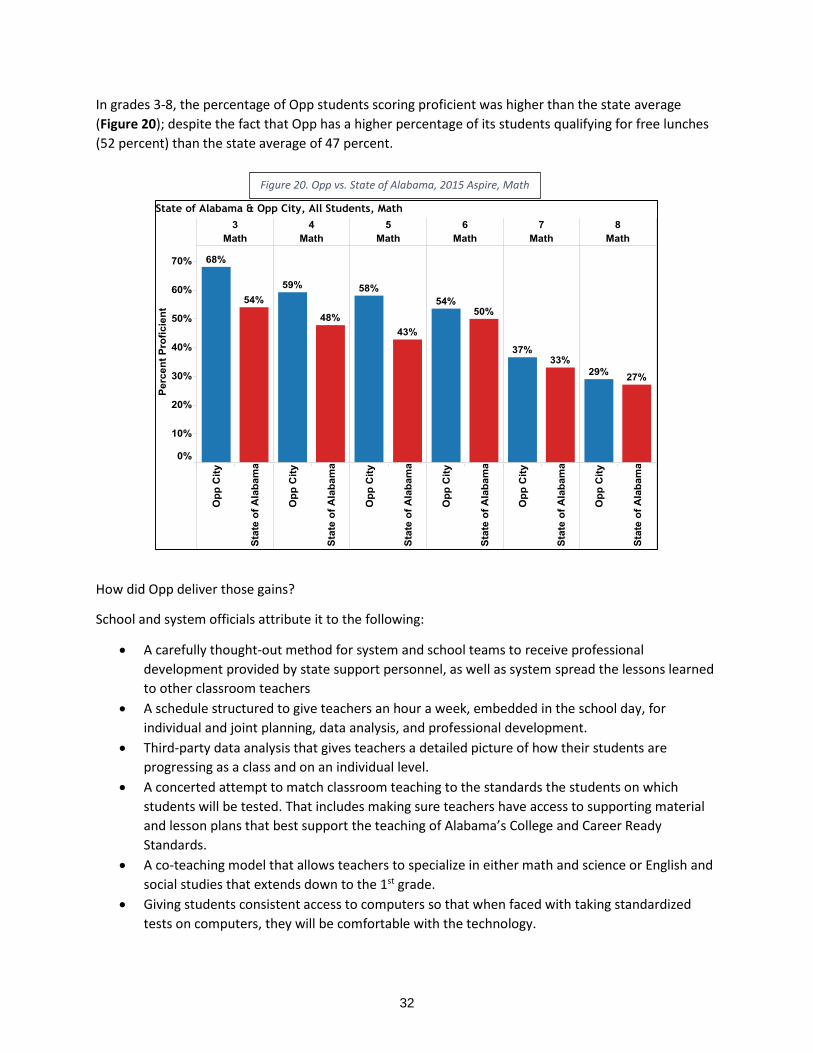
In grades 3-8, the percentage of Opp students scoring proficient was higher than the state average
(Figure 20); despite the fact that Opp has a higher percentage of its students qualifying for free lunches
(52 percent) than the state average of 47 percent.
How did Opp deliver those gains?
School and system officials attribute it to the following:
A carefully thought-out method for system and school teams to receive professional
development provided by state support personnel, as well as system spread the lessons learned
to other classroom teachers
A schedule structured to give teachers an hour a week, embedded in the school day, for
individual and joint planning, data analysis, and professional development.
Third-party data analysis that gives teachers a detailed picture of how their students are
progressing as a class and on an individual level.
A concerted attempt to match classroom teaching to the standards the students on which
students will be tested. That includes making sure teachers have access to supporting material
and lesson plans that best support the teaching of Alabama’s College and Career Ready
Standards.
A co-teaching model that allows teachers to specialize in either math and science or English and
social studies that extends down to the 1st grade.
Giving students consistent access to computers so that when faced with taking standardized
tests on computers, they will be comfortable with the technology.
Figure 20. Opp vs. State of Alabama, 2015 Aspire, Math
32
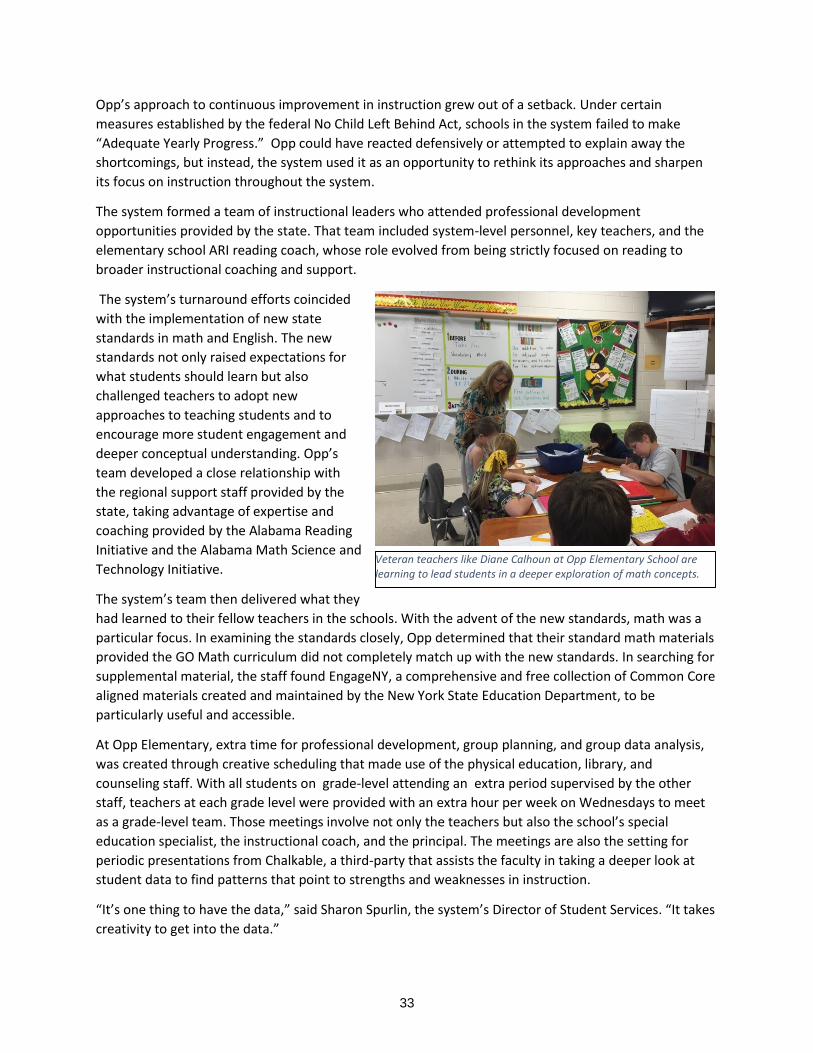
Opp’s approach to continuous improvement in instruction grew out of a setback. Under certain
measures established by the federal No Child Left Behind Act, schools in the system failed to make
“Adequate Yearly Progress.” Opp could have reacted defensively or attempted to explain away the
shortcomings, but instead, the system used it as an opportunity to rethink its approaches and sharpen
its focus on instruction throughout the system.
The system formed a team of instructional leaders who attended professional development
opportunities provided by the state. That team included system-level personnel, key teachers, and the
elementary school ARI reading coach, whose role evolved from being strictly focused on reading to
broader instructional coaching and support.
The system’s turnaround efforts coincided
with the implementation of new state
standards in math and English. The new
standards not only raised expectations for
what students should learn but also
challenged teachers to adopt new
approaches to teaching students and to
encourage more student engagement and
deeper conceptual understanding. Opp’s
team developed a close relationship with
the regional support staff provided by the
state, taking advantage of expertise and
coaching provided by the Alabama Reading
Initiative and the Alabama Math Science and
Technology Initiative.
The system’s team then delivered what they
had learned to their fellow teachers in the schools. With the advent of the new standards, math was a
particular focus. In examining the standards closely, Opp determined that their standard math materials
provided the GO Math curriculum did not completely match up with the new standards. In searching for
supplemental material, the staff found EngageNY, a comprehensive and free collection of Common Core
aligned materials created and maintained by the New York State Education Department, to be
particularly useful and accessible.
At Opp Elementary, extra time for professional development, group planning, and group data analysis,
was created through creative scheduling that made use of the physical education, library, and
counseling staff. With all students on grade-level attending an extra period supervised by the other
staff, teachers at each grade level were provided with an extra hour per week on Wednesdays to meet
as a grade-level team. Those meetings involve not only the teachers but also the school’s special
education specialist, the instructional coach, and the principal. The meetings are also the setting for
periodic presentations from Chalkable, a third-party that assists the faculty in taking a deeper look at
student data to find patterns that point to strengths and weaknesses in instruction.
“It’s one thing to have the data,” said Sharon Spurlin, the system’s Director of Student Services. “It takes
creativity to get into the data.”
Veteran teachers like Diane Calhoun at Opp Elementary School are learning to lead students in a deeper exploration of math concepts.
33
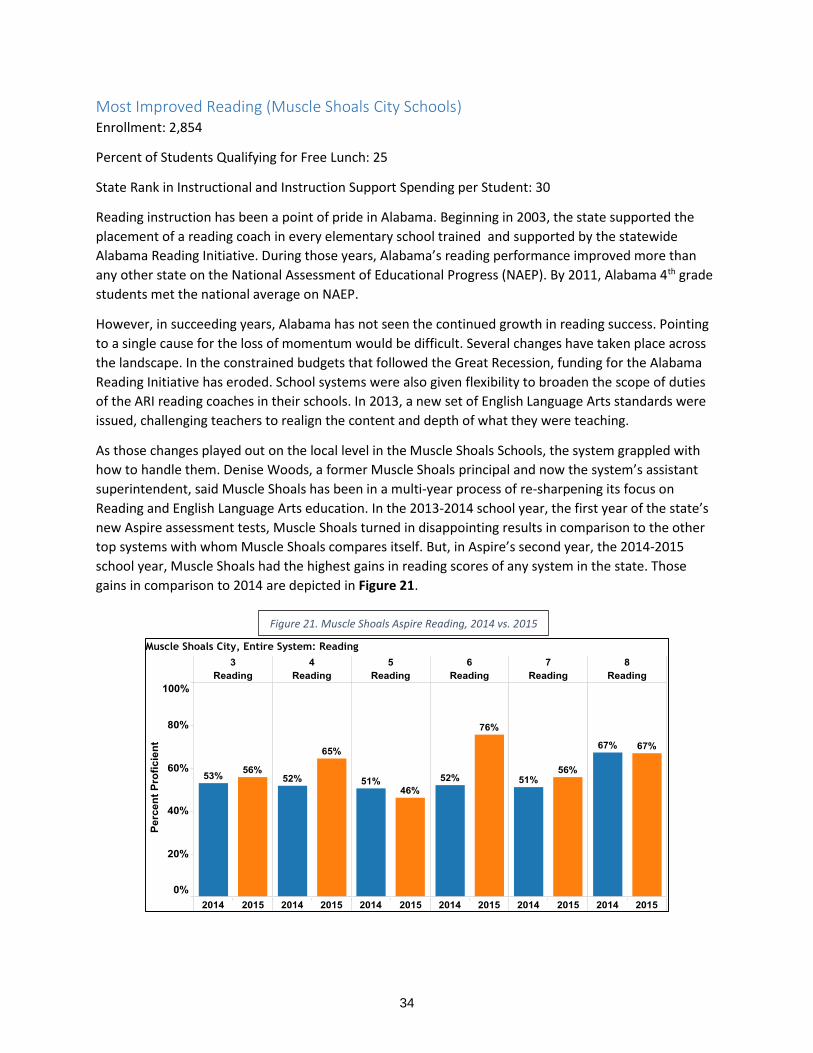
Most Improved Reading (Muscle Shoals City Schools) Enrollment: 2,854
Percent of Students Qualifying for Free Lunch: 25
State Rank in Instructional and Instruction Support Spending per Student: 30
Reading instruction has been a point of pride in Alabama. Beginning in 2003, the state supported the
placement of a reading coach in every elementary school trained and supported by the statewide
Alabama Reading Initiative. During those years, Alabama’s reading performance improved more than
any other state on the National Assessment of Educational Progress (NAEP). By 2011, Alabama 4th grade
students met the national average on NAEP.
However, in succeeding years, Alabama has not seen the continued growth in reading success. Pointing
to a single cause for the loss of momentum would be difficult. Several changes have taken place across
the landscape. In the constrained budgets that followed the Great Recession, funding for the Alabama
Reading Initiative has eroded. School systems were also given flexibility to broaden the scope of duties
of the ARI reading coaches in their schools. In 2013, a new set of English Language Arts standards were
issued, challenging teachers to realign the content and depth of what they were teaching.
As those changes played out on the local level in the Muscle Shoals Schools, the system grappled with
how to handle them. Denise Woods, a former Muscle Shoals principal and now the system’s assistant
superintendent, said Muscle Shoals has been in a multi-year process of re-sharpening its focus on
Reading and English Language Arts education. In the 2013-2014 school year, the first year of the state’s
new Aspire assessment tests, Muscle Shoals turned in disappointing results in comparison to the other
top systems with whom Muscle Shoals compares itself. But, in Aspire’s second year, the 2014-2015
school year, Muscle Shoals had the highest gains in reading scores of any system in the state. Those
gains in comparison to 2014 are depicted in Figure 21.
Figure 21. Muscle Shoals Aspire Reading, 2014 vs. 2015
34
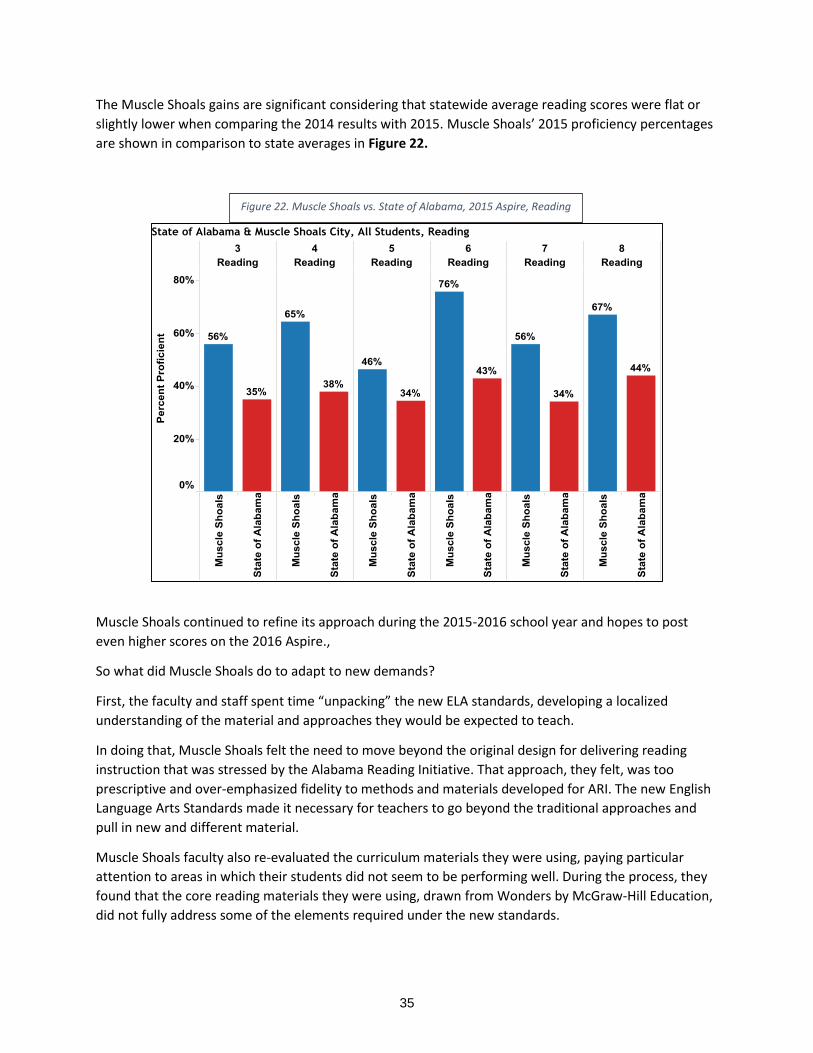
The Muscle Shoals gains are significant considering that statewide average reading scores were flat or
slightly lower when comparing the 2014 results with 2015. Muscle Shoals’ 2015 proficiency percentages
are shown in comparison to state averages in Figure 22.
Muscle Shoals continued to refine its approach during the 2015-2016 school year and hopes to post
even higher scores on the 2016 Aspire.,
So what did Muscle Shoals do to adapt to new demands?
First, the faculty and staff spent time “unpacking” the new ELA standards, developing a localized
understanding of the material and approaches they would be expected to teach.
In doing that, Muscle Shoals felt the need to move beyond the original design for delivering reading
instruction that was stressed by the Alabama Reading Initiative. That approach, they felt, was too
prescriptive and over-emphasized fidelity to methods and materials developed for ARI. The new English
Language Arts Standards made it necessary for teachers to go beyond the traditional approaches and
pull in new and different material.
Muscle Shoals faculty also re-evaluated the curriculum materials they were using, paying particular
attention to areas in which their students did not seem to be performing well. During the process, they
found that the core reading materials they were using, drawn from Wonders by McGraw-Hill Education,
did not fully address some of the elements required under the new standards.
Figure 22. Muscle Shoals vs. State of Alabama, 2015 Aspire, Reading
35
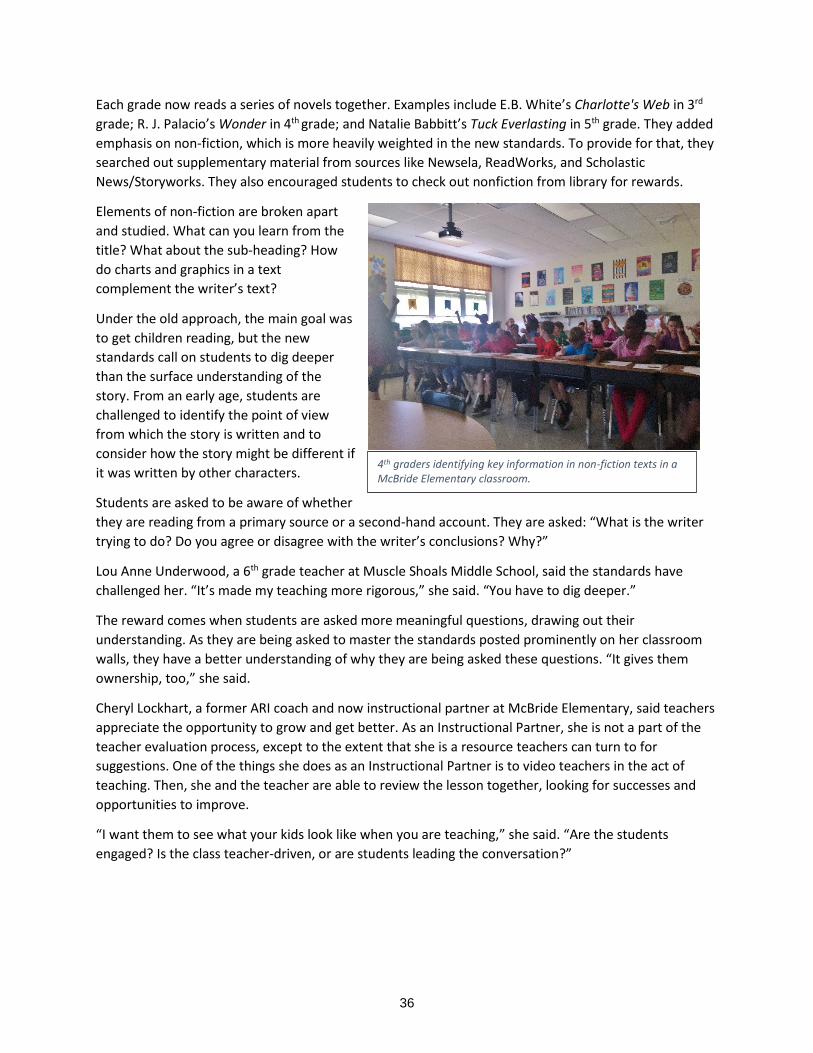
Each grade now reads a series of novels together. Examples include E.B. White’s Charlotte's Web in 3rd
grade; R. J. Palacio’s Wonder in 4th grade; and Natalie Babbitt’s Tuck Everlasting in 5th grade. They added
emphasis on non-fiction, which is more heavily weighted in the new standards. To provide for that, they
searched out supplementary material from sources like Newsela, ReadWorks, and Scholastic
News/Storyworks. They also encouraged students to check out nonfiction from library for rewards.
Elements of non-fiction are broken apart
and studied. What can you learn from the
title? What about the sub-heading? How
do charts and graphics in a text
complement the writer’s text?
Under the old approach, the main goal was
to get children reading, but the new
standards call on students to dig deeper
than the surface understanding of the
story. From an early age, students are
challenged to identify the point of view
from which the story is written and to
consider how the story might be different if
it was written by other characters.
Students are asked to be aware of whether
they are reading from a primary source or a second-hand account. They are asked: “What is the writer
trying to do? Do you agree or disagree with the writer’s conclusions? Why?”
Lou Anne Underwood, a 6th grade teacher at Muscle Shoals Middle School, said the standards have
challenged her. “It’s made my teaching more rigorous,” she said. “You have to dig deeper.”
The reward comes when students are asked more meaningful questions, drawing out their
understanding. As they are being asked to master the standards posted prominently on her classroom
walls, they have a better understanding of why they are being asked these questions. “It gives them
ownership, too,” she said.
Cheryl Lockhart, a former ARI coach and now instructional partner at McBride Elementary, said teachers
appreciate the opportunity to grow and get better. As an Instructional Partner, she is not a part of the
teacher evaluation process, except to the extent that she is a resource teachers can turn to for
suggestions. One of the things she does as an Instructional Partner is to video teachers in the act of
teaching. Then, she and the teacher are able to review the lesson together, looking for successes and
opportunities to improve.
“I want them to see what your kids look like when you are teaching,” she said. “Are the students
engaged? Is the class teacher-driven, or are students leading the conversation?”
4th graders identifying key information in non-fiction texts in a McBride Elementary classroom.
36
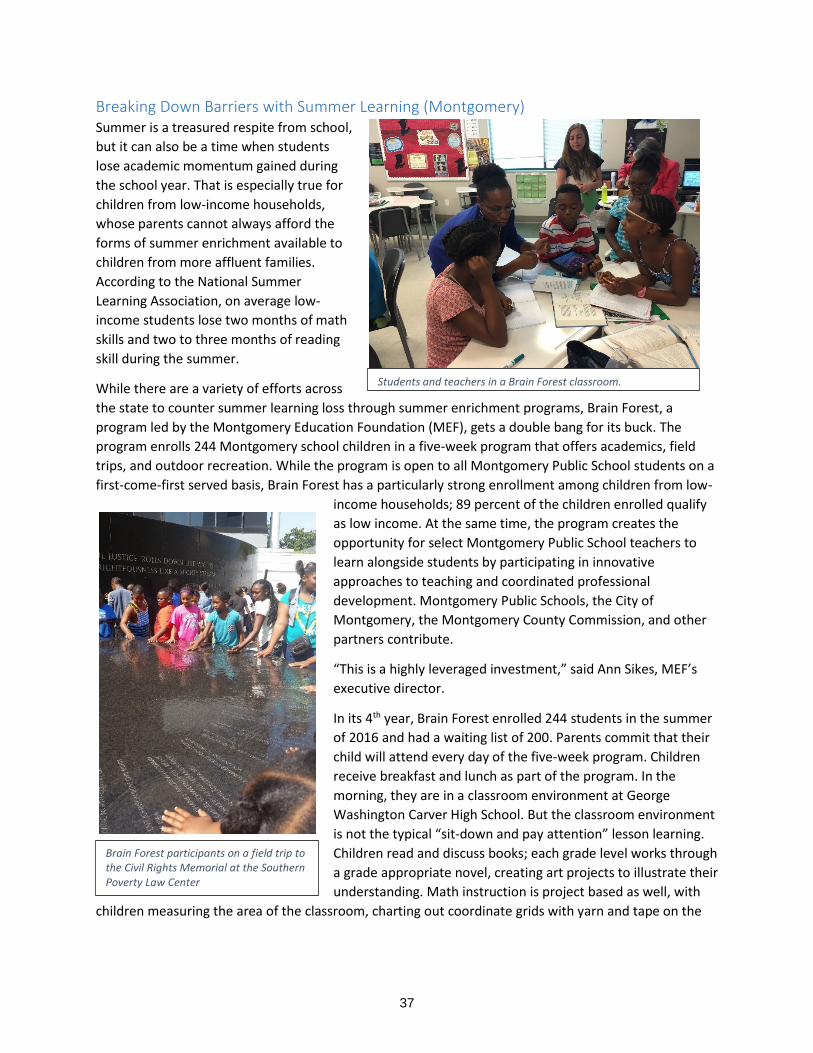
Breaking Down Barriers with Summer Learning (Montgomery) Summer is a treasured respite from school,
but it can also be a time when students
lose academic momentum gained during
the school year. That is especially true for
children from low-income households,
whose parents cannot always afford the
forms of summer enrichment available to
children from more affluent families.
According to the National Summer
Learning Association, on average low-
income students lose two months of math
skills and two to three months of reading
skill during the summer.
While there are a variety of efforts across
the state to counter summer learning loss through summer enrichment programs, Brain Forest, a
program led by the Montgomery Education Foundation (MEF), gets a double bang for its buck. The
program enrolls 244 Montgomery school children in a five-week program that offers academics, field
trips, and outdoor recreation. While the program is open to all Montgomery Public School students on a
first-come-first served basis, Brain Forest has a particularly strong enrollment among children from low-
income households; 89 percent of the children enrolled qualify
as low income. At the same time, the program creates the
opportunity for select Montgomery Public School teachers to
learn alongside students by participating in innovative
approaches to teaching and coordinated professional
development. Montgomery Public Schools, the City of
Montgomery, the Montgomery County Commission, and other
partners contribute.
“This is a highly leveraged investment,” said Ann Sikes, MEF’s
executive director.
In its 4th year, Brain Forest enrolled 244 students in the summer
of 2016 and had a waiting list of 200. Parents commit that their
child will attend every day of the five-week program. Children
receive breakfast and lunch as part of the program. In the
morning, they are in a classroom environment at George
Washington Carver High School. But the classroom environment
is not the typical “sit-down and pay attention” lesson learning.
Children read and discuss books; each grade level works through
a grade appropriate novel, creating art projects to illustrate their
understanding. Math instruction is project based as well, with
children measuring the area of the classroom, charting out coordinate grids with yarn and tape on the
Brain Forest participants on a field trip to the Civil Rights Memorial at the Southern Poverty Law Center
Students and teachers in a Brain Forest classroom.
37
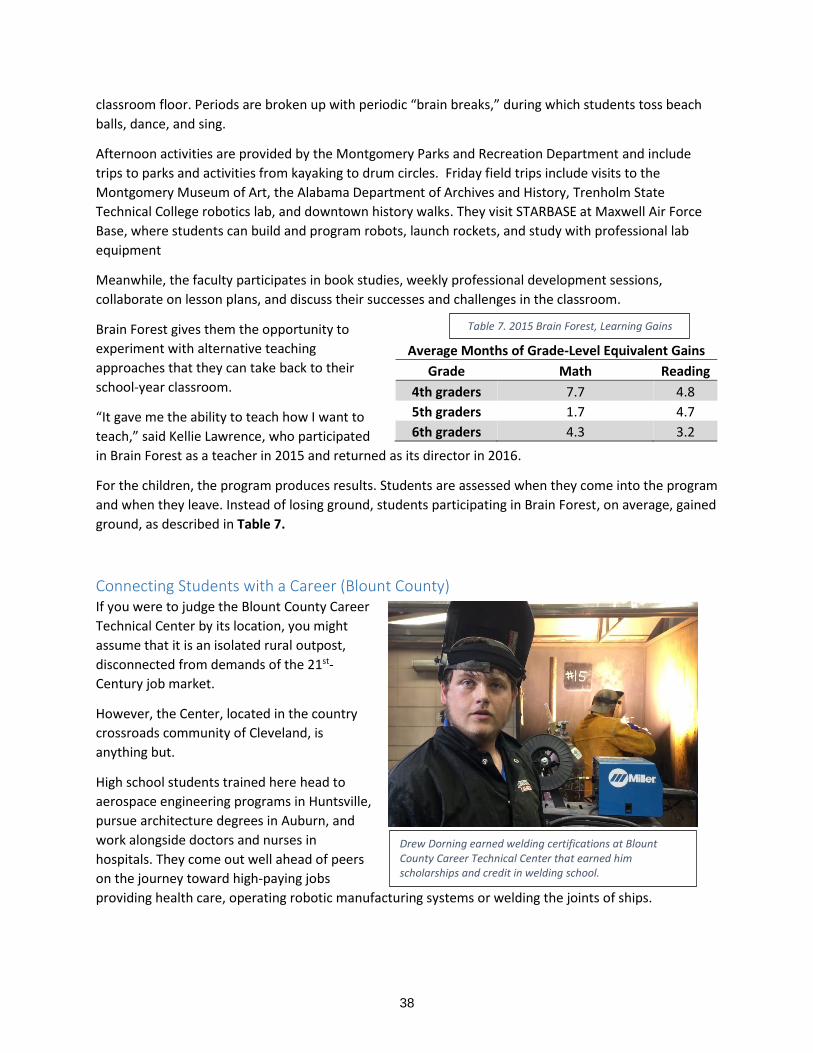
classroom floor. Periods are broken up with periodic “brain breaks,” during which students toss beach
balls, dance, and sing.
Afternoon activities are provided by the Montgomery Parks and Recreation Department and include
trips to parks and activities from kayaking to drum circles. Friday field trips include visits to the
Montgomery Museum of Art, the Alabama Department of Archives and History, Trenholm State
Technical College robotics lab, and downtown history walks. They visit STARBASE at Maxwell Air Force
Base, where students can build and program robots, launch rockets, and study with professional lab
equipment
Meanwhile, the faculty participates in book studies, weekly professional development sessions,
collaborate on lesson plans, and discuss their successes and challenges in the classroom.
Brain Forest gives them the opportunity to
experiment with alternative teaching
approaches that they can take back to their
school-year classroom.
“It gave me the ability to teach how I want to
teach,” said Kellie Lawrence, who participated
in Brain Forest as a teacher in 2015 and returned as its director in 2016.
For the children, the program produces results. Students are assessed when they come into the program
and when they leave. Instead of losing ground, students participating in Brain Forest, on average, gained
ground, as described in Table 7.
Connecting Students with a Career (Blount County) If you were to judge the Blount County Career
Technical Center by its location, you might
assume that it is an isolated rural outpost,
disconnected from demands of the 21st-
Century job market.
However, the Center, located in the country
crossroads community of Cleveland, is
anything but.
High school students trained here head to
aerospace engineering programs in Huntsville,
pursue architecture degrees in Auburn, and
work alongside doctors and nurses in
hospitals. They come out well ahead of peers
on the journey toward high-paying jobs
providing health care, operating robotic manufacturing systems or welding the joints of ships.
Average Months of Grade-Level Equivalent Gains
Grade Math Reading
4th graders 7.7 4.8
5th graders 1.7 4.7
6th graders 4.3 3.2
Table 7. 2015 Brain Forest, Learning Gains
Drew Dorning earned welding certifications at Blount County Career Technical Center that earned him scholarships and credit in welding school.
38
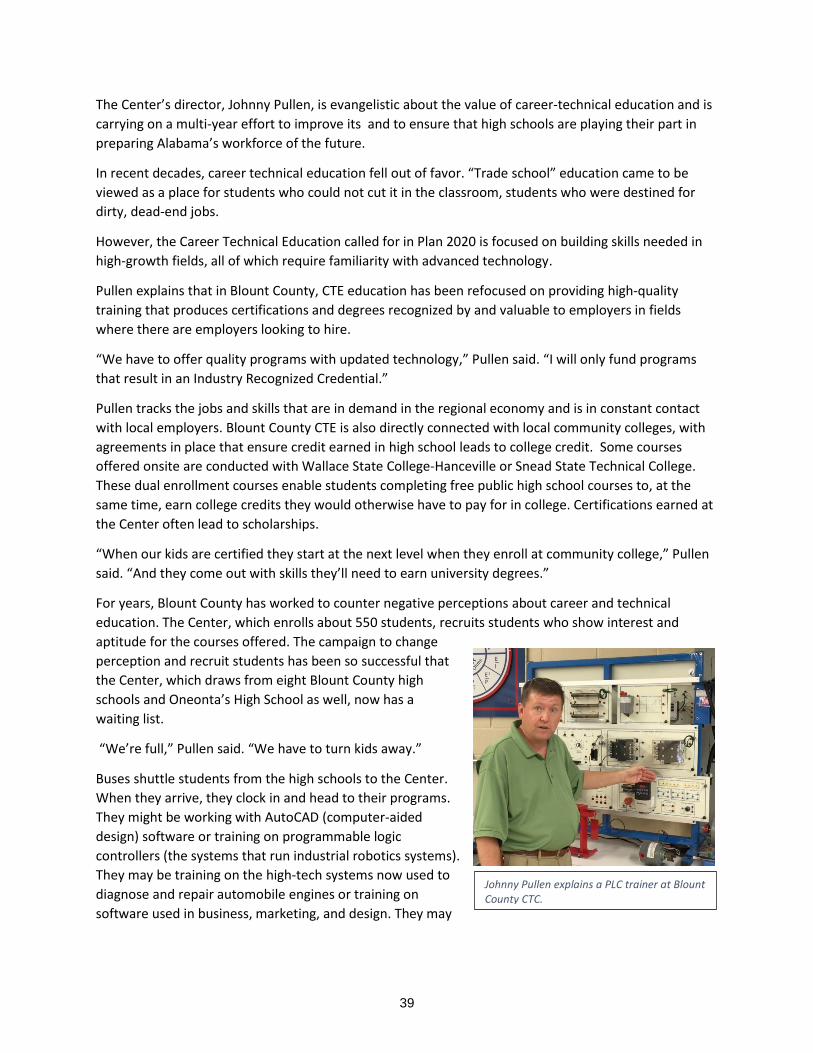
The Center’s director, Johnny Pullen, is evangelistic about the value of career-technical education and is
carrying on a multi-year effort to improve its and to ensure that high schools are playing their part in
preparing Alabama’s workforce of the future.
In recent decades, career technical education fell out of favor. “Trade school” education came to be
viewed as a place for students who could not cut it in the classroom, students who were destined for
dirty, dead-end jobs.
However, the Career Technical Education called for in Plan 2020 is focused on building skills needed in
high-growth fields, all of which require familiarity with advanced technology.
Pullen explains that in Blount County, CTE education has been refocused on providing high-quality
training that produces certifications and degrees recognized by and valuable to employers in fields
where there are employers looking to hire.
“We have to offer quality programs with updated technology,” Pullen said. “I will only fund programs
that result in an Industry Recognized Credential.”
Pullen tracks the jobs and skills that are in demand in the regional economy and is in constant contact
with local employers. Blount County CTE is also directly connected with local community colleges, with
agreements in place that ensure credit earned in high school leads to college credit. Some courses
offered onsite are conducted with Wallace State College-Hanceville or Snead State Technical College.
These dual enrollment courses enable students completing free public high school courses to, at the
same time, earn college credits they would otherwise have to pay for in college. Certifications earned at
the Center often lead to scholarships.
“When our kids are certified they start at the next level when they enroll at community college,” Pullen
said. “And they come out with skills they’ll need to earn university degrees.”
For years, Blount County has worked to counter negative perceptions about career and technical
education. The Center, which enrolls about 550 students, recruits students who show interest and
aptitude for the courses offered. The campaign to change
perception and recruit students has been so successful that
the Center, which draws from eight Blount County high
schools and Oneonta’s High School as well, now has a
waiting list.
“We’re full,” Pullen said. “We have to turn kids away.”
Buses shuttle students from the high schools to the Center.
When they arrive, they clock in and head to their programs.
They might be working with AutoCAD (computer-aided
design) software or training on programmable logic
controllers (the systems that run industrial robotics systems).
They may be training on the high-tech systems now used to
diagnose and repair automobile engines or training on
software used in business, marketing, and design. They may
Johnny Pullen explains a PLC trainer at Blount County CTC.
39
be taking courses that lead to certification as a Certified Nursing Assistant, a valuable credential that
puts students in the position to work in health care while pursuing more advanced degrees.
Career technical education offers advantages for students and industry as well. Pullen points to the
training offered on PLCs, software-driven brains of advanced manufacturing systems.
“This is one of one of the most requested areas of need in the state, this industrial system type of
program,” Pullen said. Graduates trained in Blount County are able to move more quickly through
community college and into jobs. Recent graduates reported back to Pullen that they have been offered
automotive manufacturing jobs, starting at $64,000 a year.
“It helps them finish up faster, so they are available to industry and the workforce,” Pullen said.
Conclusion The systems visited for this report do not provide a comprehensive catalog of approaches that work to
improve student achievement. However, the systems did widely share certain practices and beliefs. We
do not imply that the characteristics of these systems are unique to this sample set of schools.
A compilation of these approaches and attitudes shared by these systems may be of use to other
systems looking for ways that they might improve.
Alabama school systems have been challenged like never before by the aspirational goals of Plan 2020
and nationally competitive learning standards adopted in recent years. Courses of study have been
revised. Educators have been called upon to adopt new approaches to teaching.
Earlier this year, Sue Desmond-Hellman, the CEO of the Bill and Melinda Gates Foundation, conceded
that the Foundation, a prime backer of new national standards for education, had underestimated “the
level of resources and support required for our public education systems to be well-equipped to
implement the standards.”
Desmond-Hellman went on to say that school districts across the county have reported difficulty
identifying or developing Common Core-aligned materials. The sample set of successful systems
described in this report identified that as a challenge, as well. However, it was one they put hard work
into addressing by adapting or creating curriculum, developing lessons, and searching for supplemental
materials.
Such ambitious change cannot be expected to be achieved overnight. But successful districts have
enthusiastically embraced the challenge and are seeing the fruits of their labor.
What follows is a recap of commonly identified characteristics and approaches of our sample set of
successful school systems.
40
1. Successful systems start with the belief that all children can succeed.
2. In successful systems, students are guided toward mastering a rigorous set of nationally competitive learning standards, rather than having them march through textbook-based courses.
3. Successful systems have developed a localized, deep knowledge and understanding of the standards students are expected to master at each grade level, and how those standards build mastery as students progress through school.
4. Successful systems have sought out course materials and resources needed to help students on their journey and have not remained dependent on traditional, packaged curriculua.
5. In successful systems, standards are clearly communicated to students in the classroom in a concrete and understandable form. Students are encouraged to take ownership of their education, rather than having it presented to them through teachers’ lectures. An emphasis is placed on the real world application of concepts taught.
6. Successful systems are engaged in a continuous process of strategic planning and improvement, which gathers information from student assessment data and surveys. Data is analyzed and shared. Weaknesses are identified and addressed. Where students are struggling, students are not blamed. Instead, teaching is re-examined.
7. Successful systems put a primary focus on instructional leadership and improvement. System and school-based instructional teams and teachers collaborate on efforts to improve teaching.
8. In successful systems, instructional coaching is well-supported in successful systems. The personnel involved in coaching may be subject matter specialists, like the reading coach positions supported by the Alabama Reading Initiative, or they may be instructional partners. Whatever the approach, that personnel need to be well-trained, respected by teachers, and considered leaders of the school’s instructional improvement.
9. Successful systems make careful decisions on hiring and tenure. Novice teachers are supported with mentoring from veteran teachers. Evaluation is systematic, but care is taken to create an environment that emphasizes teacher growth rather than punitive accountability.
10. Successful systems create schedules that allow for professional development, planning, and grade level cooperation embedded in the school day. Professional development is targeted at areas of need and system priorities.
11. Successful systems recognize that well-planned, engaging instruction is the best antidote to distraction and discipline problems.
12. Successful systems are clear-eyed about their system’s demographics and recognize that socioeconomic and linguistic differences can present barriers to school success. They work to break down those barriers.
13. Successful systems are increasingly connecting K-12 education to career and college. Close working relationships with community colleges and universities are cultivated. Systems are in communication with local employers to match student education and training with local job demand. Students are encouraged to map out college and career plans early and are provided with avenues for pursuing their interests.
14. Successful systems communicate with parents and the community at large. Mutual understanding and shared goals lead to higher levels of support.
41
PARTNERS OF THE BUSINESS EDUCATION ALLIANCE
Will Brooke