Embed Size (px)
Citation preview

Final Report
TRC1602
Examining the Required Cement Content
Bryan Casillas Waleed Almutairi
Caleb Lebow W. Micah Hale
Department of Civil Engineering University of Arkansas in Fayetteville
June 2020

Final Report
TRC1602
Examining the Required Cement Content
Bryan Casillas Waleed Almutairi
Caleb Lebow W. Micah Hale
Department of Civil Engineering University of Arkansas in Fayetteville
June 2020


1. Report No.
TRC1602
2. Government Accession No. 3. Recipient’s Catalog No.
4. Title and Subtitle
Examining the Required Cement Content
5. Report Date:
June 2020
6. Performing Organization Code:
7. Author(s)
Bryan Casillas, Waleed Almutairi, Caleb Lebow, and
W. Micah Hale
8. Performing Organization Report No.
9. Performing Organization Name and Address
Department of Civil Engineering
University of Arkansas in Fayetteville
Fayetteville, AR, 72701
10. Work Unit No.
11. Contract or Grant No.
TRC1602
12. Sponsoring Agency Name and Address
Arkansas Department of Transportation, Transportation
Research Committee
10324 I-30, Little Rock, AR 72209
13. Type of Report and Period
Final Report
14. Sponsoring Agency
15. Supplementary Notes
Supported by a grant from the Arkansas Department of Transportation
16. Abstract
Portland cement is a significant component in a concrete mixture. For concrete used in portland
cement concrete pavement (PCCP), Class S, and Class S(AE) concrete, the Arkansas
Department of Transportation specifies a minimum cementitious material content of 564 lb/yd3
and 611 lb/yd3, respectively. Prior research conducted at the University of Arkansas, TRC
0603, indicated concrete mixtures used in five bridge decks throughout Arkansas achieved the
required 28-day strength at seven days, and the measured compressive strength at 28 days was
30% greater than required. The use of high strength concrete in may increase cracking and
consequently reduce the durability of the pavement, structure, or bridge deck. Therefore, a
reduction of the current cementitious content to a minimum level at which the concrete can
meet the requirements of workability, compressive strength, and durability is an essential
assignment. In addition, a reduction of the cementitious content can partially reduce
construction costs, because cement is the most expensive ingredient in concrete. Using less
cement within the concrete mixtures also lessens the negative impact on the environment due
to the production of cement accounting for a large portion of total greenhouse gases generated
by the production of concrete and its ingredients. This project will examine reducing the
required cement content for PCCP, Class S, and Class S(AE) concrete.
17. Key Words
Cement content, drying shrinkage,
compressive strength
18. Distribution Statement
None.
19. Security Classif. (of this report)
Unclassified
20. Security Classif. (of this
page) Unclassified
21. No. of Pages
83
22. Price: N/A
SI* (MODERN METRIC) CONVERSION FACTORS APPROXIMATE CONVERSIONS TO SI UNITS
Symbol When You Know Multiply By To Find Symbol
LENGTH in inches 25.4 millimeters mm
ft feet 0.305 meters m
yd yards 0.914 meters m
mi miles 1.61 kilometers km
AREA in
2 square inches 645.2 square millimeters mm
2
ft2
square feet 0.093 square meters m2
yd2
square yard 0.836 square meters m2
ac acres 0.405 hectares ha
mi2
square miles 2.59 square kilometers km2
fl oz
VOLUME fluid ounces 29.57 milliliters
gallons 3.785 liters
cubic feet 0.028 cubic meters
cubic yards 0.765 cubic
meters NOTE: volumes greater than 1000 L shall be
shown in m3
mL
gal L
ft3
m3
yd3
m
3
MASS oz ounces 28.35 grams g
lb pounds 0.454 kilograms kg
T short tons (2000 lb) 0.907 megagrams (or "metric ton") Mg (or "t")
oF
TEMPERATURE (exact degrees) Fahrenheit 5 (F-32)/9 Celsius
or (F-32)/1.8
oC
fc
fl
ILLUMINATION foot-candles 10.76 lux
foot-Lamberts 3.426 candela/m2
lx
cd/m2
lbf
lbf/in2
FORCE and PRESSURE or STRESS poundforce 4.45 newtons
poundforce per square inch 6.89 kilopascals
N
kPa
APPROXIMATE CONVERSIONS FROM SI UNITS
Symbol When You Know Multiply By To Find Symbol
LENGTH mm millimeters 0.039 inches in
m meters 3.28 feet ft
m meters 1.09 yards yd
km kilometers 0.621 miles mi
AREA mm
2 square millimeters 0.0016 square inches in
2
m2 square meters 10.764 square feet ft2
m2 square meters 1.195 square yards yd
2
ha hectares 2.47 acres ac
km2
square kilometers 0.386 square miles mi2
VOLUME mL milliliters 0.034 fluid ounces fl oz
L liters 0.264 gallons gal
m3 cubic meters 35.314 cubic feet ft3
m3 cubic meters 1.307 cubic yards yd3
MASS g grams 0.035 ounces oz
kg kilograms 2.202 pounds lb
Mg (or "t") megagrams (or "metric ton") 1.103 short tons (2000 lb) T
oC
TEMPERATURE (exact degrees) Celsius 1.8C+32 Fahrenheit
oF
lx
cd/m2
ILLUMINATION lux 0.0929 foot-candles
candela/m2
0.2919 foot-Lamberts
fc
fl
N
kPa
FORCE and PRESSURE or STRESS newtons 0.225 poundforce
kilopascals 0.145 poundforce per square inch
lbf
lbf/in2
*SI is the symbol for the International System of Units. Appropriate rounding should be made to comply with Section 4 of ASTM E380.
(Revised March 2003)

v
Table of Contents
1. Introduction ........................................................................................................................... 1
1.1. Research Motivation ........................................................................................... 1
1.2. Research Goals.................................................................................................... 2
2. Literature Review ................................................................................................................ 4
2.1. Water to Cementitious Material Ratio ................................................................ 4
2.2. Cement Content .................................................................................................. 6
2.3. Aggregate Content .............................................................................................. 7
2.4. Supplementary Cementitious Material Content .................................................. 9
2.5. Summary ........................................................................................................... 10
3. Materials and Methods ....................................................................................................... 11
3.1. Introduction ....................................................................................................... 11
3.2. Mixture Design ................................................................................................. 11
3.2.1. Overview ...................................................................................................... 11
3.2.2. Mixture Proportions ..................................................................................... 14
3.3. Materials ........................................................................................................... 17
3.4. Test Specimens ................................................................................................. 21
3.5. Test Methods ..................................................................................................... 23
4. Results and Discussion ........................................................................................................ 26
4.1. Introduction ....................................................................................................... 26
4.2. Results for the PCCP Mixturs ........................................................................... 26
4.2.1. Compressive Strength .................................................................................. 26
4.2.2. Unrestrained Drying Shrinkage ................................................................... 32

vi
4.2.3. Static Modulus of Elasticity ......................................................................... 36
4.3. Results for the Class S Mixtures ....................................................................... 37
4.3.1. Compressive Strength .................................................................................. 37
4.3.2. Unrestrained Drying Shrinkage ................................................................... 42
4.3.3. Static Modulus of Elasticity ......................................................................... 48
4.4. Results for the Class S(AE) Mixtures ............................................................... 49
4.4.1. Compressive Strength .................................................................................. 50
4.4.2. Unrestrained Drying Shrinkage ................................................................... 54
4.5. Additional Testing ............................................................................................ 59
5. Conclusions and Recommendations .................................................................................. 63
5.1. PCCP Mixtures ................................................................................................. 63
5.2. Class S Mixtures ............................................................................................... 64
5.3. Class S(AE) Mixtures ....................................................................................... 64
6. Works Cited ......................................................................................................................... 66

vii
List of Figures
Figure 2.1 – Influence of Water-Cement Ratio and Moist Curing Age on Concrete Strength
(Mehta & Monteiro, 2006) .............................................................................................................. 4
Figure 2.2 – Effect of w/c on Shrinkage (Wassermann, Katz, & Bentur, 2009) ............................ 5
Figure 2.3 – Influence of Aggregate Size and w/cm on Strength (Cordon & Gillespie, 1963) ...... 7
Figure 2.4 – Influence of Aggregate Content on Shrinkage (Mehta & Monteiro, 2006) ............... 8
Figure 2.5 – Effects of Fly Ash on Concrete Strength (Bamforth, 1980) ....................................... 9
Figure 3.1 – Coarse Aggregate Gradation ................................................................................... 20
Figure 3.2 - Fine Aggregate Gradation ......................................................................................... 20
Figure 3.3 – Aggregate Storage Bins ............................................................................................ 21
Figure 3.4 – Sump, Unit Weight, and Air Content Measurements ............................................... 22
Figure 3.5 – Compressive Cylinder and Unrestrained Drying Shrinkage Prism Storage ............. 24
Figure 3.6 – Laboratory Equipment .............................................................................................. 25
Figure 4.1 – Compressive Strengths of 564 lb/yd3 Cementitious Material PCCP Mixtures ....... 27
Figure 4.2 – Compressive Strengths of 517 lb/yd3 Cementitious Material PCCP Mixtures ....... 29
Figure 4.3 – Compressive Strengths of 470 lb/yd3 Cementitious Material PCCP Mixtures ....... 31
Figure 4.4 – Drying Shrinkage of 564 lb/yd3 Cementitious Material PCCP Mixtures................. 33
Figure 4.5 – Drying Shrinkage of 517 lb/yd3 Cementitious Material PCCP Mixtures ................ 34
Figure 4.6 – Drying Shrinkage of 470 lb/yd3 Cementitious Material PCCP Mixtures ................ 35
Figure 4.7 – ACI 318 Predicted vs. Measured Modulus of Elasticity for PCCP Mixtures .......... 37
Figure 4.8 – Compressive Strength of Class S Mixtures Containing Only Cement ..................... 38
Figure 4.9 – Compressive Strength of Class S Mixtures Containing 611 lb/yd3 .......................... 40

viii
Figure 4.10 – Compressive Strength of Class S Mixtures Containing 564 lb/yd3 ....................... 40
Figure 4.11 – Compressive Strength of Class S Mixtures Containing 517 lb/yd3 ....................... 41
Figure 4.12 – Drying Shrinkage of Class S Mixtures Containing 611 lb/yd3 and 0% FA ........... 43
Figure 4.13 – Drying Shrinkage of Class S Mixtures Containing 564 lb/yd3 and 0% FA ........... 43
Figure 4.14 – Drying Shrinkage of Class S Mixtures Containing 517 lb/yd3 and 0% FA ........... 44
Figure 4.15 – Drying Shrinkage of Class S Mixtures Containing 611 lb/yd3 and 20% FA ......... 45
Figure 4.16 – Drying Shrinkage of Class S Mixtures Containing 564 lb/yd3 and 20% FA ......... 45
Figure 4.17 – Drying Shrinkage of Class S Mixtures Containing 517 lb/yd3 and 20% FA ......... 46
Figure 4.18 – Drying Shrinkage of Class S Mixtures Containing 611 lb/yd3 and 30% FA ......... 46
Figure 4.19 – Drying Shrinkage of Class S Mixtures Containing 564 lb/yd3 and 30% FA ......... 47
Figure 4.20 – Drying Shrinkage of Class S Mixtures Containing 517 lb/yd3 and 30% FA ......... 47
Figure 4.21 – Predicted vs. Measured Modulus of Elasticity for Class S Mixtures ..................... 49
Figure 4.22 – Compressive Strength of Class S(AE) Mixtures Containing Cement Only ........... 50
Figure 4.23 – Compressive Strength of Class S(AE) Mixtures with 611 lb/yd3 .......................... 51
Figure 4.24 – Compressive Strength of Class S(AE) Mixtures with 564 lb/yd3 .......................... 52
Figure 4.25 – Compressive Strength of Class S(AE) Mixtures with 517 lb/yd3 .......................... 53
Figure 4.26 – Drying Shrinkage of Class S(AE) Mixtures Containing 611 lb/yd3 and 0% FA ... 54
Figure 4.27 – Drying Shrinkage of Class S(AE) Mixtures Containing 564 lb/yd3 and 0% FA ... 55
Figure 4.28 – Drying Shrinkage of Class S(AE) Mixtures Containing 517 lb/yd3 and 0% FA ... 55
Figure 4.29 – Drying Shrinkage of Class S(AE) Mixtures Containing 611 lb/yd3 and 20% FA . 56
Figure 4.30 – Drying Shrinkage of Class S(AE) Mixtures Containing 564 lb/yd3 and 20% FA . 57
Figure 4.31 – Drying Shrinkage of Class S(AE) Mixtures Containing 517 lb/yd3 and 20% FA . 57
Figure 4.32 – Drying Shrinkage of Class S(AE) Mixtures Containing 611 lb/yd3 and 30% FA . 58

ix
Figure 4.33 – Drying Shrinkage of Class S Mixtures Containing 564 lb/yd3 and 30% FA ......... 58
Figure 4.34 – Drying Shrinkage of Class S Mixtures Containing 517 lb/yd3 and 30% FA ......... 59
Figure 4.35 – Measured Modulus of Elasticity vs. Predicted Values ........................................... 61
Figure 4.36 – Measured RCIP Values .......................................................................................... 62

x
List of Tables
Table 1.1 – Class S, Class S (AE), and PCCP Concrete Mixture Requirements............................ 2
Table 3.1 – Class S, Class S(AE), and PCCP Concrete Mixture Requirements .......................... 12
Table 3.2 – Representative PCCP Mixture Designs ..................................................................... 12
Table 3.3 - Representative Class S Mixture Designs .................................................................... 13
Table 3.4 - Representative Class S(AE) Mixture Designs ............................................................ 14
Table 3.5 – PCCP Batching Matrix .............................................................................................. 15
Table 3.6 - Class S Batching Matrix ............................................................................................. 16
Table 3.7 - Class S(AE) Batching Matrix ..................................................................................... 17
Table 3.8 - Cement Properties ...................................................................................................... 18
Table 3.9 - Fly Ash Properties ...................................................................................................... 19

xi
ACKNOWLEDGMENTS
We would like to thanks the Arkansas Department of Transportation and the Transportation
Research Committee for sponsoring this research project. The authors would like to thank Mr.
Chris McKenney at ARDOT for his assistance throughout the project.
1
1. Introduction
1.1. Research Motivation
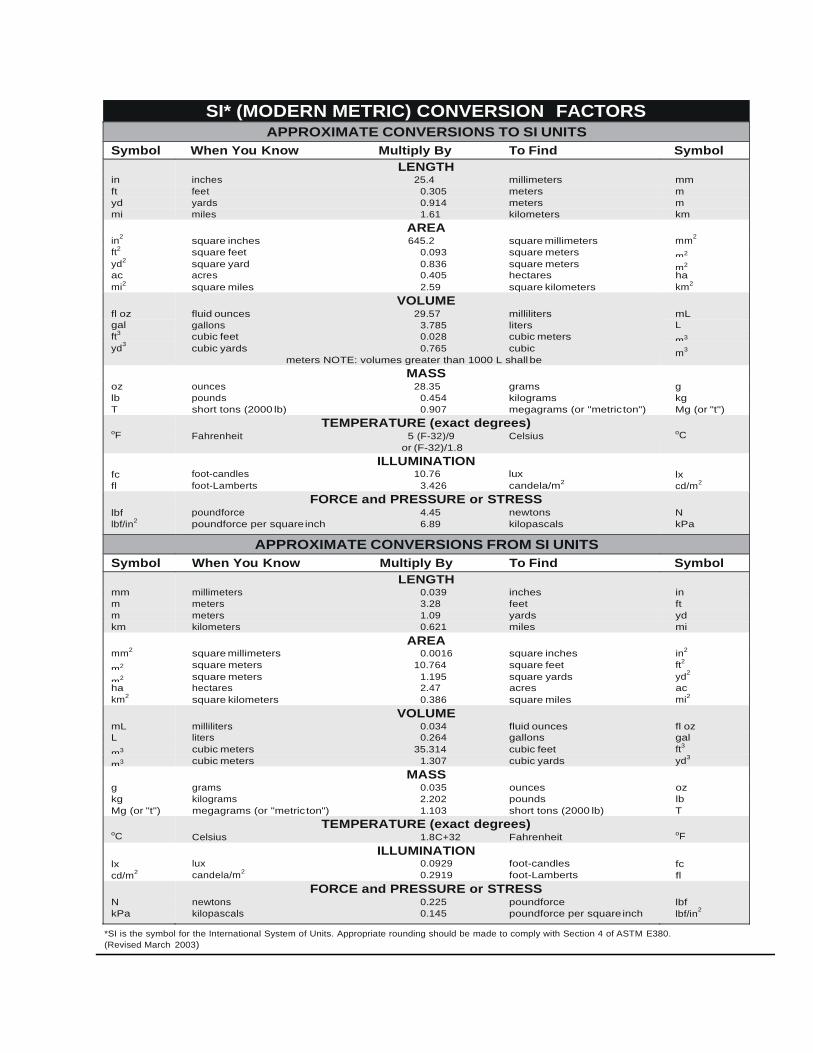
Deterioration of the infrastructure in the United States of America is a problem which is
in critical need of address. According to the American Society of Civil Engineers’ Infrastructure
Report Card, the United States scores a D in the roads category due to many roadways being in
poor condition and responsible agencies being chronically underfunded (ASCE, 2017). The
Arkansas Section of ASCE graded the state’s roads as a D+ in their 2014 report. According to
the report, Arkansas has the 12th largest state highway system in the nation with over 16,000
miles of highway, but lack of funding has placed projects on hold, and the long-term funding
solutions are not immediate clear (ASCE, 2014). These burdens have placed a strain on the
Arkansas Department of Transportation (ARDOT), which is tasked with maintaining and adding
to the growing network of state highways in Arkansas. There is a need to find practical ways to
effectively use materials and funds.
A portion of the over 16,000 miles of highway in Arkansas is portland cement concrete
pavement (PCCP). Between 2006 and 2016, ARDOT spent $566 million for over 4.2 million
cubic yards of PCCP. A large component of this cost is cement. Cement is the most expensive
material found in typical PCCP mixtures. From information provided by ARDOT, the cost of
cement is $95.42/ton. Not only is cement the most expensive material found in typical PCCP
mixtures, but it is also the most pollutant. Among industrial emissions, cement production is the
third largest source of greenhouse gases contributing 39.9 MMT CO2 equivalent, which accounts
for 10.6% of industrial emissions (EPA 2017). Additionally, it is estimated cement production
accounts for 5% of total global anthropogenic carbon emissions (Humphreys and Mahasenan
2002, Worrell, et al. 2001). By reducing the cement content in PCCP mixtures, both economic
and environmental benefits would be realized.

2
In addition to examining PCCP mixtures, the research program will also investigate the
minimum cement content in Class S and Class S(AE) concrete. Class S mixtures are used for the
structural elements of bridges, such as retaining walls, box culverts, footings, piers, and
abutments cast in Arkansas. Class S(AE) is Class S, structural concrete, that is air entrained
(AE). Class S(AE) is used in bridge decks and in other structural concrete that requires air
entrainment. Table 1.1 shows the required fresh and hardened concrete properties for Class S,
Class S(AE), and PCCP concrete.
Table 1.1. Class S, Class S (AE), and PCCP Concrete Mixture Requirements
Properties Class S Class S(AE) PCCP
Minimum 28-day compressive strength (psi) 3500 4000 4000
Minimum cementitious content (lb/yd3) 611 611 564
Maximum fly ash content (Class C or F) (%) 20 20 20
Maximum slag cement content (%) 25 25 25
Maximum w/cm 0.49 0.44 0.45
Slump range (in.) 1 – 4 1 – 4 ≤ 2
Air content (%) - 6 ± 2 6 ± 2
1.2. Research Goals
The goal of this research is to investigate the effects of reducing the current ARDOT
minimum cementitious content on the compressive strength, unrestrained drying shrinkage, and
modulus of elasticity for the three type of mixtures, Class S, Class S(AE), and PCCP. Unique
mixture designs incorporating up to four cementitious material contents, three fly ash
replacement percentages, and four water to cementitious material ratios (w/cm) will be tested for
compressive strength and unrestrained drying shrinkage. Sample mixtures from the initial tests
will be chosen and subjected to a static modulus of elasticity test, and the effect of coarse

3
aggregate source will be examined on selective mixtures. The goal of this research program is to
determine if the minimum specified cement content for PCCP, Class S, and Class S(AE) can be
reduced and determine what this reduction in cement content may have on concrete performance.

4
2. Literature Review
This literature review will take an in depth look at past research that has examined the
relationship between mixture characteristics and the fresh and hardened properties of concrete.
These characteristics include w/cm, cement content, aggregate content, supplementary
cementitious material content, and fly ash content and will be discussed in detail.
2.1. Water to Cementitious Material Ratio
Research in the early 1900s by Abrams produced a relationship between water-
cementitious material ratio (w/cm) and concrete strength (Mehta and Monteiro 2006). This
relationship is illustrated in Figure 2.1. As w/cm increases, compressive strengths decrease at all
ages for moist cured concrete due to an increase in capillary porosity (Wassermann, Katz and
Bentur 2009, Dhir, et al. 2004, Mehta and Monteiro 2006, Taylor, et al. 2012).
Figure 2.1 – Influence of Water-Cement Ratio and Moist Curing Age on Concrete Strength
(Mehta and Monteiro 2006)

5
Studies have shown strength is directly correlated to w/cm and independent of cement
content at a given w/cm (Wassermann, Katz and Bentur 2009). How the w/cm is changed is also
of importance. Popovics concluded changing the cement content while keeping the water
content constant caused greater changes in strength, while changing the water content and
maintaining the cement content resulted in lower strength changes (Popovics 1990, Obla, Hong
and Lobo 2017).
Figure 2.2 – Effect of w/c on Shrinkage (Wassermann, Katz and Bentur 2009)
While w/cm has a measureable effect on the compressive strength of concrete, a
correlation between w/cm and drying shrinkage is not as pronounced. Research conducted by
Wassermann (2009) and shown in Figure 2.2, indicates increasing the w/cm from 0.45 to 0.70
results in only an increase in shrinkage of the test specimens of 100 microstrains. For the
mixtures tested, water content was held at approximately 200 kg/m3. Additionally, this decrease
in shrinkage is potentially attributed to the use of a chemical admixture in the mixture with a
w/cm of 0.45 which was not used in the remaining three mixtures.

6
2.2. Cement Content
As mentioned previously, changes in cement content for a given w/cm have little to no
effect on concrete strength. Cement content has a greater effect on total absorption and capillary
absorption coefficient, due to increasing the paste content, which does increase strength, but the
increase is not in large magnitude (Wassermann, Katz and Bentur 2009). Research has also
suggested once the required cement content is reached, additional cement can decrease 28-day
compressive strength by up to 15% (Yurdakul 2010).
A consensus is difficult to be reached concerning how and to what degree cement content
effects drying shrinkage. Research conducted by Wassermann (2009) suggests the impact of
cement content on drying shrinkage is minor, and changes in drying shrinkage due to increasing
or decreasing cement content have no clear pattern. However, other researchers suggest a
decrease in cement content provides less opportunity for concrete shrinkage due to an increase of
aggregate to compensate for the lowered w/cm (Kosmatka, Kerkhoff and Panarese 2003, Mehta
and Monteiro 2006, Mindess, Young and Darwin 2003). Research focused on cracking in decks
observed a nearly 500% increase in crack density from 0.05 ft/ft2 to 0.23 ft/ft2 when the cement
content was increased from 605 lb/yd3 to 639 lb/yd3 in field studies involving bridge decks
(Schmitt and Darwin 1999). It is important to note, due to this data being conducted in the field,
the opportunity for outside factors to contribute to the increase in crack density is higher.
Similar to the effect of overall cement content on drying shrinkage, the effects of cement
fineness is also a topic not fully understood. According to ACI 224.R-01 (ACI Committee 224
2001), the properties of cement, including fineness, directly affect concrete shrinkage. However,
several other researchers have concluded the effect of fineness and other cement properties cause
little to no change in the overall performance of the concrete mixture (Li, Qi and Ma 1999,
Neville 1995, Mehta and Monteiro 2006).

7
2.3. Aggregate Content
In normal strength concrete, aggregates rarely fracture and cause the failure of the
specimen. Instead, factors affected by aggregate properties are typically the cause of failure.
Aggregate size, shape, gradation, surface texture, and mineralogy can all affect strength. Large
aggregates tend to form weak bonds with the cement matrix in the interfacial transition zone,
leading to increased microcracks. However, smaller aggregates increase water demand due high
surface area to volume ratios (Mehta and Monteiro 2006, Cordon and Gillespie 1963, Ley and
Cook, Aggregate Gradations for Concrete Pavement Mixtures 2014).
Figure 2.3 shows the increasing strength benefit of using smaller maximum aggregate
size as w/cm decreases. Use of microfines (material passing the #200 sieve) in concrete mixtures
has shown increased strength when compared to baseline mixtures (Rached, Fowler and Koehler
2010). Additionally, the use of rough aggregates has shown improved early-age strength, but the
benefits decrease at later ages due to chemical interactions between the aggregate and hydrated
cement particles increasing in influence (Mehta and Monteiro 2006, Rached, Fowler and Koehler
2010).
Figure 2.3 – Influence of Aggregate Size and w/cm on Strength (Cordon and Gillespie 1963)

8
Mehta (2006) suggests the most important factor affecting drying shrinkage in concrete is
the aggregate content of the mixture. Shown in Figure 2.4, concrete mixtures with varying w/cm
followed a similar, decreasing trend in shrinkage as percent content of aggregate was increased.
Pure cement paste is susceptible to large changes in volume due to moisture loss and lack of
mechanical restraint. Aggregates in concrete serve as a physical restraint for the cement paste.
Therefore, increasing the amount of aggregate within a mixture will decrease drying shrinkage.
Additionally, increasing the modulus of elasticity of the coarse aggregate will result in greater
shrinkage resistance due to the coarse aggregate experiencing lower strain values for the same
amount of stress exerted by the contracting cement paste (Kosmatka, Kerkhoff and Panarese
2003, Mehta and Monteiro 2006, Mindess, Young and Darwin 2003). While increasing coarse
aggregate content generally has positive effects on shrinkage, an increase in the percentage of
microfines of greater than four percent within a gradation can increase drying shrinkage due to
an increase in water demand of the mixture. With additional water required to maintain fresh
concrete properties, excess water is introduced into the mixture which is eventually expelled
during curing causing drying shrinkage (Hanna 2003).
Figure 2.4 – Influence of Aggregate Content on Shrinkage (Mehta and Monteiro 2006)

9
2.4. Supplementary Cementitious Material Content
Use of pozzolanic mineral admixtures also known as supplementary cementitious
materials, such as fly ash, can improve ultimate strength of concrete by causing chemical
reactions which lead to additional calcium silica hydrate formation (Mehta and Monteiro 2006).
While the ultimate strength of a concrete mixture may be improved by the usage of
supplementary cementitious materials, early age strength is typically reduced. Low early age
strength is attributed to lower heat of hydration of the pozzolanic reactions. The rate of
pozzolanic hydration is slower than the rate of cement hydration which means concrete
incorporating fly ash must be properly cured for an appropriate length of time for the strength
benefits of fly ash to be realized (Thomas 2007).
Figure 2.5 shows the affects incorporating fly ash into concrete mixtures has on early and
late age strengths. For the mixtures shown in Figure 2.5, fly ash replacement was 30%. When
standard curing methods are used, concrete with fly ash experiences a delay in strength gain
initially, as shown in the graph on the left of Figure 2.5. At approximately 56 days of age, the
mixture incorporating fly ash surpassed the mixture containing only portland cement.
Figure 2.5 – Effects of Fly Ash on Concrete Strength (Bamforth 1980)

10
2.5. Summary
Cement content effects both fresh and hardened properties. Past research has shown, in
most cases, cement content can be decreased while maintaining strength requirements and
helping to decrease drying shrinkage, permeability, and cracking. Additionally, the replacement
of cement by SCMs can be helpful in reducing cracking and permeability while maintaining
workability. The addition of fly ash, along with high range water reducer and air entertainer, can
reduce the required cement content while still meeting design standards.

11
3. Materials and Methods
3.1. Introduction
This research program consisted of five primary tasks: design of concrete mixtures based
on data provided by ARDOT, batching of concrete mixtures, casting of concrete test specimens,
testing of concrete specimens at predetermined intervals, and analysis of collected data. All
casting and testing of samples occurred at the University of Arkansas Engineering Research
Center (ERC) in Fayetteville, Arkansas. Materials used in this research program were locally
available. The goal of the research program was to determine if the minimum cement content for
Class S, Class S(AE), and/or PCCP mixtures can be reduced while achieving the specified fresh
and hardened concrete properties.
3.2. Mixture Design
3.2.1. Overview
As stated previously, the goal of this research program was to determine if the minimum
cementitious content for PCCP, Class S, and Class S(AE) concrete as defined in ARDOT
specifications can be reduced but still achieve the required fresh and hardened properties.
Current ARDOT specifications for the three types of concrete are shown below in Table 3.1. The
specifications prescribe the minimum cementitious material content, maximum fly ash
replacement percentage, minimum 28-day compressive strength, slump range, air content range,
and maximum w/cm. A summary of these specifications is provided in Table 3.1. These
specifications served as a base point for the design of concrete mixtures tested. Additionally,
ARDOT provided representative PCCP, Class S, and Class S(AE) mixtures from various
concrete producers in Arkansas. A summary of these eight PCCP mixtures is provided in Table
3. with the names of the companies redacted. As shown in Table 3., all PCCP mixture providers

12
designed mixtures using the minimum cementitious material amount, 546 lb/yd3. Of the eight
representative mixtures, two provided mixtures with 0% fly ash replacement, four provided
mixtures with 15% fly ash replacement, and two provided mixtures with 20% fly ash
replacement – the maximum allowed by ARDOT specifications. Coarse aggregate content
varied from 1747 to 1899 lb/yd3, and all providers used #57 gradation for the coarse aggregate.
Finally, the w/cm varied from 0.38 to 0.45 for the provided representative mixtures.
Table 3.1 – Class S, Class S (AE), and PCCP Concrete Mixture Requirements
Properties Class S Class S(AE) PCCP
Minimum 28-day compressive strength (psi) 3500 4000 4000
Minimum cementitious content (lb/yd3) 611 611 564
Maximum fly ash content (class C or F) (%) 20 20 20
Maximum slag cement content (%) 25 25 25
Maximum w/cm 0.49 0.44 0.45
Slump range (in.) 1 – 4 1 – 4 ≤ 2
Air content (%) - 6 ± 2 6 ± 2
Table 3.2 – Representative PCCP Mixture Designs
Material Concrete Mixture Designs from Various Companies
A B C D E F G H
Cement (lb/yd3) 451 479 479 564 479 564 479 451
Fly Ash (lb/yd3) 113 85 85 0 85 0 85 113
Coarse Aggregate
(lb/yd3) 1851 1747 1747 1756 1893 1770 1774 1899
w/cm 0.40 0.38 0.38 0.38 0.44 0.44 0.38 0.45
ARDOT also provided the data shown below in Table 3.3. This table shows the typical
mixtures proportions for the Class S used in Arkansas with the names of the concrete producers
redacted. The table shows that there are many commonalities among the mixtures. For the Class
S mixtures, all producers used the minimum amount of cementitious material (564 lb/yd3). Six
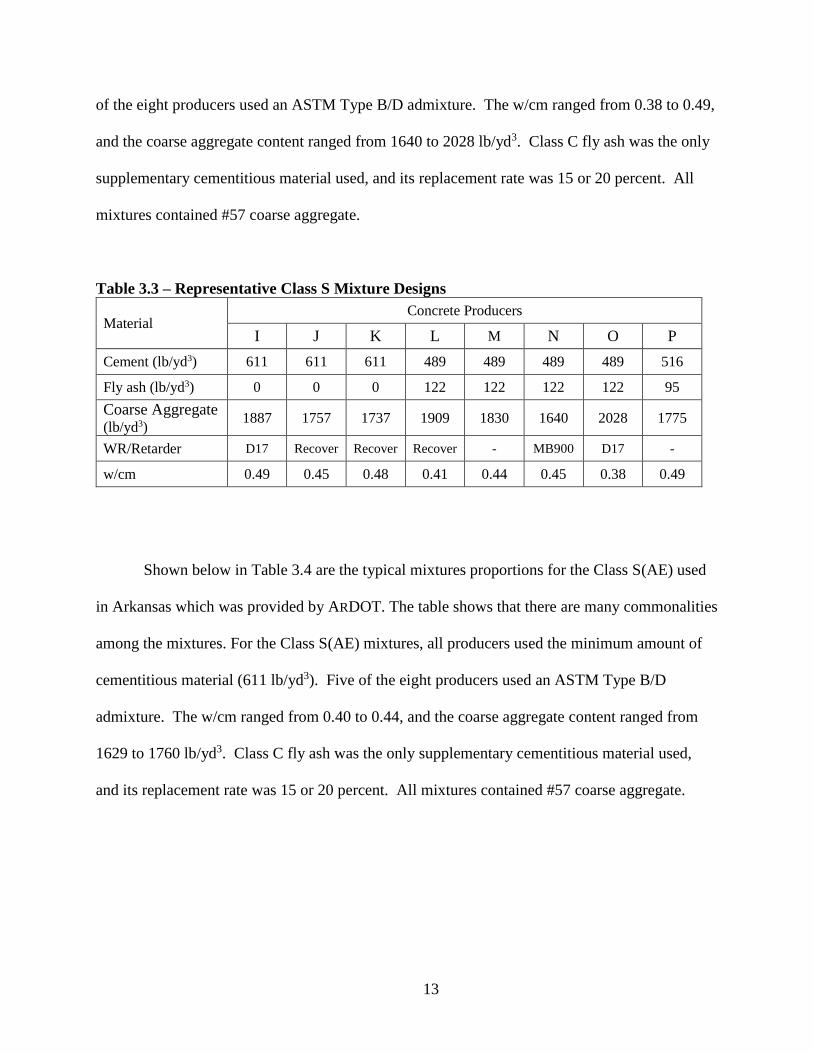
13
of the eight producers used an ASTM Type B/D admixture. The w/cm ranged from 0.38 to 0.49,
and the coarse aggregate content ranged from 1640 to 2028 lb/yd3. Class C fly ash was the only
supplementary cementitious material used, and its replacement rate was 15 or 20 percent. All
mixtures contained #57 coarse aggregate.
Table 3.3 – Representative Class S Mixture Designs
Material Concrete Producers
I J K L M N O P
Cement (lb/yd3) 611 611 611 489 489 489 489 516
Fly ash (lb/yd3) 0 0 0 122 122 122 122 95
Coarse Aggregate
(lb/yd3) 1887 1757 1737 1909 1830 1640 2028 1775
WR/Retarder D17 Recover Recover Recover - MB900 D17 -
w/cm 0.49 0.45 0.48 0.41 0.44 0.45 0.38 0.49
Shown below in Table 3.4 are the typical mixtures proportions for the Class S(AE) used
in Arkansas which was provided by ARDOT. The table shows that there are many commonalities
among the mixtures. For the Class S(AE) mixtures, all producers used the minimum amount of
cementitious material (611 lb/yd3). Five of the eight producers used an ASTM Type B/D
admixture. The w/cm ranged from 0.40 to 0.44, and the coarse aggregate content ranged from
1629 to 1760 lb/yd3. Class C fly ash was the only supplementary cementitious material used,
and its replacement rate was 15 or 20 percent. All mixtures contained #57 coarse aggregate.

14
Table 3.4 – Representative Class S(AE) Mixture Designs
Material
Concrete Producers
Q R S T U V W X
Cement (lb/yd3) 611 520 489 519 489 519 516 489
Fly Ash (lb/yd3) 0 91 122 91 122 91 95 122
Coarse Aggregate (lb/yd3)
1760 1740 1745 1687 1731 1629 1720 1720
WR/Retarder D17 D17 Yes Recover - - D17
w/cm 0.44 0.40 0.42 0.44 0.44 0.44 0.44 0.42
3.2.2. Mixture Proportions
Utilizing the representative PCCP mixture designs in Table 3. as a reference, a batching
matrix was developed with the goal of reducing cement content and cementitious material
content. The batching matrix consisting of 36 unique concrete mixtures is shown in Table 3..
Cementitious material contents were decided to be 470, 517, and 564 lb/yd3. These values
incorporate current ARDOT specifications and provided representative mixture designs for the
maximum cementitious material content tested. Cementitious material contents of 517 and 470
lb/yd3 represent removing a half and a whole standard bag of cement per cubic yard,
respectively. Fly ash replacement percentages were chosen to be 0, 20, and 30 percent of
cementitious material content to best represent current specification allowances and observe
effects of increasing the current maximum fly ash replacement percentage of 20. The lowest
three w/cms, 0.38, 0.42, and 0.45, best represent current PCCP mixture designs from providers.
A w/cm of 0.50 was added to observe the performance effects of excess water incorporated into
mixtures on job sites. For all mixtures, a coarse aggregate of #57 gradation and content of 1750
lb/yd3 were chosen, because this combination best represents the gradation and various coarse
aggregate contents in Table 3.. This was the only consistent batch weight property for all
mixtures.

15
Table 3.5 – PCCP Batching Matrix
Cementitious Material Content (lb/yd3) w/cm
0.38 0.42 0.45 0.50
564 (0% Class C Fly Ash) X X X X
564 (20% Class C Fly Ash) X X X X
564 (30% Class C Fly Ash) X X X X
517 (0% Class C Fly Ash) X X X X
517 (20% Class C Fly Ash) X X X X
517 (30% Class C Fly Ash) X X X X
470 (0% Class C Fly Ash) X X X X
470 (20% Class C Fly Ash) X X X X
470 (30% Class C Fly Ash) X X X X
Using the representative Class S mixture designs in Table 3. as a reference, a batching
matrix was developed with the goal of reducing cement content and cementitious material
content. The batching matrix consisting of 36 unique concrete mixtures is shown in Table 3..
The cementitious material content ranged from 517 to 611 lb/yd3. This included the current
ARDOT minimum of 611 lb/yd3 but then included 517 and 564 lb/yd3. This represents a “1/2
bag” and full bag of cement less than the ARDOT minimum. The w/cm range was 0.38, 0.45,
0.49, and 0.55. This also represents the range of w/cm used in the 9 districts along with the
w/cm of 0.55 which represents a mixture in which water was added in the field. For each
cementitious material content and w/cm, Class C fly ash replaced 0, 20, or 30 % of the cement.
The coarse aggregate content used in all mixtures was 1800 lb/yd3 which was chosen based on
consultation with ARDOT.

16
Table 3.6 – Class S Batching Matrix
Cementitious Material content (lb/yd3) w/cm
0.38 0.45 0.49 0.55
611 0% Class C Fly Ash) X X X X
611 (20% Class C Fly Ash) X X X X
611 (30% Class C Fly Ash) X X X X
564 (0% Class C Fly Ash) X X X X
564 (20% Class C fly ash) X X X X
564 (30% Class C fly ash) X X X X
517 (0% Class C Fly Ash) X X X X
517 (20% Class C fly ash) X X X X
517 (30% Class C fly ash) X X X X
Utilizing the representative Class S(AE) mixture designs in Table 3. as a reference, a
batching matrix was developed with the goal of reducing cement content and cementitious
material content. The batching matrix consisting of 36 unique concrete mixtures is shown in
Table 3.. For cementitious material, the ARDOT minimum is 611 lb/yd3. To check the reduction
not only of cement but also of total cementitious material, this was tested at the current minimum
standard of 611 lb/yd3, as well as lower values of 564 and 517 lb/yd3, to further evaluate the
potential waste of materials in pursuit of unneeded strength. Regarding w/cm ratio, the current
max w/cm that ARDOT allows for class S(AE) is 0.44. Thus, testing was performed at the max,
as well as at two lower w/cm ratios to compare reductions in shrinkage due to lessened water
contents. The w/cm ratio was also tested at 0.50, as a worst-case scenario for field concrete.
Finally, the current maximum ARDOT standard for fly ash replacement is 20%. For tests in this
study, 0, 20 and 30% fly ash replacement values were used. The mixes batched with 0% fly ash
were treated as the control while the 20 and then 30% mixes were evaluated to determine
shrinkage effects when reducing cement through replacement by SCMs. The coarse aggregate

17
content used in all mixtures was 1800 lb/yd3, which was chosen based on consultation with
ARDOT. The only difference between the Class S(AE) mixtures and the Class S mixtures is the
total air content and the fine aggregate content. All Class S(AE) mixtures had a total air content
of 6±2 %, and because of the additional air, the fine aggregate content was less in the Class
S(AE) mixtures.
Table 3.7 – Class S(AE) Batching Matrix
Cementitious Material content (lb/yd3) w/cm
0.38 0.45 0.49 0.55
611 0% Class C Fly Ash) X X X X
611 (20% Class C Fly Ash) X X X X
611 (30% Class C Fly Ash) X X X X
564 (0% Class C Fly Ash) X X X X
564 (20% Class C fly ash) X X X X
564 (30% Class C fly ash) X X X X
517 (0% Class C Fly Ash) X X X X
517 (20% Class C fly ash) X X X X
517 (30% Class C fly ash) X X X X
3.3. Materials
All mixtures tested used the same source of cement, fly ash, coarse aggregate, and fine
aggregate. Type I/II portland cement from Ash Grove Packaging Group meeting ASTM C150
specifications (ASTM 2017) was selected due to its ease of availability in Northwest Arkansas.
Class C fly ash meeting ASTM C618 specifications (ASTM 2015) was sourced from Pine Bluff,
Arkansas, and supplied by Boral Resources. Both materials were kept in a storage building at to
provide protection from moisture and contamination. The cement and fly ash used in this project

18
were tested to determine chemical composition and other properties. The results of these tests
are summarized in Table 3.8 and Table 3.9, respectively.
Table 3.8 – Cement Properties
Property Composition
Chemical Compounds
SiO2 20.1%
Al2O3 5.1%
Fe2O3 3.8%
CaO 64.2%
MgO 1.0%
SO3 3.2%
Loss on Ignition 2.4%
Na2O 0.2%
K2O 0.6%
Insoluble Residue 0.4%
CO2 1.1%
Limestone 2.8%
CaCO3 88.2%
Potential Compounds
C3S 55.0%
C2S 14.0%
C3A 7.0%
C4AF 11.0%
C3S + 4.75 C3A 88.0%
Physical
Air Content of Mortar (Volume) 8.0%
Fineness 4.5 m2/g
Autoclave Expansion -0.01%
Mortar Bar Expansion 0.00%

19
Table 3.9 – Fly Ash Properties
Chemical Compounds Composition
SiO2 36.7%
Al2O3 21.5%
Fe2O3 5.7%
CaO 22.7%
Na2O 1.5%
K2O 0.6%
MgO 4.3%
∑ Oxides 63.9%
∑ Alkalis 29.1%
Coarse aggregate used for this project was a crushed limestone sourced from Sharp’s
Quarry in Springdale, Arkansas. A sieve analysis was performed on the aggregate to ensure the
gradation met ARDOT specifications. The results of this sieve analysis are shown against
ARDOT specifications in Figure 3.. Additionally, specific gravity and absorption capacity of
2.68 and 1.2%, respectively, were used for proportion calculations. Fine aggregate used in this
project was sourced from the Arkansas River in Van Buren, Arkansas. A sieve analysis was also
performed on the fine aggregate. The results from this analysis are shown in Figure 3.2. A
specific gravity of 2.63 and absorption capacity of 0.8% were used for mixture proportioning.
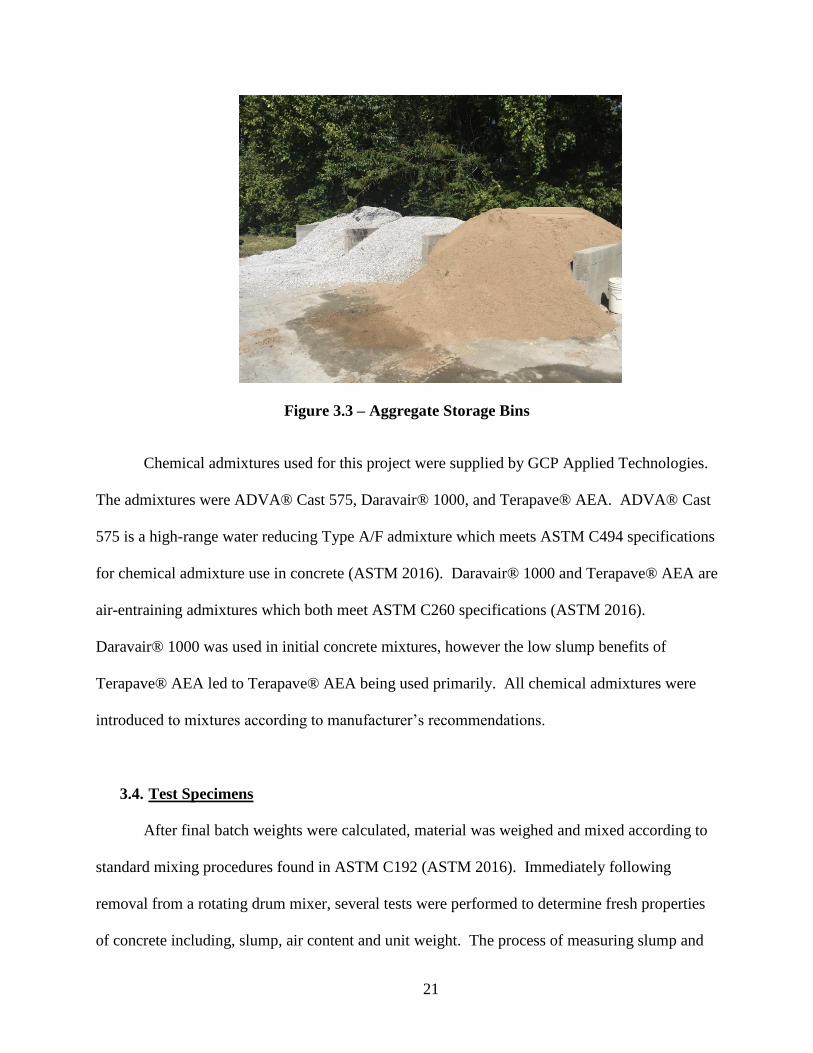
The calculated fineness modulus for the sand was 2.22. Coarse and fine aggregate stock piles
were stored in uncovered aggregate bins at the Engineering Research Center (ENRC) at the
University of Arkansas, shown in Figure 3.3. The sieve analysis of both coarse and fine
aggregates followed specifications found in AASHTO T27 (AASHTO 2014).

20
Figure 3.1 – Coarse Aggregate Gradation
Figure 3.2 – Fine Aggregate Gradation
0
10
20
30
40
50
60
70
80
90
100
1 1/2" 1" 1/2" #4 #8
% P
assi
ng
Sieve Size
Acceptable Range
Actual
0
10
20
30
40
50
60
70
80
90
100
4 40 400
% P
assi
ng
Sieve Number
21
Figure 3.3 – Aggregate Storage Bins
Chemical admixtures used for this project were supplied by GCP Applied Technologies.
The admixtures were ADVA® Cast 575, Daravair® 1000, and Terapave® AEA. ADVA® Cast
575 is a high-range water reducing Type A/F admixture which meets ASTM C494 specifications
for chemical admixture use in concrete (ASTM 2016). Daravair® 1000 and Terapave® AEA are
air-entraining admixtures which both meet ASTM C260 specifications (ASTM 2016).
Daravair® 1000 was used in initial concrete mixtures, however the low slump benefits of
Terapave® AEA led to Terapave® AEA being used primarily. All chemical admixtures were
introduced to mixtures according to manufacturer’s recommendations.
3.4. Test Specimens
After final batch weights were calculated, material was weighed and mixed according to
standard mixing procedures found in ASTM C192 (ASTM 2016). Immediately following
removal from a rotating drum mixer, several tests were performed to determine fresh properties
of concrete including, slump, air content and unit weight. The process of measuring slump and

22
the pressure meter used for unit weight and air content are shown in Figure 3.4. Slump, unit
weight, and air content were measured according to specifications found in AASHTO T119,
T121, and T152, respectively (AASHTO 2014, AASHTO 2015, AASHTO n.d.).
Figure 3.4 – Sump, Unit Weight, and Air Content Measurements
For all mixtures, two hardened concrete properties were measured – compressive strength
and unrestrained drying shrinkage. To complete this task, 12 cylinders, four inches in diameter
by eight inches in height, were fabricated and cured according to AASHTO T23 and ASTM
C192 specifications (AASHTO 2014, ASTM 2016). Additionally, three prisms, four inches
square by 11.25 inches in length were fabricated and stored for each mixture according to ASTM
C157 (ASTM 2016). However, due to limited water bath storage space, initial water curing of
prisms was not performed. All test specimens were stored in an enclosed environmental
chamber which was kept at 72ºF through use of an air conditioning system and 50% humidity
through use of a dehumidifier. Following compressive strength testing, an additional 12

23
cylinders were fabricated from the mixtures which averaged the three highest and three lowest
compressive strength values for modulus of elasticity testing.
3.5. Test Methods
All compressive strength tests were performed at the ERC using a 400-kip capacity
Forney compression machine with an ADMET GB2 digital display. Compressive strengths of
all mixtures were measured at 1 day, 7 days, 28 days, and 56 days following procedures found in
AASHTO T22 (AASHTO 2014). Three cylinders were tested to failure at each age, and the
average of the three calculated compressive strengths was recorded as mixture’s compressive
strength. Cylinder ends were placed within aluminum caps with neoprene pads prior to loading.
Some cylinder ends were ground using an end-grinding machine on site, because the
compressive strength of the cylinders exceeded the limits of the neoprene pads.
For each mixture, unrestrained drying shrinkage of three prisms was measured weekly for
16 weeks following measurement procedures found in ASTM C157 (ASTM 2016). An initial
length was measured following demolding at 24 hours of age for each prism. As shown in
Figure 3.5, prisms were placed on rollers to allow free movement in the plane of measurement.
Length changed was measured using a Humboldt length comparator with a digital gauge and
precision to the nearest ten-thousandth of an inch.

24
Figure 3.5 – Compressive Cylinder and Unrestrained Drying Shrinkage Prism Storage
Static modulus of elasticity was measured at seven and 28 days for the three mixtures
with the highest compressive strength and the three mixtures with the lowest compressive
strength following the guidance of ASTM C469 (ASTM 2014). The test was performed on three
cylinders within a collar with dial gauge using the Forney for loading. All cylinders used for
static modulus of elasticity testing were ground to a smooth, plane finish on the ends. Figure 3.
shows the length comparator, Forney with static modulus of elasticity specimen loaded, and end-
grinding machine. Raw data from these tests were analyzed using Microsoft Excel.

25
Figure 3.6 – Laboratory Equipment

26
4. Results and Discussion
4.1. Introduction
This chapter will cover the three hardened concrete properties of primary concern –
compressive strength, unrestrained drying shrinkage, and static modulus of elasticity. The
results will be shown in as concise manner possible to provide the reader with a clear
understanding of the results. The results are also divided into three sections based on the type of
mixture, PCCP, Class S, and then Class S(AE).
4.2. Results for the PCCP Mixtures
The results for the PCCP mixtures are presented and discussed in the following sections.
The testing matrix and the mixture proportions for the PCCP mixtures were discussed in Chapter
3.
4.2.1. Compressive Strength
Compressive strength data are condensed to three figures based upon cementitious
material content. Figure 4.1 shows compressive strength data for mixtures with a cementitious
material content of 564 lb/yd3 at 1 day, 7 days, 28 days, and 56 days of age. The data presented
in this figure – along will all following compressive strength figures – is grouped by fly ash
replacement percentages, increasing from left to right, and by w/cm within those groups, also
increasing from left to right. A horizontal line was added at 4,000 psi to represent the current
ARDOT compressive strength specification of 4,000 psi at 28 days.

27
Figure 4.1 – Compressive Strengths of 564 lb/yd3 Cementitious Material PCCP Mixtures
As shown by Figure 4.1, all mixtures containing a cementitious material content of 564
lb/yd3 achieved the specified 28-day strength of 4,000 psi. All but one mixture achieved the
specified strength by 7 days of age. Several trends are evident in this figure. First, a positive
effect on compressive strength caused by decreasing the w/cm is evident by decreasing
compressive strength values within each fly ash replacement percentage group as w/cm increase
from left to right.
There are two exceptions to this trend. The mixture with a fly ash replacement
percentage of 20 and w/cm of 0.45 along with the mixture with a fly ash replacement percentage
of 30 and w/cm of 0.42 both had lower compressive strengths than mixtures with the same fly
ash replacement percentage and higher w/cm. A possible explanation for this is air content. The
two lower compressive strength mixtures had measured air contents of 8.0% and 7.5%,
respectively, while the two higher compressive strength mixtures had measured air contents of
0
1,000
2,000
3,000
4,000
5,000
6,000
7,000
8,000
9,000
10,000
0.38 0.42 0.45 0.50 0.38 0.42 0.45 0.50 0.38 0.42 0.45 0.50
0% 0% 0% 0% 20% 20% 20% 20% 30% 30% 30% 30%
Com
pre
ssiv
e S
tren
gth
(psi
)
w/cm
Fly Ash Replacement
1 Day 7 Day 28 Day 56 Day

28
6.5% and 5.8%, respectively. Second, while 28-day and 56-day compressive strengths are
comparable between mixtures with a w/cm 0.38 and different fly ash replacement percentages, a
slight increase in late-age compressive strengths of 30% fly ash replacement mixtures can been
seen when comparing to mixtures with 0% and 20% fly ash replacement. This trend would be
expected to continue if compressive strength tests were performed at later ages than this project.
A delay in strength gain as fly ash replacement percentage increases is seen when comparing 1-
day and 7-day compressive strengths. The difference in early-age compressive strengths between
20% fly ash replacement and 30% fly ash replacement is not as pronounced as the difference
between mixtures containing zero fly ash and mixtures those containing any amount of fly ash.
Third, without decreasing current ARDOT specifications for cementitious material content, the
results in Figure 4.1 show the quantity of cement can be reduced by increasing the maximum
allowable fly ash replacement percentage to 30. While early-age strengths may not be
comparable to PCCP mixtures with a lower fly ash replacement percentage, 4,000 psi at 28 days
is the only compressive strength requirement and a majority of mixtures achieved this
requirement by 7 days of age.
Next, Figure 4.2 shows compressive strength data for all mixtures with a cementitious
material content of 517 lb/yd3. The format of this graph is the same as Figure 4.1. Again, a
horizontal line representing the current ARDOT 28-day compressive strength specification of
4,000 psi was added. This group of data contains the first mixture which was unable to be
completely mixed which was the mixtures at a w/cm of 0.38. This mixture lacked the
workability needed to cast test cylinders. Mixtures with higher fly ash replacement percentages
benefited from the increase in workability when fly ash is used.

29
Figure 4.2 – Compressive Strengths of 517 lb/yd3 Cementitious Material PCCP Mixtures
Despite the mixtures with a w/cm of 0.38 being unmixable, all other mixtures represented
in Figure 4.2 exceeded the 28-day compressive strength specification. Similar to Figure 4.1, all
but two mixtures achieved 4,000 psi by 7 days of age. Several trends again are present in Figure
4.2, but not as clear as data from mixtures with 564 lb/yd3 cementitious material contents. First,
the positive trend in compressive strength as w/cm decreases is again present in this data,
especially among the mixtures with 20% and 30% fly ash replacement. An exception to this
trend is evident among the mixtures containing zero fly ash. The mixture within this group with
a w/cm of 0.42 had a lower compressive strength than a mixture with a w/cm of 0.45. Once
again, air content could be the cause of this discrepancy. The air contents of these two mixtures
was 6.0% and 4.0%, respectively. Second, compressive strengths at 28 days and 56 days of age
between mixtures with the same w/cm and different fly ash replacement percentages exhibit
increased variability compared to the differences in late-age strengths of mixtures containing 564
0
1,000
2,000
3,000
4,000
5,000
6,000
7,000
8,000
9,000
10,000
0.38 0.42 0.45 0.50 0.38 0.42 0.45 0.50 0.38 0.42 0.45 0.50
0% 0% 0% 0% 20% 20% 20% 20% 30% 30% 30% 30%
Co
mpre
ssiv
e S
tren
gth
(psi
)
w/cm
Fly Ash Replacement
1 Day 7 Day 28 Day 56 Day

30
lb/yd3 with 30% fly ash replacement mixtures showing increased late age strength only over zero
fly ash mixtures with a e/cm of 0.50 and 20% fly ash replacement mixtures with a w/cm of 0.45
and 0.50. However, the pattern of lower early-age compressive strengths in mixtures containing
20% and 30% fly ash replacement compared to mixtures with zero fly ash remains. Again, this
data shows the potential for reducing the cement content of PCCP mixtures used by ARDOT
through an overall reduction in cementitious material content and an increase in fly ash
replacement percentage to 30. While early-age strengths would be lower than mixtures
containing higher cementitious material contents and lower fly ash replacement percentages, a
majority of mixtures with 517 lb/yd3 cementitious material content achieved the 28-day
compressive strength requirement by 7 days of age.
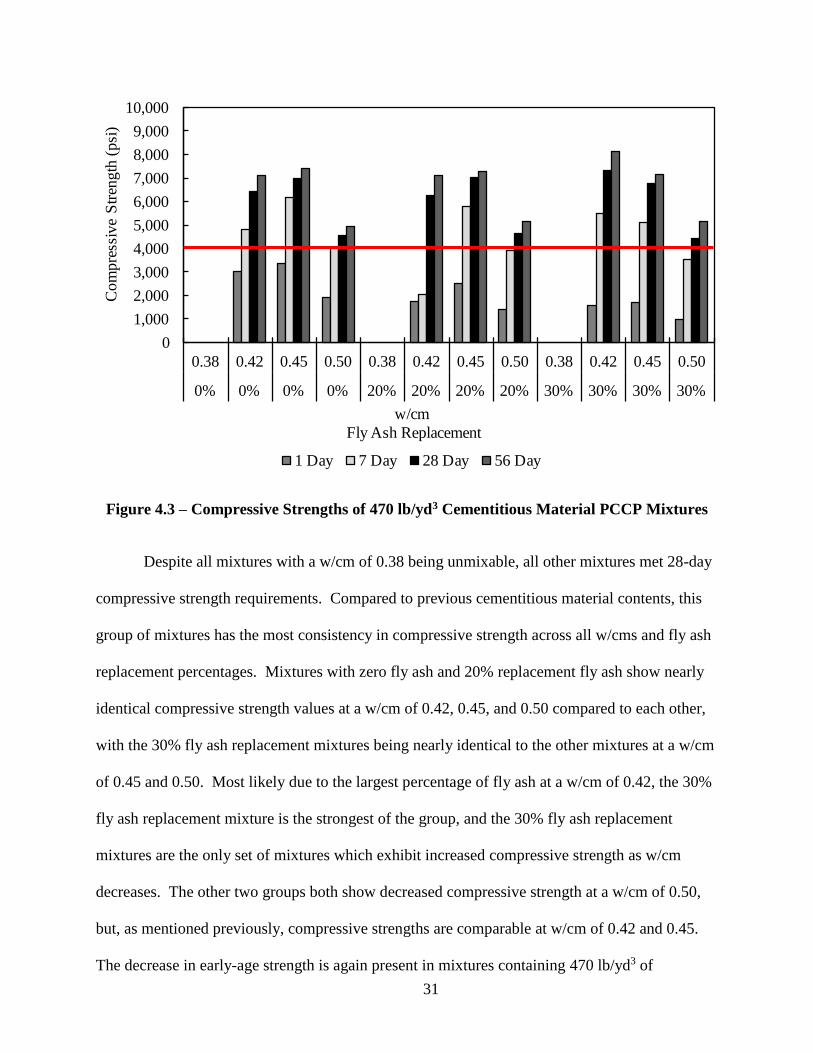
Finally, Figure 4.3 shows compressive strength data for PCCP mixtures with a
cementitious material content of 470 lb/yd3. This was the lowest cementitious material content
tested for this project. The figure follows the same format as compressive strength figures
corresponding to 564 lb/yd3 and 517 lb/yd3 cementitious material content mixtures. As seen in
Figure 4.3, all mixtures at a w/cm of 0.38 did not mix. These mixtures did not contain enough
paste or water to facilitate a successful mixture. The mixtures were stiffer compared to the
previous two groups of mixtures and workability was poor. Once again, as fly ash replacement
percentages increased, workability and slump increased.
31
Figure 4.3 – Compressive Strengths of 470 lb/yd3 Cementitious Material PCCP Mixtures
Despite all mixtures with a w/cm of 0.38 being unmixable, all other mixtures met 28-day
compressive strength requirements. Compared to previous cementitious material contents, this
group of mixtures has the most consistency in compressive strength across all w/cms and fly ash
replacement percentages. Mixtures with zero fly ash and 20% replacement fly ash show nearly
identical compressive strength values at a w/cm of 0.42, 0.45, and 0.50 compared to each other,
with the 30% fly ash replacement mixtures being nearly identical to the other mixtures at a w/cm
of 0.45 and 0.50. Most likely due to the largest percentage of fly ash at a w/cm of 0.42, the 30%
fly ash replacement mixture is the strongest of the group, and the 30% fly ash replacement
mixtures are the only set of mixtures which exhibit increased compressive strength as w/cm
decreases. The other two groups both show decreased compressive strength at a w/cm of 0.50,
but, as mentioned previously, compressive strengths are comparable at w/cm of 0.42 and 0.45.
The decrease in early-age strength is again present in mixtures containing 470 lb/yd3 of
0
1,000
2,000
3,000
4,000
5,000
6,000
7,000
8,000
9,000
10,000
0.38 0.42 0.45 0.50 0.38 0.42 0.45 0.50 0.38 0.42 0.45 0.50
0% 0% 0% 0% 20% 20% 20% 20% 30% 30% 30% 30%
Co
mpre
ssiv
e S
tren
gth
(psi
)
w/cm
Fly Ash Replacement
1 Day 7 Day 28 Day 56 Day

32
cementitious material. The mixture with 20% fly ash replacement and a w/cm of 0.42 shows a
large increase in compressive strength between 7-day breaks and 28-day breaks. This is most
likely due to poor consolidation within the cylinder mold caused by low workability leading to
highly porous test cylinders. Despite these conditions, half the mixtures which were able to be
mixed achieved 28-day compressive strength requirements in 7 days and all mixtures (excluding
the 0.38 mixtures) achieved 4000 psi by 28 days of age. This dataset represents the largest
possible decrease in both cementitious material and cement used in PCCP mixtures by ARDOT.
4.2.2. Unrestrained Drying Shrinkage
Drying shrinkage data was separated into figures based upon cementitious material
content and data series based upon fly ash replacement percentage and w/cm. Similar to
compressive strength figures, for mixtures which data is unavailable, data series are not present
within the graph, but is shown for continuity in the legend.
0
100
200
300
400
500
600
700
1 2 3 4 5 6 7 8 9 10 11 12 13 14 15 16
Str
ain (
-10
-6)
Time (weeks)
0% Fly Ash, 0.50 0% Fly Ash, 0.45 0% Fly Ash, 0.42 0% Fly Ash, 0.38
20% Fly Ash, 0.50 20% Fly Ash, 0.45 20% Fly Ash, 0.42 20% Fly Ash, 0.38
30% Fly Ash, 0.50 30% Fly Ash, 0.45 30% Fly Ash, 0.42 30% Fly Ash, 0.38

33
Figure 4.4 presents unrestrained drying shrinkage data for mixtures with 564 lb/yd3 cementitious
material. Additionally, various colors and shapes of data points represent different w/cm and fly
as replacement percentages, respectively.
Figure 4.4 – Drying Shrinkage of 564 lb/yd3 Cementitious Material PCCP Mixtures
As shown in Figure 4.4, while shrinkage data is scattered throughout the range of values,
several patterns are evident within data sets of the same w/cm. On average, mixtures with a
w/cm of 0.38 display lower values of strain, with the zero fly ash content mixture consistently
have the lowest shrinkage values of the data presented in Figure 4. Mixtures with a w/cm of 0.42
are concentrated within the middle of this data group. Additionally, shrinkage values increase
almost linearly between week 1 and week 9 before leveling off and stabilizing in week 10 and
following. All mixtures remained below 28-day, 90-day, and 16-week unrestrained shrinkage
limits recommended by previous research (Mokarem 2002, Babaei and Purvis 1996).
0
100
200
300
400
500
600
700
1 2 3 4 5 6 7 8 9 10 11 12 13 14 15 16
Str
ain (
-10
-6)
Time (weeks)
0% Fly Ash, 0.50 0% Fly Ash, 0.45 0% Fly Ash, 0.42 0% Fly Ash, 0.38
20% Fly Ash, 0.50 20% Fly Ash, 0.45 20% Fly Ash, 0.42 20% Fly Ash, 0.38
30% Fly Ash, 0.50 30% Fly Ash, 0.45 30% Fly Ash, 0.42 30% Fly Ash, 0.38

34
Next, Figure 4. presents unrestrained dry shrinkage data for mixtures containing 517
lb/yd3 cementitious material. This figure is formatted exactly the same as Figure 4.. Within this
data set, the first instance of missing data appears – the mixture containing 0% fly ash
replacement and a w/cm of 0.38 was unable to mix properly.
Figure 4.5 – Drying Shrinkage of 517 lb/yd3 Cementitious Material PCCP Mixtures
Figure 4.5 again shows similar patters to Figure 4.4. While shrinkage data is scattered
throughout the range of values, on average, mixtures with a w/cm of 0.38 display lower values of
strain, with the mixtures containing 20% and 30% fly ash replacement consistently measuring
lower shrinkage values. Mixtures with a w/cm of 0.42 are again concentrated within the middle
of this data group and show little variance between different fly ash replacement percentages.
For this group of data, most mixtures are shown stabilizing in week 6. All mixtures remained
0
100
200
300
400
500
600
700
1 2 3 4 5 6 7 8 9 10 11 12 13 14 15 16
Str
ain (
-10
-6)
Time (weeks)
0% Fly Ash, 0.50 0% Fly Ash, 0.45 0% Fly Ash, 0.42 0% Fly Ash, 0.38
20% Fly Ash, 0.50 20% Fly Ash, 0.45 20% Fly Ash, 0.42 20% Fly Ash, 0.38
30% Fly Ash, 0.50 30% Fly Ash, 0.45 30% Fly Ash, 0.42 30% Fly Ash, 0.38

35
below 28-day, 90-day, and 16-week unrestrained shrinkage limits recommended by previous
research (Mokarem 2002, Babaei and Purvis 1996).
Finally, Figure 4.6 displays data from mixtures with a cementitious material content of
470 lb/yd3. This figure is formatted the same as the two preceding figures, and no data is
available for mixtures with a w/cm of 0.38.
Figure 4.6 – Drying Shrinkage of 470 lb/yd3 Cementitious Material PCCP Mixtures
The data presented in Figure 4.6 shows fewer patterns than previous data sets. The
mixture with 20% fly ash replacement and a w/cm of 0.45 consistently shows the lowest
shrinkage values of this group and mixtures of all cementitious material contents. For this group
of data, there is little shrinkage after week 7. Consistent with all previous data groups, all
mixtures remained below 28-day, 90-day, and 16-week unrestrained shrinkage limits
recommended by previous research (Mokarem 2002, Babaei and Purvis 1996).
0
100
200
300
400
500
600
700
1 2 3 4 5 6 7 8 9 10 11 12 13 14 15 16
Str
ain (
-10
-6)
Time (weeks)
0% Fly Ash, 0.50 0% Fly Ash, 0.45 0% Fly Ash, 0.42 0% Fly Ash, 0.38
20% Fly Ash, 0.50 20% Fly Ash, 0.45 20% Fly Ash, 0.42 20% Fly Ash, 0.38
30% Fly Ash, 0.50 30% Fly Ash, 0.45 30% Fly Ash, 0.42 30% Fly Ash, 0.38

36
4.2.3. Static Modulus of Elasticity
Static modulus of elasticity data is presented in Figure 4.7
with the predicted modulus of elasticity from ACI 318-14 (ACI Comittee 318 2014). Static
modulus of elasticity was measured at 7 days and 28 days for six mixtures. As previously
mentioned, the modulus of elasticity was measured for only the best three performing mixtures
and the worst three performing mixtures in relation to compressive strength. As shown in Figure
4., for most mixtures, the equation provided by ACI 318-14 is slightly conservative. One data
point falls slightly below predicted modulus of elasticity, while the remaining mixtures are either
at or just above the equation’s prediction. This data show that mixtures with various
cementitious material contents, fly ash replacement percentages, and w/cms will achieve or
exceed expected values of modulus of elasticity.
0
1,000
2,000
3,000
4,000
5,000
6,000
7,000
8,000
0 2,000 4,000 6,000 8,000 10,000
Mod
ulu
s of
Ela
stic
ity
(ksi
)
Compressive Strength (psi)
ACI 318 Predicted
Measured

37
Figure 4.7 – ACI 318 Predicted vs Measured Modulus of Elasticity for PCCP Mixtures
4.3. Results for the Class S Mixtures
The results for the Class S mixtures are presented and discussed in the following sections.
The testing matrix and the mixture proportions for the Class S mixtures were discussed in
Chapter 3.
4.3.1. Compressive Strength
Figure 4.8 presents the compressive strength of Class S mixtures having cement contents
of 611, 564, and 517 lb/yd3. As a reminder, Class S mixtures only contain entrapped air. At
each cement content, the four bars represent the four ages at which the concrete was tested. All
concrete mixtures achieved 3500 psi, the specified strength by AHTD at 28 days. As indicated
in Figure 4.8, for a given w/cm, increasing the cement content increases the compressive
strength. For example, as the cement content was increased from 517 to 611 lb/yd3 for mixtures
at a w/cm of 0.49, the compressive strength at 28 day increased from 6700 to 7510 psi. Figure
0
1,000
2,000
3,000
4,000
5,000
6,000
7,000
8,000
0 2,000 4,000 6,000 8,000 10,000
Mod
ulu
s of
Ela
stic
ity
(ksi
)
Compressive Strength (psi)
ACI 318 Predicted
Measured

38
4.8 also shows the effect of water content on the workability of the mixtures. Two mixtures, the
564 lb/yd3 and 517 lb/yd3 at a w/cm, would not mix. This is a function of the lower w/cm and
the lower cement content which then reduces the overall water content.
Figure 4.8 – Compressive Strength of Class S Mixtures Containing Only Cement
Figures 4.9, 4.10, and 4.11 show the effect of fly ash on concrete mixtures with
cementitious material contents of 611, 564, and 517 lb/yd3 respectively. It is clear that fly ash
replacement affects the compressive strength at early ages of 1 and 7 days. This reduction in
strength as fly ash content increases is shown in mixtures having cementitious material content
of 611 lb/yd3 and a w/cm of 0.49. As can been seen in Figure 4.9, the compressive strength at 1
day decreased from 3450 psi to 1810 psi as fly ash content increased from 0 to 30%. This
reduction in strength at early ages is expected due to slow reaction of fly ash. The difference in
early age strength depends on the fly ash content (Thomas 2007). Also, the difference in
0
2000
4000
6000
8000
10000
12000
0.55 0.49 0.45 0.38 0.55 0.49 0.45 0.38 0.55 0.49 0.45 0.38
611 564 517
Com
pre
ssiv
e S
tren
gth
(p
si)
w/cm
Cementitious material content (lb/yd3)
1 7 28 56

39
strength gain of the mixtures without fly ash compared to the mixtures with fly ash maybe
caused by the heat of hydration degree. A rise in concrete temperature may lead to microcracks
in the interfacial transition zone (ITZ), which eventually lowers the ultimate strength, but
concrete with fly ash tends to have lower temperatures during hydration which prevents the
propagation of microcracks (Longarini 2014). As shown in Figures 4.9, 4.10, and 4.11, for a
given cementitious material content and w/cm, the compressive strength of concrete mixtures is
similar or higher as the fly ash content increased. For example, for mixtures at a w/cm of 0.49
and cementitious content of 517 lb/yd3, the compressive strength of 28 days increased from 6700
to 7990 psi as fly ash content increased from 0 to 30 percent. The addition of fly ash up to 30%
affected the compressive strength of concrete mixtures at 7 days; however, the compressive
strength at 7 days achieved 3500 psi for all concrete mixtures even with the high w/cm of
0.55. At 1-day compressive strength, there was a significant reduction in strength when fly ash
content increased from 0 to 30%. For example, for mixtures with cementitious content of 611
lb/yd3 at a w/cm of 0.55, the compressive strength decreased from 3110 psi to 1600 psi as fly ash
content increased from 0% to 30 %.

40
Figure 4.9 – Compressive strength of Class S Mixtures containing 611 lb/yd3 of
Cementitious Material
Figure 4.10 – Compressive Strength of Class S Mixtures Containing 564 lb/yd3
of Cementitious Material
0
2000
4000
6000
8000
10000
12000
0.55 0.49 0.45 0.38 0.55 0.49 0.45 0.38 0.55 0.49 0.45 0.38
0 20 30
Com
pre
ssiv
e S
tren
gth
(psi
)
w/cm
Fly ash replacment %
1 7 28 56
0
2000
4000
6000
8000
10000
12000
0.55 0.49 0.45 0.38 0.55 0.49 0.45 0.38 0.55 0.49 0.45 0.38
0 20 30
Com
pre
ssiv
e S
tren
gth
(psi
)
w/cm
Fly ash replacment %
1 7 28 56

41
Figure 4.11 – Compressive Strength of Class S Mixtures Containing 517 lb/yd3
of Cementitious Material
All concrete mixtures tested in this research for compressive strength meet the 28-day
required strength by ARDOT of 3500 psi. Based on compressive strength only, there is no risk if
the cementitious content is reduced from 611 lb/yd3, the minimum cementitious content assigned
by AHTD, to 517 lb/yd3. Even though adding fly ash up to 30% reduced the early age strength of
all concrete mixtures, the compressive strength at 28 days was similar or higher for mixtures
with fly ash compared to the mixtures without fly ash. To observe the behavior of concrete
mixtures having higher than expected w/cm, compressive strength was tested for concrete
mixtures with 0.55 w/cm. Even at a w/cm of 0.55, all mixtures met the required 28-day
compressive strength of 3500. The previous recommendations do not apply for concrete mixtures
with cementitious content of 564 lb/yd3 and 517 lb/yd3 at a w/cm of 0.38 because they were
unable to be batched.
0
2000
4000
6000
8000
10000
12000
0.55 0.49 0.45 0.38 0.55 0.49 0.45 0.38 0.55 0.49 0.45 0.38
0 20 30
Com
pre
ssiv
e S
tren
gth
(psi
)
w/cm
Fly ash replacment %
1 7 28 56
42
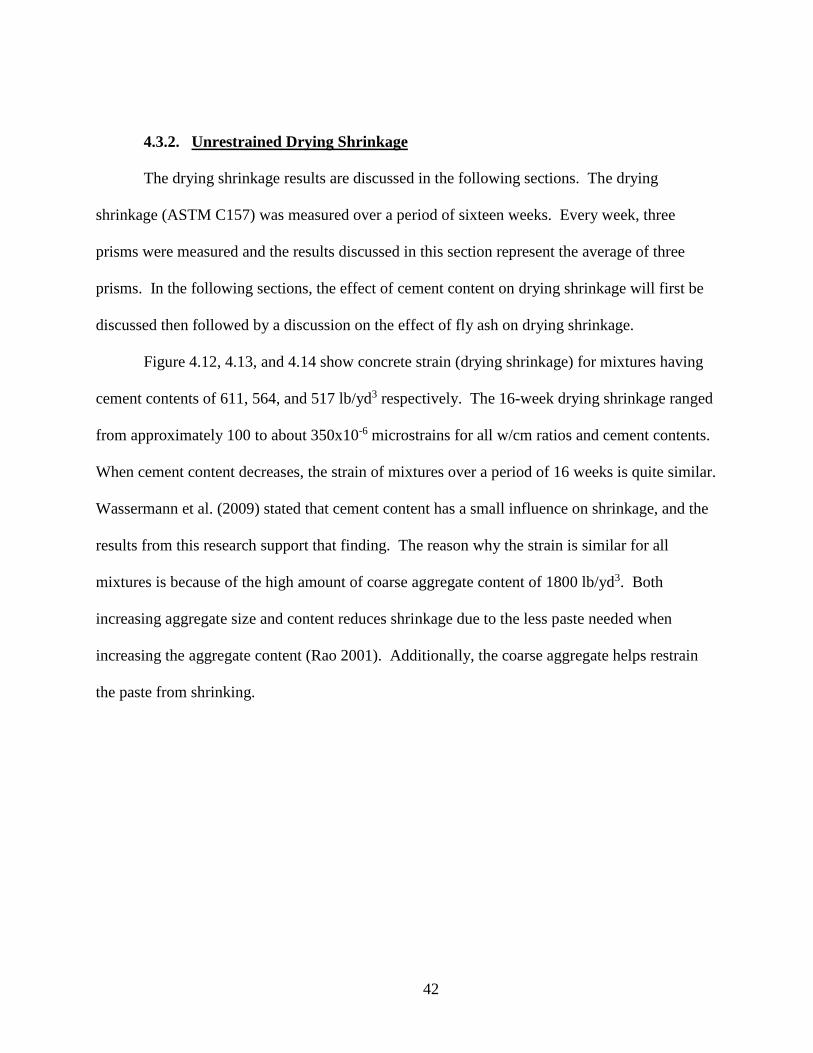
4.3.2. Unrestrained Drying Shrinkage
The drying shrinkage results are discussed in the following sections. The drying
shrinkage (ASTM C157) was measured over a period of sixteen weeks. Every week, three
prisms were measured and the results discussed in this section represent the average of three
prisms. In the following sections, the effect of cement content on drying shrinkage will first be
discussed then followed by a discussion on the effect of fly ash on drying shrinkage.
Figure 4.12, 4.13, and 4.14 show concrete strain (drying shrinkage) for mixtures having
cement contents of 611, 564, and 517 lb/yd3 respectively. The 16-week drying shrinkage ranged
from approximately 100 to about 350x10-6 microstrains for all w/cm ratios and cement contents.
When cement content decreases, the strain of mixtures over a period of 16 weeks is quite similar.
Wassermann et al. (2009) stated that cement content has a small influence on shrinkage, and the
results from this research support that finding. The reason why the strain is similar for all
mixtures is because of the high amount of coarse aggregate content of 1800 lb/yd3. Both
increasing aggregate size and content reduces shrinkage due to the less paste needed when
increasing the aggregate content (Rao 2001). Additionally, the coarse aggregate helps restrain
the paste from shrinking.

43
Figure 4.12 – Drying Shrinkage of Class S Mixtures with 611 lb/yd3 and 0% Fly Ash
Figure 4.13 – Drying Shrinkage Class S Mixtures with 564 lb/yd3 and 0% Fly Ash
0
100
200
300
400
500
600
700
1 2 3 4 5 6 7 8 9 10 11 12 13 14 15 16
Str
ain (
10
-6)
Weeks
0.55 w/cm0.49 w/cm0.45 w/cm0.38 w/cm
0
100
200
300
400
500
600
700
1 2 3 4 5 6 7 8 9 10 11 12 13 14 15 16
Str
ain (
10
-6)
Weeks
0.55 w/cm
0.49 w/cm
0.45 w/cm

44
Figure 4.14 – Drying Shrinkage of Class S Mixtures with 517 lb/yd3 and 0% Fly Ash
Figures 4.15, 4.16, and 4.17 illustrate the shrinkage strain of concrete mixtures having
cementitious material content of 611, 564, 517 lb/yd3 with 20% fly ash respectively. Adding
20% fly ash did not affect the strain of the mixtures. As previously mentioned, having a high
amount of coarse aggregate is the reason why there is no considerable change in drying
shrinkage for all the concrete mixtures. At a fly ash content of 30%, the range of drying
shrinkage over a period of 16 weeks remained within the 100 to about 350x10-6 microstrains as
can be seen in Figures 4.18, 4.19, and 4.20.
0
100
200
300
400
500
600
700
1 2 3 4 5 6 7 8 9 10 11 12 13 14 15 16
Str
ain (
10
-6)
Weeks
0.55 w/cm0.49 w/cm0.45 w/cm

45
Figure 4.15 – Drying Shrinkage of Class S Mixtures with 611 lb/yd3 and 20% Fly Ash
Figure 4.16 – Drying Shrinkage of Class S Mixtures with 564 lb/yd3 and 20% Fly Ash
0
100
200
300
400
500
600
700
1 2 3 4 5 6 7 8 9 10 11 12 13 14 15 16
Str
ain (
10
-6)
Weeks
0.55 w/cm0.49 w/cm0.45 w/cm0.38 w/cm
0
100
200
300
400
500
600
700
1 2 3 4 5 6 7 8 9 10 11 12 13 14 15 16
Str
ain (
10
-6)
Weeks
0.55 w/cm0.49 w/cm0.45 w/cm

46
Figure 4.17 – Drying Shrinkage of Class S Mixtures with 517 lb/yd3 and 20% Fly Ash
Figure 4.18 – Drying Shrinkage of Class S Mixtures with 611 lb/yd3 and 30% Fly Ash
0
100
200
300
400
500
600
700
1 2 3 4 5 6 7 8 9 10 11 12 13 14 15 16
Str
ain (
10
-6)
Weeks
0.55 w/cm0.49 w/cm0.45 w/cm
0
100
200
300
400
500
600
700
1 2 3 4 5 6 7 8 9 10 11 12 13 14 15 16
Str
ain (
10
-6)
Weeks
0.55 w/cm0.49 w/cm0.45 w/cm0.38 w/cm

47
Figure 4.19 – Drying Shrinkage of Class S Mixture with 564 lb/yd3 and 30% Fly Ash
Figure 4.20 – Drying Shrinkage of Class S Mixtures with 517 lb/yd3 and 30% Fly Ash
Babaei et al (1995) states that shrinkage cracking may be reduced by limiting the 4
months drying shrinkage to 700 x10-6 microstrains or less. As shown in figures 4.12 through
0
100
200
300
400
500
600
700
1 2 3 4 5 6 7 8 9 10 11 12 13 14 15 16
Str
ain (
10
-6)
Weeks
0.55 w/cm0.49 w/cm0.45 w/cm
0
100
200
300
400
500
600
700
1 2 3 4 5 6 7 8 9 10 11 12 13 14 15 16
Str
ain (
10
-6)
Weeks
0.55 w/cm0.49 w/cm0.45 w/cm

48
4.14, which are the cement only mixtures, the highest strain value of 16 weeks of age is
approximately 350x10-6 microstrains. Therefore, reducing the cement content from 611 to 517
lb/yd3 did not significantly change the shrinkage values, and it is expected that the reduction in
cement content would not affect cracking due to drying shrinkage. Also, replacing 30% of the
cement with fly ash did affect the drying shrinkage of the mixtures. Regarding w/cm, there is no
clear effect on the magnitude of drying shrinkage when the w/cm decreased from 0.55 to 0.38.
In addition to the high course aggregate content discussed above, research has shown that for a
given coarse aggregate content, the w/cm ratio does not clearly influence drying shrinkage
(Deshpande et al. 2007).
4.3.3. Static Modulus of Elasticity
Static modulus of elasticity data are presented in Figure 4.21
with the predicted modulus of elasticity from ACI 318-14 (ACI Comittee 318 2014) and
AASHTO. Static modulus of elasticity was measured at 7 days and 28 days for six mixtures. As
previously mentioned, the modulus of elasticity was measured for only the best three performing
0
1,000
2,000
3,000
4,000
5,000
6,000
7,000
8,000
0 2,000 4,000 6,000 8,000 10,000
Mod
ulu
s of
Ela
stic
ity
(ksi
)
Compressive Strength (psi)
ACI 318 Predicted
Measured

49
mixtures and the worst three performing mixtures in relation to compressive strength. As shown
in Figure 4., both equations provide a reasonable estimate for the modulus of elasticity.
Approximately, half of the mixtures plotted above the prediction equations and half plotted
below the equations. One reason for why there were more mixture plotting below the line is the
higher strength of the Class S mixtures versus that of the PCCP mixtures. There were Class S
mixtures which had a compressive strength of 10,000 psi and researchers have found that the
ACI and AASHTO equations overestimate modulus of elasticity for high strength concrete.
Figure 4.21- Predicted vs. Measured Modulus of Elasticity for Class S Mixtures
4.4. Results for the Class S(AE) Mixtures
The results for the Class S(AE) mixtures are presented and discussed in the following
sections. The testing matrix and the mixture proportions for the Class S(AE) mixtures were
discussed in Chapter 3.
0
1000
2000
3000
4000
5000
6000
7000
8000
0 5 10 15 20
Modulu
s of
Ela
stic
ity (
Ksi
)
Compressive Strength (Ksi)
ACI Equation
AASHTO Equation
7 day
28 day
56 dayMeasured

50
4.4.1. Compressive Strength
For class S(AE) concrete, ARDOT requires a minimum 28-day compressive strength of
4000 psi, which was achieved by all mixes. Each batch had three cylinders tested at 1, 7, 28, and
56 days. Thus, all of strength values referenced in this report represent the average of 3
specimens. The following is the data collected and how it correlates to some of the focused
aspects of this study.
As specified prior, an increase in cement content often relates to an increase in
compressive strength. However, within this study the increase of cementitious material from
517 to 564 to 611 lb/yd3 produced near equivalent compressive strength values, as can be seen
in Figure 4.22. All the initial mixes met 4000 psi by 28 days, however about 78% reached this
by 7 days. Additionally, it is important to note that even the weakest mix, the 0.50 w/cm 517
lb/yd3 30% FA mixture, met required strength by 28 days. Based on this data, at a cementitious
content of 517 lb/yd3, and a w/cm above ARDOT standards, the 4000-psi compressive strength
requirement can be met.
Figure 4.22 – Compressive Strength of Class S(AE) Mixtures Containing Cement Only

51
Fly ash plays a significant role in ultimate strength values, but for this study focused on
is effects on compressive strength and drying shrinkage. Due to the later occurring pozzolanic
reaction of fly ash, many fly ash mixes gain strength more slowly than non-fly ash mixes, but
gain slightly greater strength overall due to the continued reactions. Thus, when comparing it to
a cement only mix, the fly ash mix often has moderate to substantially less strength at 1 and 7
days, as can be viewed graphically in Figures 4.23, 4.24, and 4.25. Additionally, it follows
from this that greater amounts of fly ash reduce early age strength development (Thomas,
2007). This is especially true for lower cementitious contents, such as the 517 lb/yd3 mix, as
these mixes already have reduced cement and portions of the mixtures are replaced with a less
reactive material. In an almost opposite role, looking later into the life of concrete, this same
slower reacting fly ash often resulted in equal to slightly greater strength than mixes with little
to no fly ash at similar water cement ratios.
Figure 4.23 – Compressive Strength of Class S(AE) Mixtures with 611 lb/yd3 of
Cementitious Material

52
Figure 4.24 – Compressive Strength of Class S(AE) Mixtures with 564 lb/yd3 of
Cementitious Material

53
Figure 4.25 – Compressive Strength of Class S(AE) Mixtures with 517 lb/yd3
of
Cementitious Material
The results showed that the ARDOT standards of 611 lb/yd3 of cementitious material
could be reduced to 564 or 517 lb/yd3 for Class S(AE) concrete since all the mixtures exceeded
the minimum compressive strength of 4000 psi by 28 days. This includes the cases of fly ash
replacement mixes with 0, 20, and even 30%. Though the mixes with higher fly ash contents
did show lower early strength, by 28 days they developed sufficient strength. Considering this,
it seems that the ARDOT standard of a maximum 20% fly ash could be increased to 30% based
on compressive strength tests. Additionally, to further cement these findings it is important to
note that even in the case of a w/cm ratio of 0.50, well above the ARDOT max of 0.44, all
mixes still met the requirements. In the end, the strength data show that in many cases current
standards overdesign, and reduction of cement is both plausible and helpful monetarily and
environmentally.

54
4.4.2. Unrestrained Drying Shrinkage
Figures 4.26, 4.27, and 4.28 represent findings for the cement only, Class S(AE) mixtures
for all w/cms tested. In both mixtures with and without fly ash, findings were generally similar.
It was noted that reducing cementitious material from 611 to 517 lb/yd3 caused an approximate
decrease in microstrain of 100 x 10-6. As the w/cm decreased from the max of 0.50 to the
minimum of 0.40, there was an approximate decrease of 50 x 10-6 microstrain. The similarity in
strain is likely attributed to the high amount of coarse aggregate content, 1800 lb/yd3, in each
mix. By the end of 16 weeks, many of the measurements for these mixes read near 500 x 10-6
microstrain.
Figure 4.26 – Class S(AE) Drying Shrinkage for Mixtures with 611 lb/yd3 and 0% Fly Ash
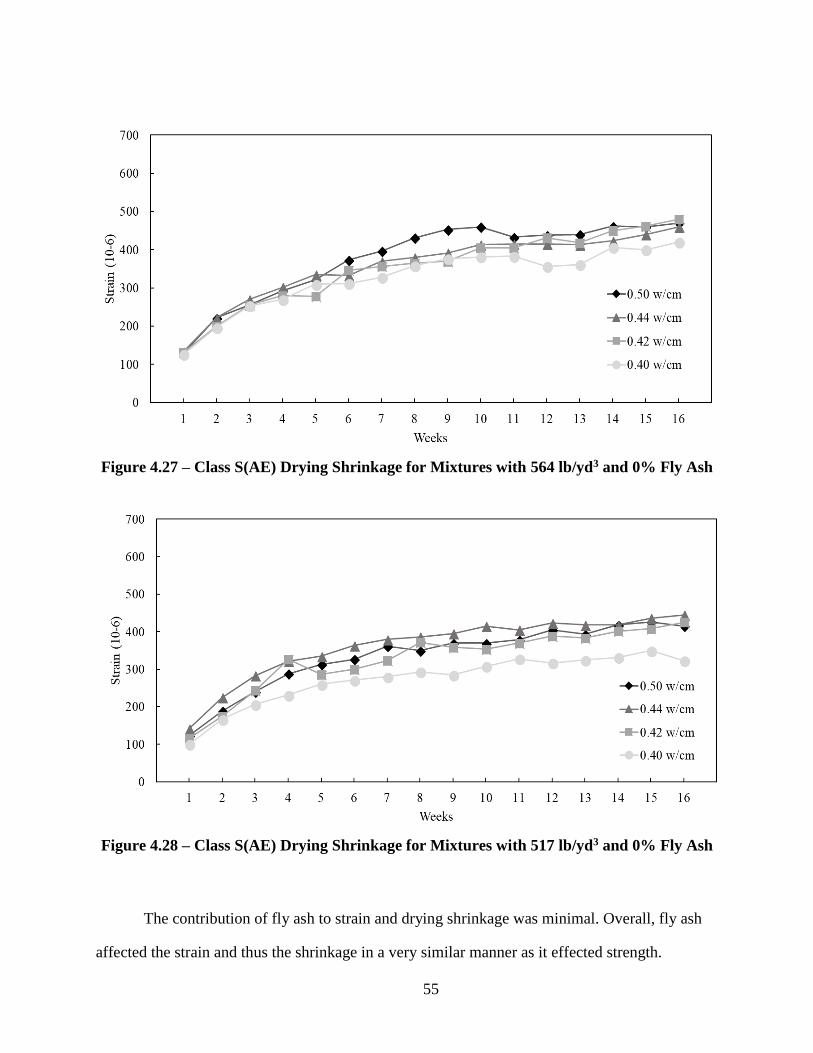
55
Figure 4.27 – Class S(AE) Drying Shrinkage for Mixtures with 564 lb/yd3 and 0% Fly Ash
Figure 4.28 – Class S(AE) Drying Shrinkage for Mixtures with 517 lb/yd3 and 0% Fly Ash
The contribution of fly ash to strain and drying shrinkage was minimal. Overall, fly ash
affected the strain and thus the shrinkage in a very similar manner as it effected strength.
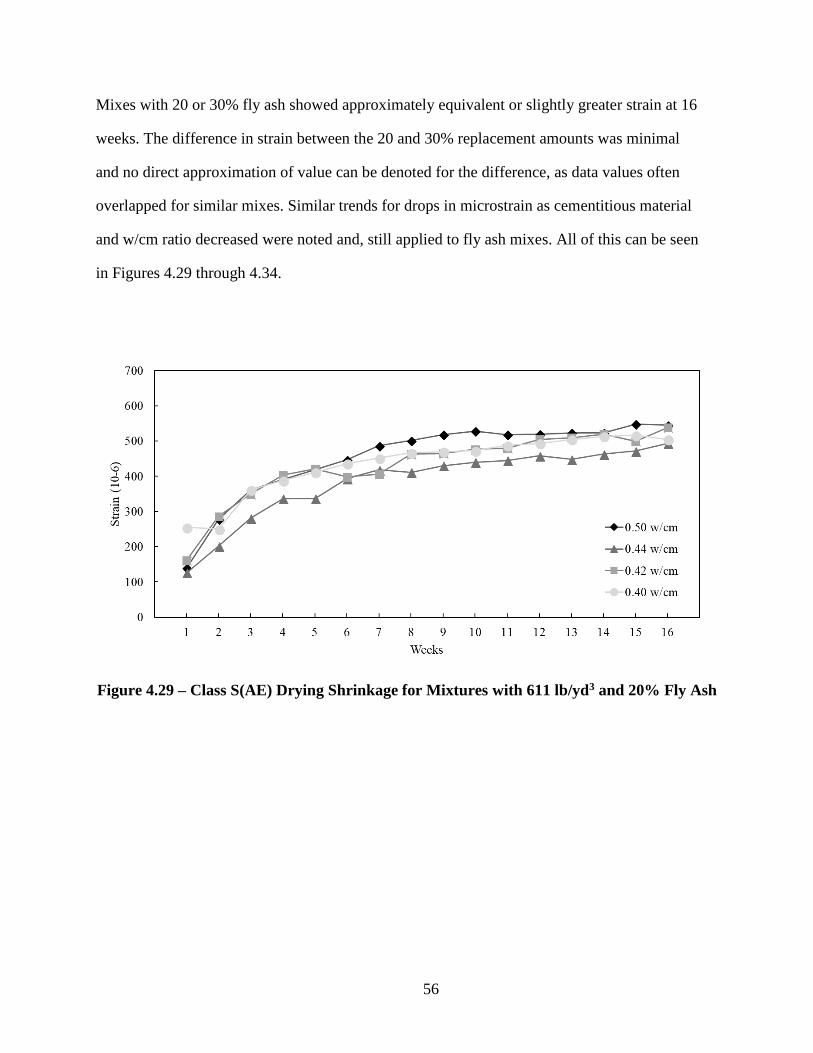
56
Mixes with 20 or 30% fly ash showed approximately equivalent or slightly greater strain at 16
weeks. The difference in strain between the 20 and 30% replacement amounts was minimal
and no direct approximation of value can be denoted for the difference, as data values often
overlapped for similar mixes. Similar trends for drops in microstrain as cementitious material
and w/cm ratio decreased were noted and, still applied to fly ash mixes. All of this can be seen
in Figures 4.29 through 4.34.
Figure 4.29 – Class S(AE) Drying Shrinkage for Mixtures with 611 lb/yd3 and 20% Fly Ash

57
Figure 4.30 – Class S(AE) Drying Shrinkage for Mixtures with 564 lb/yd3 and 20% Fly Ash
Figure 4.31 – Class S(AE) Drying Shrinkage for Mixtures with 517 lb/yd3 and 20% Fly Ash

58
Figure 4.32- Class S(AE) Drying Shrinkage for Mixtures with 611 lb/yd3 and 30% Fly Ash
Figure 4.33 – Class S(AE) Drying Shrinkage for Mixtures with 564 lb/yd3 and 30% Fly Ash

59
Figure 4.34 – Class S(AE) Drying Shrinkage for Mixtures with 517 lb/yd3 and 30% Fly Ash
From the shrinkage data we can determine the reduction in cement has no negative
effects on drying shrinkage. In addition, it appears the addition of fly ash is of little to no
consequences in regard to drying shrinkage, as it causes equal to slightly greater strain than those
mixes with no fly ash. In all initial 36 cases, no mix exceeded 600 x 10-6 microstrain, meaning
the maximum shrinkage values were less than value (700 x 10-6) that is suggested to cause
cracking in restrained conditions. Additionally, it was noted that as the w/cm decreased, the
strain showed a slight drop on average. Thus, overall it was found that reduction of cement and
replacement of fly ash performed more than adequately to meet ARDOT standards, while not
increasing strain leading to cracking.
4.5. Additional Testing
Both Modulus of Elasticity (MOE) and Rapid Chloride Ion Penetrability (RCIP), per
ASTM C1202, testing were performed for 9 additional mixes. These mixes represented not

60
just class S(AE) concrete, but also Class S and PCCP, to better fulfill the entirety of the
study which focused on multiple ARDOT approved concrete types. The goal was to
determine the differences in MOE, RCIP, strength, and shrinkage between the weakest
mixtures tested for these three classes. The 3 mixes tested used no fly ash and were: Class
S(AE) with 517 lb/yd3 at a w/cm of 0.50, Class S with 517 lb/yd3 at a w/cm of 0.55, and
class PCCP with 470 lb/yd3 at a w/cm of 0.50. Each batch was performed once with
sandstone, river gravel, and limestone as the coarse aggregate. Mixes were tested at 28 and
56 days.
For the MOE data, Equation 1 and 2 below give the standard MOE equations so they
can be plotted and compared to the data in Figure 4.35.
Ec = 57,000f’c Eq.1
Ec = 33wc1.5√f’c Eq. 2
There is little change in MOE values from 28 to 56 days. Though it had the lowest
specific gravity, the river gravel provided the highest MOE values. The river gravel was
followed by the limestone and then the sandstone, both at 28 and 56 days. Additionally, it
appears the river gravel and limestone both behave better than the predictions from the ACI
and AASHTO equations. All the while, the sandstone failed to meet expectations at either 28
or 56 days.

61
Figure 4.35 – Measured Modulus of Elasticity versus Predicted Values
Figure 4.36 presents the findings for RCIP and shows the standards for chloride ion
permeability based on ASTM C1202. It should be noted in Figure 4.36 that higher numbers of
coulombs passing through the specimen equate to less resistive and theoretically more
permeable concrete. This was best seen in the case of the Class S mix which had the highest
w/cm of 0.55 and produced values substantially higher in every aggregate case. While changes
were small between the values of the different mixes as the aggregate was changed, it seemed
evident that the most resistant aggregate was the river gravel, followed by the limestone and
then sandstone

62
Figure 4.36 - Measured RCIP Values
High

63
5. Conclusions and Recommendations
This research project examined the effects of reducing cementitious material content and
increasing fly ash replacement percentage for PCCP, Class S, and Class S(AE) mixtures on
compressive strength, unrestrained drying shrinkage, static modulus of elasticity, and costs. The
results of this investigation are discussed below.
5.1. PCCP Mixtures
The current minimum cementitious material content of 564 lb/yd3 is not necessary
to achieve specified 28-day compressive strength of 4,000 psi. All mixtures
containing the current requirement exceeded specified compressive strength by 28
days of age. A majority of mixtures reached target strength by 7 days of age.
Mixtures containing 517 lb/yd3 and 470 lb/yd3 cementitious material also all met
28-day compressive strength specifications, with a majority of mixtures also
achieving this requirement by 7 days of age.
The required cement content could be reduced to 470 lb/yd3 without adversely
affecting compressive strength or shrinkage performance.
Fly ash content could be increased to 30% and still achieve the specified
compressive strength.
Early age compressive strengths were lower in mixtures containing fly ash,
compared to mixtures without.
Unrestrained drying shrinkage for mixtures of all cementitious material contents
were within acceptable ranges for shrinkage cracking to not be a concern.

64
5.2. Class S Mixtures
The current minimum cementitious material content of 611 lb/yd3 is not necessary
to achieve specified 28-day compressive strength of 3,500 psi. All mixtures
containing the current requirement exceeded specified compressive strength by 28
days of age. A majority of mixtures reached target strength by 7 days of age.
The minimum cement content for Class S concrete could be reduced to 517 lb/yd3
without adversely affecting compressive strength or shrinkage performance.
When the w/cm was 0.55 (above the specified value), the concrete mixture
having 517 lb/yd3 and 30% fly ash met the required compressive strength.
Class C fly ash content is recommended to allow maximum replacement
percentage to increase to 30%.
Concrete mixtures with 20 and 30 % Class C fly ash have similar or higher
compressive strength at 28 day and 56 day compared to mixtures with 0 % Class
C fly ash.
Unrestrained drying shrinkage for mixtures of all cementitious material contents
were within acceptable ranges for shrinkage cracking to not be a concern.
5.3. Class S(AE) Mixtures
ARDOT could allow their minimum required cementitious material content for
class S(AE) concrete to be reduced from 611 to 517 lb/yd3 while still meeting
requirements for fresh and hardened properties.
Class C fly ash content could be increased to a max of 30% while still meeting

65
ARDOT requirements.At the highest w/cm ratio of 0.50 with the lowest
cementitious material value of 517 lb/yd3 and 30% replacement of cement
with fly ash, the mix still developed the required 28 day strength and showed a
level of shrinkage not significantly different from that of lower w/cm mixes.
All mixes achieved the ARDOT standard compressive strength for class S(AE)
concrete of 4000 psi by 28 day, with most exceeding this value by 7 days.
Mixes batched with 20 or 30 % class C fly ash had equivalent to slightly greater
drying shrinkage strain and compressive strength at 28 day and 56 days,
compared to mixtures with no fly ash.
Drying shrinkage was found to have minimal changes overall with
approximate drops of 100 microstrain from 611 to 517 lb/yd3 and of 50
microstrain from 0.50 to 0.40 w/cm ratios.
66
6. Works Cited
AASHTO. (2013). T 255-00 - Total Evaporable Moisture Content of Aggregate by Drying. In
Standard Specifications for Transportation Materials and Methods of Sampling and
Testing. Washington, D.C.
AASHTO. (2014). T 119M/T 119-13 - Slump of Hydraulic Cement Concrete. In Standard
Specifications for Transportation Materials and Methods of Sampling and Testing (35th
Edition ed.). Washington, D.C.
AASHTO. (2014). T 22-14 - Compressive Strength of Cylindrical Concrete Specimens. In
Standard Specifications for Transportation Materials and Methods of Sampling and
Testing. Washington, D.C.
AASHTO. (2014). T 23-14 - Making and Curing Concrete Test Specimens in the Field. In
Standard Specifications for Transportation Materials and Methods of Sampling and
Testing. Washington, D.C.
AASHTO. (2014). T 27-14 - Sieve Analysis of Fine and Coarse Aggregates. In Standard
Specifications for Transportation Materials and Methods of Sampling and Testing (35th
Edition ed.). Washington, D.C.
AASHTO. (2015). T 121M/T 121-15 - Density (Unit Weight), Yield, and Air Content
(Gravimetric) of Concrete. In Standard Specifications for Transportation Materials and
Methods of Sampling and Testing (35th Edition ed.). Washington, D.C.
AASHTO. (n.d.). T 152-13 - Air Content of Freshly Mixed Concrete by the Pressure Method. In
Standard Specifications for Transportation Materials and Methods of Sampling and
Testing (35th Edition ed.). Washington, D.C.
ACI. (2013). CT-13: ACI Concrete Terminology - An ACI Standard. Farmington Hills, MI:
American Concrete Institute.
ACI Comitte 209. (2005). 209.1R-05: Report on Factors Affecting Shrinkage and Creep of
Hardened Concrete. Farmington Hills, MI: American Concrete Institute.
ACI Comittee 301. (2010). ACI 301-10 - Specification for Structural Concrete. Famington Hills:
American Concrete Institute.
ACI Comittee 318. (2014). ACI 318-14: Building Code Requirements for Structural Concrete
and Commentary. Farmington Hills: American Concrete Institute.
ACI Committee 224. (2001). 224.R-01: Causes, Evaluation and Repair of Cracks in Concrete.
Farmington Hills, MI: American Concrete Institute.
Ahmad, S., & Alghamdi, S. (n.d.). A Statistical Approach to Optimizing Concrete Mixture
Design. The Scientific World Journal, 2014, 7.

67
AHTD. (2014). Standard Specifications for Highway Construction. Division 500 - Rigid
Pavements. Arkansas State Highway and Transportation Department.
AHTD. (2014). Standard Specifications for Highway Construction. Division 800 - Structures.
Arkansas State Highway and Transportation Department.
Aktan, H., Fu, G., Dekelbab, W., & Attanayaka, U. (2003). Investigate Causes & Develop
Methods to Minimize Early-Age Deck Cracking on Michigan Bridge Decks. Wayne State
University, Department of Civil & Environmental Engineering. Lansing: Michigan
Department of Transportation.
Allahham, J., Bordelon, A., Li, L., & Rayaprolu, S. (2016). Review and Specification for
Shrinkage Cracks of Bridge Decks. Salt Lake City: Utah Department of Transportation.
ASCE. (2014). 2014 Report Card for Arkansas' Infrastructure. Reston: ASCE.
ASCE. (2017). ASCE's 2017 Infrasructure Report Card. Reston: ASCE.
ASTM. (2014). C469/C469M-14 - Standard Test Method for Static Modulus of Elasticity and
Poisson's Ratio of Concrete in Compression. In Book of Standards (Vol. 04.02). West
Conshohocken.
ASTM. (2015). C618-15 - Standard Specification for Coal Fly Ash and Raw or Calcined Natural
Pozzolan for Use in Concrete. In Book of Standards (Vol. 04.02). West Conshohocken.
ASTM. (2016). C157/C157M-08(2014) - Standard Test Method for Length Change of Hardened
Hydraulic-Cement Mortar and Concrete. In Book of Standards (Vol. 04.02). West
Conshohocken.
ASTM. (2016). C192/192M - Standard Practice for Making and Curing Concrete Test
Specimens in the Laboratory. In Book of Standards (Vol. 04.02). West Conshohocken.
ASTM. (2016). C260/260M-10a(2016) - Standard Specification for Air-Entraining Admixtures
for Concrete. In Book of Standards (Vol. 04.02). West Conshohocken.
ASTM. (2016). C494/C494M-16 - Standard Specification for Chemical Admixtures for
Concrete. In Book of Standards (Vol. 04.02). West Conshohocken.
ASTM. (2017). C150/C150M-17 - Standard Specification for Portland Cement. In Book of
Standards (Vol. 04.01). West Conshohocken.
Babaei, K., & Purvis, R. L. (1996). Minimizing Premature Cracking in Concrete Bridge Decks.
International Bridge Conference.
Ballard, Z. J., Durham, S., & Liu, R. (2013). DEVELOPING CRITERIA FOR PERFORMANCE-
BASED CONCRETE SPECIFICATIONS. University of Colorado Denver. Denver:
Colorado Deparmtent of Transportation - Reserach.

68
Bamforth, P. (1980, September). In-Situ Measurement of the Effect of Partial Portland Cement
Replacement Using Either Fly Ash or Ground-Granulated Blastfurnace Slag on the
Performance of Mass Concrete. Proceeding of the Institution of Civil Engineers, 69, pp.
777-800.
Bentz, D. P., Ferraris, C. F., & Snyder, K. A. (2013). Best Practices Guide for High-Volume Fly
Ash Concretes: Assuring Properties and Performance. United States of America
Department of Commerce, National Institute of Standards and Technology. Washington,
D.C.: National Institute of Standards and Technology.
Bentz, D. P., Hasen, A. S., & Guynn, J. M. (n.d.). Optimization of Cement and Fly Ash Particle
Sizes to Produce Sustainable Concretes. Cement & Concrete Composites(33), 824-831.
Bilodeau, A., Sivasundaram, V., Painter, K., & Malhotra, V. (1994). Durability of Concrete
Incorporating High Volumes of Fly Ash from Sources in the USA. Materials Journal,
91(1), 3-12.
Chen, C., Habert, G., Bouzidi, Y., & Jullien, A. (2010). Environmental Impact of Cement
Production: Detail of the Different Processes and Cement Plant Variability Evaluation.
Journal of Cleaner Production, 18(5), 478-485.
Cook, M., Ghaeezadeh, A., Ley, T., & Russell, B. (2013). Investigation of Optimized Graded
Concrete for Oklahoma- Phase 1. Oklahoma State University, Civil and Environmental
Engineering. Oklahoma City: Oklahoma Department of Transportation.
Cordon, W., & Gillespie, H. (1963). Variables in Concrete Aggregates and Portland Cement
Paste which Influence the Strenght of Concrete. ACI Journal, 60(8), 1029-1052.
Dewar, J. (1999). Computer Modelling of Concrete Mixtures. New York: Routledge.
Dhir, R., McCarthy, M., Zhou, S., & Tittle, P. (2004). Role of Cement Content in Specifications
for Concrete Durability: Cement Type Influences. Proceedings of the Institution of Civil
Engineers-Structures and Buildings, 157(2), 113-127.
EPA. (2003). Background Document for Life-Cycle Greenhouse Gas Emission Factors for Fly
Ash Used as a Cement Replacement in Concrete. Washington, D.C.: Environmental
Protection Agency.
EPA. (2017). Inventory of U.S. Greenhouse Gas Emissions and Sinks. Washington, D.C.:
Environmental Protection Agency.
Fennis, S., & Walraven, J. (2011). ECOLOGICAL CONCRETE AND WORKABILITY: A
MARRIAGE WITH FUTURE? 36th Conference on OUR WORLD IN CONCRETE &
STRUCTURES (p. 10). Singapore: CI-Premier.
Flower, D. J., & Sanjayan, J. G. (2007). Green House Gas Emissions Due to Concrete
Manufacture. The International Journal of Life Cycle Assessment, 282-288.

69
Hanna, A. N. (2003, September). Aggregate Tests for Portland Cement Concrete Pavements:
Review and Recommendations. Research Results Digest(281), 28.
Hartt, W. H., Nam, J., & Li, L. (2002). A Unified Approach to Concrete Mix Design
Optimization for Durability Enhancement and Life-Cycle Cost Optimization. Tallahassee:
Florida Department of Transportation Research Center.
Humphreys, K., & Mahasenan, M. (2002). Toward a Sustainable Cement Industry. Geneva:
World Business Council for Sustainable Development.
Khaleghi, B. (2017). Washington State Evaluation of Performance Based Concrete for Bridge
Decks. Transportation Research Record: Journal of the Transportation Research Board,
2642, 35-45.
Kosmatka, S. H., Kerkhoff, B., & Panarese, W. C. (2003). Design and Control of Concrete
Mixtures (14th Edition ed.). Portland Cement Association.
Larrard, F. (1999). Concrete Mixture Proportioning. New York: Routledge.
Ley, T., & Cook, D. (2014, October). Aggregate Gradations for Concrete Pavement Mixtures.
Road Map Track, p. 4.
Ley, T., Cook, D., & Fick, G. (2012). Concrete Pavement Mixture Design and Analysis (MDA):
Effect of Aggregate Systems on Concrete Properties. Iowa State University. Ames:
National Concrete Pavement Technology Center.
Li, Z., Qi, M., & Ma, B. (1999). Crack Width of High-Performance Concrete Due to Restrained
Shrinkage. Jornal of Materials in Civil Engineering, 11(3), 214-223.
Mehta, K. P., & Monteiro, P. J. (2006). Concrete: Microstructure, Properties, and Materials
(3rd Edition ed.). New York: McGraw-Hill.
Mindess, S., Young, J. F., & Darwin, D. (2003). Concrete. Upper Saddle River, NJ: Pearson
Education.
Mokarem, D. W. (2002). Development of Concrete Shrinkage Performance Specifications.
Virginia Polytechnic Institute and State University, Civil and Environmental Department.
Blacksburg: Virginia Polytechnic Institute and State University.
Montana Department of Transportation. (n.d.). Concrete Aggregate Combined Gradataion
Example. Helena: MDOT.
Monteiro, P., & P.R.L., H. (1994). Designing Concrete Mixtures for Desired Mechanical
Properties and Durability. Concrete Technology, 144, 519-544.
Neville, A. (1995). Properties of Concrete. Harlow, U.K.: Longman Group.

70
NRMCA. (2012). Concrete CO2 Fact Sheet. National Ready Mixed Concrete Association. Silver
Spring: NRMCA.
NRMCA. (2015). Minimum Cementitious Materials Content. Silver Spring: National Ready
Mixed Concrete Association.
Obla, K. H., Hong, R., & Lobo, C. L. (2017). Should Minimum Cementitious Contents for
Concrete Be Specified? Transportation Research Board 96th Annual Meeting (pp. 1-15).
Washington: Transportation Research Board.
Peyton, S., Sanders, C., Arratia, S., and Hale, W. (2011). Curing Practices to Reduce Plastic
Shrinkage in Concrete Bridge Decks, TRC0603, Arkansas State Highway and
Transportation Departemnt.
Popovics, S. (1990). Analysis of the Concrete Strenght versus Water-Cement Ratio Relationship.
ACI Materials Journal, 85(5).
Portland Cement Association. (2015). Supplementary Cementitious Materials. Skokie: Portland
Cement Association.
Rached, M., Fowler, D., & Koehler, E. (2010). Use of Aggregates to Reduce Cement Content in
Concrete. International Conference on Sustainable Construction Materials and
Technologies. Ancona, Italy.
Richardson, D. N. (n.d.). Standard Method of Test for Total Evaporable Moisture Content of
Aggregate by Drying. University of Missouri - Rolla. Springfield: National Technical
Information Center.
Rudy, A., & Olek, J. (2012). Optimization of Mixture Proportions for Concrete Pavements—
Influence of Supplementary Cementitious Materials, Paste Content and Aggregate
Gradation. Purdue University, Joint Transportation Research Program. Indianapolis:
Indiana Department of Transportation.
Schmitt, T. R., & Darwin, D. (1999). Effect of Material Properties on Cracking in Bridge Decks.
Journal of Bridge Engineering, 4(1), 8-13.
Shilstone, J. M. (June, 1990). Concrete Mixture Optimization. Concrete International, pp. 33-39.
Taylor, P., Bektas, F., Yurdakul, E., & Ceylan, H. (2012). Optimizing Cementitious Content in
Concrete Mixtures for Required Performance. Iowa State University. Washington, D.C.:
Federal Highway Administration.
The Aberdeen Group. (1976). Air Entrainment and Concrete. 6.
Thomas, M. D. (2007). Optimizing the use of fly ash in concrete (Vol. 5420). Skokie, IL:
Portland Cement Association.

71
Tobin, R. (1957). A Quick Method for Determining Cement Content of Fresh Concrete. 27th
annual convention of the National Ready Mixed Concrete Association (p. 5). Los
Angeles: The Aberdeen Group.
Wang, K., Shah, S. P., & Phuaksuk, P. (2001). Plastic Shrinkage Cracking in Concrete
Materials—Influence of Fly Ash and Fibers. Materials Journal, 98(6), 458-464.
Wassermann, R., Katz, A., & Bentur, A. (2009). Minimum Cement Content Requirements: a
Must or a Myth? Materials and Structures, 42, 973-982.
Whiting, D., Todres, A., Nagi, M., Yu, T., Peshkin, D., Darter, M., Geiker, M. (n.d.). Sythesis of
Current and Projected Concrete Highway Technology. Construction Technology
Laboratories, ERES Consultants, G.M. Idorn Colsult. Washington, D.C.: Strategic
Highway Research Program.
Williamson, R. (1984). Methods for Determining the Water and Cement Content of Fresh
Concrete. Materiaux et Constructions, 18(106), 269-278.
Worrell, E., Price, L., Martin, N., Hendriks, C., & Meida, L. O. (2001). Carbon Dioxide
Emissions from the Global Cement Industry. Annual Review of Energy and the
Environment, 26(1), 303-329.
Yurdakul, E. (2010, January). Optimizing Concrete Mixtures with Minimum Cement Content for
Performance and Sustainability. Iowa State University. Ames: Iowa State University.
Retrieved from http://lib.dr.iastate.edu
Yurdakul, E., Taylor, P. C., Ceylan, H., & Bektas, F. (2011). Minimizing Cementitious Content
for Performance and Sustainability in Rigid Pavements. 2011 International Concrete
Sustainability Conference. Boston: National Ready-Mixed Concrete Association.