Embed Size (px)
Citation preview

Examining spillover effect of US… / M. Zubair Mumtaz, Z. Alexander Smith 89Estudios de Economía. Vol. 46 - Nº 1, Junio 2019. Págs. 89-124
Examining spillover effect of US monetary policy to European stock markets: A Markov-Switching approach*1
Examinando efectos de rebalse de la política monetaria de Estados Unidos sobre los mercados accionarios europeos: un efecto de cambios de Markov
Muhammad Zubair Mumtaz**Zachary Alexander Smith***
Abstract
This study empirically examines the spillover effect from US monetary policy to nineteen European economies using Markov-switching models. The results of the univariate Markov-switching models validate the presence of two distinct regimes for both US monetary policy and the stock markets. We find mixed results when applying the multivariate Markov-switching models. The results report a positive relationship between the US interest rate and developed stock markets except for the Finish, Swiss, Swedish and UK stock markets whereas our findings confirm a positive relationship with the developing stock markets except for the Slovenian and Ukraine stock markets. Importantly, the nature of this effect varies during the economic crisis period. This study also compares the spillover effect between Asian and European stock markets and concludes that the effect of US monetary policy varies from market to market, however, changes in US monetary policy have greater effects on developed markets.
Key words: Spillover effect, monetary policy, Markov-switching models, European stock markets.
JEL Classification: C22, E44, E52, G15.
* We are grateful for valuable feedback and comments provided by Rómulo Chumacero (the editor) and two anonymous referees and believe that our paper benefited greatly from their comments and suggestions.
** [Corresponding author] School of Social Sciences & Humanities, National University of Sciences and Technology, Sector H-12, Islamabad, Pakistan. Tel: +92 51 9085 3566. Email: [email protected]
*** Tapia College of Business, Saint Leo University, FL, USA, Email: [email protected].
Received: February, 2018. Accepted: August, 2018.
Estudios de Economía, Vol. 46 - Nº 190
Resumen
Este trabajo evalúa el efecto rebalse de la política monetaria de Estados Unidos en diecinueve economías europeas, utilizando modelos de cambios markovia-nos. Modelos univariados validan la presencia de dos regímenes, tanto para la política monetaria de Estados Unidos como de los mercados accionarios. Encontramos una relación positiva entre la tasa de Estados Unidos y los mer-cados accionarios de economías desarrolladas (con la excepción de Finlandia, Suiza, Suecia y Reino Unido) y mercados accionarios de países en desarrollo (excepto por Eslovenia y Ucrania). A su vez, la naturaleza de este efecto varía en períodos de crisis. El trabajo también compara el efecto rebalse entre eco-nomías asiáticas y europeas, demostrando que los efectos son distintos entre mercados. Sin embargo, la influencia de la tasa de interés de Estados Unidos es mayor en mercados desarrollados.
Palabras clave: Efecto rebalse, política monetaria, modelos de cambio de régimen markoviano, mercados accionarios europeos.
Clasificación JEL: C22, E44, E52, G15.
1. Introduction
Over the past two decades, globalization has been perceived as a dominant factor which has deepened trade relationships and financial integration. This il-lustrates that the linkages associated with one market eventually either positively or negatively influence other markets. As a consequence, the spillover effect from shocks in other countries has increased importance from the point of view of the academician and policymakers in relation to how those shocks in other regions are likely to affect the local region. Bekaert, Hoerova, and Duca (2013) argued that international financial growth and conditions are determined by a global financial cycle, which, in turn, seems to be affected, to a great extent, by monetary policy in the US.
Local stock markets play an important role in financial integration and they are notoriously sensitive to changes in the monetary policy. However, their sensitivity may vary from market to market and across different time periods. Researchers have provided different arguments regarding the impact of monetary policy on the stock markets (see, inter alia, Conover, Jensen, Johnson, & Mercer, 1999; Bjornland & Leitemo, 2009; Chatziantoniou, Duffy, & Filis, 2013). Some researchers argued that an increase in the money supply results in increases in stock prices which eventually encourages activity in the stock market (Bjornland & Leitemo, 2009). According to Chatziantoniou et al. (2013), the effect of monetary policy on the stock market returns flows through five potential chan-nels, which are interest rates, credit, the wealth effect, the exchange rate, and the monetary effect. Other researchers claimed that an expansionary monetary
Examining spillover effect of US… / M. Zubair Mumtaz, Z. Alexander Smith 91
policy increases the asset prices, which reduces their expected returns and thus, decreases stock market activities (Laopodis, 2013; Ivrendi & Guloglu, 2012). This happens as a result of an increase in stock prices that are considered as a possible omen of expected inflation which would cause the ensuing counterac-tion of the Federal Reserve.
Around the globe, stock markets have matured and integrated further over the past few decades. The Efficient Market Hypothesis posits that stock mar-kets are more sensitive to changes in economies across the globe due to these increases in integration (Fama & French, 1989). Markets are more sensitive to changes in the U.S. monetary policy which may influence the stock markets of both the developed and developing economies. However, the impact of U.S. monetary policy towards developing markets is more prominent relative to the impact on developed markets (Yang and Hamori, 2014). Rigobon and Sack (2003) determined that movements in the stock market can have a significant influence on the macro-economy and thus considered it an important parameter to use to determine monetary policy. They employed identification techniques based on the heteroscedasticity of stock market returns to examine the reaction of monetary policy to changes in the performance of the stock market and found a significant policy response, which indicated that a 5% rise (fall) in the S&P 500 index increases the likelihood of a 25-basis point tightening (easing) by about a half (Rigobon & Sack, 2003).
Yang and Hamori (2014) analyzed the spillover effect of US monetary policy on the Indonesian, Singaporean, and Thai Stock Markets during the period that lasted from 1990 to 2012. They employed univariate and multivariate Markov-switching models and reported that US interest rates inversely influenced these markets during the boom period, however, this influence vanishes during the recession period. In addition, they determined that the spillover effect from US monetary policy affects these stock markets only during the tranquil period (Yang et al., 2003). They also explored the transmission mechanism of asset prices; especially, from the US to small economies (Yang et al., 2014). In short, they found that stock markets are influenced more by the treasury bill rate in a bull market relative to bear market as the duration of a bull market is higher than a bear market.
Many studies have been conducted to examine the relationship between monetary policy and stock prices in different regions across different time periods using various econometric techniques. In literature, most of the stud-ies investigated the relationship between stock prices and the U.S. monetary policy in developing and emerging Asian Economies and a few European developed markets. Like Asian Economies, European countries may have been influenced by changes in U.S. monetary policy. In this context, it is important to examine how European countries respond to changes in U.S. monetary policy as they experience bull and bear stock market regimes. This also suggests that an increase/decrease in U.S. interest rates may provide an opportunity for firms to explore their business avenues by investing in the U.S. or other European markets.

Estudios de Economía, Vol. 46 - Nº 192
The aim of this study is to analyze the relationship between U.S. monetary policy and the selected developed and developing European Countries. We use the Markov-switching models to examine the impact of monetary policy on the stock market prices during the period lasting from January 1994 to December 2017. Furthermore, we examine the regime switching process of the federal funds rate, the S&P 500, and nineteen European stock markets and find the existence of two different regimes using univariate Markov-switching models. While employing multivariate Markov-switching models, this study finds mixed results. The results report a positive relationship between the US interest rate and the selected developed countries with the exception of the Finish, Swiss, Swedish, and UK stock markets. This relationship is also positive in developing markets except for the Slovenia and Ukraine stock markets during the economic expansion phase. The role of the previous stock market returns is relatively small in regards to determining the future movement of stock markets in European Countries. In this study, we also compare the effect of US interest rates on the Asian and European Stock Markets and conclude that the effect of US Monetary Policy varies from market to market, however, this effect towards developed markets is greater.
The remainder of the study is structured as follows. Section 2 explains the prior literature on monetary policy and stock prices, Section 3 constructs the specification of Markov-switching models, Section 4 describes the data of the study, Section 5 presents estimation results, and Section 6 concludes the paper.
2. Monetary policy and stock prices
Economic theory describes the various ways in which there is an interrelation between monetary policy and asset prices, especially through stock prices. We understand that stock prices are valued on the basis of forward-looking opinions and that a change in the policy rate, which is an important component of monetary policy, may influence stock prices. An announcement of an increase or decrease in the policy rate may positively or negatively affect the stock prices directly and the determination of dividend and stock return premium indirectly. In general, asset prices may affect consumption through a wealth channel and the firms’ ability to borrow funds, that is, a credit channel. There are various perspectives of how the policy rate should be increased or decreased, the monetary policy-makers attempt to affect aggregate demand to attempt to control inflation or increase opportunities for investment in the country. This course of action, as a result, influences the stock prices. The change in U.S. monetary policy not only affects the assets prices in the US but this change will affect the stock prices in countries all over the world. However, the magnitude of influence on the stock prices varies which depends on the size of businesses in the respective country engaged in transactions that are affected the U.S. market. To understand more about the relationship between monetary policy and stock prices, the ensuing paragraphs present some empirical evidence.
Examining spillover effect of US… / M. Zubair Mumtaz, Z. Alexander Smith 93
To examine the dynamic association between the stability of monetary policy and the volatility of stock prices in four Asian countries (Malaysia, Singapore, South Korea, and Thailand), Ivrendi and Guloglu (2012) employed a Markov-regime switching autoregressive conditional heteroscedasticity technique. They identified the existence of an asymmetric relationship between monetary policy and stock prices with all of the aforementioned countries except for Thailand (Ivrendi et al., 2012). Hussain (2010) estimated the return and volatility of European countries including France, Germany, Switzerland, and the United Kingdom and the U.S. equity indices as a result of monetary policy decisions and macroeconomic news announcements, which included intraday data during the period lasting from 2000 to 2008. He found that monetary policy actions instantly and significantly affected the stock prices and volatilities in both the US and European Markets (Hussain, 2010). In another study, Fakra (2009) used intraday data during the 1994 to 2005 period to analyze the impact of U.S. Monetary Policy on the level and conditional volatility of S&P 500 Index. She employed the GARCH technique and identified that a 1% increase in the policy rate caused a decline in stock returns of roughly 5.6% (Fakra, 2009). In short, her findings illustrate that volatility depends on the nature and timing of monetary policy shocks (Fakra, 2009).
Bjornland and Leitemo (2009) examined the interdependence between US Monetary Policy and the S&P 500 Index by employing a structural vector au-toregressive technique. They explored the evidence of interdependence between the interest rate policy and real stock prices (Bjornland et al., 2009). Bjornland et al. (2009) found that there was an instant decrease in real stock prices by 7% to 9% due to an increase in federal funds rate by 100 basis points. However, a stock price shock inflating real stock prices by 1% led to an increase in the interest rate of roughly 4 basis points (Bjornland et al., 2009).
Chu (2015) investigated the dependence structure between monetary policy and stock market liquidity in China using the dynamic copula approach during the period lasting from 2006 to 2012. His findings suggested that less liquid stock markets are influenced by contractionary monetary policy and that highly liquid stock markets are influenced by expansionary monetary policy (Chu, 2015). He also found that there was an asymmetric effect of monetary shocks on stock market liquidity (Chu, 2015). In addition, the strength of lower-tail dependence between monetary liquidity and stock liquidity increases signifi-cantly for the post-crisis period (Chu, 2015). Fischbacher, Hens, and Zeisberger (2013) examined the effect of monetary policy on stock market bubbles and trading behavior in experimental asset markets and registered a strong impact of interest rate policy on liquidity in the stock market; however, it only had a small influence on bubbles.
Kurov (2010) estimated the effect of monetary policy on investors’ sentiment associated with the S&P 500 Index during the period lasting from 1990 to 2004. He reported that monetary policy decisions have a significant effect on inves-tor sentiment and that the actions associated with monetary policy in the bear market phase have a strong influence on stock prices that are more sensitive to
Estudios de Economía, Vol. 46 - Nº 194
changes in investor sentiment and credit markets conditions (Kurov, 2010). To examine the determinants of global spillovers from US Monetary Policy shocks, Georgiadis (2015) used a vector autoregressive model and found considerable spillover effects to the entire world markets. He reported that changes in the US Monetary Policy have a larger effect, which illustrates that changes to US interest rates have a greater effect on many economies than changes in their domestic rates (Georgiadis, 2015).
3. Measuring Markov-switching models
The Markov-switching model of Hamilton (1989), also recognized as the regime switching model, is one of the most prevalent time series models in the literature. This model encompasses many structures that can illustrate time series actions in various regimes. Allowing the model to switch between these structures improves this techniques capacity to detect more composite dynamic forms. An innovative characteristic of this model is that the switching mechanism is organized by an unobservable state variable that follows a first-order Markov chain. The primary Markov switching model emphasizes the mean behavior of variables. This technique has been widely employed to examine economic and financial time series (Hamilton, 1989; Diebold, Lee, & Weinbach, 1994; Kim, 2004), among many others.
This study employs the multivariate Markov-Switching Intercept Autoregressive Heteroscedasticity (MSIAH) model (Ang & Timmermann, 2012) to investigate the relationship between US Monetary Policy and the European stock markets. A general form of the model is defined as:
(1) yt = µst + βst yst−1+ εt
where yt refers to a matrix containing the return on the equity index, the return on the gold price index, and the 3-month Treasury bill rate. µst = µ1st
, µ2st, µ3st( )
is a vector of means in state St and βSt is 3 x 3 a matrix of autoregressive coe-
fficients in state St. We assume that unobservable state-dependent variable St grasps a complicated ergodic M-state Markov process with a transition matrix, we have the following transition matrix:
(2) P =
p11 p12 … p1M
p21 p22 ! p2M
" " " "pM1 pM2 ! pMM
⎡
⎣
⎢⎢⎢⎢⎢
⎤
⎦
⎥⎥⎥⎥⎥
where pij = Pr St = j St−1 = i⎡⎣ ⎤⎦;i, j =1, . …, M .

Examining spillover effect of US… / M. Zubair Mumtaz, Z. Alexander Smith 95
We further presume that the residuals adhere to a normal distribution for all regimes:
(3) εt ~ N 0, ΣSt( )
where εt = (ε1t ,ε2t ,ε3t ) and ΣSt is a 3 x 3 variance-covariance matrix conditional on St:
(4) ΣSt =
σ11,stσ12,st
σ13,st
σ 21,stσ 22,st
σ 23,st
σ 31,stσ 32,st
σ 33,st
⎡
⎣
⎢⎢⎢⎢
⎤
⎦
⎥⎥⎥⎥
In summary, the conditional distribution of yt constructed on state St and earlier information can be presented as
(5) f yt St , yt−1( ) = 1
2ηN /2 ΣSt1/2 exp −1 / 2εtΣst
−1εt⎡⎣
⎤⎦
where N = 3 is the number of parameters in the system with the estimated joint distribution.
Including the unobservable state variable St generates
(6) f yt yt−1( ) = i=1
M
∑f yt St , yt−1( )Pr St y1, …., yt−1( )
where M denotes the number of possible regimes.The log-likelihood function can be formulated as
(7) L =t=1
T
∑ln f(yt yt−1)⎡⎣ ⎤⎦
where T is the number of observations in the dataset. The maximum likelihood technique is employed to evaluate the variables µSt
, βSt and ΣSt for St = 1, …, M,
and the transition probability P.Mainly, Eq. (1) is condensed to a simple VAR model when there is no regime
(M = 1). With regard to univariate analysis, we further use the Markov-Switching Intercept Heteroscedasticity (MSIH) technique, where βSt
= 0 for St = 1, …, M, to ascertain whether a more parsimonious model can postulate an ample nar-rative of each parameter.
We also employ the Schwarz Bayesian Criterion (SBC) to determine the best-fitting Markov-switching models for which the lowest SBC value is selected.

Estudios de Economía, Vol. 46 - Nº 196
In addition, we use the linearity test of Davis (1977, 1987) to determine the appropriateness of the state-dependent model. In addition, the regime classifica-tion measure (RCM) is used to assess the aptness of the state-dependent model (Ang & Bekaert, 2002). This aspect is expressed as:
(8) RCM = 400 x 1
Tt=1
T
∑Pr St = j Θt⎡⎣ ⎤⎦ 1−Pr St = j ΘT⎡⎣ ⎤⎦( )
where the constant term 400 confirms that the statistics range from 0 to 100, and Pr St = j ΘT⎡⎣ ⎤⎦ represents to the smoothed regime probabilities conditioned on the full information set ΘT . A value of 0 infers a perfectly discrete two-regime model, whereas a value of 100 entails an absolutely integrated two-regime model. Hence, a value of 50 commonly serves as a benchmark. A value below 50 reveals that the two-regime model executes well whereas a value above 50 shows that the single-regime model works well.
4. Data Description
To examine the effects of the changes in US monetary policy on the European stock markets, we used the return on equity indices and 3-month Treasury bill rate as one classification. The US 3-month Treasury bill rate represents the Federal Fund Rate (FED), return on equity bases on the Standard & Poor’s 500 (S&P 500) to estimate the inflation overflow from excess liquidity, and the return on equity bases on the Morgan Stanley Capital International (MSCI) stock price index for the European countries. To investigate how stock market prices behave as a result of changes in the US Monetary Policy, we segregated the European countries into developed and developing economies. As a substitute for the exact Fed Funds Rate, we used the US 3-month Treasury bill rate to gain exposure to the market’s anticipation of future rates and the movement of the interest rate. We chose ten developed countries including Austria, Belgium, Denmark, France, Finland, Germany, Norway, Switzerland, Sweden, and the UK and nine develop-ing countries including Bulgaria, Croatia, Czech, Hungary, Poland, Portugal, Serbia, Slovenia and Ukraine to examine the effect of US monetary policy on these markets. The selection of these countries is solely based on the availability of data. We consider monthly data during the period lasting from January 1994 to December 2017 which is obtained from the DataStream1.
1 The sample period ranges between January 1994 to December 2017 for all the developed countries. However, our dataset varies for the selected developing countries due to late registration on MSCI index. Our sample includes: Czech and Hungary (January 1995 to December 2017), Croatia and Slovenia (June 2002 to December 2017), Bulgaria (June 2005 to December 2017), Ukrain (June 2006 to December 2017), and Serbia (June 2008 to December 2017)]. However, the complete dataset was available for Poland and Portugal.
Examining spillover effect of US… / M. Zubair Mumtaz, Z. Alexander Smith 97
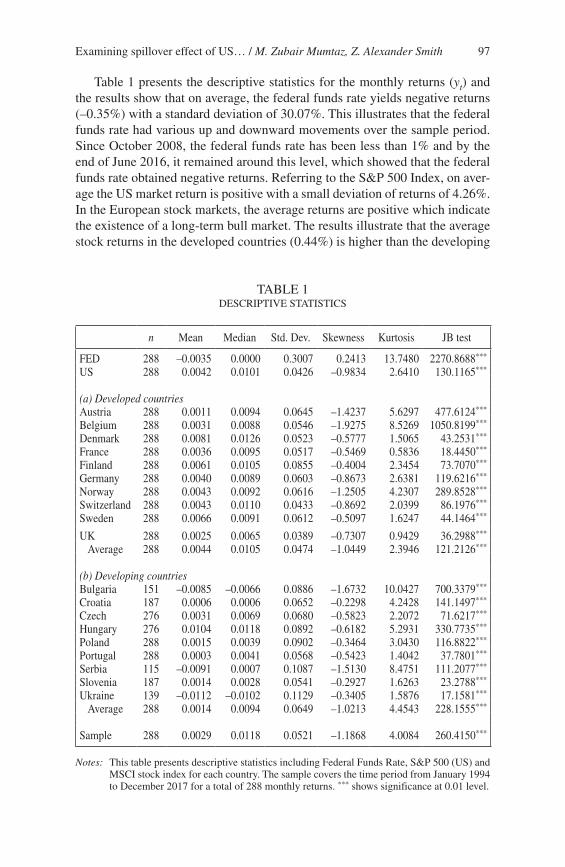
Table 1 presents the descriptive statistics for the monthly returns (yt) and the results show that on average, the federal funds rate yields negative returns (–0.35%) with a standard deviation of 30.07%. This illustrates that the federal funds rate had various up and downward movements over the sample period. Since October 2008, the federal funds rate has been less than 1% and by the end of June 2016, it remained around this level, which showed that the federal funds rate obtained negative returns. Referring to the S&P 500 Index, on aver-age the US market return is positive with a small deviation of returns of 4.26%. In the European stock markets, the average returns are positive which indicate the existence of a long-term bull market. The results illustrate that the average stock returns in the developed countries (0.44%) is higher than the developing
TABLE 1DESCRIPTIVE STATISTICS
n Mean Median Std. Dev. Skewness Kurtosis JB test
FED 288 –0.0035 0.0000 0.3007 0.2413 13.7480 2270.8688***
US 288 0.0042 0.0101 0.0426 –0.9834 2.6410 130.1165***
(a) Developed countriesAustria 288 0.0011 0.0094 0.0645 –1.4237 5.6297 477.6124***
Belgium 288 0.0031 0.0088 0.0546 –1.9275 8.5269 1050.8199***
Denmark 288 0.0081 0.0126 0.0523 –0.5777 1.5065 43.2531***
France 288 0.0036 0.0095 0.0517 –0.5469 0.5836 18.4450***
Finland 288 0.0061 0.0105 0.0855 –0.4004 2.3454 73.7070***
Germany 288 0.0040 0.0089 0.0603 –0.8673 2.6381 119.6216***
Norway 288 0.0043 0.0092 0.0616 –1.2505 4.2307 289.8528***
Switzerland 288 0.0043 0.0110 0.0433 –0.8692 2.0399 86.1976***
Sweden 288 0.0066 0.0091 0.0612 –0.5097 1.6247 44.1464***
UK 288 0.0025 0.0065 0.0389 –0.7307 0.9429 36.2988***
Average 288 0.0044 0.0105 0.0474 –1.0449 2.3946 121.2126***
(b) Developing countriesBulgaria 151 –0.0085 –0.0066 0.0886 –1.6732 10.0427 700.3379***
Croatia 187 0.0006 0.0006 0.0652 –0.2298 4.2428 141.1497***
Czech 276 0.0031 0.0069 0.0680 –0.5823 2.2072 71.6217***
Hungary 276 0.0104 0.0118 0.0892 –0.6182 5.2931 330.7735***
Poland 288 0.0015 0.0039 0.0902 –0.3464 3.0430 116.8822***
Portugal 288 0.0003 0.0041 0.0568 –0.5423 1.4042 37.7801***
Serbia 115 –0.0091 0.0007 0.1087 –1.5130 8.4751 111.2077***
Slovenia 187 0.0014 0.0028 0.0541 –0.2927 1.6263 23.2788***
Ukraine 139 –0.0112 –0.0102 0.1129 –0.3405 1.5876 17.1581***
Average 288 0.0014 0.0094 0.0649 –1.0213 4.4543 228.1555***
Sample 288 0.0029 0.0118 0.0521 –1.1868 4.0084 260.4150***
Notes: This table presents descriptive statistics including Federal Funds Rate, S&P 500 (US) and MSCI stock index for each country. The sample covers the time period from January 1994 to December 2017 for a total of 288 monthly returns. *** shows significance at 0.01 level.
Estudios de Economía, Vol. 46 - Nº 198
countries (0.14%). The deviation of returns in developed countries (4.74%) are lower than developing countries (6.49%) which illustrates that there is higher volatility of stock returns in developing countries. On average, Bulgarian, Serbian, and Ukrainian stock indices obtained negative returns. The highest returns were generated by the Hungarian Stock Market (1.04%) whereas the highest volatility of returns were registered by Ukrainian Stock Market (11.29%). The negative skewness of stock returns in all the cases show negative returns in most of the instances. The results of the Jarque-Bera (JB) test suggest that the null hypothesis of a normal distribution is rejected in all the cases.
Appendix 1 provides a correlation matrix for the monthly returns (yt). The results illustrate a positive correlation between the US Stock Market and the Federal Funds Rate, between the US Stock Market and the European Stock Market, and between the Federal Funds Rate and the European Stock Market. These results corroborate with the general economic theory suggesting that when the Federal Reserve decreases its interest rate, outside financial markets consider it as a favorable news. Hence, the positive association between the US and selected European stock markets suggest that excess liquidity from the US has a positive effect on these European stock markets. On a single instance, we find the evidence of a negative correlation between the Federal Funds Rate and the Polish stock market.
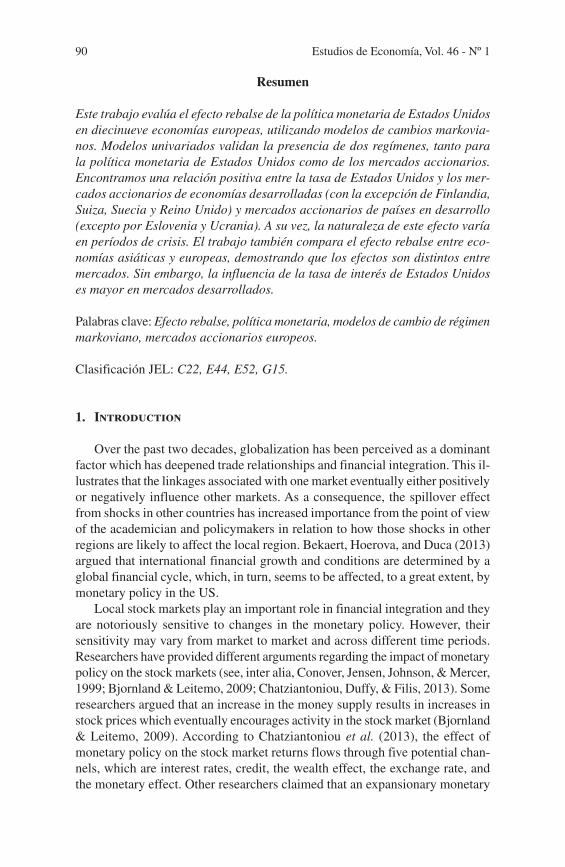
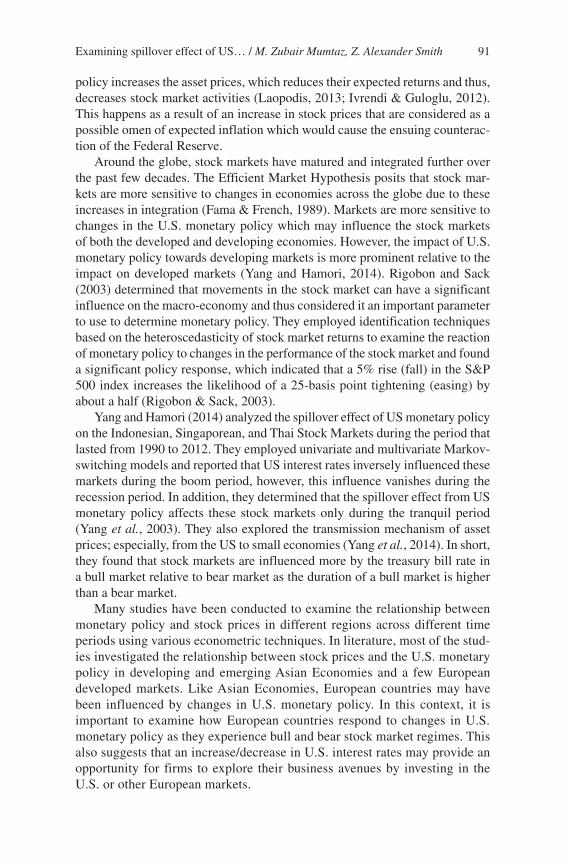
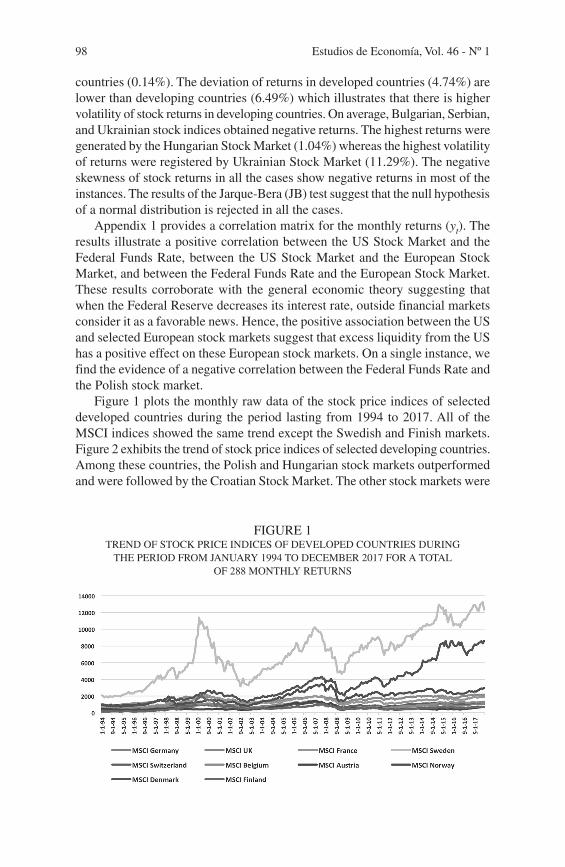
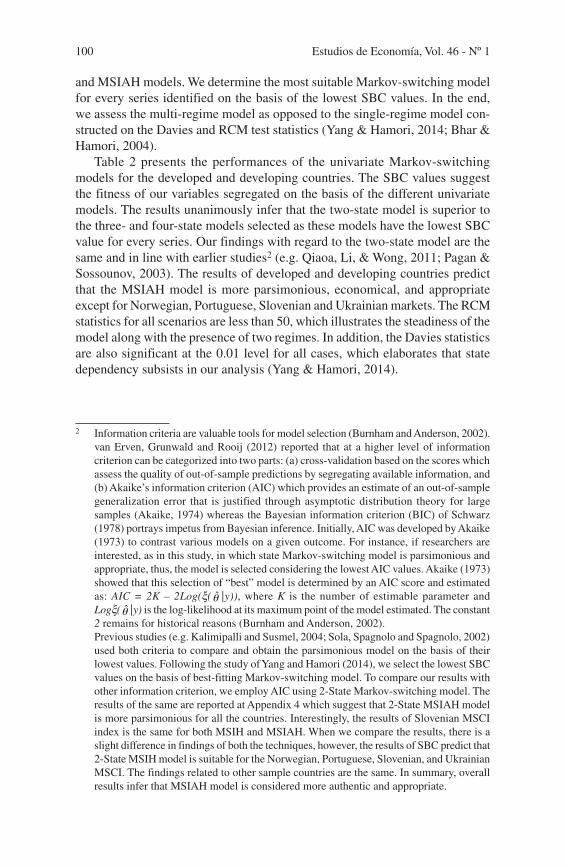
Figure 1 plots the monthly raw data of the stock price indices of selected developed countries during the period lasting from 1994 to 2017. All of the MSCI indices showed the same trend except the Swedish and Finish markets. Figure 2 exhibits the trend of stock price indices of selected developing countries. Among these countries, the Polish and Hungarian stock markets outperformed and were followed by the Croatian Stock Market. The other stock markets were
FIGURE 1TREND OF STOCK PRICE INDICES OF DEVELOPED COUNTRIES DURING
THE PERIOD FROM JANUARY 1994 TO DECEMBER 2017 FOR A TOTAL OF 288 MONTHLY RETURNS

Examining spillover effect of US… / M. Zubair Mumtaz, Z. Alexander Smith 99
the worst performers in the sample. All the stock markets showed a dip during the 2007/08 period, which illustrates that the financial crisis affected them. Comparing the shocks, the financial crisis occurred during 1997/98 may have had less of an effect on these stock markets.
To assess the unit roots, we apply the Augmented Dickey-Fuller (ADF) test without an intercept. The data of all the stock prices are in return form (i.e. stock indices return = ln(Pt+1) – ln(Pt). Appendix 2 presents the results of the ADF unit root test. In all the cases, we reject the null hypothesis of a unit root which illustrates that the data is stationary for the stock indices and federal fund rate. To further strengthen our analysis, we emphasize the use of the Johansen cointegration test for examining the relationship between the federal funds rate and the respective stock index to examine whether they are cointegrated or not. Appendix 3 exhibits the results of cointegration test which illustrates that trace statistics in all the cases are more than the critical value (i.e. 3.76) and indicate that no cointegration vector exists between the series. This finding implies that there is no need to apply a vector error correction model (VECM) as cointegra-tion is non-existent.
5. Empirical Results
5.1. Regime for the marginal distributions
First, we examine whether there is any sign of regime-switching behaviors for US monetary policy and the European stock markets. To achieve this, we segregate every series by fixing a range of two-, three-, and four-regime MSIH
FIGURE 2TREND OF STOCK PRICE INDICES OF DEVELOPING COUNTRIES DURING
THE PERIOD FROM JANUARY 1994 TO DECEMBER 2017 FOR A TOTAL OF 288 MONTHLY RETURNS
Estudios de Economía, Vol. 46 - Nº 1100
and MSIAH models. We determine the most suitable Markov-switching model for every series identified on the basis of the lowest SBC values. In the end, we assess the multi-regime model as opposed to the single-regime model con-structed on the Davies and RCM test statistics (Yang & Hamori, 2014; Bhar & Hamori, 2004).
Table 2 presents the performances of the univariate Markov-switching models for the developed and developing countries. The SBC values suggest the fitness of our variables segregated on the basis of the different univariate models. The results unanimously infer that the two-state model is superior to the three- and four-state models selected as these models have the lowest SBC value for every series. Our findings with regard to the two-state model are the same and in line with earlier studies2 (e.g. Qiaoa, Li, & Wong, 2011; Pagan & Sossounov, 2003). The results of developed and developing countries predict that the MSIAH model is more parsimonious, economical, and appropriate except for Norwegian, Portuguese, Slovenian and Ukrainian markets. The RCM statistics for all scenarios are less than 50, which illustrates the steadiness of the model along with the presence of two regimes. In addition, the Davies statistics are also significant at the 0.01 level for all cases, which elaborates that state dependency subsists in our analysis (Yang & Hamori, 2014).
2 Information criteria are valuable tools for model selection (Burnham and Anderson, 2002). van Erven, Grunwald and Rooij (2012) reported that at a higher level of information criterion can be categorized into two parts: (a) cross-validation based on the scores which assess the quality of out-of-sample predictions by segregating available information, and (b) Akaike’s information criterion (AIC) which provides an estimate of an out-of-sample generalization error that is justified through asymptotic distribution theory for large samples (Akaike, 1974) whereas the Bayesian information criterion (BIC) of Schwarz (1978) portrays impetus from Bayesian inference. Initially, AIC was developed by Akaike (1973) to contrast various models on a given outcome. For instance, if researchers are interested, as in this study, in which state Markov-switching model is parsimonious and appropriate, thus, the model is selected considering the lowest AIC values. Akaike (1973) showed that this selection of “best” model is determined by an AIC score and estimated as: AIC = 2K – 2Log(x( θ̂ |y)), where K is the number of estimable parameter and Logx( θ̂ |y) is the log-likelihood at its maximum point of the model estimated. The constant 2 remains for historical reasons (Burnham and Anderson, 2002).
Previous studies (e.g. Kalimipalli and Susmel, 2004; Sola, Spagnolo and Spagnolo, 2002) used both criteria to compare and obtain the parsimonious model on the basis of their lowest values. Following the study of Yang and Hamori (2014), we select the lowest SBC values on the basis of best-fitting Markov-switching model. To compare our results with other information criterion, we employ AIC using 2-State Markov-switching model. The results of the same are reported at Appendix 4 which suggest that 2-State MSIAH model is more parsimonious for all the countries. Interestingly, the results of Slovenian MSCI index is the same for both MSIH and MSIAH. When we compare the results, there is a slight difference in findings of both the techniques, however, the results of SBC predict that 2-State MSIH model is suitable for the Norwegian, Portuguese, Slovenian, and Ukrainian MSCI. The findings related to other sample countries are the same. In summary, overall results infer that MSIAH model is considered more authentic and appropriate.

Examining spillover effect of US… / M. Zubair Mumtaz, Z. Alexander Smith 101
TABLE 2PERFORMANCE MEASURES FOR UNIVARIATE MARKOV SWITCHING MODELS
SBC values RCM statistics and Davies test
2-State MSIH
2-State MSIAH
3-State MSIH
3-State MSIAH
4-State MSIH
4-State MISAH
RCM statistics
Davies test
FED 0.261 –1.083 –0.233 –1.077 –0.432 –1.031 19.114 0.000US –3.520 –3.597 –0.106 –3.521 –3.414 –3.375 21.760 0.000
(b) Developed countries 0.000Austria –2.768 –2.796 –2.689 –2.720 –2.573 –2.562 11.723 0.000Belgium –3.155 –3.221 –3.135 –3.124 –3.048 –3.005 10.748 0.000Denmark –3.052 –3.075 –2.979 –3.002 –2.865 –2.848 37.192 0.000France –3.083 –3.115 –3.049 –3.028 –2.953 –2.938 33.240 0.000Finland –2.055 –2.209 –2.031 –2.201 –1.825 –1.966 21.002 0.000Germany –2.083 –2.871 –2.714 –2.772 –2.641 –2.705 30.422 0.000Norway –2.838 –2.829 –2.754 –2.766 –2.666 –2.651 13.892 0.000Switzerland –3.476 –3.502 –3.433 –3.422 –3.234 –3.321 40.910 0.000Sweden –2.762 –2.867 –2.711 –2.785 –2.609 –2.669 30.500 0.000UK –3.569 –3.710 –3.605 –3.652 –3.509 –3.487 29.868 0.000 Average –3.329 –3.382 –3.273 –3.310 –3.167 –3.131 34.554 0.000
(b) Developing countries 0.000Bulgaria –2.227 –2.295 –2.138 –2.188 –1.980 –2.030 34.936 0.000Croatia –2.628 –2.758 –2.488 –2.673 –2.399 –2.519 43.140 0.000Czech –2.440 –2.527 –2.467 –2.435 –2.337 –2.274 23.687 0.000Hungary –2.001 –2.045 –1.929 –1.937 –1.784 –1.785 24.815 0.000Poland –1.947 –2.115 –1.957 –2.045 –1.840 –1.893 12.596 0.000Portugal –2.874 –2.868 –2.814 –2.777 –2.609 –2.734 46.231 0.000Serbia –1.768 –2.019 –1.628 –1.871 –1.623 –1.612 37.857 0.000Slovenia –2.983 –2.966 –2.869 –2.836 –2.711 –2.637 16.940 0.000Ukraine –1.458 –1.455 –1.372 –1.307 –1.054 –1.083 37.982 0.000 Average –2.696 –2.824 –2.638 –2.759 –2.542 –2.615 30.177 0.000
Sample –3.124 –3.206 –3.132 –3.148 –2.906 –3.024 41.160 0.000
Notes: Performance measures are evaluated using univariate Markov switching models. The sample period is considered from January 1994 to December 2017 for a total of 288 monthly re-turns. Federal Funds Rate, S&P 500 (US), and MSCI stock index for selected developed and developing European countries. We select Schwarz Bayesian Criterion (SBC) values to identify the best-fitting Markov-switching models and their lowest values are presented in bold. Davies test statistics are reported as p-values.
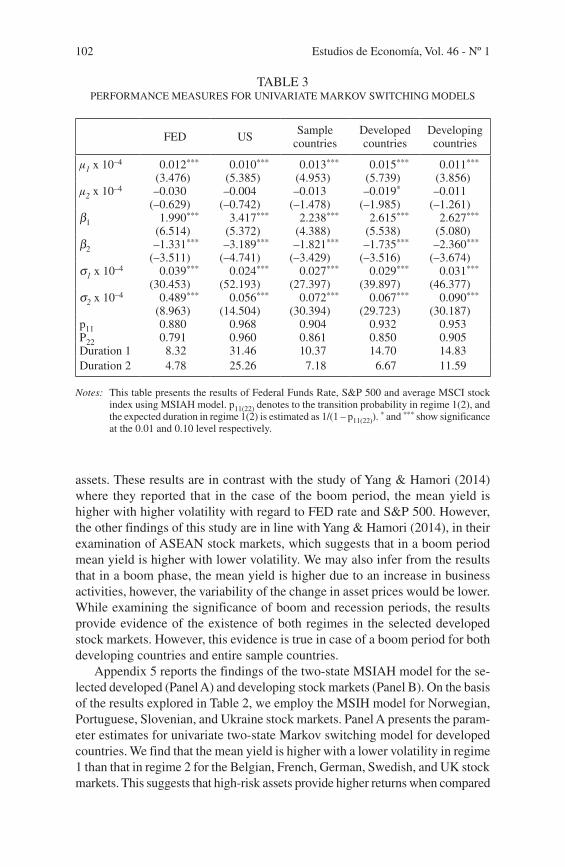
Table 3 reports the findings of the two-state MSIAH model for the federal funds rate, US Stock Market, entire sample, developed, and developing stock markets. In all the cases, regime 1 refers to the boom phase and regime 2 shows the recessionary phase of the economy. When we analyze the results, the mean yield is higher with lower volatility in regime 1 as compared to regime 2 which illustrates that bonds offer higher returns when compared against the low-risk
Estudios de Economía, Vol. 46 - Nº 1102
TABLE 3PERFORMANCE MEASURES FOR UNIVARIATE MARKOV SWITCHING MODELS
FED US Sample countries
Developed countries
Developing countries
μ1 x 10⁻⁴ 0.012***
(3.476)0.010***
(5.385)0.013***
(4.953)0.015***
(5.739)0.011***
(3.856)μ2 x 10⁻⁴ –0.030
(–0.629)–0.004
(–0.742)–0.013
(–1.478)–0.019*
(–1.985)–0.011
(–1.261)β1 1.990***
(6.514)3.417***
(5.372)2.238***
(4.388)2.615***
(5.538)2.627***
(5.080)β2 –1.331***
(–3.511)–3.189***
(–4.741)–1.821***
(–3.429)–1.735***
(–3.516)–2.360***
(–3.674)σ1 x 10⁻⁴ 0.039***
(30.453)0.024***
(52.193)0.027***
(27.397)0.029***
(39.897)0.031***
(46.377)σ2 x 10⁻⁴ 0.489***
(8.963)0.056***
(14.504)0.072***
(30.394)0.067***
(29.723)0.090***
(30.187)p11 0.880 0.968 0.904 0.932 0.953P22 0.791 0.960 0.861 0.850 0.905Duration 1 8.32 31.46 10.37 14.70 14.83Duration 2 4.78 25.26 7.18 6.67 11.59
Notes: This table presents the results of Federal Funds Rate, S&P 500 and average MSCI stock index using MSIAH model. p11(22) denotes to the transition probability in regime 1(2), and the expected duration in regime 1(2) is estimated as 1/(1 – p11(22)).
* and *** show significance at the 0.01 and 0.10 level respectively.
assets. These results are in contrast with the study of Yang & Hamori (2014) where they reported that in the case of the boom period, the mean yield is higher with higher volatility with regard to FED rate and S&P 500. However, the other findings of this study are in line with Yang & Hamori (2014), in their examination of ASEAN stock markets, which suggests that in a boom period mean yield is higher with lower volatility. We may also infer from the results that in a boom phase, the mean yield is higher due to an increase in business activities, however, the variability of the change in asset prices would be lower. While examining the significance of boom and recession periods, the results provide evidence of the existence of both regimes in the selected developed stock markets. However, this evidence is true in case of a boom period for both developing countries and entire sample countries.
Appendix 5 reports the findings of the two-state MSIAH model for the se-lected developed (Panel A) and developing stock markets (Panel B). On the basis of the results explored in Table 2, we employ the MSIH model for Norwegian, Portuguese, Slovenian, and Ukraine stock markets. Panel A presents the param-eter estimates for univariate two-state Markov switching model for developed countries. We find that the mean yield is higher with a lower volatility in regime 1 than that in regime 2 for the Belgian, French, German, Swedish, and UK stock markets. This suggests that high-risk assets provide higher returns when compared
Examining spillover effect of US… / M. Zubair Mumtaz, Z. Alexander Smith 103
against low-risk assets but their volatility is lower. Here, regime 2 refers to the recessionary phase of the economy where the low-risk assets (e.g. bonds) offer lower returns but their volatility is high; however, these findings do not carry over to the Austrian, Danish, Finnish, Norwegian, and Swiss stock markets. This is because all of these stock markets have negative returns in regime 1 and positive returns in regime 2. In addition, the volatility of these stock markets are lower in regime 2 which illustrates that the economies are undergoing stable growth. The findings of the univariate model considering developing countries are exhibited at Panel B-Appendix 5. For instance, the Czech Stock Market provides higher returns in regime 2 relative to Polish markets in which higher returns are obtained in regime 1. These inflated returns are, thus, obtained during the boom period. The results of Portuguese, Slovenian, and Ukraine stock markets are evaluated using a two-state MSIH model. We find that the mean returns are higher with lower volatility in regime 1 when compared to regime 2 for the Hungarian Stock Market. Economically, these states are translated as regime 2 which reflects that during the recessionary phase the low-risk assets provide higher returns than high-risk assets. The lower volatility in regime 1 posits that the economy is getting consistent growth. The Slovenian Stock Market obtains negative and insignificant returns with higher volatility in regime 2. In most instances, our findings are consistent with the earlier study conducted by Yang and Hamori (2014) wherein they examined the spillover impact of US Monetary Policy to ASEAN stock markets including Indonesia, Singapore, and Thailand. The results of all three countries reported higher mean returns with lower volatility in regime 2. The results infer that Asian stock markets considered in the above study may have the same characteristics and behaviors in their pattern of returns.
The estimated transition probabilities and their corresponding expected duration are reported in Table 3. On the basis of the findings, it also reflects that the duration of a bull market is much longer than bear market periods for all the sample countries except for the UK and Polish stock indices. This shows that the stock market in the US explores excess liquidity which acts as a crucial factor in driving the increase in asset prices. The interpretation of this finding is that the state-dependent models appropriately measure our specified model, which indicate that the growth rate of the money supply is inconsistent. Mainly, the high growth rate of the money supply always carries surplus liquidity, which simply forces the asset prices to increase. Our empirical results reveal that the mean yield in regime 2 for the US Stock Market is lower than regime 1. As regime 2 shows the catastrophe period for the US economy, the typical role of the Federal Reserve becomes more important, that is, to constantly provide liquidity for the acceleration of the economy. It is a general phenomenon that the injection of capital constantly follows a higher return and will flow to other markets as the domestic market will offer a lower return if the economy is not growing. The higher duration of the bull market when compared against the bear market indicates that there is a surge of capital flows in the boom period from both the developed and developing economies; however, any adverse effect will force the investors to explore overseas business avenues to earn higher returns

Estudios de Economía, Vol. 46 - Nº 1104
as domestic markets are not feasible. The findings of this study are in line with earlier studies (Yang & Hamori, 2014).
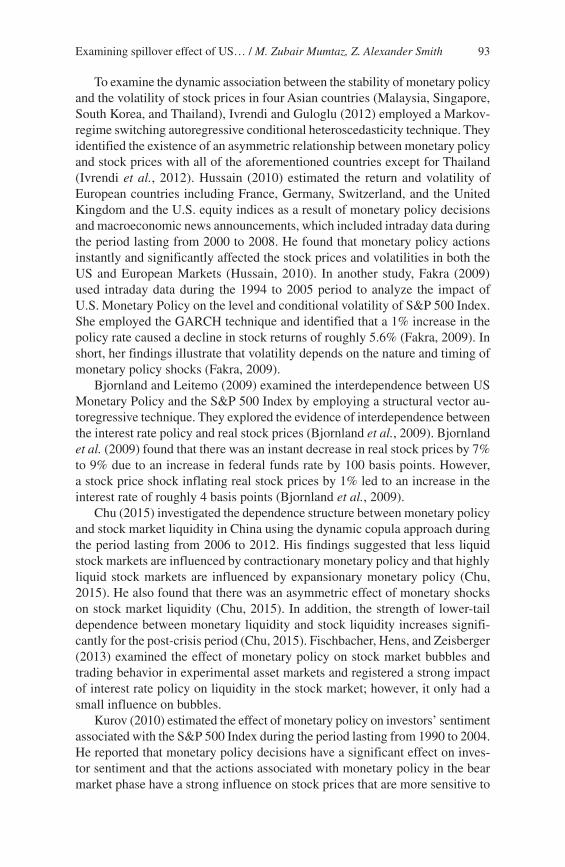
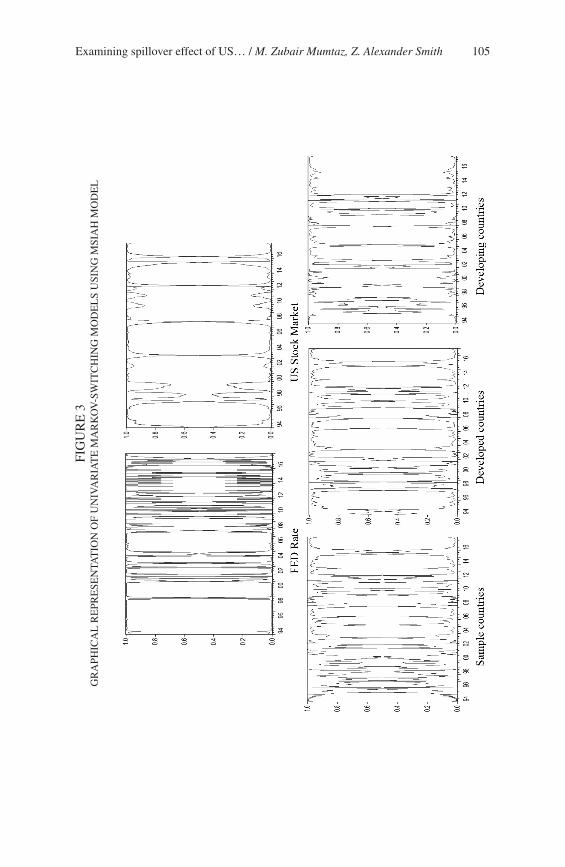
To explain the market movements, Figure 3 exhibits the transition prob-abilities for both regimes. During the time horizon of the study, crisis periods include: (a) Asian currency crisis in 1999 and (b) the international financial crisis in 2008. Moreover, the diagrams illustrate a larger impact of these crises on the European countries. If we compare these figures with Yang & Hamori (2014), the effect of these crises on the ASEAN countries were smaller. This illustrates that the size of the economy matters as an association of higher busi-ness activities with the US may have a higher probability of influencing business activities in these countries, which could lead to crisis. Appendix 6 plots the transition probability of all the sample countries. In the case of the US Stock Market, the effect of the international financial crisis is also higher as regime 2 indicates a bear market resulting in a reduction of business activities due to a reduction in the money supply.
Considering the above results, we identify a number of factors that can be considered in the light of the market movements and business cycles: (a) ex-ploration of two-states for each variable, which would classify the behavior of stock market into either bear or bull market, (b) identification of the duration of specific regimes, (c) the volatility is lower in the economic expansion regime, which is also prevalent in the case of all selected developed and developing countries, (d) the effect of the international financial crisis on the US Stock Market is greater than the Asian Crisis, and (e) the US monetary policy also has generated prolonged cycles, after the crisis that occurred in 2008. This illustrates that the spillover effect from the excess liquidity is considered an issue of inter-est. It all depends upon the influence of US Monetary Policy on the respective stock market. Some economies may be influenced more by changes in the US Federal Funds Rate; however, all the countries in all sample are affected by changes in the interest rate.
5.2. Regime for the joint distributions
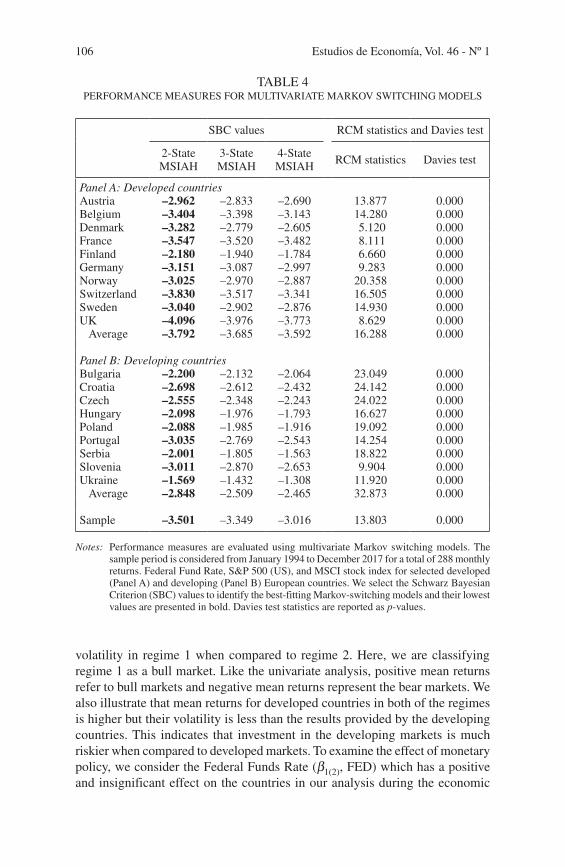
Now we examine the impact of the Federal Funds Rate and excess liquidity on the selected European stock markets by incorporating the US factors into the Markov-switching model. Following the same technique, we chose the best fitting MSIAH model selected on the basis of their SBC values and assess its appropriateness using the Davis and RCM test statistics. Table 4 reports the results of a multivariate Markov-switching model illustrating that all the sta-tistics show the two-state MSIAH model is the best fitting model in all of the scenarios. Considering the earlier studies (e.g. Yang & Hamori, 2014; Pagan & Sossounov, 2003), we understand that the two-state model specifies adequate analysis for our model.
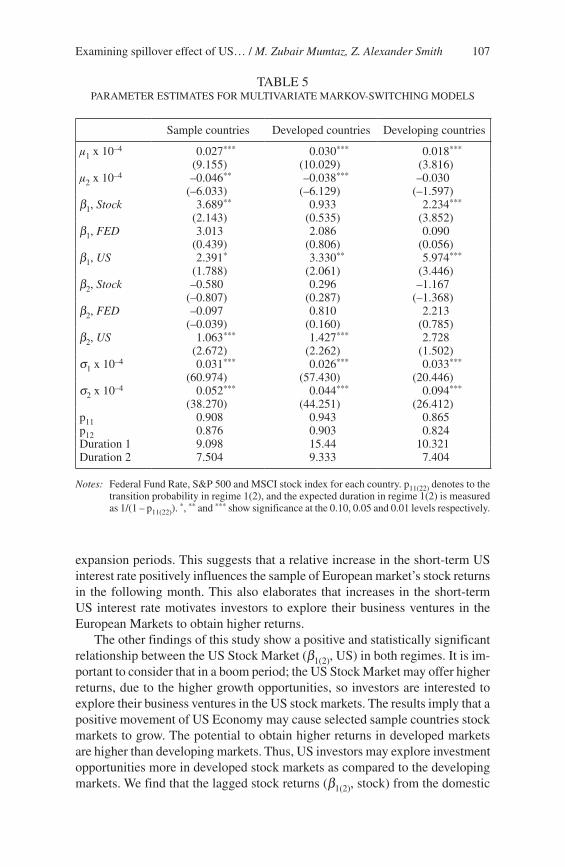
Table 5 demonstrates the estimation results of the entire sample, developed and developing countries using multivariate Markov-switching model. In all of the empirical findings, the results report higher mean returns with lower
Examining spillover effect of US… / M. Zubair Mumtaz, Z. Alexander Smith 105
FIG
UR
E 3
GR
APH
ICA
L R
EPR
ESE
NTA
TIO
N O
F U
NIV
AR
IAT
E M
AR
KO
V-S
WIT
CH
ING
MO
DE
LS
USI
NG
MSI
AH
MO
DE
L
Estudios de Economía, Vol. 46 - Nº 1106
TABLE 4PERFORMANCE MEASURES FOR MULTIVARIATE MARKOV SWITCHING MODELS
SBC values RCM statistics and Davies test
2-State MSIAH
3-State MSIAH
4-State MSIAH RCM statistics Davies test
Panel A: Developed countriesAustria –2.962 –2.833 –2.690 13.877 0.000Belgium –3.404 –3.398 –3.143 14.280 0.000Denmark –3.282 –2.779 –2.605 5.120 0.000France –3.547 –3.520 –3.482 8.111 0.000Finland –2.180 –1.940 –1.784 6.660 0.000Germany –3.151 –3.087 –2.997 9.283 0.000Norway –3.025 –2.970 –2.887 20.358 0.000Switzerland –3.830 –3.517 –3.341 16.505 0.000Sweden –3.040 –2.902 –2.876 14.930 0.000UK –4.096 –3.976 –3.773 8.629 0.000 Average –3.792 –3.685 –3.592 16.288 0.000
Panel B: Developing countriesBulgaria –2.200 –2.132 –2.064 23.049 0.000Croatia –2.698 –2.612 –2.432 24.142 0.000Czech –2.555 –2.348 –2.243 24.022 0.000Hungary –2.098 –1.976 –1.793 16.627 0.000Poland –2.088 –1.985 –1.916 19.092 0.000Portugal –3.035 –2.769 –2.543 14.254 0.000Serbia –2.001 –1.805 –1.563 18.822 0.000Slovenia –3.011 –2.870 –2.653 9.904 0.000Ukraine –1.569 –1.432 –1.308 11.920 0.000 Average –2.848 –2.509 –2.465 32.873 0.000
Sample –3.501 –3.349 –3.016 13.803 0.000
Notes: Performance measures are evaluated using multivariate Markov switching models. The sample period is considered from January 1994 to December 2017 for a total of 288 monthly returns. Federal Fund Rate, S&P 500 (US), and MSCI stock index for selected developed (Panel A) and developing (Panel B) European countries. We select the Schwarz Bayesian Criterion (SBC) values to identify the best-fitting Markov-switching models and their lowest values are presented in bold. Davies test statistics are reported as p-values.
volatility in regime 1 when compared to regime 2. Here, we are classifying regime 1 as a bull market. Like the univariate analysis, positive mean returns refer to bull markets and negative mean returns represent the bear markets. We also illustrate that mean returns for developed countries in both of the regimes is higher but their volatility is less than the results provided by the developing countries. This indicates that investment in the developing markets is much riskier when compared to developed markets. To examine the effect of monetary policy, we consider the Federal Funds Rate (β1(2), FED) which has a positive and insignificant effect on the countries in our analysis during the economic
Examining spillover effect of US… / M. Zubair Mumtaz, Z. Alexander Smith 107
expansion periods. This suggests that a relative increase in the short-term US interest rate positively influences the sample of European market’s stock returns in the following month. This also elaborates that increases in the short-term US interest rate motivates investors to explore their business ventures in the European Markets to obtain higher returns.
The other findings of this study show a positive and statistically significant relationship between the US Stock Market (β1(2), US) in both regimes. It is im-portant to consider that in a boom period; the US Stock Market may offer higher returns, due to the higher growth opportunities, so investors are interested to explore their business ventures in the US stock markets. The results imply that a positive movement of US Economy may cause selected sample countries stock markets to grow. The potential to obtain higher returns in developed markets are higher than developing markets. Thus, US investors may explore investment opportunities more in developed stock markets as compared to the developing markets. We find that the lagged stock returns (β1(2), stock) from the domestic
TABLE 5PARAMETER ESTIMATES FOR MULTIVARIATE MARKOV-SWITCHING MODELS
Sample countries Developed countries Developing countries
μ1 x 10⁻⁴ 0.027***
(9.155)0.030***
(10.029)0.018***
(3.816)μ2 x 10⁻⁴ –0.046**
(–6.033)–0.038***
(–6.129)–0.030
(–1.597)β1, Stock 3.689**
(2.143)0.933
(0.535)2.234***
(3.852)β1, FED 3.013
(0.439)2.086
(0.806)0.090
(0.056)β1, US 2.391*
(1.788)3.330**
(2.061)5.974***
(3.446)β2, Stock –0.580
(–0.807)0.296
(0.287)–1.167
(–1.368)β2, FED –0.097
(–0.039)0.810
(0.160)2.213
(0.785)β2, US 1.063***
(2.672)1.427***
(2.262)2.728
(1.502)σ1 x 10⁻⁴ 0.031***
(60.974)0.026***
(57.430)0.033***
(20.446)σ2 x 10⁻⁴ 0.052***
(38.270)0.044***
(44.251)0.094***
(26.412)p11 0.908 0.943 0.865p12 0.876 0.903 0.824Duration 1 9.098 15.44 10.321Duration 2 7.504 9.333 7.404
Notes: Federal Fund Rate, S&P 500 and MSCI stock index for each country. p11(22) denotes to the transition probability in regime 1(2), and the expected duration in regime 1(2) is measured as 1/(1 – p11(22)).
*, ** and *** show significance at the 0.10, 0.05 and 0.01 levels respectively.
Estudios de Economía, Vol. 46 - Nº 1108
market are significant and well warranted in regime 1 except in developed markets. However, lagged stock returns are insignificant in regime 2 in all the cases. In nutshell, we may infer that the spillover effect from US Monetary Policy plays a pivotal role in determining the asset prices in the European stock markets. However, the effect of US monetary policy varies between developed and developing markets.
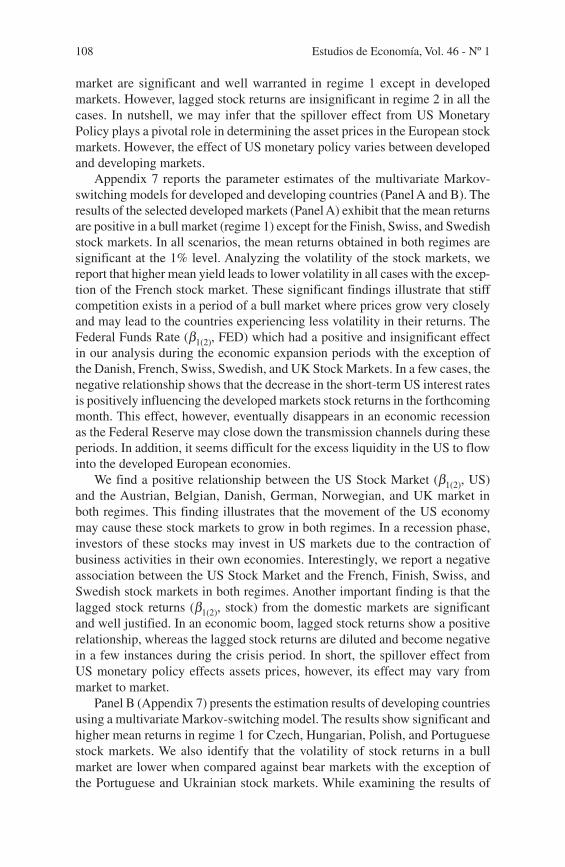
Appendix 7 reports the parameter estimates of the multivariate Markov-switching models for developed and developing countries (Panel A and B). The results of the selected developed markets (Panel A) exhibit that the mean returns are positive in a bull market (regime 1) except for the Finish, Swiss, and Swedish stock markets. In all scenarios, the mean returns obtained in both regimes are significant at the 1% level. Analyzing the volatility of the stock markets, we report that higher mean yield leads to lower volatility in all cases with the excep-tion of the French stock market. These significant findings illustrate that stiff competition exists in a period of a bull market where prices grow very closely and may lead to the countries experiencing less volatility in their returns. The Federal Funds Rate (β1(2), FED) which had a positive and insignificant effect in our analysis during the economic expansion periods with the exception of the Danish, French, Swiss, Swedish, and UK Stock Markets. In a few cases, the negative relationship shows that the decrease in the short-term US interest rates is positively influencing the developed markets stock returns in the forthcoming month. This effect, however, eventually disappears in an economic recession as the Federal Reserve may close down the transmission channels during these periods. In addition, it seems difficult for the excess liquidity in the US to flow into the developed European economies.
We find a positive relationship between the US Stock Market (β1(2), US) and the Austrian, Belgian, Danish, German, Norwegian, and UK market in both regimes. This finding illustrates that the movement of the US economy may cause these stock markets to grow in both regimes. In a recession phase, investors of these stocks may invest in US markets due to the contraction of business activities in their own economies. Interestingly, we report a negative association between the US Stock Market and the French, Finish, Swiss, and Swedish stock markets in both regimes. Another important finding is that the lagged stock returns (β1(2), stock) from the domestic markets are significant and well justified. In an economic boom, lagged stock returns show a positive relationship, whereas the lagged stock returns are diluted and become negative in a few instances during the crisis period. In short, the spillover effect from US monetary policy effects assets prices, however, its effect may vary from market to market.
Panel B (Appendix 7) presents the estimation results of developing countries using a multivariate Markov-switching model. The results show significant and higher mean returns in regime 1 for Czech, Hungarian, Polish, and Portuguese stock markets. We also identify that the volatility of stock returns in a bull market are lower when compared against bear markets with the exception of the Portuguese and Ukrainian stock markets. While examining the results of
Examining spillover effect of US… / M. Zubair Mumtaz, Z. Alexander Smith 109
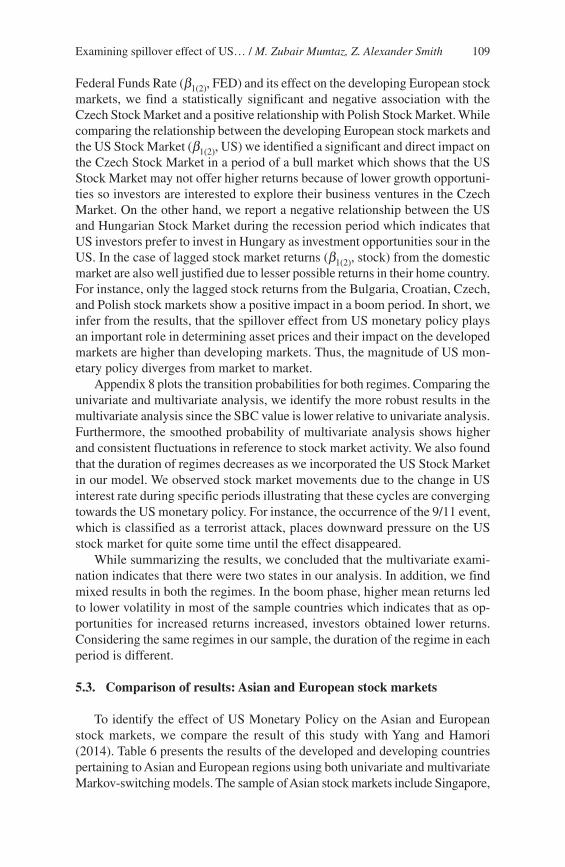
Federal Funds Rate (β1(2), FED) and its effect on the developing European stock markets, we find a statistically significant and negative association with the Czech Stock Market and a positive relationship with Polish Stock Market. While comparing the relationship between the developing European stock markets and the US Stock Market (β1(2), US) we identified a significant and direct impact on the Czech Stock Market in a period of a bull market which shows that the US Stock Market may not offer higher returns because of lower growth opportuni-ties so investors are interested to explore their business ventures in the Czech Market. On the other hand, we report a negative relationship between the US and Hungarian Stock Market during the recession period which indicates that US investors prefer to invest in Hungary as investment opportunities sour in the US. In the case of lagged stock market returns (β1(2), stock) from the domestic market are also well justified due to lesser possible returns in their home country. For instance, only the lagged stock returns from the Bulgaria, Croatian, Czech, and Polish stock markets show a positive impact in a boom period. In short, we infer from the results, that the spillover effect from US monetary policy plays an important role in determining asset prices and their impact on the developed markets are higher than developing markets. Thus, the magnitude of US mon-etary policy diverges from market to market.
Appendix 8 plots the transition probabilities for both regimes. Comparing the univariate and multivariate analysis, we identify the more robust results in the multivariate analysis since the SBC value is lower relative to univariate analysis. Furthermore, the smoothed probability of multivariate analysis shows higher and consistent fluctuations in reference to stock market activity. We also found that the duration of regimes decreases as we incorporated the US Stock Market in our model. We observed stock market movements due to the change in US interest rate during specific periods illustrating that these cycles are converging towards the US monetary policy. For instance, the occurrence of the 9/11 event, which is classified as a terrorist attack, places downward pressure on the US stock market for quite some time until the effect disappeared.
While summarizing the results, we concluded that the multivariate exami-nation indicates that there were two states in our analysis. In addition, we find mixed results in both the regimes. In the boom phase, higher mean returns led to lower volatility in most of the sample countries which indicates that as op-portunities for increased returns increased, investors obtained lower returns. Considering the same regimes in our sample, the duration of the regime in each period is different.
5.3. Comparison of results: Asian and European stock markets
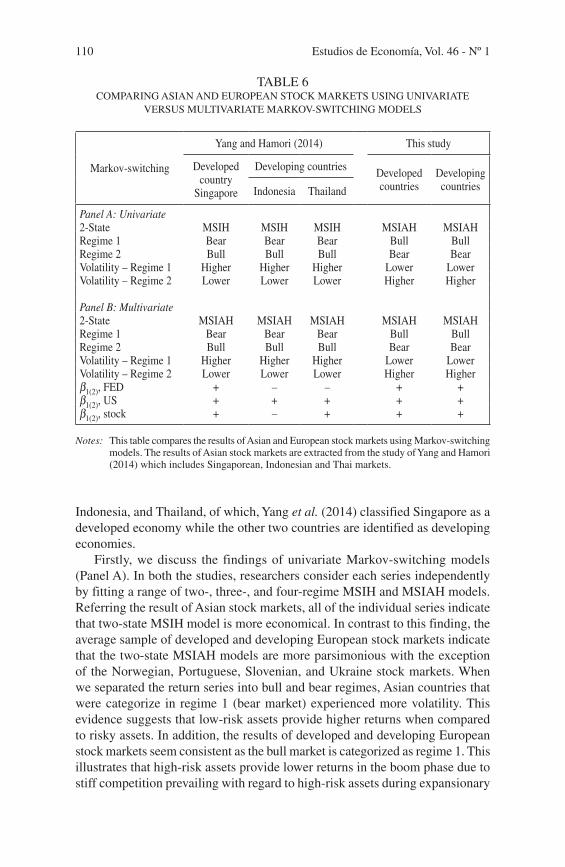
To identify the effect of US Monetary Policy on the Asian and European stock markets, we compare the result of this study with Yang and Hamori (2014). Table 6 presents the results of the developed and developing countries pertaining to Asian and European regions using both univariate and multivariate Markov-switching models. The sample of Asian stock markets include Singapore,
Estudios de Economía, Vol. 46 - Nº 1110
Indonesia, and Thailand, of which, Yang et al. (2014) classified Singapore as a developed economy while the other two countries are identified as developing economies.
Firstly, we discuss the findings of univariate Markov-switching models (Panel A). In both the studies, researchers consider each series independently by fitting a range of two-, three-, and four-regime MSIH and MSIAH models. Referring the result of Asian stock markets, all of the individual series indicate that two-state MSIH model is more economical. In contrast to this finding, the average sample of developed and developing European stock markets indicate that the two-state MSIAH models are more parsimonious with the exception of the Norwegian, Portuguese, Slovenian, and Ukraine stock markets. When we separated the return series into bull and bear regimes, Asian countries that were categorize in regime 1 (bear market) experienced more volatility. This evidence suggests that low-risk assets provide higher returns when compared to risky assets. In addition, the results of developed and developing European stock markets seem consistent as the bull market is categorized as regime 1. This illustrates that high-risk assets provide lower returns in the boom phase due to stiff competition prevailing with regard to high-risk assets during expansionary
TABLE 6COMPARING ASIAN AND EUROPEAN STOCK MARKETS USING UNIVARIATE
VERSUS MULTIVARIATE MARKOV-SWITCHING MODELS
Markov-switching
Yang and Hamori (2014) This study
Developed country
Singapore
Developing countries Developed countries
Developing countriesIndonesia Thailand
Panel A: Univariate2-State MSIH MSIH MSIH MSIAH MSIAHRegime 1 Bear Bear Bear Bull BullRegime 2 Bull Bull Bull Bear BearVolatility – Regime 1 Higher Higher Higher Lower Lower Volatility – Regime 2 Lower Lower Lower Higher Higher
Panel B: Multivariate2-State MSIAH MSIAH MSIAH MSIAH MSIAHRegime 1 Bear Bear Bear Bull BullRegime 2 Bull Bull Bull Bear BearVolatility – Regime 1 Higher Higher Higher Lower Lower Volatility – Regime 2 Lower Lower Lower Higher Higher β1(2), FED + – – + +β1(2), US + + + + +β1(2), stock + – + + +
Notes: This table compares the results of Asian and European stock markets using Markov-switching models. The results of Asian stock markets are extracted from the study of Yang and Hamori (2014) which includes Singaporean, Indonesian and Thai markets.
Examining spillover effect of US… / M. Zubair Mumtaz, Z. Alexander Smith 111
business activities while the possibilities of increasing their returns in the re-cessionary phase would be higher. Likewise, the duration of a bull market is higher than a bear market in all of the markets. Considering the above results, we infer that all of the developed and developing markets pertaining to Asian and European regions are more volatile as they are obtaining higher returns in the recessionary phase which is contrary to earlier studies.
Secondly, researchers analyzed the results of the multivariate Markov-switching model using the US factors which are summarized in Table 6 (Panel B). The researchers found that all of the statistics predict that the two-state MSIAH model is the best fitting and appropriate for all stock markets under consideration (Pagan & Sossounov, 2003). The estimation results of all Asian stock markets represent the bear market as regime 1. These stock markets obtain positive returns in the recessionary phase with the exception of the Singaporean Stock Market. It is interesting to note that these markets obtained lower mean returns with higher volatility in recessionary periods, again this finding con-tradicts typically behavior and it is the same as in the case univariate analysis. The results of selecting regimes in both univariate and multivariate Markov-switching models are the same with regard to Asian stock markets. Considering the developed and developing European stock markets, the evidence suggests that the bull market should be categorized as regime 1. These markets also earned higher returns with lower volatility in regime 1 but this evidence is not true in case of the French, Portuguese, and Ukraine stock markets. This implies that considering the US factor, these markets are offering higher returns in boom phase as there are some other opportunities that can be explored.
The researchers also incorporated the Federal Funds Rate (β1(2), FED) to examine its impact on the Asian and European stock markets. This variable negatively influences the selected Asian stock markets during the economic recession phase (regime 2). A relative decrease in the short-term interest rate in the US has a positive influence on the Asian stock returns in the ensuing month whereas this effect wears off during the economic recession period. In this study, we find a positive relationship during the expansionary phase for the developed and developing stock markets which illustrates that a relative decrease in the short-term US interest rate has a positive effect on these markets in the coming month. In a recession phase, this effect vanishes due to the closure of the channelization of funds by the Federal Reserve. This finding is interesting in the sense that increases in short-term US interest rates encourage investors to explore their business opportunities. This evidence illustrates that stock markets and short-term US interest rates move side by side as investors find it appropriate to invest in their respective stock market when the Federal Funds Rate increased during the economic expansion period.
We also examine the effect of the US Stock Market (β1(2), US) on the sample stock markets. The results of Asian stock markets predict a positive and significant effect of the US Stock Market in both regimes. In a boom phase, the relation-ship is strengthened. We also identify a direct relationship between European and US stock markets. This finding suggests that when the US Stock Market

Estudios de Economía, Vol. 46 - Nº 1112
grows, developing markets will also generate positive returns as these markets are volatile, thus, offering higher returns. Considering the lagged stock returns (β1(2), stock), the results predict that domestic markets are not well justified due to the fact that these lagged returns from Indonesia in regime 1 and both from Singapore and Thailand in regime 2 are positive and significant. In this study, we consider the diverse nature of stock markets that have different characteris-tics and find that the lagged stock returns of the Finnish, Swiss, Swedish, UK, Slovenia, and Ukraine markets are negative in a boom phase and the crisis period. In nutshell, researchers conclude from both of the studies that the spillover effect from the US monetary policy acts as a catalyst in determining the asset prices in both the Asian and European markets, however, the effect of magnitude varies from market to market.
6. Conclusion
The purpose of this study is to examine the relationship between US Monetary Policy and selected developed and developing European stock markets during the period lasting from 1994 to 2017. In this study, we examined the regime switching process associated with the Federal Funds Rate, S&P 500, and ten developed and nine developing European stock markets by employing univari-ate Markov-switching models and find evidence of two different regimes: (a) a period of economic expansion and (b) a period of economic recession. To determine the estimation results of multivariate Markov-switching models, we apply US factors to examine the influence of US Federal Monetary Policy on the European stock markets. This study determines that there are mixed results regarding the influence of the Federal Funds Rate on these countries. We find a negative relationship between the Federal Funds Rate and the selected developed countries (i.e. Danish, French, Swiss, Swedish, and UK stock markets) during the economic expansion phase. In addition, we explored the negative and posi-tive co-movement between the US Stock Market and developed and developing markets, respectively. Nonetheless, the role of the lagged stock market returns is marginal when attempting to predict the future movement of stock markets in European countries. The important contribution of this study is to compare the effect of US Monetary Policy on the Asian and European stock markets and conclude that the effect of US Monetary Policy varies from market to market, however, it has a greater effect on developed markets.
With regard to the implications of this study, the estimation results identify the transmission mechanics of asset prices particularly from the US to developed and developing European economies. As the transmission mechanics vary in case of bull and bear regimes. The European stock markets are affected due to changes in the Federal Funds Rate and, more precisely, in an economic expansion period when compared against a recessionary period. In addition, the spillover effect varies between the bull and bear regimes for all the scenarios. Moreover, the spillover effect has a greater influence in the bull market when compared
Examining spillover effect of US… / M. Zubair Mumtaz, Z. Alexander Smith 113
against the bear market. The reason behind this finding is that developed markets are more integrated with the US market so any change in monetary policy, as well as the US Stock Market, may have more effect on these markets; however, this effect may decrease in the case of developing markets especially during the phase of economic recession.
References
Akaike, H. (1973). “Information theory as an extension of the maximum likeli-hood principle”. In: Petrov, B. N. Csaki, F. (Eds.), Second International Symposium on Information Theory. Akademiai Kiado, Budapest, 267-281.
Akaike, H. (1974). “A new look at the statistical model identification”. IEEE Transaction on Automatic Control, Vol. 19, Nº 6; 716-723.
Ang, A., and Bekaert, G. (2002). “Regime switches in interest rate”. Journal of Business & Economic Statistics, Vol. 20, Nº 2; 163-182.
Ang, A., and Timmermann, A. (2012). “Regime changes and financial markets”. Annual Review of Economics, Vol. 4; 313-337.
Bekaert, G., Hoerova, M., and Lo Duca, M. (2013). “Risk, uncertainty and mon-etary policy”. Journal of Monetary Economics, Vol. 60, Nº 7; 771-788.
Bhar, R., and Hamori, S. (2004). Hidden Markov models: Applications to finan-cial economics. Springer, Boston.
Bjornland, H.C., and K. Leitemo (2009). “Identifying the interdependence be-tween US monetary policy and the stock market”. Journal of Monetary Economics, Vol. 56; 275-282.
Burnham, K., and Anderson, D. (2002). Model Selection and Multimodal Inference. Springer, New York.
Chatziantoniou, I., Duffy, D. and Filis, G. (2013). “Stock market response to monetary and fiscal policy shocks: Multi-country evidence”. Economic Modelling, Vol. 30; 754-769.
Chu, X. (2015). “Modelling impact of monetary policy on stock market liquid-ity: A dynamic copula approach”. Applied Economic Letters, Vol. 22, Nº 10; 820-824.
Conover, C. M., G. R. Jensen, R. R. Johnson and J. M. Mercer (1999). “Monetary environment and international stock return”. Journal of Banking and Finance, Vol. 23; 1357-1381.
Davies, R. B. (1977). “Hypothesis testing when a nuisance parameter is present only under the alternative”. Biometrika, Vol. 64, Nº 2; 247-254.
Davies, R. B. (1987). “Hypothesis testing when a nuisance parameter is present only under the alternative”. Biometrika, Vol. 74, Nº 1; 33-43.
Diebold, F.X., Lee, J-H, and Weinbach, G. (1994). Regime switching with time-varying transition probabilities. C. Hargreaves (ed.), Nonstationary Time Series Analysis and Cointegration. Oxford University Press, 283-302.
Drton, M., and Plummer, M. (2017). “A Bayesian information criterion for singular models”. Journal of the Royal Statistical Society, Vol. 79, Nº 2; 323-380.
Estudios de Economía, Vol. 46 - Nº 1114
van Erven, T., Grunwald, P. and de Rooiji, S. (2012). “Catching up faster by switching sooner: A predictive approach”. Journal of the Royal Statistical Society: Series B, 74; 361-417.
Fakra, M. (2009). “The effect of monetary policy shocks on stock prices account-ing for endogeneity and omitted variable biases”. Review of Financial Economics, Vol. 18; 47-55.
Fama, E. F. and K. R. French (1989). “Business conditions and expected return on stocks and bonds”. Journal of Financial Economics, Vol. 25; 23-49.
Fischbacher, U., Hens, T. and Zeisberger, S. (2013). “The impact of monetary policy on stock market bubbles and trading behaviour: Evidence from the lab”. Journal of Economic Dynamics & Control, Vol. 37; 2104-2122.
Georgiadis, G. (2015). “Determinants of global spillovers from U.S. monetary policy”. European Central Bank, Working Paper Nº 1854, Germany.
Hamilton, J. (1989). “A new approach to the economic analysis of nonstationary time series and the business cycle”. Econometrica, Vol. 57; 357-384.
Hussain, S. M. (2010). “Simultaneous monetary policy announcements and international stock markets response: An intraday analysis”, Journal of Banking & Finance, Vol. 35, Nº 3; 752-764.
Ivrendi, M. and Guloglu, B. (2012). “Changes in stock price volatility and monetary policy regime: Evidence from Asian Countries”, Emerging Markets Finance & Trade, Vol. 48, Nº 4; 54-74.
Kalimipalli, M., and Susmel, R. (2004). “Regime-switching stochastic volatility and short-term interest rates”. Journal of Empirical Finance, Vol. 11, Nº 3; 309-329.
Kim, C-J. (2004). “Markov-switching models with endogenous explanatory variables II: A two-step MLE procedure”. Journal of Econometrics, Vol. 148; 46-55.
Kurov, A. (2010). “Investor sentiment and the stock market’s reaction to monetary policy”. Journal of Banking and Finance, Vol. 34; 139-149.
Laopodis, N. (2013). “Monetary policy and stock market dynamics across monetary regime”. Journal of International Money and Finance, Vol. 33; 381-406.
Pagan, A. R., and Sossounov, K. A. (2003). “A simple framework for analysing bull and bear markets”. Journal of Applied Econometrics, Vol. 18, Nº 1; 23-46.
Qiaoa, Z., Yuming, L., and Wongc, W-K. (2011). “Regime-dependent relation-ship among the stock markets of the US, Australia, and New Zealand: A Markov-switching VAR approach”. Applied Financial Economics, Vol. 21; 1831-1841.
Rigobon, R., and Sack, B. (2003). “Measuring the reaction of monetary policy to the stock market”. The Quarterly Journal of Economics, Vol. 118, Nº 2; 639-669.
Schwarz, G. (1978). “Estimating the dimension of a model”. The Annals of Statistics, Vol. 6; 461-464.
Sola, M., Spagnolo, F. and Spagnolo, N. (2002). “A test for volatility spillovers”. Economic Letters, Vol. 76; 77-84.
Yang, L., Hamori, S. (2014). “Spillover effect of US monetary policy to ASEAN stock markets: Evidence from Indonesia, Singapore and Thailand”. Pacific-Basic Finance Journal, Vol. 26; 145-155.

Examining spillover effect of US… / M. Zubair Mumtaz, Z. Alexander Smith 115
APPENDIX 1CORRELATION MATRIX OF MONTHLY RETURNS
FED US Stock
FED 1US 0.0567 1
Stoc
k M
arke
t – D
evel
oped
ec
onom
ies
Austria 0.1663 0.7026 1Belgium 0.1547 0.7008 1Denmark 0.1907 0.6431 1France 0.0736 0.8097 1Finland 0.0539 0.6356 1Germany 0.0874 0.7852 1Norway 0.1117 0.7530 1Switzerland 0.0575 0.7151 1Sweden 0.0680 0.7210 1UK 0.0672 0.8407 1 Average 0.1210 0.8748 1
Stoc
k M
arke
t – D
evel
opin
g ec
onom
ies
Bulgaria 0.0818 0.6014 1Croatia 0.0977 0.4739 1Czech 0.0259 0.4631 1Hungary 0.0887 0.6206 1Poland –0.0200 0.5115 1Portugal 0.0092 0.6100 1Serbia 0.0479 0.6522 1Slovenia 0.1969 0.4337 1Ukraine 0.0525 0.5072 1 Average 0.0544 0.6476 1
Notes: Federal fund rate, S&P 500 (US) and MSCI stock index for each country. The sample covers the time period from January 1994 to December 2017 for a total of 288 monthly returns.
APPENDIX 2UNIT ROOT TEST
Country ADF Country ADF
US –15.046*** FED –14.833***
Austria –13.292*** Bulgaria –8.019***
Belgium –13.398*** Croatia –12.699***
Denmark –15.624*** Czech –16.254***
France –15.460*** Hungary –14.845***
Finland –13.991*** Poland –18.124***
Germany –16.008*** Portugal –14.842***
Norway –14.869*** Serbia –7.945***
Switzerland –14.580*** Slovenia –11.337***
Sweden –15.610*** Ukraine –9.393***
UK –16.767***
Notes: This appendix present the result of ADF unit root test. FED = federal fund rate (3-month treasury bill rate). The sample covers the time period from January 1994 to December 2017 for a total of 288 monthly returns.

Estudios de Economía, Vol. 46 - Nº 1116
APPENDIX 3JOHANSEN COINTEGRATION TEST
Country Trace stats. Country Trace stats.
FED-US 96.903*** FED-UK 108.268***
FED-Austria 73.494*** FED-Bulgaria 33.568***
FED-Belgium 87.781*** FED-Croatia 66.853***
FED-Denmark 95.212*** FED-Czech 103.980***
FED-France 101.150*** FED-Hungary 107.826***
FED-Finland 99.548*** FED-Poland 125.338***
FED-Germany 101.247*** FED-Portugal 95.837***
FED-Norway 103.203*** FED-Serbia 40.304***
FED-Switzerland 96.869*** FED-Slovenia 50.311***
FED-Sweden 104.388*** FED-Ukraine 44.511***
Notes: This table presents the results of cointegration test between federal fund rate and market return of respective stock index. The critical value at 5% is 3.76 which is less than trace statistics in all the scenarios which suggests no cointegration between variables.
APPENDIX 4RESULTS FOR UNIVARIATE MARKOV SWITCHING MODELS BY APPLYING AIC
Countries 2-State MSIH
2-State MSIAH Countries 2-State
MSIH2-State MSIAH
US –3.584 –3.674 FED 0.197 –1.159Austria –2.768 –2.872 Bulgaria –2.327 –2.415Belgium –3.155 –3.221 Croatia –2.715 –2.862Denmark –3.115 –3.151 Czech –2.505 –2.605France –3.083 –3.191 Hungary –2.077 –2.123Finland –2.055 –2.209 Poland –2.011 –2.192Germany –2.083 –2.871 Portugal –2.937 –2.944Norway –2.901 –2.905 Serbia –1.887 –2.163Switzerland –3.540 –3.579 Slovenia –3.069 –3.069Sweden –2.826 –2.943 Ukraine –1.564 –1.581UK –3.632 –3.711 Average –2.759 –2.899Average –3.393 –3.459 Entire Sample –3187 –3.282
Notes: We determine performance measures by applying univariate Markov switching models and selecting Akaike Information Criterion (AIC) the best-fitting models on the basis of their lowest values. The sample period is considered from January 1994 to December 2017 for a total of 288 monthly returns. The sample is the combination of selected MSCI stock index for developed and developing countries. The lowest values of AIC are presented in bold.

Examining spillover effect of US… / M. Zubair Mumtaz, Z. Alexander Smith 117
APP
EN
DIX
5PA
NE
L A
: PA
RA
ME
TE
R E
STIM
AT
ES
FOR
UN
IVA
RIA
TE
TW
O-S
TAT
E M
AR
KO
V S
WIT
CH
ING
MO
DE
LS
– D
EV
EL
OPE
D C
OU
NT
RIE
S
Aus
tria
Bel
gium
Den
mar
kFr
ance
Finl
and
Ger
man
yN
orw
aySw
itzer
land
Swed
enU
K
μ 1 x 1
0–4–0
.60**
(–1.
986)
0.01
0***
(4.1
12)
–0.0
12(–
1.18
7)0.
012**
*
(3.9
69)
–0.0
00(–
0.03
0)0.
013**
*
(3.8
68)
–0.0
58*
(–1.
970)
–0.0
12(–
1.30
6)0.
016**
*
(4.6
67)
0.01
0***
(4.6
21)
μ 2 x
10–4
0.00
8**
(2.5
38)
–0.0
54**
*
(–2.
309)
0.01
8***
(5.0
53)
–0.0
04(–
0.67
2)0.
011**
(2.2
85)
–0.0
08(–
0.96
7)0.
011**
*
(3.4
16)
0.01
3***
(4.3
58)
–0.0
11(–
1.16
9)–0
.004
(–0.
882)
β 1 1.
658**
(2.2
55)
3.98
9***
(5.9
26)
2.29
3***
(3.5
91)
3.03
0***
(5.1
97)
3.34
2***
(5.1
88)
3.19
2***
(5.5
00)
1.80
0**
(2.5
45)
2.93
2***
(4.8
50)
2.87
7***
(5.0
05)
β 2–4
.023
***
(–6.
128)
–1.7
49**
(–2.
560)
–3.1
01**
*
(–4.
927)
–3.1
27**
*
(–4.
373)
–3.7
54**
*
(–5.
228)
–2.8
83**
*
(–4.
612)
–2.4
56**
*
(–3.
993)
–2.2
87**
*
(–4.
134)
–2.9
96**
*
(–4.
403)
σ 1 x 1
0–40.
127**
*
(13.
682)
0.03
8***
(60.
452)
0.07
0***
(27.
200)
0.03
1***
(39.
007)
0.11
8***
(25.
561)
0.03
5***
(35.
419)
0.11
4***
(13.
416)
0.06
0***
(32.
071)
0.03
7***
(35.
962)
0.02
1***
(45.
946)
σ 2 x 1
0–40.
048**
*
(58.
994)
0.10
6***
(16.
491)
0.03
8***
(41.
454)
0.06
4***
(38.
166)
0.05
0***
(34.
564)
0.08
0***
(30.
500)
0.04
8***
(58.
078)
0.02
7***
(39.
582)
0.08
8***
(27.
381)
0.04
9***
(43.
480)
p 110.
840
0.98
20.
908
0.95
40.
966
0.96
10.
802
0.85
80.
949
0.94
7p 22
0.98
20.
852
0.95
70.
958
0.97
70.
947
0.97
90.
921
0.90
80.
952
Dur
atio
n 1
6.25
55.0
010
.90
21.6
929
.28
25.3
35.
067.
0519
.77
18.7
7D
urat
ion
256
.86
6.75
23.2
323
.80
43.6
918
.87
46.9
512
.65
10.8
521
.00
Not
es:
Fede
ral
Fund
s R
ate,
S&
P 50
0 an
d M
SCI
stoc
k in
dex
for
each
cou
ntry
. p11
(22)
den
otes
to
the
tran
sitio
n pr
obab
ility
in
regi
me
1(2)
, and
the
exp
ecte
d du
ratio
n in
re
gim
e 1(
2) is
est
imat
ed a
s 1/
(1 –
p11
(22)
). * ,
** a
nd **
* sh
ow s
igni
fica
nce
at th
e 0.
10, 0
.05
and
0.01
leve
ls, r
espe
ctiv
ely.
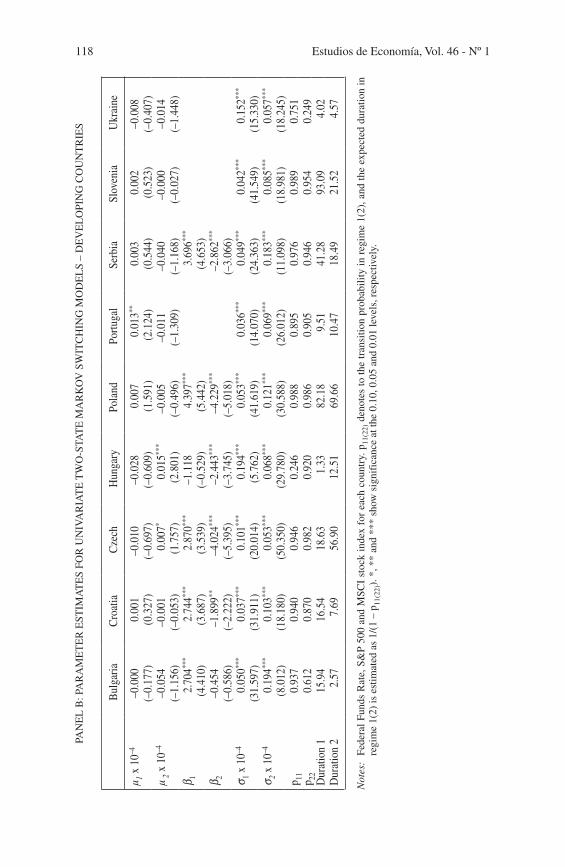
Estudios de Economía, Vol. 46 - Nº 1118
PAN
EL
B: P
AR
AM
ET
ER
EST
IMA
TE
S FO
R U
NIV
AR
IAT
E T
WO
-STA
TE
MA
RK
OV
SW
ITC
HIN
G M
OD
EL
S –
DE
VE
LO
PIN
G C
OU
NT
RIE
S
Bul
garia
Cro
atia
Cze
chH
unga
ryPo
land
Portu
gal
Serb
iaSl
oven
iaU
krai
ne
μ 1 x 1
0–4–0
.000
(–0.
177)
0.00
1(0
.327
)–0
.010
(–0.
697)
–0.0
28(–
0.60
9)0.
007
(1.5
91)
0.01
3**
(2.1
24)
0.00
3(0
.544
)0.
002
(0.5
23)
–0.0
08(–
0.40
7)μ 2
x 1
0–4–0
.054
(–1.
156)
–0.0
01(–
0.05
3)0.
007*
(1.7
57)
0.01
5***
(2.8
01)
–0.0
05(–
0.49
6)–0
.011
(–1.
309)
–0.0
40(–
1.16
8)–0
.000
(–0.
027)
–0.0
14(–
1.44
8)β 1
2.70
4***
(4.4
10)
2.74
4***
(3.6
87)
2.87
0***
(3.5
39)
–1.1
18(–
0.52
9)
4.39
7***
(5.4
42)
3.69
6***
(4.6
53)
β 2–0
.454
(–0.
586)
–1.8
99**
(–2.
222)
–4.0
24**
*
(–5.
395)
–2.4
43**
*
(–3.
745)
–4.2
29**
*
(–5.
018)
–2.8
62**
*
(–3.
066)
σ 1 x 1
0–40.
050**
*
(31.
597)
0.03
7***
(31.
911)
0.10
1***
(20.
014)
0.19
4***
(5.7
62)
0.05
3***
(41.
619)
0.03
6***
(14.
070)
0.04
9***
(24.
363)
0.04
2***
(41.
549)
0.15
2***
(15.
330)
σ 2 x 1
0–40.
194**
*
(8.0
12)
0.10
3***
(18.
180)
0.05
3***
(50.
350)
0.06
8***
(29.
780)
0.12
1***
(30.
588)
0.06
9***
(26.
012)
0.18
3***
(11.
098)
0.08
5***
(18.
981)
0.05
7***
(18.
245)
p 110.
937
0.94
00.
946
0.24
60.
988
0.89
50.
976
0.98
90.
751
p 220.
612
0.87
00.
982
0.92
00.
986
0.90
50.
946
0.95
40.
249
Dur
atio
n 1
15.9
416
.54
18.6
31.
3382
.18
9.51
41.2
893
.09
4.02
Dur
atio
n 2
2.57
7.69
56.9
012
.51
69.6
610
.47
18.4
921
.52
4.57
Not
es:
Fede
ral
Fund
s R
ate,
S&
P 50
0 an
d M
SCI
stoc
k in
dex
for
each
cou
ntry
. p11
(22)
den
otes
to
the
tran
sitio
n pr
obab
ility
in
regi
me
1(2)
, and
the
exp
ecte
d du
ratio
n in
re
gim
e 1(
2) is
est
imat
ed a
s 1/
(1 –
p11
(22)
). *
, **
and
***
show
sig
nifi
canc
e at
the
0.10
, 0.0
5 an
d 0.
01 le
vels
, res
pect
ivel
y.
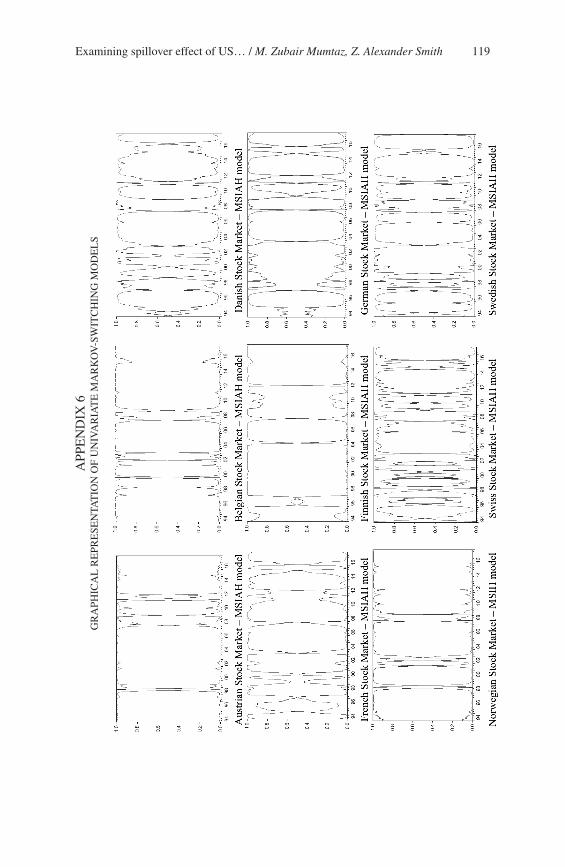
Examining spillover effect of US… / M. Zubair Mumtaz, Z. Alexander Smith 119
APP
EN
DIX
6G
RA
PHIC
AL
RE
PRE
SEN
TAT
ION
OF
UN
IVA
RIA
TE
MA
RK
OV
-SW
ITC
HIN
G M
OD
EL
S

Estudios de Economía, Vol. 46 - Nº 1120
App
endi
x 6
(con
tinu
atio
n)
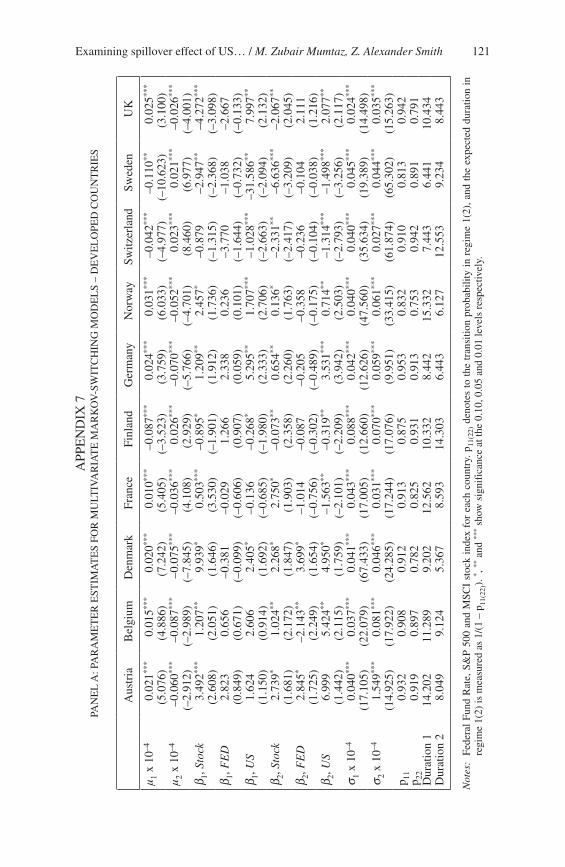
Examining spillover effect of US… / M. Zubair Mumtaz, Z. Alexander Smith 121
APP
EN
DIX
7PA
NE
L A
: PA
RA
ME
TE
R E
STIM
AT
ES
FOR
MU
LTIV
AR
IAT
E M
AR
KO
V-S
WIT
CH
ING
MO
DE
LS
– D
EV
EL
OPE
D C
OU
NT
RIE
S
Aus
tria
Bel
gium
Den
mar
kFr
ance
Finl
and
Ger
man
yN
orw
aySw
itzer
land
Swed
enU
K
μ 1 x
10–4
0.02
1***
(5.0
76)
0.01
5***
(4.8
86)
0.02
0***
(7.2
42)
0.01
0***
(5.4
05)
–0.0
87**
*
(–3.
523)
0.02
4***
(3.7
59)
0.03
1***
(6.0
33)
–0.0
42**
*
(–4.
977)
–0.1
10**
(–10
.623
)0.
025**
*
(3.1
00)
μ 2 x
10–4
–0.0
60**
*
(–2.
912)
–0.0
87**
*
(–2.
989)
–0.0
75**
*
(–7.
845)
–0.0
36**
*
(4.1
08)
0.02
6***
(2.9
29)
–0.0
70**
*
(–5.
766)
–0.0
52**
*
(–4.
701)
0.02
3***
(8.4
60)
0.02
1***
(6.9
77)
–0.0
26**
*
(–4.
001)
β 1, S
tock
3.49
2***
(2.6
08)
1.20
7**
(2.0
51)
9.93
9*
(1.6
46)
0.50
3***
(3.5
30)
–0.8
95*
(–1.
901)
1.20
9**
(1.9
12)
2.45
7*
(1.7
36)
–0.8
79(–
1.31
5)–2
.947
**
(–2.
368)
–4.2
72**
*
(–3.
098)
β 1, F
ED
2.82
3(0
.849
)0.
656
(0.6
71)
–0.3
81(–
0.09
9)–0
.029
(–0.
606)
1.26
6(0
.907
)2.
338
(0.0
59)
0.23
6(0
.101
)–3
.770
(–1.
644)
–1.0
38(–
0.73
2)–2
.667
(–0.
133)
β 1, U
S1.
624
(1.1
50)
2.60
6(0
.914
)2.
405*
(1.6
92)
–0.1
36(–
0.68
5)–0
.268
*
(–1.
980)
5.29
5**
(2.3
33)
1.70
7***
(2.7
06)
–1.0
28**
*
(–2.
663)
–31.
586**
(–2.
094)
7.99
7**
(2.1
32)
β 2, S
tock
2.73
9*
(1.6
81)
1.02
4**
(2.1
72)
2.26
8*
(1.8
47)
2.75
0*
(1.9
03)
–0.0
73**
(2.3
58)
0.65
4**
(2.2
60)
0.13
6*
(1.7
63)
–2.3
31**
(–2.
417)
–6.6
36**
*
(–3.
209)
–2.0
67**
(2.0
45)
β 2, F
ED
2.84
5*
(1.7
25)
–2.1
43**
(2.2
49)
3.69
9*
(1.6
54)
–1.0
14(–
0.75
6)–0
.087
(–0.
302)
–0.2
05(–
0.48
9)–0
.358
(–0.
175)
–0.2
36(–
0.10
4)–0
.104
(–0.
038)
2.11
1(1
.216
)β 2,
US
6.99
9(1
.442
)5.
424**
(2.1
15)
4.95
0*
(1.7
59)
–1.5
63**
(–2.
101)
–0.3
19**
(–2.
209)
3.53
1***
(3.9
42)
0.71
4**
(2.5
03)
–1.3
14**
*
(–2.
793)
–1.4
98**
*
(–3.
256)
2.07
7**
(2.1
17)
σ 1 x
10–4
0.04
0***
(17.
105)
0.03
7***
(22.
079)
0.04
1***
(67.
433)
0.04
3***
(17.
005)
0.08
8***
(12.
660)
0.04
2***
(12.
626)
0.04
0***
(47.
560)
0.04
0***
(35.
634)
0.04
5***
(19.
389)
0.02
4***
(14.
498)
σ 2 x
10–4
1.54
9***
(14.
925)
0.08
1***
(17.
922)
0.04
6***
(24.
285)
0.03
1***
(17.
244)
0.07
0***
(17.
076)
0.05
9***
(9.9
51)
0.06
1***
(33.
415)
0.02
7***
(61.
874)
0.04
4***
(65.
302)
0.03
5***
(15.
263)
p 110.
932
0.90
80.
912
0.91
30.
875
0.95
30.
832
0.91
00.
813
0.94
2p 22
0.91
90.
897
0.78
20.
825
0.93
10.
913
0.75
30.
942
0.89
10.
791
Dur
atio
n 1
14.2
0211
.289
9.20
212
.562
10.3
328.
442
15.3
327.
443
6.44
110
.434
Dur
atio
n 2
8.04
99.
124
5.36
78.
593
14.3
036.
443
6.12
712
.553
9.23
48.
443
Not
es:
Fede
ral
Fund
Rat
e, S
&P
500
and
MSC
I st
ock
inde
x fo
r ea
ch c
ount
ry. p
11(2
2) d
enot
es t
o th
e tr
ansi
tion
prob
abili
ty i
n re
gim
e 1(
2), a
nd t
he e
xpec
ted
dura
tion
in
regi
me
1(2)
is m
easu
red
as 1
/(1
– p 11
(22)
). * ,
** a
nd **
* sh
ow s
igni
fica
nce
at th
e 0.
10, 0
.05
and
0.01
leve
ls r
espe
ctiv
ely.
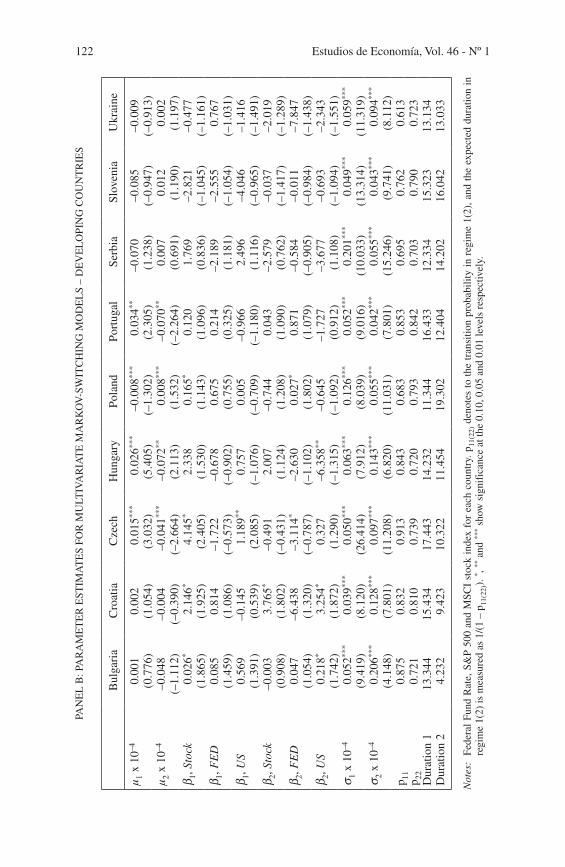
Estudios de Economía, Vol. 46 - Nº 1122
PAN
EL
B: P
AR
AM
ET
ER
EST
IMA
TE
S FO
R M
ULT
IVA
RIA
TE
MA
RK
OV
-SW
ITC
HIN
G M
OD
EL
S –
DE
VE
LO
PIN
G C
OU
NT
RIE
S
Bul
gari
aC
roat
ia
Cze
chH
unga
ryPo
land
Port
ugal
Se
rbia
Slov
enia
Ukr
aine
μ 1 x
10–4
0.00
1(0
.776
)0.
002
(1.0
54)
0.01
5***
(3.0
32)
0.02
6***
(5.4
05)
–0.0
08**
*
(–1.
302)
0.03
4**
(2.3
05)
–0.0
70(1
.238
)–0
.085
(–0.
947)
–0.0
09(–
0.91
3)μ 2
x 10
–4–0
.048
(–1.
112)
–0.0
04(–
0.39
0)–0
.041
***
(–2.
664)
–0.0
72**
(2.1
13)
0.00
8***
(1.5
32)
–0.0
70**
(–2.
264)
0.00
7(0
.691
)0.
012
(1.1
90)
0.00
2(1
.197
)β 1,
Sto
ck0.
026*
(1.8
65)
2.14
6*
(1.9
25)
4.14
5*
(2.4
05)
2.33
8(1
.530
)0.
165*
(1.1
43)
0.12
0(1
.096
)1.
769
(0.8
36)
–2.8
21(–
1.04
5)–0
.477
(–1.
161)
β 1, F
ED
0.08
5(1
.459
)0.
814
(1.0
86)
–1.7
22(–
0.57
3)–0
.678
(–0.
902)
0.67
5(0
.755
)0.
214
(0.3
25)
–2.1
89(1
.181
)–2
.555
(–1.
054)
0.76
7(–
1.03
1)β 1,
US
0.56
9(1
.391
)–0
.145
(0.5
39)
1.18
9**
(2.0
85)
0.75
7(–
1.07
6)0.
005
(–0.
709)
–0.9
66(–
1.18
0)2.
496
(1.1
16)
–4.0
46(–
0.96
5)–1
.416
(–1.
491)
β 2, S
tock
–0.0
03(0
.908
)3.
765*
(1.8
02)
–0.4
91(–
0.43
1)2.
007
(1.1
24)
–0.7
44(1
.208
)0.
043
(1.0
90)
–2.5
79(0
.762
)–0
.037
(–1.
417)
–2.0
19(–
1.28
9)β 2,
FE
D0.
047
(1.0
54)
–6.4
38(1
.320
)–3
.114
*
(–0.
787)
–2.6
30(–
1.10
2)0.
027*
(1.8
02)
0.87
1(1
.079
)–0
.584
(–0.
905)
–0.0
11(–
0.98
4)–7
.847
(–1.
438)
β 2, U
S0.
218*
(1.7
42)
3.25
4*
(1.8
72)
0.32
7(1
.290
)–6
.358
**
(–1.
315)
–0.6
45(–
1.09
2)–1
.727
(0.9
12)
–3.6
77(1
.108
)–0
.693
(–1.
094)
–2.3
43(–
1.55
1)σ 1
x 10
–40.
052**
*
(9.4
19)
0.03
9***
(8.1
20)
0.05
0***
(26.
414)
0.06
3***
(7.9
12)
0.12
6***
(8.0
39)
0.05
2***
(9.0
16)
0.20
1***
(10.
033)
0.04
9***
(13.
314)
0.05
9***
(11.
319)
σ 2 x
10–4
0.20
6***
(4.1
48)
0.12
8***
(7.8
01)
0.09
7***
(11.
208)
0.14
3***
(6.8
20)
0.05
5***
(11.
031)
0.04
2***
(7.8
01)
0.05
5***
(15.
246)
0.04
3***
(9.7
41)
0.09
4***
(8.1
12)
p 110.
875
0.83
20.
913
0.84
30.
683
0.85
30.
695
0.76
20.
613
p 220.
721
0.81
00.
739
0.72
00.
793
0.84
20.
703
0.79
00.
723
Dur
atio
n 1
13.3
4415
.434
17.4
4314
.232
11.3
4416
.433
12.3
3415
.323
13.1
34D
urat
ion
24.
232
9.42
310
.322
11.4
5419
.302
12.4
0414
.202
16.0
4213
.033
Not
es:
Fede
ral
Fund
Rat
e, S
&P
500
and
MSC
I st
ock
inde
x fo
r ea
ch c
ount
ry. p
11(2
2) d
enot
es t
o th
e tr
ansi
tion
prob
abili
ty i
n re
gim
e 1(
2), a
nd t
he e
xpec
ted
dura
tion
in
regi
me
1(2)
is m
easu
red
as 1
/(1
– p 11
(22)
). * ,
** a
nd **
* sh
ow s
igni
fica
nce
at th
e 0.
10, 0
.05
and
0.01
leve
ls r
espe
ctiv
ely.

Examining spillover effect of US… / M. Zubair Mumtaz, Z. Alexander Smith 123
APP
EN
DIX
8G
RA
PHIC
AL
RE
PRE
SEN
TAT
ION
OF
MU
LTIV
AR
IAT
E M
AR
KO
V-S
WIT
CH
ING
MO
DE
LS
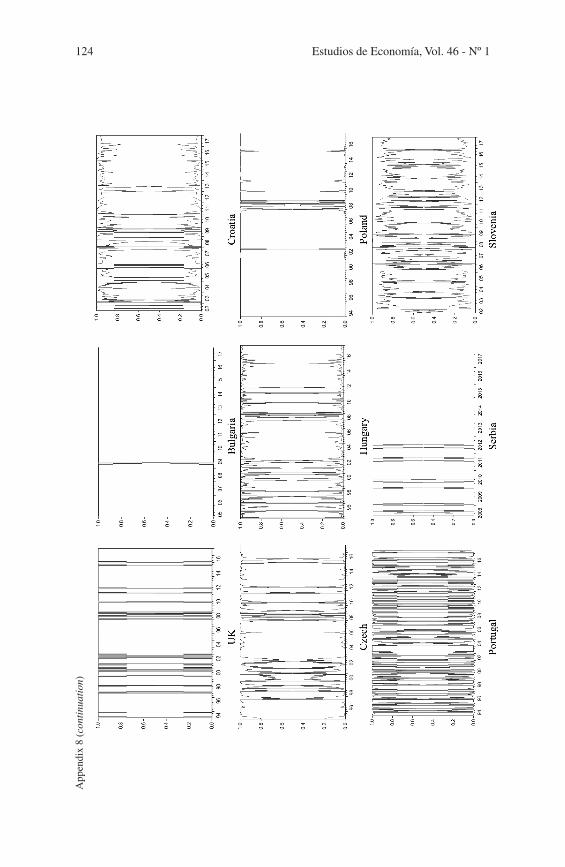
Estudios de Economía, Vol. 46 - Nº 1124
App
endi
x 8
(con
tinu
atio
n)