Embed Size (px)
Citation preview
Monetary Policy ReportJanuary 2012

©2012 Bank of Canada
234 Wellington StreetOttawa, Ontario K1A 0G9
Phone: 613 782-8111 or 1 800 303-1282
[email protected] bankofcanada.ca
ISSN 1201-8783 (Print)ISSN 1490-1234 (Online)
Canada’s Infl ation-Control Strategy1
Infl ation targeting and the economy• The Bank’s mandate is to conduct monetary policy to pro-
mote the economic and fi nancial well-being of Canadians .
• Canada’s experience with infl ation targeting since 1991 has shown that the best way to foster confi dence in the value of money and to contribute to sustained economic growth, employment gains and improved living standards is by keeping infl ation low, stable and predictable .
• In 2011, the Government and the Bank of Canada renewed Canada’s infl ation-control target for a further fi ve-year period, ending 31 December 2016 . The target, as measured by the total consumer price index (CPI), remains at the 2 per cent midpoint of the control range of 1 to 3 per cent .
The monetary policy instrument• The Bank carries out monetary policy through changes
in the target overnight rate of interest .2 These changes are transmitted to the economy through their infl uence on market interest rates, domestic asset prices and the exchange rate, which aff ect total demand for Canadian goods and services . The balance between this demand and the economy’s production capacity is, over time, the pri-mary determinant of infl ation pressures in the economy .
• Monetary policy actions take time—usually from six to eight quarters—to work their way through the economy and have their full eff ect on infl ation . For this reason, monetary policy must be forward looking .
• Consistent with its commitment to clear, transparent communications, the Bank regularly reports its perspec-tive on the forces at work on the economy and their
implications for infl ation . The Monetary Policy Report (MPR) is a key element of this approach . Policy decisions are typically announced on eight pre-set days during the year, and full updates of the Bank’s outlook, including risks to the projection, are published four times per year in the MPR .
Infl ation targeting is symmetric and fl exible• Canada’s infl ation-targeting approach is symmetric, which
means that the Bank is equally concerned about infl ation rising above or falling below the 2 per cent target .
• Canada’s infl ation-targeting framework is fl exible . Typically, the Bank seeks to return infl ation to target over a horizon of six to eight quarters . However, the most appropriate horizon for returning infl ation to target will vary depending on the nature and persistence of the shocks buff eting the economy .
Monitoring infl ation• In the short run, a good deal of movement in the CPI is
caused by fl uctuations in the prices of certain volatile components (e .g ., fruit and gasoline) and by changes in indirect taxes . For this reason, the Bank also monitors a set of “core” infl ation measures, most importantly the CPIX, which strips out eight of the most volatile CPI com-ponents and the eff ect of indirect taxes on the remaining components . These “core” measures allow the Bank to “look through” temporary price movements and focus on the underlying trend of infl ation . In this sense, core infl a-tion is monitored as an operational guide to help the Bank achieve the total CPI infl ation target . It is not a replace-ment for it .
1 See Joint Statement of the Government of Canada and the Bank of Canada on the Renewal of the Infl ation-Control Target (8 November 2011) andRenewal of the Infl ation-Control Target: Background Information—November 2011, which are both available on the Bank’s website .
2 When interest rates are at the zero lower bound, additional monetary easing to achieve the infl ation target can be provided through three unconven-tional instruments: (i) a conditional statement on the future path of the policy rate; (ii) quantitative easing; and (iii) credit easing . These instruments and the principles guiding their use are described in the Annex to the April 2009 Monetary Policy Report .
Monetary Policy ReportJanuary 2012
This is a report of the Governing Council of the Bank of Canada: Mark Carney, Tiff Macklem, John Murray, Timothy Lane, Jean Boivin and Agathe Côté.
This report includes data received up to 13 January 2012.

Today, our demographics have turned, our productivity growth has slowed and the world is undergoing a competitive deleveraging. We might appear to prosper for a while by consuming beyond our means. Markets may let us do so for longer than we should. But if we yield to this temptation, eventually we, too, will face painful adjustments. It is better to rebalance now from a position of strength; to build the competitiveness and prosperity worthy of our nation.
—Mark Carney
Governor, Bank of Canada12 December 2011 Toronto, Ontario
ContentsOverview . . . . . . . . . . . . . . . . . . . . . . . . . . . . . . . . . . . . . . . . . . . . . . . . . . . . . . . . . . . . . . . . . . 1
The Global Economy . . . . . . . . . . . . . . . . . . . . . . . . . . . . . . . . . . . . . . . . . . . . . . . . . . . 3
Global Financial Conditions . . . . . . . . . . . . . . . . . . . . . . . . . . . . . . . . . . . . . . . . . . . . 5
Euro Area . . . . . . . . . . . . . . . . . . . . . . . . . . . . . . . . . . . . . . . . . . . . . . . . . . . . . . . . . . . . . . . 9
United States . . . . . . . . . . . . . . . . . . . . . . . . . . . . . . . . . . . . . . . . . . . . . . . . . . . . . . . . . . 12
Other Advanced Economies . . . . . . . . . . . . . . . . . . . . . . . . . . . . . . . . . . . . . . . . . . 15
Emerging-Market Economies . . . . . . . . . . . . . . . . . . . . . . . . . . . . . . . . . . . . . . . . . 15
Commodity Prices . . . . . . . . . . . . . . . . . . . . . . . . . . . . . . . . . . . . . . . . . . . . . . . . . . . . . 15
Implications for the Canadian Economy . . . . . . . . . . . . . . . . . . . . . . . . . . . . . 17
The Canadian Economy . . . . . . . . . . . . . . . . . . . . . . . . . . . . . . . . . . . . . . . . . . . . . . 19
Financial Conditions . . . . . . . . . . . . . . . . . . . . . . . . . . . . . . . . . . . . . . . . . . . . . . . . . . . 19
Estimated Pressures on Capacity . . . . . . . . . . . . . . . . . . . . . . . . . . . . . . . . . . . .22
Economic Activity . . . . . . . . . . . . . . . . . . . . . . . . . . . . . . . . . . . . . . . . . . . . . . . . . . . . .23
Inflation . . . . . . . . . . . . . . . . . . . . . . . . . . . . . . . . . . . . . . . . . . . . . . . . . . . . . . . . . . . . . . . .29
Risks to the Outlook . . . . . . . . . . . . . . . . . . . . . . . . . . . . . . . . . . . . . . . . . . . . . . . . . . . 31
Technical BoxesTechnical Box 1: Euro-Area Financial Conditions and
Spillover Effects . . . . . . . . . . . . . . . . . . . . . . . . . . . . . . . . . . . . . . 8
Technical Box 2: Fiscal Austerity in the Euro Area . . . . . . . . . . . . . . . . . . .11

Overview
The outlook for the global economy has deteriorated and uncertainty has increased since October. The sovereign debt crisis in Europe has intensi-fied, conditions in international financial markets have tightened and risk aversion has risen. The recession in Europe is now expected to be deeper and longer than the Bank had anticipated. The Bank continues to assume that European authorities will implement sufficient measures to contain the crisis, although this assumption is clearly subject to downside risks. In the United States, while the rebound in real GDP during the second half of 2011 was stronger than anticipated, the Bank expects the recovery will proceed at a more modest pace going forward, owing to ongoing household delever-aging, fiscal consolidation and the spillovers from Europe. Chinese growth is decelerating, as expected, toward a more sustainable pace. Commodity prices—with the exception of oil—are expected to be below the levels antici-pated in October through 2013.
The Bank’s overall outlook for the Canadian economy is little changed from October. While the economy had more momentum than anticipated in the second half of 2011, the pace of growth going forward is expected to be more modest than previously envisaged, largely due to the external environ-ment. Prolonged uncertainty about the global economic and financial environment is likely to dampen the rate of growth of business investment, albeit to a still-solid pace. Net exports are expected to contribute little to growth, reflecting moderate foreign demand and ongoing competitiveness challenges, including the persistent strength of the Canadian dollar. In con-trast, very favourable financing conditions are expected to buttress con-sumer spending and housing activity. Household expenditures are expected to remain high relative to GDP and the ratio of household debt to income is projected to rise further.
The Bank estimates that the economy grew by 2.4 per cent in 2011 and projects that it will grow by 2.0 per cent in 2012 and 2.8 per cent in 2013. While the economy appears to be operating with less slack than previ-ously assumed, given the more modest growth profile, the economy is only anticipated to return to full capacity by the third quarter of 2013, one quarter earlier than was expected in October.
The dynamics for inflation are similar to those anticipated in October, although the profile for inflation is marginally firmer. Both total and core inflation are expected to moderate in 2012 and subsequently rise, reaching 2 per cent by the third quarter of 2013 as excess supply is slowly absorbed,
OveRview 1 BANK OF CANADA • Monetary Policy rePort • January 2012

labour compensation grows modestly and inflation expectations remain well-anchored.
Several significant upside and downside risks are present in the inflation outlook for Canada.
The three main upside risks to inflation in Canada relate to the possibility of stronger-than-expected inflationary pressures in the global economy, stronger-than-expected growth in the U.S. economy and stronger momentum in Canadian household spending.
The two main downside risks to inflation in Canada relate to sovereign debt and banking concerns in Europe and the possibility that growth in Canadian household spending could be weaker than projected.
Overall, the Bank judges that these risks are roughly balanced over the pro-jection horizon.
Reflecting all of these factors, on 17 January, the Bank maintained the target for the overnight rate at 1 per cent. With the target interest rate near historic lows and the financial system functioning well, there is considerable mon-etary policy stimulus in Canada. The Bank will continue to monitor carefully economic and financial developments in the Canadian and global econ-omies, together with the evolution of risks, and set monetary policy con-sistent with achieving the 2 per cent inflation target over the medium term.
2 OveRview BANK OF CANADA • Monetary Policy rePort • January 2012
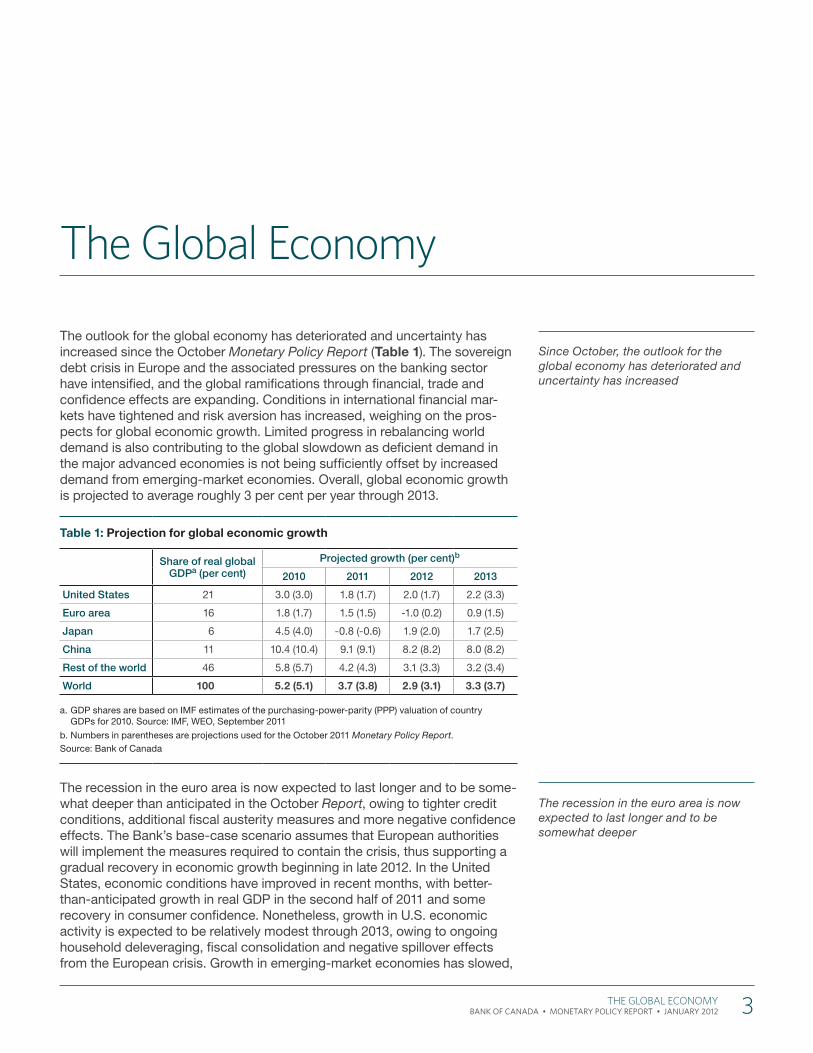
The outlook for the global economy has deteriorated and uncertainty has increased since the October Monetary Policy Report (Table 1). The sovereign debt crisis in Europe and the associated pressures on the banking sector have intensified, and the global ramifications through financial, trade and confidence effects are expanding. Conditions in international financial mar-kets have tightened and risk aversion has increased, weighing on the pros-pects for global economic growth. Limited progress in rebalancing world demand is also contributing to the global slowdown as deficient demand in the major advanced economies is not being sufficiently offset by increased demand from emerging-market economies. Overall, global economic growth is projected to average roughly 3 per cent per year through 2013.
Table 1: Projection for global economic growth
Share of real global GDPa (per cent)
Projected growth (per cent)b
2010 2011 2012 2013
United States 21 3.0 (3.0) 1.8 (1.7) 2.0 (1.7) 2.2 (3.3)
Euro area 16 1.8 (1.7) 1.5 (1.5) -1.0 (0.2) 0.9 (1.5)
Japan 6 4.5 (4.0) -0.8 (-0.6) 1.9 (2.0) 1.7 (2.5)
China 11 10.4 (10.4) 9.1 (9.1) 8.2 (8.2) 8.0 (8.2)
Rest of the world 46 5.8 (5.7) 4.2 (4.3) 3.1 (3.3) 3.2 (3.4)
World 100 5.2 (5.1) 3.7 (3.8) 2.9 (3.1) 3.3 (3.7)
a. GDP shares are based on IMF estimates of the purchasing-power-parity (PPP) valuation of country GDPs for 2010. Source: IMF, WEO, September 2011
b. Numbers in parentheses are projections used for the October 2011 Monetary Policy Report.Source: Bank of Canada
The recession in the euro area is now expected to last longer and to be some-what deeper than anticipated in the October Report, owing to tighter credit conditions, additional fiscal austerity measures and more negative confidence effects. The Bank’s base-case scenario assumes that European authorities will implement the measures required to contain the crisis, thus supporting a gradual recovery in economic growth beginning in late 2012. In the United States, economic conditions have improved in recent months, with better-than-anticipated growth in real GDP in the second half of 2011 and some recovery in consumer confidence. Nonetheless, growth in U.S. economic activity is expected to be relatively modest through 2013, owing to ongoing household deleveraging, fiscal consolidation and negative spillover effects from the European crisis. Growth in emerging-market economies has slowed,
Since October, the outlook for the global economy has deteriorated and uncertainty has increased
The recession in the euro area is now expected to last longer and to be somewhat deeper
The Global economy
The GlObal eCOnOMy 3 BANK OF CANADA • Monetary Policy rePort • January 2012
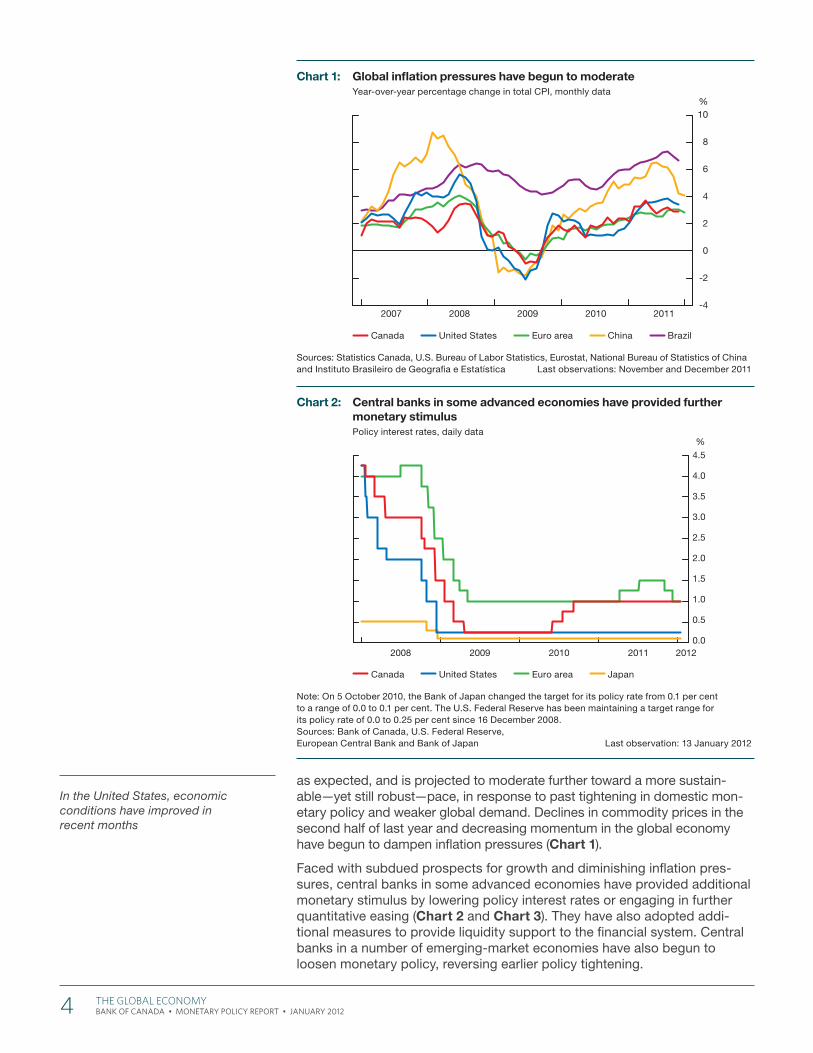
as expected, and is projected to moderate further toward a more sustain-able—yet still robust—pace, in response to past tightening in domestic mon-etary policy and weaker global demand. Declines in commodity prices in the second half of last year and decreasing momentum in the global economy have begun to dampen inflation pressures (Chart 1).
Faced with subdued prospects for growth and diminishing inflation pres-sures, central banks in some advanced economies have provided additional monetary stimulus by lowering policy interest rates or engaging in further quantitative easing (Chart 2 and Chart 3). They have also adopted addi-tional measures to provide liquidity support to the financial system. Central banks in a number of emerging-market economies have also begun to loosen monetary policy, reversing earlier policy tightening.
In the United States, economic conditions have improved in recent months
Chart 1: Global infl ation pressures have begun to moderateYear-over-year percentage change in total CPI, monthly data
Sources: Statistics Canada, U.S. Bureau of Labor Statistics, Eurostat, National Bureau of Statistics of China and Instituto Brasileiro de Geografi a e Estatística Last observations: November and December 2011
2007 2008 2009 2010 2011-4
-2
0
2
4
6
8
10%
Canada United States Euro area China Brazil
Chart 2: Central banks in some advanced economies have provided further monetary stimulusPolicy interest rates, daily data
Note: On 5 October 2010, the Bank of Japan changed the target for its policy rate from 0.1 per cent to a range of 0.0 to 0.1 per cent. The U.S. Federal Reserve has been maintaining a target range for its policy rate of 0.0 to 0.25 per cent since 16 December 2008.Sources: Bank of Canada, U.S. Federal Reserve, European Central Bank and Bank of Japan Last observation: 13 January 2012
2008 2009 2010 2011 2012
%
0.0
0.5
1.0
1.5
2.0
2.5
3.0
3.5
4.0
4.5
Canada United States Euro area Japan
4 The GlObal eCOnOMy BANK OF CANADA • Monetary Policy rePort • January 2012
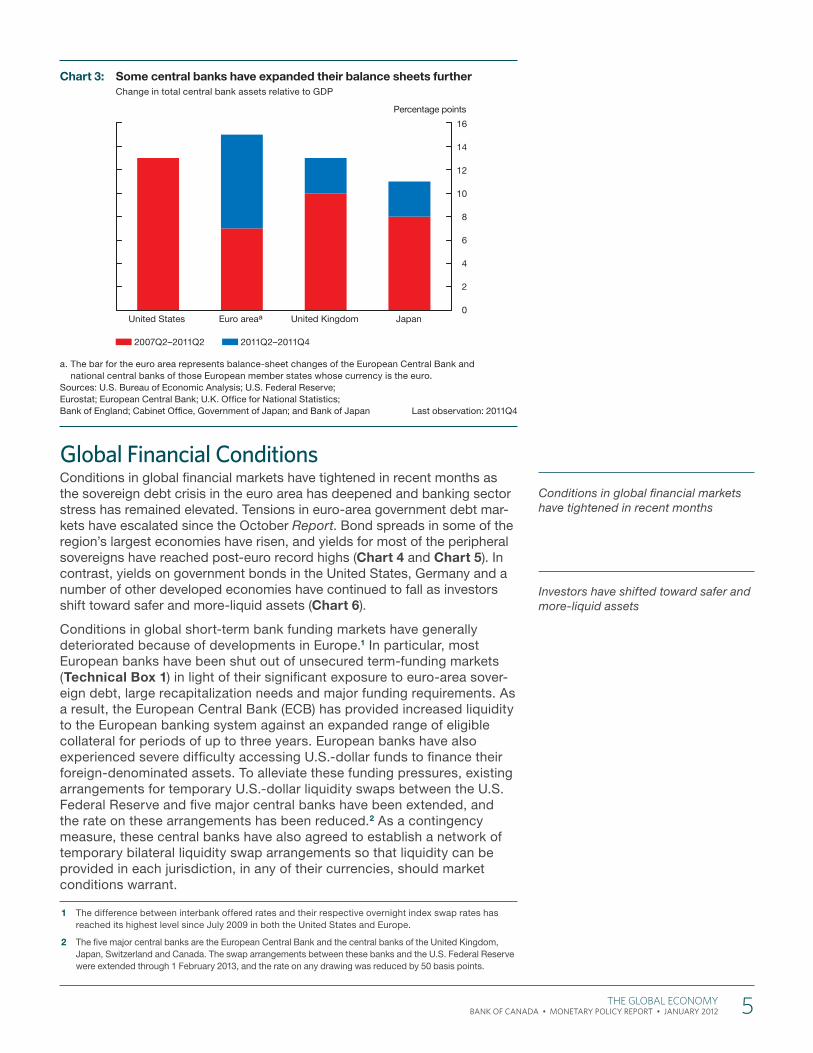
Global Financial ConditionsConditions in global financial markets have tightened in recent months as the sovereign debt crisis in the euro area has deepened and banking sector stress has remained elevated. Tensions in euro-area government debt mar-kets have escalated since the October Report. Bond spreads in some of the region’s largest economies have risen, and yields for most of the peripheral sovereigns have reached post-euro record highs (Chart 4 and Chart 5). In contrast, yields on government bonds in the United States, Germany and a number of other developed economies have continued to fall as investors shift toward safer and more-liquid assets (Chart 6).
Conditions in global short-term bank funding markets have generally deteriorated because of developments in Europe.1 In particular, most European banks have been shut out of unsecured term-funding markets (Technical Box 1) in light of their significant exposure to euro-area sover-eign debt, large recapitalization needs and major funding requirements. As a result, the European Central Bank (ECB) has provided increased liquidity to the European banking system against an expanded range of eligible collateral for periods of up to three years. European banks have also experienced severe difficulty accessing U.S.-dollar funds to finance their foreign-denominated assets. To alleviate these funding pressures, existing arrangements for temporary U.S.-dollar liquidity swaps between the U.S. Federal Reserve and five major central banks have been extended, and the rate on these arrangements has been reduced.2 As a contingency measure, these central banks have also agreed to establish a network of temporary bilateral liquidity swap arrangements so that liquidity can be provided in each jurisdiction, in any of their currencies, should market conditions warrant.
1 The difference between interbank offered rates and their respective overnight index swap rates has reached its highest level since July 2009 in both the United States and Europe.
2 The five major central banks are the European Central Bank and the central banks of the United Kingdom, Japan, Switzerland and Canada. The swap arrangements between these banks and the U.S. Federal Reserve were extended through 1 February 2013, and the rate on any drawing was reduced by 50 basis points.
Conditions in global financial markets have tightened in recent months
Investors have shifted toward safer and more-liquid assets
Chart 3: Some central banks have expanded their balance sheets furtherChange in total central bank assets relative to GDP
a. The bar for the euro area represents balance-sheet changes of the European Central Bank andnational central banks of those European member states whose currency is the euro.
Sources: U.S. Bureau of Economic Analysis; U.S. Federal Reserve; Eurostat; European Central Bank; U.K. Offi ce for National Statistics; Bank of England; Cabinet Offi ce, Government of Japan; and Bank of Japan Last observation: 2011Q4
0
2
4
6
8
10
12
14
16
Percentage points
United States Euro areaa United Kingdom Japan
2007Q2–2011Q2 2011Q2–2011Q4
The GlObal eCOnOMy 5 BANK OF CANADA • Monetary Policy rePort • January 2012
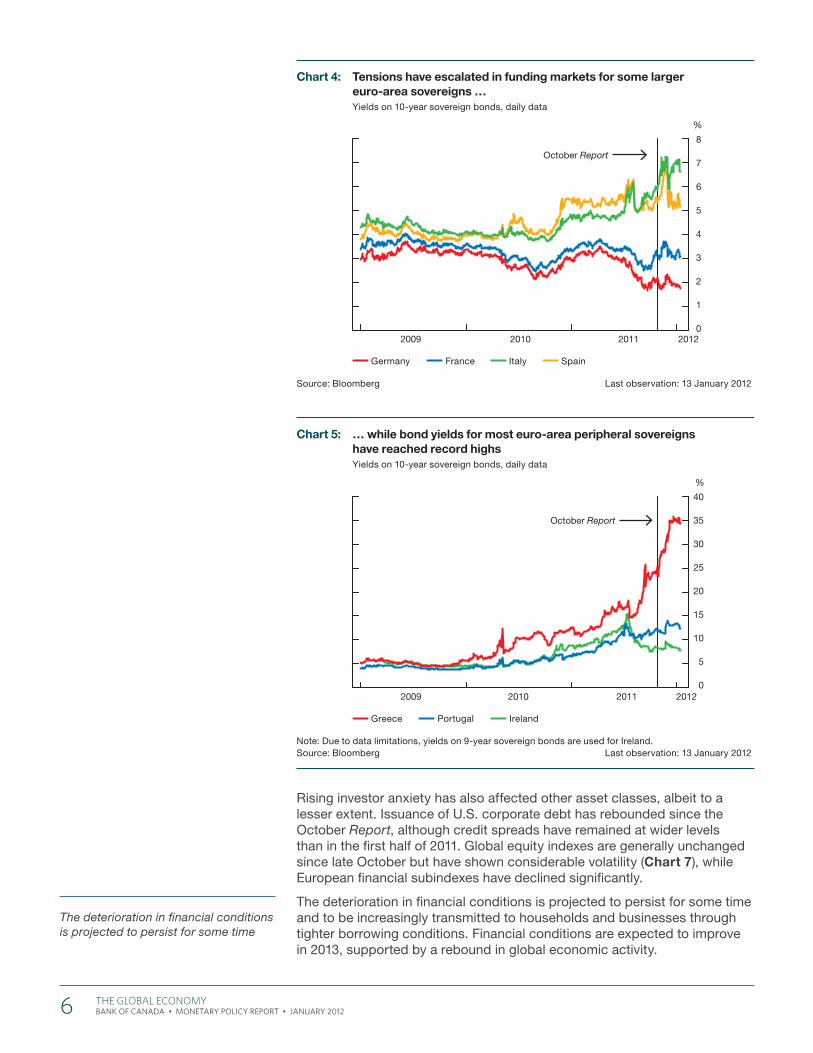
Rising investor anxiety has also affected other asset classes, albeit to a lesser extent. Issuance of U.S. corporate debt has rebounded since the October Report, although credit spreads have remained at wider levels than in the first half of 2011. Global equity indexes are generally unchanged since late October but have shown considerable volatility (Chart 7), while European financial subindexes have declined significantly.
The deterioration in financial conditions is projected to persist for some time and to be increasingly transmitted to households and businesses through tighter borrowing conditions. Financial conditions are expected to improve in 2013, supported by a rebound in global economic activity.
The deterioration in financial conditions is projected to persist for some time
Chart 5: … while bond yields for most euro-area peripheral sovereigns have reached record highsYields on 10-year sovereign bonds, daily data
Note: Due to data limitations, yields on 9-year sovereign bonds are used for Ireland.Source: Bloomberg Last observation: 13 January 2012
2009 2010 2011 20120
5
10
15
20
25
30
35
40
%
October Report
Greece Portugal Ireland
Chart 4: Tensions have escalated in funding markets for some larger euro-area sovereigns …Yields on 10-year sovereign bonds, daily data
Source: Bloomberg Last observation: 13 January 2012
2009 2010 20110
1
2
3
4
5
6
7
8
2012
%
October Report
Germany France Italy Spain
6 The GlObal eCOnOMy BANK OF CANADA • Monetary Policy rePort • January 2012
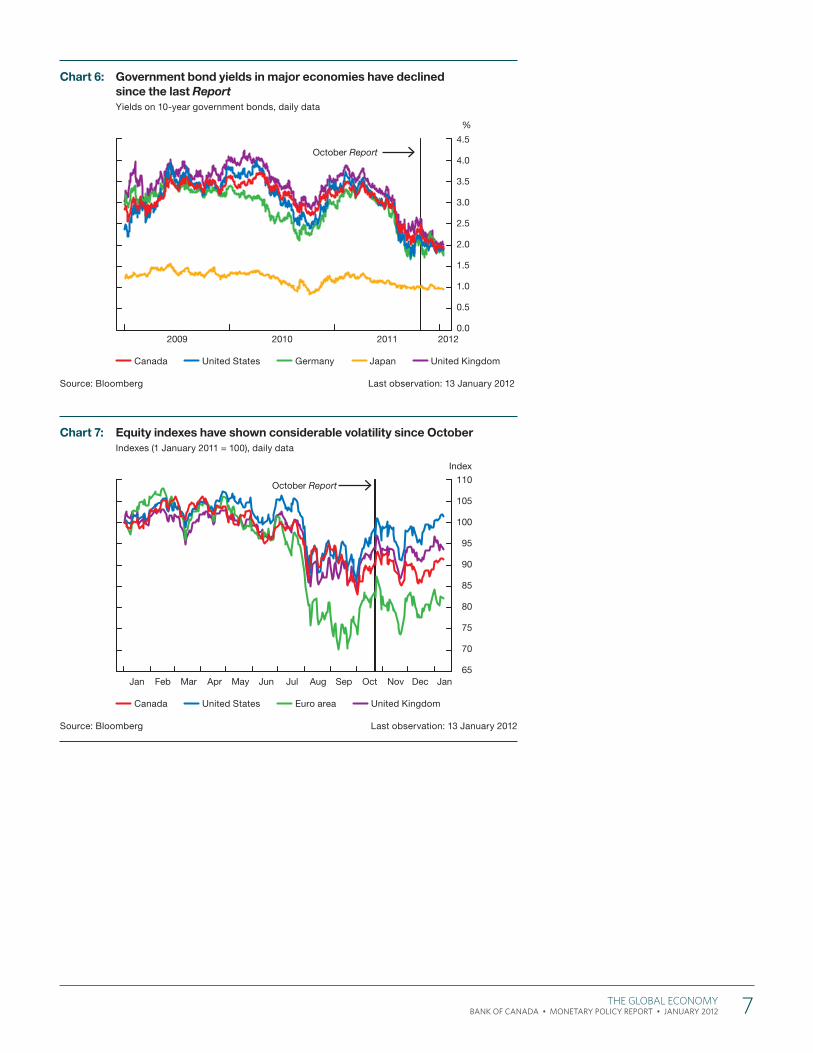
Chart 6: Government bond yields in major economies have declined since the last ReportYields on 10-year government bonds, daily data
Source: Bloomberg Last observation: 13 January 2012
2009 2010 2011 2012
%
October Report
0.0
0.5
1.0
1.5
2.0
2.5
3.0
3.5
4.0
4.5
Canada United States Germany Japan United Kingdom
Chart 7: Equity indexes have shown considerable volatility since OctoberIndexes (1 January 2011 = 100), daily data
Source: Bloomberg Last observation: 13 January 2012
65
70
75
80
85
90
95
100
105
110
Jan Feb Mar Apr May Jun Jul Aug Sep Oct Nov Dec Jan
Index
October Report
Canada United States Euro area United Kingdom
The GlObal eCOnOMy 7 BANK OF CANADA • Monetary Policy rePort • January 2012
Technical Box 1
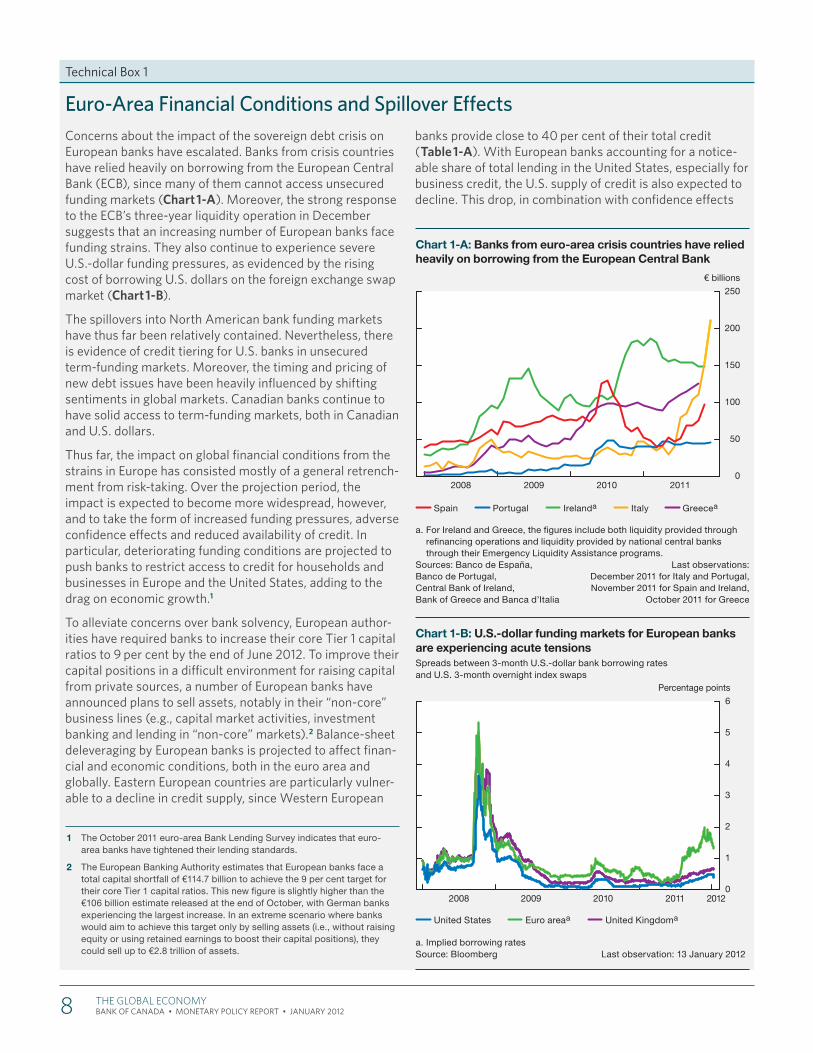
Euro-Area Financial Conditions and Spillover EffectsConcerns about the impact of the sovereign debt crisis on European banks have escalated . Banks from crisis countries have relied heavily on borrowing from the European Central Bank (ECB), since many of them cannot access unsecured funding markets (Chart 1-A) . Moreover, the strong response to the ECB’s three-year liquidity operation in December suggests that an increasing number of European banks face funding strains . They also continue to experience severe U .S .-dollar funding pressures, as evidenced by the rising cost of borrowing U .S . dollars on the foreign exchange swap market (Chart 1-B) .
The spillovers into North American bank funding markets have thus far been relatively contained . Nevertheless, there is evidence of credit tiering for U .S . banks in unsecured term-funding markets . Moreover, the timing and pricing of new debt issues have been heavily influenced by shifting sentiments in global markets . Canadian banks continue to have solid access to term-funding markets, both in Canadian and U .S . dollars .
Thus far, the impact on global financial conditions from the strains in Europe has consisted mostly of a general retrench-ment from risk-taking . Over the projection period, the impact is expected to become more widespread, however, and to take the form of increased funding pressures, adverse confidence effects and reduced availability of credit . In particular, deteriorating funding conditions are projected to push banks to restrict access to credit for households and businesses in Europe and the United States, adding to the drag on economic growth .1
To alleviate concerns over bank solvency, European author-ities have required banks to increase their core Tier 1 capital ratios to 9 per cent by the end of June 2012 . To improve their capital positions in a difficult environment for raising capital from private sources, a number of European banks have announced plans to sell assets, notably in their “non-core” business lines (e .g ., capital market activities, investment banking and lending in “non-core” markets) .2 Balance-sheet deleveraging by European banks is projected to affect finan-cial and economic conditions, both in the euro area and globally . Eastern European countries are particularly vulner-able to a decline in credit supply, since Western European
1 The October 2011 euro-area Bank Lending Survey indicates that euro-area banks have tightened their lending standards.
2 The European Banking Authority estimates that European banks face a total capital shortfall of €114.7 billion to achieve the 9 per cent target for their core Tier 1 capital ratios. This new figure is slightly higher than the €106 billion estimate released at the end of October, with German banks experiencing the largest increase. In an extreme scenario where banks would aim to achieve this target only by selling assets (i.e., without raising equity or using retained earnings to boost their capital positions), they could sell up to €2.8 trillion of assets.
banks provide close to 40 per cent of their total credit (Table 1-A) . With European banks accounting for a notice-able share of total lending in the United States, especially for business credit, the U .S . supply of credit is also expected to decline . This drop, in combination with confidence effects
Chart 1-A: Banks from euro-area crisis countries have relied heavily on borrowing from the European Central Bank
a. For Ireland and Greece, the fi gures include both liquidity provided through refi nancing operations and liquidity provided by national central banks through their Emergency Liquidity Assistance programs.
Sources: Banco de España, Last observations: Banco de Portugal, December 2011 for Italy and Portugal,Central Bank of Ireland, November 2011 for Spain and Ireland, Bank of Greece and Banca d’Italia October 2011 for Greece
0
50
100
150
200
250
2008 2009 2010 2011
€ billions
Spain Portugal Irelanda Italy Greecea
Chart 1-B: U.S.-dollar funding markets for European banks are experiencing acute tensionsSpreads between 3-month U.S.-dollar bank borrowing rates and U.S. 3-month overnight index swaps
a. Implied borrowing ratesSource: Bloomberg Last observation: 13 January 2012
2008 2009 2010 2011 20120
1
2
3
4
5
6Percentage points
United States Euro areaa United Kingdoma
8 The GlObal eCOnOMy BANK OF CANADA • Monetary Policy rePort • January 2012
and weaker economic prospects, is projected to constrain growth in business investment .3
Overall, the crisis in the euro area is projected to dampen global economic growth considerably, reducing the level of
3 The Federal Reserve’s 2011Q3 Senior Loan Officer Opinion Survey sug-gests that, to date, signs of tightening have been observed for foreign banks only (for lending standards on commercial and industrial loans).
world GDP by somewhat more than 1 per cent by the end of 2012, including reductions of 0 .8 per cent in the United States and 0 .6 per cent in Canada . These estimates include both direct trade effects and indirect spillovers owing to increased funding pressures, lower confidence and reduced availability of credit .
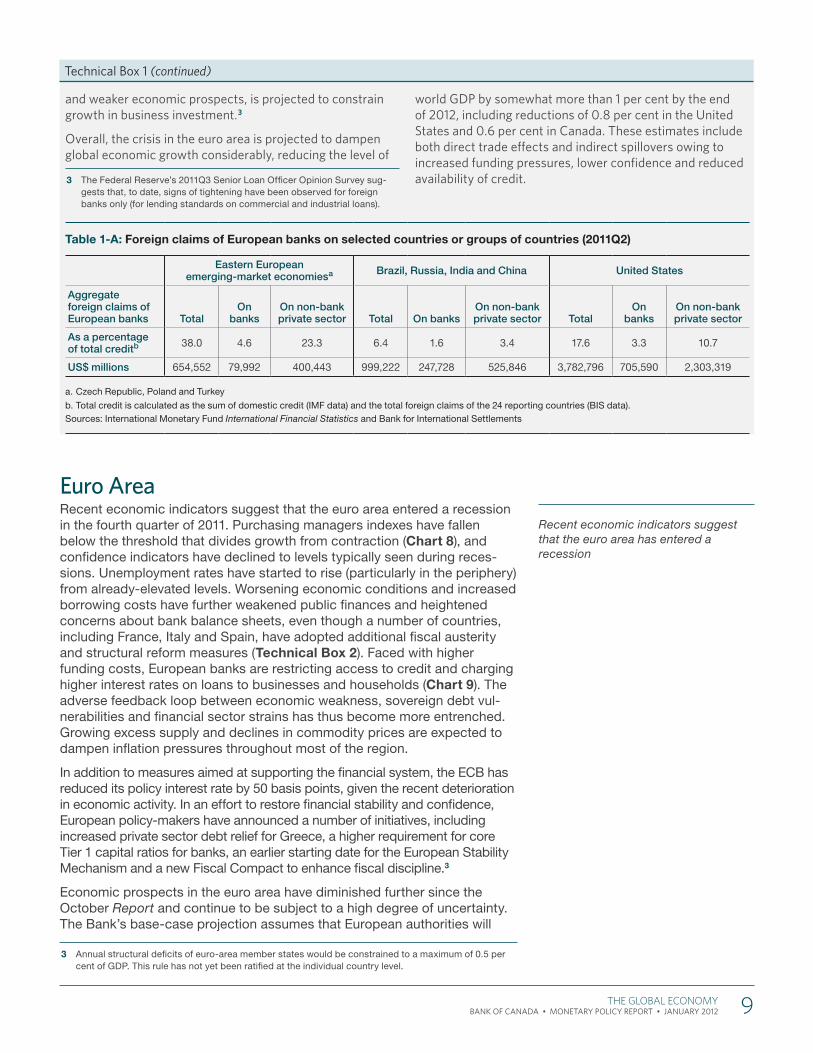
Table 1-A: Foreign claims of European banks on selected countries or groups of countries (2011Q2)
Eastern European emerging-market economiesa Brazil, Russia, India and China United States
Aggregate foreign claims of European banks Total
On banks
On non-bank private sector Total On banks
On non-bank private sector Total
On banks
On non-bank private sector
As a percentage of total creditb 38.0 4.6 23.3 6.4 1.6 3.4 17.6 3.3 10.7
US$ millions 654,552 79,992 400,443 999,222 247,728 525,846 3,782,796 705,590 2,303,319
a. Czech Republic, Poland and Turkey
b. Total credit is calculated as the sum of domestic credit (IMF data) and the total foreign claims of the 24 reporting countries (BIS data).Sources: International Monetary Fund International Financial Statistics and Bank for International Settlements
Technical Box 1 (continued)
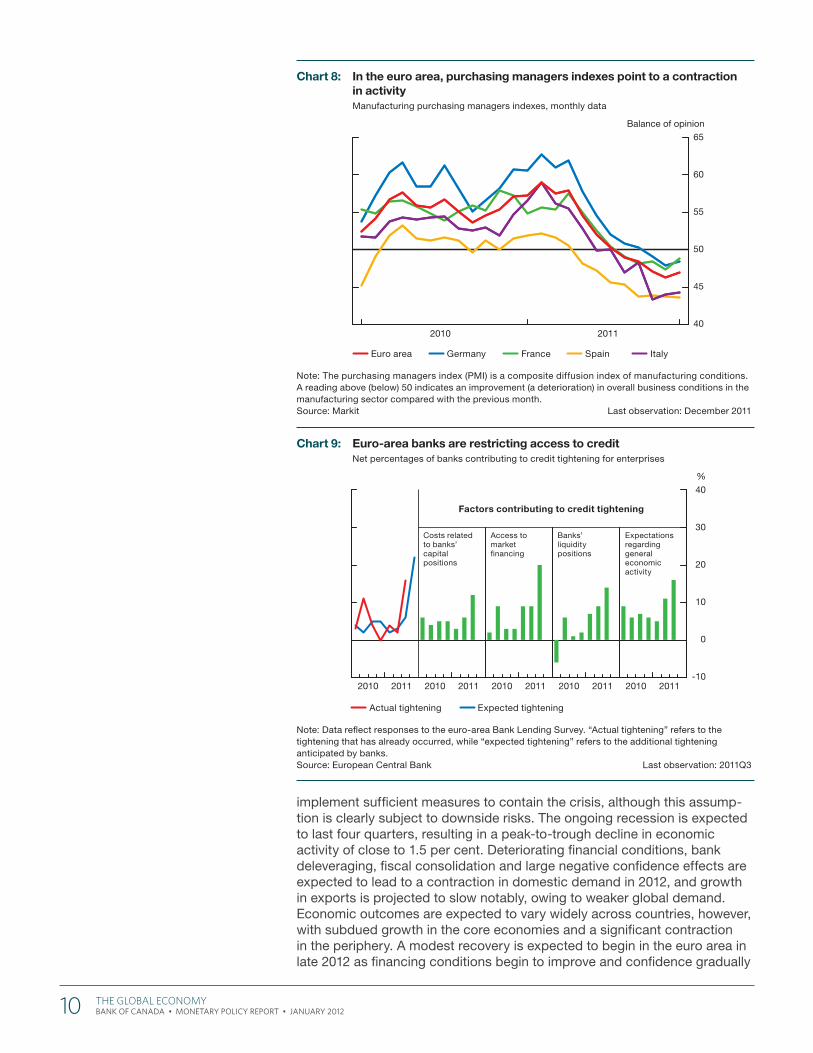
Euro AreaRecent economic indicators suggest that the euro area entered a recession in the fourth quarter of 2011. Purchasing managers indexes have fallen below the threshold that divides growth from contraction (Chart 8), and confidence indicators have declined to levels typically seen during reces-sions. Unemployment rates have started to rise (particularly in the periphery) from already-elevated levels. Worsening economic conditions and increased borrowing costs have further weakened public finances and heightened concerns about bank balance sheets, even though a number of countries, including France, Italy and Spain, have adopted additional fiscal austerity and structural reform measures (Technical Box 2). Faced with higher funding costs, European banks are restricting access to credit and charging higher interest rates on loans to businesses and households (Chart 9). The adverse feedback loop between economic weakness, sovereign debt vul-nerabilities and financial sector strains has thus become more entrenched. Growing excess supply and declines in commodity prices are expected to dampen inflation pressures throughout most of the region.
In addition to measures aimed at supporting the financial system, the ECB has reduced its policy interest rate by 50 basis points, given the recent deterioration in economic activity. In an effort to restore financial stability and confidence, European policy-makers have announced a number of initiatives, including increased private sector debt relief for Greece, a higher requirement for core Tier 1 capital ratios for banks, an earlier starting date for the European Stability Mechanism and a new Fiscal Compact to enhance fiscal discipline.3
Economic prospects in the euro area have diminished further since the October Report and continue to be subject to a high degree of uncertainty. The Bank’s base-case projection assumes that European authorities will
3 Annual structural deficits of euro-area member states would be constrained to a maximum of 0.5 per cent of GDP. This rule has not yet been ratified at the individual country level.
Recent economic indicators suggest that the euro area has entered a recession
The GlObal eCOnOMy 9 BANK OF CANADA • Monetary Policy rePort • January 2012
implement sufficient measures to contain the crisis, although this assump-tion is clearly subject to downside risks. The ongoing recession is expected to last four quarters, resulting in a peak-to-trough decline in economic activity of close to 1.5 per cent. Deteriorating financial conditions, bank deleveraging, fiscal consolidation and large negative confidence effects are expected to lead to a contraction in domestic demand in 2012, and growth in exports is projected to slow notably, owing to weaker global demand. Economic outcomes are expected to vary widely across countries, however, with subdued growth in the core economies and a significant contraction in the periphery. A modest recovery is expected to begin in the euro area in late 2012 as financing conditions begin to improve and confidence gradually
Chart 8: In the euro area, purchasing managers indexes point to a contraction in activityManufacturing purchasing managers indexes, monthly data
Note: The purchasing managers index (PMI) is a composite diffusion index of manufacturing conditions. A reading above (below) 50 indicates an improvement (a deterioration) in overall business conditions in the manufacturing sector compared with the previous month. Source: Markit Last observation: December 2011
2010 201140
45
50
55
60
65
Balance of opinion
Euro area Germany France Spain Italy
Chart 9: Euro-area banks are restricting access to creditNet percentages of banks contributing to credit tightening for enterprises
Note: Data refl ect responses to the euro-area Bank Lending Survey. “Actual tightening” refers to the tightening that has already occurred, while “expected tightening” refers to the additional tightening anticipated by banks. Source: European Central Bank Last observation: 2011Q3
2010 2011 2010 2011 2010 2011 2010 2011 2010 2011-10
0
10
20
30
40
-10
0
10
20
30
40
%%
Actual tightening Expected tightening
Factors contributing to credit tightening
Costs related to banks’ capital positions
Access to market fi nancing
Banks’ liquidity positions
Expectations regarding general economic activity
10 The GlObal eCOnOMy BANK OF CANADA • Monetary Policy rePort • January 2012
Technical Box 2
Fiscal Austerity in the Euro AreaFrom an aggregate perspective, the euro area’s public debt burden is lower than that of the United States and Japan . However, many individual countries have high public defi-cits and public debt levels well above 90 per cent of GDP .1 Similarly, while the aggregate current account deficit for the whole euro area is about 0 .5 per cent of GDP, with a small net negative international investment position, there are significant variations at the country level (Table 2-A) . Notably, some of the peripheral countries have had large negative net international investment positions of more than 20 per cent of GDP and sizable current account deficits, often in excess of 5 per cent of GDP, although these current account deficits have decreased markedly in recent months .
Elevated debt levels, lack of competitiveness, prospects of sluggish growth and deteriorating fiscal positions (owing in part to upcoming age-related pressures) have led to substantial increases in sovereign borrowing costs and, consequently, to banking sector stress in many euro-area countries . To restore fiscal balance, most euro-area countries are introducing additional measures to promote fiscal austerity and structural reforms to generate growth and ensure a sustainable debt path .2 Announced austerity plans include a mix of pension reforms, tax increases and reductions in government spending, including lower public sector employment . Government spending cuts account for most of the planned fiscal adjustment, but sizable tax
1 C. Reinhart and K. Rogoff find that debt starts to have adverse effects on growth when it exceeds 90 per cent of GDP (“Growth in a Time of Debt,” American Economic Review 100, no. 2 (2010): 573–78.)
2 Moreover, increased fiscal discipline is being considered for the whole European Union, with the most recent EU summit calling for additional fiscal rules with greater centralized oversight of national budgets.
increases are being enacted in several countries as well . Structural reforms, announced or planned, generally focus on improving competition in product markets and flexibility in labour markets .
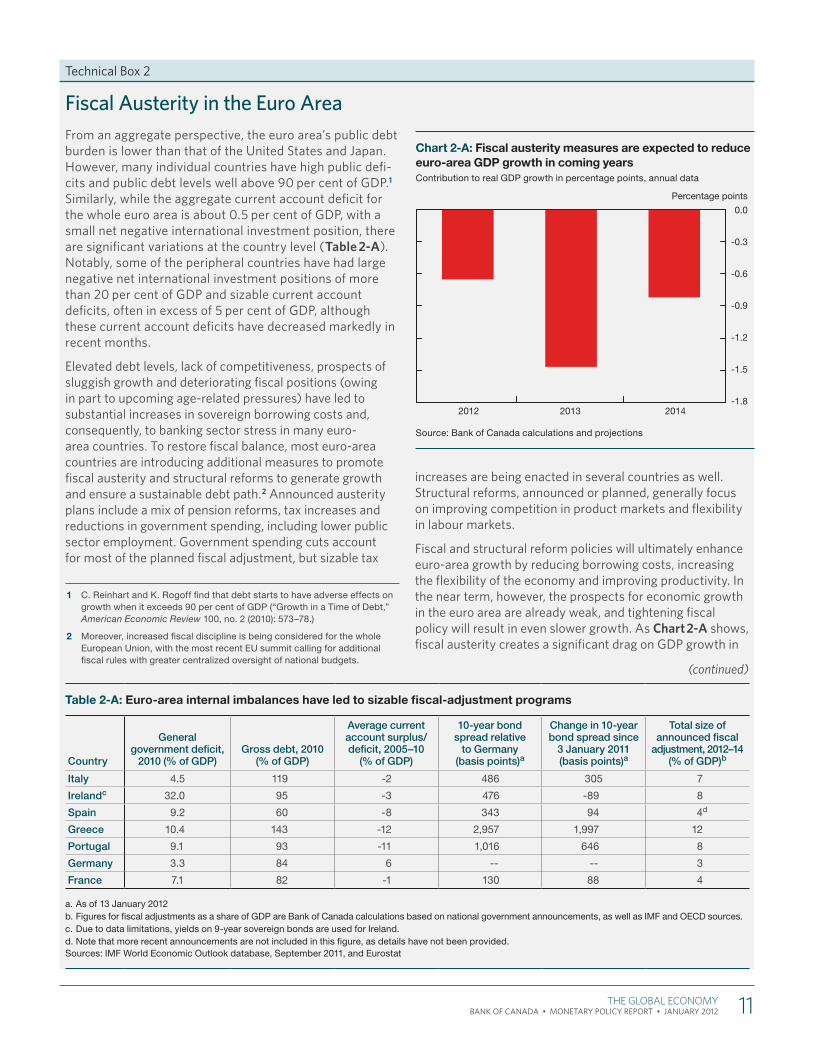
Fiscal and structural reform policies will ultimately enhance euro-area growth by reducing borrowing costs, increasing the flexibility of the economy and improving productivity . In the near term, however, the prospects for economic growth in the euro area are already weak, and tightening fiscal policy will result in even slower growth . As Chart 2-A shows, fiscal austerity creates a significant drag on GDP growth in
Table 2-A: Euro-area internal imbalances have led to sizable fiscal-adjustment programs
Country
General government deficit,
2010 (% of GDP) Gross debt, 2010
(% of GDP)
Average current account surplus/deficit, 2005–10
(% of GDP)
10-year bond spread relative
to Germany (basis points)a
Change in 10-year bond spread since
3 January 2011 (basis points)a
Total size of announced fiscal
adjustment, 2012–14 (% of GDP)b
Italy 4.5 119 -2 486 305 7
Irelandc 32.0 95 -3 476 -89 8
Spain 9.2 60 -8 343 94 4d
Greece 10.4 143 -12 2,957 1,997 12
Portugal 9.1 93 -11 1,016 646 8
Germany 3.3 84 6 -- -- 3
France 7.1 82 -1 130 88 4
a. As of 13 January 2012 b. Figures for fiscal adjustments as a share of GDP are Bank of Canada calculations based on national government announcements, as well as IMF and OECD sources.c. Due to data limitations, yields on 9-year sovereign bonds are used for Ireland.d. Note that more recent announcements are not included in this figure, as details have not been provided.Sources: IMF World Economic Outlook database, September 2011, and Eurostat
Chart 2-A: Fiscal austerity measures are expected to reduce euro-area GDP growth in coming yearsContribution to real GDP growth in percentage points, annual data
Source: Bank of Canada calculations and projections
2012 2013 2014
Percentage points
-1.8
-1.5
-1.2
-0.9
-0.6
-0.3
0.0
(continued)
The GlObal eCOnOMy 11 BANK OF CANADA • Monetary Policy rePort • January 2012
recovers in response to the implementation of required policy measures and structural reforms. Overall, relative to expectations in the October Report, the level of real GDP in the euro area is projected to be about 1 per cent lower at the end of 2013.
United StatesRecent economic activity in the United States has been stronger than anticipated. Boosted by higher consumer spending and business invest-ment, growth in real GDP rebounded to approximately 2.5 per cent in the second half of 2011. Despite this positive surprise, the U.S. recovery is expected to proceed at a more modest pace through 2012–13, with GDP growth averaging roughly 2 per cent per year, owing to headwinds from household deleveraging, fiscal consolidation and spillover effects from the European crisis.
U.S. inflation pressures are projected to decrease in response to lower commodity prices and significant excess capacity. As a result, the Federal Reserve is expected to maintain very accommodative monetary condi-tions. Average annual GDP growth in the United States is projected to be slightly stronger in 2012 than anticipated in the October Report, mainly reflecting the rebound in growth in the second half of 2011 and reduced fiscal tightening. Growth in 2013 is, however, expected to be significantly weaker.
Fiscal consolidation is projected to exert a drag on U.S. real GDP growth amounting to about 0.8 percentage points in 2012 and about 2.5 percentage points in 2013 (Chart 10). The estimated impact in 2012 is smaller than was anticipated in the October Report, given improved prospects for the exten-sion of the payroll tax cuts and unemployment insurance benefits that were scheduled to expire at the end of 2011.4 The estimated drag in 2013 is larger,
4 Although these measures have been renewed for two months, the Bank’s base-case scenario now assumes that they will be extended to the end of 2012.
Growth in U.S. real GDP rebounded in the second half of 2011, but is expected to proceed at a more modest pace
Fiscal consolidation is projected to exert a drag on U.S. real GDP growth
the Bank’s outlook, removing about 0 .7 percentage points from euro-area growth in 2012, 1 .5 percentage points in 2013 and 0 .8 percentage points in 2014 .3 In light of this deficiency in demand, the global rotation of demand (and hence greater demand for European exports) will be critical to support growth in the euro area during this period .
The negative effects from austerity are not necessarily limited to their immediate impact on GDP—there is a risk that a negative feedback loop between weak economic growth, declining tax revenues, stress in the banking sector and rising borrowing costs could become more severe . Negative shocks
3 Note that fiscal austerity will have a net negative effect on growth relative to a scenario where delayed fiscal consolidation does not negatively affect growth.
to growth will lower tax revenues and may raise borrowing costs, exacerbating government deficits and increasing pres-sures on euro-area banks (since they have large exposures to sovereign debt) . This in turn could create a need for greater austerity, which would further reduce GDP growth .
Conversely, if too little fiscal consolidation is implemented, the outcome could be much worse . Insufficient or non-cred-ible commitments to fiscal and structural reforms risk loss of investor confidence and a rapid escalation of borrowing costs . Such a scenario would likely entail an even deeper recession and, ultimately, the need for more severe fiscal tightening and even debt writedowns .
This dilemma underscores the importance of structural reforms to boost growth .
Technical Box 2 (continued)
12 The GlObal eCOnOMy BANK OF CANADA • Monetary Policy rePort • January 2012
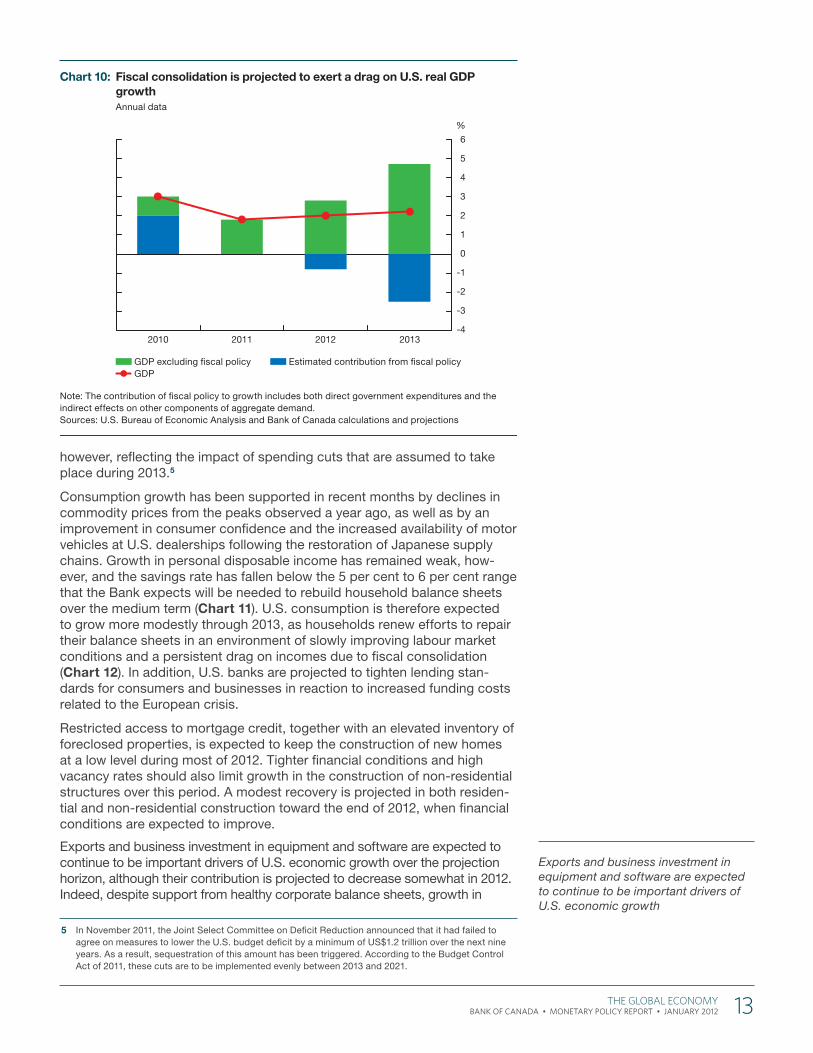
however, reflecting the impact of spending cuts that are assumed to take place during 2013.5
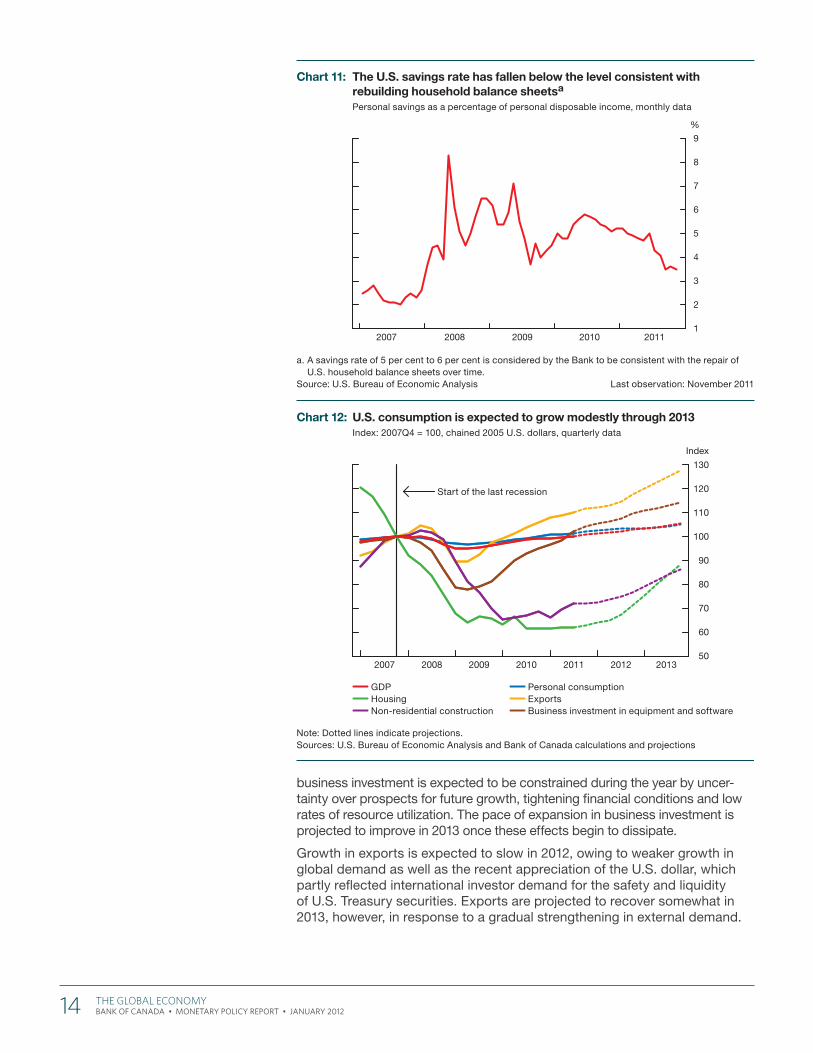
Consumption growth has been supported in recent months by declines in commodity prices from the peaks observed a year ago, as well as by an improvement in consumer confidence and the increased availability of motor vehicles at U.S. dealerships following the restoration of Japanese supply chains. Growth in personal disposable income has remained weak, how-ever, and the savings rate has fallen below the 5 per cent to 6 per cent range that the Bank expects will be needed to rebuild household balance sheets over the medium term (Chart 11). U.S. consumption is therefore expected to grow more modestly through 2013, as households renew efforts to repair their balance sheets in an environment of slowly improving labour market conditions and a persistent drag on incomes due to fiscal consolidation (Chart 12). In addition, U.S. banks are projected to tighten lending stan-dards for consumers and businesses in reaction to increased funding costs related to the European crisis.
Restricted access to mortgage credit, together with an elevated inventory of foreclosed properties, is expected to keep the construction of new homes at a low level during most of 2012. Tighter financial conditions and high vacancy rates should also limit growth in the construction of non-residential structures over this period. A modest recovery is projected in both residen-tial and non-residential construction toward the end of 2012, when financial conditions are expected to improve.
Exports and business investment in equipment and software are expected to continue to be important drivers of U.S. economic growth over the projection horizon, although their contribution is projected to decrease somewhat in 2012. Indeed, despite support from healthy corporate balance sheets, growth in
5 In November 2011, the Joint Select Committee on Deficit Reduction announced that it had failed to agree on measures to lower the U.S. budget deficit by a minimum of US$1.2 trillion over the next nine years. As a result, sequestration of this amount has been triggered. According to the Budget Control Act of 2011, these cuts are to be implemented evenly between 2013 and 2021.
Exports and business investment in equipment and software are expected to continue to be important drivers of U.S. economic growth
Chart 10: Fiscal consolidation is projected to exert a drag on U.S. real GDP growthAnnual data
Note: The contribution of fi scal policy to growth includes both direct government expenditures and the indirect effects on other components of aggregate demand. Sources: U.S. Bureau of Economic Analysis and Bank of Canada calculations and projections
2010 2011 2012 2013-4
-3
-2
-1
0
1
2
3
4
5
6
%
GDP excluding fi scal policy GDP
Estimated contribution from fi scal policy
The GlObal eCOnOMy 13 BANK OF CANADA • Monetary Policy rePort • January 2012
business investment is expected to be constrained during the year by uncer-tainty over prospects for future growth, tightening financial conditions and low rates of resource utilization. The pace of expansion in business investment is projected to improve in 2013 once these effects begin to dissipate.
Growth in exports is expected to slow in 2012, owing to weaker growth in global demand as well as the recent appreciation of the U.S. dollar, which partly reflected international investor demand for the safety and liquidity of U.S. Treasury securities. Exports are projected to recover somewhat in 2013, however, in response to a gradual strengthening in external demand.
Chart 12: U.S. consumption is expected to grow modestly through 2013Index: 2007Q4 = 100, chained 2005 U.S. dollars, quarterly data
Note: Dotted lines indicate projections.Sources: U.S. Bureau of Economic Analysis and Bank of Canada calculations and projections
2007 2008 2009 2010 2011 2012 201350
60
70
80
90
100
110
120
130
Index
GDP Housing Non-residential construction
Personal consumption Exports Business investment in equipment and software
Start of the last recession
Chart 11: The U.S. savings rate has fallen below the level consistent with rebuilding household balance sheetsa
Personal savings as a percentage of personal disposable income, monthly data
a. A savings rate of 5 per cent to 6 per cent is considered by the Bank to be consistent with the repair of U.S. household balance sheets over time.
Source: U.S. Bureau of Economic Analysis Last observation: November 2011
2007 2008 2009 2010 20111
2
3
4
5
6
7
8
9
%
14 The GlObal eCOnOMy BANK OF CANADA • Monetary Policy rePort • January 2012
Other Advanced EconomiesIn Japan, activity related to reconstruction helped boost the growth of real GDP to 5.6 per cent in the third quarter of 2011. Real GDP growth moder-ated sharply in the fourth quarter of last year, however, and is projected to average less than 2.0 per cent per year through 2013 as the impetus from the rebuilding of infrastructure wanes. At the same time, slowing external demand and the recent sharp appreciation of the yen are expected to weigh on export growth. In reaction to the deceleration in economic activity, the Bank of Japan has further expanded the size of its asset-purchase program. The central bank also intervened in foreign exchange markets at the end of October to limit the rise of the yen.
Real GDP growth in other advanced economies has slowed recently and is expected to be subdued in coming quarters, reflecting a weakening in external demand, declining household and business confidence, and con-tinued drag from fiscal consolidation. To counter the deterioration in eco-nomic conditions, monetary authorities in a number of countries, including Australia, Norway and Sweden, have lowered their policy interest rates. Some economies with significant trade and financial links with the euro area could experience a recession. Economic activity is expected to gather momentum toward the end of 2012, supported by a modest recovery in global growth and an improvement in confidence.
Emerging-Market EconomiesEconomic growth in China decelerated to 9.1 per cent in the third quarter of 2011 in response to the past tightening in monetary policy and slowing external demand, especially from Europe, its most important trading partner. Measures undertaken by the authorities to cool activity in the real estate sector have led to a softening in housing demand and a fall in property prices. Moderating food prices contributed to a marked decline in the overall inflation rate to 4.1 per cent in December from a recent peak of 6.5 per cent in July. With inflation pressures easing, Chinese authorities have shifted toward a more accommodative monetary policy stance and in December lowered the reserve requirement ratio for financial institu-tions by 50 basis points. Growth in real GDP is nevertheless projected to moderate to around 8 per cent over 2012–13. Structural reforms and a modest appreciation of the Chinese real exchange rate are expected to support a gradual rotation of demand away from investment and exports and toward consumption.
Despite some slowing due to a moderation in global demand, real GDP growth in other emerging-market economies is expected to remain relatively strong, supported by an easing in monetary policy. This generally positive out-look is tempered, however, by the effects of increased risk aversion in global financial markets, which has led to capital outflows from some emerging-market economies, implying some tightening in credit conditions. Growth is projected to slow particularly rapidly in the countries of Central and Eastern Europe, since their exports are directed principally toward Europe and their financial systems are heavily dominated by Western European banks.
Commodity PricesPrices for non-energy commodities are essentially unchanged since the October Report. While the prices of base metals and agricultural commod-ities have recovered somewhat in recent weeks following declines in late 2011, the prices of non-energy commodities are projected to fall in 2012 in
Real GDP growth in Japan is projected to average less than 2.0 per cent per year through 2013 as the impetus from the rebuilding of infrastructure wanes
Economic growth in China decelerated to 9.1 per cent in the third quarter
With inflation pressures easing, Chinese authorities have shifted toward a more accommodative monetary policy stance
Prices of non-energy commodities are projected to fall in 2012
The GlObal eCOnOMy 15 BANK OF CANADA • Monetary Policy rePort • January 2012
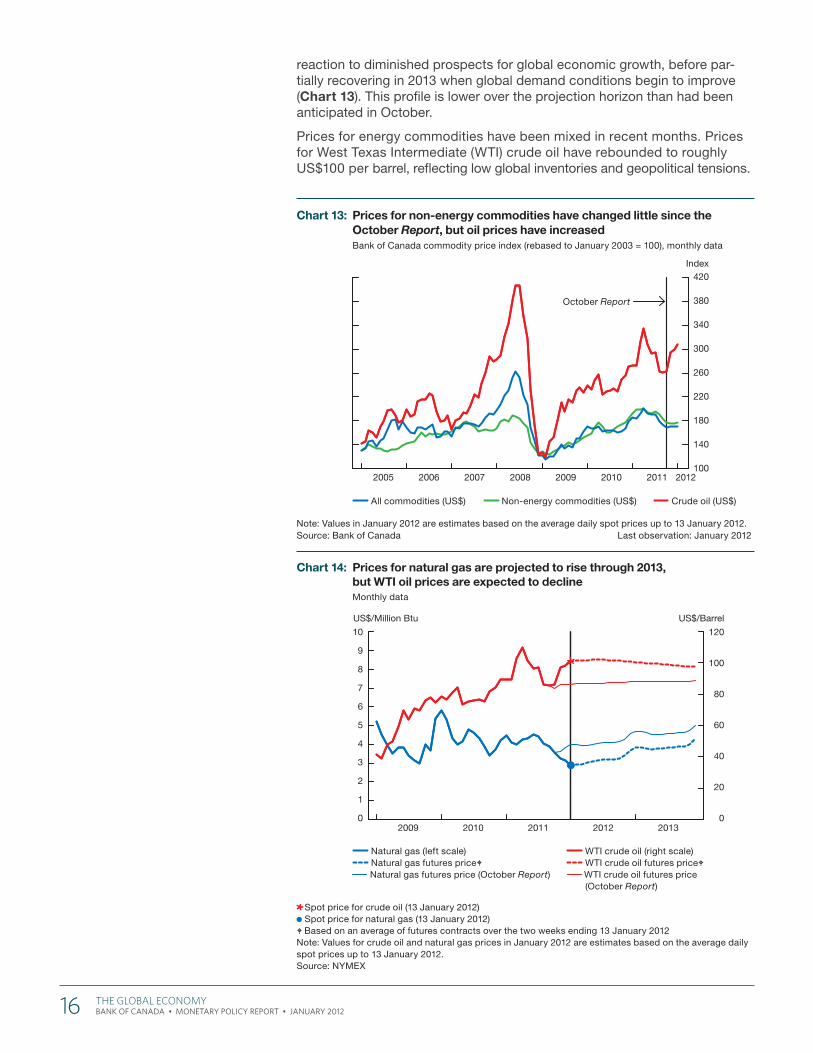
reaction to diminished prospects for global economic growth, before par-tially recovering in 2013 when global demand conditions begin to improve (Chart 13). This profile is lower over the projection horizon than had been anticipated in October.
Prices for energy commodities have been mixed in recent months. Prices for West Texas Intermediate (WTI) crude oil have rebounded to roughly US$100 per barrel, reflecting low global inventories and geopolitical tensions.
Chart 13: Prices for non-energy commodities have changed little since the October Report, but oil prices have increasedBank of Canada commodity price index (rebased to January 2003 = 100), monthly data
Note: Values in January 2012 are estimates based on the average daily spot prices up to 13 January 2012.Source: Bank of Canada Last observation: January 2012
2005 2006 2007 2008 2009 2010 2011 2012100
140
180
220
260
300
340
380
420Index
All commodities (US$) Non-energy commodities (US$) Crude oil (US$)
October Report
Chart 14: Prices for natural gas are projected to rise through 2013, but WTI oil prices are expected to declineMonthly data
Spot price for crude oil (13 January 2012)Spot price for natural gas (13 January 2012)
Based on an average of futures contracts over the two weeks ending 13 January 2012Note: Values for crude oil and natural gas prices in January 2012 are estimates based on the average daily spot prices up to 13 January 2012.Source: NYMEX
0
20
40
60
80
100
120
0
1
2
3
4
5
6
7
8
9
10
2009 2010 2011 2012 2013
US$/BarrelUS$/Million Btu
Natural gas (left scale) Natural gas futures price Natural gas futures price (October Report)
WTI crude oil (right scale) WTI crude oil futures price WTI crude oil futures price (October Report)
16 The GlObal eCOnOMy BANK OF CANADA • Monetary Policy rePort • January 2012
In addition, improved prospects for alleviating the inventory overhang in Cushing have led to a narrowing in the WTI-Brent spread to around US$10 per barrel from US$24 per barrel in October. The latest futures curve suggests that WTI crude prices are projected to ease modestly through the end of 2013, although prices are expected to remain above the levels anticipated at the time of the October Report (Chart 14). In contrast, natural gas prices in North America have fallen sharply in response to unseasonably warm weather, in an environment of persistent excess supply. While prices are projected to recover through 2013 based on the latest futures curve, the level of natural gas prices is expected to remain lower through 2013 than anticipated in the October Report.
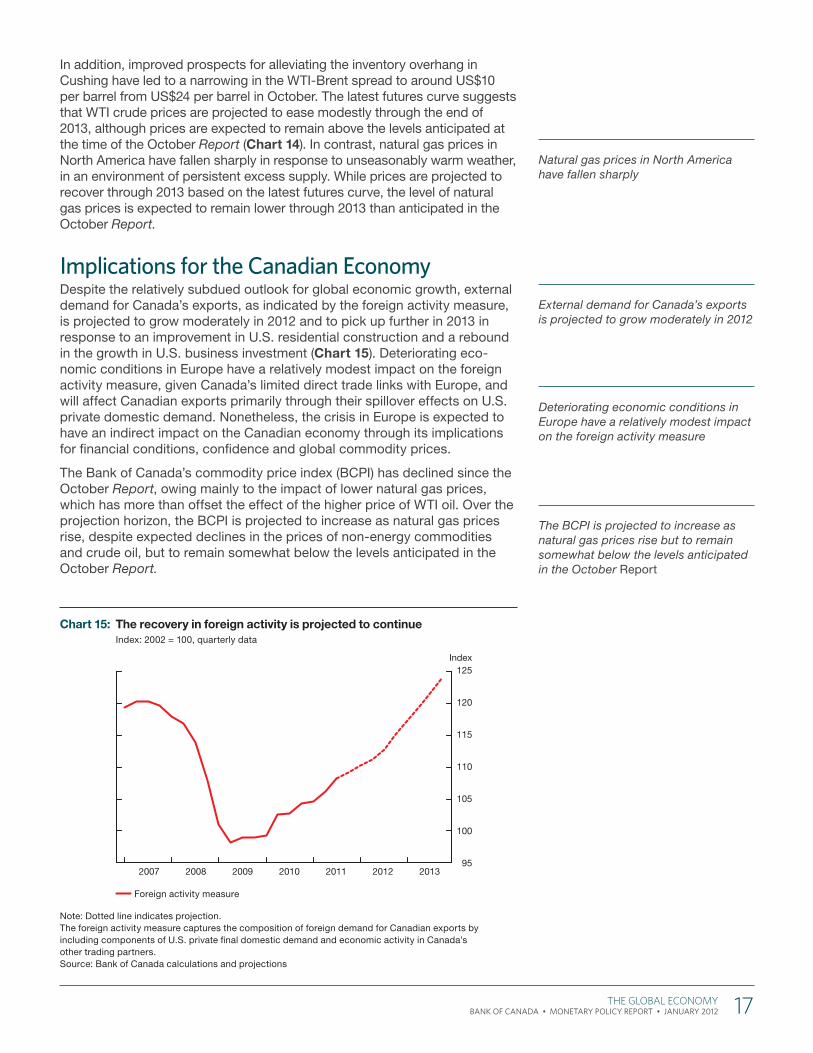
Implications for the Canadian EconomyDespite the relatively subdued outlook for global economic growth, external demand for Canada’s exports, as indicated by the foreign activity measure, is projected to grow moderately in 2012 and to pick up further in 2013 in response to an improvement in U.S. residential construction and a rebound in the growth in U.S. business investment (Chart 15). Deteriorating eco-nomic conditions in Europe have a relatively modest impact on the foreign activity measure, given Canada’s limited direct trade links with Europe, and will affect Canadian exports primarily through their spillover effects on U.S. private domestic demand. Nonetheless, the crisis in Europe is expected to have an indirect impact on the Canadian economy through its implications for financial conditions, confidence and global commodity prices.
The Bank of Canada’s commodity price index (BCPI) has declined since the October Report, owing mainly to the impact of lower natural gas prices, which has more than offset the effect of the higher price of WTI oil. Over the projection horizon, the BCPI is projected to increase as natural gas prices rise, despite expected declines in the prices of non-energy commodities and crude oil, but to remain somewhat below the levels anticipated in the October Report.
Natural gas prices in North America have fallen sharply
External demand for Canada’s exports is projected to grow moderately in 2012
Deteriorating economic conditions in Europe have a relatively modest impact on the foreign activity measure
The BCPI is projected to increase as natural gas prices rise but to remain somewhat below the levels anticipated in the October Report
Chart 15: The recovery in foreign activity is projected to continueIndex: 2002 = 100, quarterly data
Note: Dotted line indicates projection.The foreign activity measure captures the composition of foreign demand for Canadian exports by including components of U.S. private fi nal domestic demand and economic activity in Canada’s other trading partners.Source: Bank of Canada calculations and projections
2007 2008 2009 2010 2011 2012 201395
100
105
110
115
120
125Index
Foreign activity measure
The GlObal eCOnOMy 17 BANK OF CANADA • Monetary Policy rePort • January 2012
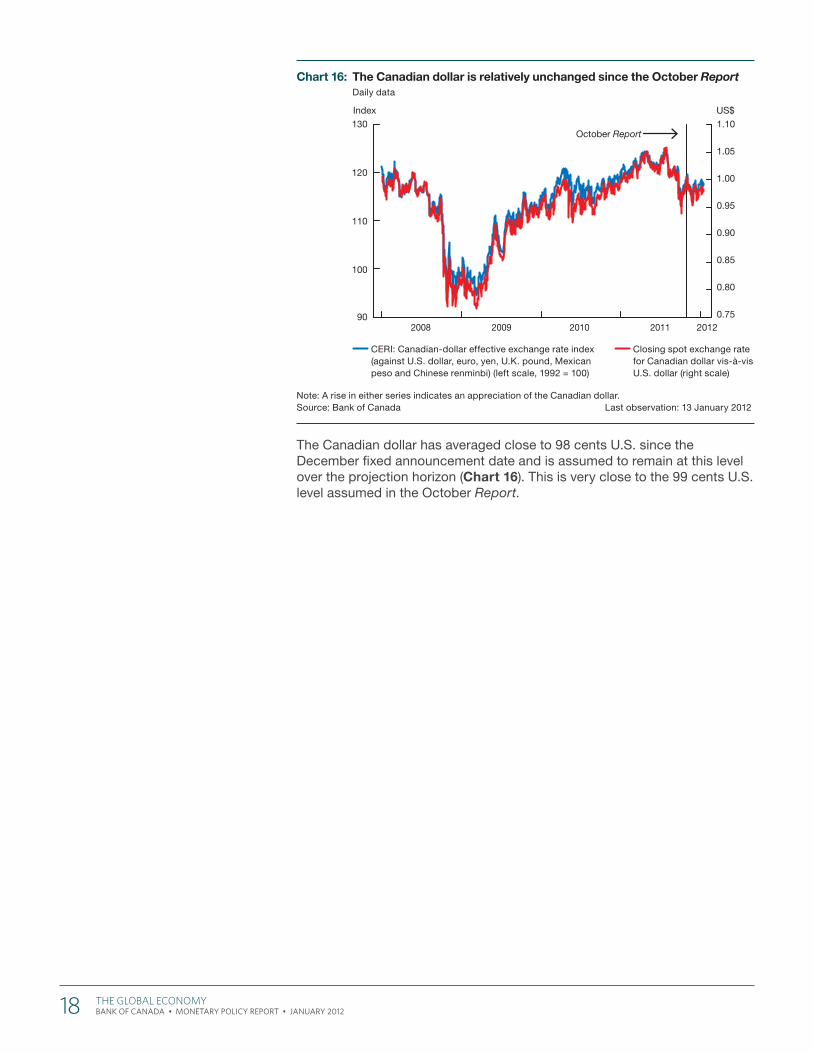
The Canadian dollar has averaged close to 98 cents U.S. since the December fixed announcement date and is assumed to remain at this level over the projection horizon (Chart 16). This is very close to the 99 cents U.S. level assumed in the October Report.
Chart 16: The Canadian dollar is relatively unchanged since the October ReportDaily data
Note: A rise in either series indicates an appreciation of the Canadian dollar.Source: Bank of Canada Last observation: 13 January 2012
2008 2009 2010 2011 201290
100
110
120
130
0.75
0.80
0.85
0.90
0.95
1.00
1.05
1.10
US$Index
October Report
CERI: Canadian-dollar effective exchange rate index (against U.S. dollar, euro, yen, U.K. pound, Mexican peso and Chinese renminbi) (left scale, 1992 = 100)
Closing spot exchange rate for Canadian dollar vis-à-vis U.S. dollar (right scale)
18 The GlObal eCOnOMy BANK OF CANADA • Monetary Policy rePort • January 2012

The Bank’s outlook for the Canadian economy is little changed relative to the October Report. Although growth in the second half of 2011 was stronger than anticipated, the weaker external outlook is expected to affect the Canadian economy through confidence, financial and trade channels. The Bank continues to expect that these headwinds will limit economic growth in Canada in 2012 to a modest pace, after which growth is projected to pick up as the global environment improves. Private domestic demand is anticipated to remain the primary driver of growth in Canada throughout the projection horizon, with relatively weak global economic growth and com-petitiveness challenges, including the persistent strength of the Canadian dollar, continuing to restrain net exports.
Consistent with this outlook, the Bank continues to expect that the output gap will persist well into 2013. Excess supply in the economy, together with mod-erate growth in labour compensation and dissipating pressures from com-modity prices, is anticipated to result in a moderation in both total and core CPI inflation to below 2 per cent around mid-2012. This moderation is pro-jected to be slightly less pronounced than in the October Report, partly reflecting some expected persistence in the slightly firmer prices seen recently for a few goods, as well as a slightly higher assumed path for oil prices. Nonetheless, the broad profile for inflation in Canada is little changed, with the Bank projecting both total and core inflation to return gradually to 2 per cent over the latter part of the projection horizon as slack in the economy is slowly absorbed and inflation expectations remain well anchored.
Financial ConditionsDespite the deterioration in global financial conditions, the aggregate supply and price of credit to businesses and households in Canada remain very stimulative (Chart 17), providing important ongoing support to the economic expansion. Both the Bank’s Senior Loan Officer Survey (available on the Bank’s website under Publications and Research > Periodicals > SLOS 2011Q4) and the Business Outlook Survey (available on the Bank’s website under Publications and Research > Periodicals > BOS Winter 2011) suggested that business-lending conditions were little changed in the fourth quarter, after several quarters of sustained easing (Chart 18). Household credit remains readily available at very low rates.
Canadian financial markets have been resilient in recent months. The S&P/TSX Composite Index is roughly unchanged since the October Report, as are the relative prices of Canadian bank equities (Chart 19). Canadian
The Bank’s outlook for the Canadian economy is little changed relative to the October Report
Total and core CPI inflation are expected to moderate to below 2 per cent around mid-2012 … before returning gradually to 2 per cent over the latter part of the projection horizon
The aggregate supply and price of credit to businesses and households in Canada remain very stimulative
The Canadian economy
The Canadian eCOnOMy 19 BANK OF CANADA • Monetary Policy rePort • January 2012
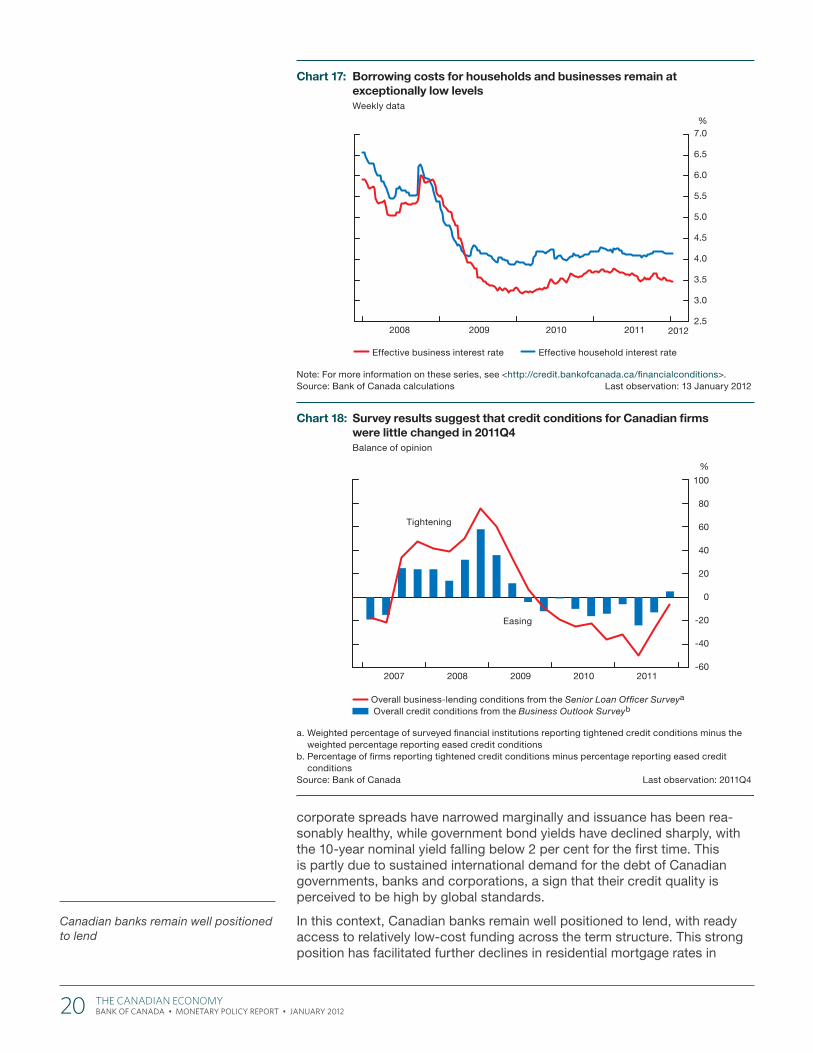
corporate spreads have narrowed marginally and issuance has been rea-sonably healthy, while government bond yields have declined sharply, with the 10-year nominal yield falling below 2 per cent for the first time. This is partly due to sustained international demand for the debt of Canadian governments, banks and corporations, a sign that their credit quality is perceived to be high by global standards.
In this context, Canadian banks remain well positioned to lend, with ready access to relatively low-cost funding across the term structure. This strong position has facilitated further declines in residential mortgage rates in
Canadian banks remain well positioned to lend
Chart 17: Borrowing costs for households and businesses remain at exceptionally low levelsWeekly data
Note: For more information on these series, see <http://credit.bankofcanada.ca/fi nancialconditions>.Source: Bank of Canada calculations Last observation: 13 January 2012
2008 2009 2010 2011 2012
%
2.5
3.0
3.5
4.0
4.5
5.0
5.5
6.0
6.5
7.0
Effective business interest rate Effective household interest rate
Chart 18: Survey results suggest that credit conditions for Canadian fi rms were little changed in 2011Q4Balance of opinion
a. Weighted percentage of surveyed fi nancial institutions reporting tightened credit conditions minus the weighted percentage reporting eased credit conditions
b. Percentage of fi rms reporting tightened credit conditions minus percentage reporting eased credit conditions
Source: Bank of Canada Last observation: 2011Q4
-60
-40
-20
0
20
40
60
80
100
2007 2008 2009 2010 2011
%
For internal purposes only; will not print in fi nal publicationFile name: CEA - balance of opinion - EN.indd
Overall business-lending conditions from the Senior Loan Offi cer Surveya
Overall credit conditions from the Business Outlook Surveyb
Tightening
Easing
20 The Canadian eCOnOMy BANK OF CANADA • Monetary Policy rePort • January 2012
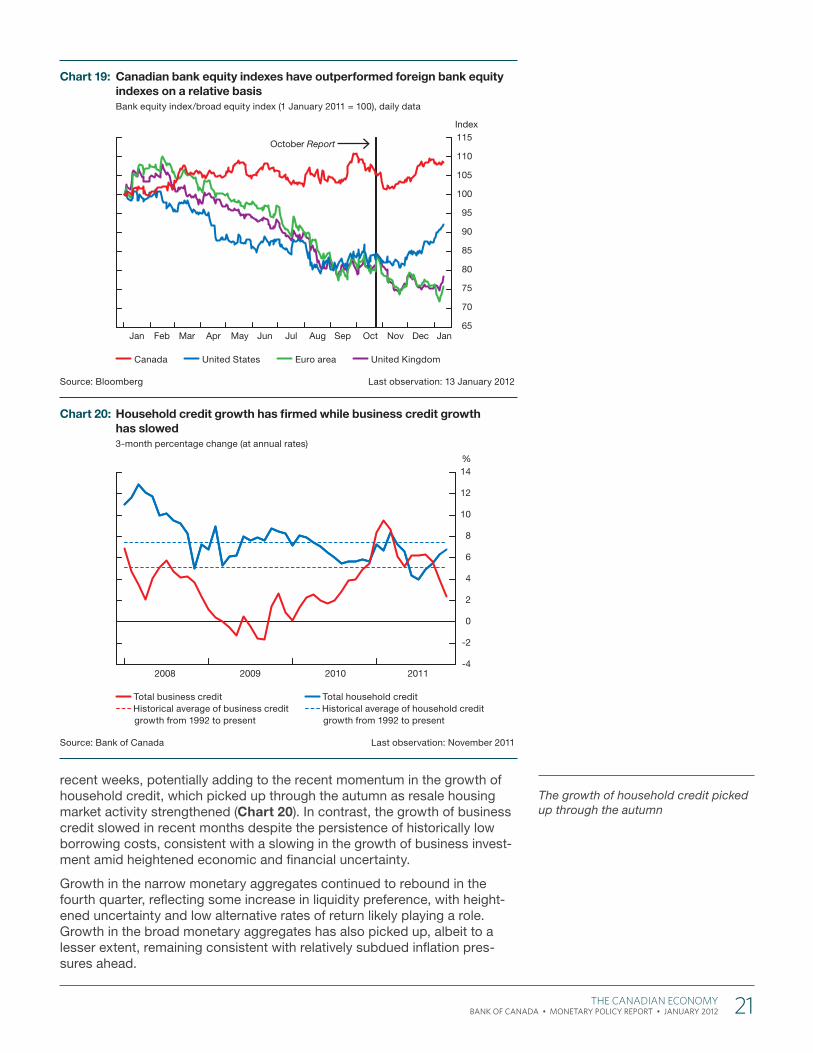
recent weeks, potentially adding to the recent momentum in the growth of household credit, which picked up through the autumn as resale housing market activity strengthened (Chart 20). In contrast, the growth of business credit slowed in recent months despite the persistence of historically low borrowing costs, consistent with a slowing in the growth of business invest-ment amid heightened economic and financial uncertainty.
Growth in the narrow monetary aggregates continued to rebound in the fourth quarter, reflecting some increase in liquidity preference, with height-ened uncertainty and low alternative rates of return likely playing a role. Growth in the broad monetary aggregates has also picked up, albeit to a lesser extent, remaining consistent with relatively subdued inflation pres-sures ahead.
The growth of household credit picked up through the autumn
Chart 20: Household credit growth has fi rmed while business credit growth has slowed3-month percentage change (at annual rates)
Source: Bank of Canada Last observation: November 2011
2008 2009 2010 2011-4
-2
0
2
4
6
8
10
12
14%
Total business credit Historical average of business credit growth from 1992 to present
Total household credit Historical average of household credit growth from 1992 to present
Chart 19: Canadian bank equity indexes have outperformed foreign bank equity indexes on a relative basisBank equity index/broad equity index (1 January 2011 = 100), daily data
Source: Bloomberg Last observation: 13 January 2012
65
70
75
80
85
90
95
100
105
110
115October Report
Jan Feb Mar Apr May Jun Jul Aug Sep Oct Nov Dec Jan
Index
Canada United States Euro area United Kingdom
The Canadian eCOnOMy 21 BANK OF CANADA • Monetary Policy rePort • January 2012
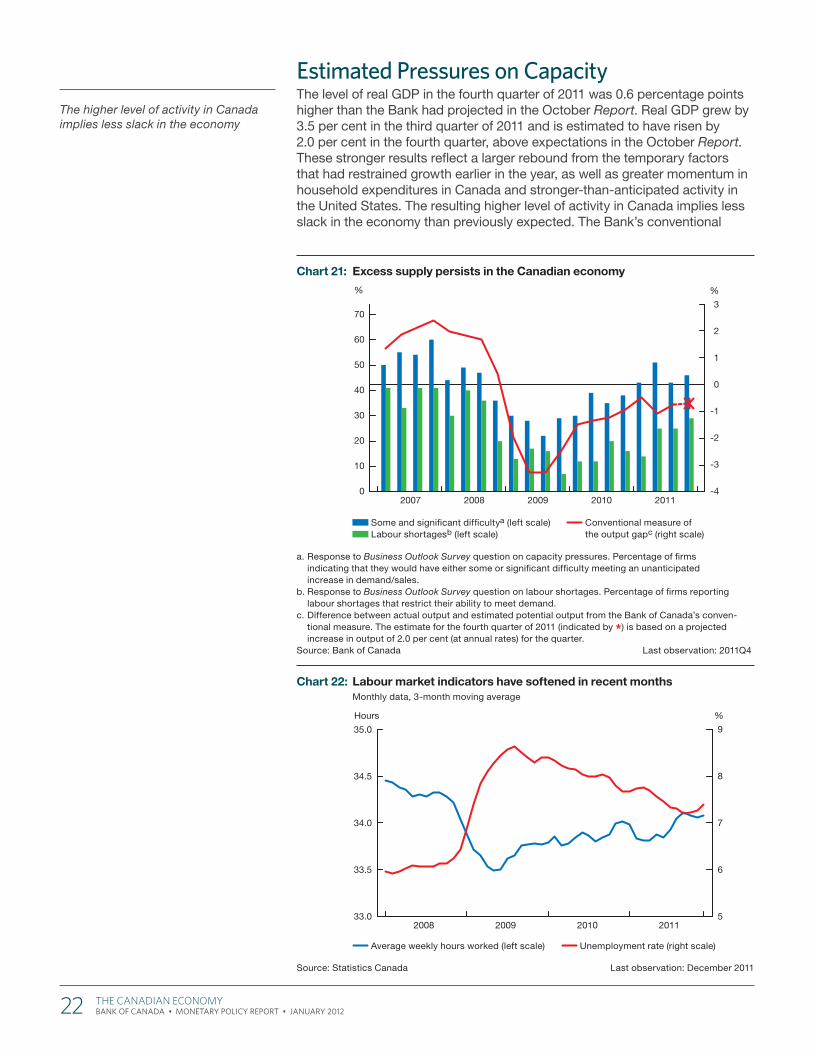
Estimated Pressures on CapacityThe level of real GDP in the fourth quarter of 2011 was 0.6 percentage points higher than the Bank had projected in the October Report. Real GDP grew by 3.5 per cent in the third quarter of 2011 and is estimated to have risen by 2.0 per cent in the fourth quarter, above expectations in the October Report. These stronger results reflect a larger rebound from the temporary factors that had restrained growth earlier in the year, as well as greater momentum in household expenditures in Canada and stronger-than-anticipated activity in the United States. The resulting higher level of activity in Canada implies less slack in the economy than previously expected. The Bank’s conventional
The higher level of activity in Canada implies less slack in the economy
Chart 21: Excess supply persists in the Canadian economy
a. Response to Business Outlook Survey question on capacity pressures. Percentage of fi rms indicating that they would have either some or signifi cant diffi culty meeting an unanticipated increase in demand/sales.
b. Response to Business Outlook Survey question on labour shortages. Percentage of fi rms reporting labour shortages that restrict their ability to meet demand.
c. Difference between actual output and estimated potential output from the Bank of Canada’s conven-tional measure. The estimate for the fourth quarter of 2011 (indicated by *) is based on a projected increase in output of 2.0 per cent (at annual rates) for the quarter.
Source: Bank of Canada Last observation: 2011Q4
-4
-3
-2
-1
0
1
2
3
0
10
20
30
40
50
60
70
2007 2008 2009 2010 2011
%%
Some and signifi cant diffi cultya (left scale) Labour shortagesb (left scale)
Conventional measure of the output gapc (right scale)
Chart 22: Labour market indicators have softened in recent monthsMonthly data, 3-month moving average
Source: Statistics Canada Last observation: December 2011
5
6
7
8
9
2008 2009 2010 2011
%Hours
33.0
33.5
34.0
34.5
35.0
Average weekly hours worked (left scale) Unemployment rate (right scale)
22 The Canadian eCOnOMy BANK OF CANADA • Monetary Policy rePort • January 2012
measure of the output gap has shown similar dynamics, narrowing to -0.7 per cent in the fourth quarter of 2011 (Chart 21). The Bank’s winter Business Outlook Survey also showed that the proportion of firms that would have difficulty responding to an unexpected increase in demand edged up relative to the previous survey, remaining at a level close to its historical average.
In contrast, conditions in the labour market have softened in recent months. The unemployment rate rose through the fourth quarter to reach 7.5 per cent in December, reflecting a decline in private sector employ-ment, and average weekly hours worked have fallen (Chart 22). While responses to the Bank’s winter Business Outlook Survey showed an increase in the proportion of firms reporting labour shortages, this propor-tion remains below its historical average.
On balance, the Bank judges that the economy was operating at roughly three-quarters of a per cent below its production capacity in the fourth quarter of 2011, a smaller degree of slack than the Bank had anticipated in the October Report.
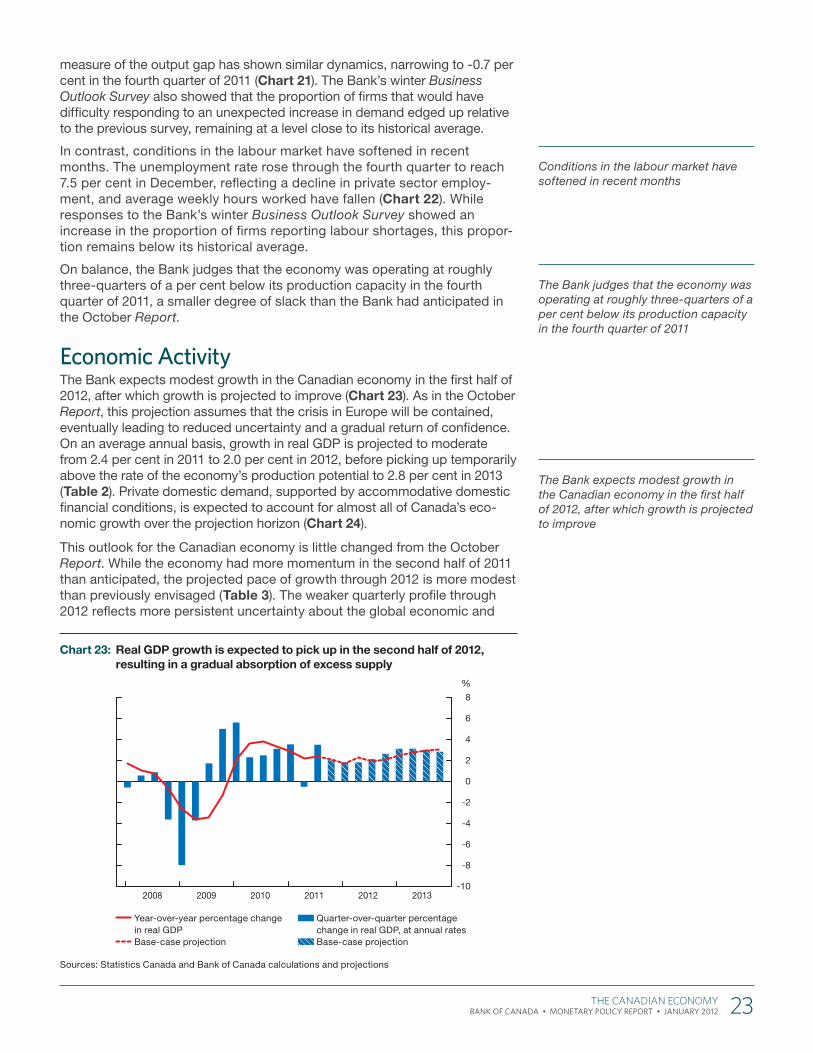
Economic ActivityThe Bank expects modest growth in the Canadian economy in the first half of 2012, after which growth is projected to improve (Chart 23). As in the October Report, this projection assumes that the crisis in Europe will be contained, eventually leading to reduced uncertainty and a gradual return of confidence. On an average annual basis, growth in real GDP is projected to moderate from 2.4 per cent in 2011 to 2.0 per cent in 2012, before picking up temporarily above the rate of the economy’s production potential to 2.8 per cent in 2013 (Table 2). Private domestic demand, supported by accommodative domestic financial conditions, is expected to account for almost all of Canada’s eco-nomic growth over the projection horizon (Chart 24).
This outlook for the Canadian economy is little changed from the October Report. While the economy had more momentum in the second half of 2011 than anticipated, the projected pace of growth through 2012 is more modest than previously envisaged (Table 3). The weaker quarterly profile through 2012 reflects more persistent uncertainty about the global economic and
Conditions in the labour market have softened in recent months
The Bank judges that the economy was operating at roughly three-quarters of a per cent below its production capacity in the fourth quarter of 2011
The Bank expects modest growth in the Canadian economy in the first half of 2012, after which growth is projected to improve
Chart 23: Real GDP growth is expected to pick up in the second half of 2012, resulting in a gradual absorption of excess supply
Sources: Statistics Canada and Bank of Canada calculations and projections
-10
-8
-6
-4
-2
0
2
4
6
8
2008 2009 2010 2011 2012 2013
%
Year-over-year percentage change in real GDP
Base-case projection
Quarter-over-quarter percentage change in real GDP, at annual rates
Base-case projection
The Canadian eCOnOMy 23 BANK OF CANADA • Monetary Policy rePort • January 2012
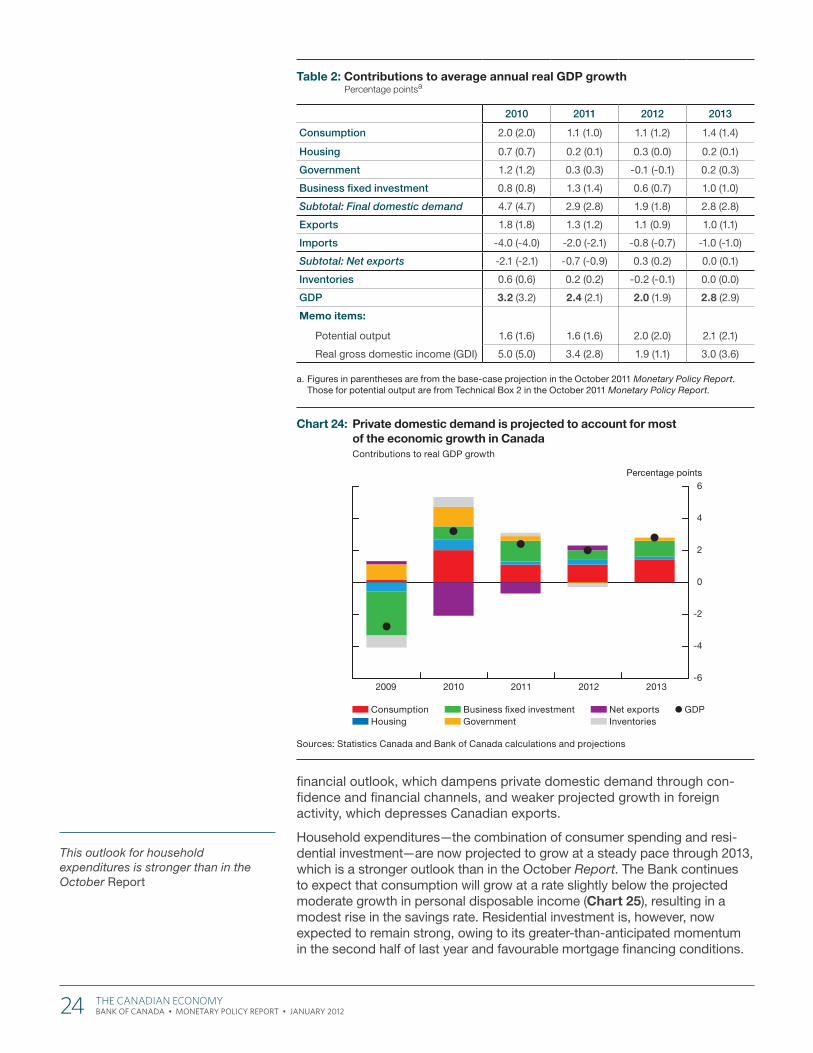
financial outlook, which dampens private domestic demand through con-fidence and financial channels, and weaker projected growth in foreign activity, which depresses Canadian exports.
Household expenditures—the combination of consumer spending and resi-dential investment—are now projected to grow at a steady pace through 2013, which is a stronger outlook than in the October Report. The Bank continues to expect that consumption will grow at a rate slightly below the projected moderate growth in personal disposable income (Chart 25), resulting in a modest rise in the savings rate. Residential investment is, however, now expected to remain strong, owing to its greater-than-anticipated momentum in the second half of last year and favourable mortgage financing conditions.
This outlook for household expenditures is stronger than in the October Report
Chart 24: Private domestic demand is projected to account for most of the economic growth in CanadaContributions to real GDP growth
Sources: Statistics Canada and Bank of Canada calculations and projections
2009 2010 2011 2012 2013-6
-4
-2
0
2
4
6Percentage points
Consumption Housing
Business fi xed investment Government
Net exports Inventories
GDP
Table 2: Contributions to average annual real GDP growthPercentage pointsa
2010 2011 2012 2013
Consumption 2.0 (2.0) 1.1 (1.0) 1.1 (1.2) 1.4 (1.4)
Housing 0.7 (0.7) 0.2 (0.1) 0.3 (0.0) 0.2 (0.1)
Government 1.2 (1.2) 0.3 (0.3) -0.1 (-0.1) 0.2 (0.3)
Business fixed investment 0.8 (0.8) 1.3 (1.4) 0.6 (0.7) 1.0 (1.0)
Subtotal: Final domestic demand 4.7 (4.7) 2.9 (2.8) 1.9 (1.8) 2.8 (2.8)
Exports 1.8 (1.8) 1.3 (1.2) 1.1 (0.9) 1.0 (1.1)
Imports -4.0 (-4.0) -2.0 (-2.1) -0.8 (-0.7) -1.0 (-1.0)
Subtotal: Net exports -2.1 (-2.1) -0.7 (-0.9) 0.3 (0.2) 0.0 (0.1)
Inventories 0.6 (0.6) 0.2 (0.2) -0.2 (-0.1) 0.0 (0.0)
GDP 3.2 (3.2) 2.4 (2.1) 2.0 (1.9) 2.8 (2.9)
Memo items:
Potential output 1.6 (1.6) 1.6 (1.6) 2.0 (2.0) 2.1 (2.1)
Real gross domestic income (GDI) 5.0 (5.0) 3.4 (2.8) 1.9 (1.1) 3.0 (3.6)
a. Figures in parentheses are from the base-case projection in the October 2011 Monetary Policy Report. Those for potential output are from Technical Box 2 in the October 2011 Monetary Policy Report.
24 The Canadian eCOnOMy BANK OF CANADA • Monetary Policy rePort • January 2012
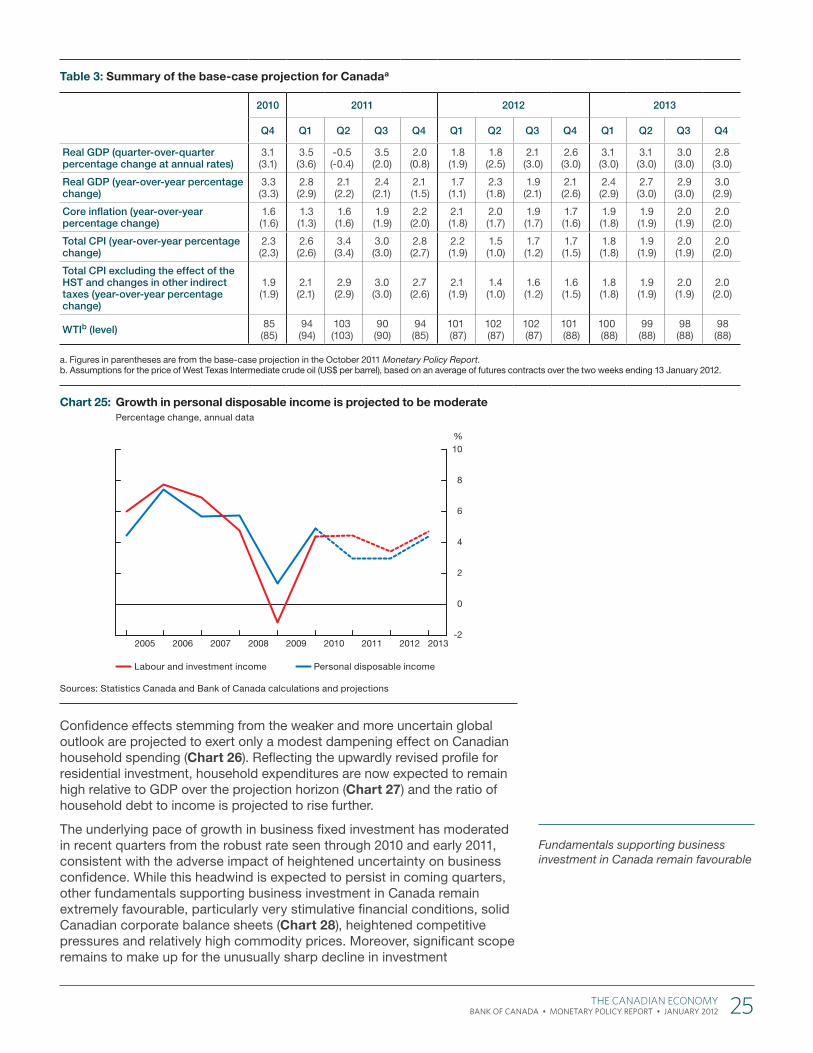
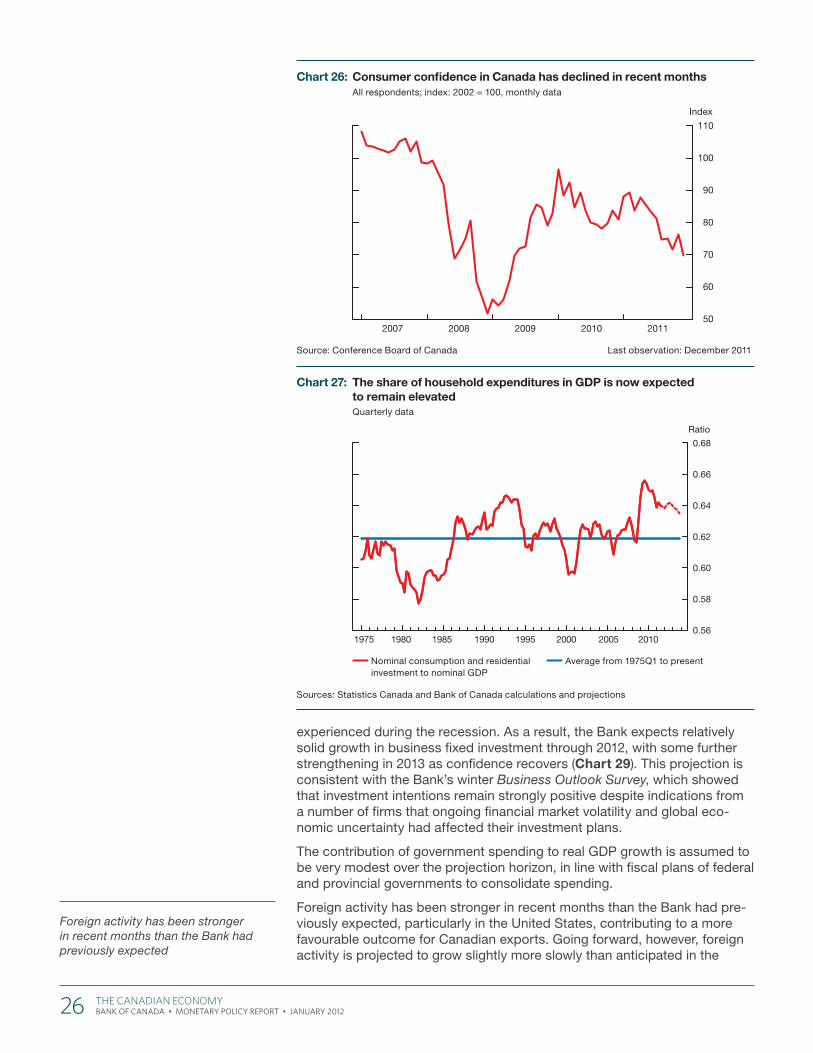
Confidence effects stemming from the weaker and more uncertain global outlook are projected to exert only a modest dampening effect on Canadian household spending (Chart 26). Reflecting the upwardly revised profile for residential investment, household expenditures are now expected to remain high relative to GDP over the projection horizon (Chart 27) and the ratio of household debt to income is projected to rise further.
The underlying pace of growth in business fixed investment has moderated in recent quarters from the robust rate seen through 2010 and early 2011, consistent with the adverse impact of heightened uncertainty on business confidence. While this headwind is expected to persist in coming quarters, other fundamentals supporting business investment in Canada remain extremely favourable, particularly very stimulative financial conditions, solid Canadian corporate balance sheets (Chart 28), heightened competitive pressures and relatively high commodity prices. Moreover, significant scope remains to make up for the unusually sharp decline in investment
Fundamentals supporting business investment in Canada remain favourable
Table 3: Summary of the base-case projection for Canadaa
2010 2011 2012 2013
Q4 Q1 Q2 Q3 Q4 Q1 Q2 Q3 Q4 Q1 Q2 Q3 Q4
Real GDP (quarter-over-quarter percentage change at annual rates)
3.1(3.1)
3.5(3.6)
-0.5(-0.4)
3.5(2.0)
2.0(0.8)
1.8(1.9)
1.8(2.5)
2.1(3.0)
2.6(3.0)
3.1(3.0)
3.1(3.0)
3.0(3.0)
2.8(3.0)
Real GDP (year-over-year percentage change)
3.3(3.3)
2.8(2.9)
2.1(2.2)
2.4(2.1)
2.1(1.5)
1.7(1.1)
2.3(1.8)
1.9(2.1)
2.1(2.6)
2.4(2.9)
2.7(3.0)
2.9(3.0)
3.0(2.9)
Core inflation (year-over-year percentage change)
1.6(1.6)
1.3(1.3)
1.6(1.6)
1.9(1.9)
2.2(2.0)
2.1(1.8)
2.0(1.7)
1.9(1.7)
1.7(1.6)
1.9(1.8)
1.9(1.9)
2.0(1.9)
2.0(2.0)
Total CPI (year-over-year percentage change)
2.3(2.3)
2.6(2.6)
3.4(3.4)
3.0(3.0)
2.8(2.7)
2.2(1.9)
1.5(1.0)
1.7(1.2)
1.7(1.5)
1.8(1.8)
1.9(1.9)
2.0(1.9)
2.0(2.0)
Total CPI excluding the effect of the HST and changes in other indirect taxes (year-over-year percentage change)
1.9(1.9)
2.1(2.1)
2.9(2.9)
3.0(3.0)
2.7(2.6)
2.1(1.9)
1.4(1.0)
1.6(1.2)
1.6(1.5)
1.8(1.8)
1.9(1.9)
2.0(1.9)
2.0(2.0)
WTIb (level) 85(85)
94(94)
103(103)
90(90)
94(85)
101(87)
102(87)
102(87)
101(88)
100(88)
99(88)
98(88)
98(88)
a. Figures in parentheses are from the base-case projection in the October 2011 Monetary Policy Report. b. Assumptions for the price of West Texas Intermediate crude oil (US$ per barrel), based on an average of futures contracts over the two weeks ending 13 January 2012.
Chart 25: Growth in personal disposable income is projected to be moderatePercentage change, annual data
Sources: Statistics Canada and Bank of Canada calculations and projections
2005 2006 2007 2008 2009 2010 2011 2012 2013-2
0
2
4
6
8
10%
Labour and investment income Personal disposable income
The Canadian eCOnOMy 25 BANK OF CANADA • Monetary Policy rePort • January 2012
experienced during the recession. As a result, the Bank expects relatively solid growth in business fixed investment through 2012, with some further strengthening in 2013 as confidence recovers (Chart 29). This projection is consistent with the Bank’s winter Business Outlook Survey, which showed that investment intentions remain strongly positive despite indications from a number of firms that ongoing financial market volatility and global eco-nomic uncertainty had affected their investment plans.
The contribution of government spending to real GDP growth is assumed to be very modest over the projection horizon, in line with fiscal plans of federal and provincial governments to consolidate spending.
Foreign activity has been stronger in recent months than the Bank had pre-viously expected, particularly in the United States, contributing to a more favourable outcome for Canadian exports. Going forward, however, foreign activity is projected to grow slightly more slowly than anticipated in the
Foreign activity has been stronger in recent months than the Bank had previously expected
Chart 27: The share of household expenditures in GDP is now expected to remain elevatedQuarterly data
Sources: Statistics Canada and Bank of Canada calculations and projections
1975 1980 1985 1990 1995 2000 2005 2010
Ratio
0.56
0.58
0.60
0.62
0.64
0.66
0.68
Nominal consumption and residential investment to nominal GDP
Average from 1975Q1 to present
Chart 26: Consumer confi dence in Canada has declined in recent months All respondents; index: 2002 = 100, monthly data
Source: Conference Board of Canada Last observation: December 2011
2007 2008 2009 2010 201150
60
70
80
90
100
110
Index
26 The Canadian eCOnOMy BANK OF CANADA • Monetary Policy rePort • January 2012
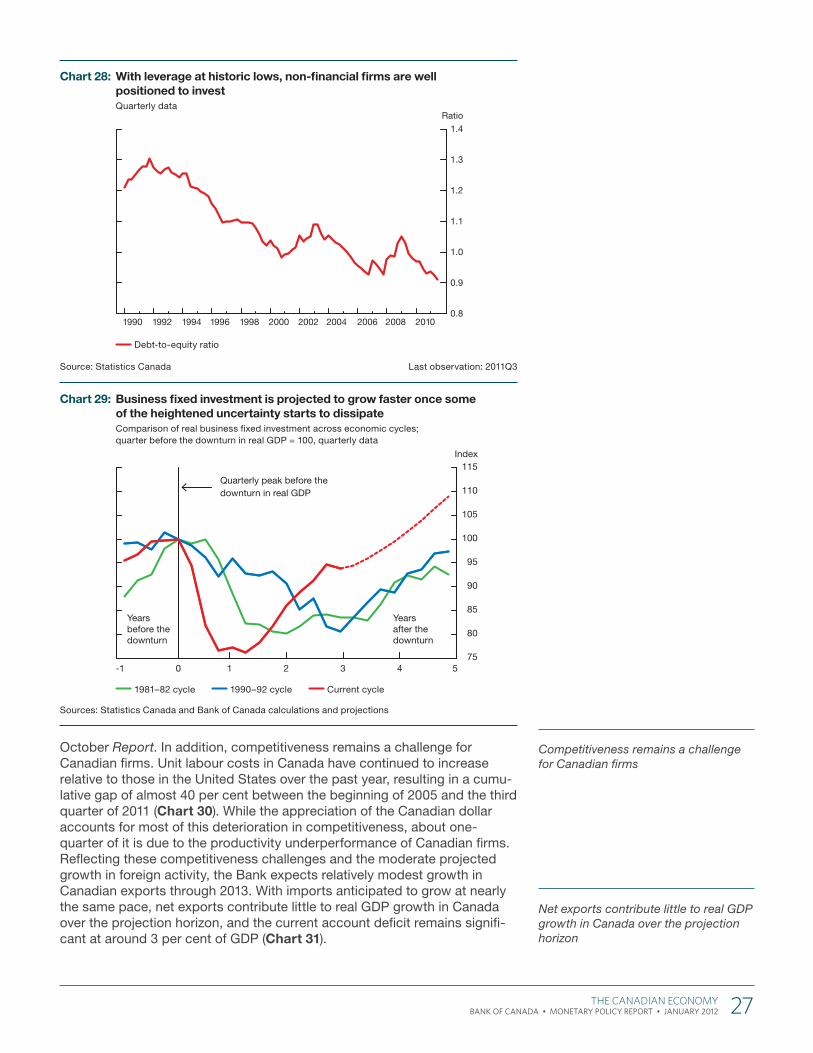
October Report. In addition, competitiveness remains a challenge for Canadian firms. Unit labour costs in Canada have continued to increase relative to those in the United States over the past year, resulting in a cumu-lative gap of almost 40 per cent between the beginning of 2005 and the third quarter of 2011 (Chart 30). While the appreciation of the Canadian dollar accounts for most of this deterioration in competitiveness, about one-quarter of it is due to the productivity underperformance of Canadian firms. Reflecting these competitiveness challenges and the moderate projected growth in foreign activity, the Bank expects relatively modest growth in Canadian exports through 2013. With imports anticipated to grow at nearly the same pace, net exports contribute little to real GDP growth in Canada over the projection horizon, and the current account deficit remains signifi-cant at around 3 per cent of GDP (Chart 31).
Competitiveness remains a challenge for Canadian firms
Net exports contribute little to real GDP growth in Canada over the projection horizon
Chart 28: With leverage at historic lows, non-fi nancial fi rms are well positioned to investQuarterly data
Source: Statistics Canada Last observation: 2011Q3
1990 1992 1994 1996 1998 2000 2002 2004 2006 2008 2010
Ratio
0.8
0.9
1.0
1.1
1.2
1.3
1.4
Debt-to-equity ratio
Chart 29: Business fi xed investment is projected to grow faster once some of the heightened uncertainty starts to dissipateComparison of real business fi xed investment across economic cycles; quarter before the downturn in real GDP = 100, quarterly data
Sources: Statistics Canada and Bank of Canada calculations and projections
-1 0 1 2 3 4 575
80
85
90
95
100
105
110
115Index
Yearsbefore thedownturn
Yearsafter thedownturn
Quarterly peak before the downturn in real GDP
1981–82 cycle 1990–92 cycle Current cycle
The Canadian eCOnOMy 27 BANK OF CANADA • Monetary Policy rePort • January 2012
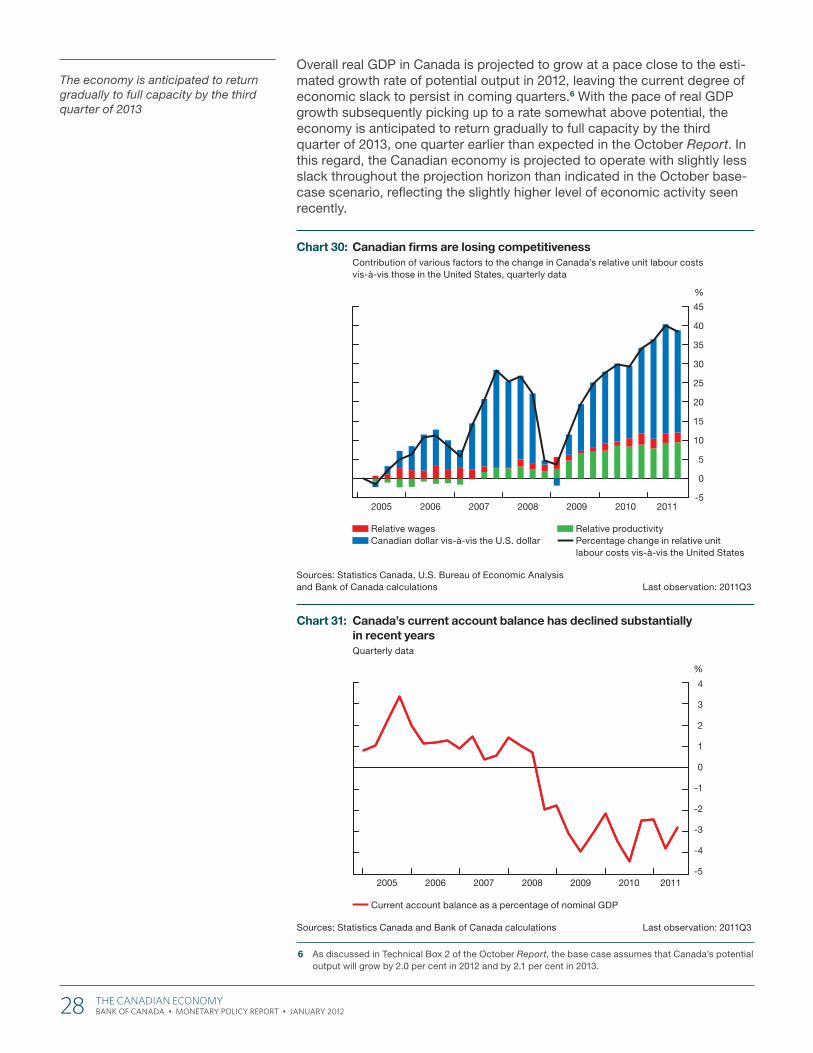
Overall real GDP in Canada is projected to grow at a pace close to the esti-mated growth rate of potential output in 2012, leaving the current degree of economic slack to persist in coming quarters.6 With the pace of real GDP growth subsequently picking up to a rate somewhat above potential, the economy is anticipated to return gradually to full capacity by the third quarter of 2013, one quarter earlier than expected in the October Report. In this regard, the Canadian economy is projected to operate with slightly less slack throughout the projection horizon than indicated in the October base-case scenario, reflecting the slightly higher level of economic activity seen recently.
6 As discussed in Technical Box 2 of the October Report, the base case assumes that Canada’s potential output will grow by 2.0 per cent in 2012 and by 2.1 per cent in 2013.
The economy is anticipated to return gradually to full capacity by the third quarter of 2013
Chart 30: Canadian fi rms are losing competitivenessContribution of various factors to the change in Canada’s relative unit labour costs vis-à-vis those in the United States, quarterly data
Sources: Statistics Canada, U.S. Bureau of Economic Analysis and Bank of Canada calculations Last observation: 2011Q3
2005 2006 2007 2008 2009 2010 2011-5
0
5
10
15
20
25
30
35
40
45
%
Relative wages Canadian dollar vis-à-vis the U.S. dollar
Relative productivity Percentage change in relative unit labour costs vis-à-vis the United States
Chart 31: Canada’s current account balance has declined substantially in recent yearsQuarterly data
Sources: Statistics Canada and Bank of Canada calculations Last observation: 2011Q3
2005 2006 2007 2008 2009 2010 2011-5
-4
-3
-2
-1
0
1
2
3
4
%
Current account balance as a percentage of nominal GDP
28 The Canadian eCOnOMy BANK OF CANADA • Monetary Policy rePort • January 2012
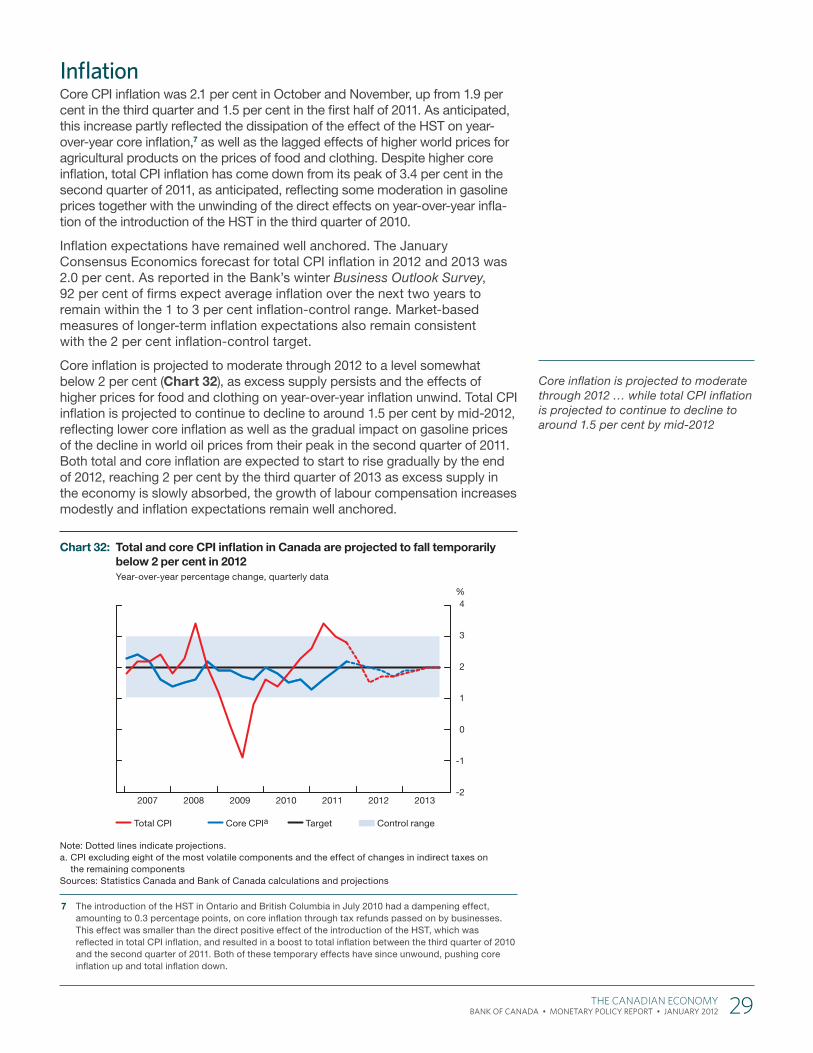
InflationCore CPI inflation was 2.1 per cent in October and November, up from 1.9 per cent in the third quarter and 1.5 per cent in the first half of 2011. As anticipated, this increase partly reflected the dissipation of the effect of the HST on year-over-year core inflation,7 as well as the lagged effects of higher world prices for agricultural products on the prices of food and clothing. Despite higher core inflation, total CPI inflation has come down from its peak of 3.4 per cent in the second quarter of 2011, as anticipated, reflecting some moderation in gasoline prices together with the unwinding of the direct effects on year-over-year infla-tion of the introduction of the HST in the third quarter of 2010.
Inflation expectations have remained well anchored. The January Consensus Economics forecast for total CPI inflation in 2012 and 2013 was 2.0 per cent. As reported in the Bank’s winter Business Outlook Survey, 92 per cent of firms expect average inflation over the next two years to remain within the 1 to 3 per cent inflation-control range. Market-based measures of longer-term inflation expectations also remain consistent with the 2 per cent inflation-control target.
Core inflation is projected to moderate through 2012 to a level somewhat below 2 per cent (Chart 32), as excess supply persists and the effects of higher prices for food and clothing on year-over-year inflation unwind. Total CPI inflation is projected to continue to decline to around 1.5 per cent by mid-2012, reflecting lower core inflation as well as the gradual impact on gasoline prices of the decline in world oil prices from their peak in the second quarter of 2011. Both total and core inflation are expected to start to rise gradually by the end of 2012, reaching 2 per cent by the third quarter of 2013 as excess supply in the economy is slowly absorbed, the growth of labour compensation increases modestly and inflation expectations remain well anchored.
7 The introduction of the HST in Ontario and British Columbia in July 2010 had a dampening effect, amounting to 0.3 percentage points, on core inflation through tax refunds passed on by businesses. This effect was smaller than the direct positive effect of the introduction of the HST, which was reflected in total CPI inflation, and resulted in a boost to total inflation between the third quarter of 2010 and the second quarter of 2011. Both of these temporary effects have since unwound, pushing core inflation up and total inflation down.
Core inflation is projected to moderate through 2012 … while total CPI inflation is projected to continue to decline to around 1.5 per cent by mid-2012
Chart 32: Total and core CPI infl ation in Canada are projected to fall temporarily below 2 per cent in 2012Year-over-year percentage change, quarterly data
Note: Dotted lines indicate projections.a. CPI excluding eight of the most volatile components and the effect of changes in indirect taxes on
the remaining components Sources: Statistics Canada and Bank of Canada calculations and projections
2007 2008 2009 2010 2011 2012 2013-2
-1
0
1
2
3
4%
Total CPI Core CPIa Target Control range
The Canadian eCOnOMy 29 BANK OF CANADA • Monetary Policy rePort • January 2012
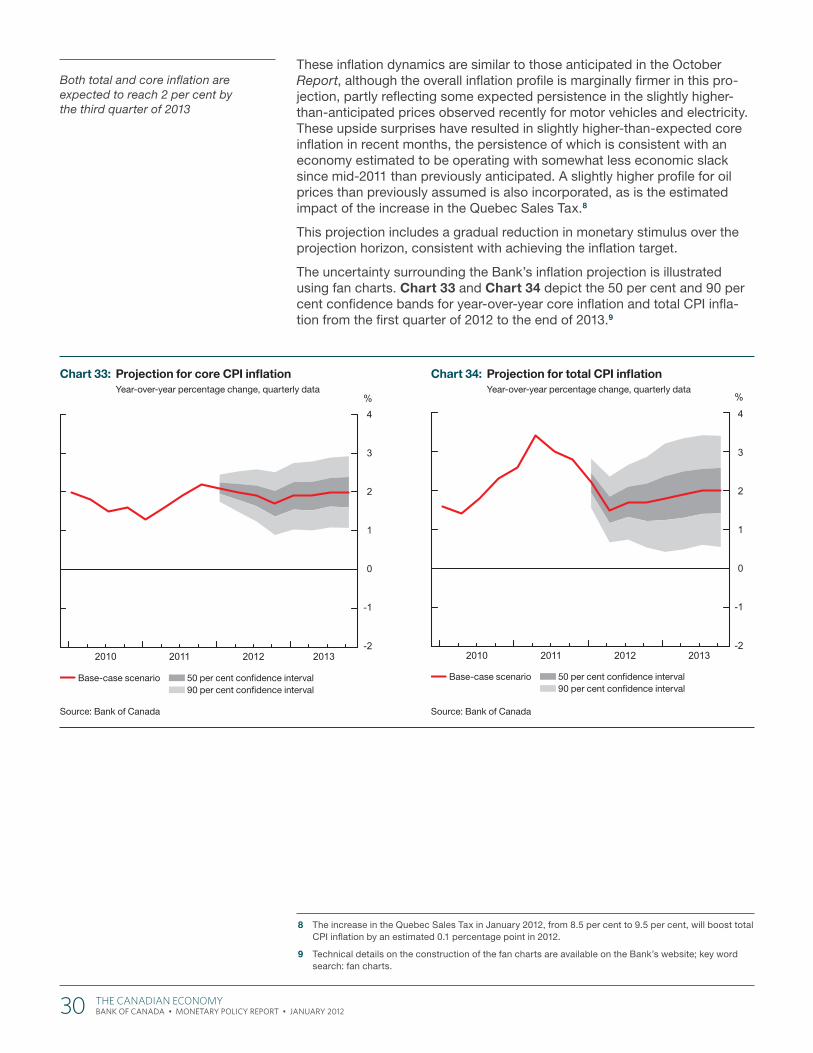
These inflation dynamics are similar to those anticipated in the October Report, although the overall inflation profile is marginally firmer in this pro-jection, partly reflecting some expected persistence in the slightly higher-than-anticipated prices observed recently for motor vehicles and electricity. These upside surprises have resulted in slightly higher-than-expected core inflation in recent months, the persistence of which is consistent with an economy estimated to be operating with somewhat less economic slack since mid-2011 than previously anticipated. A slightly higher profile for oil prices than previously assumed is also incorporated, as is the estimated impact of the increase in the Quebec Sales Tax.8
This projection includes a gradual reduction in monetary stimulus over the projection horizon, consistent with achieving the inflation target.
The uncertainty surrounding the Bank’s inflation projection is illustrated using fan charts. Chart 33 and Chart 34 depict the 50 per cent and 90 per cent confidence bands for year-over-year core inflation and total CPI infla-tion from the first quarter of 2012 to the end of 2013.9
8 The increase in the Quebec Sales Tax in January 2012, from 8.5 per cent to 9.5 per cent, will boost total CPI inflation by an estimated 0.1 percentage point in 2012.
9 Technical details on the construction of the fan charts are available on the Bank’s website; key word search: fan charts.
Both total and core inflation are expected to reach 2 per cent by the third quarter of 2013
Chart 33: Projection for core CPI infl ationYear-over-year percentage change, quarterly data
Source: Bank of Canada
2010 2011 2012 2013-2
-1
0
1
2
3
4%
Base-case scenario 50 per cent confi dence interval 90 per cent confi dence interval
Chart 34: Projection for total CPI infl ationYear-over-year percentage change, quarterly data
Source: Bank of Canada
2010 2011 2012 2013-2
-1
0
1
2
3
4
%
Base-case scenario 50 per cent confi dence interval 90 per cent confi dence interval
30 The Canadian eCOnOMy BANK OF CANADA • Monetary Policy rePort • January 2012
The inflation outlook in Canada is subject to significant risks. In particular, the Bank’s projection assumes that authorities in Europe are able to contain the ongoing crisis, although this assumption is clearly subject to downside risks.
The three main upside risks to inflation in Canada relate to the possibility of stronger-than-expected inflationary pressures in the global economy, stronger-than-expected growth in the U.S. economy and stronger momentum in Canadian household spending.
� Global inflationary pressures could be more persistent than currently projected if growth in emerging-market economies does not decelerate to more sustainable levels or if potential output in advanced economies is lower than projected.
� Recently observed strength in U.S. consumption could be more persis-tent than anticipated and fiscal policy could exert a smaller-than-antici-pated drag on growth in the latter part of the projection.
� Residential investment in Canada has been stronger than expected and household expenditures could have more momentum than currently projected.
The two main downside risks to inflation in Canada relate to sovereign debt and banking concerns in Europe and the possibility that growth in Canadian household spending could be weaker than projected.
� Failure to contain the crisis in Europe is the most serious risk facing the global and Canadian economies. The effects on Canada through finan-cial, confidence and trade channels would be substantial, given the size and importance of the euro area to the global economy.
� High household debt levels in Canada could lead to a sharper-than-expected deceleration in household spending. Relatedly, if there were a sudden weakening in the Canadian housing sector, it could have sizable spillover effects on other areas of the economy.
Overall, the Bank judges that the risks to the inflation outlook in Canada are roughly balanced over the projection horizon.
Risks to the Outlook
Risks TO The OuTlOOk 31 BANK OF CANADA • Monetary Policy rePort • January 2012