Embed Size (px)
Citation preview

Evolutionary Affinities of the Order Perissodactylaand the Phylogenetic Status of the Superordinal
Taxa Ungulata and AltungulataDan Graur*Manolo Gouy,† and Laurent Duret†
*Department of Zoology, George S. Wise Faculty of Life Sciences, Tel Aviv University, 69978 Ramat Aviv, Israel; and †Laboratoire deBiometrie, Genetique et Biologie des Populations, CNRS, URA 2055, Universite Claude Bernard Lyon 1,
43 Boulevard du 11 Novembre 1918, 69622 Villeurbanne Cedex, France
Received January 26, 1996; revised July 5, 1996
Contrary to morphological claims, molecular dataindicate that the order Perissodactyla (e.g., horses,rhinoceroses, and tapirs) is neither part of the superor-dinal taxon Paenungulata (Sirenia, Proboscidea, andHyracoidea) nor an immediate outgroup of the paenun-gulates. Rather, Perissodactyla is closer to CarnivoraandCetartiodactyla (Cetacea 1 Artiodactyla) than it isto the paenungulates. Therefore, two morphologicallydefined superordinal taxa, Altungulata (Proboscidea,Sirenia, Hyracoidea, and Perissodactyla) and Ungu-lata (Altungulata and Cetartiodactyla), are invali-dated. Perissodactyla, Carnivora, and Cetartiodactylaare shown to constitute a rather tight trichotomy.However, a molecular analysis of 36 protein sequenceswith a total concatenated length of 7885 aligned aminoacids indicates thatPerissodactyla is closer toCetartio-dactyla than either taxa is to Carnivora. The relation-ships among Paenungulata, Primates, and the cladeconsisting of Perissodactyla, Carnivora, and Cetartio-dactylaa could not be resolved on the basis of theavailabledata. r 1997 Academic Press
INTRODUCTION
In most contemporary morphological phylogeneticschemes (e.g., Novacek, 1992), horses and their rela-tives (order Perissodactyla) are positioned either as theclosest outgroup to the superorder Paenungulata, whichincludes three extant orders, Proboscidea (elephants),Hyracoidea (hyraxes), and Sirenia (sea cows andmana-tees), or as nearest neighbors of the hyraxes, and,therefore, nested within the Paenungulata (Prothero etal., 1988; Fisher and Tassy, 1993; Prothero, 1993).Molecular analyses, on the other hand, indicate thatPerissodactyla may be closely related to Artiodactyla,Cetacea, and Carnivora (e.g., Irwin et al., 1991; Ma etal., 1993; Krettek et al., 1995; Queralt et al., 1995;Zolzer and von Hagen, 1995). In the following, we use
proteins for which orthologous sequence data exist formembers of Paenungulata, Perissodactyla, Artiodac-tyla, Cetacea, Carnivora, and Primates, as well asnoneutherian outgroups, to test different evolutionaryschemes and identify the phylogenetic position of Peris-sodactyla within the eutherian tree. We also testthe phylogenetic validity, i.e., the monophyly, of thefollowing proposed superorders: (1)Altungulata (Probos-cidea, Sirenia, Hyracoidea, and Perissodactyla) (Pro-thero and Schock, 1988) and (2) Ungulata (Perisso-dactyla, Cetartiodactyla, Proboscidea, Sirenia, andHyracoidea) (McKenna, 1975).
DATA AND METHODS
Proteins have been collected by using Release 11 ofthe HOVERGEN (Duret et al., 1994) and Release 46.0of the PIR (George et al., 1994) databases. The ordersCetacea and Artiodactyla were treated as a singletaxon, Cetartiodactyla (Montgelard et al., in press),since either they are very closely related sister taxa(Novacek, 1992) or the Cetacea are nested within theArtiodactyla (Graur and Higgins, 1994; for review, seeMilinkovitch, 1995). The protein sequenceswere alignedby using the CLUSTAL W program (Thompson et al.,1994).Ambiguous parts in the alignments (as judged byvisual inspection), as well as gaps, have been removedfrom further analysis. In each analysis, sequences wereused only if they were available for all the taxa inquestion. If a certain taxon was represented in aprotein data set by two or more species, we constructeda neighbor-joining phylogenetic tree and selected thesequence with the shortest branch length to representthe order in question. The list of proteins and theorganisms from which they were obtained are given inTable 1. Implicit in this procedure is the assumptionthat each taxon dealt with in this study is monophy-
MOLECULAR PHYLOGENETICS AND EVOLUTION
Vol. 7, No. 2, April, pp. 195–200, 1997ARTICLE NO. FY960391
1951055-7903/97 $25.00Copyright r 1997 by Academic PressAll rights of reproduction in any form reserved.

letic, and, therefore, valid. Genetic distances werecomputed by correcting for multiple hits (Kimura,1983). Phylogenetic trees were constructed by usingthree reconstruction methods: neighbor joining (Saitouand Nei, 1987) by means of the CLUSTAL W program,maximum parsimony with the PROTPARS program inthe PHYLIP package (Felsenstein, 1989), and maxi-mum likelihood with PROTML (Adachi and Hasegawa,
1992). Reliability of internal branches of neighbor-joining trees was ascertained by 1000 bootstrap repli-cates (Felsenstein, 1985). To evaluate the extent towhich a maximum likelihood tree is a significantlybetter representation of the true tree than the alterna-tive possible trees, we estimated the bootstrap probabil-ity by the resampling of the estimated log-likelihoodmethod with 10,000 replicates (Kishino et al., 1990).
TABLE 1
List of Protein Sequences and the Organisms from which They Were Derived
Protein CET CAR HYR PER PRI PRO SIR MYO OUT
1. Nuclearly encoded proteinsaA-crystallin Cdro Cfam Pcap Tind Lful Lafr Tinu Mmus MrufHemoglobin-b Rtar Pvit Pcap Csim Pcyn Emax Tinu Rnor MrufHemoglobin-a Chir Aful Pcap Ecab Cape Emax Tinu Mmar Mgigvon Willebrand factor Sscr Cfam Pcap Csim Hsap Lafr Ddug Spol —Insulin Btau Cfam — Ecab Hsap Lafr — Maur GgalProlactin Sscr Fcat — Ecab Hsap Lafr — Maur GgalInterleukin-2 Sscr Fcat — Ecab Mnem — Tman Mung —Myoglobin Sscr Llut — Ecab Mfas Emas — Sleu DvirGrowth hormone Sscr Vvul — Ecab Hsap Lafr — Maur GgalInsulin-like growth factor I Sscr Cfam — Ecab Hsap — — Rnor Ggalb-chorionic gonadotropin Sscr Cfam — Easi Pham — — Rnor CcotPhospholipase A-2 Sscr Cfam — Ecab Hsap — — Rnor BmulCD44 antigen Btau Cfam — Ecab Pham — — Maur —Na,K-ATPase a1 subunit Oari Cfam — Ecab Hsap — — Rnor GgalSerum albumin Sscr Cfam — Ecab Hsap — — Rnor GgalAtrial natriuretic polypeptide Sscr Cfam — Ecab Hsap — — Rnor Ggalg-interferon Oari Cfam — Ecab Hsap — — Mung —Pancreatic polypeptide Btau Clup — Tpin Hsap — — Mmus DvirTumor necrosis factor a Sscr Fcat — Ecab Pham — — Mmus —Colipase Sscr Cfam — Ecab Hsap — — Rnor —Cytochrome c Lgua Cfam — Easi Mmul — — Mmus MgigPlasminogen Btau Cfam — Ecab Hsap — — Mmus —SRY protein Oari Hgry — Ecab Ppyg — — Hall Smac
2. Mitochondrially encoded proteinsCytochrome b Sscr Pvit — Egre Hsap Lafr — Rnor MdomNADH dehydrogenase 1 Btau Pvit — Ecab Hsap — — Mmus DvirNADH dehydrogenase 2 Btau Pvit — Ecab Hsap — — Mmus DvirNADH dehydrogenase 3 Btau Pvit — Ecab Hsap — — Rnor DvirNADH dehydrogenase 4 Btau Pvit — Ecab Hsap — — Rnor DvirNADH dehydrogenase 5 Btau Pvit — Ecab Hsap — — Mmus DvirNADH dehydrogenase 6 Btau Pvit — Ecab Hsap — — Mmus DvirNADH dehydrogenase 4L Btau Pvit — Ecab Hsap — — Mmus DvirCytochrome c oxydase I Btau Pvit — Ecab Hsap — — Mmus DvirCytochrome c oxydase II Btau Hgry — Ecab Tban — — Mmus DvirCytochrome c oxidase III Bmus Hgry — Ecab Hsap — — Rnor DvirATPase subunit 6 Btau Pvit — Ecab Hsap — — Mmus DvirATPase subunit 8 Btau Pvit — Ecab Hsap — — Mpen Dvir
Note. Abbreviations: CET, Cetartiodactyla; Bmus, Balaenoptera musculus; Btau, Bos taurus; Cdro, Camelus dromedarius; Chir, Caprahircus; Lgua, Lama guanicoe; Oari, Ovis aries; Rtar, Rangifer tarandus; Sscr, Sus scrofa; CAR, Carnivora; Aful, Ailurus fulgens; Cfam, Canisfamiliaris; Clup, Canis lupus; Fcat, Felis catus; Hgry, Halichoerus grypus; Llut, Lutra lutra; Pvit, Phoca vitulina; Vvul, Vulpes vulpes; HYR,Hyracoidea; Pcap, Procavia capensis; PER, Perissodactyla; Csim, Ceratotherium simum; Ecab, Equus caballus; Egre, Equus grevyi; Easi,Equus asinus; Tind, Tapirus indicus; Tpin, Tapirus pinchaque; PRI, Primates; Cape, Cebus apella; Hsap, Homo sapiens; Lful, Lemur fulvus;Mnem, Macaca nemestrina; Mfas, Macaca fascicularis; Mmul, Macaca mulatta; Pcyn, Papio cynocephalus; Pham, Papio hamadryas; Ppyg,Pongo pygmaeus; Tban, Tarsius bancanus; PRO, Proboscidea; Emax,Elephasmaximus; Lafr, Loxodonta africana; SIR, Sirenia; Ddug,Dugongdugon; Tinu, Trichechus inunguis; Tman, Trichechus manatus; MYO, Myomorpha; Mmus, Mus musculus; Rnor, Rattus norvegicus; Spol,Spalax polonicus; Sleu, Spalax leucodon ehrnbergi;Mmar 5 Marmota marmota;Maur,Mesocricetus auratus;Mung,Meriones unguiculatus;Hall, Hylomyscus alleni; Mpen, Microtus pennsylvanicus; OUT, Noneutherian outgroup; Bmul, Bungarus multicinctus; Ccot, Coturnixcoturnix; Dvir, Didelphis virginiana; Ggal, Gallus gallus;Mgig,Macropus giganteus;Mruf,Macropus rufus;Mdom,Monodelphis domestica;Smac, Sminthopsis macroura.
196 GRAUR, GOUY, AND DURET

For purposes of maximum utilization of the moleculardata, we address each question in this study by usingthe smallest possible number of taxa.
RESULTS
In the first stage of the analysis, we checked whetherPerissodactyla is nested within the Paenungulata, i.e.,closer to hyraxes than either is to sirenians and probos-cideans, as advocated by Prothero and colleagues (1988;Prothero, 1993). Four protein sequences, aA crystallin,hemoglobin a, hemoglobin b, and exon 28 of vonWillebrand factor, are available for Sirenia, Probosci-dea, Hyracoidea, Perissodactyla, and Primates. Thelength of the aligned concatenated sequence was 826amino acids. With four ingroup taxa and an outgroup(Primates), there are 15 possible phylogenetic trees(Table 2). Trees 1–3 are consistent with paenungulatemonophyly, whereas trees 4–12 indicate that Perissodac-tyla should be included within Paenungulata. Trees13–15 are inconsistent with paenungulate monophylyeven if Perissodactyla is included within this super-order. By using the neighbor-joining method we ob-tained tree 2. Judging by the bootstrap value for theclustering of Hyracoidea and Proboscidea to the exclu-sion of Sirenia (394/1,000), however, none of the threepossible internal arrangements for the three paenungu-late orders (trees 1–3) is significantly better than theother two. The Hyracoidea–Proboscidea–Sirenia clade,on the other hand, is supported by all 1000 bootstrap
replicates. Trees 1 and 3 emerge as equally parsimoni-ous, each requiring 399 amino acid replacements. Tree2 requires 400 amino acid replacements and is there-fore equally likely. Trees in which the Paenungulataare rendered paraphyletic by Primates or Perissodac-tyla require 24–34 additional amino acid replacements.Topology 3 turned out to be the maximum likelihoodtree. A comparison among the 15 alternative trees bythe maximum likelihood method is shown in Table 2.The combined bootstrap probability for trees 1–3 is100%, as opposed to a combined probability of zero forall the other trees. Therefore, the molecular dataindicate conclusively that Perissodactyla is not nestedwithin the Paenungulata.Next, we tested the phylogenetic integrity of Altungu-
lata and Ungulata. In this analysis, the three paenun-gulate orders were treated as a single taxon, and theirphylogenetic affinities to Perissodactyla, Cetartiodac-tyla, and Carnivora (a nonungulate taxon) were recon-structed, with Primates as an outgroup. In this case webase our reconstruction on 10 proteins: insulin, prolac-tin, aA crystallin, interleukin-2, myoglobin, hemoglo-bin a, hemoglobin b, cytochrome b, growth hormone,and exon 28 of von Willebrand factor. The length of thealigned concatenated sequence consisting of these pro-teins is 1908 amino acids. Again, we deal with 15possible topologies (Table 3). Trees 4–6 are consistentwith altungulate monophyly; tree 5 is consistent withthe superorder Ungulata. In all the other possibletrees, the altungulates are paraphyletic. The neighbor-
TABLE 2
Comparison among 15 Possible Alternative Phyloge-netic Trees for Primates (Pri), Perissodactyla (Per),Sirenia (Sir), Proboscidea (Pro), and Hyracoidea (Hyr)by theMaximumLikelihoodMethod
Tree topology
Log-likelihooddifference fromthe maximumlikelihoodtree (6SE)
Bootstrapprobability of
tree being the MLtree from among
15 possibletrees (%)
1 (Pri, (Per, (Hyr, (Sir, Pro)))) 22.44 6 9.78 28.872 (Pri, (Per, (Pro, (Hyr, Sir)))) 23.10 6 9.55 25.193 (Pri, (Per, (Per, (Hyr, Pro)))) Maximum
likelihood tree45.94
4 (Pri, (Pro, (Per, (Hyr, Sir)))) 269.92 6 21.72 0.005 (Pri, (Pro, (Sir, (Hyr, Per)))) 288.66 6 22.31 0.006 (Pri, (Pro, (Hyr, (Sir, Per)))) 290.84 6 21.93 0.007 (Pri, (Hyr, (Per, (Sir, Pro)))) 275.52 6 21.84 0.008 (Pri, (Hyr, (Sir, (Per, Pro)))) 290.55 6 22.00 0.009 (Pri, (Hyr, (Pro, (Sir, Per)))) 295.47 6 21.28 0.0010 (Pri, (Sir, (Per, (Hyr, Pro)))) 267.55 6 19.76 0.0011 (Pri, (Sir, (Hyr, (Per, Pro)))) 283.65 6 22.61 0.0012 (Pri, (Sir, (Pro, (Per, Hyr)))) 284.50 6 22.53 0.0013 (Pri, ((Pro, Per), (Sir, Hyr))) 269.77 6 21.69 0.0014 (Pri, ((Sir, Per), (Pro, Hyr))) 274.88 6 18.26 0.0015 (Pri, ((Pro, Sir), (Per, Hyr))) 273.98 6 15.49 0.00
TABLE 3
Comparison among 15 Possible Alternative Phyloge-netic Trees for Primates (Pri), Perissodactyla (Per),Carnivora (Car), Paenungulata (Pae), andCetartiodac-tyla (Cet) by theMaximumLikelihoodMethod
Tree topology
Log-likelihooddifference fromthe maximumlikelihoodtree (6SE)
Bootstrapprobability of
tree being the MLtree from among
15 possibletrees (%)
1 (Pri, (Pae, (Per, (Cet, Car)))) 29.25 6 13.92 24.092 (Pri, (Pae, (Car, (Cet, Per)))) Maximum
likelihood tree73.21
3 (Pri, (Pae, (Cet, (Car, Per)))) 220.60 6 11.88 0.904 (Pri, (Cet, (Car, (Pae, Per)))) 260.81 6 22.15 0.015 (Pri, (Car, (Cet, (Pae, Per)))) 248.45 6 21.39 0.556 (Pri, ((Pae, Per), (Car, Cet))) 246.88 6 22.87 0.397 (Pri, (Per, (Cet, (Car, Pae)))) 266.08 6 20.99 0.008 (Pri, (Per, (Pae, (Cet, Car)))) 253.31 6 22.20 0.049 (Pri, (Per, (Car, (Pae, Cet)))) 253.91 6 23.19 0.4110 (Pri, (Cet, (Per, (Pae, Car)))) 276.71 6 19.61 0.0011 (Pri, (Cet, (Pae, (Per, Car)))) 271.18 6 19.64 0.0012 (Pri, (Car, (Per, (Cet, Pae)))) 252.24 6 21.27 0.3013 (Pri, (Car, (Pae, (Cet, Per)))) 248.19 6 16.08 0.0614 (Pri, ((Car, Per), (Pae, Cet))) 258.46 6 21.45 0.0415 (Pri, ((Pae, Car), (Per, Cet))) 253.62 6 15.30 0.00
197EVOLUTIONARY AFFINITIES OF PERISSODACTYLA

joining method yields tree 1. However, phylogenies 2and 3 cannot be excluded on the basis of the bootstrapvalue (622/1000) for the clustering of Cetartiodactylaand Carnivora to the exclusion of Perissodactyla. Incontrast, the branch separating the Paenungulata fromthe Perissodactyla–Carnivora–Cetartiodactyla clade issupported by 983 of 1000 bootstrap replicates. Tree 2emerges as themost parsimonious arrangement, with atotal length of 942 amino acid replacements. It cannot,however, be shown to be significantly better than tree 1with 949 amino acid replacements. Tree 3, on the otherhand, with 955 replacements, is significantly lengthierthan trees 1 and 2. The trees in which Paenungulataclusters with Perissodactyla to the exclusion of theother three taxa (trees 4–6) require 29–32 additionalamino acid replacements. Other trees require up to 43more replacements than the most parsimonious tree.Topology 2 also turned out to be the maximum likeli-hood tree (Table 3). The combined bootstrap probabilityfor trees 1–3 is 98.2%, as opposed to a negligiblecombined probability of 0.95% for the three trees (4–6)in which Perissodactyla is a sister group of Paenungu-lata. Altungulata and Ungulata, therefore, do not seemto constitute monophyletic clades.Next, with the aim of determining whether the
paenungulates are closer to the clade that includesPerissodactyla, Cetartiodactyla, and Carnivora or toPrimates, we added to the phylogenetic analysis anoneutherian outgroup. Eight sequences (insulin, pro-lactin, growth hormone, aAcrystallin,myoglobin, hemo-globin a, hemoglobin b, and cytochrome b) with a totalconcatenated length of 1426 aligned amino acids wereavailable for analysis. With any of the three methods ofphylogenetic reconstruction, we were unable to resolvethe trichotomy among Primates, Paenungulata, andthe Perissodactyla–Carnivora–Cetartiodactyla clade.The trichotomy remained unresolved with all methodsof reconstruction even after treating Perissodactyla,Carnivora, and Cetartiodactyla as a single clade,thereby reducing the number of taxa in the analyses.Since myomorph rodents are now generally believed tobe basal to the above ingroup lineages, and since theyare closer evolutionarily to the ingroup than eitheravians or marsupials, we repeated the previous analy-ses by using myomorphs as outgroup. Nine proteinsequences (cytochrome b, insulin, prolactin, aA-crystal-lin, myoglobin, a and b globin, growth hormone, andexon 28 of von Willebrand factor) with a total concat-enated length of 1778 aligned amino acids were avail-able. The neighbor-joining and maximum parsimonyanalyses yielded a clustering of Paenungulata and thePerissodactyla–Carnivora–Cetartiodactyla clade. How-ever, the branch connecting this clade was not sup-ported by bootstrap. The maximum likelihood analysissupported a clustering of the Paenungulata with Pri-mates to the exclusion of the Perissodactyla–Carnivora–
Cetartiodactyla clade. However, the bootstrap probabil-ity of this tree was only 74.59%.Finally, we attempted to disentangle the Perissodac-
tyla–Carnivora–Cetartiodactyla trichotomy by using36 protein sequences: insulin-like growth factor I,insulin, b chorionic gonadotropin, prolactin, phospholi-pase A-2, CD44 antigen, Na1,K1-ATPase a1-subunit,serum albumin, atrial natriuretic polypeptide, aA-crystallin, g-interferon, interleukin-2, pancreatic poly-peptide, tumor necrosis factor a, colipase, myoglobin,cytochrome c, plasminogen, b-globin, a-globin, growthhormone, SRY protein, exon 28 of vonWillebrand factorprotein, and all the 13 proteins encoded by themitochon-dria: NADH dehydrogenase subunits 1, 2, 3, 4, 4L, 5,and 6, cytochrome c oxydase subunits 1–3, ATPasesubunits 6 and 8, and cytochrome b. The length of theconcatenated sequence was 7885 aligned amino acids.Primates was used as the outgroup. There are threepossible trees (Table 4). The neighbor-joining methodyields phylogeny 1, an arrangement supported by 978/1000 bootstrap replicates. Tree 1 also emerged as themost parsimonious arrangement, with a total length of3206 amino acid replacements. Trees 2 and 3 required3221 and 3216 amino acid replacements, respectively.Tree 1 also turned out to be the maximum likelihoodtree, with a bootstrap probability of 85.42%. This tree istherefore significantly better than the other two alter-native trees. The length of the internal branch is onlyabout a quarter the values of the terminal branchesleading to Perissodactyla and the Artiodactyla 1 Ceta-cea clade, and, therefore, the Perissodactyla–Carnivora–Artiodactyla 1 Cetacea trichotomy seems to be rathertight. Nevertheless, the currently available data indi-cate that Perissodactyla clusters with the Artiodactyla 1
Cetacea clade to the exclusion of Carnivora.
DISCUSSION
In this study, we present molecular evidence for theevolutionary relationships of Perissodactyla relatively
TABLE 4
Comparison among Three Possible AlternativePhylogenetic Trees for Perissodactyla (Per),
Carnivora (Car), and Cetartiodactyla (Cet), withPrimates (Pri) as Outgroup, by the Maximum
Likelihood Method
Tree topology
Log-likelihooddifference fromthe maximumlikelihoodtree (6SE)
Bootstrapprobability of
tree being the MLtree from amongthree possibletrees (%)
1 (Pri, (Car, (Cet, Per)Maximum
likelihood tree 85.422 (Pri, (Cet, (Per, Car) 240.71 6 31.18 8.303 (Pri, (Per, (Cet, Car) 242.92 6 30.99 6.28
198 GRAUR, GOUY, AND DURET
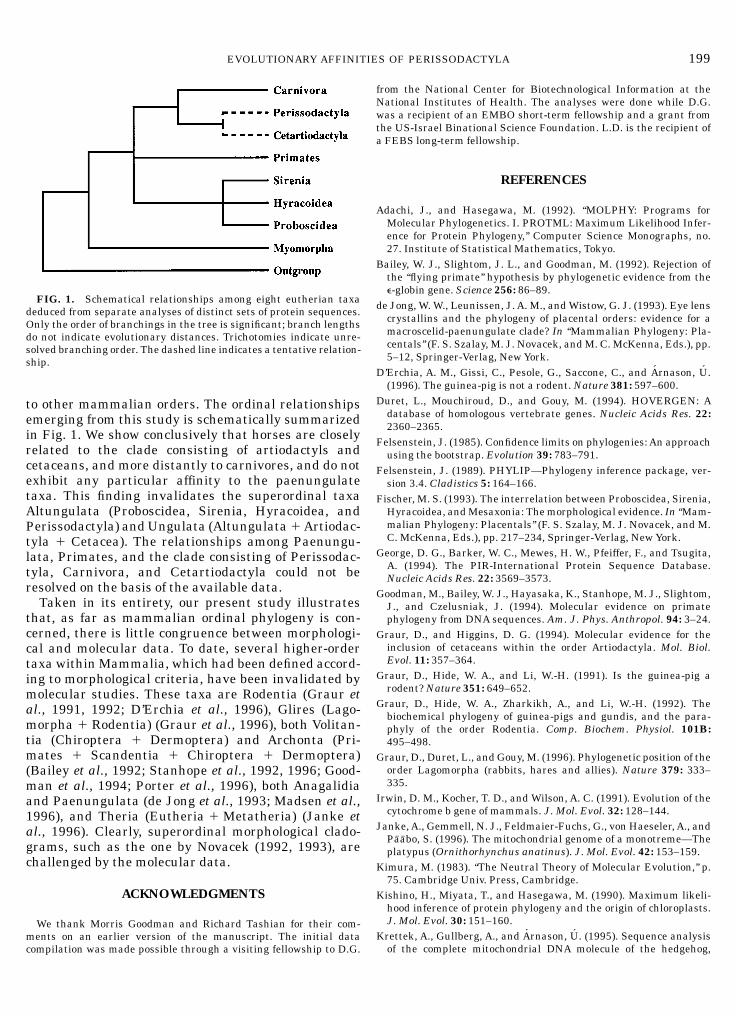
to other mammalian orders. The ordinal relationshipsemerging from this study is schematically summarizedin Fig. 1. We show conclusively that horses are closelyrelated to the clade consisting of artiodactyls andcetaceans, and more distantly to carnivores, and do notexhibit any particular affinity to the paenungulatetaxa. This finding invalidates the superordinal taxaAltungulata (Proboscidea, Sirenia, Hyracoidea, andPerissodactyla) andUngulata (Altungulata 1Artiodac-tyla 1 Cetacea). The relationships among Paenungu-lata, Primates, and the clade consisting of Perissodac-tyla, Carnivora, and Cetartiodactyla could not beresolved on the basis of the available data.Taken in its entirety, our present study illustrates
that, as far as mammalian ordinal phylogeny is con-cerned, there is little congruence between morphologi-cal and molecular data. To date, several higher-ordertaxa withinMammalia, which had been defined accord-ing to morphological criteria, have been invalidated bymolecular studies. These taxa are Rodentia (Graur etal., 1991, 1992; D’Erchia et al., 1996), Glires (Lago-morpha 1 Rodentia) (Graur et al., 1996), both Volitan-tia (Chiroptera 1 Dermoptera) and Archonta (Pri-mates 1 Scandentia 1 Chiroptera 1 Dermoptera)(Bailey et al., 1992; Stanhope et al., 1992, 1996; Good-man et al., 1994; Porter et al., 1996), both Anagalidiaand Paenungulata (de Jong et al., 1993; Madsen et al.,1996), and Theria (Eutheria 1 Metatheria) (Janke etal., 1996). Clearly, superordinal morphological clado-grams, such as the one by Novacek (1992, 1993), arechallenged by the molecular data.
ACKNOWLEDGMENTS
We thank Morris Goodman and Richard Tashian for their com-ments on an earlier version of the manuscript. The initial datacompilation was made possible through a visiting fellowship to D.G.
from the National Center for Biotechnological Information at theNational Institutes of Health. The analyses were done while D.G.was a recipient of an EMBO short-term fellowship and a grant fromthe US-Israel Binational Science Foundation. L.D. is the recipient ofa FEBS long-term fellowship.
REFERENCES
Adachi, J., and Hasegawa, M. (1992). ‘‘MOLPHY: Programs forMolecular Phylogenetics. I. PROTML: Maximum Likelihood Infer-ence for Protein Phylogeny,’’ Computer Science Monographs, no.27. Institute of Statistical Mathematics, Tokyo.
Bailey, W. J., Slightom, J. L., and Goodman, M. (1992). Rejection ofthe ‘‘flying primate’’ hypothesis by phylogenetic evidence from thee-globin gene. Science 256: 86–89.
de Jong, W.W., Leunissen, J.A. M., andWistow, G. J. (1993). Eye lenscrystallins and the phylogeny of placental orders: evidence for amacroscelid-paenungulate clade? In ‘‘Mammalian Phylogeny: Pla-centals’’ (F. S. Szalay, M. J. Novacek, andM. C. McKenna, Eds.), pp.5–12, Springer-Verlag, NewYork.
D’Erchia, A. M., Gissi, C., Pesole, G., Saccone, C., and Arnason, U.(1996). The guinea-pig is not a rodent.Nature 381: 597–600.
Duret, L., Mouchiroud, D., and Gouy, M. (1994). HOVERGEN: Adatabase of homologous vertebrate genes. Nucleic Acids Res. 22:2360–2365.
Felsenstein, J. (1985). Confidence limits on phylogenies:An approachusing the bootstrap. Evolution 39: 783–791.
Felsenstein, J. (1989). PHYLIP—Phylogeny inference package, ver-sion 3.4. Cladistics 5: 164–166.
Fischer, M. S. (1993). The interrelation between Proboscidea, Sirenia,Hyracoidea, andMesaxonia: Themorphological evidence. In ‘‘Mam-malian Phylogeny: Placentals’’ (F. S. Szalay, M. J. Novacek, and M.C. McKenna, Eds.), pp. 217–234, Springer-Verlag, NewYork.
George, D. G., Barker, W. C., Mewes, H. W., Pfeiffer, F., and Tsugita,A. (1994). The PIR-International Protein Sequence Database.Nucleic Acids Res. 22: 3569–3573.
Goodman, M., Bailey, W. J., Hayasaka, K., Stanhope, M. J., Slightom,J., and Czelusniak, J. (1994). Molecular evidence on primatephylogeny from DNA sequences. Am. J. Phys. Anthropol. 94: 3–24.
Graur, D., and Higgins, D. G. (1994). Molecular evidence for theinclusion of cetaceans within the order Artiodactyla. Mol. Biol.Evol. 11: 357–364.
Graur, D., Hide, W. A., and Li, W.-H. (1991). Is the guinea-pig arodent?Nature 351: 649–652.
Graur, D., Hide, W. A., Zharkikh, A., and Li, W.-H. (1992). Thebiochemical phylogeny of guinea-pigs and gundis, and the para-phyly of the order Rodentia. Comp. Biochem. Physiol. 101B:495–498.
Graur, D., Duret, L., and Gouy, M. (1996). Phylogenetic position of theorder Lagomorpha (rabbits, hares and allies). Nature 379: 333–335.
Irwin, D. M., Kocher, T. D., and Wilson, A. C. (1991). Evolution of thecytochrome b gene of mammals. J. Mol. Evol. 32: 128–144.
Janke,A., Gemmell, N. J., Feldmaier-Fuchs, G., von Haeseler,A., andPaabo, S. (1996). The mitochondrial genome of a monotreme—Theplatypus (Ornithorhynchus anatinus). J. Mol. Evol. 42: 153–159.
Kimura, M. (1983). ‘‘The Neutral Theory of Molecular Evolution,’’ p.75. Cambridge Univ. Press, Cambridge.
Kishino, H., Miyata, T., and Hasegawa, M. (1990). Maximum likeli-hood inference of protein phylogeny and the origin of chloroplasts.J. Mol. Evol. 30: 151–160.
Krettek, A., Gullberg, A., and Arnason, U. (1995). Sequence analysisof the complete mitochondrial DNA molecule of the hedgehog,
FIG. 1. Schematical relationships among eight eutherian taxadeduced from separate analyses of distinct sets of protein sequences.Only the order of branchings in the tree is significant; branch lengthsdo not indicate evolutionary distances. Trichotomies indicate unre-solved branching order. The dashed line indicates a tentative relation-ship.
199EVOLUTIONARY AFFINITIES OF PERISSODACTYLA

Erinaceus europaeus, and the phylogenetic position of the Lipo-typhla. J. Mol. Evol. 42: 952–957.
Ma, D. P., Zharkikh, A., Graur, D., VandeBerg, J. L., and Li, W.-H.(1993). Structure and evolution of opossum, guinea pig, andporcupine cytochrome b genes. J. Mol. Evol. 36: 327–334.
Madsen, O., Deen, P. M. T., and de Jong, W. W. (1996). Furtherevidence for a macroscelid-paenungulate clade as derived fromaquaporin-2 sequences. In ‘‘Proceedings of the Fifth InternationalCongress of Systematic and Evolutionary Biology,’’ p. 69, Budapest.
McKenna, M. C. (1975). Toward a phylogenetic classification of theMammalia. In ‘‘Phylogeny of the Primates: An InterdisciplinaryApproach’’ (W. P. Luckett and F. S. Szalay, Eds.), pp. 21–46,Plenum, NewYork.
Milinkovitch,M. C. (1995). Molecular phylogeny of cetaceans promptsrevision of morphological transformations. Trends Ecol. Evol. 10:328–334.
Montgelard, C., Catzeflis, F. M., and Douzery, E. (1997). Phylogeneticrelationships of artiodactyls and cetaceans as deduced from thecomparison of mitochondrial cytochrome b and 12S rRNA se-quences.Mol. Biol. Evol., in press.
Novacek, M. J. (1992). Mammalian phylogeny: Shaking the tree.Nature 356: 121–125.
Novacek, M. J. (1993). Reflections on higher mammalian phylogenet-ics. J. Mamm. Evol. 1: 3–30.
Porter, C. A., Goodman, M., and Stanhope, M. J. (1996). Evidence onmammalian phylogeny from sequences of exon 28 of the vonWillebrand factor gene.Mol. Phylogenet. Evol. 5: 89–101.
Prothero, D. R. (1993). Ungulate phylogeny:Molecular vs.morphologi-cal evidence. In ‘‘Mammalian Phylogeny: Placentals’’ (F. S. Szalay,M. J. Novacek, and M. C. McKenna, Eds.), pp. 173–181, Springer-Verlag, NewYork.
Prothero, D. R., and Schock, R. M. (1989). Origin and evolution of thePerissodactyla: Summary and synthesis. In ‘‘The Evolution of
Perissodactyls’’ (D. R. Prothero and R. M. Schock, Eds.), pp.504–537, Clarendon, NewYork.
Prothero, D. R., Manning, E. M., and Fischer, M. S. (1988). Thephylogeny of the ungulates. In ‘‘The Phylogeny and Classificationof Tetrapods’’ (M. J. Benton, Ed.), pp. 201–234, Oxford Univ. Press,Oxford.
Queralt, R., Adroer, R., Oliva, R., Winkfein, R. J., Retief, J. D., andDixon, G. H. (1995). Evolution of protamine P1 genes in mammals.J. Mol. Evol. 40: 601–607.
Saitou, N., and Nei, M. (1987). The neighbor-joining method: A newmethod for reconstructing phylogenetic trees. Mol. Biol. Evol. 4:406–425.
Shoshani, J. (1993). Hyracoidea-Tethytheria affinity based onmyologi-cal data. In ‘‘Mammalian Phylogeny: Placentals’’ (F. S. Szalay, M. J.Novacek, andM. C. McKenna, Eds.), pp. 235–256, Springer-Verlag,NewYork.
Stanhope,M. J., Czelusniak, J., Si, J. S., Nickerson, J., and Goodman,M. (1992). A molecular perspective on mammalian evolution fromthe gene encoding interphotoreceptor retinoid binding protein,with convincing evidence for bat monophyly.Mol. Phylogenet. Evol.1: 148–160.
Stanhope, M. J., Smith, J. L., Waddell, V. G., Porter, C. A., Shivji,M. S., and Goodman, M. (1996). Mammalian evolution and theinterphotoreceptor retinoid binding protein (IRBP) gene: Convinc-ing evidence for several superordinal clades. J. Mol. Evol. 43:83–92.
Thompson, J. D., Higgins, D. G., and Gibson, T. J. (1994). CLUSTALW: Improving the sensitivity of progressive multiple sequencealignment through sequence weighting, position-specific gap penal-ties and weight matrix choice.Nucleic Acids Res. 22: 4673–4780.
Zolzer, U., and von Hagen, H. O. (1995). Amino acid sequences of P1protamines and the phylogeny of eutherian mammals: A cladisticstudy. Comp. Biochem. Physiol. 110B: 805–815.
200 GRAUR, GOUY, AND DURET