Embed Size (px)
Citation preview
Evolution of the electrical contact of dynamicpantograph–catenary system
Guangning Wu1 • Wenfu Wei1 • Guoqiang Gao1 • Jie Wu1 • Yue Zhou1
Received: 29 October 2015 / Revised: 18 March 2016 / Accepted: 19 March 2016 / Published online: 9 April 2016
� The Author(s) 2016. This article is published with open access at Springerlink.com
Abstract A good contact between the pantograph and
catenary is critically important for the working reliability of
electric trains, while the basic understanding on the electrical
contact evolution during the pantograph–catenary system
working is still ambiguous so far. In this paper, the evolution
of electric contact was studied in respects of the contact
resistance, temperature rise, and microstructure variation,
based on a home-made pantograph–catenary simulation
system. Pure carbon strips and copper alloy contact wires
were used, and the experimental electrical current, sliding
speed, and normal force were set as 80 A, 30 km/h, and 80 N,
respectively. The contact resistance presented a fluctuation
without obvious regularity, concentrating in the region of 25
and 50 mX. Temperature rise of the contact point experi-
enced a fast increase at the first several minutes and finally
reached a steady state. The surface damage of carbon trips in
microstructure analysis revealed a complicated interaction of
the sliding friction, joule heating, and arc erosion.
Keywords Pantograph–catenary system � Electrical
contact � Electric trains � Contact resistance � Temperature
rise � Microstructure
1 Introduction
Pantograph–catenary system bears the task of energy
transfer from the electrical power grid to electric trains;
therefore, the electrical contact between the pantograph
and catenary is directly related with the working reliability
and safety of the trains. In the working situation, the
overhead contact wire and sliding strip suffer from the
multiple impacts of zigzag sliding friction, joule heating,
and offline arcing erosion, which make the evolution of
electrical contact rather complex. Especially the random
arcing become more predominant at higher speed, heavier
load, and cold weather conditions, which has already
turned into a great obstacle for the stable current collection
[1].
Among the great amounts of researches related with the
pantograph–catenary system, large efforts were made on
the mechanical vibration coupling analysis, aerodynamic
force calculation, and active control design [2–5]. Rela-
tively, researches on the electrical contact itself were paid
less attention to. Besides the comparison of friction wear
properties under different current and speed conditions [6,
7], there were also constant interests in the electrical
temperature characteristics [8], conducted and radiated
electromagnetic emission, etc. [9, 10]. All the above
studies were closely related to the electrical contact of the
pantograph–catenary system and therefore, possess signif-
icant importance to prompt the development of high-speed
railway technology.
However, most previous researches were focused on
only one or two aspects of the electrical contact and could
reveal limited information on the dynamic evolution pro-
cess. Simultaneous investigations into the different aspects
of the electrical contact, such as the conductivity variation,
temperature rise, as well as the microstructure character-
istics, would be absolutely helpful for a better under-
standing of the pantograph–catenary system.
In this work, a comprehensive study on the sliding
electrical contact of a pantograph–catenary system was
carried out. Simultaneous voltage and current were
& Wenfu Wei
1 School of Electrical Engineering, Southwest Jiaotong
University, Chengdu 610031, China
123
J. Mod. Transport. (2016) 24(2):132–138
DOI 10.1007/s40534-016-0099-1
recorded to obtain the conductivity property, while infrared
thermometry was utilized to get the temperature rise. In the
end, the surface damages and material transfer were studied
through microstructure analysis. Experimental results of
this paper may help reveal the physical mechanisms for the
sliding electrical contact of pantograph–catenary system
and also provide a benchmark for the modeling of pan-
tograph–catenary system.
2 Experimental setup
2.1 The pantograph–catenary simulation test
system
Considering the real working conditions of a pantograph–
catenary system, a set of pantograph–catenary contact test
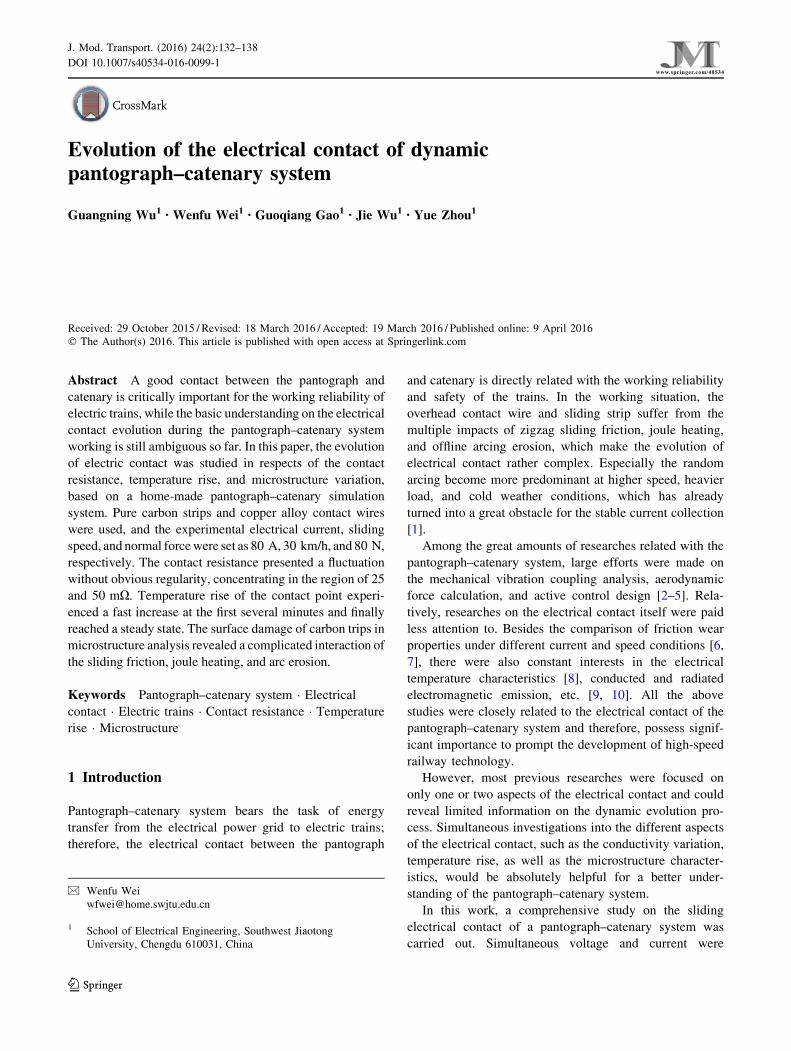
apparatus was set up. As shown in Fig. 1, this experimental
system consisted of an AC power source, adjustable resis-
tance, inductance loads, a rotating wheel, and a carbon
strip; a partial photo of the experimental apparatus is given
in Fig. 2. The AC power source adopted the electrical–
electronic technology and effectively realized a stable out-
put current from 0 to 200 A in a compact structure. The
adjustable resistance and inductance were used to simulate
the different train loads. The copper alloy wire with a
realistic geometry was fixed in the groove around the outer
edge of the rotating wheel. The pantograph strip, made of
carbon materials, was housed on a carriage driven by two
different motors. The rotating movement of contact wire
and the horizontal translation of pantograph strip success-
fully realized the zigzag motion in the real working con-
dition. Furthermore, the pantograph strip could move in the
vertical direction to simulate the switch status. During the
experiments, the electrical current came from the constant
current power source, passing through the contact wire, the
pantograph strip, and the adjustable resistive–inductance
load, and eventually went back to the power source. The
above electrical layout was similar to that of a real working
pantograph–catenary system.
In this work, experimental parameters of the electrical
current, sliding speed, and normal force was fixed as 80 A,
30 km/h, and 80 N, respectively. The running time of each
experiment was lasted for 10 min.
2.2 Measurement methods
The contact voltage across the wheel and strip was mea-
sured by a 1,000:1 high voltage probe (TPP0250, Tek-
tronix), while the current was measured by a Rogowski coil
(i400s, Fluke). The two-dimensional infrared images con-
taining temperature information were recorded by an
infrared thermometer (NS9500, NEC InfraRed Camera)
with a record speed of five frames per second. It is worth
noting that since the most previous study on the tempera-
ture characteristics utilized a thermocouple probe buried in
the strip, our infrared measurement provided a non-intru-
sive as well as spatial-resolution detection.
The electrical signals were both stored into a multi-
channel recorder, with a constant sampling frequency of
1 kHz. Thermometer could be triggered either manually or
automatically. After the experiments, the carbon strip was
disassembled for microstructure examination by a scanning
electron microscope.
3 Results and discussions
3.1 Characteristics of electrical parameters
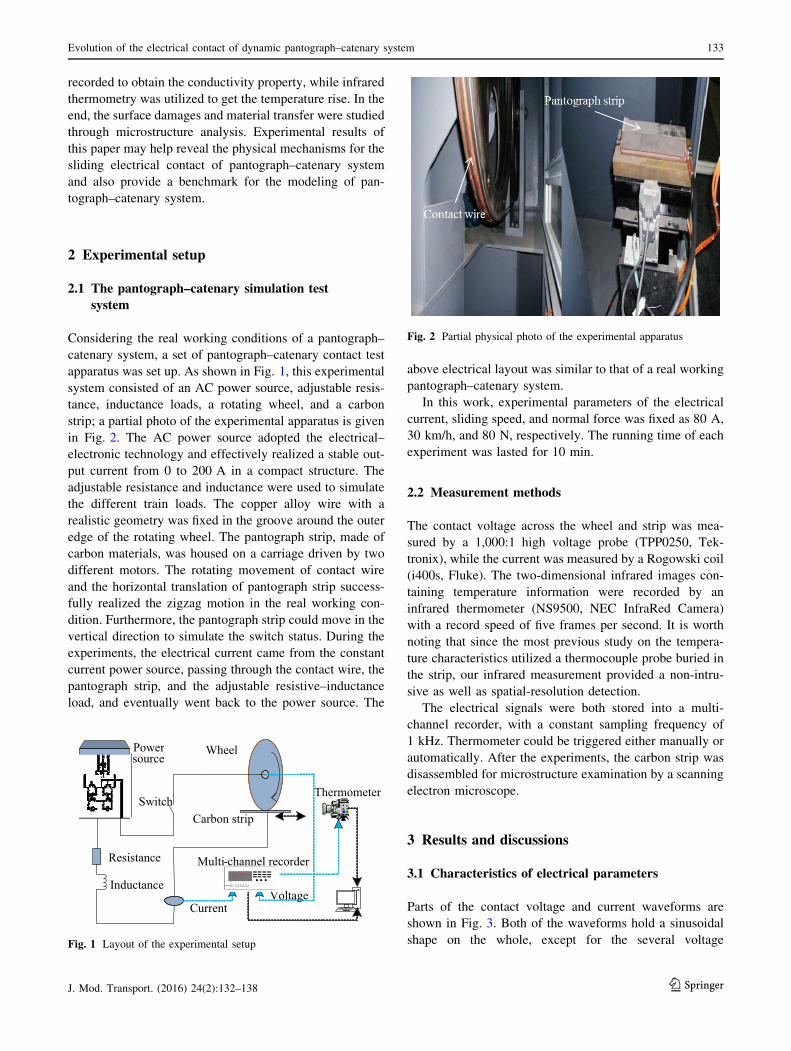
Parts of the contact voltage and current waveforms are
shown in Fig. 3. Both of the waveforms hold a sinusoidal
shape on the whole, except for the several voltage
Resistance
Inductance
Carbon strip
Wheel
CurrentVoltage
osc
Switch
Powersource
Multi-channel recorder
Thermometer
Fig. 1 Layout of the experimental setup
Fig. 2 Partial physical photo of the experimental apparatus
Evolution of the electrical contact of dynamic pantograph–catenary system 133
123J. Mod. Transport. (2016) 24(2):132–138
distortion regions which were probably accompanied by
pantograph arcing or sparking. The phase of voltage wave-
form stays the same as that of current waveform, due to the
resistive properties of the contact area. Amplitude of the
contact voltage reaches around 2 V. The sharp changes of
contact voltage, for example at 306.05 and 306.19 s, were
directly resulted from the steep drop of contact force, which
was expected to induce the occurrence of pantograph arcing.
According to our previous study on the pantograph arcing,
the resistance of arc plasma was generally one order of
magnitude higher than the normal contact resistance.
The occurrence of pantograph arcing not only distorted
the electrical power quality, but also resulted in the severe
temperature rise on the electrodes surfaces, ablated mate-
rial, and worsen the current collection system damages.
The primary cause for the pantograph arcing should be
attributed to the unexpected vibration between contact wire
and strip due to the geometry singularity. Therefore, the
occurrence of pantograph arcing was quite random, which
brought in great difficulties in the study of electrical con-
tact properties. Previous researches have shown that the
occurrence probability increased as the running speed got
higher, while the arc erosion became much more serious
[11]. Although the comprehensive impacts of arcing on the
surface damages were still not clarified well, the electrical
parameter characteristics had been well analyzed based on
the classic Cassie-mayr’s equation [12, 13], while the
evolution of spatial temperature distribution could be fur-
ther surveyed by the magnetic-hydrodynamic theory.
3.2 Contact resistance with time
From the above discussion, the electrical contact exhibited
an ideal resistive property. Therefore, the contact resistance
R could be directly obtained using the Ohm’s law, R =
U/I, where U and I were the experimentally recorded
contact voltage and current, respectively.
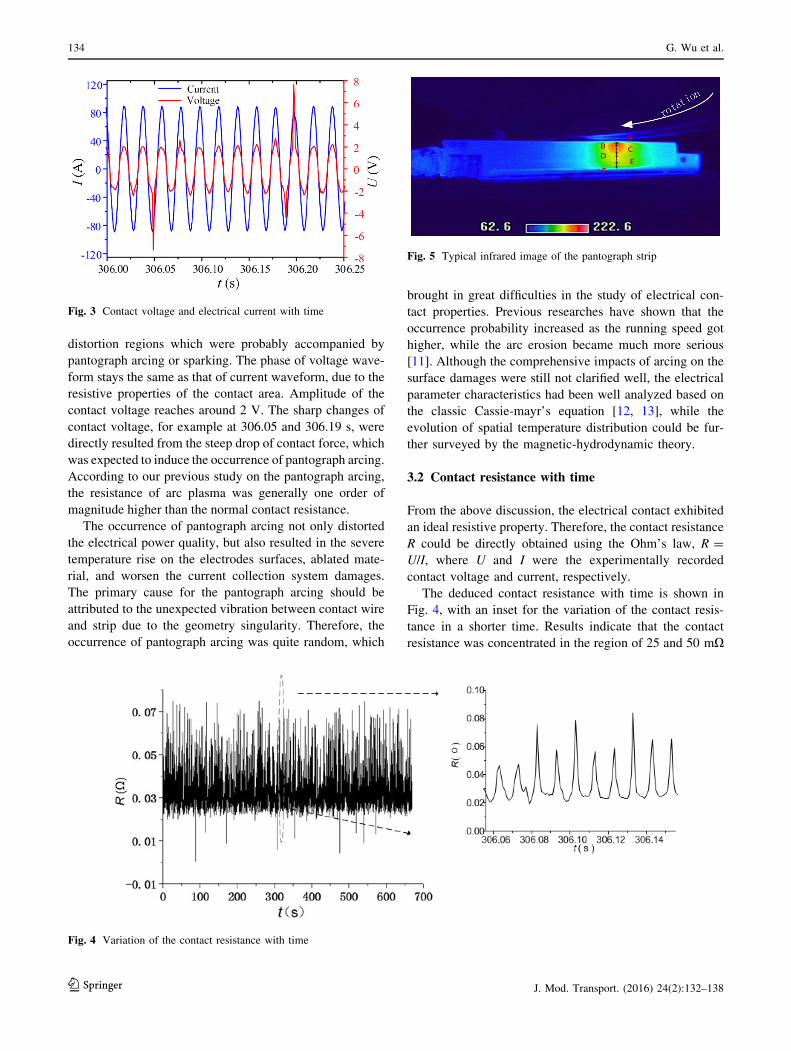
The deduced contact resistance with time is shown in
Fig. 4, with an inset for the variation of the contact resis-
tance in a shorter time. Results indicate that the contact
resistance was concentrated in the region of 25 and 50 mX
Fig. 3 Contact voltage and electrical current with time
Fig. 4 Variation of the contact resistance with time
Fig. 5 Typical infrared image of the pantograph strip
134 G. Wu et al.
123 J. Mod. Transport. (2016) 24(2):132–138
during the entire period and experienced a relatively small
fluctuation. The fluctuation period was 10 ms, just a half
cycle of the AC power frequency. We regarded that the
regular crossing zero of AC current contributed to the
regular rise of contact resistance. The fluctuation irregu-
larity in resistance values could be explained from the
variation of effective contact area. The effective contact
area was the actual contact parts from the microscopic
aspect, which suffered from the friction work, joule heat,
and/or arcing erosion. During the constant sliding process
with current, the effective contact area was always going
through a dynamic variation of being destroyed and re-
formation from one place to another. Therefore, the contact
resistance depended on the effective contact area and
experienced an obvious fluctuation. On the other hand, the
average contact resistance was highly depended on the
contact force, material resistivity, running speed, and cur-
rent. The former two parameters determined primarily the
static contact resistance, while the latter two parameters
influenced the dynamic variation process significantly.
3.3 Temperature distribution of pure carbon strip
Material properties, such as resistivity, hardness, and fric-
tion coefficient, are temperature dependent, and will
influence the final wear loss level of the material. Hence an
investigation on temperature characteristic during the
pantograph–catenary working is quite necessary. Typical
infrared image of the pantograph strip is shown in Fig. 5. It
can be seen that the highest temperature was just located at
the contact point of the pantograph strip and contact wire.
With the distance away from the contact point increasing,
the temperature decreased gradually. On the whole, a
Gaussian-like temperature distribution in the pantograph
strip could be found. The temperature of the contact wire
remained at quite low level due to the constant rotation.
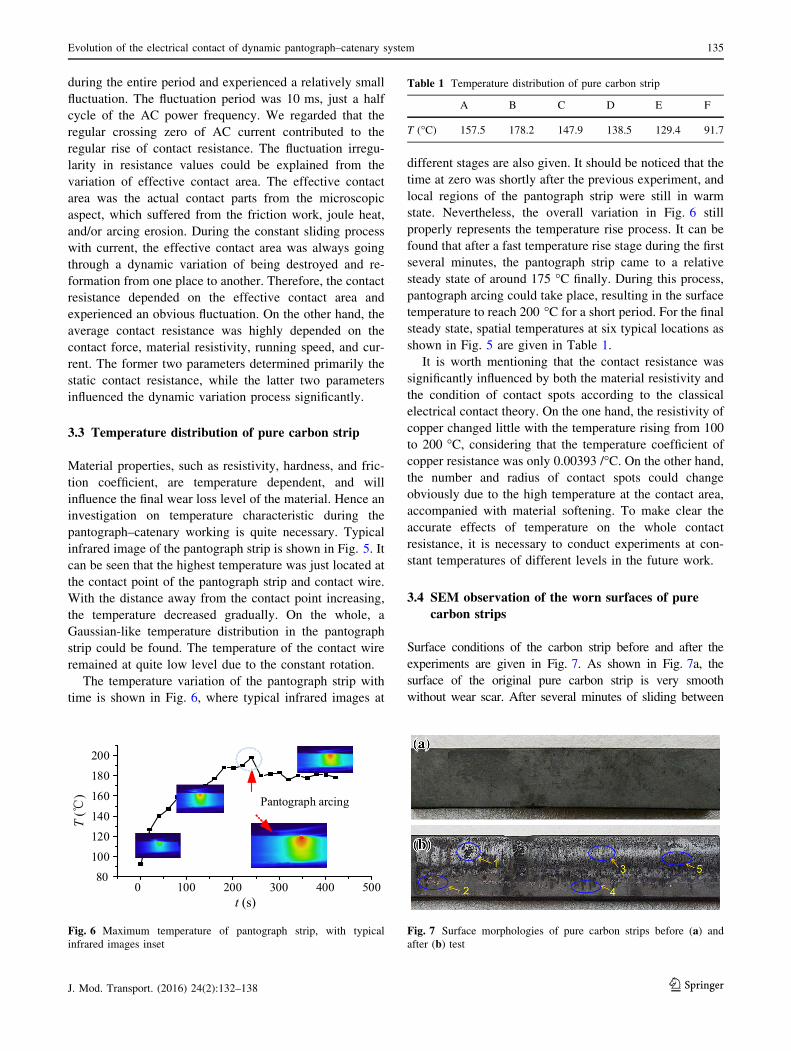
The temperature variation of the pantograph strip with
time is shown in Fig. 6, where typical infrared images at
different stages are also given. It should be noticed that the
time at zero was shortly after the previous experiment, and
local regions of the pantograph strip were still in warm
state. Nevertheless, the overall variation in Fig. 6 still
properly represents the temperature rise process. It can be
found that after a fast temperature rise stage during the first
several minutes, the pantograph strip came to a relative
steady state of around 175 �C finally. During this process,
pantograph arcing could take place, resulting in the surface
temperature to reach 200 �C for a short period. For the final
steady state, spatial temperatures at six typical locations as
shown in Fig. 5 are given in Table 1.
It is worth mentioning that the contact resistance was
significantly influenced by both the material resistivity and
the condition of contact spots according to the classical
electrical contact theory. On the one hand, the resistivity of
copper changed little with the temperature rising from 100
to 200 �C, considering that the temperature coefficient of
copper resistance was only 0.00393 /�C. On the other hand,
the number and radius of contact spots could change
obviously due to the high temperature at the contact area,
accompanied with material softening. To make clear the
accurate effects of temperature on the whole contact
resistance, it is necessary to conduct experiments at con-
stant temperatures of different levels in the future work.
3.4 SEM observation of the worn surfaces of pure
carbon strips
Surface conditions of the carbon strip before and after the
experiments are given in Fig. 7. As shown in Fig. 7a, the
surface of the original pure carbon strip is very smooth
without wear scar. After several minutes of sliding between
0 100 200 300 400 50080
100
120
140
160
180
200
T (
) Pantograph arcing
t (s)
Fig. 6 Maximum temperature of pantograph strip, with typical
infrared images inset
Fig. 7 Surface morphologies of pure carbon strips before (a) and
after (b) test
Table 1 Temperature distribution of pure carbon strip
A B C D E F
T (�C) 157.5 178.2 147.9 138.5 129.4 91.7
Evolution of the electrical contact of dynamic pantograph–catenary system 135
123J. Mod. Transport. (2016) 24(2):132–138

pantograph strip and catenary wire, a new surface morphology
with pits and craters appeared, as shown in Fig. 7b. The new
morphologies were generally classified as the following five
types (corresponding to regions 1–5 in Fig. 7, respectively):
• Craters Diameters of typical craters could reach as high
as several millimeters. Serious arc discharge accompa-
nying the high-speed friction would be major contri-
butions to the formation of craters.
• Dull-red area There were irregular dull-red areas
distributed on the strip surface, indicating that the
material of copper alloy wire was gradually transferred
to the strip. This area would be referenced as material
transfer area hereinafter.
• Bright area White bright area was much brighter than
the basic carbon materials, which could possibly result
from the deposition of oxidative materials.
• Dark stream line Dark stream line was in the same
direction of the contact wire rotation.
• Pits There were great amounts of pits, with much
smaller diameter than the crater, widely distributed on
the strip surface.
Both the dark stream line and the pits could be the direct
evidence of arc discharge occurrence.
The typical microstructures in different areas of the
pantograph strip are shown in Fig. 8. Figure 8a presents the
original strip surface used for comparison, and Fig. 8b–d is
the enlarged pictures of material transfer area, bright area,
and arc ablation area, respectively. By comparing the sur-
face pictures before and after test, we can find that the
surface of strip became bumpy, and a large number of wear
debris, arc ablation craters, and spalling blocks appeared.
Meanwhile, some flake-like fragments can also be found
from the worn surface.
When the pantograph strip rubbed against the catenary
wire with the current, arc discharges occurred frequently
because of the air gap of pantograph–catenary system
breakdown. A lot of heat was generated on the contact
surface, which included arc heat, Joule heat, and friction
heat, resulting in the plastic deformation of material. The
high temperature generated by the pantograph–catenary arc
would ablate pantograph strip and catenary wire, simulta-
neously melting metal material and gasifying carbon
Fig. 8 SEM images of pure carbon strips in four different cases. a Original surface before test. b Material transfer area. c Bright area. d Arc
ablation area
136 G. Wu et al.
123 J. Mod. Transport. (2016) 24(2):132–138
material from the pantograph strip and contact wire [14].
As a result, the number of real contact points on the contact
surface decreased, and the electrical contact condition of
the pantograph–catenary system tended to deteriorate. The
friction force, friction heat, and shear force all increased,
producing a few of wear cracks. With the sliding contin-
ually going on, flake-like delaminations (Fig. 8c) were
formed on the contact surface. That was attributed to the
serious material adhesion caused by high temperature, and
the fracturing delamination caused by shearing force and
normal stress. The flake-like delaminations would further
evolve into spalling blocks by shearing force, as shown in
Fig. 8b and c. In addition, we can find a large number of
debris on the surface of the strip in Fig. 8b. It could be
concluded that abrasive wear had played an important part
in material transfer process. There are several craters dis-
tributed on the strip in Fig. 8d, which could be the evidence
of intense arc discharges. In summary, in the whole process
of rubbing, the temperature rise of the contact couple was
an important factor which had a significant influence on the
wear rate of the pantograph–catenary system.
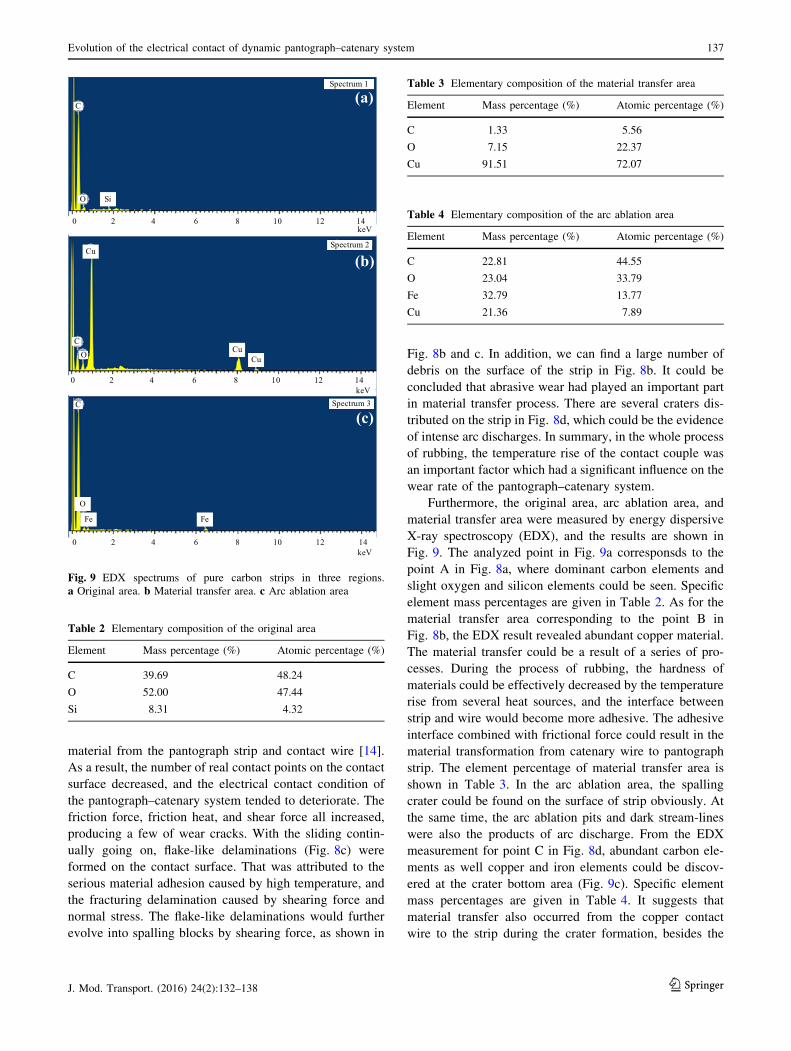
Furthermore, the original area, arc ablation area, and
material transfer area were measured by energy dispersive
X-ray spectroscopy (EDX), and the results are shown in
Fig. 9. The analyzed point in Fig. 9a corresponsds to the
point A in Fig. 8a, where dominant carbon elements and
slight oxygen and silicon elements could be seen. Specific
element mass percentages are given in Table 2. As for the
material transfer area corresponding to the point B in
Fig. 8b, the EDX result revealed abundant copper material.
The material transfer could be a result of a series of pro-
cesses. During the process of rubbing, the hardness of
materials could be effectively decreased by the temperature
rise from several heat sources, and the interface between
strip and wire would become more adhesive. The adhesive
interface combined with frictional force could result in the
material transformation from catenary wire to pantograph
strip. The element percentage of material transfer area is
shown in Table 3. In the arc ablation area, the spalling
crater could be found on the surface of strip obviously. At
the same time, the arc ablation pits and dark stream-lines
were also the products of arc discharge. From the EDX
measurement for point C in Fig. 8d, abundant carbon ele-
ments as well copper and iron elements could be discov-
ered at the crater bottom area (Fig. 9c). Specific element
mass percentages are given in Table 4. It suggests that
material transfer also occurred from the copper contact
wire to the strip during the crater formation, besides the
0 2 4 6 8 10 12 14keV
0 2 4 6 8 10 12 14keV
0 2 4 6 8 10 12 14keV
Spectrum 1
Spectrum 2
Spectrum 3
CuCu
FeFe
O
C
O
C
Cu
SiO
C(a)
(b)
(c)
Fig. 9 EDX spectrums of pure carbon strips in three regions.
a Original area. b Material transfer area. c Arc ablation area
Table 2 Elementary composition of the original area
Element Mass percentage (%) Atomic percentage (%)
C 39.69 48.24
O 52.00 47.44
Si 8.31 4.32
Table 3 Elementary composition of the material transfer area
Element Mass percentage (%) Atomic percentage (%)
C 1.33 5.56
O 7.15 22.37
Cu 91.51 72.07
Table 4 Elementary composition of the arc ablation area
Element Mass percentage (%) Atomic percentage (%)
C 22.81 44.55
O 23.04 33.79
Fe 32.79 13.77
Cu 21.36 7.89
Evolution of the electrical contact of dynamic pantograph–catenary system 137
123J. Mod. Transport. (2016) 24(2):132–138
previously described material transfer area. Therefore, the
arc discharge could be expected as a significant factor
resulting in the material transfer of pantograph–catenary
system. However, the damage mechanism of the pan-
tograph–catenary system included both mechanical and
electrical wear. The accurate wear process would possibly
be well understood by a multiple physics coupling simu-
lation in the future work.
4 Conclusion
In this paper, the evolution of the electrical contact
between pantograph and catenary was studied in respects
of the electrical conductivity, temperature rise, as well as
the microstructure variation. The following conclusions
can be drawn.
• The contact resistance was majorly concentrated in the
region of 25 and 50 mX, and a relative fluctuation
without obvious regularity could be found.
• The temperature of the contact point experienced a fast
rise int the first several minutes but finally reached a
steady state of 175 �C. Spatial temperature exhibited a
Gaussian-like distribution, and the random arc dis-
charge could induce a sharp increase of local
temperature.
• The evolution mechanisms were discussed from the
microstructure analysis of five typical morphologies,
and arc discharges was expected to be responsible for
the formations of dark stream line, pits, and craters,
while the material transfer process was dependent on
adhesion wear and arc discharge.
Acknowledgments This work was supported by the National Nat-
ural Science Foundation of China (Nos. U1234202 and 51577158),
the National Science Foundation for Distinguished Young Scholars of
China (No. 51325704), and the Fundamental Research Funds for the
Central Universities (No. A0920502051505-19).
Open Access This article is distributed under the terms of the
Creative Commons Attribution 4.0 International License (http://
creativecommons.org/licenses/by/4.0/), which permits unrestricted
use, distribution, and reproduction in any medium, provided you give
appropriate credit to the original author(s) and the source, provide a
link to the Creative Commons license, and indicate if changes were
made.
References
1. Midya S, Bormann D, Larsson A, Schutte T, Thottappillil R
(2008) Understanding pantograph arcing in electrified railways—
influence of various parameters. In: 2008 IEEE international
symposium on electromagnetic compatibility, vols 1–3,
pp 592–597
2. Zhang W, Zhou N, Li R, Mei G, Song D (2011) Pantograph and
catenary system with double pantographs for high-speed trains at
350 km/h or higher. J Mod Transp 19(1):7–11
3. Collina A, Bruni S (2002) Numerical simulation of pantograph-
overhead equipment interaction. Veh Syst Dyn 38(4):261–291
4. Chater E, Ghani D, Giri F, Haloua M (2015) Output feedback
control of pantograph–catenary system with adaptive estimation
of catenary parameters. J Mod Transp 160(4):257–266
5. Zhai WM, Cai CB (1998) Effect of locomotive vibrations on
pantograph–catenary system dynamics. Veh Syst Dyn 29:47–58
6. Yang HJ, Chen GX, Gao GQ, Wu GN, Zhang WH (2015)
Experimental research on the friction and wear properties of a
contact strip of a pantograph–catenary system at the sliding speed
of 350 km/h with electric current. Wear 332:949–955
7. Yang HJ, Hu Y, Chen GX, Zhang WH, Wu GN (2014) Corre-
lation between the wear and vibration of the contact strip in a
contact wire rubbing against a contact strip with electrical cur-
rent. Tribol Trans 57(1):86–93
8. Ge X, Liu WZ, Yang ZP, Wang YF (2014) The study on elec-
trical temperature characteristics of high speed pantograph. In:
2014 IEEE transportation electrification conference and Expo
(Itec) Asia-Pacific 2014
9. Tellini B, Macucci M, Giannetti R, Antonacci GA (2001) Con-
ducted and radiated interference measurements in the line-pan-
tograph system. IEEE Trans Instrum Meas 50(6):1661–1664
10. Midya S, Thottappillil R (2008) An overview of electromagnetic
compatibility challenges in European rail traffic management
system. Transp Res Part C Emerg Technol 16(5):515–534
11. Hu Y, Chen GX, Gao GQ, Wu GN, Zhang WH, Zhou ZR (2015)
Study on material transfer in the process of contact strips rubbing
against a contact wire with electric current. Proc Inst Mech Eng
Part J J Eng Tribol 230:202–211
12. Liu YJ, Chang GW, Huang HM (2010) Mayr’s equation-based
model for pantograph arc of high-speed railway traction system.
IEEE Trans Power Deliv 25(3):2025–2027
13. Li TZ, Wu GN, Zhou LJ, Gao GQ, Wang WG, Wang B, Liu DL,
Li DJ (2011) Pantograph arcing’s impact on locomotive equip-
ments. In: 2011 IEEE 57th Holm conference on electrical
contacts
14. Ding T, Chen GX, Bu J, Zhang WH (2011) Effect of temperature
and arc discharge on friction and wear behaviours of carbon
strip/copper contact wire in pantograph–catenary systems. Wear
271(9–10):1629–1636
138 G. Wu et al.
123 J. Mod. Transport. (2016) 24(2):132–138