Embed Size (px)
Citation preview

Shock Waves (2012) 22:403–415DOI 10.1007/s00193-012-0399-2
ORIGINAL ARTICLE
Evolution of blast wave profiles in simulated air blasts:experiment and computational modeling
N. Chandra · S. Ganpule · N. N. Kleinschmit ·R. Feng · A. D. Holmberg · A. Sundaramurthy ·V. Selvan · A. Alai
Received: 9 February 2012 / Revised: 26 April 2012 / Accepted: 4 July 2012 / Published online: 24 July 2012© Springer-Verlag 2012
Abstract Shock tubes have been extensively used in thestudy of blast traumatic brain injury due to increased inci-dence of blast-induced neurotrauma in Iraq and Afghanistanconflicts. One of the important aspects in these studies ishow to best replicate the field conditions in the laboratorywhich relies on reproducing blast wave profiles. Evolutionof the blast wave profiles along the length of the compres-sion-driven air shock tube is studied using experiments andnumerical simulations with emphasis on the shape and mag-nitude of pressure time profiles. In order to measure dynamicpressures of the blast, a series of sensors are mounted on acylindrical specimen normal to the flow direction. Our resultsindicate that the blast wave loading is significantly differentfor locations inside and outside of the shock tube. Pressureprofiles inside the shock tube follow the Friedlander wave-form fairly well. Upon approaching exit of the shock tube, anexpansion wave released from the shock tube edges signif-icantly degrades the pressure profiles. For tests outside theshock tube, peak pressure and total impulse reduce drasti-cally as we move away from the exit and majority of loadingis in the form of subsonic jet wind. In addition, the planarityof the blast wave degrades as blast wave evolves three dimen-sionally. Numerical results visually and quantitatively con-firm the presence of vortices, jet wind and three-dimensionalexpansion of the planar blast wave near the exit. Pressureprofiles at 90◦ orientation show flow separation. When cyl-inder is placed inside, this flow separation is not sustained,but when placed outside the shock tube this flow separation
Communicated by M. Brouillette.
N. Chandra (B) · S. Ganpule · N. N. Kleinschmit · R. Feng ·A. D. Holmberg · A. Sundaramurthy · V. Selvan · A. AlaiDepartment of Mechanical and Materials Engineering,University of Nebraska-Lincoln, Lincoln, NE 68588-0656, USAe-mail: [email protected]
is sustained which causes tensile loading on the sides of thecylinder. Friedlander waves formed due to field explosives inthe intermediate-to far-field ranges are replicated in a narrowtest region located deep inside the shock tube.
Keywords Blast wave · Shock tube · Pressure profiles ·Expansion · Jet wind · Experiments ·Numerical simulations · TBI
1 Introduction
Due to the increased use of improvised explosive devices(IED’s) in military conflicts, there has been a major increasein the number of traumatic brain injuries (TBI’s) [1].A major limitation of the current state of blast-induced TBI(BTBI) is the paucity of information on the pathophysiologyof blast-induced neurotrauma (BINT) [2]. This has led to anincrease in blast studies in recent years through animal mod-els, head surrogates and human cadavers using shock tubes[3–15]. In this work the attention is focused on compressedgas (e.g. Helium, Nitrogen) driven air shock tubes, which areextensively used as the standard research tool. The energy todrive the air shock can also be obtained from small explosives[4,16] as well as combustible fluids like oxy-acetylene [17].While explosives yield higher overpressures, the test speci-mens will be subjected to smoke and chemical residues. Thecombustible shock tubes can easily generate high pressureswith less kinetic energy; however, varying both overpres-sure and duration independently is a challenge. In all theseresearch efforts, the effect of sample placement (or discussionof consideration of sample placement) along the length of theshock tube is not critically analyzed. The locations includeplacement of the sample at various locations inside and out-side of the shock tube. Placement of the sample outside the
123

404 N. Chandra et al.
Positive Impulse (I+)
Ove
rpre
ssur
e
Negative phase duration
Peak Overpressure
Ambient Pressure
Shoc
k fr
ont
Nonlinear decay
positive phase duration
time
Fig. 1 Mathematical representation of planar Friedlander waveform.Equation in the figure represents instantaneous overpressure p+ at giventime t , where p∗ is the peak overpressure, td is positive phase durationand b is decay constant
shock tube is preferred by researchers, as the dimensions ofthe sample are equivalent or larger than the cross-sectionaldimensions of the shock tube [9,15]. It is known that thepressure profiles continuously change along the length of theshock tube [18], which in turn can change biomechanicalresponse of the sample (e.g. animal, cadaver) in terms ofinjury type, severity and lethality. Thus to create an accuraterepresentation of a blast wave generated from an IED in thefar-field range, the sample placement must be carefully con-sidered. The goal of this work was to understand blast waveevolution along the length of the shock tube with particularemphasis on the evolution when blast wave exits the shocktube.
In a typical free-field explosion, a blast wave propagatesradially from the source of the explosive. Close to the sourceof the explosion, the pressure history is very turbulent andunpredictable, but further away from the center the blast wavetakes the form of a Friedlander wave [19]. This wave has thecharacteristics of shock front followed by nonlinear decay asshown in Fig. 1. In this work we focus on Friedlander wave(positive phase) implicated in BINT.
2 Review of shock tube theory
Although individual shock tubes for blast wave simulationmay have different features for different purposes, the essen-tial wave physics can be understood by analyzing the wavepropagation in a generic shock tube configuration as shown inFig. 3. A typical (compression driven) shock tube consists ofa driver section of pressurized gas and a driven section of airat atmospheric pressure with the two sections separated byset of membranes. When the membranes bursts, the drivergas expands rapidly and compresses the atmospheric air(i.e. driven gas) in front to a shocked state, which propa-gates forward as an air shock wave. Meanwhile, the drivergas expansion initiates a family of infinite rarefaction waves(expansion fan). These rarefaction waves first travel towardsclosed end, get reflected at the closed end and then travel
towards open end. Their sequential arrivals at a given loca-tion of driven section produce a nonlinear decay (see waveprofiles a–c of Fig. 2). The wave profile evolves with propaga-tion distance to that of a Friedlander wave (curve c of Fig. 2)when the fastest rarefaction wave (which is faster than theshock front) catches the shock front at x = x∗, where theshock front intensity is eroded the least by the rarefactionwaves. Hence, at x = x∗, peak overpressure p∗ has the max-imum value with a Friedlander wave profile. The time for thenonlinear decay to reach p = 0 gives overpressure durationt∗, which has the minimum value at x = x∗. Before the initialcatch-up, x < x∗ (curves a and b of Fig. 2) the blast waveassumes a flat-top shape as rarefaction wave reflected fromthe closed end has not reached yet. The flat-top duration isgiven by the difference in the arrival times of the shock frontand the fastest rarefaction wave. In the range x∗ < x < 0where x = 0 represents the shock tube exit, more and morerarefaction waves catch up the shock front causing decreasingp∗ and increasing t∗ with increasing x . The pressure–time(p–t) profile near (outside) the exit is shown by curve d ofFig. 2; notice that the waveform is changed significantly (lowp∗, low t∗, followed by jet wind).
Studies on evolution of the shock wave at the exit or openend have attracted researchers over the years, due to numer-ous flow phenomena occurring at the exit [20–26]. It is shownin these studies that at the exit of the shock tube, the shockwave evolves from planar to three-dimensional spherical withother effects like vortex formation, secondary shock forma-tion, Mach disc, subsonic jet flow, shock-vortex interactionand impulsive noise. All of the aforementioned effects may ormay not been seen depending on the shock wave strength andgeometry of the exit. Most of these studies, however, havefocused on flow dynamics aspects with no emphasis on qual-itative or quantitative analysis of shock/blast wave profiles(e.g. pressure–time (p–t) profiles). This becomes particu-larly important when one wants to use shock tube to generatedesired dynamic mechanical load both in terms of shape andmagnitude. The present work focuses on the shape and mag-nitude aspect of pressure time profile (referred as pressureprofile/(s) from here on) of blast wave along the length ofthe shock tube, both inside and outside from the exit (openend). Such studies of blast waves are important in the basicunderstanding of shock/blast wave dynamics and in engi-neering applications (e.g. in the study of blast-structure orblast-human interactions) as well.
3 Materials and methods
3.1 Experiments
The shock tube used to generate the blast waves for this studyis located at the University of Nebraska-Lincoln’s blast wave
123

Evolution of blast wave profiles in simulated air blasts 405
Fig. 2 Evolution of shock wavein a generic shock tube
Ove
rpre
ssur
e (M
Pa)
x (m)
ta1
ta2
t1
t2
p1* p2
*
Jet wind
I1
x*
a b c d
Closed end Exit (Open end)
Shock wave propagation direction
Shoc
k fr
ont
0
Membrane
generation facility [27]. The three main components of theshock tube are the driver, transition and driven sections. Thecircle-to-square transition is used to change the cross-sectionof the tube from a circular cylinder (driver section) to a square(driven sections); the square section is a design element toobserve events in the test section (which is part of drivensection) with high-speed video imaging (600,000 frames/s).The length and diameter of the driver section is 295 mm and101 mm, respectively. The transition is composed of 6.35-mm-thick hot rolled steel. It was brake-formed in two piecesand welded together. It has a 5.9◦ taper from the driver to thedriven section. This angle is selected so as to minimize tur-bulence caused by boundary layer separation as the driver isdischarged. The driven section has a cross section of 230 mm× 230 mm and the length of 6225 mm (Fig. 3a).
The unique features of UNL shock tube lies in its abil-ity to produce a range of peak overpressures, durations andimpulses that can all be independently controlled within rea-sonable limits. These are achieved by having variable driverlength, placing the test specimens at many selected locationsalong the driven section (with the ability to capture live vid-eos) and an end plate modifier that can alter the wave pro-files. Further wave tailoring is also achieved using differentdriver gases and burst pressures (by altering the thicknessof the membranes). The working fluid is always air, as thedriven gas stays well within a few diameter of the driver.Though the pressure–time profile in this work emphasizesall positive pressures, experiments with negative pressureshave been obtained by changing gas pressure, transitions andspecimen placements.
In addition to the aforementioned, the generation of shock-blast wave profile is affected by a number of tube parameters;length and diameter of the driver; length and diameter of thedriven; transition section if the driver and driven are of dif-ferent shape or size; type of driver and driven fluids and theirpressures. In order to obtain higher peak overpressures, onecan either increase the burst pressure, or use Helium instead
of Nitrogen or air, heat the driver gas or reduce the pres-sure in the driven section to partial vacuum. Further, whenthe diameter of the driven is increased higher driver volumeof gas at high pressure is required to reach the same peakoverpressure profile. As the driver dimension increases, thelocation of optimal test location changes based on the drivergas, driver pressure and the transition design. As the peakoverpressure decreases and duration increases downstreamof optimal test location, having a longer length leads to lowerpeak overpressure and longer duration; however, if the lengthis too short, then the shock is not fully developed (the rar-efaction wave from the driver has not reached the leadingedge of the shock) the shock assumes a flat-topped waveshape.
In the patented UNL design, pure pressurized nitrogen wasused as the driver gas, and the driven gas was air at ambientlaboratory conditions (temperature range of 23 ± 2 ◦C). Theevolution of the blast wave along the length of the shock tubewas measured using an aluminum cylinder (length = 230 mmand diameter = 41.3 mm). In order to measure the evolutionof blast wave along the length of the shock tube, the cyl-inder was placed along the longitudinal axis of the shocktube at various offset distances from the exit (open end) bothoutside (+x) and inside (−x) (Fig. 3b). Seven holes weredrilled and tapped to locate seven Dytran model 2300V1piezoelectric pressure sensors used in conjunction with Dy-tran model 6502 mounting adapters. The location labeled t0was centered between the two end surfaces of the cylinder,and the rest of the holes were evenly spaced for a total spanof 84 mm (Fig. 3b). The cylinder was mounted (i.e. firmlysecured) using brackets made out of flat steel bar. In addi-tion to the gauges mounted on the cylinder there were setof gauges (PCB pressure sensor model 134A24) mounted atvarious locations on the shock tube (along the length) whichmeasure the incident (side-on) pressures (Fig. 3a). Exper-iment was repeated three times at each location along thelength of the shock tube (N = 3).
123
406 N. Chandra et al.
Fig. 3 a Photographs of230 mm × 230 mm square shocktube used in this work.b Experimental setup tomeasure evolution of the shockwave along the length of theshock tube. Placement of thecylinder at two representativelocations along the length of theshock tube is shown
6225 mm
Exit or open end
Sensor locations for incident (side on) pressure measurement
Exit or open end
c/s 230 mm x 230 mm
Driver section
Driven section
t0
t6
cylinder
Mounting brackets
Exit or open end
+x (103 mm)
-x (3048 mm)
84 m
m
(a)
(b)
3.2 Computational modeling
Finite element (FE) based numerical approach is used todepict the experiments and to simulate the flow inside andoutside of the shock tube. The numerical techniques like finiteelement method (FEM) and computational fluid dynamics(CFD) were effectively used to study flow fields at the exit ofthe shock tube in the past [21–23,28]. The main goal of thenumerical simulation(s) in this work is to understand the flowfield as the blast wave exits the open end of the square shocktube. The effect is seen not only outside but also inside thetube. Simulations are carried with cylinder placed at variouslocations inside and outside of the shock tube. An additionalsimulation is carried out without the cylinder to understandmechanics of the undisturbed flow field.
3.2.1 FE discretization
In our FE modeling, the blast wave propagation and its inter-action with the cylinder are treated as fluid structure interac-tion (FSI) problem. The air inside and outside of the shocktube is modeled as Eulerian elements and the cylinder andmounting bracket are modeled as Lagrangian elements. Eule-rian framework allows for the modeling of highly dynamicevents (e.g. shock) which would otherwise induce heavymesh distortion. The size of the Eulerian domain is 7000× 5000 × 5000 mm3. The size of the Eulerian domain isselected such that the reflections from domain boundariesare negligible during total simulation time of interest. ThisEulerian domain is meshed with 7,016,115 hexahedral ele-ments. Biased meshing is used to reduce the total number of
123

Evolution of blast wave profiles in simulated air blasts 407
Fig. 4 Simulation setup. Cutview in transverse plane
Shock tube
Outside Environment
Exit (open end) of the shock tube
Cylinder
Mounting Bracket
Input: p-t profile from the experiment
7000 mm
5000
mm
: Displacement perpendicular to the face is zero
Shock tube
4000 mm
elements. The cylinder and mounting brackets are meshedto generate 23,948 hexahedral elements. The experimentalpressure boundary condition (i.e. experimentally measuredpressure–time (p–t) profile deep inside the shock tube) isused as an input for the FE simulations. Figure 4 shows thesimulation setup (2D section in transverse plane is shown forsimplicity). The displacement perpendicular to each face ofthe shock tube is kept zero to avoid escaping/leaking of airthrough these faces. This will maintain a planar shock fronttraveling in the longitudinal direction with no lateral flow. Inaddition, displacement perpendicular to the external bound-aries of Eulerian domain is also kept zero to avoid escap-ing/leaking of air through these faces. The tied constraintis used between open end of the shock tube and mountingbrackets and cylinder and mounting brackets.
3.2.2 Material models
Air is modeled as an ideal gas equation of state (EOS). TheMach number of the shock front from our experiments isapproximately 1.5; hence the ideal gas EOS assumption isacceptable, as the ratio of specific heats do not change dras-tically at this Mach number. Cylinder and mounting bracketsare modeled as linear, elastic, isotropic solids.
3.2.3 Solution scheme
The finite element model is solved using nonlinear transientdynamic procedure with Euler–Lagrangian coupling method
(Abaqus�). In this procedure, the governing partial differen-tial equations for the conservation of momentum, mass andenergy along with the material constitutive equations and theequations defining the initial and the boundary conditionsare solved simultaneously. An enhanced immersed boundarymethod is used to provide the coupling between the Eulerianand the Lagrangian domains. Here, the Lagrangian regionresides fully or partially within the Eulerian region and pro-vides no-flow boundary conditions to the fluid in the direc-tion normal to the local surface. Further, the Eulerian regionprovides the pressure boundary conditions to the Lagrang-ian region. Thus, a combination of fixed Eulerian meshand solid–fluid interface modeling through the enhancedimmersed boundary method allows for the concurrent simu-lations of the formation and propagation of a primary blastwave in a fluid medium and accounts for the aerodynamiceffects once the blast wave encounters a solid. A typical sim-ulation required about 2 h of CPU time, run on a dedicated 64Opteron parallel processors (processor speed 2.2 GHz, 2 GBmemory per processor) for an integration time of 20 ms.
4 Results and discussion
All experimental results presented in this work are for sen-sor t0, 0◦ orientation (unless stated otherwise) and are basedon average over three shots (N = 3) for each placementlocation. The experimental conditions were selected so thatthe pressure–time profiles remain positive (all compressive).
123

408 N. Chandra et al.
Fig. 5 a Experimentallymeasured p–t profiles at variousx locations inside the shocktube. p–t profiles followFriedlander waveform fairlywell. b Experimentallymeasured p–t profiles at variousx locations outside the shocktube. In these profiles the trendsdo not follow Friedlanderwaveform and peak overpressuredrastically reduces as we moveaway from the exit. The startingpoints of subsonic jet wind aredemarcated by cross symbols
However, the shock tube is capable of producing negativepressure by selecting shorter driver length and locating spec-imens close to the driver; the negative pressure effect canbe a factor in BTBI and will be studied in the future. Inthe current experiments, each shot is well controlled and theexperimental measurements are repeatable with only slightvariation (<5 %) in peak-to-peak variation in blast overpres-sures. Arrival of a shock wave at sensor t0 is set as t = 0 foreach placement location.
4.1 Pressure and impulse profiles along the lengthof the shock tube
Figure 5a, b, respectively, shows the reflected pressure pro-files for cylinder placement locations inside and outside
of the shock tube. The reflected pressure measures totalpressure (both kinetic and potential energy components)at a given point. The reflected pressure profiles for place-ment locations inside the shock tube show the gradualdecay in pressure and pressure profiles follow the Fried-lander waveform. Small secondary peak in pressure pro-files is due to reflection from walls of the shock tube;however, these wall reflections do not significantly affectpressure profiles. The reflected pressure profiles for place-ment locations outside the shock tube show rapid pressuredecay. Pressure profiles do not conform to the Friedlanderwaveform; shock front and pressure decay rather look likedelta function. This is followed by long duration, rela-tively constant low-pressure regime (starting points of whichare demarcated by cross symbols). This long duration,
123

Evolution of blast wave profiles in simulated air blasts 409
0.000
0.050
0.100
0.150
0.200
0.250
0.300
0.350
0.400
0 1 2 3 4 5 6 7 8 9
Impu
lse
(MP
a-m
s)
Time (ms)
-3048
-566
-312
-58
0.000
0.050
0.100
0.150
0.200
0.250
0.300
0.350
0.400
0 1 2 3 4 5 6 7 8 9
Impu
lse
(MP
a-m
s)
Time (ms)
26 103 229 391596
(a)
(b)
Fig. 6 a Impulse profiles at various x locations inside the shock tubeobtained by integration of experimentally measured p–t profiles. bImpulse profiles at various x locations outside the shock tube obtainedby integration of experimentally measured p–t profiles. Contributionof the subsonic jet wind to the impulse is demarcated by cross symbols
relatively constant low-pressure regime is referred as sub-sonic jet wind in this work. This jet wind is an artifact of theshock tube exit effect and does not occur in free-field blastconditions.
Figure 6a, b, respectively, shows the impulse profiles forcylinder placement locations inside and outside of the shocktube. The total impulse is reduced significantly for outsideplacement locations when compared with inside placementlocations. The shape of impulse profiles for placement loca-tions inside the shock tube is relatively constant (i.e. gradualincrease) as opposed to non-gradual (i.e. with slope changes)for outside placement locations. The contribution of subsonicjet wind to the impulse is high (starting points of which aredemarcated with cross symbols in Fig. 5b).
Figure 7 shows the incident (or side-on) pressure pro-files for locations inside the shock tube. These locations aresimilar to the one presented in Fig. 5a, the only differencebeing the cylinder was not present during these measure-ments. The incident pressure measures only potential energycomponent and does not take into account kinetic energypart; thus peak incident pressures will always be lower thanpeak reflected pressures. The incident (Fig. 7) and reflected
Fig. 7 Experimentally measured incident (side-on) p–t profiles at var-ious x locations inside the shock tube. Note the slope change for loca-tions near the exit due to rarefaction wave
(Fig. 5a) pressure profiles for these locations are similarqualitatively, except that there is change in slope (duringnonlinear decay) in incident pressure profiles of Fig. 7 forlocations close to the exit. This change in slope is due tothe rarefaction wave from the exit (open end) of the tubemoving into the tube. The reflected pressure profiles do notshow the change in slope because the cylinder measurementsare carried out with sensors facing the blast and dynamiceffects produced by dimensions of the cylinder that mightblock the rarefaction wave reaching the blast-facing sen-sors. Due to these effects sensors facing the blast do notrecord rarefaction wave. If we rotate the cylinder by 180◦ inthe experiments (wherein the sensors will face the rarefac-tion wave), then sensors will record the rarefaction wave.Numerical simulations have confirmed these observations(results not shown for brevity). Thus while conducting test-ing just inside the shock tube (from open end) one needsto be aware of this rarefaction wave from the exit (openend) moving back into the tube as it may change the loadinghistory.
4.2 Planarity of the blast wave
Figure 8 shows normalized arrival times for sensors t0through t6 for cylinder placement locations outside the shocktube. Arrival times are normalized with respect to sensort0. Difference in arrival time indicates non-planarity of theblast wave. It can be seen that, upon exiting the shock tubeblast wave is planar till distance (offset) of 75 mm, after thisdistance blast wave becomes progressively non-planar untilpeaking at an offset of 307 mm. After the offset of 307 mmthe non-planarity starts to decrease and eventually at far-ther distances it will become planar again but at the costof decreased pressures (Fig. 5b). A number of tests to checkplanarity inside the shock tube were also conducted (detailednot shown here); they all show that planarity is maintainedwithin the tube [29].
123

410 N. Chandra et al.
0.000
2.000
4.000
6.000
8.000
10.000
12.000
14.000
16.000
18.000
20.000
0 100 200 300 400 500 600 700
Nor
mal
ized
tim
e t-
t0 (
mic
rose
c)
x (mm)
t0t1t2t3t4t5t6
Fig. 8 Normalized arrival times of the blast wave for sensors t0 throught6 as a function of distance from the exit of the shock tube
Planarity is an important feature of the open-field blastwaves in the intermediate- to far-field range for BINT stud-ies; as the sizes of wave front are much larger than that ofa human body (i.e. larger radius of curvature with respectto human body). The interactions of such a blast wave witha human body are influenced strongly by the confinement ofan effectively edgeless wave front. This characteristic mustbe recreated in a testing to realistically simulate free-fieldblast loading. As a spherical wave, the strain associated withthe blast wave is actually triaxial. The circumferential straincomponent is given by d/r with d being the particle dis-placement and r being distance from source of explosion,thus decreasing with increasing r . For a blast wave with ashock front speed up to Mach 2 (twice the sound speed =686 m/s) at an ambient temperature of 20 ◦C, the particlevelocity jump across the shock front is less than 429 m/s,the associated d less than 0.5 mm and the associated circum-ferential strain component less than 10−4 for r beyond 5 m.Compared with 37.5 % specific volume reduction (98 % truecompressive volume strain) across the front of a Mach 2 airshock wave, the circumferential strain component (<10−4)is negligible. Therefore, a blast wave in the intermediate tofar range can be well approximated with a (uniaxial-strain)planar Friedlander wave.
Planarity of the shock-blast wave will be affected by thevery presence of test specimens due to flow obstructions. Inorder to maintain acceptable levels, the ratio of the projectedarea of the specimen to that of the shock tube cross-sectionalarea should be maintained below a critical level. It was foundthat when the specimen occupies less than 50 % of the areainside the shock tube, the shock wave structure and the mea-sured pressure profiles on the surface of the specimen arerelatively unaffected. Further, the pressure differential acrossthe specimen (anterior-posterior direction) is minimal as theshock wave quickly engulfs the specimen, as measured by thenegligible rigid body acceleration of specimen (e.g. anthro-pometric dummy head) [10].
-0.050
0.000
0.050
0.100
0.150
0.200
0.250
0.300
0 1 2 3 4 5 6 7 8 9
Pre
ssur
e (
MP
a)
Time (ms)
0 degree45 degree90 degree
-3048
0 degree
45 degree90 degree
Open end
-0.050
0.000
0.050
0.100
0.150
0.200
0 1 2 3 4 5 6 7 8 9
Pre
ssur
e (M
Pa)
Time (ms)
0 degree45 degree90 degree
0 degree
45 degree
+103
90 degreeOpen end
(a)
(b)
Fig. 9 a Experimental p–t profile at various orientations for cylinderplacement location of 3048 mm inside the shock tube (x = −3048 mm).b Experimental p–t profile at various orientations for cylinder place-ment location of 103 mm outside the shock tube (x = 103 mm)
4.3 Pressure profiles at various orientations
Figure 9a shows the pressure profiles for three orientations(0◦, 45◦ and 90◦) for cylinder placement location of 3048 mminside the shock tube. The 0◦ and 45◦ orientation shows grad-ual pressure decay, but the 90◦ orientation shows flow separa-tion from the cylinder causing a negative pressure phase. Thisnegative phase cannot be sustained and the pressure profileoscillates twice before semi-equilibrating around the otherprofiles. The 0◦ orientation experiences the highest pressurebecause of the kinetic energy contribution from the reflectedpressure. Figure 9b shows the pressure profiles for three ori-entations (0◦, 45◦ and 90◦) for cylinder placement location of103 mm outside the shock tube. All three orientations showa rapid pressure drop after the peak pressure. As mentionedearlier, 0◦ orientation experiences subsonic jet flow after therapid pressure decay. For the 45◦ orientation pressure drops tozero with a slight vacuum. The 90◦ orientation exhibits flowseparation and oscillation, but the pressure mainly remainsnegative (i.e. negative phase is sustained) due to the lack ofshock tube lateral constraints.
For the IED explosions in the intermediate- to far-fieldrange, positive phase durations are much larger than blast
123
Evolution of blast wave profiles in simulated air blasts 411
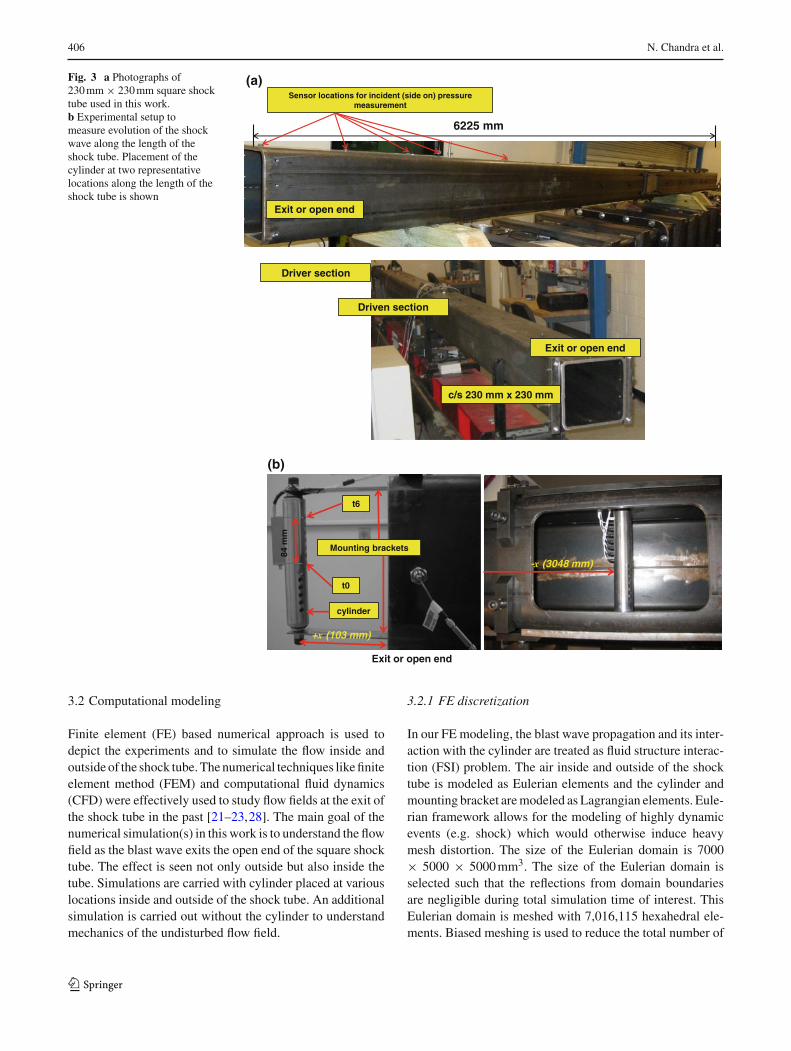
Fig. 10 Comparison of pressure time history from experiments and simulations for sensor t0 for various cylinder placement locations inside andoutside of shock tube: a x = −566 mm; b x = 26 mm; c x = 103; d x = 229
wave traversal time across human head. Thus pressures on thehead become relatively uniform as the blast wave traversesthe head [30]. Orientation results at 90◦ outside the shocktube mainly contain tensile loading (negative pressures); thisimplies that while the front (of the cylinder) is under com-pression (pushed) the side (of the cylinder) is under tension(i.e. pulled out); this loading pattern is uncharacteristic ofIED blasts in the intermediate- to far-field range.
4.4 Comparison of experiments and numerical simulations
Figure 10 shows the pressure–time (p–t) profiles from theshock tube experiments and numerical simulations for sen-sor t0 for cylinder placement locations inside (566 mm) andoutside (26, 103 and 229 mm) of the shock tube. These dis-tances (inside and outside) correspond to possible placementsof specimens in experiments; further, these data are also usedto analyze for trends and to compare with numerical results.The inside locations correspond to distances, where side-onpressure sensors were already mounted. There is good agree-
ment between the experiments and numerical simulations interms of peak overpressures, nonlinear decay and positivephase durations which is also evident from Table 1. In gen-eral, pressure decay from experiments is faster than that ofsimulations. The simulations are able to capture majority ofthe features well, including the shock front rise time, second-ary reflections and subsonic jet wind. The arrival of shockwave at sensor t0 from both experiments and simulations isset to zero for ease of comparison of different features of thepressure–time (p–t) profile. There is a slight difference inarrival times between the experiments and the simulations ofthe order of 0.3 ms, at most. Difference in arrival time indi-cates difference in shock wave speed and does not changethe pressure and impulse experienced by the cylinder. Thedifference in arrival time between experiments and simula-tions can be attributed to the ideal gas equation of state mod-eling assumption, membrane rupture pattern, friction alongthe inner wall of the shock tube and misinterpretation of thevibrations of the shock tube itself as pressure readings bythe pressure sensors [28]. The structural design at UNL is
123
412 N. Chandra et al.
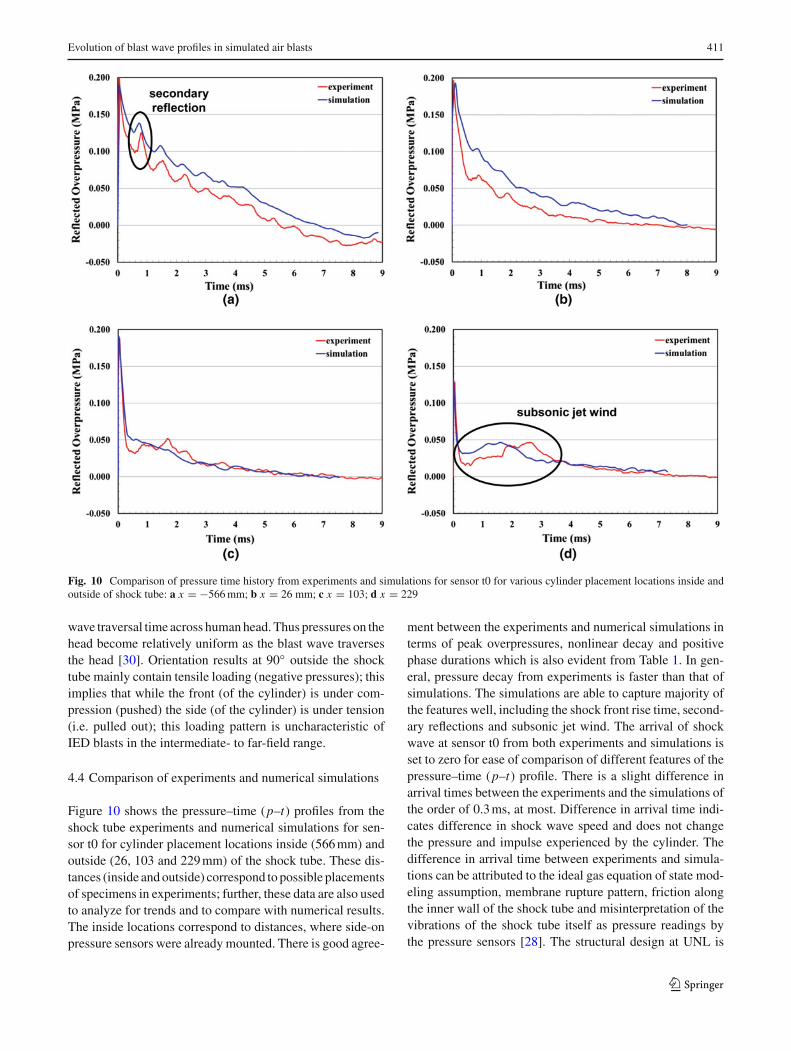
Table 1 Comparison of peakoverpressures and positive phasedurations from experiments andsimulations
Cylinder placementlocation (mm)
Peak overpressure (MPa) Positive phase duration (ms)
Experiment Simulation % Difference Experiment Simulation % Difference
x = −566 0.201 0.189 6.09 5.45 6.75 23.85
x = 26 0.198 0.192 3.03 6.06 7.7 27.06
x = 103 0.188 0.186 0.88 6.67 6.81 2.10
x = 229 0.128 0.133 3.77 – − −
made extra stiff by the use of 0.5 in steel plates and rein-forcing the structure with stiffeners every 18 inches to avoidvibrations. Zhu et al. [31] also found similar differences inarrival times from their experiments and numerical simula-tions due to the reasons stated above. The similar agreementin pressure–time (p–t) profiles is observed at other cylinderplacement locations and for all other sensors (not shown forbrevity).
4.5 Flow field at the exit of the shock tube
Flow field at the exit of the shock tube is studied usingnumerical simulations. No cylinder case is used to study/dem-onstrate the flow field at the exit that is free from any arti-facts created by the cylinder. Figure 11 shows the pressureand velocity (vector) fields at the exit of the shock tube(no cylinder case). As the blast wave exits the shock tube,the flow changes from planar to three-dimensional spherical(Fig. 11a). Rarefaction wave and vorticities at the cornersmix with blast and remaining air ejects as subsonic jet wind,which is evident from velocity vector field of Fig. 11b. Thisjet wind effect is not present deep inside tube. Further, toclearly demonstrate this, Fig. 12 shows the nodal velocitiesat various locations inside and outside the shock tube. Sincefixed Eulerian mesh is used for modeling, velocity at a givenmesh node corresponds to the instantaneous velocity of thematerial point coincident at given time ‘t’ with the considerednode. High-velocity jet wind is recorded in nodal history forlocations outside the shock tube. Particle velocity associatedwith this jet is higher than particle velocity associated withthe shock (Fig. 12b). Locations inside the shock tube that areclose to the exit also show second peak in velocity due torarefaction wave moving into the tube, but magnitude of thissecond peak is lower than particle velocity associated withthe jet for outside locations. In addition, magnitude of thissecond peak gradually reduces as we move inside the shocktube away from the exit (open end). Deep inside the shocktube (x = −3048 mm) second peak is completely absent.
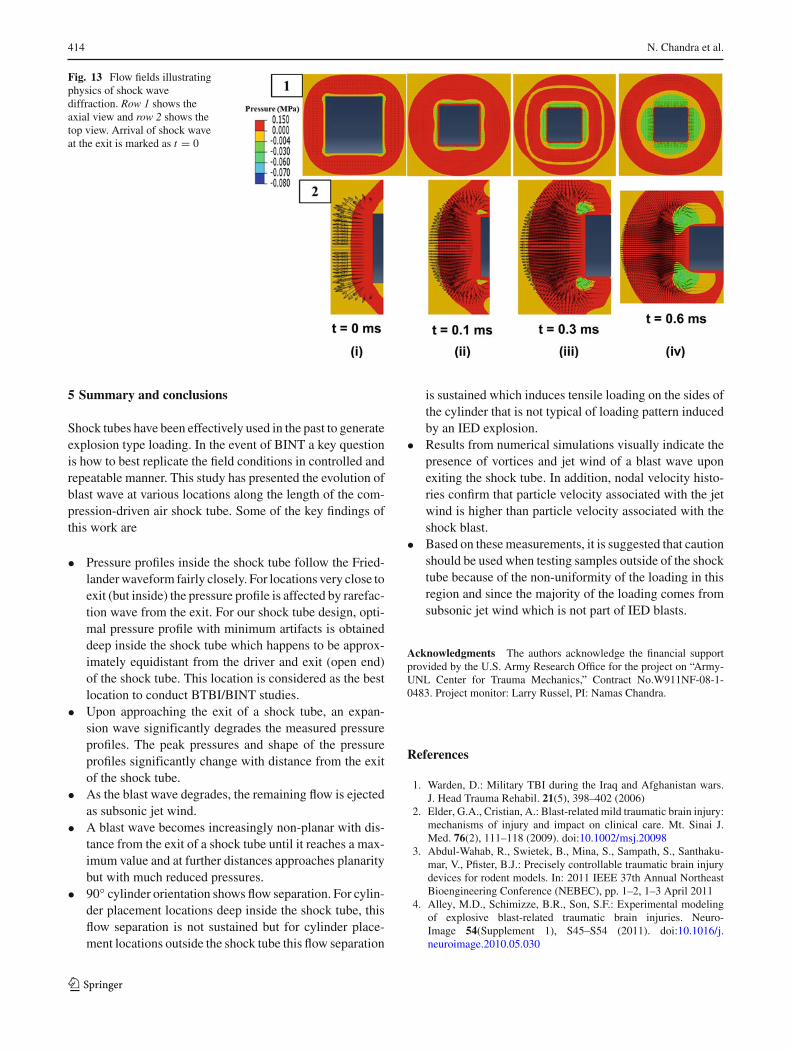
To clearly exhibit transition of blast wave from planar tothree-dimensional spherical, Fig. 13 shows the pressure dis-tribution at the exit of the shock tube for sequence of times.The black arrows indicate the (velocity) vector field. In eachfigure outer red contour indicates the primary shock wave
and inner green portion indicates primary vortex loop. Theprimary shock wave at first appears to be square shaped withrounded corners as shown in Fig. 13i. These corners becomesignificantly rounded and straight parts at the shock tubewalls are shortened (Fig. 13ii, iii, iv). This indicates that theprimary shock wave is planar at the exit (open end) of theshock tube and evolves three-dimensionally into sphericalone as time elapses. This process is called as shock wave dif-fraction that affects the flow expansion behind it [23]. Similararguments can be used to show the three-dimensional natureof primary vortex loop which is evident from green color ofFig. 13.
4.6 Flow field evolution for other conditions
The current experiments and simulations were carried out fora long square shock tube with Nitrogen as the driver gas andair as the driven (working) fluid. The evolution of flow fieldnear the exit from planar to three-dimensional, decreasingpeak overpressure, conversion from static to kinetic energyand the presence of jet winds are all governed by the phys-ics of the problem. Though this paper addresses a tube withsquare section, similar flow structure will occur for circulardriven tubes, though the structure will be radially symmet-ric. For larger squares (e.g. 711 mm by 711 mm), the sametrends as reported here are observed in computational mod-els.
This study focused on the use of Nitrogen as a driver gas.If Helium is used as the driver gas for the same burst pres-sure, the shocked air will experience a higher over pressurecompared with when Nitrogen is used as the gas. This occurssince the acoustic velocity of the Helium is 965 m/s comparedwith that of Nitrogen at 334 m/s. However, the overpressureduration in Helium-driven air will be lower than that of nitro-gen due to the fact the molecular weight of He is 0.004 kg/molcompared with nitrogen at 0.028 kg/mol. Thus the flow fieldoutside will experience a sharper fall-off in pressure in He-driven cases. In summary, when He is used as the driver gasthe physics of the flow field still remains the same except themagnitude and duration will be different.
The effect of driver gas (e.g. compression-driven, explo-sion, combustible fluid) may alter the flow dynamics bothinside and outside of the shock tube. This paper addresses
123

Evolution of blast wave profiles in simulated air blasts 413
Fig. 11 a Pressure field nearthe exit of the shock tube.Three-dimensional expansion ofshock wave along with vortexformation is seen at the exit.b Velocity vector field near theexit of the shock tube. Jet windis clearly visible in velocityvector field. Representativevector field is shown; jet is alsoobserved at other locations closeto the exit at earlier times
x
y
z
Initial Shock Wave
Reflected Shock Wave
Vortex Ring
Vortex Ring
Pressure (MPa)
Initial Shock Wave
Jet Wind Shock Tube
Exit/ Open End
(a)
(b)
Fig. 12 Nodal velocities at various locations inside and outside the shock tube. Since fixed Eulerian mesh is used for modeling, velocity at a givenmesh node corresponds to the instantaneous velocity of the material point coincident at given time ‘t’ with the considered node
the issues related to the most-often used compression-drivenair shock tubes. The jet wind at the exit develops due to theconversion of potential to kinetic energy in the vicinity of
shock exit due to tensile rarefaction wave; how and if thisconversion occurs in non-compression-driven shock tubesrequires a separate study.
123
414 N. Chandra et al.
Fig. 13 Flow fields illustratingphysics of shock wavediffraction. Row 1 shows theaxial view and row 2 shows thetop view. Arrival of shock waveat the exit is marked as t = 0
5 Summary and conclusions
Shock tubes have been effectively used in the past to generateexplosion type loading. In the event of BINT a key questionis how to best replicate the field conditions in controlled andrepeatable manner. This study has presented the evolution ofblast wave at various locations along the length of the com-pression-driven air shock tube. Some of the key findings ofthis work are
• Pressure profiles inside the shock tube follow the Fried-lander waveform fairly closely. For locations very close toexit (but inside) the pressure profile is affected by rarefac-tion wave from the exit. For our shock tube design, opti-mal pressure profile with minimum artifacts is obtaineddeep inside the shock tube which happens to be approx-imately equidistant from the driver and exit (open end)of the shock tube. This location is considered as the bestlocation to conduct BTBI/BINT studies.
• Upon approaching the exit of a shock tube, an expan-sion wave significantly degrades the measured pressureprofiles. The peak pressures and shape of the pressureprofiles significantly change with distance from the exitof the shock tube.
• As the blast wave degrades, the remaining flow is ejectedas subsonic jet wind.
• A blast wave becomes increasingly non-planar with dis-tance from the exit of a shock tube until it reaches a max-imum value and at further distances approaches planaritybut with much reduced pressures.
• 90◦ cylinder orientation shows flow separation. For cylin-der placement locations deep inside the shock tube, thisflow separation is not sustained but for cylinder place-ment locations outside the shock tube this flow separation
is sustained which induces tensile loading on the sides ofthe cylinder that is not typical of loading pattern inducedby an IED explosion.
• Results from numerical simulations visually indicate thepresence of vortices and jet wind of a blast wave uponexiting the shock tube. In addition, nodal velocity histo-ries confirm that particle velocity associated with the jetwind is higher than particle velocity associated with theshock blast.
• Based on these measurements, it is suggested that cautionshould be used when testing samples outside of the shocktube because of the non-uniformity of the loading in thisregion and since the majority of the loading comes fromsubsonic jet wind which is not part of IED blasts.
Acknowledgments The authors acknowledge the financial supportprovided by the U.S. Army Research Office for the project on “Army-UNL Center for Trauma Mechanics,” Contract No.W911NF-08-1-0483. Project monitor: Larry Russel, PI: Namas Chandra.
References
1. Warden, D.: Military TBI during the Iraq and Afghanistan wars.J. Head Trauma Rehabil. 21(5), 398–402 (2006)
2. Elder, G.A., Cristian, A.: Blast-related mild traumatic brain injury:mechanisms of injury and impact on clinical care. Mt. Sinai J.Med. 76(2), 111–118 (2009). doi:10.1002/msj.20098
3. Abdul-Wahab, R., Swietek, B., Mina, S., Sampath, S., Santhaku-mar, V., Pfister, B.J.: Precisely controllable traumatic brain injurydevices for rodent models. In: 2011 IEEE 37th Annual NortheastBioengineering Conference (NEBEC), pp. 1–2, 1–3 April 2011
4. Alley, M.D., Schimizze, B.R., Son, S.F.: Experimental modelingof explosive blast-related traumatic brain injuries. Neuro-Image 54(Supplement 1), S45–S54 (2011). doi:10.1016/j.neuroimage.2010.05.030
123

Evolution of blast wave profiles in simulated air blasts 415
5. Bolander, R., Mathie, B., Bir, C., Ritzel, D., VandeVord, P.: Skullflexure as a contributing factor in the mechanism of injury in therat when exposed to a shock wave. Ann. Biomed. Eng. 1(10),1–10 (2011). doi:10.1007/s10439-011-0343-0
6. Cernak, I., Wang, Z., Jiang, J., Bian, X., Savic, J.: Cognitive deficitsfollowing blast injury-induced neurotrauma: possible involvementof nitric oxide. Brain Injury 15(7), 593–612 (2001)
7. Chavko, M., Koller, W.A., Prusaczyk, W.K., McCarron, R.M.:Measurement of blast wave by a miniature fiber optic pressuretransducer in the rat brain. J. Neurosci. Methods 159(2), 277–281 (2007). doi:10.1016/j.jneumeth.2006.07.018
8. Cheng, J., Gu, J., Ma, Y., Yang, T., Kuang, Y., Li, B., Kang,J.: Development of a rat model for studying blast-induced trau-matic brain injury. J. Neurol. Sci. 294(1–2), 23–28 (2010). doi:10.1016/j.jns.2010.04.010
9. Desmoulin, G.T., Dionne, J.P.: Blast-induced neuro-trauma: surrogate use, loading mechanisms, and cellu-lar responses. J. Trauma 67(5), 1113–1122. doi:1110.1097/TA.1110b1013e3181bb1118e1184 (2009)
10. Ganpule, S., Gu, L., Alai, A., Chandra, N.: Role of helmet in themechanics of shock wave propagation under blast loading con-ditions. Comput. Methods Biomech. Biomed. Eng. 1–12 (2011).doi:10.1080/10255842.2011.597353
11. Long, J.B., Bentley, T.L., Wessner, K.A., Cerone, C., Sweeney, S.,Bauman, R.A.: Blast overpressure in rats: recreating a battlefieldinjury in the laboratory. J Neurotrauma 26(6), 827–840 (2009).doi:10.1089/neu.2008.0748
12. Rafaels, K.: Blast brain injury risk. PhD dissertation, University ofVirginia (2010)
13. Saljo, A., Bolouri, H., Mayorga, M., Svensson, B., Hamberger,A.: Low-level blast raises intracranial pressure and impairs cog-nitive function in rats: prophylaxis with processed cereal feed. JNeurotrauma 27(2), 383–389 (2010). doi:10.1089/neu.2009.1053
14. Säljö, A., Mayorga, M., Bolouri, H., Svensson, B., Hamberger,A.: Mechanisms and pathophysiology of the low-level blast braininjury in animal models. NeuroImage 54(Supplement 1), S83–S88 (2011). doi:10.1016/j.neuroimage.2010.05.050
15. Rafaels, K.A., Shridharani, J., Bass, C.R., Salzar, R.S., Walilko,T.J., Panzer, M.B.: Blast wave attenuation: ballistic protective hel-mets and the head. Paper presented at the Personal Armor SafetySymposium (PASS), Washington, DC (2010)
16. Duff, R.E., Blackwell, A.N.: Explosive driven shock tubes. Rev SciInstrum 37(5), 579–586 (1966)
17. Courtney, A.C., Andrusiv, L.P., Courtney, M.W.: Oxy-acetylenedriven laboratory scale shock tubes for studying blast wave effects.Rev. Sci. Instrum. 83(4) (2012). doi:10.1063/1.3702803
18. Bleakney, W., Taub, A.H.: Interaction of shock waves. Rev. Mod.Phys. 21(4), 584–605 (1949)
19. Baker, W.E.: Explosions in air. University of Texas Press,Texas (1973)
20. Arakeri, J.H., Das, D., Krothapalli, A., Lourenco, L.: Vortex ringformation at the open end of a shock tube: a particle image veloc-imetry study. Phys. Fluids 16(4), 1008–1019 (2004). doi:10.1063/1.1649339
21. Honma, H., Ishihara, M., Yoshimura, T., Maeno, K., Morioka, T.:Interferometric CT measurement of three-dimensional flow phe-nomena on shock waves and vortices discharged from openends. Shock Waves 13(3), 179–190 (2003). doi:10.1007/s00493-003-0206-1
22. Jiang, Z., Onodera, O., Takayama, K.: Evolution of shock wavesand the primary vortex loop discharged from a square cross-sectional tube. Shock Waves 9(1), 1–10 (1999). doi:10.1007/s001930050133
23. Jiang, Z., Wang, C., Miura, Y., Takayama, K.: Three-dimensionalpropagation of the transmitted shock wave in a square cross-sec-tional chamber. Shock Waves 13(2), 103–111 (2003). doi:10.1007/s00193-003-0197-y
24. Kashimura, H., Yasunobu, T., Nakayama, H., Setoguchi, T.,Matsuo, K.: Discharge of a shock wave from an open end of atube. J. Therm. Sci. 9(1), 30–36 (2000). doi:10.1007/s11630-000-0042-x
25. Onodera, O., Jiang, Z.L., Takayama, K.: Holographic interfero-metric observation of shock waves discharged from an open-endof a square cross-sectional shock tube. JSME Int. J. Ser. B: FluidsTherm. Eng. 41(2), 408–415 (1998)
26. Setoguchi, T., Matsuo, K., Hidaka, F., Kaneko, K.: Impulsive noiseinduced by a weak shock wave discharged from an open end of atube: acoustic characteristics and its passive control. In: Proceed-ings of the 1993 ASME Winter Meeting, November 28–Decem-ber 3, 1993, New Orleans, LA, USA, 1993. American Society ofMechanical Engineers, Fluids Engineering Division (Publication)FED, pp. 57–64. ASME
27. Chandra, N., Holmberg, A., Feng, R.: Controlling the shape ofthe shock wave profile in a blast facility. U.S. Provisional patentapplication no. 61542354 (2011)
28. Jiang, Z., Takayama, K., Skews, B.W.: Numerical study on blastflowfields induced by supersonic projectiles discharged from shocktubes. Phys. Fluids 10(1), 277–288 (1998). doi:10.1063/1.869566
29. Kleinschmit, N.N.: A Shock Tube Technique for Blast WaveSimulation and Studies of Flow Structure Interactions inShock Tube Blast Experiments. University of Nebraska-Lincoln,Lincoln (2011)
30. Moss, W.C., King, M.J., Blackman, E.G.: Distinguishing real-istic military blasts from firecrackers in mitigation studies ofblast-induced traumatic brain injury. Proc. Natl. Acad. Sci. USA108(17), E82–E82 (2011). doi:10.1073/pnas.1101671108
31. Zhu, F., Wagner, C., Dal Cengio Leonardi, A., Jin, X., VandeVord, P., Chou, C., Yang, K., King, A.: Using a gel/plasticsurrogate to study the biomechanical response of the head under airshock loading: a combined experimental and numerical investiga-tion. Biomech. Model. Mechanobiol. 1–13. doi:10.1007/s10237-011-0314-2
123