Embed Size (px)
Citation preview

Evidence summary
to support
PICO question 15 on
PBM implementation:
effectiveness “comprehensive” PBM
programs
April 2018 (version 2.0)
Centre for Evidence-Based Practice (CEBaP)
Belgian Red Cross

2
Content
Flow chart ........................................................................................................................................................ 3
Overview of 20 included studies1-20 ....................................................................................................... 4
Overview of excluded studies21-37 ........................................................................................................... 6
Overview table included studies and intervention components/targeted
physicians/category/follow-up period .................................................................................................. 8
Overview evidence table GRADE software .......................................................................................... 9
GRADE domain: resource costs ............................................................................................................ 17
Detailed evidence summary................................................................................................................... 19

3
Flow chart
Scre
en
ing
Incl
ud
ed
El
igib
ility
Id
en
tifi
cati
on
Records (after removing duplicates) identified through database searching
(Pubmed, Embase, Cochrane Library, Transfusion Evidence Library)
(n = 968)
Records screened on title and
abstract
(n = 968)
Full-text articles assessed for eligibility
(n = 34)
Studies finally included
(n = 20 observational studies)
Records excluded
(n = 648)
Records excluded (n = 14) Reason for exclusion
+ Desgin (n=5)
+ Intervention (n=8)
+ Language (n=1)

4
Overview of 20 included studies1-20
1. Frank SM, Thakkar RN, Podlasek SJ, et al. Implementing a Health System-wide Patient Blood
Management Program with a Clinical Community Approach. Anesthesiology 2017;127:754-64.
2. Frew N, Alexander D, Hood J, et al. Impact of a blood management protocol on transfusion rates
and outcomes following total hip and knee arthroplasty. Ann R Coll Surg Engl 2016;98:380-6.
3. Gani F, Cerullo M, Ejaz A, et al. Implementation of a Blood Management Program at a Tertiary
Care Hospital: Effect on Transfusion Practices and Clinical Outcomes Among Patients Undergoing
Surgery. Ann Surg 2017.
4. Gross I, Seifert B, Hofmann A, et al. Patient blood management in cardiac surgery results in fewer
transfusions and better outcome. Transfusion 2015;55:1075-81.
5. Gross I, Trentino KM, Andreescu A, et al. Impact of a Patient Blood Management Program and an
Outpatient Anemia Management Protocol on Red Cell Transfusions in Oncology Inpatients and
Outpatients. Oncologist 2016;21:327-32.
6. Kansagra A, Andrzejewski C, Krushell R, et al. Blood Management Strategies to Reduce
Transfusions After Elective Lower-Extremity Joint Arthroplasty Surgeries: One Tertiary Care
Hospital's Early Experience With an Alternative Payment Model-a Total Joint "Bundle". Am J Med
Qual 2017;32:668-74.
7. Kopanidis P, Hardidge A, McNicol L, et al. Perioperative blood management programme reduces
the use of allogenic blood transfusion in patients undergoing total hip and knee arthroplasty. J
Orthop Surg Res 2016;11:28.
8. Leahy MF, Hofmann A, Towler S, et al. Improved outcomes and reduced costs associated with a
health-system-wide patient blood management program: a retrospective observational study in
four major adult tertiary-care hospitals. Transfusion 2017;57:1347-58.
9. Leahy MF, Roberts H, Mukhtar SA, et al. A pragmatic approach to embedding patient blood
management in a tertiary hospital. Transfusion 2014;54:1133-45.
10. Leahy MF, Trentino KM, May C, et al. Blood use in patients receiving intensive chemotherapy for
acute leukemia or hematopoietic stem cell transplantation: the impact of a health system-wide
patient blood management program. Transfusion 2017;57:2189-96.
11. Loftus TJ, Spratling L, Stone BA, et al. A Patient Blood Management Program in Prosthetic Joint
Arthroplasty Decreases Blood Use and Improves Outcomes. J Arthroplasty 2016;31:11-4.
12. Mehra T, Seifert B, Bravo-Reiter S, et al. Implementation of a patient blood management
monitoring and feedback program significantly reduces transfusions and costs. Transfusion
2015;55:2807-15.
13. Meybohm P, Herrmann E, Steinbicker AU, et al. Patient Blood Management is Associated With a
Substantial Reduction of Red Blood Cell Utilization and Safe for Patient's Outcome: A
Prospective, Multicenter Cohort Study With a Noninferiority Design. Ann Surg 2016;264:203-11.

5
14. Rineau E, Chaudet A, Chassier C, et al. Implementing a blood management protocol during the
entire perioperative period allows a reduction in transfusion rate in major orthopedic surgery: a
before-after study. Transfusion 2016;56:673-81.
15. Ternstrom L, Hyllner M, Backlund E, et al. A structured blood conservation programme reduces
transfusions and costs in cardiac surgery. Interact Cardiovasc Thorac Surg 2014;19:788-94.
16. Thakkar RN, Lee KH, Ness PM, et al. Relative impact of a patient blood management program on
utilization of all three major blood components. Transfusion 2016;56:2212-20.
17. Theusinger OM, Kind SL, Seifert B, et al. Patient blood management in orthopaedic surgery: a
four-year follow-up of transfusion requirements and blood loss from 2008 to 2011 at the Balgrist
University Hospital in Zurich, Switzerland. Blood Transfus 2014;12:195-203.
18. Verdecchia NM, Wisniewski MK, Waters JH, et al. Changes in blood product utilization in a seven-
hospital system after the implementation of a patient blood management program: A 9-year
follow-up. Hematology 2016;21:490-9.
19. Xydas S, Magovern CJ, Slater JP, et al. Implementation of a comprehensive blood conservation
program can reduce blood use in a community cardiac surgery program. J Thorac Cardiovasc
Surg 2012;143:926-35.
20. Yaffee DW, Smith DE, 3rd, Ursomanno PA, et al. Management of blood transfusion in aortic valve
surgery: impact of a blood conservation strategy. Ann Thorac Surg 2014;97:95-101.

6
Overview of excluded studies21-37
Butler 2015 (reason for exclusion: focused on transfusion strategies (1 PBM pillar only))
21. Butler CE, Noel S, Hibbs SP, et al. Implementation of a clinical decision support system improves
compliance with restrictive transfusion policies in hematology patients. Transfusion
2015;55:1964-71.
Cohn 2014 (reason for exclusion: inappropriate study design)
22. Cohn CS, Welbig J, Bowman R, et al. A data-driven approach to patient blood management.
Transfusion 2014;54:316-22.
Collins 2014 (reason for exclusion: focused on transfusion strategies (1 PBM pillar only))
23. Collins RA, Triulzi DJ, Waters JH, et al. Evaluation of real-time clinical decision support systems for
platelet and cryoprecipitate orders. Am J Clin Pathol 2014;141:78-84.
Corwin 2014 (reason for exclusion: focused on transfusion strategies (1 PBM pillar only))
24. Corwin HL, Theus JW, Cargile CS, et al. Red blood cell transfusion: impact of an education
program and a clinical guideline on transfusion practice. J Hosp Med 2014;9:745-9.
Geissler 2015 (reason for exclusion: focused on transfusion strategies (1 PBM pillar only))
25. Geissler RG, Kosters C, Franz D, et al. Utilisation of Blood Components in Trauma Surgery: A
Single-Centre, Retrospective Analysis before and after the Implementation of an Educative PBM
Initiative. Transfus Med Hemother 2015;42:83-9.
Geissler 2015 (reason for exclusion: focused on transfusion strategies (1 PBM pillar only))
26. Geissler RG, Rotering H, Buddendick H, et al. Utilisation of blood components in cardiac surgery:
a single-centre retrospective analysis with regard to diagnosis-related procedures. Transfus Med
Hemother 2015;42:75-82.
Grau 2017 (reason for exclusion: focused on transfusion strategies (1 PBM pillar only))
27. Grau JB, Fortier JH, Kuschner C, et al. Implementing a protocol to optimize blood use in a cardiac
surgery service: results of a pre-post analysis and the impact of high-volume blood users.
Transfusion 2017;57:2483-9.
Grayson 2003 (reason for exclusion: focused on transfusion strategies (1 PBM pillar only))
28. Grayson AD, Jackson M, Desmond MJ. Monitoring blood transfusion in patients undergoing
coronary artery bypass grafting: an audit methodology. Vox Sang 2003;85:96-101.
Norgaard 2017 (reason for exclusion: focused on transfusion strategies (1 PBM pillar only))
29. Norgaard A, Stensballe J, de Lichtenberg TH, et al. Three-year follow-up of implementation of
evidence-based transfusion practice in a tertiary hospital. Vox Sang 2017;112:229-39.
Ohsaka 2008 (reason for exclusion: focused on transfusion strategies (1 PBM pillar only))
30. Ohsaka A, Abe K, Ohsawa T, et al. A computer-assisted transfusion management system and
changed transfusion practices contribute to appropriate management of blood components.
Transfusion 2008;48:1730-8.
Oliver 2014 (reason for exclusion: focused on transfusion strategies (1 PBM pillar only))
31. Oliver JC, Griffin RL, Hannon T, et al. The success of our patient blood management program
depended on an institution-wide change in transfusion practices. Transfusion 2014;54:2617-24.
7
Patel 2016 (reason for exclusion: focused on transfusion strategies (1 PBM pillar only))
32. Patel VM, Rains AW, Clark CT. Effectiveness of Provider Education Followed by Computerized
Provider Order Entry Alerts in Reducing Inappropriate Red Blood Cell Transfusion. J Blood
Transfus 2016;2016:2859720.
Ravazi 2014 (reason for exclusion: focused on transfusion strategies (1 PBM pillar only))
33. Razavi SA, Carter AB, Puskas JD, et al. Reduced red blood cell transfusion in cardiothoracic
surgery after implementation of a novel clinical decision support tool. J Am Coll Surg
2014;219:1028-36.
Saag 2017 (reason for exclusion: focused on transfusion strategies (1 PBM pillar only))
34. Saag HS, Lajam CM, Jones S, et al. Reducing liberal red blood cell transfusions at an academic
medical center. Transfusion 2017;57:959-64.
Sekhar 2016 (reason for exclusion: focused on transfusion strategies (1 PBM pillar only))
35. Sekhar M, Clark S, Atugonza R, et al. Effective implementation of a patient blood management
programme for platelets. Transfus Med 2016;26:422-31.
Yazer 2016 (reason for exclusion: focused on transfusion strategies (1 PBM pillar only))
36. Yazer MH, Deandrade DS, Triulzi DJ, et al. Electronic enhancements to blood ordering reduce
component waste. Transfusion 2016;56:564-70.
Zuckerberg 2015 (reason for exclusion: focused on transfusion strategies (1 PBM pillar only))
37. Zuckerberg GS, Scott AV, Wasey JO, et al. Efficacy of education followed by computerized
provider order entry with clinician decision support to reduce red blood cell utilization.
Transfusion 2015;55:1628-36.

8
Overview table included studies and intervention components/targeted physicians/category/follow-up period
Gu
idelin
e
Form
Au
dit
Ed
uca
tio
n
Pri
nci
ple
s o
f K
ott
er
mo
del
Deci
sio
n s
up
po
rt s
yste
m
Mo
nit
ori
ng
an
d f
eed
back
PB
M p
illa
r 1 (
op
tim
ize e
ryth
rop
oie
sis)
PB
M p
illa
r 2 (
min
imiz
e b
loo
d lo
ss)
PB
M p
illa
r 3 (
man
ag
e a
naem
ia)
Su
rgeo
ns
All
Un
clear
Card
iac
surg
ery
Ort
ho
ped
ic s
urg
ery
Gast
roin
test
inal su
rgery
Gen
era
l su
rgery
Geen
ral M
ed
ical
Malig
nan
t d
isease
Frank, 2017, USA 30
Frew, 2016, UK 60
Gani, 2017, USA 24
Gross, 2015, USA 66
Gross, 2016, USA 60
Kansagra, 2017, USA 15
Kopanidis, 2016, Australia 24
Leahy, 2014, Australia 36
Leahy, 2017, Australia (1) 54
Leahy, 2017, Australia (2) 54
Loftus, 2016, USA 12
Mehra, 2015, Switzerland 12
Meybohm, 2016, Germany 12-30
Rineau, 2016, France 6
Ternström, 2014, Sweden 12
Thakkar, 2016, USA 12
Theusinger, 2014, Switzerland 36
Verdecchia, 2016, USA 96
Xydas, 2012, USA 6
Yaffee, 2014, USA 24
PBM
component
Follo
w -
up
(m
on
ths)
Intervention(s) to
promote/monitor PBM
implementation
Targeted
physiciansCategory
9
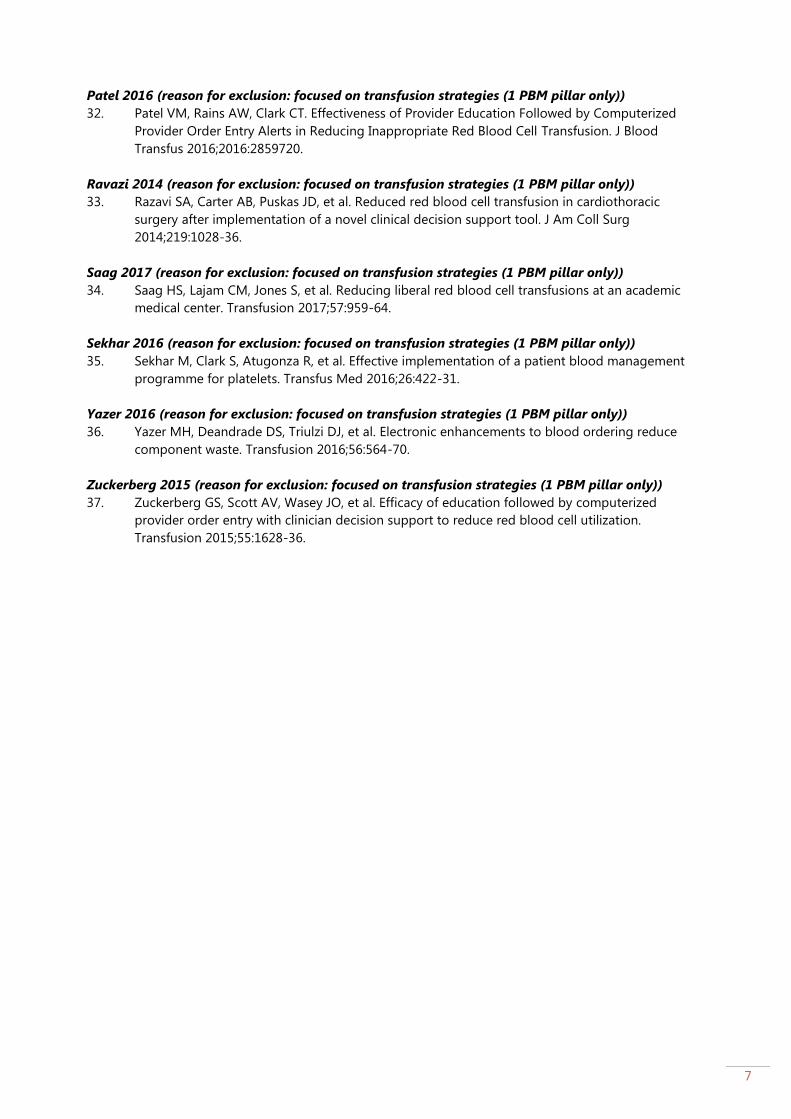
Overview evidence table GRADE software
Certainty assessment № of patients Effect
Certaint
y
Importanc
e № of
studies
Study
design
Risk of
bias Inconsistency Indirectness Imprecision
Other
considerations
a PBM
program
no PBM
program
Relativ
e
(95%
CI)
Absolut
e
(95% CI)
Blood product utilization - number of patients/admissions receiving RBC transfusion (follow up: median 22.5 months)
10 observational
studies
not
serious
not serious not serious not serious none 48174/46414
9 (10.4%)
27930/25327
2 (11.0%)
RR 0.78
(0.73 to
0.85)
24 fewer
per
1.000
(from 17
fewer to
30 fewer)
⨁⨁◯◯
LOW
CRITICAL
Blood product utilization - number of patients receiving PLT transfusion (follow up: median 21 months)
6 observational
studies
not
serious
serious a not serious not serious none 9420/317062
(3.0%)
4451/140104
(3.2%)
RR 0.86
(0.78 to
0.95)
4 fewer
per
1.000
(from 2
fewer to
7 fewer)
⨁◯◯◯
VERY
LOW
CRITICAL
Blood product utilization - number of patients receiving FFP transfusion (follow up: median 12 months)
5 observational
studies
serious b
serious a not serious serious c none 4141/316500
(1.3%)
7004/117444
(6.0%)
RR 0.49
(0.23 to
1.06)
30 fewer
per
1.000
(from 4
more to
46 fewer)
⨁◯◯◯
VERY
LOW
CRITICAL
Blood product utilization - number of patients receiving cryprecipitate transfusion (follow up: 6 months)
10
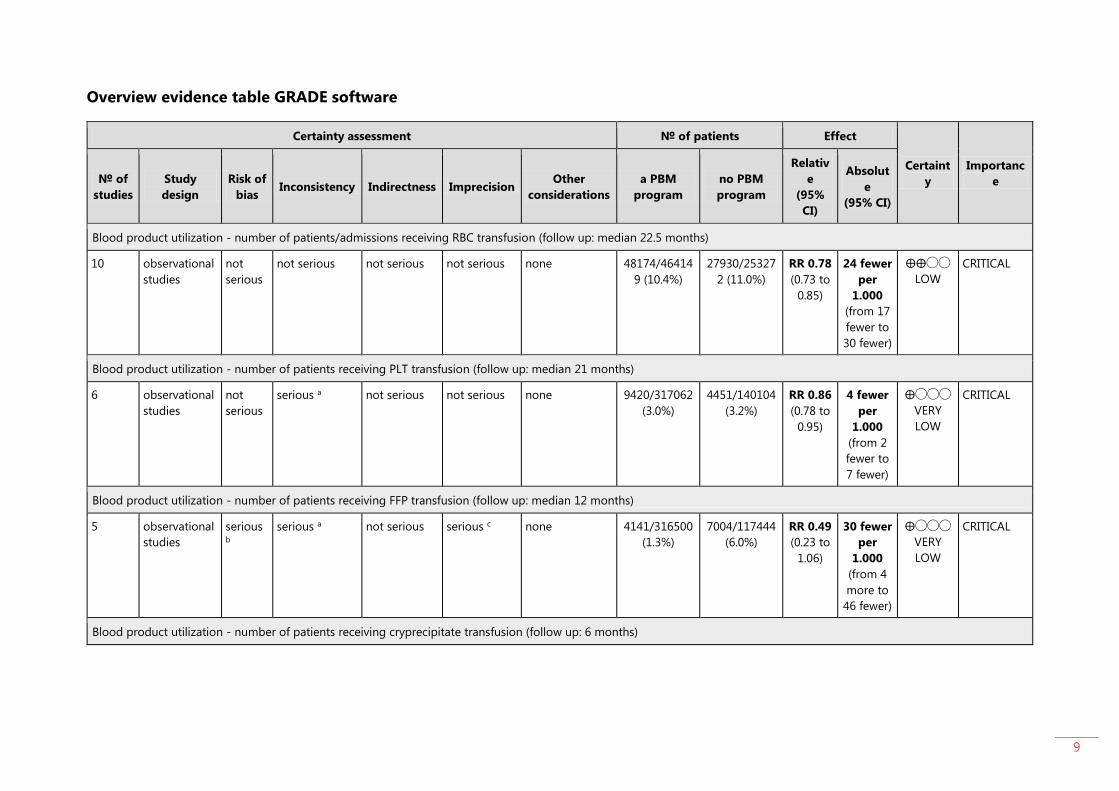
Certainty assessment № of patients Effect
Certaint
y
Importanc
e № of
studies
Study
design
Risk of
bias Inconsistency Indirectness Imprecision
Other
considerations
a PBM
program
no PBM
program
Relativ
e
(95%
CI)
Absolut
e
(95% CI)
1 observational
studies
not
serious
not serious not serious serious d none 27/551 (4.9%) 76/481
(15.8%)
RR 0.31
(0.20 to
0.47)
109
fewer
per
1.000
(from 84
fewer to
126
fewer)
⨁◯◯◯
VERY
LOW
IMPORTANT
Blood product utilization - number of patients receiving any transfusion (RBC, PLT, FFP) (follow up: median 12 months)
6 observational
studies
not
serious
serious a not serious not serious none 1582/8851
(17.9%)
2393/8608
(27.8%)
RR 0.53
(0.40 to
0.70)
131
fewer
per
1.000
(from 83
fewer to
167
fewer)
⨁◯◯◯
VERY
LOW
CRITICAL
Blood product utilization - number of RBC units transfused (continuous) (follow up: median 21 months)
7 observational
studies
not
serious
serious a not serious not serious none 375543 180660 - MD 0.47
units
lower
(0.68
lower to
0.27
lower)
⨁◯◯◯
VERY
LOW
CRITICAL
Blood product utilization - number of FFP units transfused (follow up: median 18 months)
11
Certainty assessment № of patients Effect
Certaint
y
Importanc
e № of
studies
Study
design
Risk of
bias Inconsistency Indirectness Imprecision
Other
considerations
a PBM
program
no PBM
program
Relativ
e
(95%
CI)
Absolut
e
(95% CI)
6 observational
studies
serious e
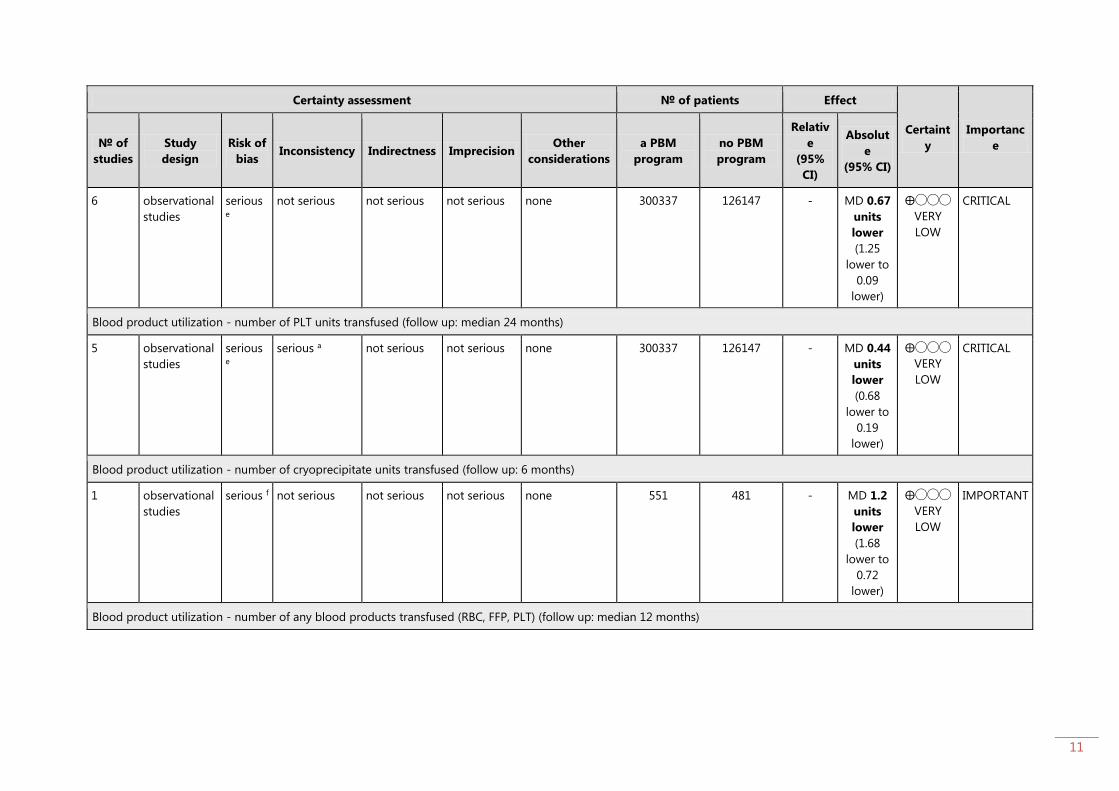
not serious not serious not serious none 300337 126147 - MD 0.67
units
lower
(1.25
lower to
0.09
lower)
⨁◯◯◯
VERY
LOW
CRITICAL
Blood product utilization - number of PLT units transfused (follow up: median 24 months)
5 observational
studies
serious e
serious a not serious not serious none 300337 126147 - MD 0.44
units
lower
(0.68
lower to
0.19
lower)
⨁◯◯◯
VERY
LOW
CRITICAL
Blood product utilization - number of cryoprecipitate units transfused (follow up: 6 months)
1 observational
studies
serious f not serious not serious not serious none 551 481 - MD 1.2
units
lower
(1.68
lower to
0.72
lower)
⨁◯◯◯
VERY
LOW
IMPORTANT
Blood product utilization - number of any blood products transfused (RBC, FFP, PLT) (follow up: median 12 months)

12
Certainty assessment № of patients Effect
Certaint
y
Importanc
e № of
studies
Study
design
Risk of
bias Inconsistency Indirectness Imprecision
Other
considerations
a PBM
program
no PBM
program
Relativ
e
(95%
CI)
Absolut
e
(95% CI)
4 observational
studies
serious g
not serious not serious not serious none 4899 8316 - MD 2.32
units
lower
(3.12
lower to
1.52
lower)
⨁◯◯◯
VERY
LOW
IMPORTANT
Morbidity - composite measures (follow up: median 22.5 months)
6 observational
studies
not
serious
not serious not serious serious c none See 'Forest plot' figure 16: no evidence of effect in
5/6 studies. One study (Gani 2017) showed that a
PBM program (containing a guideline + education
+ decision support/form/monitoring) resulted in a
statistically significant reduction in postoperative
complications.
⨁◯◯◯
VERY
LOW
CRITICAL
Figure 16: Forest plot of outcome: Morbidity (composite measures)

13
Certainty assessment № of patients Effect
Certaint
y
Importanc
e № of
studies
Study
design
Risk of
bias Inconsistency Indirectness Imprecision
Other
considerations
a PBM
program
no PBM
program
Relativ
e
(95%
CI)
Absolut
e
(95% CI)
Morbidity - acute myocardial infarction (follow up: median 24 months)
3 observational
studies
not
serious
not serious not serious serious h none 0/1038 (0.0%) 4/972 (0.4%) RR 0.20
(0.02 to
1.73)
3 fewer
per
1.000
(from 3
more to
4 fewer)
⨁◯◯◯
VERY
LOW
CRITICAL
Morbidity - acute kidney injury (follow up: median 24 months)
4 observational
studies
not
serious
not serious not serious serious i none 148/3313
(4.5%)
58/1359
(4.3%)
RR 0.84
(0.60 to
1.17)
7 fewer
per
1.000
(from 7
more to
17 fewer)
⨁◯◯◯
VERY
LOW
CRITICAL
Mortality - hospital mortality (follow up: median 24 months)
7 observational
studies
not
serious
serious a not serious serious i none OR 0.64
(0.23 to
1.74)
1 fewer
per
1.000
(from 0
fewer to
2 fewer)
⨁◯◯◯
VERY
LOW
CRITICAL
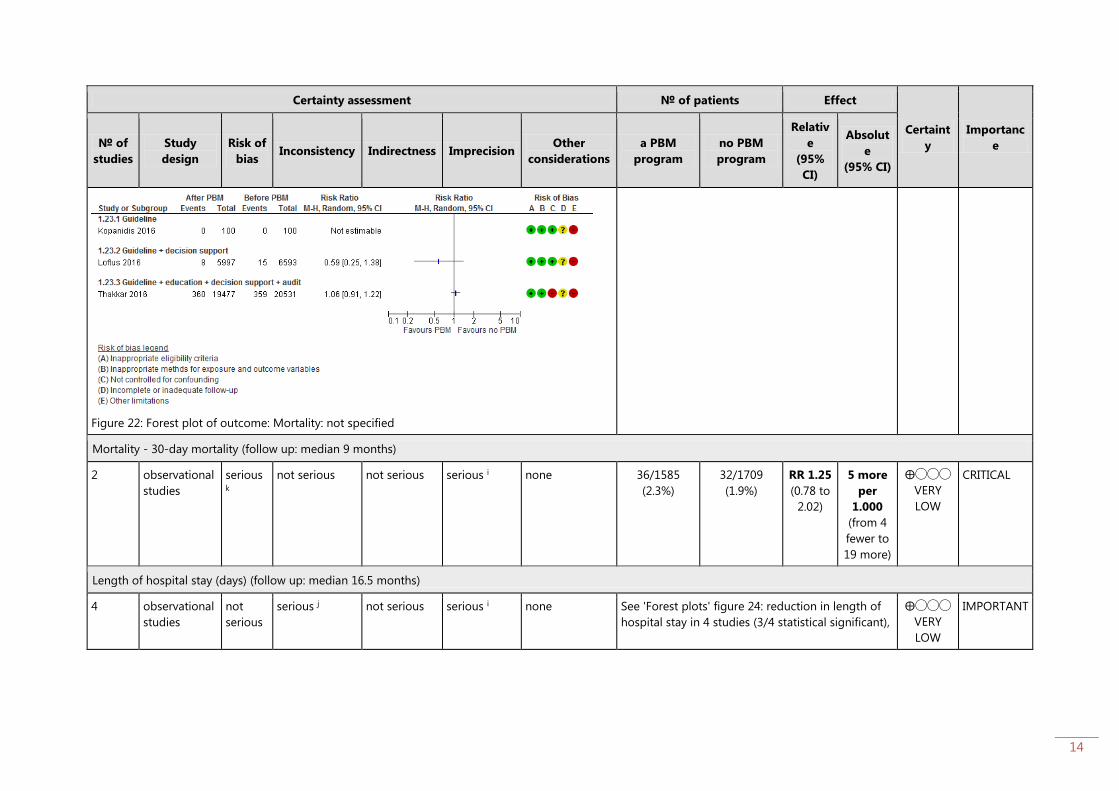
Mortality - not defined (follow up: median 12 months)
3 observational
studies
not
serious
serious j not serious not serious none See 'Forest plots' figure 22: no deaths in 1 study
(Kopanidis 2016), no evidence of effect in 1 study
(Loftus 2016) and 1 study showed no difference in
mortality rate (Thakkar 2016).
⨁◯◯◯
VERY
LOW
CRITICAL
14
Certainty assessment № of patients Effect
Certaint
y
Importanc
e № of
studies
Study
design
Risk of
bias Inconsistency Indirectness Imprecision
Other
considerations
a PBM
program
no PBM
program
Relativ
e
(95%
CI)
Absolut
e
(95% CI)
Figure 22: Forest plot of outcome: Mortality: not specified
Mortality - 30-day mortality (follow up: median 9 months)
2 observational
studies
serious k
not serious not serious serious i none 36/1585
(2.3%)
32/1709
(1.9%)
RR 1.25
(0.78 to
2.02)
5 more
per
1.000
(from 4
fewer to
19 more)
⨁◯◯◯
VERY
LOW
CRITICAL
Length of hospital stay (days) (follow up: median 16.5 months)
4 observational
studies
not
serious
serious j not serious serious i none See 'Forest plots' figure 24: reduction in length of
hospital stay in 4 studies (3/4 statistical significant),
⨁◯◯◯
VERY
LOW
IMPORTANT

15
Certainty assessment № of patients Effect
Certaint
y
Importanc
e № of
studies
Study
design
Risk of
bias Inconsistency Indirectness Imprecision
Other
considerations
a PBM
program
no PBM
program
Relativ
e
(95%
CI)
Absolut
e
(95% CI)
Figure 24: Forest plot of outcome: Length of hospital stay (days)
no evidence of effect in 1 study (total knee
arthroplasty)
Morbidity - acute ischaemic stroke (follow up: median 18 months)
4 observational
studies
not
serious
not serious not serious serious d none 92/4247
(2.2%)
40/2387
(1.7%)
RR 1.03
(0.71 to
1.52)
1 more
per
1.000
(from 5
fewer to
9 more)
⨁◯◯◯
VERY
LOW
CRITICAL
CI: Confidence interval; RR: Risk ratio; MD: Mean difference; OR: Odds ratio
a. all parameters (statistical and visual) are positive; b. Inappropriate eligibility criteria (Xydas 2012), inappropriate methods for exposure and outcome variables (Ternström 2014),
not controlled for confounding (Gross 2015, Ternström 2014 and Thakkar 2016) and other limitations (all studies); c. Large variability in results; d. Low number of events; e.
Inappropriate eligibility criteria (Xydas 2012), inappropriate methods for exposure and outcome variables (Ternström), not controlled for confounding (Gross 2015, Yaffee 2014,
Ternström 2014), other limitations (all studies); f. Inappropriate eligibility criteria and other limitations; g. Inappropriate eligibility criteria (Xydas 2012), inappropriate methods for
exposure and outcome variables (Ternström 2014), not controlled for confounding (Yaffee 2014 and Ternström 2014) and other limitations (all studies); h. Low number of events

16
and large variability in results; i. Large variability in results; j. Widely differing estimates of the effects; k. Inappropriate eligibility criteria (Xydas 2012), inappropriate methods for
exposure and outcome variables (Ternström 2014), not controlled for confounding (Ternström 2014) and other limitations (all studies).
17
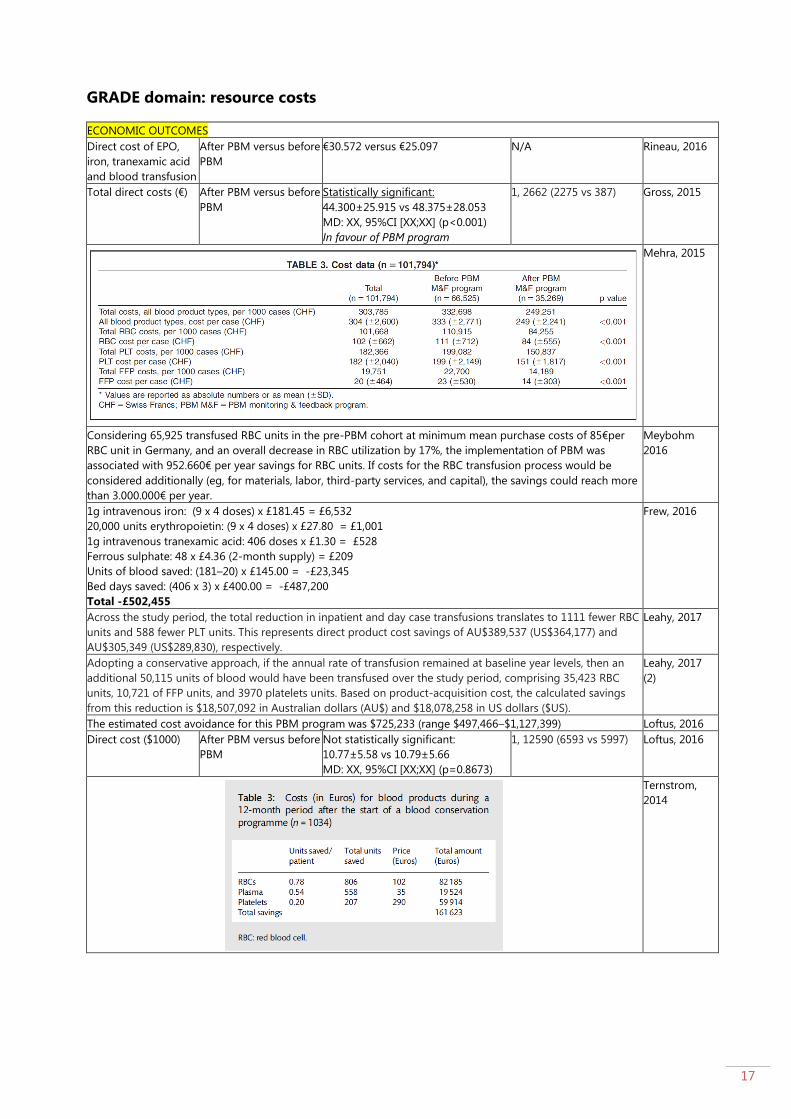
GRADE domain: resource costs
ECONOMIC OUTCOMES
Direct cost of EPO,
iron, tranexamic acid
and blood transfusion
After PBM versus before
PBM
€30.572 versus €25.097 N/A Rineau, 2016
Total direct costs (€) After PBM versus before
PBM
Statistically significant:
44.300±25.915 vs 48.375±28.053
MD: XX, 95%CI [XX;XX] (p<0.001)
In favour of PBM program
1, 2662 (2275 vs 387)
Gross, 2015
Mehra, 2015
Considering 65,925 transfused RBC units in the pre-PBM cohort at minimum mean purchase costs of 85€per
RBC unit in Germany, and an overall decrease in RBC utilization by 17%, the implementation of PBM was
associated with 952.660€ per year savings for RBC units. If costs for the RBC transfusion process would be
considered additionally (eg, for materials, labor, third-party services, and capital), the savings could reach more
than 3.000.000€ per year.
Meybohm
2016
1g intravenous iron: (9 x 4 doses) x £181.45 = £6,532
20,000 units erythropoietin: (9 x 4 doses) x £27.80 = £1,001
1g intravenous tranexamic acid: 406 doses x £1.30 = £528
Ferrous sulphate: 48 x £4.36 (2-month supply) = £209
Units of blood saved: (181–20) x £145.00 = -£23,345
Bed days saved: (406 x 3) x £400.00 = -£487,200
Total -£502,455
Frew, 2016
Across the study period, the total reduction in inpatient and day case transfusions translates to 1111 fewer RBC
units and 588 fewer PLT units. This represents direct product cost savings of AU$389,537 (US$364,177) and
AU$305,349 (US$289,830), respectively.
Leahy, 2017
Adopting a conservative approach, if the annual rate of transfusion remained at baseline year levels, then an
additional 50,115 units of blood would have been transfused over the study period, comprising 35,423 RBC
units, 10,721 of FFP units, and 3970 platelets units. Based on product-acquisition cost, the calculated savings
from this reduction is $18,507,092 in Australian dollars (AU$) and $18,078,258 in US dollars ($US).
Leahy, 2017
(2)
The estimated cost avoidance for this PBM program was $725,233 (range $497,466–$1,127,399) Loftus, 2016
Direct cost ($1000) After PBM versus before
PBM
Not statistically significant:
10.77±5.58 vs 10.79±5.66
MD: XX, 95%CI [XX;XX] (p=0.8673)
1, 12590 (6593 vs 5997) Loftus, 2016
Ternstrom,
2014

18
Thakkar, 2016
The mean number of RBC units saved per patient after initiation of BCS was 1.7 units, resulting in an estimated
cost savings of $1,755 per patient, or $679,045 overall (n ¼ 387), for an annual savings of approximately
$339,522 for RBC transfusion alone in AVR patients.
Yaffee, 2014
Blood acquisition cost savings were $2,120,273/yr, an approximate 400% return on investment for our patient
blood management efforts.
Frank, 2017
Depending on the costing methodology used as described in the outcomes and data collection section,
annualized savings between time periods before and after PBM implementation ranged from a low of $108 000
using acquisition cost (~$225/unit) to $480 000 when using activity-based costing (~$1000/unit).
Kansagra,
2017
19
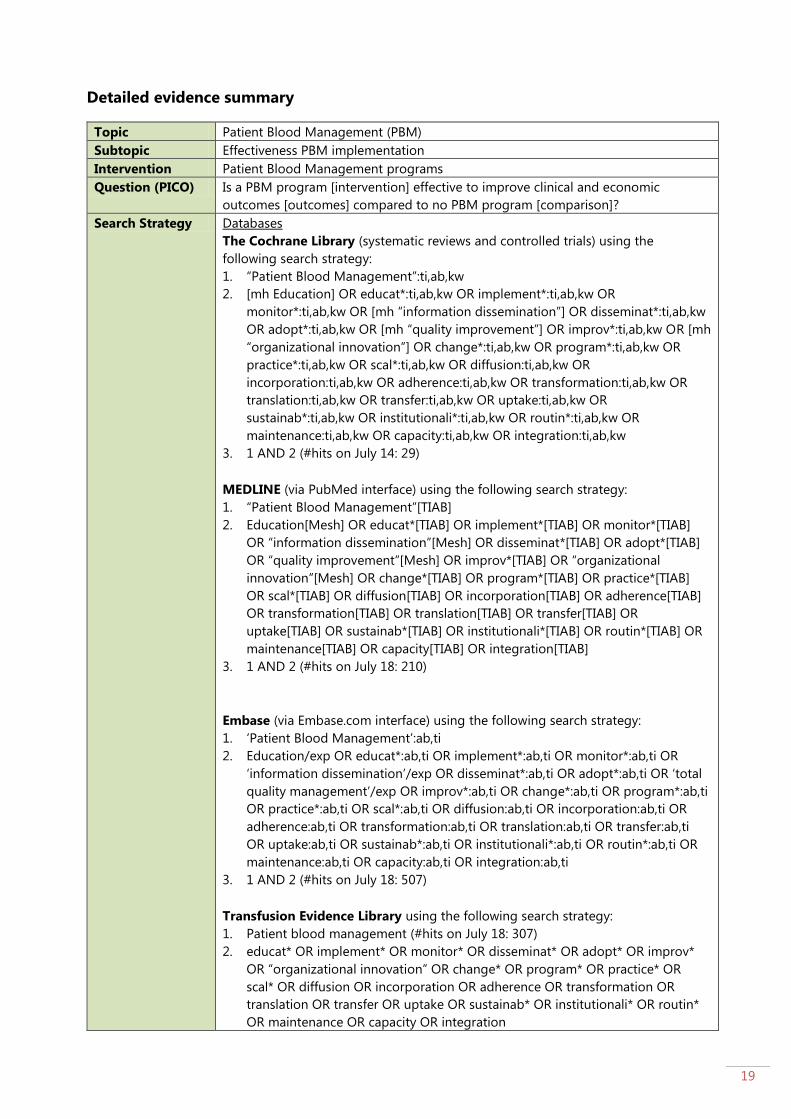
Detailed evidence summary
Topic Patient Blood Management (PBM)
Subtopic Effectiveness PBM implementation
Intervention Patient Blood Management programs
Question (PICO) Is a PBM program [intervention] effective to improve clinical and economic
outcomes [outcomes] compared to no PBM program [comparison]?
Search Strategy Databases
The Cochrane Library (systematic reviews and controlled trials) using the
following search strategy:
1. “Patient Blood Management”:ti,ab,kw
2. [mh Education] OR educat*:ti,ab,kw OR implement*:ti,ab,kw OR
monitor*:ti,ab,kw OR [mh “information dissemination”] OR disseminat*:ti,ab,kw
OR adopt*:ti,ab,kw OR [mh “quality improvement”] OR improv*:ti,ab,kw OR [mh
“organizational innovation”] OR change*:ti,ab,kw OR program*:ti,ab,kw OR
practice*:ti,ab,kw OR scal*:ti,ab,kw OR diffusion:ti,ab,kw OR
incorporation:ti,ab,kw OR adherence:ti,ab,kw OR transformation:ti,ab,kw OR
translation:ti,ab,kw OR transfer:ti,ab,kw OR uptake:ti,ab,kw OR
sustainab*:ti,ab,kw OR institutionali*:ti,ab,kw OR routin*:ti,ab,kw OR
maintenance:ti,ab,kw OR capacity:ti,ab,kw OR integration:ti,ab,kw
3. 1 AND 2 (#hits on July 14: 29)
MEDLINE (via PubMed interface) using the following search strategy:
1. “Patient Blood Management”[TIAB]
2. Education[Mesh] OR educat*[TIAB] OR implement*[TIAB] OR monitor*[TIAB]
OR “information dissemination”[Mesh] OR disseminat*[TIAB] OR adopt*[TIAB]
OR “quality improvement”[Mesh] OR improv*[TIAB] OR “organizational
innovation”[Mesh] OR change*[TIAB] OR program*[TIAB] OR practice*[TIAB]
OR scal*[TIAB] OR diffusion[TIAB] OR incorporation[TIAB] OR adherence[TIAB]
OR transformation[TIAB] OR translation[TIAB] OR transfer[TIAB] OR
uptake[TIAB] OR sustainab*[TIAB] OR institutionali*[TIAB] OR routin*[TIAB] OR
maintenance[TIAB] OR capacity[TIAB] OR integration[TIAB]
3. 1 AND 2 (#hits on July 18: 210)
Embase (via Embase.com interface) using the following search strategy:
1. ‘Patient Blood Management’:ab,ti
2. Education/exp OR educat*:ab,ti OR implement*:ab,ti OR monitor*:ab,ti OR
‘information dissemination’/exp OR disseminat*:ab,ti OR adopt*:ab,ti OR ‘total
quality management’/exp OR improv*:ab,ti OR change*:ab,ti OR program*:ab,ti
OR practice*:ab,ti OR scal*:ab,ti OR diffusion:ab,ti OR incorporation:ab,ti OR
adherence:ab,ti OR transformation:ab,ti OR translation:ab,ti OR transfer:ab,ti
OR uptake:ab,ti OR sustainab*:ab,ti OR institutionali*:ab,ti OR routin*:ab,ti OR
maintenance:ab,ti OR capacity:ab,ti OR integration:ab,ti
3. 1 AND 2 (#hits on July 18: 507)
Transfusion Evidence Library using the following search strategy:
1. Patient blood management (#hits on July 18: 307)
2. educat* OR implement* OR monitor* OR disseminat* OR adopt* OR improv*
OR “organizational innovation” OR change* OR program* OR practice* OR
scal* OR diffusion OR incorporation OR adherence OR transformation OR
translation OR transfer OR uptake OR sustainab* OR institutionali* OR routin*
OR maintenance OR capacity OR integration
20
3. 1 AND 2 (#hits on July 18: 141)
After removing duplicates, 674 papers were screened on title and abstract
In addition to the current search strategies, the first 20 related citations of all
included papers were screened and included (if appropriate).
Search date 30 January 2018
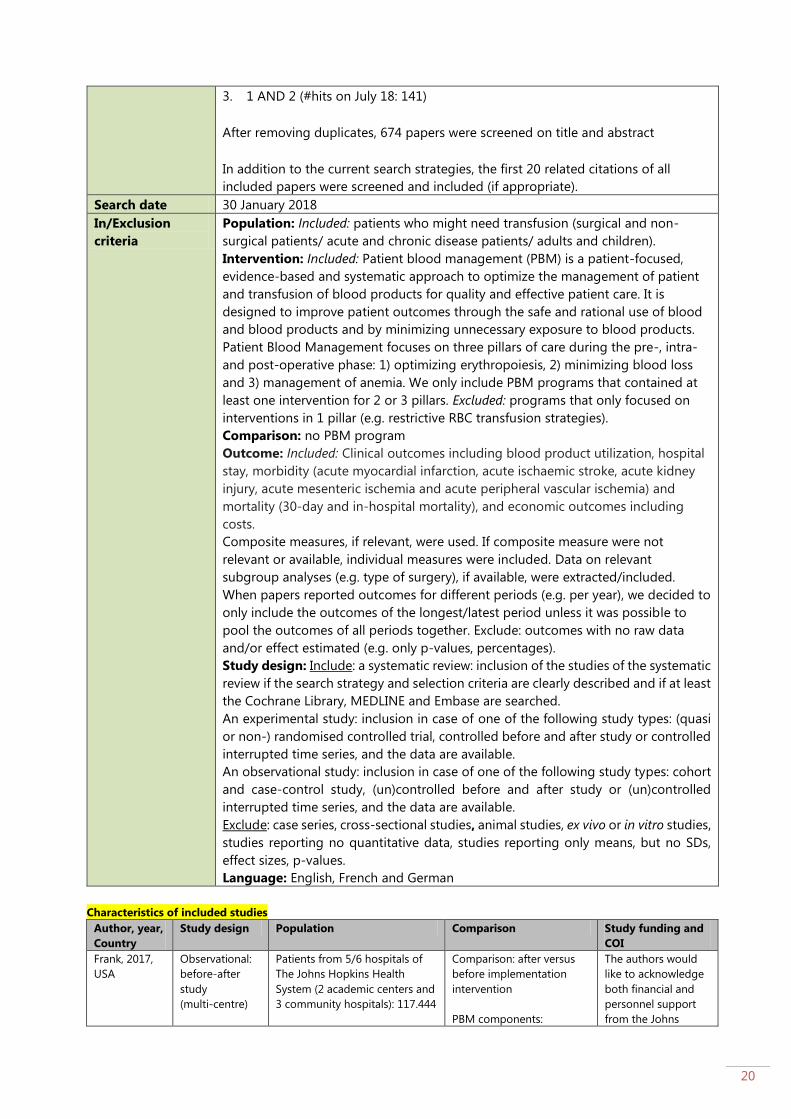
In/Exclusion
criteria
Population: Included: patients who might need transfusion (surgical and non-
surgical patients/ acute and chronic disease patients/ adults and children).
Intervention: Included: Patient blood management (PBM) is a patient-focused,
evidence-based and systematic approach to optimize the management of patient
and transfusion of blood products for quality and effective patient care. It is
designed to improve patient outcomes through the safe and rational use of blood
and blood products and by minimizing unnecessary exposure to blood products.
Patient Blood Management focuses on three pillars of care during the pre-, intra-
and post-operative phase: 1) optimizing erythropoiesis, 2) minimizing blood loss
and 3) management of anemia. We only include PBM programs that contained at
least one intervention for 2 or 3 pillars. Excluded: programs that only focused on
interventions in 1 pillar (e.g. restrictive RBC transfusion strategies).
Comparison: no PBM program
Outcome: Included: Clinical outcomes including blood product utilization, hospital
stay, morbidity (acute myocardial infarction, acute ischaemic stroke, acute kidney
injury, acute mesenteric ischemia and acute peripheral vascular ischemia) and
mortality (30-day and in-hospital mortality), and economic outcomes including
costs.
Composite measures, if relevant, were used. If composite measure were not
relevant or available, individual measures were included. Data on relevant
subgroup analyses (e.g. type of surgery), if available, were extracted/included.
When papers reported outcomes for different periods (e.g. per year), we decided to
only include the outcomes of the longest/latest period unless it was possible to
pool the outcomes of all periods together. Exclude: outcomes with no raw data
and/or effect estimated (e.g. only p-values, percentages).
Study design: Include: a systematic review: inclusion of the studies of the systematic
review if the search strategy and selection criteria are clearly described and if at least
the Cochrane Library, MEDLINE and Embase are searched.
An experimental study: inclusion in case of one of the following study types: (quasi
or non-) randomised controlled trial, controlled before and after study or controlled
interrupted time series, and the data are available.
An observational study: inclusion in case of one of the following study types: cohort
and case-control study, (un)controlled before and after study or (un)controlled
interrupted time series, and the data are available.
Exclude: case series, cross-sectional studies, animal studies, ex vivo or in vitro studies,
studies reporting no quantitative data, studies reporting only means, but no SDs,
effect sizes, p-values.
Language: English, French and German
Characteristics of included studies
Author, year,
Country
Study design Population Comparison Study funding and
COI
Frank, 2017,
USA
Observational:
before-after
study
(multi-centre)
Patients from 5/6 hospitals of
The Johns Hopkins Health
System (2 academic centers and
3 community hospitals): 117.444
Comparison: after versus
before implementation
intervention
PBM components:
The authors would
like to acknowledge
both financial and
personnel support
from the Johns
21
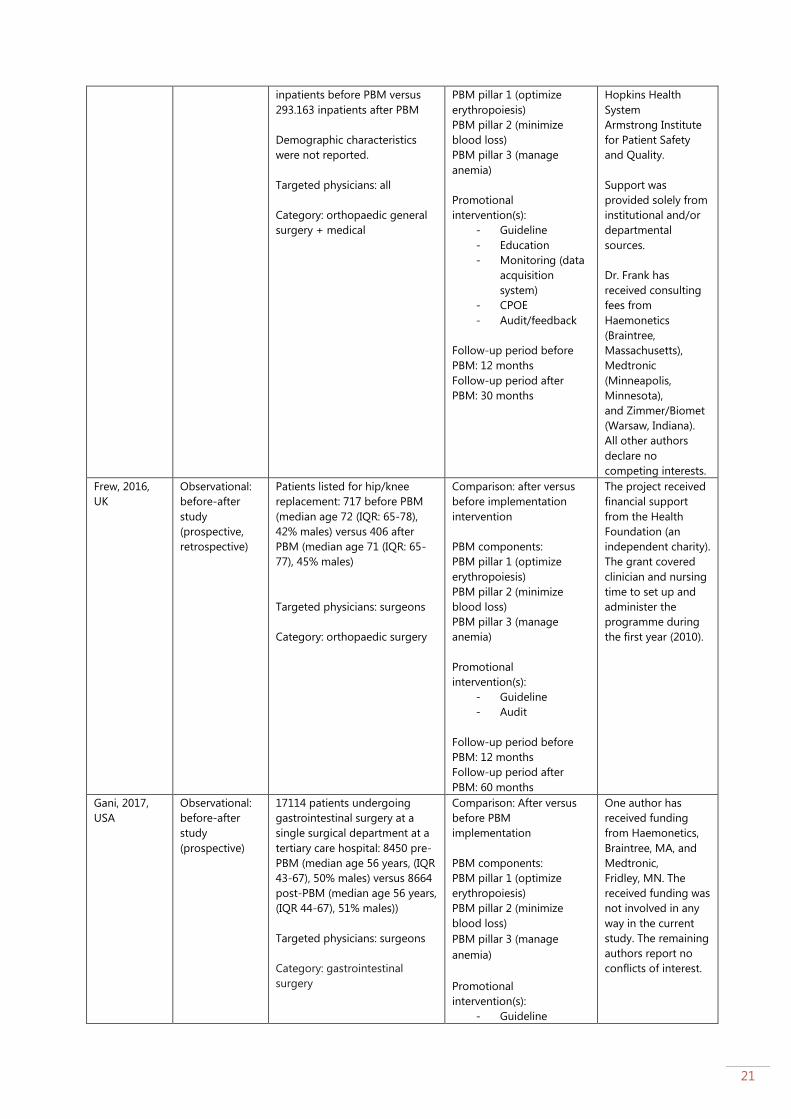
inpatients before PBM versus
293.163 inpatients after PBM
Demographic characteristics
were not reported.
Targeted physicians: all
Category: orthopaedic general
surgery + medical
PBM pillar 1 (optimize
erythropoiesis)
PBM pillar 2 (minimize
blood loss)
PBM pillar 3 (manage
anemia)
Promotional
intervention(s):
- Guideline
- Education
- Monitoring (data
acquisition
system)
- CPOE
- Audit/feedback
Follow-up period before
PBM: 12 months
Follow-up period after
PBM: 30 months
Hopkins Health
System
Armstrong Institute
for Patient Safety
and Quality.
Support was
provided solely from
institutional and/or
departmental
sources.
Dr. Frank has
received consulting
fees from
Haemonetics
(Braintree,
Massachusetts),
Medtronic
(Minneapolis,
Minnesota),
and Zimmer/Biomet
(Warsaw, Indiana).
All other authors
declare no
competing interests.
Frew, 2016,
UK
Observational:
before-after
study
(prospective,
retrospective)
Patients listed for hip/knee
replacement: 717 before PBM
(median age 72 (IQR: 65-78),
42% males) versus 406 after
PBM (median age 71 (IQR: 65-
77), 45% males)
Targeted physicians: surgeons
Category: orthopaedic surgery
Comparison: after versus
before implementation
intervention
PBM components:
PBM pillar 1 (optimize
erythropoiesis)
PBM pillar 2 (minimize
blood loss)
PBM pillar 3 (manage
anemia)
Promotional
intervention(s):
- Guideline
- Audit
Follow-up period before
PBM: 12 months
Follow-up period after
PBM: 60 months
The project received
financial support
from the Health
Foundation (an
independent charity).
The grant covered
clinician and nursing
time to set up and
administer the
programme during
the first year (2010).
Gani, 2017,
USA
Observational:
before-after
study
(prospective)
17114 patients undergoing
gastrointestinal surgery at a
single surgical department at a
tertiary care hospital: 8450 pre-
PBM (median age 56 years, (IQR
43-67), 50% males) versus 8664
post-PBM (median age 56 years,
(IQR 44-67), 51% males))
Targeted physicians: surgeons
Category: gastrointestinal
surgery
Comparison: After versus
before PBM
implementation
PBM components:
PBM pillar 1 (optimize
erythropoiesis)
PBM pillar 2 (minimize
blood loss)
PBM pillar 3 (manage
anemia)
Promotional
intervention(s):
- Guideline
One author has
received funding
from Haemonetics,
Braintree, MA, and
Medtronic,
Fridley, MN. The
received funding was
not involved in any
way in the current
study. The remaining
authors report no
conflicts of interest.
22
- Education
- Audit
- Monitoring
(monthly
dashboards using
IMPACT online)
Follow-up period before
PBM: 24 months
Follow-up period after
PBM: 24 months
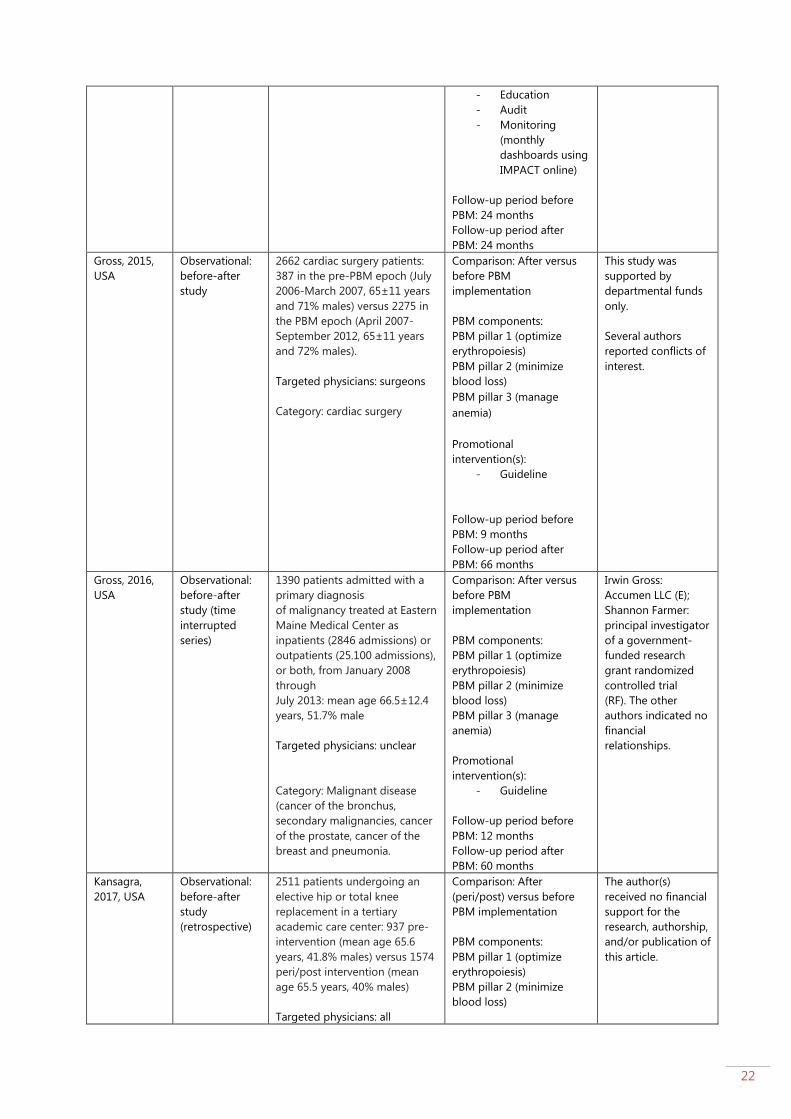
Gross, 2015,
USA
Observational:
before-after
study
2662 cardiac surgery patients:
387 in the pre-PBM epoch (July
2006-March 2007, 65±11 years
and 71% males) versus 2275 in
the PBM epoch (April 2007-
September 2012, 65±11 years
and 72% males).
Targeted physicians: surgeons
Category: cardiac surgery
Comparison: After versus
before PBM
implementation
PBM components:
PBM pillar 1 (optimize
erythropoiesis)
PBM pillar 2 (minimize
blood loss)
PBM pillar 3 (manage
anemia)
Promotional
intervention(s):
- Guideline
Follow-up period before
PBM: 9 months
Follow-up period after
PBM: 66 months
This study was
supported by
departmental funds
only.
Several authors
reported conflicts of
interest.
Gross, 2016,
USA
Observational:
before-after
study (time
interrupted
series)
1390 patients admitted with a
primary diagnosis
of malignancy treated at Eastern
Maine Medical Center as
inpatients (2846 admissions) or
outpatients (25.100 admissions),
or both, from January 2008
through
July 2013: mean age 66.5±12.4
years, 51.7% male
Targeted physicians: unclear
Category: Malignant disease
(cancer of the bronchus,
secondary malignancies, cancer
of the prostate, cancer of the
breast and pneumonia.
Comparison: After versus
before PBM
implementation
PBM components:
PBM pillar 1 (optimize
erythropoiesis)
PBM pillar 2 (minimize
blood loss)
PBM pillar 3 (manage
anemia)
Promotional
intervention(s):
- Guideline
Follow-up period before
PBM: 12 months
Follow-up period after
PBM: 60 months
Irwin Gross:
Accumen LLC (E);
Shannon Farmer:
principal investigator
of a government-
funded research
grant randomized
controlled trial
(RF). The other
authors indicated no
financial
relationships.
Kansagra,
2017, USA
Observational:
before-after
study
(retrospective)
2511 patients undergoing an
elective hip or total knee
replacement in a tertiary
academic care center: 937 pre-
intervention (mean age 65.6
years, 41.8% males) versus 1574
peri/post intervention (mean
age 65.5 years, 40% males)
Targeted physicians: all
Comparison: After
(peri/post) versus before
PBM implementation
PBM components:
PBM pillar 1 (optimize
erythropoiesis)
PBM pillar 2 (minimize
blood loss)
The author(s)
received no financial
support for the
research, authorship,
and/or publication of
this article.

23
Category: orthopedic surgery
PBM pillar 3 (manage
anemia)
Promotional
intervention(s):
- Guideline
- Education
- Audit/feedback
Follow-up period before
PBM: 9 months
Follow-up period after
PBM: 15 months
Kopanidis,
2016,
Australia
Observational:
before-after
study
(retrospective)
200 patients undergoing total
knee arthroplasty and total hip
arthroplasty (Australian teaching
hospital): 100 before PBM
(68.1±9.7 years, 74% males)
versus 100 after PBM (67.2±10.9
years, 68% males)
Anemia was defined according
to the WHO criteria: Hb level of
less than 13 g/dL for men or
less than 12 g/dL for women.
Targeted physicians: not
specified
Category: orthopedic surgery
Comparison: After versus
before PBM
implementation
PBM components:
PBM pillar 1 (optimize
erythropoiesis)
PBM pillar 2 (minimize
blood loss)
PBM pillar 3 (manage
anemia)
Promotional
intervention(s):
- Guideline
Follow-up period before
PBM: 24 months
Follow-up period after
PBM: 24 months
Funding for this
research was
received from the
Department of
Anaesthesia,
Austin Hospital
Research Fund.
The authors declare
that they have no
competing interests.
Leahy, 2014,
Australia
Observational:
before-after
study
(retrospective)
450-bed acute care teaching
hospital with a full range of
medical and surgical specialties
including cardiothoracic,
orthopaedic, vascular, colorectal
and trauma surgery: 57.327
admissions pre-PBM (49% >60
years) versus 69.920 admissions
post-PBM (48% >60 years)
Targeted physicians: all
Category: general surgery +
medical
Comparison: after versus
before implementation
intervention
PBM components:
PBM pillar 1 (optimize
erythropoiesis)
PBM pillar 2 (minimize
blood loss)
PBM pillar 3 (manage
anemia)
Promotional
intervention(s):
- Guideline
- Form
- Education
- Audit
- Decision support
system
Follow-up period before
PBM: 12 months
Follow-up period after
PBM: 36 months
The 5-year program
received executive
support and funding
from theWA State
Health Executive
Forum and the
Health Department
of
WA and was
endorsed by the
Australian Red Cross
Blood
Service.
The authors declare
that they have no
conflict of interest
relevant
to the manuscript
submitted to
TRANSFUSION
Leahy, 2017,
Australia (1)
Observational:
before-after
695 admissions at 2 tertiary
hospitals receiving intensive
chemotherapy for acute
Comparison: after versus
before implementation
intervention
CM, SS, and HC have
disclosed no

24
study
(retrospective)
leukemia or undergoing
haematopoietic stem cell
transplantation: 133 inpatient
admissions before PBM
(48.14±16.61 years) versus 562
admissions after PBM (2011-
2012 (n=143): 47.99±12.99;
2012-2013 (n=166):
50.33±14.04 years; 2013-2014
(n=153): 50.19±14.93; 2014-
2015 (n=100): 49.45±14.76
years)
Targeted physicians: all
Category: Medical - Oncology
PBM components:
PBM pillar 1 (optimize
erythropoiesis)
PBM pillar 2 (minimize
blood loss)
PBM pillar 3 (manage
anemia)
Promotional
intervention(s):
- Guideline
- Form
- Education
- Audit
- Principles of
Kotter model
Follow-up period before
PBM: 18 months
Follow-up period after
PBM: 54 months
conflicts of interest.
ML reports
honorarium from
Vifor Pharma. KT
reports nonfinancial
support from
Medical Society for
Blood Management,
nonfinancial support
from The Health
Roundtable, outside
the submitted work.
SF reports personal
fees fromThieme
(Stuttgart, Germany)
and Elsevier Science
USA and
nonfinancial support
fromthe National
Blood Authority
(Australia), the
Medical Society for
Blood Management,
and The Health
Roundtable, outside
the submitted work.
Leahy, 2017,
Australia (2)
Observational:
before-after
study
(retrospective)
605.046 patients admitted to
four major adult tertiary-care
hospitals
Targeted physicians: all
Category: general surgery and
medical settings
Comparison: after versus
before implementation
intervention
PBM components:
PBM pillar 1 (optimize
erythropoiesis)
PBM pillar 2 (minimize
blood loss)
PBM pillar 3 (manage
anemia)
Promotional
intervention(s):
- Guideline
- Form
- Education
- Audit
- Principles of
Kotter model
Follow-up period before
PBM: 18 months
Follow-up period after
PBM: 54 months
Axel Hofmann
reports personal fees
from Vifor Pharma
AG and TEM
International GmbH,
outside the
submitted work.
Simon Towler
reports nonfinancial
support from the
Medical Society for
Blood Management
and the National
Blood Authority
(Australia),
outside the
submitted work.
Kevin M. Trentino
reports nonfinancial
support from the
Medical Society for
Blood Management
and The Health
Roundtable, outside
the submitted work.
Shannon L. Farmer
reports personal fees
from Thieme
(Stuttgart, Germany)
and Elsevier Science
USA and
nonfinancial support
from the National
Blood Authority
(Australia), the
Medical Society for

25
Blood Management,
and The Health
Round Table, outside
the submitted work.
Michael Leahy
reports honorarium
from Vifor Pharma.
The remaining
authors made no
disclosures.
Loftus, 2016,
USA
Observational:
before-after
study
(retrospective)
12.590 patients from 16
different hospitals undergoing
total hip arthroplasty or total
knee arthroplasty: 5.997 before
PBM (69.64±11.52 years, 37.3%
males) versus 6.593 after PBM
(69.51±11.54 years, 38.3%
males)
Targeted physicians: not
specified
Category: orthopaedic surgery
Comparison: after versus
before implementation
intervention
PBM components:
PBM pillar 1 (optimize
erythropoiesis)
PBM pillar 2 (minimize
blood loss)
PBM pillar 3 (manage
anemia)
Promotional
intervention(s):
- Guideline
- Decision support
system
Follow-up period before
PBM: 12 months
Follow-up period after
PBM: 12 months
One or more of the
authors of this paper
have disclosed
potential or
pertinent conflicts
of interest, which
may include receipt
of payment, either
direct or indirect,
institutional
support, or
association with an
entity in the
biomedical field
which may be
perceived to have
potential conflict of
interest with this
work
Mehra, 2015,
Switzerland
Observational:
cohort study
(prospective)
101,794 patients aged 18 years
or older were included: 66525
(median age 55 years (37-69)
and 49.5% males) before PBM
and 35269 after PBM (median
age 55 years (37-70) and 48.7%
males)
Targeted physicians: all
Category: general surgery and
medical
Comparison: after versus
before implementation
intervention
PBM components:
PBM pillar 1 (optimize
erythropoiesis)
PBM pillar 2 (minimize
blood loss)
PBM pillar 3 (manage
anemia)
Intervention(s):
- Monitoring and
feedback (via
mandatory
transfusion
documentation in
electronic
medical patient
records
- Guideline
- Audit
Follow-up period before
implementation
Intervention: 20 months
Follow-up period after
implementation: 12 months
Senior author
(Spahn) reports
conflict of interest,
the remaining
authors have
disclosed no conflict
of interest.

26
Meybohm,
2016,
Germany
Observational:
before-after
study
129.719 surgical inpatients from
4 German University Hospitals
discharged between July 2012
and June 2015 with different
inclusion periods for pre-PBM
(54.513 patients): 55.7±0.8
years, 51% males and PBM
(75.206 patients): 55.6±0.8
years, 51% males.
All types of surgical procedures
(according to the German
surgery and procedure
classification) were included,
except ophthalmologic surgery,
dermatologic and non-specified
surgery
Anemia was defined according
to the WHO criteria: Hb level of
less than 13 g/dL for men or
less than 12 g/dL for women.
Targeted physicians: all
Category: general surgery
Comparison: after versus
before PBM
implementation
PBM components:
PBM pillar 1 (optimize
erythropoiesis)
PBM pillar 2 (minimize
blood loss)
PBM pillar 3 (manage
anemia)
Promotional
intervention(s):
- Guideline
- Education
- Other: handouts,
laminated cards,
posters,
checklists, and
web-based
information
Follow-up period before
PBM: 12 months
Follow-up period after
PBM: 12-30 months
This work is
supported by
internal
departmental
funding of each
center and by
research grants
provided by B. Braun
Melsungen AG,
Melsungen,
Germany; CSL
Behring, Marburg,
Germany; Fresenius
Kabi, Bad Homburg,
Germany; and Vifor
Pharma Deutschland
GmbH, Muenchen,
Germany. The
Funders of the study
had no role in design
and conduct of the
study; collection,
management,
analysis, and
interpretation of the
data; and
preparation, review,
or
approval of the
article.
Independence of
researchers from
funders is confirmed
Rineau, 2016,
France
Observational:
uncontrolled
before-after
study
(prospective)
367 patients admitted for
total hip or knee arthroplasty
(University Hospital of Angers,
France): 184 during Phase 1
(103 THA and 81 TKA):
71.1±10.5 years and 47% males
and 183 during Phase 2 (115
THA and 68 TKA): 70.1 ± 10.8
years and 43% males.
Anemia was defined according
to the WHO criteria: Hb level of
less than 13 g/dL for men or
less than 12 g/dL for women.
Targeted physicians: surgeons
Category: orthopedic surgery
Comparison: after: Phase 2
(PBM protocol) versus
before: Phase 1 (no PBM
protocol)
PBM components:
PBM pillar 1 (optimize
erythropoiesis)
PBM pillar 3 (manage
anemia)
Phase 1: EPO, iron and
tranexamic acid (with a
non-written protocol by
anesthesiologists,
physicians were not
involved) (November 2011
– December 2012)
Phase 2: combination EPO,
iron and tranexamic acid in
peri-operative period with
a protocol (posters at the
anesthesia consultation). A
restrictive transfusion
trigger (7-8 g/dL) or higher
triggers in case of poor
clinical or biologic
Senior author
(Sigismond Lasocki)
received consulting
fees from Vifor
Pharma, all other
authors have
disclosed no conflict
of interest.
27
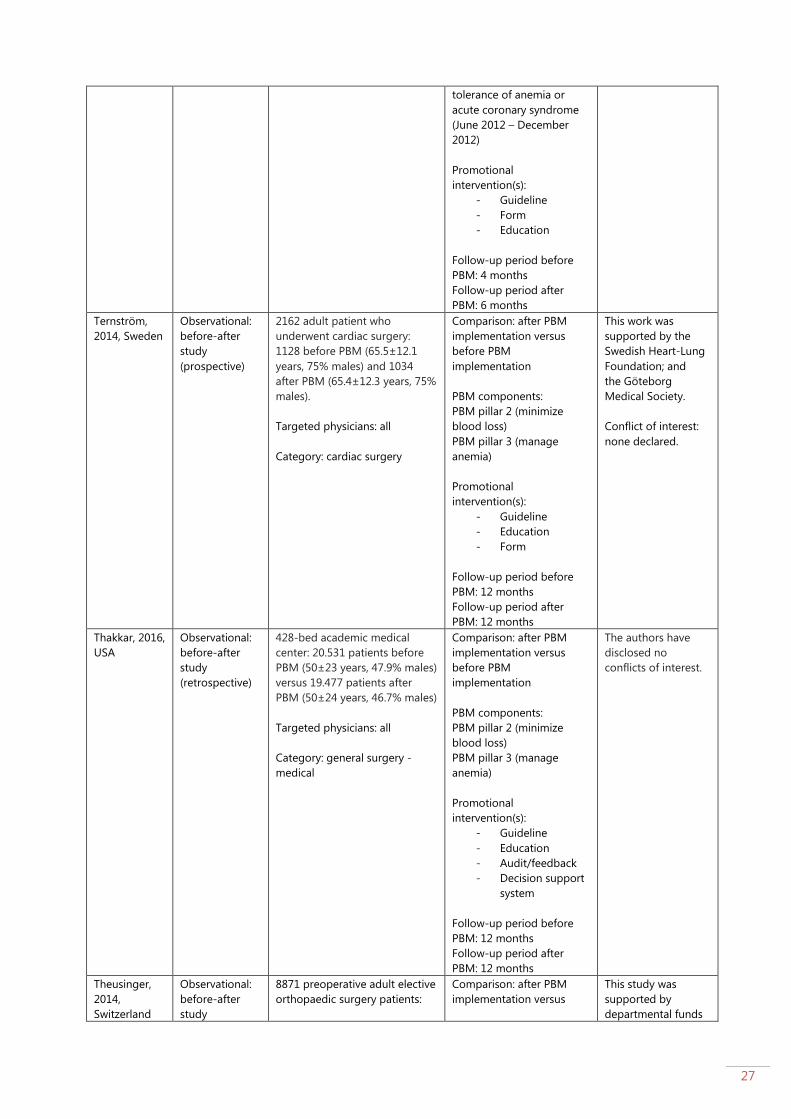
tolerance of anemia or
acute coronary syndrome
(June 2012 – December
2012)
Promotional
intervention(s):
- Guideline
- Form
- Education
Follow-up period before
PBM: 4 months
Follow-up period after
PBM: 6 months
Ternström,
2014, Sweden
Observational:
before-after
study
(prospective)
2162 adult patient who
underwent cardiac surgery:
1128 before PBM (65.5±12.1
years, 75% males) and 1034
after PBM (65.4±12.3 years, 75%
males).
Targeted physicians: all
Category: cardiac surgery
Comparison: after PBM
implementation versus
before PBM
implementation
PBM components:
PBM pillar 2 (minimize
blood loss)
PBM pillar 3 (manage
anemia)
Promotional
intervention(s):
- Guideline
- Education
- Form
Follow-up period before
PBM: 12 months
Follow-up period after
PBM: 12 months
This work was
supported by the
Swedish Heart-Lung
Foundation; and
the Göteborg
Medical Society.
Conflict of interest:
none declared.
Thakkar, 2016,
USA
Observational:
before-after
study
(retrospective)
428-bed academic medical
center: 20.531 patients before
PBM (50±23 years, 47.9% males)
versus 19.477 patients after
PBM (50±24 years, 46.7% males)
Targeted physicians: all
Category: general surgery -
medical
Comparison: after PBM
implementation versus
before PBM
implementation
PBM components:
PBM pillar 2 (minimize
blood loss)
PBM pillar 3 (manage
anemia)
Promotional
intervention(s):
- Guideline
- Education
- Audit/feedback
- Decision support
system
Follow-up period before
PBM: 12 months
Follow-up period after
PBM: 12 months
The authors have
disclosed no
conflicts of interest.
Theusinger,
2014,
Switzerland
Observational:
before-after
study
8871 preoperative adult elective
orthopaedic surgery patients:
Comparison: after PBM
implementation versus
This study was
supported by
departmental funds

28
(prospective
and
retrospective)
hip (n=3062): 2265 after PBM
(59±17 years, 47.4% males)
versus 797 before PBM (64±14
years, 43.70% males)
knee (n=2953): 2243 after PBM
(61±16 years, 46.8% males)
versus 710 before PBM (67±12
years, 38.5% males)
spine (n=2856)): 2213 after PBM
(62±15 years, 47% males) versus
643 before PBM (60±15 years,
43% males)
Targeted physicians: all
Category: orthopaedic surgery
before PBM
implementation
PBM components:
PBM pillar 1 (optimize
erythropoiesis)
PBM pillar 2 (minimize
blood loss)
PBM pillar 3 (manage
anemia)
Promotional
intervention(s):
- Guideline
Follow-up period before
PBM: 12 months
Follow-up period after
PBM: 36 months
and by a grant from
the
Gesundheitsdirektion
des Kantons
Zürichs for Highly
Specialized
Medicine.
Verdecchia,
2016, USA
Observational:
before-after
study
(retrospective)
7 hospitals in a regional, multi-
hospital healthcare system:
number of
patients/admissions/age/gender
per group was not reported
Targeted physicians: all
Category: general surgery -
medical
Comparison: after PBM
implementation versus
before PBM
implementation
PBM components:
PBM pillar 1 (optimize
erythropoiesis)
PBM pillar 2 (minimize
blood loss)
PBM pillar 3 (manage
anemia)
Promotional
intervention(s):
- Audit/feedback
- Decision support
system (CPOE)
- Education
Follow-up period before
PBM: 12 months
Follow-up period after
PBM: 96 months
No funding
No conflict of
interest to disclose
Xydas, 2012,
USA
Observational:
before-after
study
(prospective)
1032 patients undergoing
coronary and valve procedures:
481 patients (median age 69,
range 22-99 years, 69% males)
before PBM versus 551 patients
after PBM (median age 71,
range 31-92 years, 67% males)
Targeted physicians: surgeons
Category: cardiac surgery
Comparison: after PBM
implementation versus
before PBM
implementation
PBM components:
PBM pillar 2 (minimize
blood loss)
PBM pillar 3 (manage
anemia)
Promotional
intervention(s):
- Guideline
- Decision support
system
(algorithm-driven
decision)
No information
available

29
Follow-up period before
PBM: 6 months
Follow-up period after
PBM: 6 months
Yaffee, 2014,
USA
Observational:
before-after
study
(retrospective)
778 patients who underwent
aortic valve replacement: 391
before PBM (71.9±13.2 years,
62.1% males) versus 387 after
PBM (71.6±13.4 years, 56.6%
males)
Targeted physicians: cardiac
surgical care providers
Category: cardiac surgery
Comparison: after PBM
implementation versus
before PBM
implementation
PBM components:
PBM pillar 2 (minimize
blood loss)
PBM pillar 3 (manage
anemia)
Promotional
intervention(s):
- Guideline
- Education
Follow-up period before
PBM: 24 months
Follow-up period after
PBM: 24 months
No information
available
Synthesis of findings
Outcome Comparison Effect Size #studies, # participants Reference
BLOOD PRODUCT UTILIZATION
Number of patients receiving RBC transfusion (figure 1)
Patients receiving RBC After PBM versus before
PBM
Statistically significant:
11431/75206 vs 9392/54513
RR: 0.88, 95%CI [0.86;0.90]
(p<0.00001)
In favour of PBM program
1, 129719 Meybohm,
2016
Patients receiving RBC
transfusion
After PBM versus before
PBM
Statistically significant:
473/2275 vs 152/387
RR: 0.53, 95%CI [0.46;0.61]
(p<0.001)
In favour of PBM program
1, 2662 (2275 vs 387)
Gross, 2015
Proportion of
admissions receiving
RBC transfusion
After PBM versus before
PBM
Statistically significant:
2097/69920 vs 1874/57327
RR: 0.92, 95%CI [0.86;0.98] (p<0.05)
In favour of PBM program
1, 127.247 (69.920 vs
57.327)
Leahy, 2014
Number of RBC
transfusions
After PBM versus before
PBM
Statistically significant:
391/562 vs 111/133
RR: 0.83, 95%CI [0.76.0.92]
(p<0.05)
In favour of PBM program
1, 695 (562 vs 133) Leahy, 2017
(1)
Proportion of patients
that received RBC
transfusion
After PBM versus before
PBM
Statistically significant:
470/1034 vs 656/1128
RR: 0.78, 95%CI [0.72;0.85]
(p<0.05)
In favour of PBM program
1, 1034 vs 1128 Ternstrom,
2014
Proportion of patients
that received RBC
transfusion
After PBM versus before
PBM
Not statistically significant:
1398/19477 vs 1579/20531
RR: 0.93, 95%CI [0.87;1.00]
(p>0.05)
1, 40008 (19477 vs 20531) Thakkar, 2016
Proportion of patients
receiving transfusion
with RBCs
After PBM versus before
PBM
Statistically significant:
258/551 vs 288/481
RR: 0.78, 95%CI [0.70;0.88]
(p<0.05)
In favour of PBM program
1, 1032 (551 vs 481) Xydas, 2012
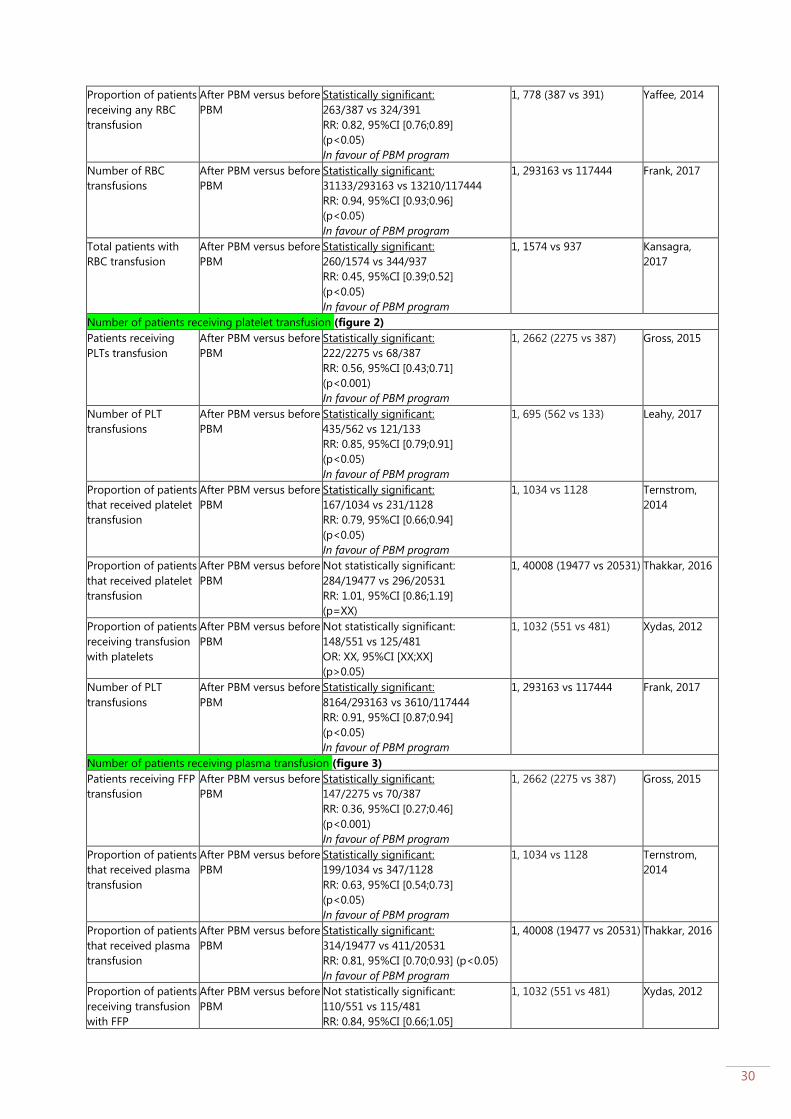
30
Proportion of patients
receiving any RBC
transfusion
After PBM versus before
PBM
Statistically significant:
263/387 vs 324/391
RR: 0.82, 95%CI [0.76;0.89]
(p<0.05)
In favour of PBM program
1, 778 (387 vs 391) Yaffee, 2014
Number of RBC
transfusions
After PBM versus before
PBM
Statistically significant:
31133/293163 vs 13210/117444
RR: 0.94, 95%CI [0.93;0.96]
(p<0.05)
In favour of PBM program
1, 293163 vs 117444 Frank, 2017
Total patients with
RBC transfusion
After PBM versus before
PBM
Statistically significant:
260/1574 vs 344/937
RR: 0.45, 95%CI [0.39;0.52]
(p<0.05)
In favour of PBM program
1, 1574 vs 937 Kansagra,
2017
Number of patients receiving platelet transfusion (figure 2)
Patients receiving
PLTs transfusion
After PBM versus before
PBM
Statistically significant:
222/2275 vs 68/387
RR: 0.56, 95%CI [0.43;0.71]
(p<0.001)
In favour of PBM program
1, 2662 (2275 vs 387)
Gross, 2015
Number of PLT
transfusions
After PBM versus before
PBM
Statistically significant:
435/562 vs 121/133
RR: 0.85, 95%CI [0.79;0.91]
(p<0.05)
In favour of PBM program
1, 695 (562 vs 133) Leahy, 2017
Proportion of patients
that received platelet
transfusion
After PBM versus before
PBM
Statistically significant:
167/1034 vs 231/1128
RR: 0.79, 95%CI [0.66;0.94]
(p<0.05)
In favour of PBM program
1, 1034 vs 1128 Ternstrom,
2014
Proportion of patients
that received platelet
transfusion
After PBM versus before
PBM
Not statistically significant:
284/19477 vs 296/20531
RR: 1.01, 95%CI [0.86;1.19]
(p=XX)
1, 40008 (19477 vs 20531) Thakkar, 2016
Proportion of patients
receiving transfusion
with platelets
After PBM versus before
PBM
Not statistically significant:
148/551 vs 125/481
OR: XX, 95%CI [XX;XX]
(p>0.05)
1, 1032 (551 vs 481) Xydas, 2012
Number of PLT
transfusions
After PBM versus before
PBM
Statistically significant:
8164/293163 vs 3610/117444
RR: 0.91, 95%CI [0.87;0.94]
(p<0.05)
In favour of PBM program
1, 293163 vs 117444 Frank, 2017
Number of patients receiving plasma transfusion (figure 3)
Patients receiving FFP
transfusion
After PBM versus before
PBM
Statistically significant:
147/2275 vs 70/387
RR: 0.36, 95%CI [0.27;0.46]
(p<0.001)
In favour of PBM program
1, 2662 (2275 vs 387)
Gross, 2015
Proportion of patients
that received plasma
transfusion
After PBM versus before
PBM
Statistically significant:
199/1034 vs 347/1128
RR: 0.63, 95%CI [0.54;0.73]
(p<0.05)
In favour of PBM program
1, 1034 vs 1128 Ternstrom,
2014
Proportion of patients
that received plasma
transfusion
After PBM versus before
PBM
Statistically significant:
314/19477 vs 411/20531
RR: 0.81, 95%CI [0.70;0.93] (p<0.05)
In favour of PBM program
1, 40008 (19477 vs 20531) Thakkar, 2016
Proportion of patients
receiving transfusion
with FFP
After PBM versus before
PBM
Not statistically significant:
110/551 vs 115/481
RR: 0.84, 95%CI [0.66;1.05]
1, 1032 (551 vs 481) Xydas, 2012

31
(p>0.05)
Number of plasma
transfusions
After PBM versus before
PBM
Statistically significant:
3371/293163 vs 7004/117444
RR: 0.19, 95%CI [0.19;0.20]
(p<0.05)
In favour of PBM program
1, 293163 vs 117444 Frank, 2017
Number of patients receiving cryoprecipitate transfusion (figure 4)
Proportion of patients
receiving transfusion
with cryoprecipitate
After PBM versus before
PBM
Statistically significant:
27/551 vs 76/481
RR: 0.31, 95%CI [0.20;0.47]
(p<0.05)
In favour of PBM program
1, 1032 (551 vs 481) Xydas, 2012
Number of patients receiving any transfusion (RBC, plasma or platelets) (figure 5)
Transfusion for total
hip/knee replacement
After PBM versus before
PBM
Statistically significant:
9/406 vs 107/717
RR: 0.15, 95%CI [0.08;0.29]
(p<0.05)
In favour of PBM program
1, 1123 (406 vs 717) Frew, 2016
Number of patients
who received
transfusions
After PBM versus before
PBM
Statistically significant:
6/100 vs 20/100
RR: 0.30, 95%CI [0.13;0.72]
(p<0.05)
In favour of PBM
1, 200 Kopanidis,
2016
Number of patients
who received
transfusions
After PBM versus before
PBM
Statistically significant:
5/167 vs 24/185
RR: 0.23, 95%CI [0.09;0.59]
(p<0.05)
In favour of PBM
1, 352 Rineau, 2016
Transfusion rate After PBM versus before
PBM
Statistically significant:
771/6593 vs 1253/5997
RR: 0.56, 95%CI [0.52;0.61]
(p<0.001)
In favour of PBM program
1, 12590 (6593 vs 5997) Loftus, 2016
Proportion of patients
that received
transfusion (RBC, FFP,
PLT)
After PBM versus before
PBM
Statistically significant:
499/1034 vs 686/1128
RR: 0.79, 95%CI [0.73;0.86]
(p<0.05)
In favour of PBM program
1, 1034 vs 1128 Ternstrom,
2014
Proportion of patients
receiving transfusion
with any blood
product use
After PBM versus before
PBM
Statistically significant:
292/551 vs 303/481
RR: 0.84, 95%CI [0.76;0.93]
(p<0.05)
In favour of PBM program
1, 1032 (551 vs 481) Xydas, 2012
Number of RBC units transfused (figure 6a and figure 6b)
RBC units per patients After PBM versus before
PBM
Statistically significant:
0.61±1.57 vs 1.28±2.34
MD: -0.67, 95%CI [-0.91;-0.43]
(p<0.001)
In favour of PBM program
1, 2662 (2275 vs 387)
Gross, 2015
RBC units per patient After PBM versus before
PBM
Statistically significant:
1.00±13.7 vs 1.21±11.6
MD: -0.21, 95%CI [-0.35;-0.07]
(p<0.001)
In favour of PBM program
1, 129719 (75206 vs
54513)
Meybohm,
2016
Number of RBC units
transfused
After PBM versus before
PBM
Statistically significant:
2.8±6.6 vs 3.6±7.5
MD: -0.80, 95%CI [-1.39;-0.21]
(p<0.05)
In favour of PBM program
1, 1034 vs 1128 Ternstrom,
2014
Allogeneic PRBCs After PBM versus before
PBM
Statistically significant:
1.5±2.2 vs 2.1±2.4
MD: -0.60, 95%CI [-0.88;-0.32]
1, 1032 (551 vs 481) Xydas, 2012

32
(p<0.05)
In favour of PBM program
RBCs After PBM versus before
PBM
Statistically significant:
2.9±4.3 vs 4.6±5.6
MD: -1.70, 95%CI [-2.40;-1.00]
(p<0.05)
In favour of PBM program
1, 778 (387 vs 391) Yaffee, 2014
RBC units transfused After PBM versus before
PBM
Not statistically significant:
5±8 vs 5±10
MD: 0, 95%CI [-0.38;0.38]
(p>0.05)
In favour of PBM program
1, 9243 (2927 vs 6316) Mehra, 2015
RBC units per
admission
After PBM versus before
PBM
Statistically significant:
0.112 (95%CI: 0.109-0.114) vs 0.083
(95%CI: 0.081-0.085)
MD: 0.029 (p<0.001)
In favour of PBM program
1, 127247 (69.920 vs
57.327)
Leahy, 2014
Proportion of 2-unit
RBC use per
admission
After PBM versus before
PBM
Statistically significant:
25.870/69.920 vs 27.516/57.327
RR: 0.87, 95%CI [0.86;0.88]
(p<0.001)
In favour of PBM program
1, 127.247 (69.920 vs
57.327)
Leahy, 2014
Proportion of ≥3-unit
RBC use per
admission
After PBM versus before
PBM
Statistically significant:
23.772/69.920 vs 22.357/57.327
RR: 0.77, 95%CI [0.76;0.78]
(p<0.001)
In favour of PBM program
1, 127.247 (69.920 vs
57.327)
Leahy, 2014
Number of RBC units
transfused
After PBM versus before
PBM
Statistically significant:
No raw data available
RR: 0.59, 95%CI [0.58;0.60]
(p<0.001)
In favour of PBM program
1, 493 (182 vs 311) Leahy, 2017
(2)
RBC units per 1000
patients
After PBM versus before
PBM
Statistically significant:
262.51/1000 vs 447.48/1000
RR: 0.59, 95%CI [0.52;0.66]
(p<0.0001)
In favour of PBM program
1, 12590 (6593 vs 5997) Loftus, 2016
Number of RBC units
per patient
After PBM versus before
PBM
Statistically significant:
0.217 vs 0.247 (p=0.035)
In favour of PBM program
1, 40008 (19477 vs 20531) Thakkar, 2016
Number of RBC units
transfused
After PBM versus before
PBM
Statistically significant:
No raw data available
29.9% decrease (p=0.002)
In favour of PBM program
1, ~60000 (year 9) vs
~80000
Verdecchia,
2016
RBC units per patient After PBM versus before
PBM
Statistically significant:
3.5±4.9 vs 4.0±6.5
MD: -0.50, 95%CI [-0.54;-0.46]
(p<0.0001)
In favour of PBM program
1, 293163 vs 117444 Frank, 2017
Proportion of ≥1 RBC-
unit transfusions
After PBM versus before
PBM
Statistically significant:
6593/8664 vs 6785/8450
RR: 0.95, 95%CI [0.93;0.96]
(p<0.001)
In favour of PBM program
1, 8664 vs 8450 Gani, 2017
Proportion of 2 RBC-
unit transfusions
After PBM versus before
PBM
Statistically significant:
2434/8664 vs 2560/8450
RR: 0.93, 95%CI [0.88;0.97]
(p<0.001)
In favour of PBM program
1, 8664 vs 8450 Gani, 2017
RBC units transfused
per 1000 patients
After PBM versus before
PBM
Statistically significant:
270/1000 vs 626/1000
RR: 0.43, 95%CI [0.39;0.48]
1, 1574 vs 937 Kansagra,
2017
33
(p<0.001)
In favour of PBM program
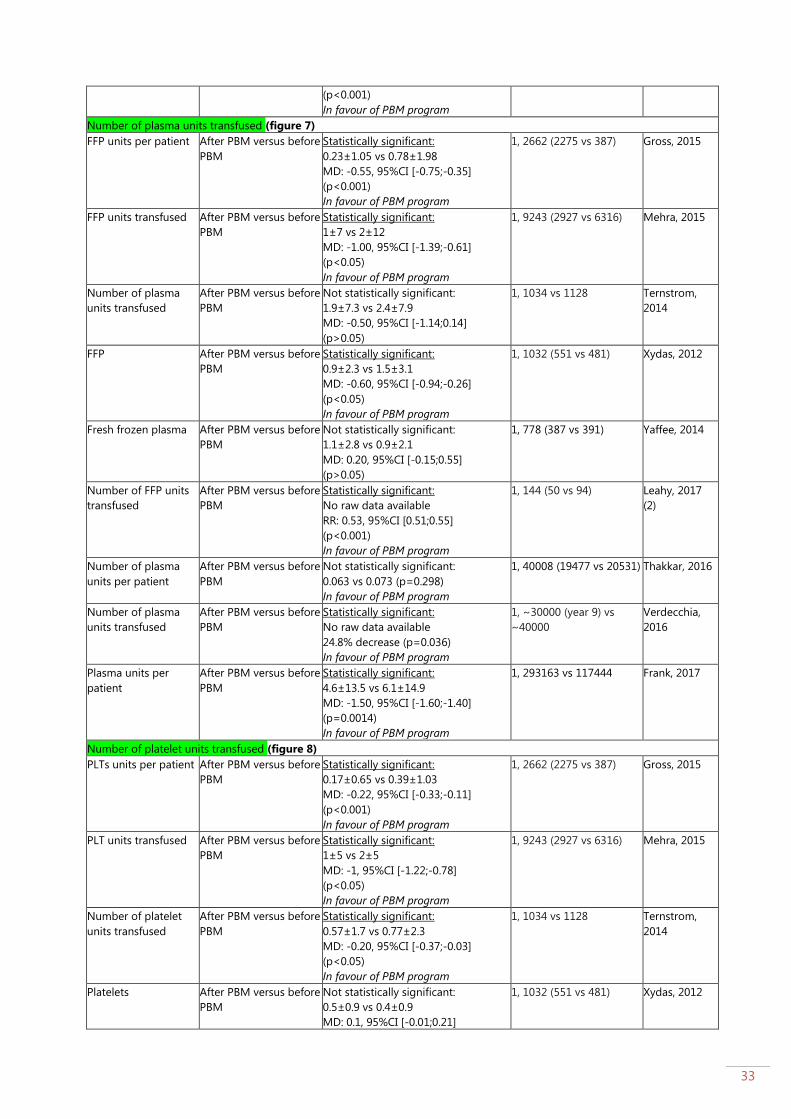
Number of plasma units transfused (figure 7)
FFP units per patient After PBM versus before
PBM
Statistically significant:
0.23±1.05 vs 0.78±1.98
MD: -0.55, 95%CI [-0.75;-0.35]
(p<0.001)
In favour of PBM program
1, 2662 (2275 vs 387)
Gross, 2015
FFP units transfused After PBM versus before
PBM
Statistically significant:
1±7 vs 2±12
MD: -1.00, 95%CI [-1.39;-0.61]
(p<0.05)
In favour of PBM program
1, 9243 (2927 vs 6316) Mehra, 2015
Number of plasma
units transfused
After PBM versus before
PBM
Not statistically significant:
1.9±7.3 vs 2.4±7.9
MD: -0.50, 95%CI [-1.14;0.14]
(p>0.05)
1, 1034 vs 1128 Ternstrom,
2014
FFP After PBM versus before
PBM
Statistically significant:
0.9±2.3 vs 1.5±3.1
MD: -0.60, 95%CI [-0.94;-0.26]
(p<0.05)
In favour of PBM program
1, 1032 (551 vs 481) Xydas, 2012
Fresh frozen plasma After PBM versus before
PBM
Not statistically significant:
1.1±2.8 vs 0.9±2.1
MD: 0.20, 95%CI [-0.15;0.55]
(p>0.05)
1, 778 (387 vs 391) Yaffee, 2014
Number of FFP units
transfused
After PBM versus before
PBM
Statistically significant:
No raw data available
RR: 0.53, 95%CI [0.51;0.55]
(p<0.001)
In favour of PBM program
1, 144 (50 vs 94) Leahy, 2017
(2)
Number of plasma
units per patient
After PBM versus before
PBM
Not statistically significant:
0.063 vs 0.073 (p=0.298)
In favour of PBM program
1, 40008 (19477 vs 20531) Thakkar, 2016
Number of plasma
units transfused
After PBM versus before
PBM
Statistically significant:
No raw data available
24.8% decrease (p=0.036)
In favour of PBM program
1, ~30000 (year 9) vs
~40000
Verdecchia,
2016
Plasma units per
patient
After PBM versus before
PBM
Statistically significant:
4.6±13.5 vs 6.1±14.9
MD: -1.50, 95%CI [-1.60;-1.40]
(p=0.0014)
In favour of PBM program
1, 293163 vs 117444 Frank, 2017
Number of platelet units transfused (figure 8)
PLTs units per patient After PBM versus before
PBM
Statistically significant:
0.17±0.65 vs 0.39±1.03
MD: -0.22, 95%CI [-0.33;-0.11]
(p<0.001)
In favour of PBM program
1, 2662 (2275 vs 387)
Gross, 2015
PLT units transfused After PBM versus before
PBM
Statistically significant:
1±5 vs 2±5
MD: -1, 95%CI [-1.22;-0.78]
(p<0.05)
In favour of PBM program
1, 9243 (2927 vs 6316) Mehra, 2015
Number of platelet
units transfused
After PBM versus before
PBM
Statistically significant:
0.57±1.7 vs 0.77±2.3
MD: -0.20, 95%CI [-0.37;-0.03]
(p<0.05)
In favour of PBM program
1, 1034 vs 1128 Ternstrom,
2014
Platelets After PBM versus before
PBM
Not statistically significant:
0.5±0.9 vs 0.4±0.9
MD: 0.1, 95%CI [-0.01;0.21]
1, 1032 (551 vs 481) Xydas, 2012
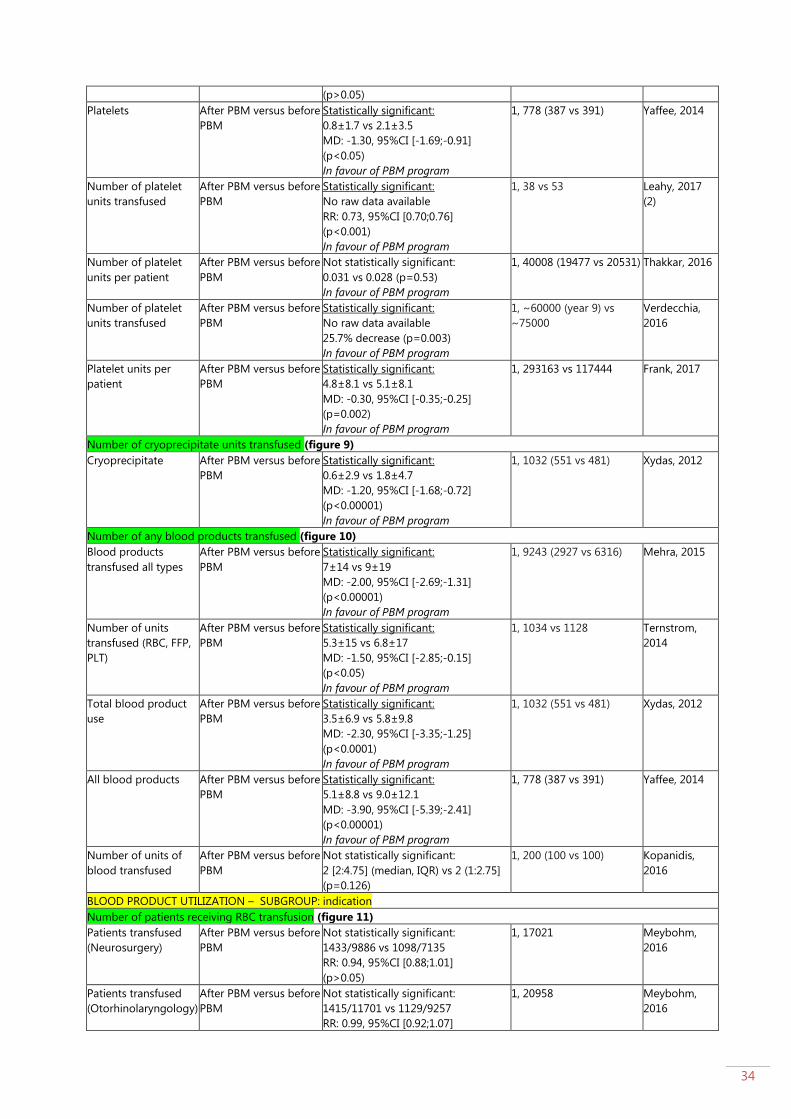
34
(p>0.05)
Platelets After PBM versus before
PBM
Statistically significant:
0.8±1.7 vs 2.1±3.5
MD: -1.30, 95%CI [-1.69;-0.91]
(p<0.05)
In favour of PBM program
1, 778 (387 vs 391) Yaffee, 2014
Number of platelet
units transfused
After PBM versus before
PBM
Statistically significant:
No raw data available
RR: 0.73, 95%CI [0.70;0.76]
(p<0.001)
In favour of PBM program
1, 38 vs 53 Leahy, 2017
(2)
Number of platelet
units per patient
After PBM versus before
PBM
Not statistically significant:
0.031 vs 0.028 (p=0.53)
In favour of PBM program
1, 40008 (19477 vs 20531) Thakkar, 2016
Number of platelet
units transfused
After PBM versus before
PBM
Statistically significant:
No raw data available
25.7% decrease (p=0.003)
In favour of PBM program
1, ~60000 (year 9) vs
~75000
Verdecchia,
2016
Platelet units per
patient
After PBM versus before
PBM
Statistically significant:
4.8±8.1 vs 5.1±8.1
MD: -0.30, 95%CI [-0.35;-0.25]
(p=0.002)
In favour of PBM program
1, 293163 vs 117444 Frank, 2017
Number of cryoprecipitate units transfused (figure 9)
Cryoprecipitate After PBM versus before
PBM
Statistically significant:
0.6±2.9 vs 1.8±4.7
MD: -1.20, 95%CI [-1.68;-0.72]
(p<0.00001)
In favour of PBM program
1, 1032 (551 vs 481) Xydas, 2012
Number of any blood products transfused (figure 10)
Blood products
transfused all types
After PBM versus before
PBM
Statistically significant:
7±14 vs 9±19
MD: -2.00, 95%CI [-2.69;-1.31]
(p<0.00001)
In favour of PBM program
1, 9243 (2927 vs 6316) Mehra, 2015
Number of units
transfused (RBC, FFP,
PLT)
After PBM versus before
PBM
Statistically significant:
5.3±15 vs 6.8±17
MD: -1.50, 95%CI [-2.85;-0.15]
(p<0.05)
In favour of PBM program
1, 1034 vs 1128 Ternstrom,
2014
Total blood product
use
After PBM versus before
PBM
Statistically significant:
3.5±6.9 vs 5.8±9.8
MD: -2.30, 95%CI [-3.35;-1.25]
(p<0.0001)
In favour of PBM program
1, 1032 (551 vs 481) Xydas, 2012
All blood products After PBM versus before
PBM
Statistically significant:
5.1±8.8 vs 9.0±12.1
MD: -3.90, 95%CI [-5.39;-2.41]
(p<0.00001)
In favour of PBM program
1, 778 (387 vs 391) Yaffee, 2014
Number of units of
blood transfused
After PBM versus before
PBM
Not statistically significant:
2 [2:4.75] (median, IQR) vs 2 (1:2.75]
(p=0.126)
1, 200 (100 vs 100) Kopanidis,
2016
BLOOD PRODUCT UTILIZATION – SUBGROUP: indication
Number of patients receiving RBC transfusion (figure 11)
Patients transfused
(Neurosurgery)
After PBM versus before
PBM
Not statistically significant:
1433/9886 vs 1098/7135
RR: 0.94, 95%CI [0.88;1.01]
(p>0.05)
1, 17021 Meybohm,
2016
Patients transfused
(Otorhinolaryngology)
After PBM versus before
PBM
Not statistically significant:
1415/11701 vs 1129/9257
RR: 0.99, 95%CI [0.92;1.07]
1, 20958 Meybohm,
2016

35
(p>0.05)
Patients transfused
(Thoracic)
After PBM versus before
PBM
Not statistically significant:
1145/2609 vs 881/1951
RR: 0.97, 95%CI [0.91;1.04]
(p>0.05)
1, 4560 Meybohm,
2016
Patients transfused
(Cardiac)
After PBM versus before
PBM
Statistically significant:
4038/7904 vs 3406/5630
RR: 0.84, 95%CI [0.82;0.87]
(p<0.05)
In favour of PBM program
1, 13534 Meybohm,
2016
Patients transfused
(Vascular)
After PBM versus before
PBM
Statistically significant:
2090/5823 vs 1755/4377
RR: 0.90, 95%CI [0.85;0.94]
(p<0.05)
In favour of PBM program
1, 10200 Meybohm,
2016
Patients transfused
(Visceral and
endocrine)
After PBM versus before
PBM
Statistically significant:
2838/13649 vs 2052/9164
RR: 0.93, 95%CI [0.88;0.98]
(p<0.05)
In favour of PBM program
1, 22813 Meybohm,
2016
Patients transfused
(Urology)
After PBM versus before
PBM
Statistically significant:
999/7243 vs 800/4791
RR: 0.83, 95%CI [0.76;0.90]
(p<0.05)
In favour of PBM program
1, 12034 Meybohm,
2016
Patients transfused
(Gynaecology)
After PBM versus before
PBM
Not statistically significant:
279/5174 vs 213/4029
RR: 1.02, 95%CI [0.86;1.21]
(p>0.05)
1, 9203 Meybohm,
2016
Patients transfused
(Obstetric)
After PBM versus before
PBM
Not statistically significant:
138/6308 vs 111/4145
RR: 0.82, 95%CI [0.64;1.05]
(p>0.05)
1, 10453 Meybohm,
2016
Patients transfused
(Oral and
maxillofacial)
After PBM versus before
PBM
Not statistically significant:
136/3105 vs 118/2361
RR: 0.88, 95%CI [0.69;1.11]
(p>0.05)
1, 5466 Meybohm,
2016
Patients transfused
(Trauma/Orthopedic)
After PBM versus before
PBM
Statistically significant:
2852/16298 vs 2438/12633
RR: 0.91, 95%CI [0.86;0.95]
(p<0.05)
In favour of PBM program
1, 28931 Meybohm,
2016
Proportion of
admissions receiving
RBC transfusion
(Cardiothoracic
surgery)
After PBM versus before
PBM
Statistically significant:
34/266 vs 81/295
RR: 0.47, 95%CI [0.32;0.67]
(p<0.05)
In favour of PBM program
1, 561 (266 vs 295) Leahy, 2014
Proportion of
admissions receiving
RBC transfusion
(Gastroenterology)
After PBM versus before
PBM
Statistically significant:
27/3980 vs 11/3778
RR: 2.33, 95%CI [1.16;4.69]
(p<0.05)
In favour of no PBM program
1, 7758 (3980 vs 3778) Leahy, 2014
Proportion of
admissions receiving
RBC transfusion
(General surgery)
After PBM versus before
PBM
Not statistically significant:
56/1276 vs 61/1853
RR: 1.33, 95%CI [0.93;1.90]
(p>0.05)
1, 3129 (1276 vs 1853) Leahy, 2014
Proportion of
admissions receiving
RBC transfusion
(Gerontology)
After PBM versus before
PBM
Not statistically significant:
12/753 vs 20/777
RR: 0.62, 95%CI [0.30;1.26]
(p>0.05)
1, 1530 (753 vs 777) Leahy, 2014
Proportion of
admissions receiving
After PBM versus before
PBM
Statistically significant:
478/2238 vs 263/1997
1, 4235 (2238 vs 1997) Leahy, 2014
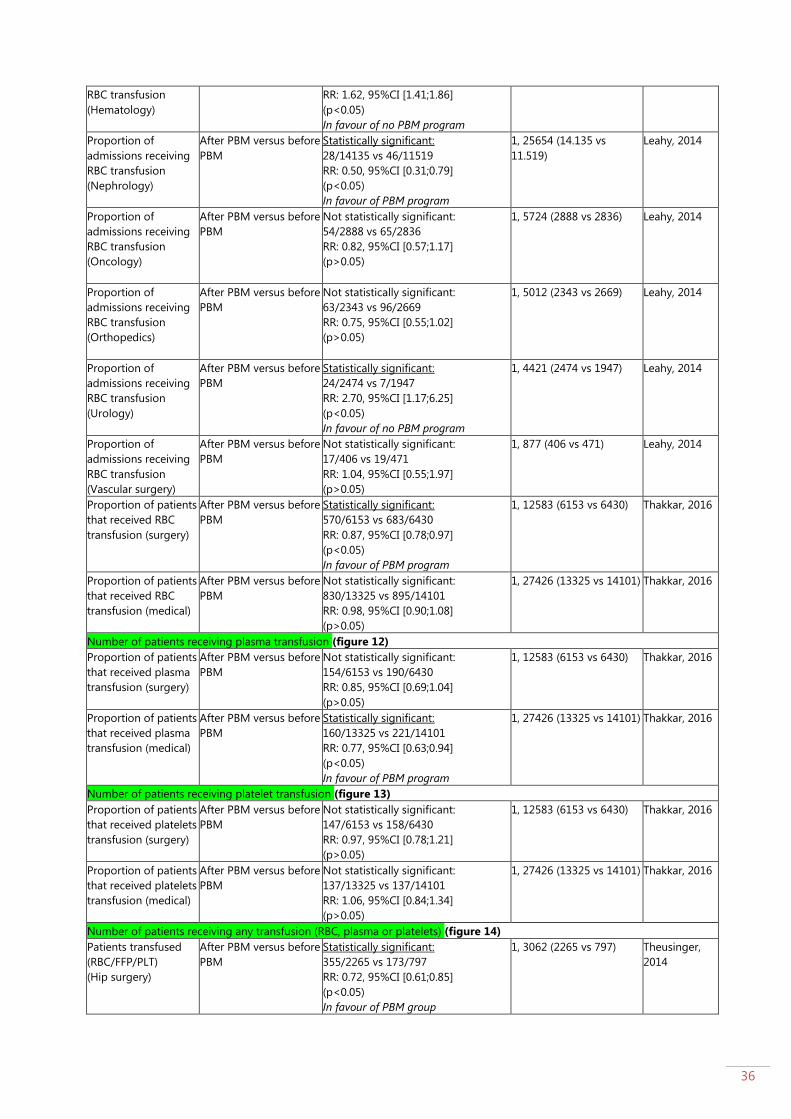
36
RBC transfusion
(Hematology)
RR: 1.62, 95%CI [1.41;1.86]
(p<0.05)
In favour of no PBM program
Proportion of
admissions receiving
RBC transfusion
(Nephrology)
After PBM versus before
PBM
Statistically significant:
28/14135 vs 46/11519
RR: 0.50, 95%CI [0.31;0.79]
(p<0.05)
In favour of PBM program
1, 25654 (14.135 vs
11.519)
Leahy, 2014
Proportion of
admissions receiving
RBC transfusion
(Oncology)
After PBM versus before
PBM
Not statistically significant:
54/2888 vs 65/2836
RR: 0.82, 95%CI [0.57;1.17]
(p>0.05)
1, 5724 (2888 vs 2836) Leahy, 2014
Proportion of
admissions receiving
RBC transfusion
(Orthopedics)
After PBM versus before
PBM
Not statistically significant:
63/2343 vs 96/2669
RR: 0.75, 95%CI [0.55;1.02]
(p>0.05)
1, 5012 (2343 vs 2669) Leahy, 2014
Proportion of
admissions receiving
RBC transfusion
(Urology)
After PBM versus before
PBM
Statistically significant:
24/2474 vs 7/1947
RR: 2.70, 95%CI [1.17;6.25]
(p<0.05)
In favour of no PBM program
1, 4421 (2474 vs 1947) Leahy, 2014
Proportion of
admissions receiving
RBC transfusion
(Vascular surgery)
After PBM versus before
PBM
Not statistically significant:
17/406 vs 19/471
RR: 1.04, 95%CI [0.55;1.97]
(p>0.05)
1, 877 (406 vs 471) Leahy, 2014
Proportion of patients
that received RBC
transfusion (surgery)
After PBM versus before
PBM
Statistically significant:
570/6153 vs 683/6430
RR: 0.87, 95%CI [0.78;0.97]
(p<0.05)
In favour of PBM program
1, 12583 (6153 vs 6430) Thakkar, 2016
Proportion of patients
that received RBC
transfusion (medical)
After PBM versus before
PBM
Not statistically significant:
830/13325 vs 895/14101
RR: 0.98, 95%CI [0.90;1.08]
(p>0.05)
1, 27426 (13325 vs 14101) Thakkar, 2016
Number of patients receiving plasma transfusion (figure 12)
Proportion of patients
that received plasma
transfusion (surgery)
After PBM versus before
PBM
Not statistically significant:
154/6153 vs 190/6430
RR: 0.85, 95%CI [0.69;1.04]
(p>0.05)
1, 12583 (6153 vs 6430) Thakkar, 2016
Proportion of patients
that received plasma
transfusion (medical)
After PBM versus before
PBM
Statistically significant:
160/13325 vs 221/14101
RR: 0.77, 95%CI [0.63;0.94]
(p<0.05)
In favour of PBM program
1, 27426 (13325 vs 14101) Thakkar, 2016
Number of patients receiving platelet transfusion (figure 13)
Proportion of patients
that received platelets
transfusion (surgery)
After PBM versus before
PBM
Not statistically significant:
147/6153 vs 158/6430
RR: 0.97, 95%CI [0.78;1.21]
(p>0.05)
1, 12583 (6153 vs 6430) Thakkar, 2016
Proportion of patients
that received platelets
transfusion (medical)
After PBM versus before
PBM
Not statistically significant:
137/13325 vs 137/14101
RR: 1.06, 95%CI [0.84;1.34]
(p>0.05)
1, 27426 (13325 vs 14101) Thakkar, 2016
Number of patients receiving any transfusion (RBC, plasma or platelets) (figure 14)
Patients transfused
(RBC/FFP/PLT)
(Hip surgery)
After PBM versus before
PBM
Statistically significant:
355/2265 vs 173/797
RR: 0.72, 95%CI [0.61;0.85]
(p<0.05)
In favour of PBM group
1, 3062 (2265 vs 797) Theusinger,
2014
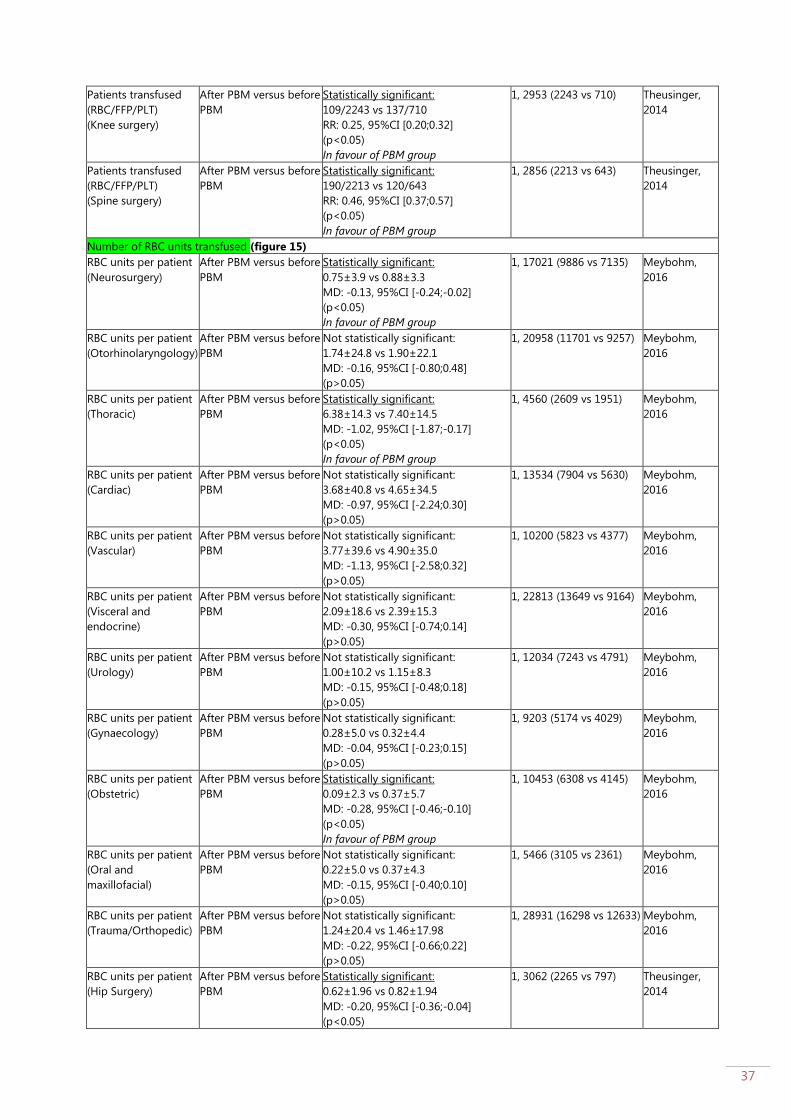
37
Patients transfused
(RBC/FFP/PLT)
(Knee surgery)
After PBM versus before
PBM
Statistically significant:
109/2243 vs 137/710
RR: 0.25, 95%CI [0.20;0.32]
(p<0.05)
In favour of PBM group
1, 2953 (2243 vs 710) Theusinger,
2014
Patients transfused
(RBC/FFP/PLT)
(Spine surgery)
After PBM versus before
PBM
Statistically significant:
190/2213 vs 120/643
RR: 0.46, 95%CI [0.37;0.57]
(p<0.05)
In favour of PBM group
1, 2856 (2213 vs 643) Theusinger,
2014
Number of RBC units transfused (figure 15)
RBC units per patient
(Neurosurgery)
After PBM versus before
PBM
Statistically significant:
0.75±3.9 vs 0.88±3.3
MD: -0.13, 95%CI [-0.24;-0.02]
(p<0.05)
In favour of PBM group
1, 17021 (9886 vs 7135) Meybohm,
2016
RBC units per patient
(Otorhinolaryngology)
After PBM versus before
PBM
Not statistically significant:
1.74±24.8 vs 1.90±22.1
MD: -0.16, 95%CI [-0.80;0.48]
(p>0.05)
1, 20958 (11701 vs 9257) Meybohm,
2016
RBC units per patient
(Thoracic)
After PBM versus before
PBM
Statistically significant:
6.38±14.3 vs 7.40±14.5
MD: -1.02, 95%CI [-1.87;-0.17]
(p<0.05)
In favour of PBM group
1, 4560 (2609 vs 1951) Meybohm,
2016
RBC units per patient
(Cardiac)
After PBM versus before
PBM
Not statistically significant:
3.68±40.8 vs 4.65±34.5
MD: -0.97, 95%CI [-2.24;0.30]
(p>0.05)
1, 13534 (7904 vs 5630) Meybohm,
2016
RBC units per patient
(Vascular)
After PBM versus before
PBM
Not statistically significant:
3.77±39.6 vs 4.90±35.0
MD: -1.13, 95%CI [-2.58;0.32]
(p>0.05)
1, 10200 (5823 vs 4377) Meybohm,
2016
RBC units per patient
(Visceral and
endocrine)
After PBM versus before
PBM
Not statistically significant:
2.09±18.6 vs 2.39±15.3
MD: -0.30, 95%CI [-0.74;0.14]
(p>0.05)
1, 22813 (13649 vs 9164) Meybohm,
2016
RBC units per patient
(Urology)
After PBM versus before
PBM
Not statistically significant:
1.00±10.2 vs 1.15±8.3
MD: -0.15, 95%CI [-0.48;0.18]
(p>0.05)
1, 12034 (7243 vs 4791) Meybohm,
2016
RBC units per patient
(Gynaecology)
After PBM versus before
PBM
Not statistically significant:
0.28±5.0 vs 0.32±4.4
MD: -0.04, 95%CI [-0.23;0.15]
(p>0.05)
1, 9203 (5174 vs 4029) Meybohm,
2016
RBC units per patient
(Obstetric)
After PBM versus before
PBM
Statistically significant:
0.09±2.3 vs 0.37±5.7
MD: -0.28, 95%CI [-0.46;-0.10]
(p<0.05)
In favour of PBM group
1, 10453 (6308 vs 4145) Meybohm,
2016
RBC units per patient
(Oral and
maxillofacial)
After PBM versus before
PBM
Not statistically significant:
0.22±5.0 vs 0.37±4.3
MD: -0.15, 95%CI [-0.40;0.10]
(p>0.05)
1, 5466 (3105 vs 2361) Meybohm,
2016
RBC units per patient
(Trauma/Orthopedic)
After PBM versus before
PBM
Not statistically significant:
1.24±20.4 vs 1.46±17.98
MD: -0.22, 95%CI [-0.66;0.22]
(p>0.05)
1, 28931 (16298 vs 12633) Meybohm,
2016
RBC units per patient
(Hip Surgery)
After PBM versus before
PBM
Statistically significant:
0.62±1.96 vs 0.82±1.94
MD: -0.20, 95%CI [-0.36;-0.04]
(p<0.05)
1, 3062 (2265 vs 797) Theusinger,
2014

38
In favour of PBM group
RBC units per patient
(Knee surgery)
After PBM versus before
PBM
Statistically significant:
0.16±0.90 vs 0.53±1.27
MD: -0.37, 95%CI [-0.47;-0.27]
(p<0.05)
In favour of PBM group
1, 2953 (2243 vs 710) Theusinger,
2014
RBC units per patient
(Spine surgery)
After PBM versus before
PBM
Statistically significant:
0.22±0.89 vs 0.66±1.80
MD: -0.44, 95%CI [-0.58;-0.30]
(p<0.05)
In favour of PBM group
1, 2856 (2213 vs 643) Theusinger,
2014
MORBIDITY (composite measures) (figure 16)
Postoperative
complication (transient
ischemic attacks,
cerebrovascular accidents,
myocardial infarctions,
ventilator-associated
pneumonia,
urinary tract infections,
surgical site infections,
sepsis, drug-resistant
infections, Clostridium
difficile infections, deep
venous thrombosis,
pulmonary embolism,
disseminated intravascular
coagulation,
and acute renal failure)
After PBM versus before
PBM
Statistically significant:
1240/8664 vs 1382/8450
OR: 0.85, 95%CI [0.79;0.93]
(p<0.05)
In favour of PBM group
1, 8664 vs 8450 Gani, 2017
In-hospital
complications
(cardiac, vascular,
acute kidney injury,
respiratory,
neurologic, digestive)
After PBM versus before
PBM
Not statistically significant
14/183 vs 11/184
OR: 1.30, 95%CI [0.58;2.95]
(p>0.05)
1, 367 Rineau, 2016
In-hospital
complications (death,
myocardial infarction,
ischemic stroke, acute
renal failure,
pneumonia, sepsis)
After PBM versus before
PBM
Not statistically significant
4768/75206 vs 3559/54513
Adjusted OR: 0.96, 95%CI [0.92;1.00]
(p=0.079)
1, 129719 Meybohm,
2016
Major post-operative
complications (acute
coronary syndrome,
exacerbation of
chronic lung disease,
exacerbation of heart
failure, acute kidney
injury, pulmonary
embolism, narcotised
from analgesia)
After PBM versus before
PBM
Not statistically significant:
7/100 vs 5/100
OR: 1.43, 95%CI [0.44;4.67] (p>0.05)
1, 200 Kopanidis,
2016
Any morbidity
(infection, thrombotic
event, kidney injury,
respiratory event,
ischemic event)
After PBM versus before
PBM
Not statistically significant:
205/19477 vs 207/20531
OR: 1.04, 95%CI [0.86;1.27] (p>0.05)
1, 40008 (19477 vs 20531) Thakkar, 2016
Major complications
(death, renal failure
requiring dialysis,
respiratory failure,
sepsis)
After PBM versus before
PBM
Not statistically significant:
42/387 vs 35/391
OR: 1.24, 95%CI [0.77;1.99] (p>0.05)
1, 778 (387 vs 391) Yaffee, 2014
MORBIDITY (composite measures) – SUBGROUP: indication (figure 17)
In-hospital
complications
(Neurosurgery)
After PBM versus before
PBM
Not statistically significant:
948/9886 vs 642/7135
Adjusted OR: 1.05, 95%CI [0.95;1.17]
1, 17021 Meybohm,
2016
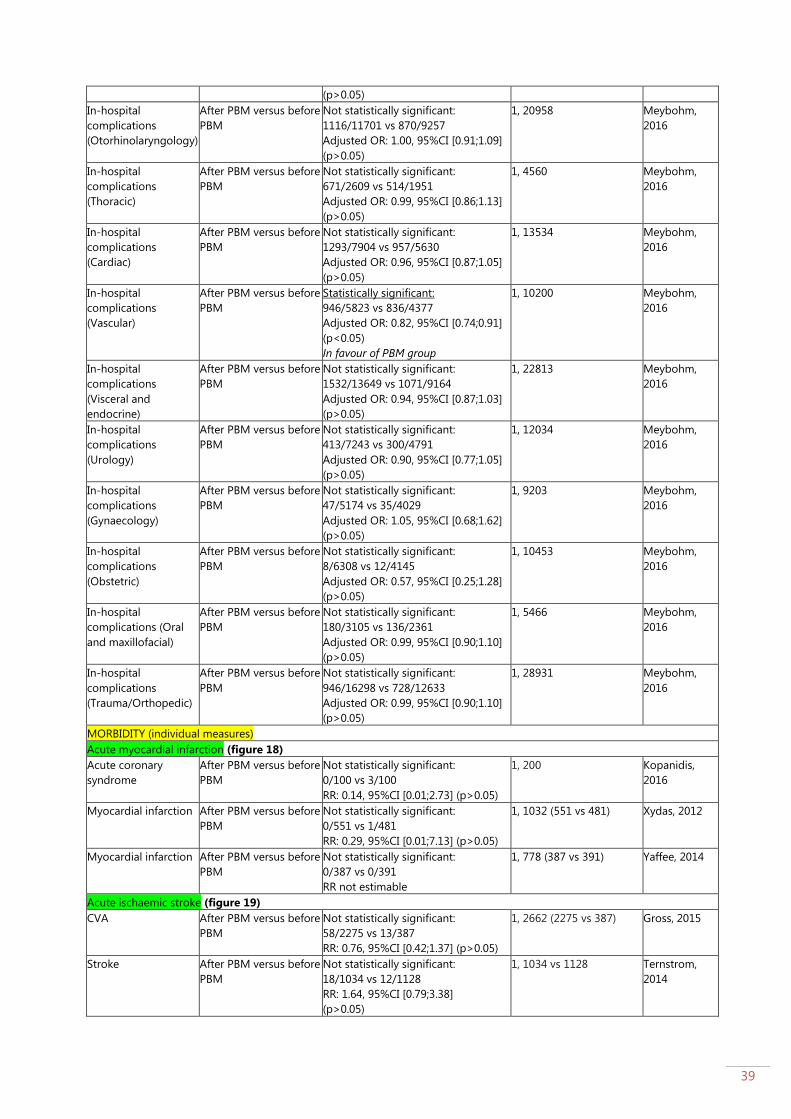
39
(p>0.05)
In-hospital
complications
(Otorhinolaryngology)
After PBM versus before
PBM
Not statistically significant:
1116/11701 vs 870/9257
Adjusted OR: 1.00, 95%CI [0.91;1.09]
(p>0.05)
1, 20958 Meybohm,
2016
In-hospital
complications
(Thoracic)
After PBM versus before
PBM
Not statistically significant:
671/2609 vs 514/1951
Adjusted OR: 0.99, 95%CI [0.86;1.13]
(p>0.05)
1, 4560 Meybohm,
2016
In-hospital
complications
(Cardiac)
After PBM versus before
PBM
Not statistically significant:
1293/7904 vs 957/5630
Adjusted OR: 0.96, 95%CI [0.87;1.05]
(p>0.05)
1, 13534 Meybohm,
2016
In-hospital
complications
(Vascular)
After PBM versus before
PBM
Statistically significant:
946/5823 vs 836/4377
Adjusted OR: 0.82, 95%CI [0.74;0.91]
(p<0.05)
In favour of PBM group
1, 10200 Meybohm,
2016
In-hospital
complications
(Visceral and
endocrine)
After PBM versus before
PBM
Not statistically significant:
1532/13649 vs 1071/9164
Adjusted OR: 0.94, 95%CI [0.87;1.03]
(p>0.05)
1, 22813 Meybohm,
2016
In-hospital
complications
(Urology)
After PBM versus before
PBM
Not statistically significant:
413/7243 vs 300/4791
Adjusted OR: 0.90, 95%CI [0.77;1.05]
(p>0.05)
1, 12034 Meybohm,
2016
In-hospital
complications
(Gynaecology)
After PBM versus before
PBM
Not statistically significant:
47/5174 vs 35/4029
Adjusted OR: 1.05, 95%CI [0.68;1.62]
(p>0.05)
1, 9203 Meybohm,
2016
In-hospital
complications
(Obstetric)
After PBM versus before
PBM
Not statistically significant:
8/6308 vs 12/4145
Adjusted OR: 0.57, 95%CI [0.25;1.28]
(p>0.05)
1, 10453 Meybohm,
2016
In-hospital
complications (Oral
and maxillofacial)
After PBM versus before
PBM
Not statistically significant:
180/3105 vs 136/2361
Adjusted OR: 0.99, 95%CI [0.90;1.10]
(p>0.05)
1, 5466 Meybohm,
2016
In-hospital
complications
(Trauma/Orthopedic)
After PBM versus before
PBM
Not statistically significant:
946/16298 vs 728/12633
Adjusted OR: 0.99, 95%CI [0.90;1.10]
(p>0.05)
1, 28931 Meybohm,
2016
MORBIDITY (individual measures)
Acute myocardial infarction (figure 18)
Acute coronary
syndrome
After PBM versus before
PBM
Not statistically significant:
0/100 vs 3/100
RR: 0.14, 95%CI [0.01;2.73] (p>0.05)
1, 200 Kopanidis,
2016
Myocardial infarction After PBM versus before
PBM
Not statistically significant:
0/551 vs 1/481
RR: 0.29, 95%CI [0.01;7.13] (p>0.05)
1, 1032 (551 vs 481) Xydas, 2012
Myocardial infarction After PBM versus before
PBM
Not statistically significant:
0/387 vs 0/391
RR not estimable
1, 778 (387 vs 391) Yaffee, 2014
Acute ischaemic stroke (figure 19)
CVA After PBM versus before
PBM
Not statistically significant:
58/2275 vs 13/387
RR: 0.76, 95%CI [0.42;1.37] (p>0.05)
1, 2662 (2275 vs 387)
Gross, 2015
Stroke After PBM versus before
PBM
Not statistically significant:
18/1034 vs 12/1128
RR: 1.64, 95%CI [0.79;3.38]
(p>0.05)
1, 1034 vs 1128 Ternstrom,
2014

40
Transient ischemic
attack
After PBM versus before
PBM
Not statistically significant:
4/551 vs 3/481
RR: 1.16, 95%CI [0.26;5.17] (p>0.05)
1, 1032 (551 vs 481) Xydas, 2012
Stroke After PBM versus before
PBM
Not statistically significant:
12/387 vs 12/391
RR: 1.01, 95%CI [0.46;2.22] (p>0.05)
1, 778 (387 vs 391) Yaffee, 2014
Acute kidney injury (figure 20)
Kidney injury After PBM versus before
PBM
Not statistically significant:
113/2275 vs 29/387
RR: 0.66, 95%CI [0.45;0.98] (p<0.05)
1, 2662 (2275 vs 387)
Gross, 2015
Acute kidney injury After PBM versus before
PBM
Not statistically significant:
2/100 vs 1/100
RR: 2.00, 95%CI [0.18;21.71] (p<0.05)
1, 200 Kopanidis,
2016
Renal failure After PBM versus before
PBM
Not statistically significant:
17/551 vs 15/481
RR: 0.99, 95%CI [0.50;1.96] (p>0.05)
1, 1032 (551 vs 481) Xydas, 2012
Renal failure requiring
dialysis
After PBM versus before
PBM
Not statistically significant:
16/387 vs 13/391
RR: 1.24, 95%CI [0.61;2.55] (p>0.05)
1, 778 (387 vs 391) Yaffee, 2014
MORTALITY (individual measures)
Hospital mortality (figure 21)
In-hospital mortality After PBM versus before
PBM
Not statistically significant:
0/183 vs 1/184
OR: 0.33, 95%CI [0.01;8.24]
(p>0.05)
1, 367 (183 vs 184) Rineau, 2016
In-hospital mortality After PBM versus before
PBM
Not statistically significant:
124/8664 vs 109/8450
OR: 1.11, 95%CI [0.86;1.44]
(p<0.05)
1, 8664 vs 8450 Gani, 2017
In-hospital mortality After PBM versus before
PBM
Not statistically significant:
100/2275 vs 15/387
OR: 1.14, 95%CI [0.66;1.98] (p>0.05)
1, 2662 (2275 vs 387)
Gross, 2015
In-hospital mortality After PBM versus before
PBM
Not statistically significant:
11/562 vs 7/133
Adjusted OR: 0.31, 95%CI [0.06;1.56]
(p=0.154)
1, 695 (562 vs 133) Leahy, 2017
Hospital mortality After PBM versus before
PBM
Not statistically significant:
348/6316 vs 748/2927
OR: XX, 95%CI [XX;XX] (p=XX)
1, 9243 (6316 vs 2927) Mehra, 2015
Hospital mortality After PBM versus before
PBM
Not statistically significant:
5/551 vs 4/481
OR: 1.09, 95%CI [0.29;4.09] (p>0.05)
1, 1032 (551 vs 481) Xydas, 2012
Hospital mortality After PBM versus before
PBM
Not statistically significant:
13/387 vs 10/391
OR: 1.32, 95%CI [0.57;3.06] (p>0.05)
1, 778 (387 vs 391) Yaffee, 2014
Mortality – not specified (figure 22)
Mortality After PBM versus before
PBM
Not statistically significant:
0/100 vs 0/100
RR: not estimable
1, 200 (100 vs 100) Kopanidis,
2016
Mortality After PBM versus before
PBM
Not statistically significant:
8/5997 vs 15/6593
RR: 0.59, 95%CI [0.25;1.38] (p>0.05)
1, 12590 (5997 vs 6593) Loftus, 2016
Mortality After PBM versus before
PBM
Not statistically significant:
360/19477 vs 359/20531
RR: 1.06, 95%CI [0.91;1.22] (p>0.05)
1, 40008 (19477 vs 20531) Thakkar, 2016
30-day mortality (figure 23)
30-day mortality After PBM versus before
PBM
Not statistically significant:
27/1034 vs 28/1128
RR: 1.15, 95%CI [0.68;1.93]
(p>0.05)
1, 1034 vs 1128 Ternstrom,
2014

41
30 day mortality After PBM versus before
PBM
Not statistically significant:
9/551 vs 4/481
RR: 1.96, 95%CI [0.61;6.34] (p>0.05)
1, 1032 (551 vs 481) Xydas, 2012
LENGTH OF HOSPITAL STAY (figure 24)
Length of stay (days)
THA
After PBM versus before
PBM
Not statistically significant:
8.8±2.3 vs 9.4±2.5
MD: -0.60, 95%CI [-1.24;0.04]
(p>0.05)
1, 218 (115 vs 103) Rineau, 2016
Length of stay (days)
TKA
After PBM versus before
PBM
Not statistically significant:
10.1±3.4 vs 9.3±2.5
MD: 0.80, 95%CI [-0.17;1.77] (p>0.05
1, 149 (68 vs 81) Rineau, 2016
115 THA and
68 TKA
Hospital length of
stay (days)
After PBM versus before
PBM
Not statistically significant:
10.2±46.6 vs 10.4±39.7
MD: -0.20, 95%CI [-0.67;0.27]
1, 129719 (75206 vs
54513)
Meybohm,
2016
Hospital length of
stay (days)
After PBM versus before
PBM
Not statistically significant:
5 [3:9] (median, IQR) vs 5 (2:9]
(p>0.999)
1, 8664 vs 8450 Gani, 2017
Hospital length of
stay (days)
After PBM versus before
PBM
Statistically significant:
10.4±8.0 vs 12.2±9.6
MD: -1.80, 95%CI [-2.81;-0.79]
(p<0.001)
In favour of PBM program
1, 2662 (2275 vs 387)
Gross, 2015
Hospital length of
stay (days)
After PBM versus before
PBM
Statistically significant:
3.02±1.76 vs 3.32±1.91
MD: -0.30, 95%CI [-0.36;-0.24]
(p<0.0001)
In favour of PBM program
1, 12590 (6593 vs 5997) Loftus, 2016
Length of stay (hours) After PBM versus before
PBM
Not statistically significant:
102 [84:125] (median, IQR) vs 101.3
(98:128]
(p=0.892)
1, 200 (100 vs 100) Kopanidis,
2016
Length of stay for
total hip replacement
(days)
After PBM versus before
PBM
Statistically significant:
6 (median), (5-8, IQR) vs 3 (2-4)
Median difference: 3, (p<0.001)
In favour of PBM program
1, 547 (361 vs 186) Frew, 2016
Length of stay for
total knee
replacement (days)
After PBM versus before
PBM
Statistically significant:
6 (median), (5-8, IQR) vs 3 (3-5)
Median difference: 3, (p<0.001)
In favour of PBM program
1, 576 (356 vs 220) Frew, 2016
Hospital length of
stay (days)
After PBM versus before
PBM
Statistically significant:
7 (6-8) vs 7 (6-9) (p=0.013)
In favour of PBM program
1, 1034 vs 1128 Ternstrom,
2014
Hospital length of
stay (days)
After PBM versus before
PBM
Not statistically significant:
7 (1-90) vs 7 (1-90) (p=0.3)
1, 778 (387 vs 391) Yaffee, 2014
ECONOMIC OUTCOMES
Direct cost of EPO,
iron, tranexamic acid
and blood transfusion
After PBM versus before
PBM
€30.572 versus €25.097 N/A Rineau, 2016
Total direct costs (€) After PBM versus before
PBM
Statistically significant:
44.300±25.915 vs 48.375±28.053
MD: XX, 95%CI [XX;XX] (p<0.001)
In favour of PBM program
1, 2662 (2275 vs 387)
Gross, 2015
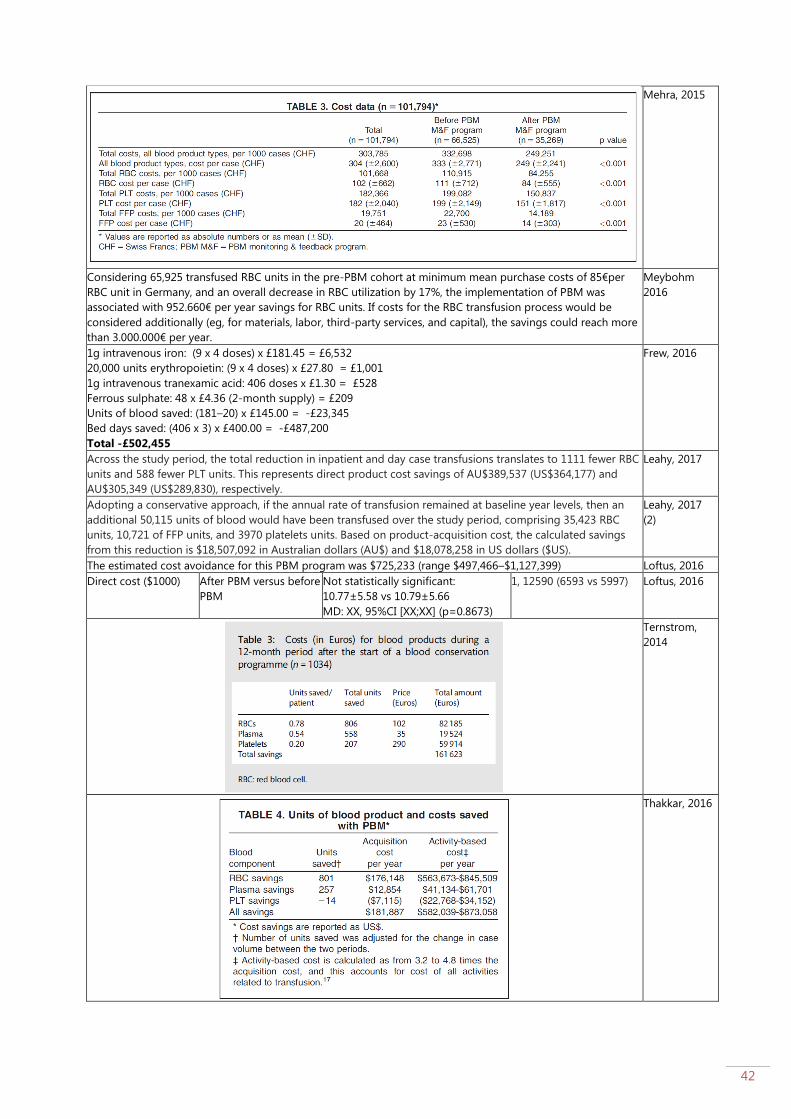
42
Mehra, 2015
Considering 65,925 transfused RBC units in the pre-PBM cohort at minimum mean purchase costs of 85€per
RBC unit in Germany, and an overall decrease in RBC utilization by 17%, the implementation of PBM was
associated with 952.660€ per year savings for RBC units. If costs for the RBC transfusion process would be
considered additionally (eg, for materials, labor, third-party services, and capital), the savings could reach more
than 3.000.000€ per year.
Meybohm
2016
1g intravenous iron: (9 x 4 doses) x £181.45 = £6,532
20,000 units erythropoietin: (9 x 4 doses) x £27.80 = £1,001
1g intravenous tranexamic acid: 406 doses x £1.30 = £528
Ferrous sulphate: 48 x £4.36 (2-month supply) = £209
Units of blood saved: (181–20) x £145.00 = -£23,345
Bed days saved: (406 x 3) x £400.00 = -£487,200
Total -£502,455
Frew, 2016
Across the study period, the total reduction in inpatient and day case transfusions translates to 1111 fewer RBC
units and 588 fewer PLT units. This represents direct product cost savings of AU$389,537 (US$364,177) and
AU$305,349 (US$289,830), respectively.
Leahy, 2017
Adopting a conservative approach, if the annual rate of transfusion remained at baseline year levels, then an
additional 50,115 units of blood would have been transfused over the study period, comprising 35,423 RBC
units, 10,721 of FFP units, and 3970 platelets units. Based on product-acquisition cost, the calculated savings
from this reduction is $18,507,092 in Australian dollars (AU$) and $18,078,258 in US dollars ($US).
Leahy, 2017
(2)
The estimated cost avoidance for this PBM program was $725,233 (range $497,466–$1,127,399) Loftus, 2016
Direct cost ($1000) After PBM versus before
PBM
Not statistically significant:
10.77±5.58 vs 10.79±5.66
MD: XX, 95%CI [XX;XX] (p=0.8673)
1, 12590 (6593 vs 5997) Loftus, 2016
Ternstrom,
2014
Thakkar, 2016

43
The mean number of RBC units saved per patient after initiation of BCS was 1.7 units, resulting in an estimated
cost savings of $1,755 per patient, or $679,045 overall (n ¼ 387), for an annual savings of approximately
$339,522 for RBC transfusion alone in AVR patients.
Yaffee, 2014
Blood acquisition cost savings were $2,120,273/yr, an approximate 400% return on investment for our patient
blood management efforts.
Frank, 2017
Depending on the costing methodology used as described in the outcomes and data collection section,
annualized savings between time periods before and after PBM implementation ranged from a low of $108 000
using acquisition cost (~$225/unit) to $480 000 when using activity-based costing (~$1000/unit).
Kansagra,
2017

44
Forest plots
Figure 1: Forest plot of outcome: Blood product utilization – Number of patients/admissions that received RBC
transfusion

45
Figure 2: Forest plot of outcome: Blood product utilization – Number of patients/admissions that received PLT
transfusion

46
Figure 3: Forest plot of outcome: Blood product utilization – Number of patients/admissions that received FFP
transfusion
Figure 4: Forest plot of outcome: Blood product utilization – Number of patients/admissions that received
cryprecipitate transfusion

47
Figure 5: Forest plot of outcome: Blood product utilization – Number of patients/admissions that received any
transfusion (RBC, PLT, FFP)

48
Figure 6a: Forest plot of outcome: Blood product utilization – Number of RBC units transfused (continuous)
Figure 6b: Forest plot of outcome: Blood product utilization – Number of RBC units transfused (dichotomous)

49
Figure 7: Forest plot of outcome: Blood product utilization – Number of FFP units transfused

50
Figure 8: Forest plot of outcome: Blood product utilization – Number of PLT units transfused
Figure 9: Forest plot of outcome: Blood product utilization – Number of cryoprecipitate units transfused
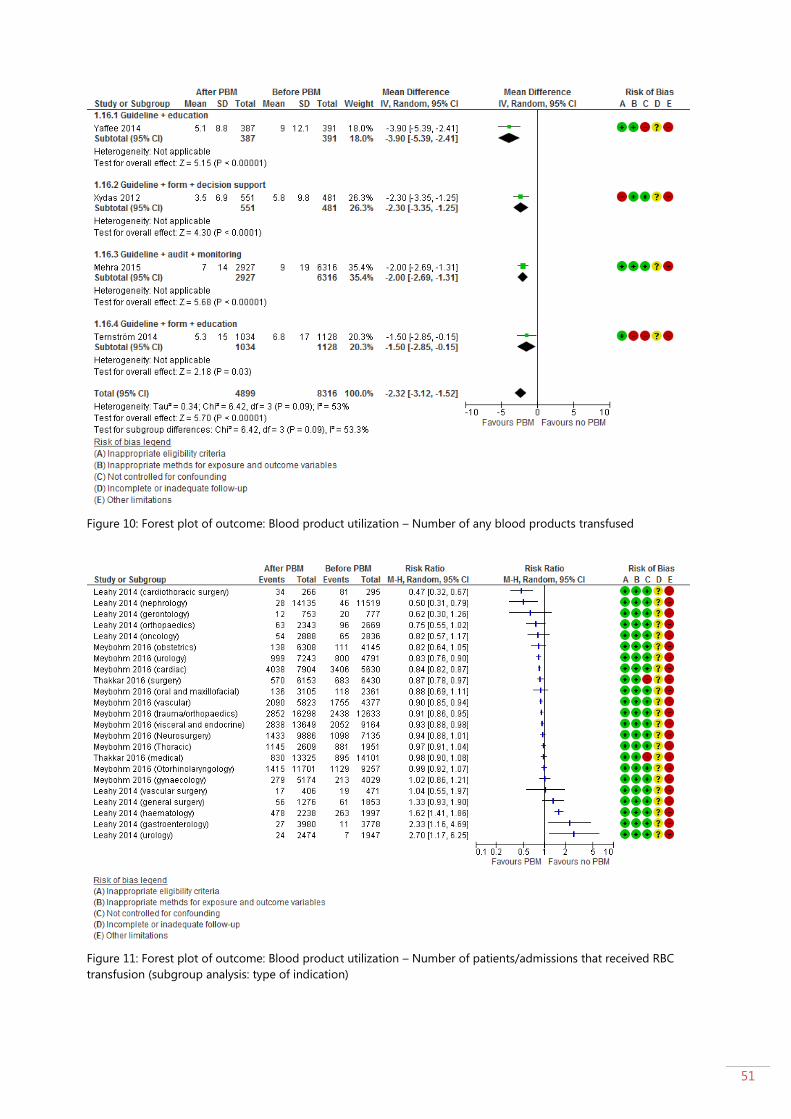
51
Figure 10: Forest plot of outcome: Blood product utilization – Number of any blood products transfused
Figure 11: Forest plot of outcome: Blood product utilization – Number of patients/admissions that received RBC
transfusion (subgroup analysis: type of indication)
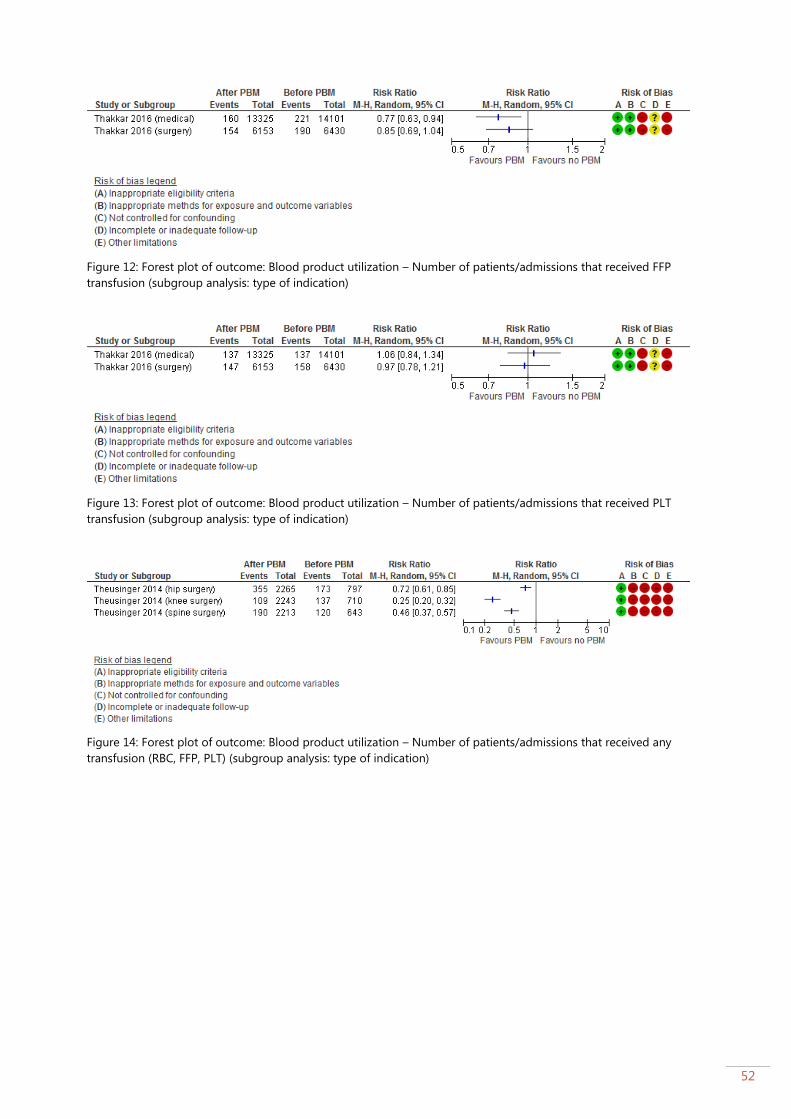
52
Figure 12: Forest plot of outcome: Blood product utilization – Number of patients/admissions that received FFP
transfusion (subgroup analysis: type of indication)
Figure 13: Forest plot of outcome: Blood product utilization – Number of patients/admissions that received PLT
transfusion (subgroup analysis: type of indication)
Figure 14: Forest plot of outcome: Blood product utilization – Number of patients/admissions that received any
transfusion (RBC, FFP, PLT) (subgroup analysis: type of indication)
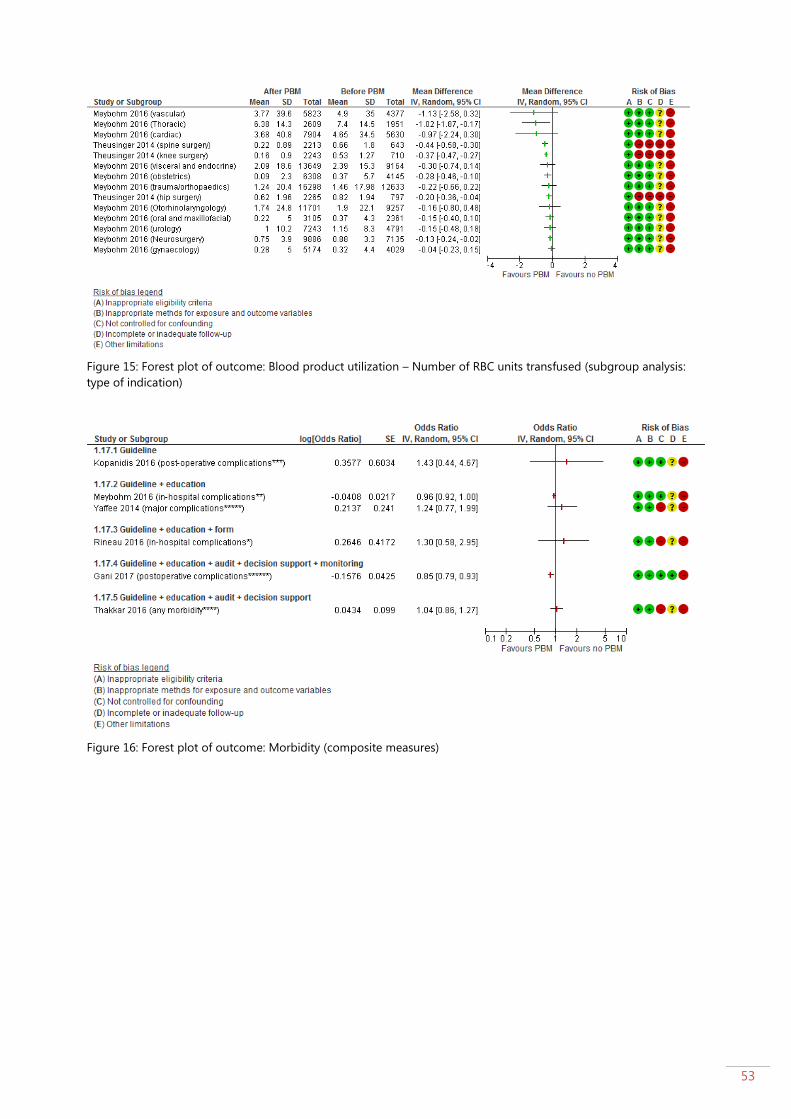
53
Figure 15: Forest plot of outcome: Blood product utilization – Number of RBC units transfused (subgroup analysis:
type of indication)
Figure 16: Forest plot of outcome: Morbidity (composite measures)

54
Figure 17: Forest plot of outcome: Morbidity (composite measures) (subgroup: type of indication)
Figure 18: Forest plot of outcome: Morbidity: acute myocardial infarction

55
Figure 19: Forest plot of outcome: Morbidity: acute ischaemic stroke

56
Figure 20: Forest plot of outcome: Morbidity: acute kidney injury

57
Figure 21: Forest plot of outcome: Mortality: hospital mortality

58
Figure 22: Forest plot of outcome: Mortality: not specified
Figure 23: Forest plot of outcome: Mortality: 30-day mortality

59
Figure 24: Forest plot of outcome: Length of hospital stay (days)

60
Quality of evidence
Author, Year Inappropriate
eligibility
criteria
Inappropriate
methods for
exposure and
outcome
variables
Not controlled
for
confounding
Incomplete or
inadequate
follow-up
Other limitations
Frank, 2017,
USA
Unclear
Data source:
online data
acquisition
system (IMPACT
Online)
Demographic
variables
(pre/post) not
reported
No
No indication for
difference in
outcome
measurements
between groups
Yes
No adjustment
for
confounding
variables in the
statistical
analysis
Unclear
Follow-up
period before
PBM: 12
months
Follow-up
period after
PBM: 30
months
Yes
PBM programs are usually
introduced in stages, as we
described. It is therefore
possible that we
underestimated the actual
blood savings because we
had already introduced
some degree of PBM to
the main campus during
what we call the pre-PBM
period.
Potential Hawthorne effect
on practice
Frew, 2016,
UK
No
Data source:
theatre database
(retrospective)
Similar
age/gender
across groups
No
No indication for
difference in
outcome
measurements
between groups
Yes
No data were
collected on
medical co-
morbidities,
intraoperative
blood loss,
body mass
index, fluid
management or
reasons for
readmission
since these are
not coded in
our hospital
databases.
Confounding
and bias is
therefore
possible.
No
Data for all
primary THRs
and TKRs
performed
between
April and
December 2010
were collected
prospectively
and compared
against the
retrospective
controls on an
intention-to-
treat basis.
Follow-up
period before
PBM: 12
months
Follow-up
period after
PBM: 60
months
Yes
For pragmatic reasons,
strict compliance with
the protocol was relaxed
and patients with minor
derangements
in Hb or ferritin levels were
not always treated to avoid
postponement of surgery.
Potential Hawthorne effect
on practice
Gani, 2017,
USA
No
Data source:
prospectively
maintained
database
Similar
demographic
variables
between groups
No
No indication for
difference in
outcome
measurements
between groups
No
Multivariate
regression
analyses with
adjustment for
different
patient
characteristics
were
conducted
No
Increase
compliance
with transfusion
guidelines
Follow-up
period before
PBM: 24
months
Follow-up
period after
Yes
Potential Hawthorne effect
on practice

61
PBM: 24
months
Gross, 2015,
USA
No
Data source:
database of the
Cardiac Surgery
Department of
Eastern Maine
Medical Center
for all cardiac
operations
was used along
with a dedicated
database
developed for
the PBM program
Similar
demographic
variables
between groups
No
No indication for
difference in
outcome
measurements
between groups
Yes
No adjustment
for
confounding
variables in the
statistical
analysis
Unclear
Follow-up
period before
PBM: 9 months
Follow-up
period after
PBM: 66
months
Yes
The full implementation
of this pillar was hindered
by two primary factors: 1)
the often urgent need for
surgery, especially
coronary artery bypass,
that limited the time
available for preoperative
anemia management
and 2) restrictions placed
on the use of
erythropoietic-stimulating
agents (ESAs) in the
context of cardiac
and vascular surgery by
the current US Food and
Drug Administration (FDA)
labeling restriction against
the use of ESAs in cardiac
and vascular surgery.
Non-adherence to
transfusion guidelines may
influence
the results but were not
covered in the present
study.
Potential Hawthorne effect
on practice
Gross, 2016,
USA
Unclear
Data source:
locally developed
extraction
program from
the hospital and
the Cancer Care
electronic
medical record
into a Microsoft
Access database.
Demographic
data between
groups not
reported
No
No indication for
difference in
outcome
measurements
between groups
No
Multivariate
regression
analyses were
conducted
Unclear
Yes
Non-adherence to
transfusion guidelines may
influence
the results but were not
covered in the present
study.
Potential Hawthorne effect
on practice
Kansagra,
2017
No
No differences
between baseline
characteristics
between groups
No
No indication for
difference in
outcome
measurements
between groups
No
Fractional
logistic
regression
analyses and
separate
regression
models were
conducted
Unclear
Follow-up
period before
PBM: 24
months
Follow-up
period after
PBM: 24
months
Yes
Potential Hawthorne effect
on practice
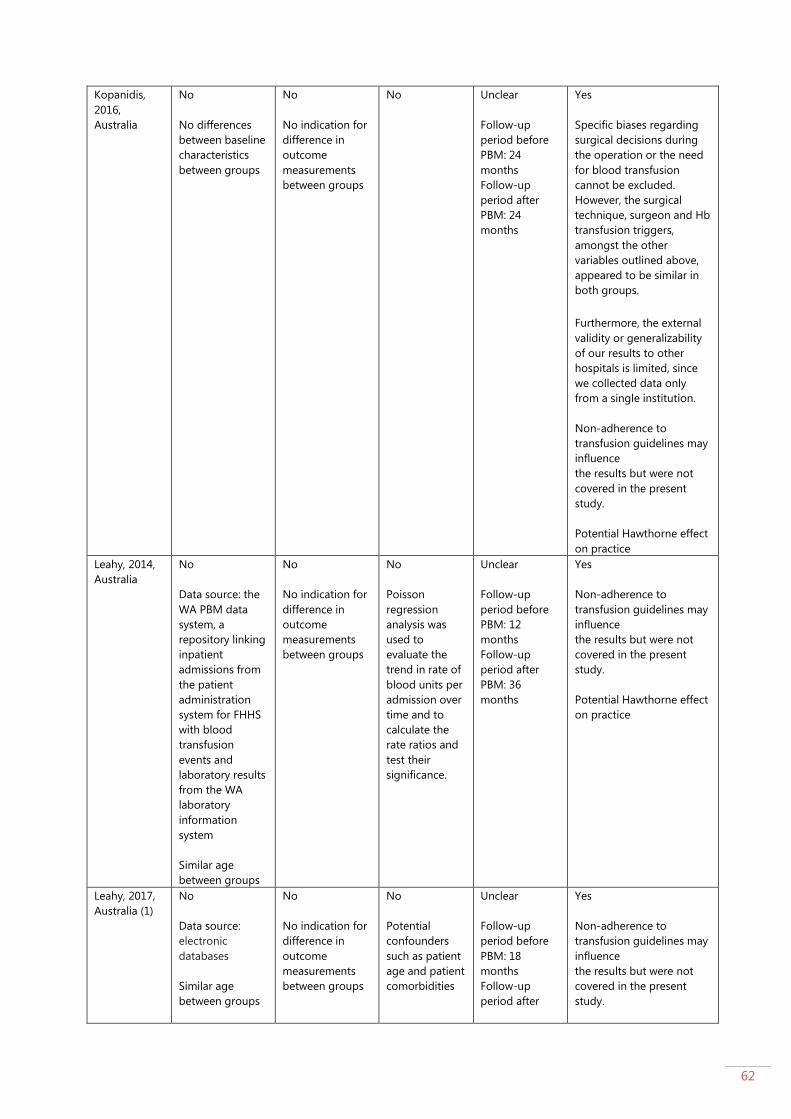
62
Kopanidis,
2016,
Australia
No
No differences
between baseline
characteristics
between groups
No
No indication for
difference in
outcome
measurements
between groups
No
Unclear
Follow-up
period before
PBM: 24
months
Follow-up
period after
PBM: 24
months
Yes
Specific biases regarding
surgical decisions during
the operation or the need
for blood transfusion
cannot be excluded.
However, the surgical
technique, surgeon and Hb
transfusion triggers,
amongst the other
variables outlined above,
appeared to be similar in
both groups.
Furthermore, the external
validity or generalizability
of our results to other
hospitals is limited, since
we collected data only
from a single institution.
Non-adherence to
transfusion guidelines may
influence
the results but were not
covered in the present
study.
Potential Hawthorne effect
on practice
Leahy, 2014,
Australia
No
Data source: the
WA PBM data
system, a
repository linking
inpatient
admissions from
the patient
administration
system for FHHS
with blood
transfusion
events and
laboratory results
from the WA
laboratory
information
system
Similar age
between groups
No
No indication for
difference in
outcome
measurements
between groups
No
Poisson
regression
analysis was
used to
evaluate the
trend in rate of
blood units per
admission over
time and to
calculate the
rate ratios and
test their
significance.
Unclear
Follow-up
period before
PBM: 12
months
Follow-up
period after
PBM: 36
months
Yes
Non-adherence to
transfusion guidelines may
influence
the results but were not
covered in the present
study.
Potential Hawthorne effect
on practice
Leahy, 2017,
Australia (1)
No
Data source:
electronic
databases
Similar age
between groups
No
No indication for
difference in
outcome
measurements
between groups
No
Potential
confounders
such as patient
age and patient
comorbidities
Unclear
Follow-up
period before
PBM: 18
months
Follow-up
period after
Yes
Non-adherence to
transfusion guidelines may
influence
the results but were not
covered in the present
study.
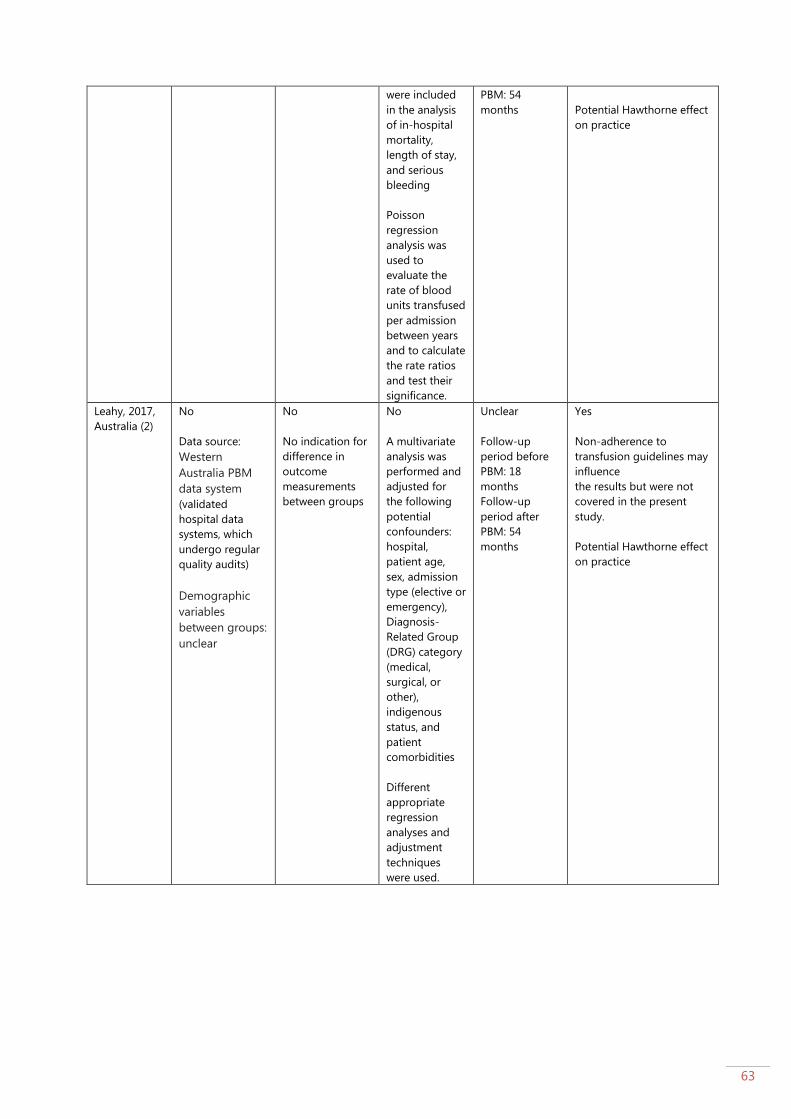
63
were included
in the analysis
of in-hospital
mortality,
length of stay,
and serious
bleeding
Poisson
regression
analysis was
used to
evaluate the
rate of blood
units transfused
per admission
between years
and to calculate
the rate ratios
and test their
significance.
PBM: 54
months
Potential Hawthorne effect
on practice
Leahy, 2017,
Australia (2)
No
Data source:
Western
Australia PBM
data system
(validated
hospital data
systems, which
undergo regular
quality audits)
Demographic
variables
between groups:
unclear
No
No indication for
difference in
outcome
measurements
between groups
No
A multivariate
analysis was
performed and
adjusted for
the following
potential
confounders:
hospital,
patient age,
sex, admission
type (elective or
emergency),
Diagnosis-
Related Group
(DRG) category
(medical,
surgical, or
other),
indigenous
status, and
patient
comorbidities
Different
appropriate
regression
analyses and
adjustment
techniques
were used.
Unclear
Follow-up
period before
PBM: 18
months
Follow-up
period after
PBM: 54
months
Yes
Non-adherence to
transfusion guidelines may
influence
the results but were not
covered in the present
study.
Potential Hawthorne effect
on practice
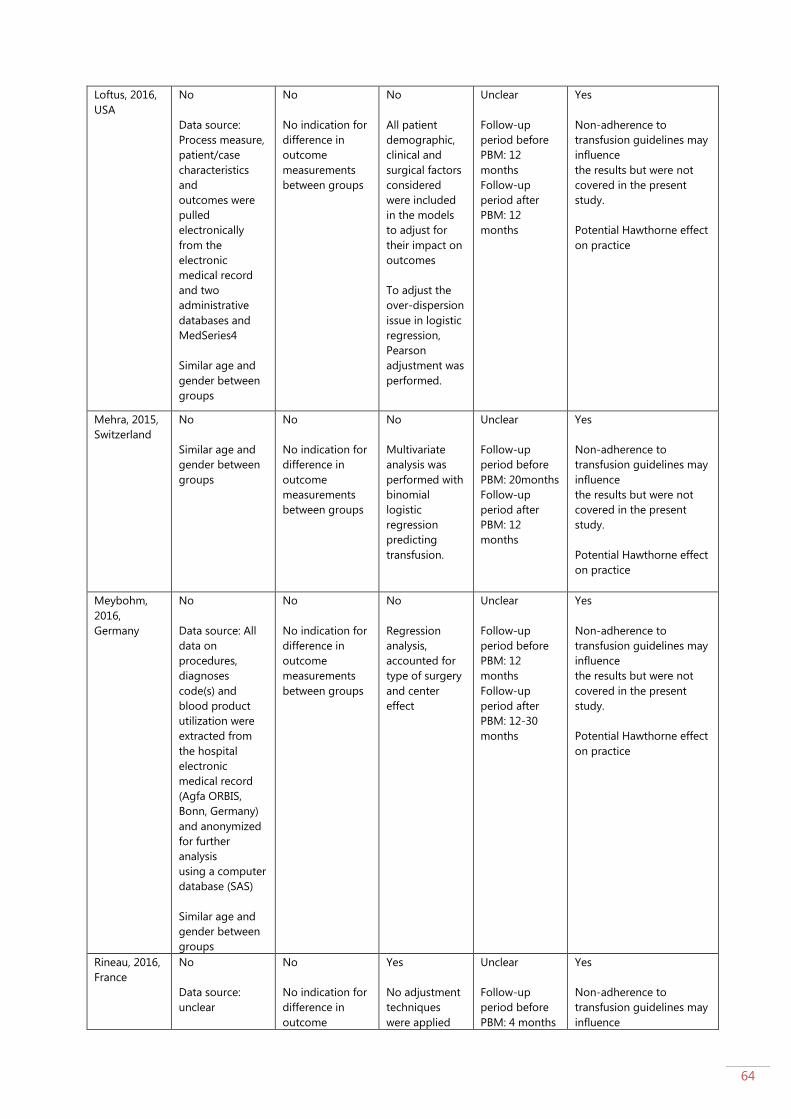
64
Loftus, 2016,
USA
No
Data source:
Process measure,
patient/case
characteristics
and
outcomes were
pulled
electronically
from the
electronic
medical record
and two
administrative
databases and
MedSeries4
Similar age and
gender between
groups
No
No indication for
difference in
outcome
measurements
between groups
No
All patient
demographic,
clinical and
surgical factors
considered
were included
in the models
to adjust for
their impact on
outcomes
To adjust the
over-dispersion
issue in logistic
regression,
Pearson
adjustment was
performed.
Unclear
Follow-up
period before
PBM: 12
months
Follow-up
period after
PBM: 12
months
Yes
Non-adherence to
transfusion guidelines may
influence
the results but were not
covered in the present
study.
Potential Hawthorne effect
on practice
Mehra, 2015,
Switzerland
No
Similar age and
gender between
groups
No
No indication for
difference in
outcome
measurements
between groups
No
Multivariate
analysis was
performed with
binomial
logistic
regression
predicting
transfusion.
Unclear
Follow-up
period before
PBM: 20months
Follow-up
period after
PBM: 12
months
Yes
Non-adherence to
transfusion guidelines may
influence
the results but were not
covered in the present
study.
Potential Hawthorne effect
on practice
Meybohm,
2016,
Germany
No
Data source: All
data on
procedures,
diagnoses
code(s) and
blood product
utilization were
extracted from
the hospital
electronic
medical record
(Agfa ORBIS,
Bonn, Germany)
and anonymized
for further
analysis
using a computer
database (SAS)
Similar age and
gender between
groups
No
No indication for
difference in
outcome
measurements
between groups
No
Regression
analysis,
accounted for
type of surgery
and center
effect
Unclear
Follow-up
period before
PBM: 12
months
Follow-up
period after
PBM: 12-30
months
Yes
Non-adherence to
transfusion guidelines may
influence
the results but were not
covered in the present
study.
Potential Hawthorne effect
on practice
Rineau, 2016,
France
No
Data source:
unclear
No
No indication for
difference in
outcome
Yes
No adjustment
techniques
were applied
Unclear
Follow-up
period before
PBM: 4 months
Yes
Non-adherence to
transfusion guidelines may
influence

65
Similar age and
gender between
groups
measurements
between groups
Follow-up
period after
PBM: 6 months
the results but were not
covered in the present
study.
Potential Hawthorne effect
on practice
Ternström,
2014, Sweden
No
Data source: all
patient and
transfusion data
were collected
from patient
records and local
data registries
into a database
by a designated
research nurse.
Similar age and
gender between
groups
Yes
The data for the
period before the
start of the
project were
retrieved from
prospective
registries, the
data for the
period after the
start were
collected
prospectively
Yes
No adjustment
techniques
were applied
Unclear
Follow-up
period before
PBM: 12
months
Follow-up
period after
PBM: 12
months
Yes
Non-adherence to
transfusion guidelines may
influence
the results but were not
covered in the present
study.
Potential Hawthorne effect
on practice
Thakkar,
2016, USA
No
Data source:
electronic
medical records
at the Johns
Hopkins Bayview
Medical Center
Similar age and
gender between
groups
No
No indication for
difference in
outcome
measurements
between groups
Yes
No adjustment
techniques
were applied
Unclear
Follow-up
period before
PBM: 12
months
Follow-up
period after
PBM: 12
months
Yes
Potential Hawthorne effect
on practice
The presence of a PBM
program that was already
in place for almost 2 years
at Johns Hopkins Hospital,
which is the largest
hospital in our health
system
Theusinger,
2014,
Switzerland
No
Data source: Data
from database of
the Department
of Orthopaedics,
Balgrist Hospital
for all hip, knee,
and spine
operations
performed
between 2008
and 2011 were
matched with
those from the
laboratory and
transfusion
databases of the
Central
Laboratory of
Zurich (Zurich,
Switzerland)
Similar age and
gender between
groups
Yes
2008 was
analysed
retrospectively,
whereas 2009
through to 2011
prospectively
Yes
No adjustment
techniques
were applied
Yes
Peri-operative
data were
available
for all patients,
whereas
complete
postoperative
data were
available for
only 60% of hip
operations,
33% of knee
operations, and
50% of spinal
operations
Follow-up
period before
PBM: 12
months
Follow-up
period after
PBM: 36
months
Yes
Potential Hawthorne effect
on practice

66
Verdecchia,
2016, USA
No
Data source:
centralized
database of
patient
transfusion
records
Demographic
variables: unclear
No
Normalization
technique was
used to account
for differences in
the number of
patients treated
and the number
of transfusions
administered
at each hospital
Yes
No adjustment
techniques
were applied
Unclear
Follow-up
period before
PBM: 12
months
Follow-up
period after
PBM: 96
months
Yes
Non-adherence to
transfusion guidelines may
influence
the results but were not
covered in the present
study.
Potential Hawthorne effect
on practice
Xydas, 2012,
USA
Yes
Data source:
unclear
No
No indication for
difference in
outcome
measurements
between groups
No
multivariate
logistic
regression
models were
used
Unclear
Follow-up
period before
PBM: 6 months
Follow-up
period after
PBM: 6 months
Yes
Non-adherence to
transfusion guidelines may
influence
the results but were not
covered in the present
study.
Potential Hawthorne effect
on practice
Yaffee, 2014,
USA
No
Data source:
unclear
Baseline patient
characteristics
were similar
between groups
No
No indication for
difference in
outcome
measurements
between groups
Yes
No adjustment
techniques
were applied
Unclear
Follow-up
period before
PBM: 24
months
Follow-up
period after
PBM: 24
months
Yes
Non-adherence to
transfusion guidelines may
influence
the results but were not
covered in the present
study.
Potential Hawthorne effect
on practice
Certainty of the body of evidence: see GRADE evidence tables
Conclusion See Evidence-to-Decision template
Reference(s) See list ‘overview 20 included studies’
Evidence used for Guideline
Project PBM consensus meeting
Reviewer(s) Hans Van Remoortel