Embed Size (px)
Citation preview

EVIDENCE OF THE IMPACT OF IMF FISCAL AND
MONETARY POLICIES ON THE CAPACITY TO ADDRESS HIV/AIDS AND TB CRISES IN ZAMBIA, 1990 TO 2007
Research Team:
Collins Chansa Patrick Nkandu Patrick Banda
Submitted to:
The Centre for Economic Governance and AIDS in Africa (CEGAA)
and
RESULTS Educational Fund (REF)
This study was supported by the Open Society Institute through REF, USA
June 2009

____________________________________________________________________________________________________________________________________________________________________________
EEvviiddeennccee ooff TThhee IImmppaacctt ooff IIMMFF FFiissccaall aanndd MMoonneettaarryy PPooll iicciieess oonn tthhee CCaappaaccii ttyy ttoo AAddddrreessss HHIIVV//AAIIDDSS aanndd TTBB CCrriisseess iinn ZZaammbbiiaa,, 11999977 ttoo 22000077
ii
Table of Contents
Table of Contents ............................................................................................................................ ii
List of Tables ................................................................................................................................. iv
List of Figures ................................................................................................................................ iv
List of Boxes .................................................................................................................................. iv
LIST OF ACRONYMS AND ABBREVIATIONS ........................................................................v
ACKNOWLEDGEMENTS ......................................................................................................... viii
EXECUTIVE SUMMARY .............................................................................................................1
CHAPTER ONE ..............................................................................................................................4
1.0 INTRODUCTION ................................................................................................................4
1.1 Background to the IMF Programmes in Zambia ..................................................................4
1.2 Study Objectives ...................................................................................................................5
1.3 Significance of the Study ......................................................................................................5
1.4 Research Methodology .........................................................................................................6
1.4.1 Study design ......................................................................................................................6
1.4.2 Sampling............................................................................................................................6
1.4.3 Scope of the Study.............................................................................................................6
1.4.4 Sources of data ..................................................................................................................7
1.4.5 Data analysis .....................................................................................................................7
1.4.6 Study Limitations and Challenges ....................................................................................7
CHAPTER TWO .............................................................................................................................8
2 SOCIO-ECONOMIC ENVIRONMENT ..................................................................................8
2.1 Key Economic Performance Indicators ................................................................................8
2.2 Demographic and Health Indicators ...................................................................................10
2.3 HIV/AIDS Prevalence ........................................................................................................10
2.4 Magnitude of TB in Zambia ...............................................................................................12
CHAPTER THREE .......................................................................................................................13
3. STUDY FINDINGS............................................................................................................13
3.1 Overview of Zambia’s IMF Programmes, 1990-2007 ....................................................... 13
3.1.1 Structural Adjustment Programme and the Enhanced Structural Adjustment Facility ...... 13
3.1.2 Poverty Reduction and Growth Facility ............................................................................. 14
____________________________________________________________________________________________________________________________________________________________________________
EEvviiddeennccee ooff TThhee IImmppaacctt ooff IIMMFF FFiissccaall aanndd MMoonneettaarryy PPooll iicciieess oonn tthhee CCaappaaccii ttyy ttoo AAddddrreessss HHIIVV//AAIIDDSS aanndd TTBB CCrriisseess iinn ZZaammbbiiaa,, 11999977 ttoo 22000077
iii
3.1.3 Current Update on Zambia’s PRGF, 2009 ......................................................................... 15
3.1.4 Monetary Policy & Exchange Rates .................................................................................. 16
3.1.5 Fiscal Policy ....................................................................................................................... 19
3.1.6 Wage Policies and the Staff Monitored Programme.......................................................... 20
3.1.7 Debt Relief and Fiscal Space ............................................................................................ 21
3.2 Process of IMF Policy Formulation in Zambia ................................................................. 29
3.3 Extent to which MTEFs are used as a Planning Device in the Country............................ 30
3.4 Setting of Budget Ceilings for National, Health and HIV/AIDS and TB ......................... 31
3.5 Trends in the Government Health Budget ......................................................................... 35
3.5.1 Trends in Total Health Spending and per capita health expenditure ................................ 35
3.5.2 Trends in HIV/AIDS Expenditure by Source ................................................................... 37
3.5.3 Estimated Resources for Tuberculosis .............................................................................. 39
3.6 Human Resource budgetary allocations, emoluments and distribution in the health sector in Zambia ...................................................................................................................................... 40
3.6.1 Trends in the public budget allocations for health personnel ........................................... 40
3.6.2 Personal Emoluments for Health Workers in Zambia ...................................................... 41
3.6.3 Trends in the Numbers of Health Professional Working in the Health Sector ................. 42
3.6.4 Trends of Human Resources in the Health Sector in HIV/AIDS ..................................... 44
3.7 Evidence of the Impact of IMF Programmes on Government’s Response to HIV/AIDS/Health and TB Crises ................................................................................................. 45
3.7.1 Introduction of User Fees in Zambia ................................................................................ 45
3.7.2 IMF Wage Bill Policies and Impact on Human Resources for Health and HIV/AIDS .... 46
3.7.2 IMF Programmes, Poverty and HIV/AIDS ...................................................................... 48
4.1. Critical Review of Underlying Assumptions of the IMF Macroeconomic Framework in Zambia .......................................................................................................................................... 51
CHAPTER FOUR ..........................................................................................................................51
CHAPTER FIVE ...........................................................................................................................56
5.0 DISCUSSION, CONCLUSIONS AND RECOMMENDATIONS ....................................56
5.1 Discussion .......................................................................................................................... 56
5.2 Findings.............................................................................................................................. 59
5.3 Recommendations .............................................................................................................. 60
REFERENCES ............................................................................................................................. 64

____________________________________________________________________________________________________________________________________________________________________________
EEvviiddeennccee ooff TThhee IImmppaacctt ooff IIMMFF FFiissccaall aanndd MMoonneettaarryy PPooll iicciieess oonn tthhee CCaappaaccii ttyy ttoo AAddddrreessss HHIIVV//AAIIDDSS aanndd TTBB CCrriisseess iinn ZZaammbbiiaa,, 11999977 ttoo 22000077
iv
List of Tables
Table 1: Key Economic Performance Indicators for Zambia (1999-2007) .................................... 9
Table 2: Key Demographic and Health Indicators ....................................................................... 10
Table 3: Trends in HIV Morbidity and Mortality ......................................................................... 11
Table 4: Inflation-Reduction Targets, 2006 – 2012 ...................................................................... 16
Table 5: Quantitative Monetary Targets for PRGF in Zambia: GIR/NDA .................................. 17
Table 6: Budget Deficit Targets, 2006 – 2012 .............................................................................. 19
Table 7: Public Sector Wage Bill Ceiling, 2005-2010 ................................................................. 20
Table 8: Summary of IMF Economic Reform Programmes: Zambia, 1992-2007 ....................... 23
Table 9: Health Expenditure Ratios, 1995 – 2006 ........................................................................ 36
Table 10: Estimates of Resources Required for NASF (2006-2010) based on 50% scale up and Funding Gap (Figures in US$) ...................................................................................................... 39
Table 11: Public health sector wage bill as a % of total government health expenditure (US$) .. 40
Table 12: Composite Monthly Pay before tax of a sample of health workers, 2005 .................... 42
Table 13: Current Staff Levels versus Recommended Staff to Population to Staff Ratios and Establishment ................................................................................................................................ 43
Table 14: Total Required FTEs of Health Worker Labour for HIV/AIDS under the ‘Sustain’ Policy and Percent of Available FTEs in Parentheses .................................................................. 44
Table 15: Trends in the recruitment of Core Health Workers 2004 – 2007 ................................. 47
Table 16: Linkages between Poverty and HIV/AIDS ................................................................... 49
List of Figures Figure 1: Transparency in the formulation of IMF/Fiscal/Monetary Programmes ...................... 29 Figure 2: MoH Budget as a Percentage of Total Government Discretionary Budget, 1991 - 2007....................................................................................................................................................... 35 Figure 3: Contribution to Total Health Expenditure, 1995-2006 ................................................. 37 Figure 4: Average Shares of Total Health Expenditure, 2006 ...................................................... 37 Figure 5: HIV/AIDS Funding Sources, 2002-2006 ...................................................................... 38
List of Boxes Box 1: HIV/AIDS Spending and Support to Human Resources .................................................. 31 Box 2: Setting of Budget Ceilings ................................................................................................ 32 Box 3: IMF on Grants from International Donors ........................................................................ 50

____________________________________________________________________________________________________________________________________________________________________________
EEvviiddeennccee ooff TThhee IImmppaacctt ooff IIMMFF FFiissccaall aanndd MMoonneettaarryy PPooll iicciieess oonn tthhee CCaappaaccii ttyy ttoo AAddddrreessss HHIIVV//AAIIDDSS aanndd TTBB CCrriisseess iinn ZZaammbbiiaa,, 11999977 ttoo 22000077
v
LIST OF ACRONYMS AND ABBREVIATIONS AIDS Acquired Immune Deficiency Syndrome ANC Antenatal Care ART Antiretroviral Therapy ARV Antiretroviral BOZ Bank of Zambia CBO Community Based Organization CCM Country Coordinating Mechanism CCZ Christian Council of Zambia CEGAA Centre for Economic Governance and AIDS in Africa CHAZ Churches Health Association of Zambia CIDA Canadian International Development Agency CRS Catholic Relief Services CSO Civil Society Organisation/Central Statistical Office CSPR Civil Society for Poverty Reduction DFID UK Department for International Development DHB District Health Board DHS Demographic Health Survey DOTS Directly Observed Treatment EFZ Evangelical Fellowship of Zambia ESAF Enhanced Structural Adjustment Facility EU European Union EXT External Resources (Donor Expenditure) FAO Food and Agriculture Organization FBO Faith Based Organisation FDS Flying Doctor Service FNDP Fifth National Development Plan FTE Full Time Equivalent GDP Gross Domestic Product GFATM Global Fund to Fight AIDS, TB and Malaria GNC General Nursing Council GRZ Government Republic of Zambia HCW Health Care Workers HHE Household Expenditure HIPC Highly Indebted Poor Countries Initiative HIV Human Immunodeficiency Virus HMIS Health Management Information System HRH Human Resources for Health HSRP Health Sector Response Plan HSS Health Systems Strengthening HTC HIV Testing and Counseling (initiated by the health care provider) HR Human Resources HRSP Human Resources Strategic Plan IEC Information, Education and Communication IFI International Financial Institution IHP International Health Partnership ILO International Labour Organisation IMF International Monetary Fund JASZ Joint Assistance Strategy for Zambia

____________________________________________________________________________________________________________________________________________________________________________
EEvviiddeennccee ooff TThhee IImmppaacctt ooff IIMMFF FFiissccaall aanndd MMoonneettaarryy PPooll iicciieess oonn tthhee CCaappaaccii ttyy ttoo AAddddrreessss HHIIVV//AAIIDDSS aanndd TTBB CCrriisseess iinn ZZaammbbiiaa,, 11999977 ttoo 22000077
vi
MDG Millennium Development Goal MDR Multi Drug Resistance MDRI Multilateral Debt Relief Initiative MIS Management Information Systems MISA Media Institute of Southern Africa MPSA Ministries, Provinces and Other Spending Agencies M&E Monitoring and Evaluation MOAC Ministry of Agriculture and Cooperatives MoE Ministry of Education MoU Memorandum of Understanding MoH Ministry of Health MTCT Mother to Child Transmission (of HIV) MTEF Medium Term Expenditure Framework NAC National AIDS Council NAP National Action Plan NASF National AIDS Strategic Framework NCP Neighborhood Care Point NDCC National Development and Coordinating Committee NEMC National Economic Management Cycle NFNC National Food and Nutrition Commission NGO Non Governmental Organization NHSP National Health Strategic Plan NPA National Plan of Action NSP National Strategic Plan NTP National TB Plan OHB Occupational Health Board OI Opportunistic Infections OVC Orphans and Vulnerable Children PAC Public Accounts Committee PE Public Expenditure/Personal Emoluments PEP Post Exposure Prophylaxis PEPFAR President’s Emergency Plan for AIDS Relief PLHIV People Living with HIV/AIDS PMTCT Prevention of Mother to Child Transmission (of HIV) PBRS Poverty Reduction Budget Support PRGF Poverty Reduction and Growth Facility PRSP Poverty Reduction and Strategy Paper PSMD RAP
Public Service Management Division Rights Accumulation Programme
REF RESULTS Educational Fund, USA RHC Rural Health Centre SADC South African Development Community SAG Sector Advisory Group SAP Structural Adjustment Programme SIDA SMP
Swedish International Development Agency Staff Monitored Programme
SRH Sexual Reproductive Health STI Sexually Transmitted Infections SWAp Sector Wide Approach TALC Treatment Action and Literacy Campaign

____________________________________________________________________________________________________________________________________________________________________________
EEvviiddeennccee ooff TThhee IImmppaacctt ooff IIMMFF FFiissccaall aanndd MMoonneettaarryy PPooll iicciieess oonn tthhee CCaappaaccii ttyy ttoo AAddddrreessss HHIIVV//AAIIDDSS aanndd TTBB CCrriisseess iinn ZZaammbbiiaa,, 11999977 ttoo 22000077
vii
TB Tuberculosis TBA Traditional Birthing Attendant TGE Total Government Expenditure THE Total Health Expenditure TWG Technical Working Group UN United Nations UNAIDS Joint United Nations Program on HIV/AIDS UNDAF United National Development Assistance Framework UNESCO United Nations Education, Scientific and Cultural Organization UNFPA United Nations Population Fund UNICEF United Nations Children’s Fund UNISP United Nations Implementation Support Plan UNGASS United Nations General Assembly Special Session on HIV/AIDS USAID United States Agency for International Development USG United States (of America) Government VCT Voluntary Counselling and Testing (for HIV) WFP World Food Program WHO World Health Organization XDR Extreme Drug Resistance YWCA Young Women’s Christian Association ZDHS Zambia Demographic and Health Survey ZDAD Zambia Development and Assistance Database ZHWRS Zambia Health Rural Workers Retention Scheme

____________________________________________________________________________________________________________________________________________________________________________
EEvviiddeennccee ooff TThhee IImmppaacctt ooff IIMMFF FFiissccaall aanndd MMoonneettaarryy PPooll iicciieess oonn tthhee CCaappaaccii ttyy ttoo AAddddrreessss HHIIVV//AAIIDDSS aanndd TTBB CCrriisseess iinn ZZaammbbiiaa,, 11999977 ttoo 22000077
viii
ACKNOWLEDGEMENTS Assistance received from several people made the compilation of this report possible. First, the Zambia research team which was responsible for co-coordinating and implementing the research in Zambia. Foremost, we would like to express our profound appreciation to Mr. Collins Chansa who worked tirelessly in ensuring that the information was gathered and analyzed. Also acknowledged are the services of Mr. Patrick Banda for the commendable work during the field work and Mr. Patrick Nkandu for the logistical support and contribution during the data analysis stage. The researchers would like to thank Dr. Urbanus Kioko and Teresa Guthrie of CEGAA for their support in developing this report. Last but not least, CEGAA would like to thank all the questionnaire respondents whose collaboration made the data collection exercise so much easier.
____________________________________________________________________________________________________________________________________________________________________________
EEvviiddeennccee ooff TThhee IImmppaacctt ooff IIMMFF FFiissccaall aanndd MMoonneettaarryy PPooll iicciieess oonn tthhee CCaappaaccii ttyy ttoo AAddddrreessss HHIIVV//AAIIDDSS aanndd TTBB CCrriisseess iinn ZZaammbbiiaa,, 11999977 ttoo 22000077
1
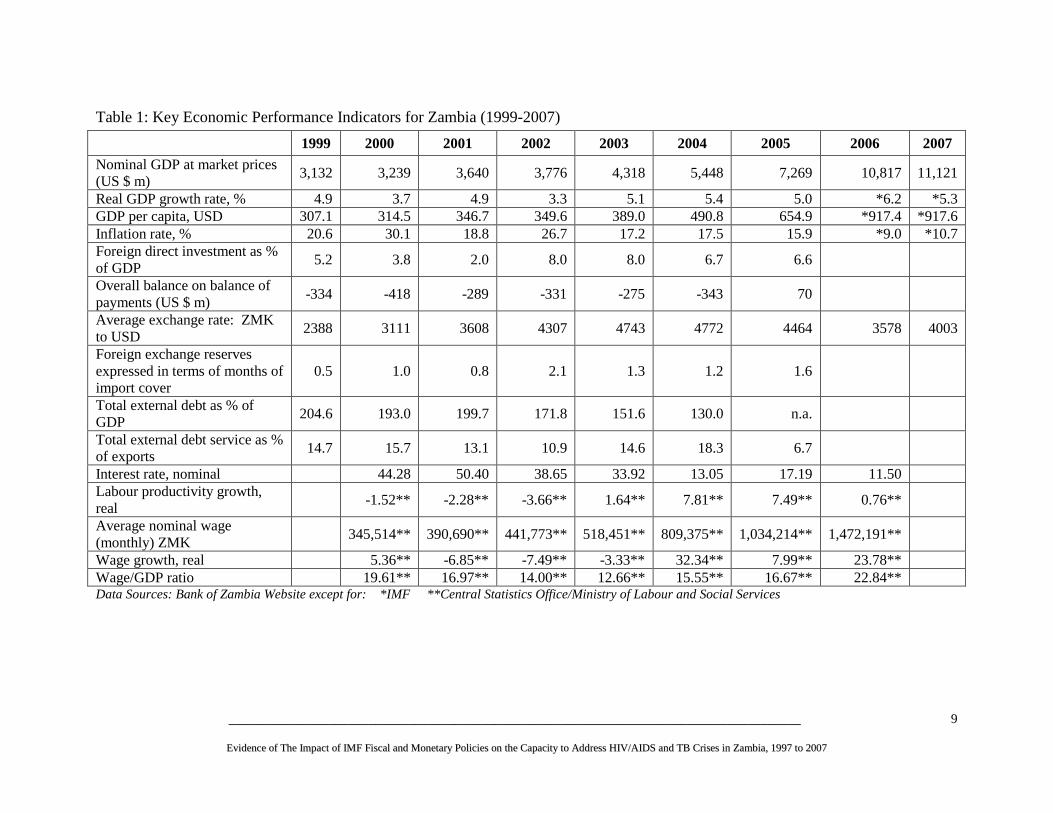
EXECUTIVE SUMMARY INTRODUCTION This study on Zambia is part of a broader three-country assessment of the impact of International Monetary Fund (IMF) fiscal and monetary policies on the government’s capacity to address the HIV/AIDS and tuberculosis (TB) crises. Recent studies have shown that IMF macroeconomic programmes that focus on strict fiscal and monetary policies restrict public spending, limiting public investment in health, HIV/AIDS and TB. This study discusses the impact of IMF programmes on Zambia’s ability to overcome the challenges posed by HIV/AIDS, TB, and human resource shortage. The purpose of this research is to raise awareness within the IMF and the Zambian government and civil society about the potential impacts of IMF programmes on Zambia’s ability to overcome these challenges. This study combined qualitative and quantitative data collection methods in order to analyze IMF policies from 1990 to 2009. Using data collected from documents through a comprehensive data search and key informant interviews, this study assessed the impact of IMF programmes on public spending. National strategic plans, planning guidelines, pieces of legislature, and national budget documents were obtained from relevant ministries and other institutions like the IMF, World Bank, and the World Health Organisation and examined in detail. FINDINGS Regarding Health Budgets, the study finds:
• During 1995-2006, Government health expenditure as a share of GDP declined steadily. • The level of funding to the health sector from all sources was insufficient to fully finance the
current National Health Strategic Plan through 2010. The study identified a financing gap of $756 million.
• Donor contributions to overall spending on HIV/AIDS averaged about 55% more than government contributions between 2003 and 2006. The restrictive fiscal and monetary policies prescribed by the IMF indirectly limit the growth in the government’s health budget and result in government reliance on donors to finance HIV/AIDS programmes.
• The health sector faces a personnel deficiency; health worker shortages exist at every service delivery level. Population-to-staff ratios are above the WHO recommendations for almost all health cadres.
• Health worker unemployment increased significantly while staff workloads multiplied. Poor worker conditions of service have encouraged health employee migration to the private sector and foreign countries, while recruitment as a percentage of the total government health budget declined from 8 percent in 2005 to 4 percent in 2007.
Zambia implemented short-term measures such as public sector reform, market liberalization, and a tight fiscal policy in order to meet the conditions for receiving loans or bilateral aid. Policies aimed at public sector deficit reduction have constrained public spending; a review of the annual national government

____________________________________________________________________________________________________________________________________________________________________________
EEvviiddeennccee ooff TThhee IImmppaacctt ooff IIMMFF FFiissccaall aanndd MMoonneettaarryy PPooll iicciieess oonn tthhee CCaappaaccii ttyy ttoo AAddddrreessss HHIIVV//AAIIDDSS aanndd TTBB CCrriisseess iinn ZZaammbbiiaa,, 11999977 ttoo 22000077
2
health budget showed that it decreased over the period 1990 to 2007. Zambia has not retained its Abuja commitment to maintain health spending at 15 percent of its annual national budget, despite some positive economic growth and reduced debt servicing due to recent cancellation initiatives. Wage bill policies directed at reducing the overall government wage bill substantially contributed to the decrease in health sector employment. Government wage bill ceilings and a hiring freeze, intended to reduce domestic non-interest expenditures, increased migration of health sector workers and exacerbated a critical shortage of core health personnel. Regarding IMF programmes, the study finds:
• The macroeconomic framework for 2008-2011 seeks a nearly balanced budget; tight monetary policy with inflation below 5 percent; increased international currency reserves; and the maintenance of market-determined interest and exchange rates. The increase of electricity tariffs to the cost of service is a radical structural policy conditionality.
• The overall policy priority of the current macroeconomic framework is for stabilization, not scaling-up. The framework is designed to constrain public spending, not to enable the large scaling-up of public expenditure needed to meet the MDGs.
• Restrictive fiscal and monetary policies and the adoption of market-based interest rates have limited the government’s ability to engage in expansionary policies that are required for any scaling-up scenario.
• Such targets and policies in the current macroeconomic framework limit the government’s fiscal space by reducing the overall national resource envelope. This adversely affects allocations to the different government ministries, including the health ministry.
• IMF programmes are formulated through a non-transparent process involving the IMF and the MoFNP. While other stakeholders, such as other government ministries, donors, civil society and NGOs are later consulted, they are not included in the initial and most crucial stage of the policy and budget formation process.
This paper concludes that IMF macroeconomic programmes indirectly restrict the flow of financial and human resources to the health sector. IMF programmes have inhibited options to scale-up interventions in the fight against HIV/AIDS and TB by constraining national public spending and investment with its policy conditionalities. The government has not been able to significantly scale up interventions for HIV/AIDS from its own resources and depends heavily on external donor support. The Zambian MoH is particularly concerned about poor staffing levels for health and HIV/AIDS, and predicts that the national HIV/AIDS targets will be impossible to achieve without radical remedial measures. RECOMMENDATIONS 1) Eliminate harmful quantitative, structural and policy conditions attached to IMF programmes We recommend the elimination of harmful conditionalities attached to loans and grants. The government and IMF should encourage accountability of funds and prudent public financial management systems without further economic policy targets or reforms as binding conditions. Macroeconomic management must encourage full spending and absorption of aid. 2) Open Macroeconomic Policy Decision-Making to a Broader Group of Public Stakeholders

____________________________________________________________________________________________________________________________________________________________________________
EEvviiddeennccee ooff TThhee IImmppaacctt ooff IIMMFF FFiissccaall aanndd MMoonneettaarryy PPooll iicciieess oonn tthhee CCaappaaccii ttyy ttoo AAddddrreessss HHIIVV//AAIIDDSS aanndd TTBB CCrriisseess iinn ZZaammbbiiaa,, 11999977 ttoo 22000077
3
The decision process to choose Zambia’s macroeconomic policy priorities and other alternative policy options should be subject to a broader national public debate and discussion involving parliament, academia, civil society, labour, and the domestic media. The implementation and evaluation of policy reforms should be participatory and inclusive with all the stakeholders. 3) Open Debt Contraction to a Broader Group of Public Stakeholders Any viable debt-sustainability analysis (DSA) tool must address social development issues. We urge the adoption of the “Debt Management Bill”, which provides for parliamentary oversight and creates space for broader transparency and accountability to the public in the future contraction and management of public debt. 4) Alternative Policies for Increased Public Spending & Investment Must Be Considered The underlying assumptions and policies informing the current macroeconomic framework in Zambia should be revisited and reconsidered by a larger group of public stakeholders. Alternative policy options that could allow more flexibility in deficit financing, geared specifically toward health-sector resource mobilization, should be considered by a broader group of stakeholders before the policies are decided. 5) Conduct IMF Macroeconomic Literacy Trainings CSOs must create awareness through convening IMF Macroeconomic Literacy Trainings for public stakeholders (CSOs, labour, legislators, media reporters, and line ministry officials) so as to increase knowledge of the IMF policies and their effects. Such training is essential to enable advocacy for alternative, more expansionary macroeconomic policies that could more effectively reduce poverty and advance the health of Zambians. 6) Eliminate the Wage Bill Ceiling The cap on the wage bill was shown to be one of the critical factors limiting the Ministry of Health efforts to recruit adequate personnel for the scale up of HIV/AIDS and TB services; an immediate short-term step that could be taken is to remove the current wage bill restriction of 8.5 percent of GDP. 7) Example of Alternative Policy Approach to Consider: Managed Exchange Rates The dramatic economic consequences of swings in global copper prices suggest that Zambia should more carefully manage its currency exchange rate in the short term within a longer-term development framework. 8) Example of Alternative Policy: Large Reinvestment in Public Water System The Government should engage in a large, up-front public investment to renew and extend public water system infrastructure. This approach would reduce unit costs in the sector, make tariffs affordable, and improve the sustainability of cost-recovery efforts, more than paying for itself over the long-term. 9) Example of Alternative Policy: No Electricity Price Increases for Consumers The proposed future increase in electricity tariffs should not be implemented. The Government should instead explore alternative policy approaches, including the option of increasing the operational efficiency of ZESCO and the rehabilitation and construction of new power generation projects.

____________________________________________________________________________________________________________________________________________________________________________
EEvviiddeennccee ooff TThhee IImmppaacctt ooff IIMMFF FFiissccaall aanndd MMoonneettaarryy PPooll iicciieess oonn tthhee CCaappaaccii ttyy ttoo AAddddrreessss HHIIVV//AAIIDDSS aanndd TTBB CCrriisseess iinn ZZaammbbiiaa,, 11999977 ttoo 22000077
4
CHAPTER ONE
1.0 INTRODUCTION
1.1 Background to the IMF Programmes in Zambia A number of challenges facing the development of quality health care in developing countries have been well-documented over the past two decades. These challenges include limited funding for the health sector; a severe shortage of key health workers; inadequate infrastructure and obsolete equipment; weak and fragmented health systems; and a high prevalence of communicable and non-communicable diseases, especially HIV/AIDS, TB and Malaria (WHO, 2004; 2007). Attrition of health workers, poor management and accountability of resources has also been identified as some of the problems facing developing countries in Africa (WHO, 2007). Today, however, there is accumulating evidence to suggest that IMF programmes have also negatively impacted on the capacity of poor countries in Africa to invest adequately in health (Genberg, 1993; McIntyre et al., 2004; ActionAid et al, 2004; Wood, 2006; Center for Global Development, 2007; ActionAid, 2008; Baker, 2008). The IMF’s influence on health policy in developing African countries has been well linked to SAPs, programmes that were “sold” by the IMF to policy makers at the Ministries of Finance and by policy makers to health workers and their clients (World Bank, 1994). These were taken as a corrective measure that has been imposed on developing countries by the World Bank and IMF through its loan conditionalities (McIntyre et al., 2004). SAP measures include privatizing government-owned enterprises and government-provided services, reducing government spending, orienting economies to promote exports, trade liberalization, and higher interest rates, eliminating subsidies on consumer items such as foods, fuel and medicines and tax increases (Genberg, 1993; McIntyre et al., 2004, (Situmbeko and Zulu, 2004). Today, the SAPs take the form of Poverty Reduction and Growth Facility (PRGF). Due to the restrictive nature of the fiscal policies and the stringent conditionalities that accompany them, it is strongly arguable that IMF polices ultimately restrict health spending and wage bills for the overall health sector, including HIV/AIDS and TB (Genberg, 1993; McIntyre et al., 2004; ActionAid et al., 2004; Wood, 2006; Center for Global Development, 2007; ActionAid, 2008; Baker, 2008). The IMF, however, argues to the contrary. It states that it does not limit health care spending and that the ability of governments to spend is limited by the country’s availability of resources. It further contends that if government spending exceeds a country’s available resources, this will have de-stabilizing consequences on the economy (IMF, 2008a). The IMF also believes that under-performing economies in developing countries can improve if there is more fiscal discipline and macroeconomic stability (McIntyre et al., 2004). Zambia became a member of the IMF on 23rd September 1965. High import prices and low export prices prompted IMF membership. With the oil crisis of 1973 and 1977, there was a significant increase in IMF funding to Zambia, which also led to the institute’s influential role on economic policy formulation and management (Situmbeko and Zulu, 2004). Since 1965 to date, Zambia has been a member of the IMF except for the period between May 1987 to August 1989 when the first Republican President, Dr. Kenneth Kaunda, broke away from the IMF and announced the suspension of IMF reform efforts.
____________________________________________________________________________________________________________________________________________________________________________
EEvviiddeennccee ooff TThhee IImmppaacctt ooff IIMMFF FFiissccaall aanndd MMoonneettaarryy PPooll iicciieess oonn tthhee CCaappaaccii ttyy ttoo AAddddrreessss HHIIVV//AAIIDDSS aanndd TTBB CCrriisseess iinn ZZaammbbiiaa,, 11999977 ttoo 22000077
5
During its period of interaction with the IMF, Zambia has adopted a number of programmes including the Structural Adjustment Programs (SAPs), the Enhanced Structural Adjustment Facility (ESAF), the Poverty Reduction and Growth Facility (PRGF), and the Staff Monitored Programme (SMP). Certain initiatives such as the Highly Indebted Poor Countries (HIPC) debt relief initiative have also been implemented over the period 1999 to 2005. The focus of these IMF programmes involve controls on government fiscal spending, reduction of external and domestic debt, public service reforms, budgeting process reforms, privatization and liberalization, and poverty reduction and growth, among other fiscal and monetary issues. With such reform, Situmbeko and Zulu (2004) report that the World Bank hailed Zambia as having the most successful privatization programme in Sub-Saharan Africa. Despite the World Bank’s praise, Zambia’s economic, social and demographic indicators have deteriorated badly since the adoption of IMF programmes in the 1990s. It has been documented that SAPs and successor programmes led to massive job losses, increased poverty, limited spending for human resources for health, and a social crisis whose symptoms are worsening problems in public health and a decreasing life expectancy that is linked with the HIV/AIDS burden (Government of Zambia/UN, 1996; Carlsson et al., 2000; McCulloch et al., 2001). Situmbeko and Zulu (2004) further argue that poverty and un-payable debt in Zambia have made the country dependent on the IMF and other International Financial Institutions (IFIs). Given this history, the IMF exercises a considerable degree of control over the country’s economic policy. IMF and World Bank interventions have also been labelled unsuccessful, undemocratic, and unfair (ibid). This study explores the impacts of IMF programmes on Zambia’s ability to respond to the HIV/AIDS and TB epidemics (as key examples of disease-specific impacts) with broader implications for the country’s capability to effectively address other health crises and to develop sustainable health systems. The study looks at the trends in HIV/AIDS/TB mobility, mortality, funding for health and HIV/AIDS/TB, numbers of health professional working in the health sector in TB and HIV/AIDS, and support to health systems strengthening before the IMF programmes of the 1990s and the impact over time after their adoption.
1.2 Study Objectives The purpose of this research is to increase awareness and knowledge among governments, external development partners, civil society, and within the IMF of the nature of IMF programmes and conditionalities and their impact on the government’s ability to respond specifically to the HIV/AIDS and TB epidemics. The specific objectives were to:
• Review the content, process and transparency of the IMF Programmes, • Identify the key stakeholders in the process of accepting programmes and conditionalities, their
influence and power, • Identify trends in the total public (domestic) health expenditure, • Identify trends in the public (domestic) expenditure for TB and HIV/AIDS, • Identify trends in the public (domestic) expenditure for personnel for health, TB and HIV/AIDS, • Identify trends the number of health professionals working in the health sector, in TB and
HIV/AIDS, • Consider trends in accessing TB and HIV/AIDS treatment services, and • Identify other effects of IMF programmes on country ability to respond to TB and HIV/AIDS
1.3 Significance of the Study

____________________________________________________________________________________________________________________________________________________________________________
EEvviiddeennccee ooff TThhee IImmppaacctt ooff IIMMFF FFiissccaall aanndd MMoonneettaarryy PPooll iicciieess oonn tthhee CCaappaaccii ttyy ttoo AAddddrreessss HHIIVV//AAIIDDSS aanndd TTBB CCrriisseess iinn ZZaammbbiiaa,, 11999977 ttoo 22000077
6
This study provides more evidence on how IMF program polices have influenced the financing and delivery of health services (particularly HIV/AIDS and TB) in Zambia. The research feeds into the policy debates of the IMF, the government, donor agencies and civil society groups on the impact of IMF programmes on health, HIV/AIDS and TB, and provides recommendations to change and improve the status quo. The Zambian government and civil society groups can use the results from this study to demand for the IMF to change its macroeconomic restraint programmes, and to be more consultative during the policy and budget formulation processes.
1.4 Research Methodology
1.4.1 Study design This study combined both qualitative and quantitative data collection techniques. The study focused on IMF polices from 1990 to 2007 and comprised mainly information on IMF programmes obtained from documents through a comprehensive data search and in-person interviews with key informants. The study also is comprised of budget analysis obtained through the examination of national budget documents, medium-term expenditure frameworks (MTEFs), public expenditure reviews, and expenditure records.
1.4.2 Sampling Institutions were selected based on their involvement in (i) national economic management and planning, (ii) health planning and budgeting, (iii) research and academic, and (iv) advocacy and public awareness. The institutions that were included in the study were the Bank of Zambia, the MoH, the MoFNP, the IMF, the World Bank, the Churches Health Association of Zambia (CHAZ), the Civil Society for Poverty Reduction, OXFAM, National AIDS Council (NAC) and the University of Zambia (UNZA). From the above institutions, a pool of interviewees, especially executive directors of civil society organizations, directors in planning and public health, national budget specialists, health planners, economists, and HIV/AIDS and TB programme specialists, were selected based on expertise or years of service at the institution. HIV/AIDS and TB programme specialists were selected from the MoH and NAC.
1.4.3 Scope of the Study The study is focused on IMF programmes that have been implemented in Zambia between 1990 and 2007. Specifically, the assessment of the impact of IMF programmes on Zambia’s response to health, HIV/AIDS and the TB crisis involved a description of how IMF macroeconomic programmes are formulated, the content of the programmes and the context in which they were formulated. The study also examined the socio-economic factors that led to the introduction and implementation of IMF programmes in Zambia. In order to ascertain whether the formulation of the programmes had been participatory we undertook a stakeholder analysis using existing literature and interviews with key informants. This was critical in order to determine the role of various players in influencing the policy process. Finally, the study examines the trends in budget allocations for health, HIV/AIDS and TB and personnel working in TB and HIV/AIDS programmes.

____________________________________________________________________________________________________________________________________________________________________________
EEvviiddeennccee ooff TThhee IImmppaacctt ooff IIMMFF FFiissccaall aanndd MMoonneettaarryy PPooll iicciieess oonn tthhee CCaappaaccii ttyy ttoo AAddddrreessss HHIIVV//AAIIDDSS aanndd TTBB CCrriisseess iinn ZZaammbbiiaa,, 11999977 ttoo 22000077
7
1.4.4 Sources of data The study focused primarily on IMF related programmes (such as the SAPs, ESAF, PRGF, SMP) and their impact on government response to the health, HIV/AIDS and TB crisis in Zambia. A desk review was carried out by reviewing relevant policy documents and reports including strategic plans, government legislature, planning guidelines and national budget documents, human resources for health data, and international agreements and reports. The Internet provided an important research tool to access IMF policy documents relevant to Zambia. The key search words used from websites were: “economic reforms”, “IMF”, “donor assistance”, “Structural Adjustment Programmes”, “SAPs”, “ESAF”, “PRSP, “PRGF”, “SMP”, “Zambia”, “aid conditionalities”, and “health reforms”. Several documents were found and reviewed including research articles and other technical reports from national and international databases and websites. Unpublished papers and presentations from national and international conferences were also accessed. National health accounts and data on budget allocations for health, HIV/AIDS and TB was obtained from the MoFNP, Bank of Zambia, MoH, NAC, the World Bank, the IMF, and WHO. The research team spent a lot of time establishing contacts with the key informants in government departments, civil society organizations, UNZA, and donor organizations and gaining their permission to access the required documents and to conduct face-to-face interviews.
1.4.5 Data analysis Analysis of the qualitative data was done by reviewing and categorizing responses from all the respondents. Similar responses within and across the interviews were grouped and then added to study questions and emerging themes until exhaustion. Qualitative data from the key informant interviews were then combined with quantitative data and triangulated with the already existing literature. In the process of data analysis, Microsoft Word and Excel were used. The data were presented in tables and graphs (line graphs, bar charts, pie charts) to show the trends overtime. We tracked the changes in health, HIV/AIDS and TB expenditure, human resources staffing levels, and outcomes and linked this to the period of IMF policy implementation.
1.4.6 Study Limitations and Challenges The study’s main limitation is the complexity in establishing direct causal relationship between the IMF programmes and their impact on health, HIV/AIDS and TB. The IMF programmes cannot be held entirely accountable for the positive/negative outcomes in health, HIV/AIDS and TB because IMF programmes are implemented as part of a broad set of other national macroeconomic programmes. The other limitation was the difficulty in getting data on HIV/AIDS before the IMF programmes. Historical data on HIV/AIDS and human resources before 1990 could have provided more insight into the study. In addition, a lot of data were extracted from several documents from different national and international sources, population based surveys and several authors during the period 1990 to 2007. Some of this data could be unreliable and not directly comparable.

____________________________________________________________________________________________________________________________________________________________________________
EEvviiddeennccee ooff TThhee IImmppaacctt ooff IIMMFF FFiissccaall aanndd MMoonneettaarryy PPooll iicciieess oonn tthhee CCaappaaccii ttyy ttoo AAddddrreessss HHIIVV//AAIIDDSS aanndd TTBB CCrriisseess iinn ZZaammbbiiaa,, 11999977 ttoo 22000077
8
CHAPTER TWO
2 SOCIO-ECONOMIC ENVIRONMENT
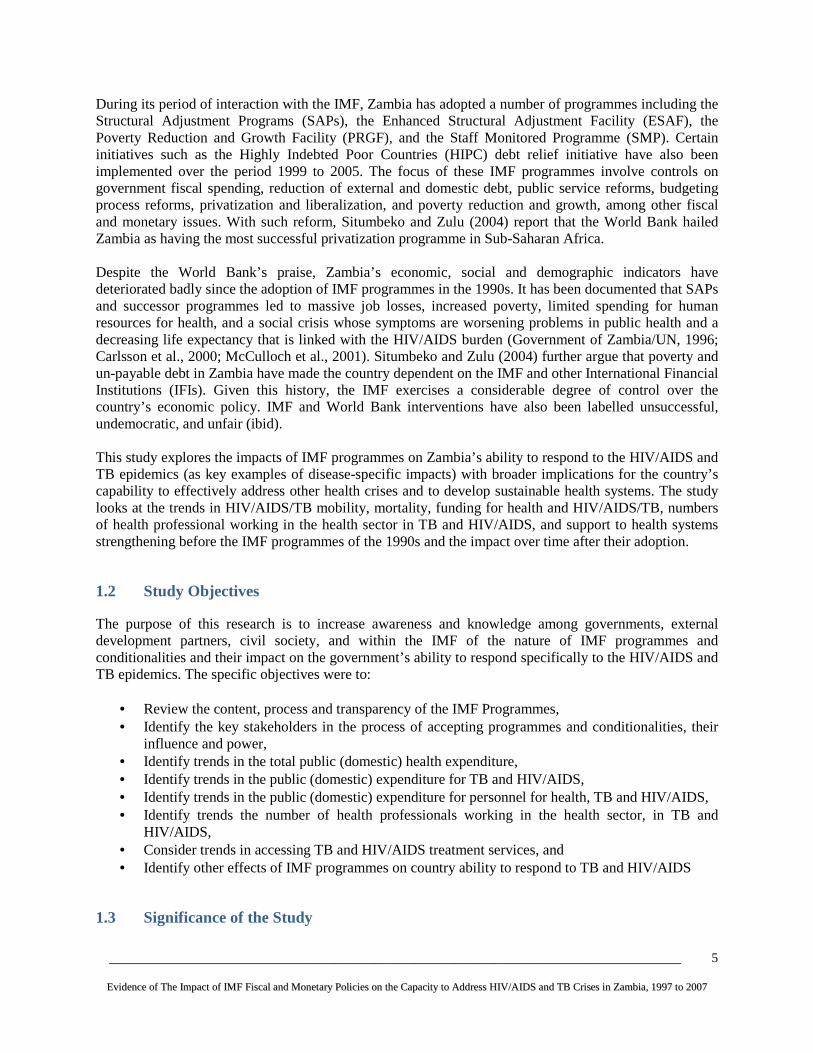
2.1 Key Economic Performance Indicators Economic growth in Zambia, one of the least developed countries in Southern Africa, is heavily dependent on earnings from copper production. During the 1990’s, the country registered minimal economic growth and by 2003, the real economic output grew by only 2.9% per annum while the GDP per capita was US$359 (Government of Zambia, 2002; Masiye et al., 2005). However, for the past 4 years, the economy has been experiencing macroeconomic stability as evidenced by growth in the real GDP of more than 5% per annum, reduction in inflation, appreciation of the Kwacha against the major international currencies, declining interest rates, reduced external debt burden, and an increase in foreign exchange reserves (MoFNP, 2008a). By the end of 2007, the GDP per capita was estimated at US$918 (WEO 2008). The recent economic growth can be attributed to a rise in the price of copper on the international market and as a result of debt cancellation under the Enhanced HIPC initiative, Group of Eight (8) countries, and the MDRI. These initiatives led to a reduction in Zambia’s total external debt from US$ 7.1 billion in 2004 to US$ 581 million (IMF, 2006a). Table 1 below provides a summary of the key economic indicators for Zambia.
____________________________________________________________________________________________________________________________________________________________________________
EEvviiddeennccee ooff TThhee IImmppaacctt ooff IIMMFF FFiissccaall aanndd MMoonneettaarryy PPooll iicciieess oonn tthhee CCaappaaccii ttyy ttoo AAddddrreessss HHIIVV//AAIIDDSS aanndd TTBB CCrriisseess iinn ZZaammbbiiaa,, 11999977 ttoo 22000077
9
Table 1: Key Economic Performance Indicators for Zambia (1999-2007) 1999 2000 2001 2002 2003 2004 2005 2006 2007 Nominal GDP at market prices (US $ m)
3,132 3,239 3,640 3,776 4,318 5,448 7,269 10,817 11,121
Real GDP growth rate, % 4.9 3.7 4.9 3.3 5.1 5.4 5.0 *6.2 *5.3 GDP per capita, USD 307.1 314.5 346.7 349.6 389.0 490.8 654.9 *917.4 *917.6 Inflation rate, % 20.6 30.1 18.8 26.7 17.2 17.5 15.9 *9.0 *10.7 Foreign direct investment as % of GDP
5.2 3.8 2.0 8.0 8.0 6.7 6.6
Overall balance on balance of payments (US $ m)
-334 -418 -289 -331 -275 -343 70
Average exchange rate: ZMK to USD
2388 3111 3608 4307 4743 4772 4464 3578 4003
Foreign exchange reserves expressed in terms of months of import cover
0.5 1.0 0.8 2.1 1.3 1.2 1.6
Total external debt as % of GDP
204.6 193.0 199.7 171.8 151.6 130.0 n.a.
Total external debt service as % of exports
14.7 15.7 13.1 10.9 14.6 18.3 6.7
Interest rate, nominal 44.28 50.40 38.65 33.92 13.05 17.19 11.50 Labour productivity growth, real
-1.52** -2.28** -3.66** 1.64** 7.81** 7.49** 0.76**
Average nominal wage (monthly) ZMK
345,514** 390,690** 441,773** 518,451** 809,375** 1,034,214** 1,472,191**
Wage growth, real 5.36** -6.85** -7.49** -3.33** 32.34** 7.99** 23.78** Wage/GDP ratio 19.61** 16.97** 14.00** 12.66** 15.55** 16.67** 22.84** Data Sources: Bank of Zambia Website except for: *IMF **Central Statistics Office/Ministry of Labour and Social Services
____________________________________________________________________________________________________________________________________________________________________________
EEvviiddeennccee ooff TThhee IImmppaacctt ooff IIMMFF FFiissccaall aanndd MMoonneettaarryy PPooll iicciieess oonn tthhee CCaappaaccii ttyy ttoo AAddddrreessss HHIIVV//AAIIDDSS aanndd TTBB CCrriisseess iinn ZZaammbbiiaa,, 11999977 ttoo 22000077
10
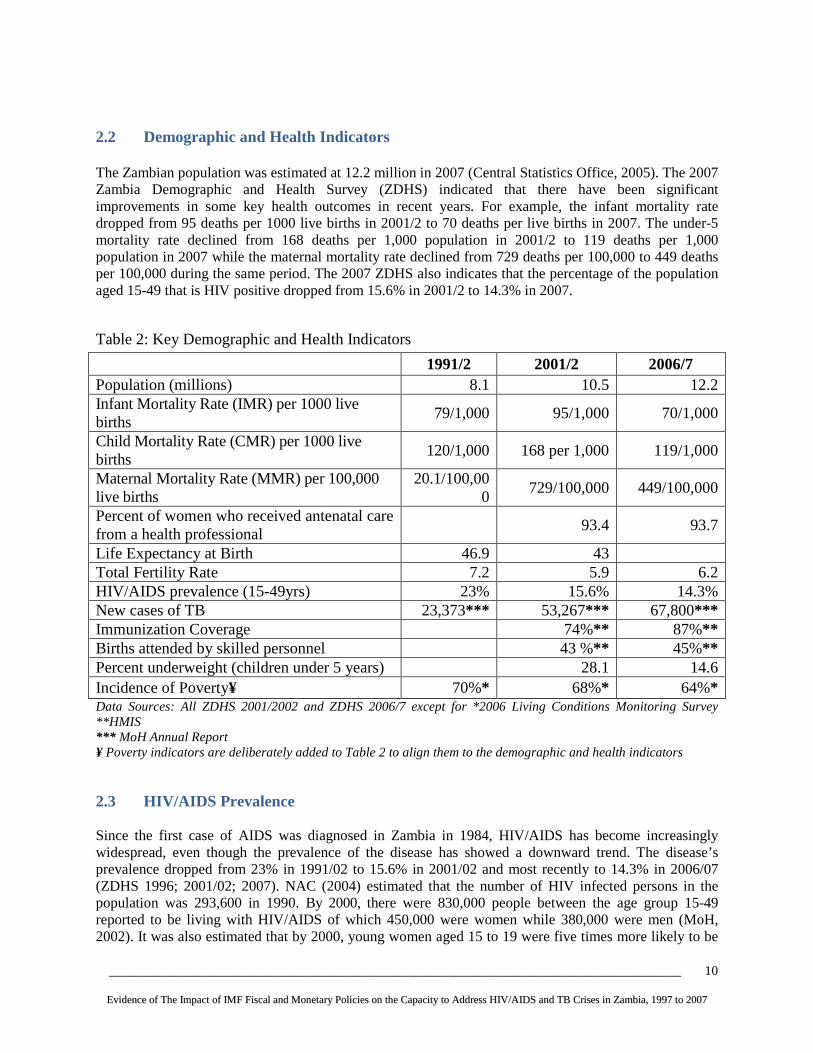
2.2 Demographic and Health Indicators The Zambian population was estimated at 12.2 million in 2007 (Central Statistics Office, 2005). The 2007 Zambia Demographic and Health Survey (ZDHS) indicated that there have been significant improvements in some key health outcomes in recent years. For example, the infant mortality rate dropped from 95 deaths per 1000 live births in 2001/2 to 70 deaths per live births in 2007. The under-5 mortality rate declined from 168 deaths per 1,000 population in 2001/2 to 119 deaths per 1,000 population in 2007 while the maternal mortality rate declined from 729 deaths per 100,000 to 449 deaths per 100,000 during the same period. The 2007 ZDHS also indicates that the percentage of the population aged 15-49 that is HIV positive dropped from 15.6% in 2001/2 to 14.3% in 2007.
Table 2: Key Demographic and Health Indicators
1991/2 2001/2 2006/7 Population (millions) 8.1 10.5 12.2 Infant Mortality Rate (IMR) per 1000 live births
79/1,000 95/1,000 70/1,000
Child Mortality Rate (CMR) per 1000 live births
120/1,000 168 per 1,000 119/1,000
Maternal Mortality Rate (MMR) per 100,000 live births
20.1/100,000
729/100,000 449/100,000
Percent of women who received antenatal care from a health professional
93.4 93.7
Life Expectancy at Birth 46.9 43 Total Fertility Rate 7.2 5.9 6.2 HIV/AIDS prevalence (15-49yrs) 23% 15.6% 14.3% New cases of TB 23,373*** 53,267** * 67,800*** Immunization Coverage 74%** 87%** Births attended by skilled personnel 43 %** 45%** Percent underweight (children under 5 years) 28.1 14.6 Incidence of Poverty¥ 70%* 68%* 64%* Data Sources: All ZDHS 2001/2002 and ZDHS 2006/7 except for *2006 Living Conditions Monitoring Survey **HMIS *** MoH Annual Report ¥ Poverty indicators are deliberately added to Table 2 to align them to the demographic and health indicators
2.3 HIV/AIDS Prevalence Since the first case of AIDS was diagnosed in Zambia in 1984, HIV/AIDS has become increasingly widespread, even though the prevalence of the disease has showed a downward trend. The disease’s prevalence dropped from 23% in 1991/02 to 15.6% in 2001/02 and most recently to 14.3% in 2006/07 (ZDHS 1996; 2001/02; 2007). NAC (2004) estimated that the number of HIV infected persons in the population was 293,600 in 1990. By 2000, there were 830,000 people between the age group 15-49 reported to be living with HIV/AIDS of which 450,000 were women while 380,000 were men (MoH, 2002). It was also estimated that by 2000, young women aged 15 to 19 were five times more likely to be

____________________________________________________________________________________________________________________________________________________________________________
EEvviiddeennccee ooff TThhee IImmppaacctt ooff IIMMFF FFiissccaall aanndd MMoonneettaarryy PPooll iicciieess oonn tthhee CCaappaaccii ttyy ttoo AAddddrreessss HHIIVV//AAIIDDSS aanndd TTBB CCrriisseess iinn ZZaammbbiiaa,, 11999977 ttoo 22000077
11
infected compared to males in the same age group with 25% of pregnant women being HIV positive (MoH, 2002). By 2007, the adult HIV population was estimated at 1,482,228 (MoH/NAC, 2008). The paediatric HIV population was at 82,825 in 2007 from 60,000 in 2005 (ibid).
Table 3: Trends in HIV Morbidity and Mortality
1990 2000 2005 2006 2007 Adult HIV Population 293,600 830,000 1,200,000 1,300,000 1,482,228 Adult AIDS Deaths 10,600 76,700 95,373 96,202 97,494 Paediatric HIV Population 60,000 70,000 82,825 Paediatric AIDS Deaths 6,000 7,000 8,283 Data Sources: MoH, 1992; 2002; NAC, 2004; MoH/NAC, 2008 The total number of adult AIDS-related deaths rose from 10,600 in 1990 to 76,700 in 2000 and by 2007, the number was 97,494 (NAC, 2004; MoH/NAC, 2008). The paediatric AIDS related deaths rose from 60,000 in 2005, to 70,000 in 2006, and 82,825 in 2007 (MoH/NAC, 2008). NAC (2006a) estimates that nearly 80% of HIV transmission in Zambia is through heterosexual contact and this is exacerbated by high-risk sexual practices, gender inequity, stigma and discriminatory practices and high prevalence of sexually transmitted infections and tuberculosis. The transmission of HIV is also strongly linked to the high poverty levels in the country. The MoH (2002) observes that the relationship between HIV/AIDS and poverty is complex, that manifestations of HIV/AIDS lead to poverty, and that the state of poverty directly or indirectly creates vulnerability to HIV/AIDS. HIV/AIDS leads to poverty by eliminating the productive sector of society, the 15-49 years age group (ibid). The high poverty levels in the country have fuelled HIV/AIDS, which has in turn led to loss of household income as other members of the household divert time from income-generating activities to care for patients, rising costs for medical care, and greater expenses as families take over care of children from deceased relatives. Children are removed from school to save school fees, leading to a loss of human capital and potential future income. Orphaned children whose parents die from HIV/AIDS are the most vulnerable. In 2005, the Central Statistics Office estimated that the number of orphans ranged from 750,000 to 1.2 million, out of which 75% are HIV orphans (Central Statistics Office, 2005). NAC (2004) and the MoH (2002) highlight the negative impact of HIV/AIDS on industrial productivity due to increased expenditure and reduced revenue. They affirm that companies have been experiencing increased expenditures for employees’ health care costs, burial costs, and recruitment/training of new workers to replace the deceased. In addition, the HIV/AIDS epidemic has contributed to reduced productivity and revenue as a result of increased absenteeism (due to illness), high attendance of funerals, rapid turnover of labour, and acquisition of a less experienced labour force (ibid). The economic cost of HIV/AIDS is enormous. Despite the loss of national income and increased health care costs there have been minimal allocations to the health sector. HIV/AIDS negatively impacts the economy through lower GDP output growth and reduced standard of living. Resch and others (2008) predict that in the medium term, HIV/AIDS will reduce the per capita GDP by 5.8%, with 30% of the reduction attributable to the disease’s impact on capital/labour ratio, and 53% from experience and knowledge loss due to AIDS mortality. Faced with the HIV/AIDS epidemic, the Zambian government, with the assistance of several external development partners, has provided antiretroviral therapy since 2002. In 2002, the government decided to make antiretroviral therapy (ART) widely available and allocated US$3 million to purchase antiretroviral

____________________________________________________________________________________________________________________________________________________________________________
EEvviiddeennccee ooff TThhee IImmppaacctt ooff IIMMFF FFiissccaall aanndd MMoonneettaarryy PPooll iicciieess oonn tthhee CCaappaaccii ttyy ttoo AAddddrreessss HHIIVV//AAIIDDSS aanndd TTBB CCrriisseess iinn ZZaammbbiiaa,, 11999977 ttoo 22000077
12
drugs (ARVs) for 10,000 people, to be provided through the public health service at a subsidized rate. In 2005, calls for universal access to treatment prompted the government to launch a policy aimed at providing free and universal access to ART. This policy led to an increase in the number of adults and children on ARVs from 12,000 in 2004 to 51,764 in 2005 (NAC, 2006a), 80,030 in 2006, and 149,199 in 2007 (MoH/NAC, 2008). Despite increased access to ARVs by children and adults in 2005, 2006, and 2007, the number of people receiving treatment is far below the estimated number of people living with HIV that require treatment. The estimated number of people living with HIV that require treatment was approximately 200,000 in 2005 (NAC, 2006a), 243,252 in 2006, and 295,240 in 2007 (MoH/NAC, 2008). Thus, in 2005, only 26% of all adults and children with advanced HIV infection requiring treatment were receiving ART, while in 2006 and 2007, about 33% and 51% were on treatment, respectively. The importance of scaling-up the provision of ART cannot be overemphasized. Citing the United Nations Secretariat (2003), Resch and others (2008) observe that, in the absence of major changes in treatment or prevention, AIDS will have increased the number of annual deaths in the country by 83% and, cumulatively, 2.8 million people will have died of AIDS by the year 2015. This is evidenced by the decline in the fertility rate from 7.2% in 1991/2 to 5.9% in 2001/2 and 6.2% in 2006/7. The slower rate of population growth from 2.3% in 1998 to 1.6% in 2005 is also testimony of the impact of HIV/AIDS on the demography of the nation (UNDP Data, WDI-Zambia 1998-2005). Life expectancy at birth also dropped from 47 years in 1991/2 to 43 years in 2001/2 (ZDHS, 2001/2) to 38 years in 2004 (UNDP Data, WDI-Zambia 1998-2005).
2.4 Magnitude of TB in Zambia There has been a rapid increase in the number of new tuberculosis cases, mainly due to HIV/AIDS-related tuberculosis. The MoH (1992) notes that the number of new cases of tuberculosis increased from an annual average of 5,342 in 1980 to 6,747 in 1985. By 1991, there were 23,373 new cases of tuberculosis, signifying a 246% increase over the 1985 figure (6 years later). The WHO estimates the incidence for all forms of TB cases at 553/100,000 in 2007, which corresponds to 67,800 cases in 2007 (MoH, 2007). TB, by far the most frequent opportunistic infection for people with HIV, complicates and shortens the lives of HIV-infected persons in Zambia. In 2001, the MoH estimated that TB was complicating and shortening the lives of 30-40% of all persons infected with HIV in Zambia (MoH, 2001). By 2005, it was estimated that the HIV/AIDS epidemic was fuelling about 70% of the incidence of new TB cases (MoH. 2005a). The percentage of estimated HIV-positive incident TB cases that received treatment for TB and HIV was 34.8% out of a total of 60,723 that needed treatment. In 2007, 66% (12,835) of the TB patients tested positive for HIV/AIDS out of which 39% (5,017) were started on ART (MoH/NAC, 2008). There is also evidence of rising trends in the prevalence of Multi-Drug Resistant TB (MDR TB) which was estimated at 1.8% in 2001 (MoH, 2005a). From the foregoing, it is extremely clear that the government of Zambia requires substantial amounts of resources in order for it to halt and reverse the negative impact of HIV/AIDS and TB. However, IMF programmes like the SAP, ESAF, PRSP, and the SMP have made it difficult for the MoH to fully implement and sustain HIV/AIDS and TB programmes. This argument is presented in the following chapters.

____________________________________________________________________________________________________________________________________________________________________________
EEvviiddeennccee ooff TThhee IImmppaacctt ooff IIMMFF FFiissccaall aanndd MMoonneettaarryy PPooll iicciieess oonn tthhee CCaappaaccii ttyy ttoo AAddddrreessss HHIIVV//AAIIDDSS aanndd TTBB CCrriisseess iinn ZZaammbbiiaa,, 11999977 ttoo 22000077
13
CHAPTER THREE
3. STUDY FINDINGS
3.1 Overview of Zambia’s IMF Programmes, 1990-2007 External cooperating partners, or donors, play a major role in the design and implementation of macroeconomic policies and programmes in Zambia. Of particular concern are IMF fiscal and monetary policy targets of the last 20 years and how these have influenced the country’s ability to respond to health problems, including HIV/AIDS and TB. Through a comprehensive document review and key informant interviews, it was established that the policy approach used in IMF programmes has negatively impacted government health expenditure, infrastructure investment, human resource development, and health service utilisation.
3.1.1 Structural Adjustment Programme and the Enhanced Structural Adjustment Facility Due to the IMF SAPs that were introduced in 1992, many people were pushed into poverty throughout the 1990s. Situmbeko and Zulu (2004) note that when Zambia returned to the IMF in 1989, several conditions were attached to the loan agreements, including devaluation of the kwacha, privatization, and trade and agriculture liberalization. The SAPs were aimed at adjustment and stabilization and were implemented through short-term measures such as public sector reform, market liberalisation, and tight fiscal policy aimed at decreasing the public sector deficit (Carlsson et al., 2000). The SAPs led to massive job loss, increased dependency ratios, and a breakdown of socio-economic networks. Carlsson (2000) observes that in the 1990s, retrenchment and factory closings caused mass unemployment, causing peri-urban inhabitants to try to make their living from small-scale businesses. This led to overcrowding, increased diseases, poor sanitary environment and lack of clean water. Situmbeko and Zulu (2004) also observe that by the end of 2001, a total of 257 public owned companies and units were privatized out of a target of 280. Many of the privatized companies collapsed, most people lost jobs and welfare programmes originally performed by the private companies were discontinued. Job losses were not offset by new private sector employment. According to the Central Statistics Office (1997) formal employment rose from 362,000 workers in 1986 to 546,000 workers in 1992 and then dropped to 472,000 in 1996. Job loss and rising unemployment due to IMF-initiated civil service downsizing further worsened the country’s poverty levels. By 1996, unemployment was estimated at 15%. Trade liberalization also brought massive problems to Zambia. Situmbeko and Zulu (2004) reveal that formal manufacturing employment fell by about 43% between 1991 and 1998, while paid employment in mining and manufacturing fell by 41% between 1991 and 2000. This left tens of thousands of Zambian families without incomes. Despite the boom in global copper prices in recent years, copper-belt communities in Zambia did not see the development gains they were promised. Recent reports from the Civil Society Trade Network of

____________________________________________________________________________________________________________________________________________________________________________
EEvviiddeennccee ooff TThhee IImmppaacctt ooff IIMMFF FFiissccaall aanndd MMoonneettaarryy PPooll iicciieess oonn tthhee CCaappaaccii ttyy ttoo AAddddrreessss HHIIVV//AAIIDDSS aanndd TTBB CCrriisseess iinn ZZaammbbiiaa,, 11999977 ttoo 22000077
14
Zambia and the Catholic Commission for Justice, Development and Peace (Fraser and Lungu 2007) and others have documented how IMF and World Bank loan conditions caused Zambia to lose national control over mining companies, due to weakening state institutions until they could not regulate company behaviour. Other devastating impacts include job losses and insecurity, deepening of pensioner poverty, and failure to protect the social infrastructure (McCulloch et al 200; Browne 2007; Eurodad 2008).
3.1.2 Poverty Reduction and Growth Facility The Poverty Reduction and Growth Facility (PRGF) is the IMF's low-interest lending facility for low-income countries. Loans under the PRGF carry an annual interest rate of 0.5 percent, with repayments made semi-annually, beginning 5.5 years and ending 10 years after the disbursement. Eligibility is based principally on the IMF's assessment of a country's per capita income, drawing on the cut-off point for eligibility to World Bank concessional lending. The PRGF replaced the Enhanced Structural Adjustment Facility (ESAF) of the IMF as a lending window for poor countries. The PRGF was designed to usher in a new era of reduced loan conditionalities to low-income countries. The IMF states, “PRGF-supported programs are framed around comprehensive, country-owned Poverty Reduction Strategy Papers (PRSPs). PRSPs are prepared by governments with the active participation of civil society and other development partners. PRSPs are then considered by the Executive Boards of the IMF and World Bank as the basis for concessional lending from each institution and debt relief under the joint Heavily Indebted Poor Countries (HIPC) Initiative” (IMF 2008c). The IMF claims the policies in the PRG are informed by the PRSPs. In practice, however, the PRGF’s actual quantitative targets and policy conditions are agreed during periodic closed-door discussions between the finance ministry and IMF officials. These specific targets that are decided are extremely important because they set the parameters within which the numbers are derived for use in the MTEFs and national budget planning. The decided targets may later be alluded to in PRSP documents, but they are not decided there, nor are such targets even allowed to be debated in government-led CSO consultations for PRSPs. PRGF programmes were introduced in Zambia in 1999 and have continued operation. The first PRSP, however, was operational from 2002 to 2004, and in 2005, the Fifth National Development Plan (FNDP) was developed to cover the period 2006 to 2010. Both the PRSP and FNDP describe Zambia's macroeconomic, structural, and social policies that prioritise achieving and then maintaining “macroeconomic stability” according the IMF’s restrictive definition, with the assumption that this will lay the foundation for growth and poverty reduction, as well as associated external financing needs and major sources of financing (MoFNP, 2002; 2006). Under the PRGF, the IMF’s goal is to maintain macroeconomic stability, with an emphasis on improved public resource management/accountability, reduced inflation, and strengthened external position. The PRGF was also designed to reduce loan conditionalities. In reality, however, PRGF programmes in Zambia have included quantitative and structural performance criteria. This includes continuous quantitative performance criterion on the non-accumulation of new external arrears and a structural performance criterion on cabinet approval of proposals to repeal sections of various acts that are in conflict with the Banking and Financial Services Act. The other conditions were the privatization of the Zambia Electricity Supply Company (ZESCO), and the Zambia National Commercial Bank (ZANACO). AFRODAD (2006) observes that failure to comply with conditionalities on expenditure control, and privatization of ZESCO and ZANACO prompted the IMF to revert back to ESAF fiscal controls. After the ESAF, Zambia accessed a loan under the PRGF which ran from 25th March 1999 to 28th March 2003. Upon expiry, the government pushed for another PRGF but it failed to access the facility twice in July and December 2003 because of a budget over-run (Global Policy Forum, 2005). Zambia was
____________________________________________________________________________________________________________________________________________________________________________
EEvviiddeennccee ooff TThhee IImmppaacctt ooff IIMMFF FFiissccaall aanndd MMoonneettaarryy PPooll iicciieess oonn tthhee CCaappaaccii ttyy ttoo AAddddrreessss HHIIVV//AAIIDDSS aanndd TTBB CCrriisseess iinn ZZaammbbiiaa,, 11999977 ttoo 22000077
15
considered ineligible for assessing PRGF loans due to financial slippages in the budget in 2003 mainly due to a high public sector wage bill and weak policy implementation (Bank of England, n.d; AFRODAD, 2006). The IMF ordered Zambia to curtail spending and to put in place sound macroeconomic management systems if it were to access another PRGF (Bank of England, n.d; AFRODAD, 2006). In order to ensure that this was done, the IMF put the country on their Staff-Monitored Programme (SMP), which authorized the IMF to monitor Zambia's economic performance and its spending pattern before accessing a another tranche of the PRGF loan. Zambia was initially on course to reach the HIPC completion point by the end of December 2004, but failed to fulfil an additional 15 benchmarks.
Zambia was on the SMP from 2003 to 2006, during which time it was required to satisfactorily comply with each the conditions on the SMP in order to get back “on track” with its regular PRGF programme and HIPC debt cancellation process. In 2004, after satisfactory compliance, the IMF resumed the PRGF loan programme to Zambia, offering a new 3-year line of credit amounting to SDR 220 million (about US$320 million) for the period June 2004 to September 2007 (IMF, 2008a). Most recently, in June 2008, the IMF approved another new 3-year PRGF programme amounting to SDR 48.91 million (about US$79.2 million) for the period of June 2008 to May 2011.
3.1.3 Current Update on Zambia’s PRGF, 2009 An IMF mission visited Zambia during February-March 2009 for the first and second scheduled reviews of the new PRGF arrangement. The IMF mission noted that although Zambia had benefited from high copper prices in recent years until prices dropped in 2008, today economic growth in Zambia has slowed as a result of both falling copper prices and the general global economic recession. The mining sector has been hit hard by the sharp fall in copper prices since mid-2008, which has resulted in cutbacks in production and the scaling back or suspension of expansion projects. Sectors with links to the copper industry are also being adversely affected, as are other sectors facing weaker external or domestic demand. The reduced foreign exchange inflows from the mining sector, along with outflows of portfolio capital, have led to a steep depreciation of the kwacha. After years of struggling with an appreciation of the currency due to high copper revenues, now authorities are now grappling with a sudden depreciation, underscoring the hazards and costs of adopting the IMF’s preferred “market-based” floating exchange rate policy. The IMF and Zambian authorities reached agreement on the key policy targets for the current macroeconomic framework for 2009, including the maintenance of a nearly balanced budget, a tight monetary policy of inflation below 5 percent, increased international currency reserves up to 5 months worth of imports, and the maintenance of market-determined interest rates and exchange rate. Quantitative and structural “performance criteria” (binding IMF loan conditions) and benchmarks have been set for June and December 2008, and indicative targets for September 2008. Quantitative performance criteria are proposed on (i) net domestic assets; (ii) net domestic financing of the central government; (iii) gross international reserves; (iv) new external arrears; (v) short-term external debt; and (vi) contracting or guaranteeing of external non-concessional debt by the public sector. Structural conditionality focuses on reforms in public expenditure and debt management, tax administration, financial sector development, and policies to strengthen the performance of the electricity sector. The programme will be monitored by the IMF semi-annually, and regular data on reserve money, including its components are required by IMF from the BoZ on weekly and end-monthly bases.
____________________________________________________________________________________________________________________________________________________________________________
EEvviiddeennccee ooff TThhee IImmppaacctt ooff IIMMFF FFiissccaall aanndd MMoonneettaarryy PPooll iicciieess oonn tthhee CCaappaaccii ttyy ttoo AAddddrreessss HHIIVV//AAIIDDSS aanndd TTBB CCrriisseess iinn ZZaammbbiiaa,, 11999977 ttoo 22000077
16
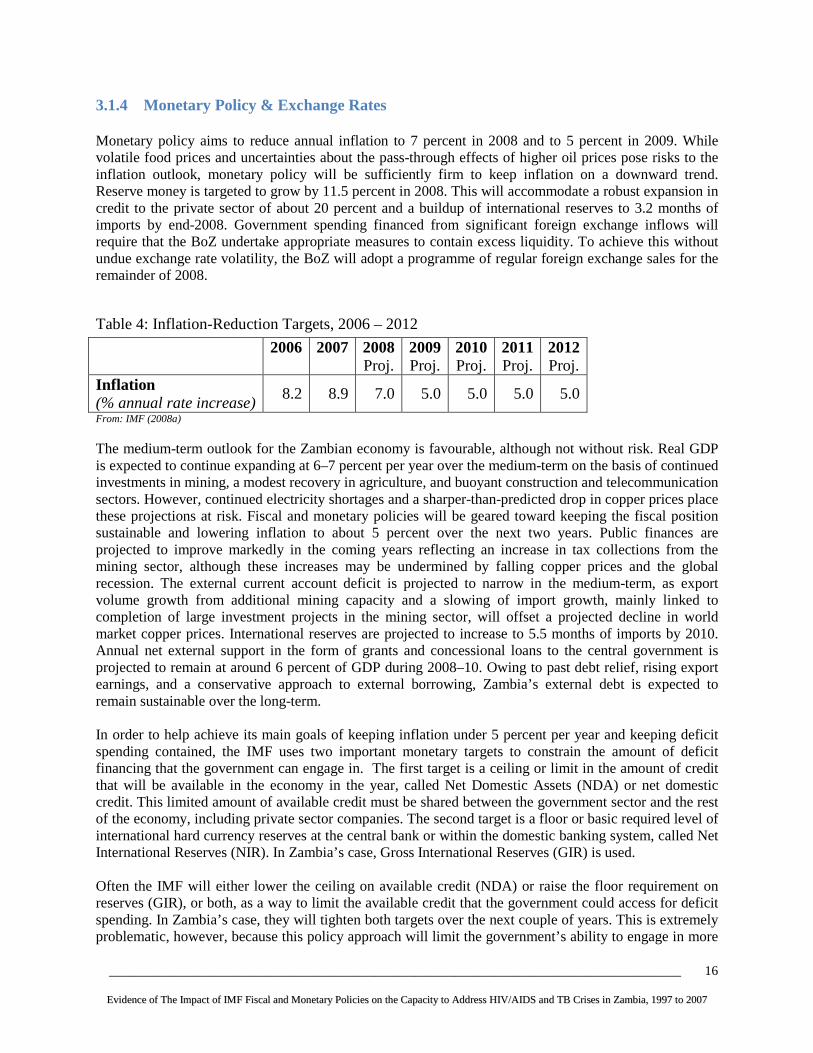
3.1.4 Monetary Policy & Exchange Rates Monetary policy aims to reduce annual inflation to 7 percent in 2008 and to 5 percent in 2009. While volatile food prices and uncertainties about the pass-through effects of higher oil prices pose risks to the inflation outlook, monetary policy will be sufficiently firm to keep inflation on a downward trend. Reserve money is targeted to grow by 11.5 percent in 2008. This will accommodate a robust expansion in credit to the private sector of about 20 percent and a buildup of international reserves to 3.2 months of imports by end-2008. Government spending financed from significant foreign exchange inflows will require that the BoZ undertake appropriate measures to contain excess liquidity. To achieve this without undue exchange rate volatility, the BoZ will adopt a programme of regular foreign exchange sales for the remainder of 2008.
Table 4: Inflation-Reduction Targets, 2006 – 2012
2006
2007
2008 Proj.
2009 Proj.
2010 Proj.
2011 Proj.
2012 Proj.
Inflation (% annual rate increase)
8.2 8.9 7.0 5.0 5.0 5.0 5.0
From: IMF (2008a) The medium-term outlook for the Zambian economy is favourable, although not without risk. Real GDP is expected to continue expanding at 6–7 percent per year over the medium-term on the basis of continued investments in mining, a modest recovery in agriculture, and buoyant construction and telecommunication sectors. However, continued electricity shortages and a sharper-than-predicted drop in copper prices place these projections at risk. Fiscal and monetary policies will be geared toward keeping the fiscal position sustainable and lowering inflation to about 5 percent over the next two years. Public finances are projected to improve markedly in the coming years reflecting an increase in tax collections from the mining sector, although these increases may be undermined by falling copper prices and the global recession. The external current account deficit is projected to narrow in the medium-term, as export volume growth from additional mining capacity and a slowing of import growth, mainly linked to completion of large investment projects in the mining sector, will offset a projected decline in world market copper prices. International reserves are projected to increase to 5.5 months of imports by 2010. Annual net external support in the form of grants and concessional loans to the central government is projected to remain at around 6 percent of GDP during 2008–10. Owing to past debt relief, rising export earnings, and a conservative approach to external borrowing, Zambia’s external debt is expected to remain sustainable over the long-term. In order to help achieve its main goals of keeping inflation under 5 percent per year and keeping deficit spending contained, the IMF uses two important monetary targets to constrain the amount of deficit financing that the government can engage in. The first target is a ceiling or limit in the amount of credit that will be available in the economy in the year, called Net Domestic Assets (NDA) or net domestic credit. This limited amount of available credit must be shared between the government sector and the rest of the economy, including private sector companies. The second target is a floor or basic required level of international hard currency reserves at the central bank or within the domestic banking system, called Net International Reserves (NIR). In Zambia’s case, Gross International Reserves (GIR) is used. Often the IMF will either lower the ceiling on available credit (NDA) or raise the floor requirement on reserves (GIR), or both, as a way to limit the available credit that the government could access for deficit spending. In Zambia’s case, they will tighten both targets over the next couple of years. This is extremely problematic, however, because this policy approach will limit the government’s ability to engage in more

____________________________________________________________________________________________________________________________________________________________________________
EEvviiddeennccee ooff TThhee IImmppaacctt ooff IIMMFF FFiissccaall aanndd MMoonneettaarryy PPooll iicciieess oonn tthhee CCaappaaccii ttyy ttoo AAddddrreessss HHIIVV//AAIIDDSS aanndd TTBB CCrriisseess iinn ZZaammbbiiaa,, 11999977 ttoo 22000077
17
deficit financing, therefore blocking the possibilities for any kind of significant “scaling up” for the MDGs, HIV/AIDS or TB. By setting these two monetary targets in this way, the IMF restricts the government of Zambia’s ability to make the large, upfront increases in public spending and investment in the public health system needed to successfully fight against HIV/AIDS and TB over the long-term. The entire macroeconomic framework is held hostage by the IMF’s idea that keeping the growth rate of the money supply (inflation) extremely low in the constant short-run must be a priority that subordinates all other goals. This idea must be critically revisited and reconsidered among a broader group of public stakeholders.
Table 5: Quantitative Monetary Targets for PRGF in Zambia: GIR/NDA
2005
2006
2007
2008 Proj.
2009 Proj.
2010 Proj.
2011 Proj.
2012 Proj.
NDA (billions of kwacha)
3,029 348 -1,242 -2,019
Gross International Reserves (millions of US Dollars)
331 595 947 1,329 1,810 2,231 2,461 2,684
In Months of Imports (millions of US Dollars)
1.5 2.2 2.5 3.2 4.7 5.5 5.9 6.2
From: IMF (2008a) The latest data from IMF documents project that over the next few years, the IMF will have Zambia lower the ceiling on available credit (NDA) while raising the required floor for gross international currency reserves (GIR), thereby squeezing away possibilities for greater “fiscal space” that could enable a scaling-up of spending for HIV/AIDS or TB and investment in health systems. The data indicate that the levels for GIR are intended to nearly double from 3.2 months of imports in 2008 to 6.2 months by 2012. The IMF and finance ministry want to build reserves to serve as a buffer during economic shocks. Building the reserves, however, also constrains fiscal space by restricting the space for additional net domestic financing. An additional reason for building reserves is that it will supposedly prevent large aid inflows from causing an appreciation of the currency (“Dutch Disease”). A September 2008 UN meeting of the MDG Africa Steering Group discussed the “Gleneagles Scenario” of doubling ODA by 2010. The participants reiterated the need for increased aid in order to achieve the MDGs. At the same time, a report issued by the IMF assessed the macroeconomic implications of scaling-up aid in Benin, Niger and Togo and warned that higher levels of aid will put moderate to sizable pressures on inflation and real exchange rates (IMF, 2008b). Concerns about such macroeconomic outcomes often constrain the full use of aid. Policies become too restrictive to allow full spending and absorption, even when aid is scaled-up. Countries are advised to maintain high interest rates, adopt inflation-targeting, and limit public expenditure. Macroeconomic policies have not been expansionary enough to increase MDG levels of spending. To identify how concerns about macroeconomic instability have curtailed an effective response to MDG scale-up, we look at the cases of Kenya, Malawi and Zambia. These countries are all confronting human development challenges and receiving resources to respond effectively; they are not, however, effectively using these resources.
____________________________________________________________________________________________________________________________________________________________________________
EEvviiddeennccee ooff TThhee IImmppaacctt ooff IIMMFF FFiissccaall aanndd MMoonneettaarryy PPooll iicciieess oonn tthhee CCaappaaccii ttyy ttoo AAddddrreessss HHIIVV//AAIIDDSS aanndd TTBB CCrriisseess iinn ZZaammbbiiaa,, 11999977 ttoo 22000077
18
We compare spending and absorption before and during the aid surge periods to demonstrate the stance taken by the macroeconomic authorities in each country. Full absorption implies that the current account deficit was financed by an amount equal to or greater than the increase in the flow of aid. Full spending means expansion of the budget deficit before grants during the aid surge by an amount equal to the increase in aid In Zambia, 39 per cent of the aid was absorbed and only 6 per cent was spent. As expected, the level of international reserves increased. The inflation rate fell slightly. Surprisingly, the real exchange rate appreciated in the face of low absorption and spending of aid receipts. Despite the restrictive macroeconomic stance, Zambia experienced a less encouraging macroeconomic outcome (Hailu 2008; IEO 2007). As a major recipient of ODA inflows, Zambia’s drive to build gross international currency reserves (GIR) amounts to a pre-emptive macroeconomic policy driven by fears of a “Dutch disease” effect. What is often forgotten, however, is that short-term macroeconomic movements are normal and expected after resources are scaled up. Large and persistent changes in inflation and exchange rates indicate a lack of supply response. Despite these obvious facts, the low level of absorption and spending in these countries is a direct consequence of macroeconomic conservatism (Hailu 2008). According to the IMF’s macroeconomic framework in Zambia, a number of macroeconomic and fiscal measures are in place to curb spending. The Medium-Term Expenditure Framework (MTEF) allows for only partial absorption and very little spending of aid because it is based on very restrictive fiscal and monetary targets focused mainly on keeping the overall budget deficit at under 1 percent of GDP, inflation at less than 5 percent, and to increase international reserves. An alternative policy approach for Zambia is advocated by the UNDP’s International Poverty Centre, which has emphasized the urgent need for large-scale programmes to meet the MDGs. According to the IPC, fiscal and monetary policies have to be expansionary in order to scale-up resources in the interest of achieving the MDGs. Macroeconomic management must encourage full spending and absorption of aid. In recent years rising international copper price and a market-based exchange rate resulted in a dramatic appreciation of the kwacha (over thirty percent in nominal terms from early 2005 to early 2008). Throughout this period the Bank of Zambia’s interventions were effective in reducing the appreciation but too small to prevent major appreciation. As a consequence of not more aggressively intervening in the currency market, the appreciation of the kwacha had a substantially negative impact on employment and public revenue generation. The economic consequences of this were aggravated by the strict budget conditionality set by the IMF (Weeks 2008; Bova 2008). The rapid rise in the international price of copper resulted in a substantial appreciation of the Kwacha, which had negative fiscal effects, caused domestic welfare losses, and reduced external competitiveness. Short term management of the exchange rate was necessary, within a long term development framework. According to Weeks (2008), given the openness of Zambia’s economy and its sensitivity to the copper price, an appropriate policy would be a managed fixed exchange rate. Over the last two decades, governments followed an IMF policy of “getting the short term economic management right and hoping the long run will take care of itself”. In a natural resource based country, this has been a recipe for slow growth and copper dependence (Weeks 2008). The recent years during which Zambia attempted to manage the copper boom in commodity markets provide a concrete basis to evaluate various exchange-rate regimes. The Zambia boom elicited an influx of foreign exchange that, together with speculative capital inflows and debt relief, sharply appreciated the Kwacha, first in November 2005 and then again during mid-2007 to mid-2008. However, because the Bank of Zambia was committed to using foreign exchange interventions only to smooth volatility in the exchange rate, it did not undertake any concerted efforts to counteract the appreciation, especially during

____________________________________________________________________________________________________________________________________________________________________________
EEvviiddeennccee ooff TThhee IImmppaacctt ooff IIMMFF FFiissccaall aanndd MMoonneettaarryy PPooll iicciieess oonn tthhee CCaappaaccii ttyy ttoo AAddddrreessss HHIIVV//AAIIDDSS aanndd TTBB CCrriisseess iinn ZZaammbbiiaa,, 11999977 ttoo 22000077
19
the sharp upturn of 2005. As a result, Zambia’s non-traditional exporters of tobacco, cotton, coffee and horticulture experienced a 30 per cent decrease in their earnings in domestic currency terms, and thus contracted their production in 2006-2007 (Bova 2008). This drop in production had dramatic consequences for employment since these sectors accounted for almost 70 percent of the total workforce while the copper mines accounted for only 10 per cent (ibid).
3.1.5 Fiscal Policy According to the IMF (2009), "The government is responding appropriately to the changed economic circumstances. Within the framework of a narrower fiscal space, due to reduced tax revenue, the proposed 2009 budget strikes a balance between increasing domestically-financed infrastructure spending in support of diversification of the economy and maintaining macroeconomic stability. Moreover, the required domestic financing of the budget deficit leaves room for substantial private sector credit growth.” According to the IMF loan review in June 2008, the fiscal policy stance was targeted to be more expansionary in 2008, with no need for any additional net domestic financing. Revenues were projected to rise by 2.5 percentage points of GDP based on a marked increase in mining taxes (to 3.2 percent of GDP) and nontax revenue. Foreign aid grants were expected to increase by 0.6 percentage points to 5.3 percent of GDP. Expenditures were budgeted to rise by 2.8 percentage points due to a rebound in capital spending from the 2007 low; an increase in the public sector wage bill because of social sector hiring and a 2–3 percent real wage increase; and allocations to the constitutional review process and arrears clearance (these will increase spending by 1.1 percent of GDP compared to 2007). The fiscal deficit, after grants, is projected to widen by only 0.3 percent of GDP reflecting an unusually high check float in 2007.
Table 6: Budget Deficit Targets, 2006 – 2012
2006
2007
2008 Proj.
2009 Proj.
2010 Proj.
2011 Proj.
2012 Proj.
Budget Balance (after grants) (% of GDP)
18.6 -0.2 -1.1 0.9 0.4 -3.1 -3.0
From: IMF (2008a)
A major part of the fiscal strategy is based on expected revenue increases from the new mining tax. When copper prices were high in recent years, the global commodities boom did actually give a new degree negotiating power to countries that export raw materials. The Zambian government has toughened its treatment of extractive industry contracts that were originally promoted as part of World Bank and IMF conditionality. In 2007, Zambia began to demand higher royalties from mining multinationals, which had been given tax concessions as part of World Bank-supported efforts to improve the “investment climate”. Former President Levy Mwanawasa announced the cancellation of all tax concessions for copper mining companies operating in Zambia, saying they were “unfair and unbalanced”. In their place “the government has, therefore, decided to introduce a new fiscal and regulatory regime in order to bring about equitable distribution of the mineral wealth.” It includes higher royalties and a windfall profits tax, bringing dramatic change to the expected tax revenue. Without the reforms mining firms would have earned $4 billion in the 2009 financial year but would only have paid tax of $300 million. Tax was expected to reach $650 million after the change (Wilks and Ruiz 2008). This new fiscal regime for the mining sector came into effect on April 1, 2008. The new regime, which supersedes existing development agreements, will substantially increase the government share of mining profits and rents. The changes include an increase in the mineral royalty to 3 percent (from 0.6 percent), an increase in the corporate income tax to 30 percent (from 25 percent), and introduction of either a
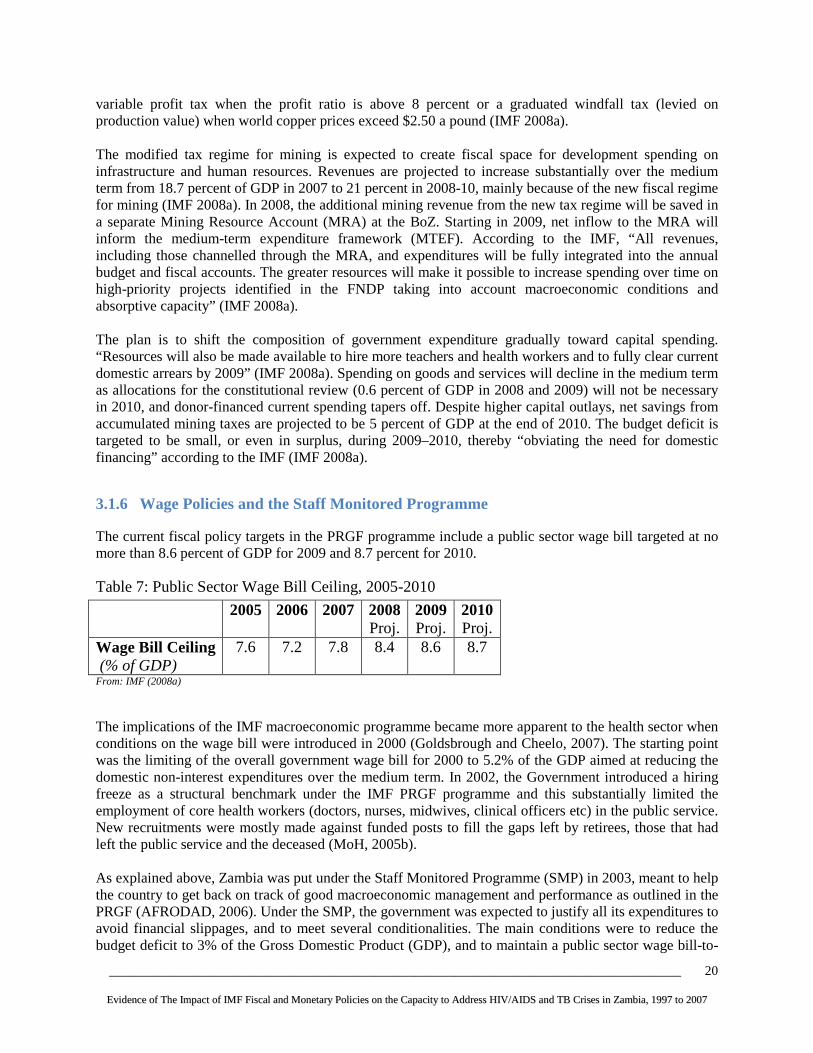
____________________________________________________________________________________________________________________________________________________________________________
EEvviiddeennccee ooff TThhee IImmppaacctt ooff IIMMFF FFiissccaall aanndd MMoonneettaarryy PPooll iicciieess oonn tthhee CCaappaaccii ttyy ttoo AAddddrreessss HHIIVV//AAIIDDSS aanndd TTBB CCrriisseess iinn ZZaammbbiiaa,, 11999977 ttoo 22000077
20
variable profit tax when the profit ratio is above 8 percent or a graduated windfall tax (levied on production value) when world copper prices exceed $2.50 a pound (IMF 2008a). The modified tax regime for mining is expected to create fiscal space for development spending on infrastructure and human resources. Revenues are projected to increase substantially over the medium term from 18.7 percent of GDP in 2007 to 21 percent in 2008-10, mainly because of the new fiscal regime for mining (IMF 2008a). In 2008, the additional mining revenue from the new tax regime will be saved in a separate Mining Resource Account (MRA) at the BoZ. Starting in 2009, net inflow to the MRA will inform the medium-term expenditure framework (MTEF). According to the IMF, “All revenues, including those channelled through the MRA, and expenditures will be fully integrated into the annual budget and fiscal accounts. The greater resources will make it possible to increase spending over time on high-priority projects identified in the FNDP taking into account macroeconomic conditions and absorptive capacity” (IMF 2008a). The plan is to shift the composition of government expenditure gradually toward capital spending. “Resources will also be made available to hire more teachers and health workers and to fully clear current domestic arrears by 2009” (IMF 2008a). Spending on goods and services will decline in the medium term as allocations for the constitutional review (0.6 percent of GDP in 2008 and 2009) will not be necessary in 2010, and donor-financed current spending tapers off. Despite higher capital outlays, net savings from accumulated mining taxes are projected to be 5 percent of GDP at the end of 2010. The budget deficit is targeted to be small, or even in surplus, during 2009–2010, thereby “obviating the need for domestic financing” according to the IMF (IMF 2008a).
3.1.6 Wage Policies and the Staff Monitored Programme The current fiscal policy targets in the PRGF programme include a public sector wage bill targeted at no more than 8.6 percent of GDP for 2009 and 8.7 percent for 2010.
Table 7: Public Sector Wage Bill Ceiling, 2005-2010
2005
2006
2007 2008 Proj.
2009 Proj.
2010 Proj.
Wage Bill Ceiling (% of GDP)
7.6 7.2 7.8 8.4 8.6 8.7
From: IMF (2008a) The implications of the IMF macroeconomic programme became more apparent to the health sector when conditions on the wage bill were introduced in 2000 (Goldsbrough and Cheelo, 2007). The starting point was the limiting of the overall government wage bill for 2000 to 5.2% of the GDP aimed at reducing the domestic non-interest expenditures over the medium term. In 2002, the Government introduced a hiring freeze as a structural benchmark under the IMF PRGF programme and this substantially limited the employment of core health workers (doctors, nurses, midwives, clinical officers etc) in the public service. New recruitments were mostly made against funded posts to fill the gaps left by retirees, those that had left the public service and the deceased (MoH, 2005b). As explained above, Zambia was put under the Staff Monitored Programme (SMP) in 2003, meant to help the country to get back on track of good macroeconomic management and performance as outlined in the PRGF (AFRODAD, 2006). Under the SMP, the government was expected to justify all its expenditures to avoid financial slippages, and to meet several conditionalities. The main conditions were to reduce the budget deficit to 3% of the Gross Domestic Product (GDP), and to maintain a public sector wage bill-to-

____________________________________________________________________________________________________________________________________________________________________________
EEvviiddeennccee ooff TThhee IImmppaacctt ooff IIMMFF FFiissccaall aanndd MMoonneettaarryy PPooll iicciieess oonn tthhee CCaappaaccii ttyy ttoo AAddddrreessss HHIIVV//AAIIDDSS aanndd TTBB CCrriisseess iinn ZZaammbbiiaa,, 11999977 ttoo 22000077
21
GDP ratio of not more than 8 percent (AFRODAD, 2006; MoH, 2006b; Goldsbrough and Cheelo, 2007). Additionally, Zambia was expected to privatize the remaining public entities in the energy and telecommunication sectors. Zambia observed the above conditions to the letter prompting the IMF to award it a loan under the PRGF amounting to SDR 220.10 million (about US$320.41 million) for the period 16th June 2004 to 30th September 2007 (IMF, 2008a). It is worth pointing out that the ceilings on the government wage bill that were introduced in 2000 and through the SMP, further reducing the government’s ability to increase its health sector spending on human resources for health, despite the critical shortage of health sector personnel. The ceilings on the government wage bill made it extremely difficult to increase the number of health workers and to make the jobs more attractive while operating within the target fiscal ceilings. Thus, efforts to improve the conditions of service, while simultaneously increasing numbers to the level recommended in the MoH staff establishment seems to be a far-fetched achievement within the set wage bill ceilings. The ceilings on the government wage bill were lifted in 2007, on completion of the conditionalities in 2006. However, the impact of this policy is still being felt today and this is evident from the severe shortage of core health workers currently being experienced in the health sector. Most of the doctors and nurses, whom the country trained from hard-earned government money, have since migrated to the private sector or to foreign countries.
3.1.7 Debt Relief and Fiscal Space According to Situmbeko and Zulu (2004), Zambia’s external debt rose from US$814 million in 1970 to US$5,671 million in 2001. By the end of 2004, Zambia owed the international community US$7.1billion (AfDB/OECD, 2004; IMF, 2006a). Due to this high debt, Zambia qualified for the HIPC initiative in December 2000 and having met the set benchmarks for economic reform, the country qualified for debt relief in April 2005. Zambia was also granted debt relief as part of the MDRI. More debt relief was further provided to Zambia by the G8 countries as a follow up to a decision that was passed at a meeting that was held in July 2005 in Scotland. Under the MDRI, three multilateral financial institutions namely the IMF, World Bank, and the African Development Bank (AfDF) pledged to cancel 100 percent of their debt claims on countries that have reached, or will eventually reach, the HIPC completion point. It should be noted that despite the MDRI being common to the 3 financial institutions, the decision to grant debt relief is ultimately the separate responsibility of each institution, and the approach to coverage and implementation varies. For the IMF, MDRI relief covers the full stock of debt owed to the IMF at end-2004 that remains outstanding at the time the country qualifies for such relief. There is no provision for relief of debt disbursed after January 1, 2005 under the MDRI. As part of the MDRI, Zambia was granted debt relief of US$569 million (excluding remaining assistance under the HIPC). For the World Bank, only the IDA credits that had been disbursed prior to 2004 were applicable under the MDRI. Due to debt relief from the Enhanced HIPC initiative, the MDRI, and the G-8 nations, Zambia’s total external debt was estimated to have reduce from US$ 7.1 billion in 2004 to US$ 581 million in 2006 (IMF, 2006a). Given the substantial debt reduction, one would expect the Zambian government to have enough fiscal space to allocate more funds to social sectors like health and specifically to the national response for HIV/AIDS. However, the savings from debt cancellation have not translated in improved government spending in the social sector. Weeks and Mckinley (2006) observes that Zambia will still not be able to significantly scale-up public spending or investment in health because of the continuing demands for excessively tight fiscal and monetary policies in its IMF loan arrangements. They further argue that even if the conditionalities were taken into account, the HIPC, MDRI, and G-8 initiatives will provide more fiscal space but this amount will be less than 1% of the GDP. Thus, with this minimal

____________________________________________________________________________________________________________________________________________________________________________
EEvviiddeennccee ooff TThhee IImmppaacctt ooff IIMMFF FFiissccaall aanndd MMoonneettaarryy PPooll iicciieess oonn tthhee CCaappaaccii ttyy ttoo AAddddrreessss HHIIVV//AAIIDDSS aanndd TTBB CCrriisseess iinn ZZaammbbiiaa,, 11999977 ttoo 22000077
22
increase in fiscal space, it would be impossible for the government to achieve the MDGs, especially goal number 6 of combating HIV/AIDS, malaria and other diseases. The other issue is whether all the debt has been cancelled under the HIPC, MDRI and G-8 initiatives. It was established that a significant proportion of the debt has been cancelled but some of the debt has not yet been cancelled as earlier promised. The IMF had predicted that Zambia’s total external debt would reduce from US$ 4.5 billion in 2005 to US$ 581 million in 2006 when the HIPC, MDRI, and G-8 debt relief initiatives were fully implemented. However, the Finance minister, in his budget speech to parliament in February 2008, reported that the external debt position of US$635 million that had been reported at the beginning of 2007 was further adjusted upwards by the end of 2007. This was in order to reflect undelivered debt relief from some of the Paris and non-Paris club creditors with whom Zambia has not yet reached agreements (MoFNP, 2008a). Apart from a relatively high external debt, the Zambian government also has a sizeable domestic debt amounting to K 9,336.9 billion or 23.8 % of GDP (ILO, 2008). It is evident therefore that the government still has a relatively high external and domestic debt and that it has limited fiscal space to allocate more funds to the health sector and for the national HIV/AIDS and TB response. As a result, debt servicing still claims some of the resources meant for poverty reduction programmes, leaving the government with little room to allocate more funds to the health sector for the provision of health services through the public health system. Thus, debt relief initiatives could have provided more fiscal space to Zambia if there were less restrictive fiscal and monetary policies from the IMF, and if all the Paris and non-Paris club creditors had cancelled their debt. This suggests that the Zambian government still has a relatively high external debt and that debt servicing still claims some of the resources for the social sectors like health and HIV/AIDS. With limited fiscal space, the ability to allocate more funds to health and HIV/AIDS is constrained. According to Boz (2009) Zambia received $211 million from donor aid in the the first half of 2008, yet sent out $26 million in external debt servicing (excluding IMF payments), somewhat less than the $37 million paid in the second half of 2007 (Boz 2009).

____________________________________________________________________________________________________________________________________________________________________________
EEvviiddeennccee ooff TThhee IImmppaacctt ooff IIMMFF FFiissccaall aanndd MMoonneettaarryy PPooll iicciieess oonn tthhee CCaappaaccii ttyy ttoo AAddddrreessss HHIIVV//AAIIDDSS aanndd TTBB CCrriisseess iinn ZZaammbbiiaa,, 11999977 ttoo 22000077
23
Table 8: Summary of IMF Economic Reform Programmes: Zambia, 1992-2007 Name of policy and year of enactment
Objective of Policy Specific key conditions of the policy
Factors necessitating the enactment of policy
Negative consequences/outcomes
Structural Adjustment Programme (SAP): 1992-1995 (Rights Accumulation Program (RAP))
• Halt high growth rates of domestic credit and money supply
• Freeing markets and eliminating government intervention and control
• Stabilize macroeconomic environment
• Privatization • Market-oriented
reforms • Sustainable external
sector: increase international reserves, reduce government domestic arrears
• Switch to indirect instruments from direct instruments to mop up liquidity from the financial system
• Spend only when you have the money
• Direct fiscal conditionalities included i) deficit limits, ii) a cap on the share of public-sector wages in GDP, and iii) reliance on ‘cash budgeting’.
• Structural performance criteria: reform civil service, publish banking regulations, privatization of state enterprises including the Zambia Consolidated Copper Mines (ZCCM)
• Primary Treasury bill auction system introduced
• Abolishment of interest rate ceilings
• Large fiscal deficits • Inefficient markets. The
government owned most of the companies and the economy had to be made more efficient by letting the private sector take over
• Government expenditure was not in line with budget
• High levels of inflation of about 180.7% in 1992
• Massive loss of employment due to privatization of government enterprises and parastatals
• Reduced access to health care due to user fees
• Reduction in real per capita health expenditure which impacted negatively on key public health programs like HIV, TB and malaria
• Limited budget allocation to government ministries which negatively affected the implementation of programmes
• Zambia was declared ineligible to use IMF financial resources in September 1987 following accumulation of arrears (overdue obligations)
• Economy contracted throughout this period
• Depreciation of the exchange rate of the kwacha against major currencies was unabated
Enhanced Structural Adjustment Facility (ESAF) 1996-1999
• Achieve positive per capita income to reduced poverty and improve living standards.
• Sustainable balance of payments position
• Use of Open Market Operations with longer maturing instruments to limit money supply growth
• Core liquid asset and statutory reserve ratios (circulars)
• Large fiscal deficits • Inefficient public markets • Government expenditure
was not in line with budget
• High levels of inflation of about 46% in 1995
• Economy continued to be hampered by difficulties in privatizing the mining conglomerate, Zambia Consolidated Copper Mines (ZCCM)
• Fiscal performance

____________________________________________________________________________________________________________________________________________________________________________
EEvviiddeennccee ooff TThhee IImmppaacctt ooff IIMMFF FFiissccaall aanndd MMoonneettaarryy PPooll iicciieess oonn tthhee CCaappaaccii ttyy ttoo AAddddrreessss HHIIVV//AAIIDDSS aanndd TTBB CCrriisseess iinn ZZaammbbiiaa,, 11999977 ttoo 22000077
24
• Maintain stable macroeconomic conditions (4% inflation by end-1998).
• Promote economic growth (3-4% by end 1998)
undermined by an increase in the stock of payments arrears by line ministries
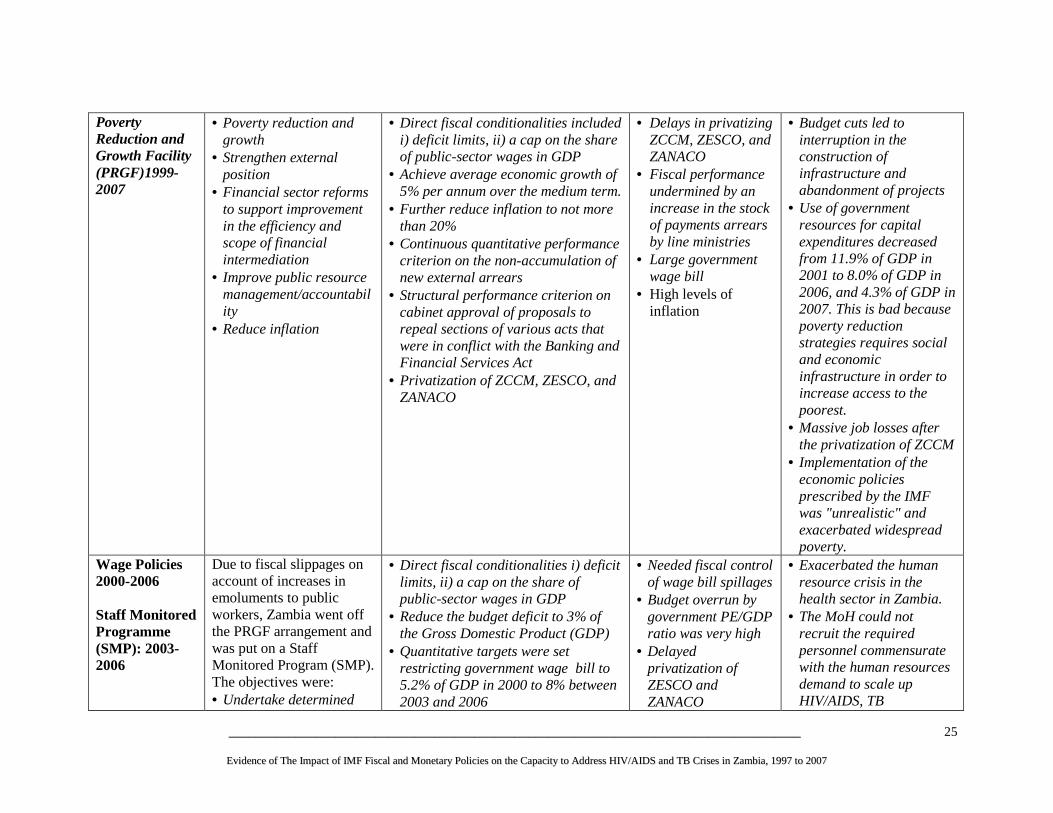
____________________________________________________________________________________________________________________________________________________________________________
EEvviiddeennccee ooff TThhee IImmppaacctt ooff IIMMFF FFiissccaall aanndd MMoonneettaarryy PPooll iicciieess oonn tthhee CCaappaaccii ttyy ttoo AAddddrreessss HHIIVV//AAIIDDSS aanndd TTBB CCrriisseess iinn ZZaammbbiiaa,, 11999977 ttoo 22000077
25
Poverty
Reduction and Growth Facility (PRGF)1999-2007
• Poverty reduction and growth
• Strengthen external position
• Financial sector reforms to support improvement in the efficiency and scope of financial intermediation
• Improve public resource management/accountability
• Reduce inflation
• Direct fiscal conditionalities included i) deficit limits, ii) a cap on the share of public-sector wages in GDP
• Achieve average economic growth of 5% per annum over the medium term.
• Further reduce inflation to not more than 20%
• Continuous quantitative performance criterion on the non-accumulation of new external arrears
• Structural performance criterion on cabinet approval of proposals to repeal sections of various acts that were in conflict with the Banking and Financial Services Act
• Privatization of ZCCM, ZESCO, and ZANACO
• Delays in privatizing ZCCM, ZESCO, and ZANACO
• Fiscal performance undermined by an increase in the stock of payments arrears by line ministries
• Large government wage bill
• High levels of inflation
• Budget cuts led to interruption in the construction of infrastructure and abandonment of projects
• Use of government resources for capital expenditures decreased from 11.9% of GDP in 2001 to 8.0% of GDP in 2006, and 4.3% of GDP in 2007. This is bad because poverty reduction strategies requires social and economic infrastructure in order to increase access to the poorest.
• Massive job losses after the privatization of ZCCM
• Implementation of the economic policies prescribed by the IMF was "unrealistic" and exacerbated widespread poverty.
Wage Policies 2000-2006 Staff Monitored Programme (SMP): 2003-2006
Due to fiscal slippages on account of increases in emoluments to public workers, Zambia went off the PRGF arrangement and was put on a Staff Monitored Program (SMP). The objectives were: • Undertake determined
• Direct fiscal conditionalities i) deficit limits, ii) a cap on the share of public-sector wages in GDP
• Reduce the budget deficit to 3% of the Gross Domestic Product (GDP)
• Quantitative targets were set restricting government wage bill to 5.2% of GDP in 2000 to 8% between 2003 and 2006
• Needed fiscal control of wage bill spillages
• Budget overrun by government PE/GDP ratio was very high
• Delayed privatization of ZESCO and ZANACO
• Exacerbated the human resource crisis in the health sector in Zambia.
• The MoH could not recruit the required personnel commensurate with the human resources demand to scale up HIV/AIDS, TB

____________________________________________________________________________________________________________________________________________________________________________
EEvviiddeennccee ooff TThhee IImmppaacctt ooff IIMMFF FFiissccaall aanndd MMoonneettaarryy PPooll iicciieess oonn tthhee CCaappaaccii ttyy ttoo AAddddrreessss HHIIVV//AAIIDDSS aanndd TTBB CCrriisseess iinn ZZaammbbiiaa,, 11999977 ttoo 22000077
26
efforts to address weakness in policy implementation
• Return to a PRGF arrangement. IMF staff closely monitored the country and government was expected to justify all its expenditures to avoid financial slippages
• Structural conditionalities: privatize the remaining public entities in the energy and banking sectors (ZESCO and ZANACO)
• The Bank of Zambia lowered the core liquid asset ratio from 17.5% to 14% in October 2003 intended to provide banks with additional liquidity for lending to the agricultural sector
interventions. • Loss of skilled staff to
other countries in search of better working conditions
• Loss of skilled personnel through the voluntary retrenchment programme by the IMF
• Government recognized that some of the end year targets could no longer be attained.
• Rising domestic debt and interest payments
Data sources with modifications: Situmbeko and Zulu (2004); Weeks and Mckinley (2006); Bank of England (n.d)

____________________________________________________________________________________________________________________________________________________________________________
EEvviiddeennccee ooff TThhee IImmppaacctt ooff IIMMFF FFiissccaall aanndd MMoonneettaarryy PPooll iicciieess oonn tthhee CCaappaaccii ttyy ttoo AAddddrreessss HHIIVV//AAIIDDSS aanndd TTBB CCrriisseess iinn ZZaammbbiiaa,, 11999977 ttoo 22000077
27
Name of policy and year of enactment
Objective of Policy Specific key conditions of the policy
Factors necessitating the enactment of policy
Perceived/anticipated Negative consequences/outcomes
Poverty Reduction and Growth Facility (PRGF)
June 2008 to May 2011
• To support the government’s objectives of boosting economic growth and reducing poverty
• Maintaining macroeconomic stability, debt sustainability, while increasing fiscal space for investment in infrastructure, energy, and human resources
• Diversifying the economy to lessen dependence on mining by improving the conditions for private sector-led growth
• Reduce annual inflation to 7% in 2008
• Public Financial Management - Submit to Cabinet a
proposal to establish a treasury single account
- Submit to Cabinet a proposal to establish a Treasury Department
• Tax Administration - Establish a headquarters
functional structure at the Zambia Revenue Authority
- Establish a single large-taxpayer office at the Zambia revenue Authority
• Financial Sector - The Bank of Zambia
will restructure the operations of its rediscount window.
- Set up a supervisory regime for the secondary market in government securities.
- Introduce risk based bank supervision.
• Debt management
• Poor public expenditure management and budget execution. Measures expected to improve cash flow management and forecasts and therefore improve fiscal and monetary policy coordination.
• Inefficiencies in the administration of tax by Zambia Revenue Authority.
• Poor liquidity management and volatility in the money market, and rendering the monetary policy to be ineffective.
• Lack of a risk-based supervision system
• Lack of a cost-effective public sector borrowing and unsound debt structure
• Inefficient and unsustainable power supply. Several power outages were being experienced and this was attributed to low power generation capacity. It was
• Increases in electricity tariffs in the mining sector will push people below the poverty datum line. Zambia is still very dependant on the mining sector which accounts for over 80% of Zambia's export earnings. Over 50% of the total electricity is consumed by the mines. Thus, increased electricity tariffs will significantly raise the capital costs for the mines leading to job losses. Zambia’s poverty levels are still quite high and the job losses are likely to worsen the situation. A new tax regime for the mining sector came into effect on 1st April 2008 and substantially increased government’s share of the mining profits and rents. The changes include an increase in the mineral royalty tax to 3% (from 0.6%), an increase in the corporate income tax to 30% (from 25%), and introduction of either a variable profit tax when the profit ratio is above 8% or a graduated windfall tax (levied on production value) when world copper prices exceed $2.50 a pound. Thus, the government has already substantially cut into the profits from the mines and subjecting the mining companies to more expenditure through increased electricity tariffs amidst a world
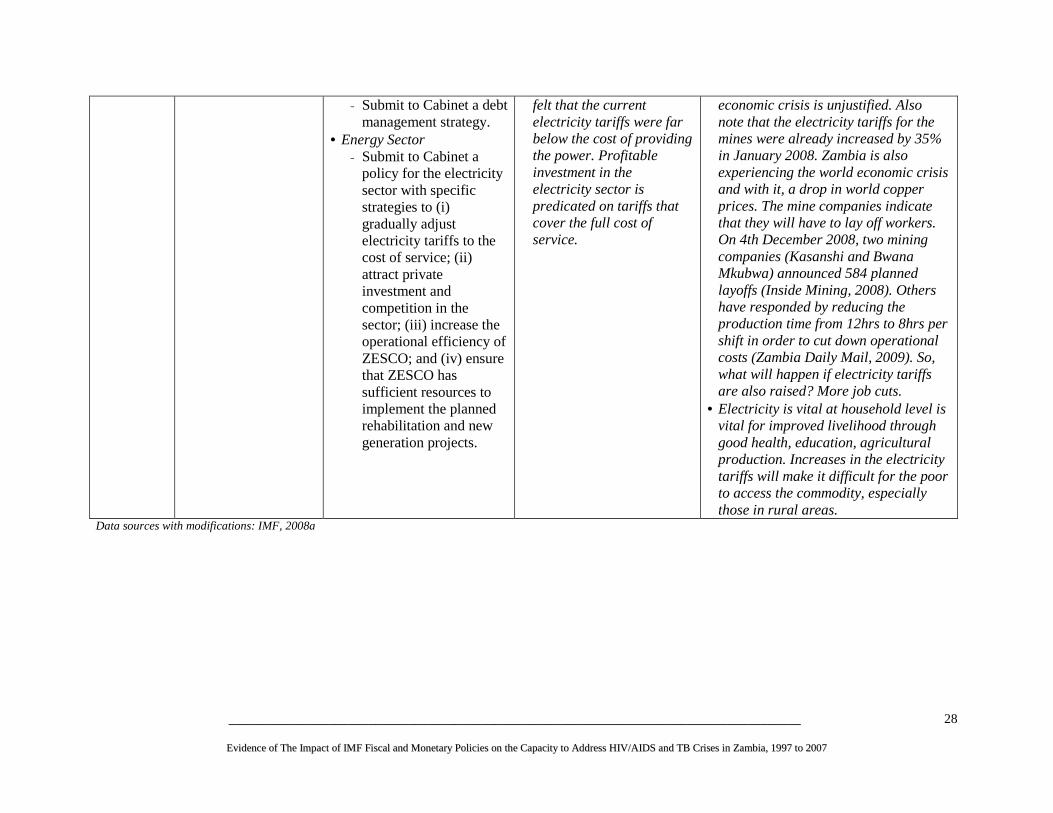
____________________________________________________________________________________________________________________________________________________________________________
EEvviiddeennccee ooff TThhee IImmppaacctt ooff IIMMFF FFiissccaall aanndd MMoonneettaarryy PPooll iicciieess oonn tthhee CCaappaaccii ttyy ttoo AAddddrreessss HHIIVV//AAIIDDSS aanndd TTBB CCrriisseess iinn ZZaammbbiiaa,, 11999977 ttoo 22000077
28
- Submit to Cabinet a debt management strategy.
• Energy Sector - Submit to Cabinet a
policy for the electricity sector with specific strategies to (i) gradually adjust electricity tariffs to the cost of service; (ii) attract private investment and competition in the sector; (iii) increase the operational efficiency of ZESCO; and (iv) ensure that ZESCO has sufficient resources to implement the planned rehabilitation and new generation projects.
felt that the current electricity tariffs were far below the cost of providing the power. Profitable investment in the electricity sector is predicated on tariffs that cover the full cost of service.
economic crisis is unjustified. Also note that the electricity tariffs for the mines were already increased by 35% in January 2008. Zambia is also experiencing the world economic crisis and with it, a drop in world copper prices. The mine companies indicate that they will have to lay off workers. On 4th December 2008, two mining companies (Kasanshi and Bwana Mkubwa) announced 584 planned layoffs (Inside Mining, 2008). Others have responded by reducing the production time from 12hrs to 8hrs per shift in order to cut down operational costs (Zambia Daily Mail, 2009). So, what will happen if electricity tariffs are also raised? More job cuts.
• Electricity is vital at household level is vital for improved livelihood through good health, education, agricultural production. Increases in the electricity tariffs will make it difficult for the poor to access the commodity, especially those in rural areas.
Data sources with modifications: IMF, 2008a

____________________________________________________________________________________________________________________________________________________________________________
EEvviiddeennccee ooff TThhee IImmppaacctt ooff IIMMFF FFiissccaall aanndd MMoonneettaarryy PPooll iicciieess oonn tthhee CCaappaaccii ttyy ttoo AAddddrreessss HHIIVV//AAIIDDSS aanndd TTBB CCrriisseess iinn ZZaammbbiiaa,, 11999977 ttoo 22000077
29
3.2 Process of IMF Policy Formulation in Zambia Most of the key informants stated that the formulation of fiscal and monetary programmes in Zambia is normally led by the IMF with the MoFNP playing the facilitation role. All the programmes in Table 8 above were designed by the IMF and negotiated with government through consultations with the MoFNP and the Bank of Zambia. Key Respondents indicated that other government ministries, donors, the civil society, and NGOs were only consulted during the later part of the policy and budget formulation processes. For example, it was gathered that during the annual national budget preparation, initial meetings where the budget framework paper and sector ceilings are set, consultations are only between the MoNFP, IMF, and the Bank of Zambia. It was also learnt that Civil Society Organizations (CSOs) were for a long time not part of the national policy formulation processes and were only brought on board during the formation of the Poverty Reduction Strategy Paper (PRSP) in 2001. Prior to this, there was no culture of CSO participation, and even though the CSO are now on board, it was suggested their ability to participate is limited by time, manpower and money (key informant). The parliamentarians are also not consulted on the budget framework paper and sector ceilings. The dominant role of IMF in the formulation of programmes in Zambia was brought to the fore by most of the respondents who expressed mixed feelings over the transparency of the whole process. Respondents from line ministries clearly stated that they were not fully involved during the formulation but during the endorsement or induction stage when everything has been agreed. It was highlighted that the programmes were imposed on Zambia without engaging the relevant wings of government to provide input on the impact of each policy. This is shown in the graph below. Only 40% of the respondent indicated that the IMF programmes were transparent while 60% indicated that the policy formulation process was somewhat transparent (30%), not transparent (20%) or didn’t know (10%). Figure 1: Transparency in the formulation of IMF/Fiscal/Monetary Programmes
Don’t Know
10%
No
20%
Somewhat
30%
Yes
40%
Source: Key Informants
The findings from the key respondents are corroborated by Situmbeko and Zulu (2004) who noted that the process of IMF policy formulation in Zambia is undemocratic and unfair and that it is not ‘a participatory process’ but rather ‘an endorsing process’. For example, the authors point out that during the process of

____________________________________________________________________________________________________________________________________________________________________________
EEvviiddeennccee ooff TThhee IImmppaacctt ooff IIMMFF FFiissccaall aanndd MMoonneettaarryy PPooll iicciieess oonn tthhee CCaappaaccii ttyy ttoo AAddddrreessss HHIIVV//AAIIDDSS aanndd TTBB CCrriisseess iinn ZZaammbbiiaa,, 11999977 ttoo 22000077
30
developing the PRSP, there was no formal mechanism for parliament as an institution to engage in the process. Parliament was only informed of important aspects of the document after it had been adopted by the government and accepted by the IMF and World Bank. They point out that all conditionalities embedded in the PRGF are non-negotiable and they come to a debtor country on a ‘take-it-or-leave-it’ basis – clearly demonstrating that the programmes of the IMF are undemocratic.
But what happens if Zambia doesn’t comply with the conditionalities? Situmbeko and Zulu (2004) quoted then IMF Resident Representative to Zambia, Mark Ellyne, as saying, “If they [the government] don’t sell, they will not get the money.” In this particular case, Zambia refused to sell the Zambia National Commercial Bank (ZNCB) and the country could not reach the HIPC completion point that was scheduled for December 2004. Thus, the IMF in turn refused to provide a debt relief of US$3.8 billion because of the ‘failure’ to implement policy conditions linked to HIPC (Situmbeko and Zulu, 2004). Zambia was put on the SMP and the country had to fulfill an additional 15 benchmarks, to qualify for another PRGF loan and to get back on track of HIPC completion. HIPC completion point was only reached in April 2005 when Zambia fulfilled most of the conditionalities (Bank of England n.d.; Situmbeko and Zulu, 2004; AFRODAD, 2006). See sub-sections 3.1.2 and 3.1.3 above.
It is also worth pointing out that the IMF has a bigger influence as a signal institution to all the other external ‘donor’ type funders. For example, Zambia broke away from the IMF and announced the suspension of the IMF reform efforts from May 1987 to August 1989 because it found it impossible to meet the IMF loan conditionalities. In turn, other external donors could not provide loans and/or grants to Zambia because the IMF had declared Zambia ineligible to access IMF financial resources because of overdue financial obligations to the IMF. As such, it is difficult for Zambia to break its relationship with the IMF. The late third President of Zambia, Dr. Levy Patrick Mwanawasa S.C, did recognize that IMF privatization programme had been of no significant benefit to the country as it led to poverty, asset stripping and job losses (Situmbeko and Zulu, 2004). Yet, he had no option but to continue cooperating with the IMF.
3.3 Extent to which MTEFs are used as a Planning Device in the Country The MTEF is used as a planning device in Zambia. The MTEF was introduced in 2004 in order to address previous weaknesses in the planning and budget processes. According to the MoFNP, the MTEF was adopted in order to meet the following objectives:
- To ensure the efficient allocation and management of public resources - To develop and maintain fiscal discipline in planning and management of public resources - To ensure commitment to budget priorities at the national and sector levels - To improve accountability of national resources - To improve predictability of resources
The MTEF tries to combine both foreign and domestic resources. Donors are required to provide information on possible disbursements well in advance to ensure that they are incorporated into the framework. It is flexible to the extent that it is revised on an annual basis, but it does not capture all donor resources. The MTEF includes both government and donor resources, particularly resources that are distributed to the common basket. For PEPFAR Funds, these do not reflect the total annual allocation for Zambia because the resources are mostly disbursed through vertical programmes and MoH has no control over this expenditure. Funds from PEPFAR and other vertical programmes, increase the total resources available to the health sector and are in most cases even more than the overall government budget on health, raising questions about the sustainability of HIV/AIDS financing. Ironically, the IMF programmes limit the overall government spending for health and HIV/AIDS while there has been no corresponding
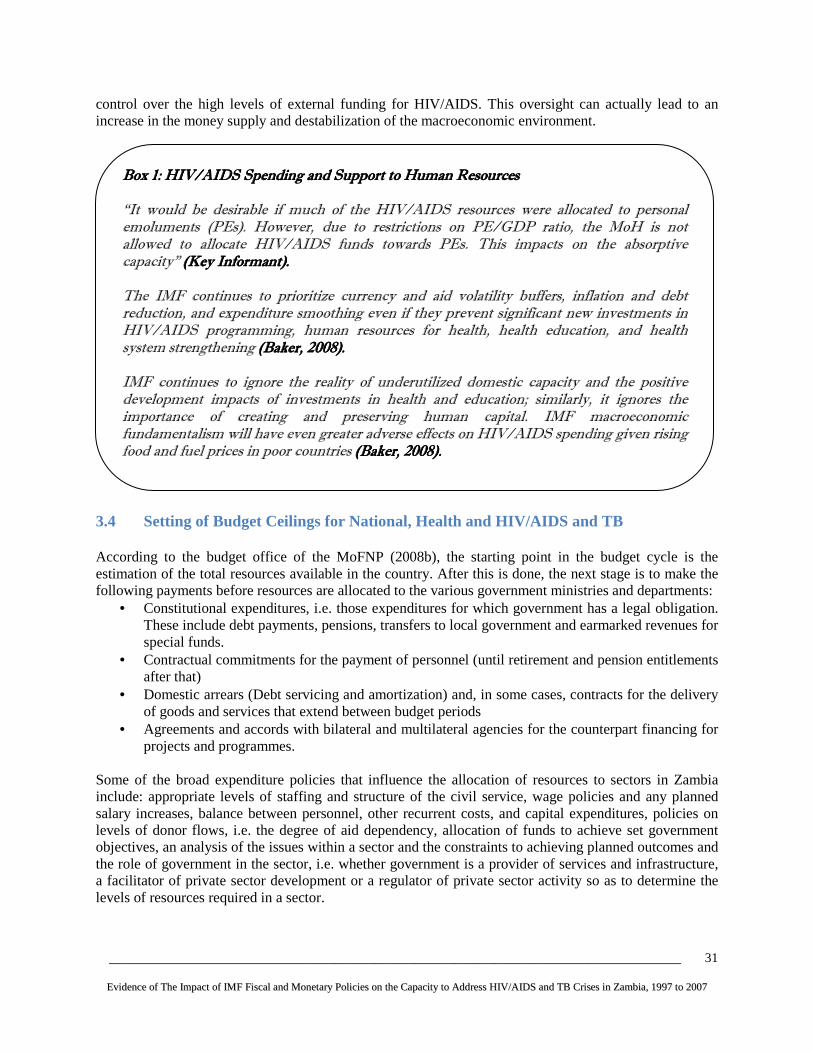
____________________________________________________________________________________________________________________________________________________________________________
EEvviiddeennccee ooff TThhee IImmppaacctt ooff IIMMFF FFiissccaall aanndd MMoonneettaarryy PPooll iicciieess oonn tthhee CCaappaaccii ttyy ttoo AAddddrreessss HHIIVV//AAIIDDSS aanndd TTBB CCrriisseess iinn ZZaammbbiiaa,, 11999977 ttoo 22000077
31
control over the high levels of external funding for HIV/AIDS. This oversight can actually lead to an increase in the money supply and destabilization of the macroeconomic environment.
3.4 Setting of Budget Ceilings for National, Health and HIV/AIDS and TB According to the budget office of the MoFNP (2008b), the starting point in the budget cycle is the estimation of the total resources available in the country. After this is done, the next stage is to make the following payments before resources are allocated to the various government ministries and departments:
• Constitutional expenditures, i.e. those expenditures for which government has a legal obligation. These include debt payments, pensions, transfers to local government and earmarked revenues for special funds.
• Contractual commitments for the payment of personnel (until retirement and pension entitlements after that)
• Domestic arrears (Debt servicing and amortization) and, in some cases, contracts for the delivery of goods and services that extend between budget periods
• Agreements and accords with bilateral and multilateral agencies for the counterpart financing for projects and programmes.
Some of the broad expenditure policies that influence the allocation of resources to sectors in Zambia include: appropriate levels of staffing and structure of the civil service, wage policies and any planned salary increases, balance between personnel, other recurrent costs, and capital expenditures, policies on levels of donor flows, i.e. the degree of aid dependency, allocation of funds to achieve set government objectives, an analysis of the issues within a sector and the constraints to achieving planned outcomes and the role of government in the sector, i.e. whether government is a provider of services and infrastructure, a facilitator of private sector development or a regulator of private sector activity so as to determine the levels of resources required in a sector.
Box 1: HIV/AIDS Spending and Support to Box 1: HIV/AIDS Spending and Support to Box 1: HIV/AIDS Spending and Support to Box 1: HIV/AIDS Spending and Support to Human ResourcesHuman ResourcesHuman ResourcesHuman Resources “It would be desirable if much of the HIV/AIDS resources were allocated to personal emoluments (PEs). However, due to restrictions on PE/GDP ratio, the MoH is not allowed to allocate HIV/AIDS funds towards PEs. This impacts on the absorptive capacity” (Key Informant).(Key Informant).(Key Informant).(Key Informant). The IMF continues to prioritize currency and aid volatility buffers, inflation and debt reduction, and expenditure smoothing even if they prevent significant new investments in HIV/AIDS programming, human resources for health, health education, and health system strengthening (Baker, 2008).(Baker, 2008).(Baker, 2008).(Baker, 2008). IMF continues to ignore the reality of underutilized domestic capacity and the positive development impacts of investments in health and education; similarly, it ignores the importance of creating and preserving human capital. IMF macroeconomic fundamentalism will have even greater adverse effects on HIV/AIDS spending given rising food and fuel prices in poor countries (Baker, 2008).(Baker, 2008).(Baker, 2008).(Baker, 2008).

____________________________________________________________________________________________________________________________________________________________________________
EEvviiddeennccee ooff TThhee IImmppaacctt ooff IIMMFF FFiissccaall aanndd MMoonneettaarryy PPooll iicciieess oonn tthhee CCaappaaccii ttyy ttoo AAddddrreessss HHIIVV//AAIIDDSS aanndd TTBB CCrriisseess iinn ZZaammbbiiaa,, 11999977 ttoo 22000077
32
Budget ceilings are then set by the MoFNP, but not all stakeholders are involved. However, key informants cited a very heavy involvement of the IMF in setting budget ceilings. The key informants revealed that IMF seeks to stabilize the financial and macroeconomic conditions in the economy that are affected by excessive expenditure.
As highlighted above and as shown below in the National Economic Management Cycle, budget ceilings for the health sector and other government ministries are decided through a process involving MoFNP, IMF, the Bank of Zambia, Cabinet, Parliament, and line ministries including the MoH. The main player in the process is the MoFNP, which makes proposals to the cabinet using the country’s macroeconomic and fiscal framework. When coming up with sector ceilings, the MoFNP jointly discusses the macroeconomic framework with the IMF. The macroeconomic framework usually depicts the changes in the economy as a whole, changes in the monetary sector and extent to which government can borrow from the system, external flows (including debt payments, donor grants, exports and imports), and the level of resources that are available for spending by the public sector. The macroeconomic framework seeks to promote the overall macroeconomic policy which, among other things, seeks to address real growth, balance of payments, inflation and the exchange rate. The Government seeks to influence these macroeconomic parameters through fiscal, monetary and external sector policies. Key informants revealed that the IMF’s position on the macroeconomic framework and decision on sector ceilings is usually well respected by the MoFNP and adhered to religiously. The MoFNP might not be in full support of the IMF’s position but it has no choice but to implement in order to avoid sanctions from the IMF. Weeks and Mckinley (2006) support this view and point out the effect of ‘donorship’ on national budgeting. They observe that there are so many specific conditionalities set by external agencies, particularly IMF and the World Bank, that once they have been accepted by the government, very little discretion remains to make other important decisions affecting economic management. They further note that the conditionalities are restrictive in themselves and that they also constrain the implementation of other polices not explicitly subject to the conditionalities. In essence, the IMF’s conditionalities and restrictions on expenditure results in the country being unable to have room to manoeuvre and to meet its own fiscal, monetary and socio-economic goals. Some of the programmes that the government fails to implement are the improvement of conditions of service for public service workers in general and the health professionals in particular.
Box 2: Setting of Budget Ceilings Box 2: Setting of Budget Ceilings Box 2: Setting of Budget Ceilings Box 2: Setting of Budget Ceilings “Budget ceilings are set by Ministry of Finance based on some formula which we don’t know. A block ceiling is set for the MoH for all public health programmes. HIV/AIDS and TB have a lot of off budget funding” (Key informant). (Key informant). (Key informant). (Key informant). “The MoFNP gives a block budget ceiling to MoH. It further breaks this block allocation with ceilings to key budget lines such as Personal Emoluments (PEs), infrastructure and drugs. The MoH then using a resource allocation criterion allocates money to various levels and cost items” (Key informant) (Key informant) (Key informant) (Key informant) “Available and potential resources that the government would get in a given fiscal year is determined by the government’s policy – social and economic and also the IMF/World Bank conditions” (Key informant)(Key informant)(Key informant)(Key informant)

____________________________________________________________________________________________________________________________________________________________________________
EEvviiddeennccee ooff TThhee IImmppaacctt ooff IIMMFF FFiissccaall aanndd MMoonneettaarryy PPooll iicciieess oonn tthhee CCaappaaccii ttyy ttoo AAddddrreessss HHIIVV//AAIIDDSS aanndd TTBB CCrriisseess iinn ZZaammbbiiaa,, 11999977 ttoo 22000077
33
Involvement of Members of Parliament in the National Economic Management Cycle, including the budgeting process and aid effectiveness agenda, is also limited, while the IMF is heavily involved. This was highlighted during a workshop organized by the MoFNP in Livingstone, Zambia from 4th to 7th June 2008 entitled, “Parliamentary Consultative Dialogue on Aid Effectiveness.” The Members of Parliament (MPs) lamented that they were not really fully involved in the setting of budget ceilings as contained in the government green paper, budget execution process, and during the negotiation/contracting of loans and grant agreements. The MPs requested the MoFNP to formalize the information sharing process to parliament on quarterly budget execution, and to involve them during the initial drafting stages of the green paper before the ceilings are finalized. It is important for MPs to be consulted at every stage as they represent constituencies of people who have mandated them to facilitate development in their areas. Without full involvement in the budgeting process, MPs will fail to deliver. It should be noted that IMF programmes may not have directly affected the public expenditure on HIV/AIDS and TB, but rather indirectly via reduced government funding to the health sector. No one in the MoH seemed to understand how the MoFNP sets the overall budget ceiling to the health sector. The wage bill policies that were implemented from 2000 to 2006 also had a negative effect on the recruitment of health workers. The ceilings on the government wage bill were lifted in 2007, but the impact of this policy is still being felt today. This is explained in more detail in sub-sections 3.1.3 above and 3.6.3 below.

____________________________________________________________________________________________________________________________________________________________________________
EEvviiddeennccee ooff TThhee IImmppaacctt ooff IIMMFF FFiissccaall aanndd MMoonneettaarryy PPooll iicciieess oonn tthhee CCaappaaccii ttyy ttoo AAddddrreessss HHIIVV//AAIIDDSS aanndd TTBB CCrriisseess iinn ZZaammbbiiaa,, 11999977 ttoo 22000077
34
MONTH Ministry of Finance Line Ministries SAGs Auditors Parliament
JANUARY Consolidation of annual administrative data sets
Annual Audit
Finalization of Economic Report
Start Preparation of NDP Progress Report.
Annual Budget approval by Cabinet and presented to
Parliament
FEBRUARY
MARCH
Parliament Approves Annual Budget
APRIL 1st IMF Review Mission 1st Quarter Meeting
Compilation of documents for PRBS Review
IMF Spring Meetings
MAY Finalization of FNDP Progress Report
JUNE
Commence FNDP Mid-Term Review
JULY2nd Quarter Meeting
Start MTEF preparation of Green Paper
AUGUST Submission of MTEF Green
Paper to Cabinet
Approval of Green Paper
SEPTEMBER Table Financial Report before Parliament
NDCC / Cabinet
Controlling Officers Workshop
Budget Guidelines issuedMPSAs Budget
Framework papers prepared
IMF/World Bank Annual Meetings
OCTOBER 2nd IMF Review 3rd Quarter Meeting
NOVEMBER
Preparation of Treasury Minutes
PAC & EC Scrutiny of Green Paper
DECEMBER MPSA Annual Work Plan
Submit Annual Audit Report
Submit annual administrative data
sets
Start M & E of priority activities
Cabinet
NATIONAL ECONOMIC MANAGEMENT CYCLE
Donors
Mis
sio
n F
ree
Per
iod
Provision of indicative figures for MTEF
Controlling Officers Workshop
Controlling Officers Workshop
ODA data capture and consolidation for ZDAD
ODA data capture and consolidation for ZDAD
5th Quarter Meeting
for
Controlling Officers Workshop
Mis
sion
Fre
e P
erio
d
4th Quarter Meeting for previous year
Parliament Approves Accounts
1st PRBS REVIEW (PAF)
National SAG Conference
High Level Policy Dialogue
2nd PRBS Review Meeting
ODA data capture and consolidation for ZDAD
Consideration of the Auditor General’s
Report for the year before the previous
year and
Consideration of the Annual National Budget
Source: MoFNP, 2008b Legend
IMF: International Monetary Fund ZDAD: Zambia Development & Assistance Database
PAFs: Performance Assessment Framework ODA: Official Development Assistance
NDCC: National Development and Coordinating Committee PAC: Public Accounts Committee
MPSA: Ministries, Provinces and other Spending Agencies SAG: Sector Advisory Group
MTEF: Medium Term Expenditure Framework M&E: Monitoring and Evaluation
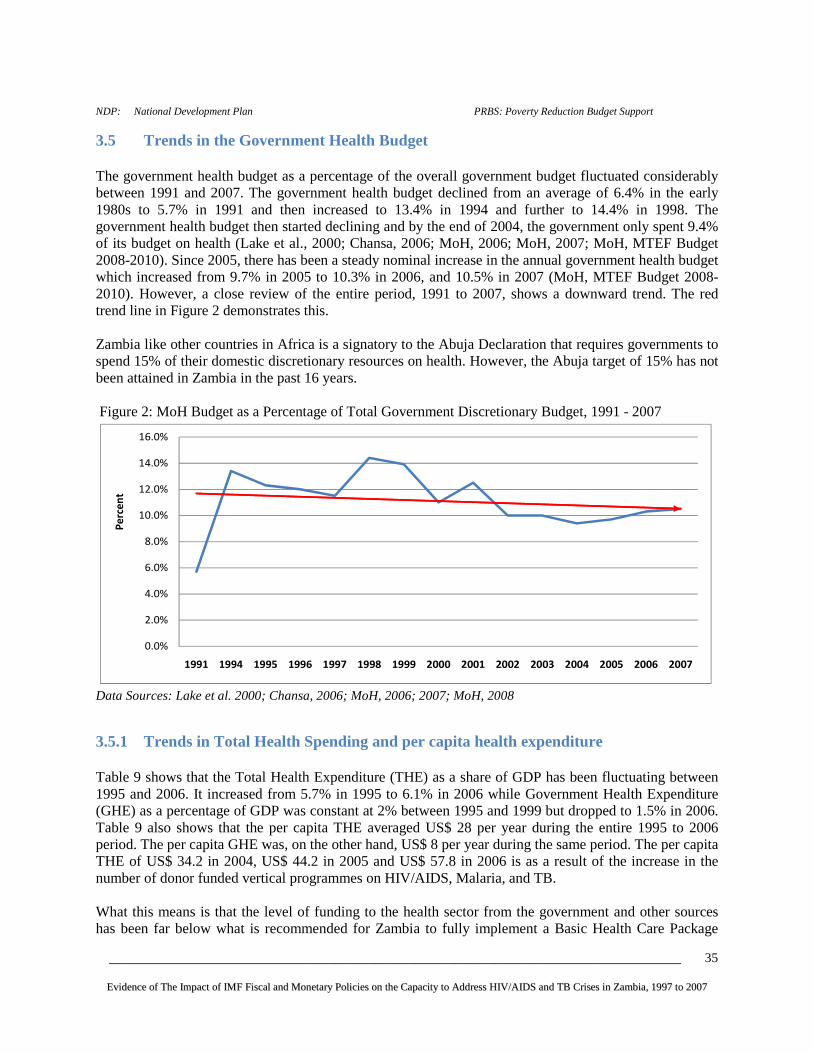
____________________________________________________________________________________________________________________________________________________________________________
EEvviiddeennccee ooff TThhee IImmppaacctt ooff IIMMFF FFiissccaall aanndd MMoonneettaarryy PPooll iicciieess oonn tthhee CCaappaaccii ttyy ttoo AAddddrreessss HHIIVV//AAIIDDSS aanndd TTBB CCrriisseess iinn ZZaammbbiiaa,, 11999977 ttoo 22000077
35
NDP: National Development Plan PRBS: Poverty Reduction Budget Support
3.5 Trends in the Government Health Budget The government health budget as a percentage of the overall government budget fluctuated considerably between 1991 and 2007. The government health budget declined from an average of 6.4% in the early 1980s to 5.7% in 1991 and then increased to 13.4% in 1994 and further to 14.4% in 1998. The government health budget then started declining and by the end of 2004, the government only spent 9.4% of its budget on health (Lake et al., 2000; Chansa, 2006; MoH, 2006; MoH, 2007; MoH, MTEF Budget 2008-2010). Since 2005, there has been a steady nominal increase in the annual government health budget which increased from 9.7% in 2005 to 10.3% in 2006, and 10.5% in 2007 (MoH, MTEF Budget 2008-2010). However, a close review of the entire period, 1991 to 2007, shows a downward trend. The red trend line in Figure 2 demonstrates this. Zambia like other countries in Africa is a signatory to the Abuja Declaration that requires governments to spend 15% of their domestic discretionary resources on health. However, the Abuja target of 15% has not been attained in Zambia in the past 16 years. Figure 2: MoH Budget as a Percentage of Total Government Discretionary Budget, 1991 - 2007
0.0%
2.0%
4.0%
6.0%
8.0%
10.0%
12.0%
14.0%
16.0%
1991 1994 1995 1996 1997 1998 1999 2000 2001 2002 2003 2004 2005 2006 2007
Pe
rce
nt
Data Sources: Lake et al. 2000; Chansa, 2006; MoH, 2006; 2007; MoH, 2008
3.5.1 Trends in Total Health Spending and per capita health expenditure Table 9 shows that the Total Health Expenditure (THE) as a share of GDP has been fluctuating between 1995 and 2006. It increased from 5.7% in 1995 to 6.1% in 2006 while Government Health Expenditure (GHE) as a percentage of GDP was constant at 2% between 1995 and 1999 but dropped to 1.5% in 2006. Table 9 also shows that the per capita THE averaged US$ 28 per year during the entire 1995 to 2006 period. The per capita GHE was, on the other hand, US$ 8 per year during the same period. The per capita THE of US$ 34.2 in 2004, US$ 44.2 in 2005 and US$ 57.8 in 2006 is as a result of the increase in the number of donor funded vertical programmes on HIV/AIDS, Malaria, and TB. What this means is that the level of funding to the health sector from the government and other sources has been far below what is recommended for Zambia to fully implement a Basic Health Care Package

____________________________________________________________________________________________________________________________________________________________________________
EEvviiddeennccee ooff TThhee IImmppaacctt ooff IIMMFF FFiissccaall aanndd MMoonneettaarryy PPooll iicciieess oonn tthhee CCaappaaccii ttyy ttoo AAddddrreessss HHIIVV//AAIIDDSS aanndd TTBB CCrriisseess iinn ZZaammbbiiaa,, 11999977 ttoo 22000077
36
(BHCP). The WHO Commission on Macroeconomics and Health had recommended that Zambia needs to spend US$ 33 per capita annually in order to fully meet the provisions of the BHCP but this is not the case (MoH, 2008b). As a matter of fact, the MoH has a financing gap of $756 million for it to fully implement the National Health Strategic Plan up to 2010 (MoH, 2008c).
Table 9: Health Expenditure Ratios, 1995 – 2006
1995 1996 1997 1998 1999 2000 2001 2002 2003 2004 2005 2006 THE/GDP %
5.7 6.2 6.4 6.9 5.7 5.6 5.5 6.7 6.8 7.2 *7.0 *6.3
GHE/GDP %
2.1 2.0 2.0 2.0 2.0 1.5 2.3 2.2 1.6 1.2 *1.4 *1.5
GHE/THE %
37.0 32.1 31.5 29.0 34.7 27.5 40.8 32.3 23.5 17.3 *19.9 *24.4
HHE/THE %
34.1 33.6 31.0 31.6 41.8 39.6 34.2 28.5 28.8 28.4 *27.4 *27.3
Donor/THE %
11.0 17.9 22.2 23.0 9.1 17.9 14.9 31.1 38.0 42.5 *46.1 *41.5
Per capita GHE US$
8.1 6.8 8.0 6.4 6.1 4.9 7.8 7.5 6.2 5.9 *8.8 *14.1
Per capita THE US$
21.9 21.3 25.5 22.0 17.5 17.6 19.0 23.3 26.5 34.2 *44.2 *57.8
Source: National Health Accounts, 2002-2004; *Preliminary National Health Accounts, 2005-2006 Data in Table 9 above was further analyzed in order to show the trends in the contributions to THE. This is presented in Figure 3. GHE as a percentage of THE was at an annual average of 29% during the entire period 1995-2006. On the other hand, Household Health Expenditure (HHE) and donor health expenditure as percentages of THE averaged 32% and 26% per year, respectively, during the same period. This implies that about 68% of total funding to the health sector comes from households and donors. Figure 3 also shows that during the past few years the government has been reducing its expenditure on the health sector while the donors have taken up the leading role. This has serious implications on the sustainability of programmes in the health sector, especially those fully funded by donors (HIV/AIDS, malaria and TB). These programmes are expensive and largely funded by donors through vertical programmes. HHE is also quite high in Zambia as can be seen in Figure 3. Since 2003, HHE has been higher than GHE. This raises questions on household food security, and equity of access to health care. Furthermore, given the high poverty levels in the country (64% by 2006), high spending by households brings to the fore the inter-relationship between poverty and ill-health.

____________________________________________________________________________________________________________________________________________________________________________
EEvviiddeennccee ooff TThhee IImmppaacctt ooff IIMMFF FFiissccaall aanndd MMoonneettaarryy PPooll iicciieess oonn tthhee CCaappaaccii ttyy ttoo AAddddrreessss HHIIVV//AAIIDDSS aanndd TTBB CCrriisseess iinn ZZaammbbiiaa,, 11999977 ttoo 22000077
37
Figure 3: Contribution to Total Health Expenditure, 1995-2006
0
5
10
15
20
25
30
35
40
45
50
GHE/THE %
HHE/THE %
Donor/THE %
Source: Constructed from Table 9 Figure 4: Average Shares of Total Health Expenditure, 2006
MoFNP24%
Employers
Households
27%
Other Private
Funds
Donors42%
Source: MoH, Preliminary Results of the 2005-2006 National Health Accounts
3.5.2 Trends in HIV/AIDS Expenditure by Source The overall spending on HIV/AIDS from all sources was US$76.9 million in 2002; US$49.6 million in 2003; US$145.2 million in 2005; and 161.2 million in 2006 (Phiri and Tien, 2004; MoH, 2008a). Figure 5 below shows the total expenditures on HIV/AIDS by source from 2002 to 2006. The data shows that donors have been providing the largest funding for HIV/AIDS since 2002. Donors contributed 46% of the total HIV/AIDS expenditure in 2002, 70.1% in 2003, 74.3% in 2005, and 74% in 2006. Households were the second largest financiers and contributed 29% in 2002, 19.7% in 2003, 16% in 2005, and 13.9% in 2006. The government was the third with 17% in 2002, 9.8% in 2003, 7.7% in 2005, and 9.5% in 2006. It is also worth noting that among the donors, the single major contributor was PEPFAR. As a proportion of total HIV/AIDS expenditure, PEPFAR contributed 26% in 2002, 27.6% in 2005, and 36.7% in 2006.

____________________________________________________________________________________________________________________________________________________________________________
EEvviiddeennccee ooff TThhee IImmppaacctt ooff IIMMFF FFiissccaall aanndd MMoonneettaarryy PPooll iicciieess oonn tthhee CCaappaaccii ttyy ttoo AAddddrreessss HHIIVV//AAIIDDSS aanndd TTBB CCrriisseess iinn ZZaammbbiiaa,, 11999977 ttoo 22000077
38
Further scrutiny of the data also depicts that donors’ contribution for HIV/AIDS expenditure doubled over the 2002 levels while government contribution in total HIV/AIDS expenditures fell by almost half. Donor contribution was on average about 55% more than the government contribution between 2003 and 2006. The implication of the above data is that the government relies heavily on donors and households to finance the HIV/AIDS programme. This can be attributed to the restrictive fiscal and monetary policies of the IMF which restricts the growth in the overall government health budget. The low contribution by government for HIV/AIDS could in turn be attributed to limited resources available from the government health budget. The percentage of households’ expenditure on HIV/AIDS has been declining since 2003 but was higher than government expenditure on HIV/AIDS throughout the period 2003 to 2006. This suggests that the financial burden on the poor households is still high despite government’s provision of free ARVs since mid-2005. The free ARVs policy might not have fully reduced the frequency of opportunistic infections among HIV/AIDS patients and likelihood of incurring catastrophic health expenditures. Other indirect costs (travel and time costs, food and accommodation for in-patients and relatives) and non-cost health costs (quality, information, and cultural), are the cause of additional financial burden for the poor. Phiri and Tien (2004) observe that the high level of household financing of HIV/AIDS care has implications on equity of access. They reported that many HIV/AIDS patients normally access additional resources in order to finance their health care. This includes getting assistance from family members or neighbours, borrowing, or selling assets (ibid). They further revealed that gender, income, and place of residence are indicators of inequity in financing access to care. Females and individuals in the bottom income quintile, and those living in rural areas receive assistance, borrow, or sell assets more frequently to pay for health services (ibid). Figure 5: HIV/AIDS Funding Sources, 2002-2006
17.0%9.8% 7.7% 9.5%
7.0%
2.0% 2.6%
29.0%
19.7% 16.0% 13.9%
46.0%
70.1% 74.3% 74.0%
0%
20%
40%
60%
80%
100%
120%
2002 2003 2005 2006
Government Employers Household Donors
Data Sources: Phiri and Tien, 2004; MoH, 2008a In order to highlight the future financial pledges for HIV/AIDS, Table 10 shows estimates of resources required for the 2006-2010 National HIV/AIDS Strategic Framework (NASF) based on a 50% scale up and funding gap. A financing gap of US$216.7 million is highlighted. Government resources are shown as constant over the five year period because historically government’s contributions have been static. While it is possible that in some years, the funding from the treasury would be more than what was

____________________________________________________________________________________________________________________________________________________________________________
EEvviiddeennccee ooff TThhee IImmppaacctt ooff IIMMFF FFiissccaall aanndd MMoonneettaarryy PPooll iicciieess oonn tthhee CCaappaaccii ttyy ttoo AAddddrreessss HHIIVV//AAIIDDSS aanndd TTBB CCrriisseess iinn ZZaammbbiiaa,, 11999977 ttoo 22000077
39
estimated in the NASF, more conservative figures are used. This is because in practice, government spending to the social sectors was guided by the PRSP, the HIPC initiative, and now the FNDP.
Table 10: Estimates of Resources Required for NASF (2006-2010) based on 50% scale up and Funding Gap (Figures in US$)
Source: NAC 2006-2010 Strategic Framework
3.5.3 Estimated Resources for Tuberculosis The Zambian TB programme has very few TB-specific workers, and can only operate through the use of the integrated primary health care system adopting a decentralized public health approach. Thus all inputs at and beyond the district level strengthen the role of generic health workers in health centers and hospitals throughout the country. The laboratories rehabilitated and supported by the TB programme also are used for general diagnosis. The programme supports 25,000 community volunteers, who are also used in other programmes in the health sector. HIV testing introduced in many health facilities throughout the country as part of the TB/HIV collaborative activities, is part of strengthening the health system’s ability to provide comprehensive health care services. To achieve the national goals and objectives, the National Tuberculosis Programme (NTP) has been implementing the Stop TB Strategy as outlined in the National Stop TB Strategic Plan. A total budget of $57,012,513 was required to adequately implement the National Stop TB Strategic Plan for the period 2007 to 2011. However, the NTP had available to it, directly or through its technical partners including NGOs about $32,053,479 for the period 2007 to 2011. The NTP benefits from external financial support coming from several donors. The major donors that support operational activities of the TB program include the Global Fund (about US$13million in 2008-2009), Canadian International Development Agency (CIDA) about US$543,820, the United States Government about US$ 5million over a five year period, and PEPFAR US$7.3 million. The government, on its part, has in recent years increased the resources for TB control and the general health services. However, it is difficult to quantify the total contribution of the government to TB control. The government does not only provide the remuneration to core NTP staff but also maintains the infrastructure of health facilities and contributes an estimated US$1,000,000 per year to operational activities in 72 districts, 9 provinces and the central unit. The government also began procuring a proportion of the anti-TB drugs from 2007 onwards at a value of US$250,000 per year (including 5000 child formulations in 2007).

____________________________________________________________________________________________________________________________________________________________________________
EEvviiddeennccee ooff TThhee IImmppaacctt ooff IIMMFF FFiissccaall aanndd MMoonneettaarryy PPooll iicciieess oonn tthhee CCaappaaccii ttyy ttoo AAddddrreessss HHIIVV//AAIIDDSS aanndd TTBB CCrriisseess iinn ZZaammbbiiaa,, 11999977 ttoo 22000077
40
3.6 Human Resource budgetary allocations, emoluments and distribution in the health sector in Zambia
3.6.1 Trends in the public budget allocations for health personnel The government under the PRGF and SMP had agreed on the level of spending on public servant personal emoluments (PEs). The starting point was the limiting of the overall government wage bill to 5.2% of the GDP in 2000 and 8% in 2004, 2005, and 2006. The national PE/GDP ratio in 2004 was 7.49% and the MoH budget for PEs was US $49,232,224, which represents a PE/GDP ratio for the health sector of 0.90%. The PE/GDP ratio for 2005 was 0.84% (MoH, 2005b). In 2006, the health PE/GDP was 0.76% while in 2007 it was 0.88%. Thus, the health PE/GDP ratio was reducing when the SMP was being implemented from 2004 to 2006, as can be seen here. The conditionalities on the wage bill were completed in 2006 and today there are no wage bill ceilings in Zambia. However, a lot of damage has already been caused as pointed out in sub-sections 3.1.3 above and 3.6.3 below.
Table 11 provides interesting results on the growth of the public health sector wage bill. The health wage bill as percentage of total government health budget declined from 67% in 2004 to 47% in 2007. The health wage bill as percentage of total government discretionary budget declined from 6.2% in 2004 to 5% in 2007. In terms of recruitment, the percentage of total recruitments as a percentage of total government health budget declined from 8% in 2005 to 4% in 2007. The decline in the health wage bill and recruitment can be attributed to the IMF policy on ceilings on the government wage bill which was implemented from 2003 to 2006 through the SMP. This programme has negatively impacted on the ability of Zambia to increase its health sector spending on human resources for health despite a critical shortage of human resources for the public health sector.
Table 11: Public health sector wage bill as a % of total government health expenditure (US$)
2004 2005 2006 2007
Health PE Budget
49,232,224
61,178,948
82,180,992
98,009,325 Recruitment & Retention (part of Health PE Budget)
-
7,216,849
4,050,198
7,494,997
Health Programme Budget
23,895,571
32,399,037
73,503,030
109,397,416
Total Government Health Budget
73,127,795
93,577,985
155,684,022
207,406,742 Total Government Discretionary Budget
793,011,972 965,805,29
0 1,515,674,46
8 1,967,445,28
5 Total Government Health Budget as percentage of Total Government Discretionary Budget
9.2% 9.7% 10.3% 10.5%
Health PEs as percentage of total Government Health Budget
67% 65% 53% 47%

____________________________________________________________________________________________________________________________________________________________________________
EEvviiddeennccee ooff TThhee IImmppaacctt ooff IIMMFF FFiissccaall aanndd MMoonneettaarryy PPooll iicciieess oonn tthhee CCaappaaccii ttyy ttoo AAddddrreessss HHIIVV//AAIIDDSS aanndd TTBB CCrriisseess iinn ZZaammbbiiaa,, 11999977 ttoo 22000077
41
Recruitment as percentage of total Government Health Budget
- 8% 3% 4%
Health PEs as percentage of total Government Discretionary Budget
6.2% 6.3% 5.4% 5.0%
Health PEs as percentage of GDP 0.90% 0.84% 0.76% 0.88% Source: MoH; MTEF Budgets 2004-2007
3.6.2 Personal Emoluments for Health Workers in Zambia The MoH (2005b) is aware of the need to generously reward health workers in order to attract and retain them. Table 12 below provides a summary of the salaries and allowances for doctors, nurses and paramedics in 2005. It was estimated that allowances make up a considerable portion of the total composite personnel emoluments and that in the case of doctors; this is about 40% (MoH, 2005b). It was also observed that there were a wide range of salary levels across health professionals with the highest earner being five times that of the lowest. It was further revealed that the private-for-profit health sector is paying significantly higher salaries than government or NGOs (MoH, 2005b). Private doctors’ salaries are more than double the salaries of government doctors, midwives’ salaries are almost one third higher, and laboratory technicians’ salaries are more than three times the amount paid by government. NGOs are paying between 23% and 46% more than government (MoH, 2005b). Despite the private sector in Zambia paying more attractive salaries and conditions of services, other countries in the region pay three to four times more, making it difficult for the MoH to retain key health workers like doctors and nurses. Poor working conditions (low salaries, lack of performance-based incentives, and poor environments) makes it easier for the private sector and other neighbouring and European countries to attract Zambian doctors, nurses, midwives and paramedics. The HIV/AIDS epidemic has also taken its toll on the health sector and even though several health workers have died or migrate elsewhere, the rate of replacement is extremely low. This further increases the workload on the remaining staff. Recent evidence from WHO suggests that countries within Africa (e.g. Namibia and Botswana) that have achieved the recommended staff population ratios have shown a tremendous improvement in their national health indicators (WHO, 2005b). For example, Botswana is one of the success stories of development and yet it has no relationship with the IMF but with a group of advisors. Stiglitz (2002) writes that Botswana recorded economic growth rates of more than 7.5% from 1961 to 1997 and yet at independence in 1966 it was a desperately poor country with a per capita annual income of $100. Botswana was helped by economic advisers to map out a programme for the country’s future. Unlike the IMF, which largely deals with a country's finance ministry and central bank, these advisers openly and candidly explained their policies as they worked with the government to obtain popular support for the programmes and policies (Stiglitz, 2002).
The other country that has made tremendous improvements without assistance from the IMF is Malaysia. Hamoudi (2000) writes that between the years 1986 and 1997, the average rate of the GNP in Malaysia was 8% and by the end of 2000 the rate reached 8.5%. Malaysia also recorded a rise in the value of exports and a decline in the value of imports in 1999. The value of exports reached US$ 84.5 billion and this value represents 2% of the total value of world exports (ibid). To date, the Malaysian approach to economic reform has raised a lot of fears because it has undermined the credibility of the IMF and the World Bank‘s prescriptions. The Malaysian economic experience in reform proved successful without any foreign loans or prescriptions.

42
Table 12: Composite Monthly Pay before tax of a sample of health workers, 2005
Cadre Gross
Monthly Salary
Recruitment & retentio
n
Commuted
Overtime
Commuted Night Duty
Uniform Upkeep
Housing
Allowance
On-call
Grand Total
(ZMK)
Grand
Total (USD)
Doctor 3,778,438 755,688
500,000
1,200,000
6,234,126
1,453
Pharmacist
3,072,188 614,438 35,0
00 400,0
00
4,121,626
960
Lab. Scientist
2,687,500 537,500 35,0
00 400,0
00
3,660,000
853
Tutor 2,429,500 485,900
35,000
450,000
3,400,4
00 792
Senior Nurse & Paramedics
1,683,230 336,646 40,000 30,000 35,0
00 450,0
00
2,574,876
600
Nurse 1,141,770 40,000 30,000
35,000
250,000
1,496,7
70 349
Mid Wife
1,141,770 40,000 30,000 35,0
00 250,0
00
1,496,770
349
Clinical Officer
1,141,770 40,000 30,000 35,0
00 250,0
00
1,496,770
349
Lab. Technologist
1,141,770 40,000 30,000 35,0
00 250,0
00
1,496,770
349
Pharmacy Tech
1,141,770 35,0
00 250,0
00
1,426,770
332
Lab. Technician
981,354 40,000 30,000 35,0
00 150,0
00
1,236,354
288
Source: MoH (2005b)
3.6.3 Trends in the Numbers of Health Professional Working in the Health Sector The human resources situation in the health sector in Zambia has long been described as a disaster (MoH, 2003). The health sector faces a major human resource crisis and there are shortages of health workers at every service delivery level (MoH, 2003). In Zambia, the annual attrition rates for selected groups are: doctors – 4.2%, registered nurses – 7.8%, enrolled nurses – 6.1%, and paramedics (clinical officers, environmental health technicians, laboratory staff, etc) at 7.7% (MoH, 2005b). A report produced by Kombe et.al. (2005), shows that according to the Nursing and Midwifery Council in the UK, a total of 461 Zambian nurses were recruited between 1998 and 2003. Other studies have shown that there are over 300 Zambian doctors working abroad (Koot and Martineau, 2005). Human resource shortages are caused by a number of factors. The MoH (2005b) presents these as the most pertinent ones:
• Inadequate working conditions of service (pay, allowances and incentives)

43
• Poor working conditions (facilities, supplies and equipment) • Weak human resource management systems • Inadequate education and training systems
Migration of staff and workload are also perpetuated by some IMF polices such as the ceiling in the public sector wage bill of 5.2% to GDP in 2000, wage freeze of 2002, and wage ceiling in the public sector wage bill of 8.01% to GDP from 2003 to 2006 (key informants, Goldsbrough and Cheelo, 2007). While the conditionalities on the wage bill were completed in 2006, the effect of long periods of reduced recruitment, and bad working conditions, worsen the human resources situation. Not all the fresh graduates (especially nurses) could be recruited despite the government having heavily invested in their training. For those already in-service, the conditions of service were not improving for same time prompting them to migrate from the public health sector. The wage bill policies also worsen the numerical, and skills/skills mix distribution of staff. Due to the poor conditions of services, fresh graduates opted to work in the urban areas and shunned to work in the rural areas. This led to severe staffing imbalances in terms of numbers, skills/skills mix and geographical distribution.
Thus, the IMF wage bill policies made it extremely difficult for the MoH to strike a balance between increasing the numbers of health workers available, making jobs more attractive and the need to operate within fiscal ceilings. Thus, human resources problems still remain in the health sector in Zambia despite the lift on wage bill policies. The severe shortage of human resources and the increasing attrition of staff are now seen as a major obstacle to improved service delivery in Zambia (MoH, 2005b; 2008b).
Table 13: Current Staff Levels versus Recommended Staff to Population to Staff Ratios and Establishment
Actual 1991
Actual 2006
Actual Change
in Staffing Levels (2006
vs 1991)
Recommended
Establishment (2005
estimate)
Shortfall from
Recommended
Establishment (2006
position)
Population – Staff
Ratio 1991
Population – Staff Ratio 2006
Doctors 508 574 66 2,333 1,759 15,817 20,542 Clinical Officers
1,372 1,212 -160 4,000 2,788 5,856 9,729
Nurses 6,335 6,496 161 16,732 10,236 1,268 1,815 Midwives 2,281 2,240 -41 5,600 3,360 3,523 5,264
Pharmacists 29 37 8 42 5 89,278 318,685
Paramedical Staff
787 2,581 1794 10,653 8,072 10,210 4,569
TOTAL 11,312 13,140 1,828 39,360 26,220 Data Sources: MoH (1992; 2005b; 2006b; 2007) Note: The above data only include core health workers and excludes administrative and support staff. Paramedical Staff = Laboratory Technicians, Environmental Health Technicians, Radiology, Physiologists, Biomedical Scientists, etc.

44
The data in Table 13 show that, by the end of 2006, only 33% of the required numbers of doctors, clinical officers, nurses, midwives, pharmacists, and paramedical staff were available leaving a shortfall of 67%. In order to fully mitigate the staff shortages, the MoH needed to employ an additional 28,048 doctors, clinical officers, nurses, midwives, pharmacists, and paramedical staff (248% more) between 1991 and 2006 but this was not the case. The number of filled positions in 2006 only increased by 1,828 (16%) as compared to 1991. Actual staffing levels for clinical officers and midwives, however, declined in 2006 whilst the numbers of the other health workers increased. It should be pointed out that the change in staffing levels in 2006 was quite insignificant to meet the health demands of a rising population and this is evident in the increase in the population to staff ratios in 2006 as compared to 1991. The population to staff ratios in 2006 rose far above the WHO recommended ratios partially due to lack government to revise the staff establishment structure according to the needs of the population. At the same time, employment of health workers stalled whilst attrition was rife as HIV/AIDS was claiming the lives of the health workers whilst some of them left for the private sector or to work abroad.
3.6.4 Trends of Human Resources in the Health Sector in HIV/AIDS As earlier pointed out, there is a severe shortage of human resources in the health sector in Zambia. Inadequate numbers of staff means that many health facilities are understaffed. There are numerous rural health centres without any professional staff at all, and more than 50% of rural health centres have only one qualified staff member (Koot and Martineau, 2005). Service delivery in hospitals is also affected, with almost all hospitals understaffed and dozens of patients being attended to by one nurse. New facilities constructed to improve access to health services, remain unopened due to lack of staff. In addition, there are insufficient health workers to scale up and expand the delivery of essential health services such as HIV/AIDS and TB. The shortage of health personnel is further compounded by the fact that the fight against HIV/AIDS and its opportunistic infections (especially TB and Malaria) require additional health personnel due to increased demand for HIV/AIDS related health care services. For example, in 2007, the total required number of full-time equivalents (FTEs) of health worker labour to sustain the HIV/AIDS activities was 2,124 (Resch et al., 2008). This includes 41 Medical Doctors, 73 Clinical Officers, 111 Registered Nurses, 148 Enrolled Nurses, 111 Enrolled Midwives, 38 Laboratory Scientists, 112 Laboratory Technologists, 223 Laboratory Technicians, 46 Pharmacists, 136 Pharmacy Technicians, 226 Peer Counselors, and 864 Community Workers (Resch et al., 2008). However, only 318 health workers (15%) were available FTEs to cater for HIV/AIDS interventions in 2007.
“It is predictable that the National HIV/AIDS targets will be impossible to achieve without radical measures to ensure adequate staffing resources are available” (MoH 2005b, p.25).
Table 14 highlights the human resource requirements to sustain HIV/AIDS interventions at the current levels between 2007 and 2011. Resch et al., (2008) estimate that the 2007 level of human resources represents less than 10% of available government-paid clinician FTEs (doctors, clinical officers, and nurses) and that 85% and 168% of the available government-paid FTEs for laboratory and pharmacy, respectively, were required for sustaining HIV/AIDS services in 2007.
Table 14: Total Required FTEs of Health Worker Labour for HIV/AIDS under the ‘Sustain’ Policy and Percent of Available FTEs in Parentheses
2007 2008 2009 2010 2011

45
Medical Doctor 64 (10) 92 (14) 125 (19) 162 (25) 201 (31) Clinical Officer 96 (8) 129 (11) 168 (14) 210 (18) 255 (22) Registered Nurse 184 (9) 236 (11) 290 (13) 346 (16) 405 (18) Enrolled Nurse 246 (6) 314 (8) 386 (10) 461 (12) 539 (13) Enrolled Midwife 184 (8) 236 (10) 290 (13) 346 (15) 405 (18) Lab Scientists 65 (259) 94 (356) 127 (464) 164 (579) 204 (701) Lab Technologist 194 (194) 281 (280) 380 (380) 491 (490) 610 (609) Lab Technician 388 (133) 561 (188) 760 (250) 981 (318) 1219 (391) Pharmacist 55 (227) 72 (236) 95 (264) 123 (304) 156 (351) Pharmacy Technician 164 (195) 216 (235) 285 (291) 369 (358) 468 (434) Peer Counselor 478 (48) 638 (64) 803 (80) 971 (97) 1143 (114) Community Worker 1243 (62) 1600 (80) 1969 (98) 2347 (117) 2733 (137) Total Health Workers 3357 (24) 4464 (32) 5673 (41) 6966 (50) 8331 (60) All Nursing 613 (7) 784 (9) 964 (11) 1152 (14) 1348 (16) All Laboratory 582 (148) 841 (211) 1140 (282) 1471 (361) 1828 (444) All Pharmacy 219 (202) 287 (236) 380 (284) 492 (343) 624 (410) Source: Resch, et al., (2008).
3.7 Evidence of the Impact of IMF Programmes on Government’s Response to HIV/AIDS/Health and TB Crises
Several key informants singled out IMF programmes such as the SAP, ESAF, PRGF, and SMP to have negatively impacted on the delivery of health services in Zambia. The focus of these different programmes was mainly on macroeconomic stabilisation, financial sector reform, reduction of inflation, reduction of fiscal deficit, sustainable public sector wage bill, and debt reduction. It is important to see the series of critical connections to see how IMF macroeconomic policies actually end up constraining spending for any particular sector such as health. First, the IMF macroeconomic policies limit the ability of the economy to grow at higher economic growth rates and raise more revenues, so overall national budgets are smaller than they otherwise could be. Second, the IMF policies limit how much deficit spending governments can engage in, again keeping the overall national budgets smaller than they otherwise could be. Third, the IMF policies can make it difficult for countries to fully use all of the ODA inflows as intended by aid donors. All of these outcomes then lead to smaller national budgets, which in turn, translate into smaller sector budgets and less money for public sector wages. By the time the macroeconomic policies have been decided by the IMF and finance ministry behind closed doors, the size and limits of the national budget have largely been pre-determined. By the time the numbers put into the MTEF go to parliament, the national budget process does not provide the scope for making any major changes after the parameters of the macroeconomic framework have been set. To realize their goals of significantly increased health financing in the future, health and education advocates must seek to change the IMF’s macroeconomic framework.
3.7.1 Introduction of User Fees in Zambia According to the IMF (2008c), the areas that are typically covered by the IMF include advising on prudent macroeconomic and financial policies and related structural reforms such as exchange rate and

46
tax policy, fiscal management, budget execution, fiscal transparency, and tax and customs administration. The IMF also draws on World Bank expertise in designing PRGF programmes, and the staffs of the Fund and Bank cooperate closely on conditionality (ibid). It should also be understood that implementation of fiscal and monetary policies under the SAP, ESAF, and PRGF programmes led to politically difficult spending restraints in the health sector. User fees as a form of health care financing were then introduced in the 1990s in order to cushion for the falling government health budgets. As one way to help health clinics and hospitals cope with the drastic public sector budget cuts associated with the first IMF stabilisation loan programmes, the World Bank introduced the idea of charging “user fees” for public health services and medicines that used to be free. Additionally, the neoliberal philosophy of the World Bank prefers to view citizens as individually-paying “customers” seeking to “buy” health services. The introduction of user fees in Africa in the 1980s and 1990s, was strongly supported by the World Bank, and encouraged by the IMF (World Bank, 1987; Watkins, 1995; AFRODAD, 2006; Masiye et al., 2008). It was argued that user fees could help to generate additional resources at the point of collection (health facility level) and at the same time help to provide good quality services. The reasoning behind this claim was justified by the low financial resources albeit high expenditure that many developing countries were experiencing at the time (Shepard and Benjamin, 1988). Several developing countries in Africa were experiencing economic crises and “recurrent cost” problems which were exacerbated by the economic reforms such as the IMF’s SAPs (ibid). Thus, it was believed that user fees would be an effective way of financing public health care in developing countries, especially for drugs and curative care as these services are tangible and address an immediate need (ibid). In reality, however, user fees were problematic. Zambia introduced user fees in 1993, which led to higher direct costs for patients, lower utilisation of health facilities, and reduced health status. Blas and Limbambala (2001) showed that user fees payments in poor populations led to dramatic declines in utilization of services. Masiye et al., (2005) analyzed the impact of cost sharing and other determinants on access to health care, including distance to the health facility, time taken to the facility, financial cost and effectiveness of exemptions. The findings showed that the poorest households were directly disadvantaged to some degree, in all the determinants of access to health care. The authors also quote several authors who have shown that user fees not only impacted negatively on equity of access to health care but also saw poverty increase. Sukwa and Chabot (1996) and Kahenya and Lake (1994) compared utilization before and after user fees and concluded that utilization dropped between 20% and 76%. User fees were particularly high for HIV/AIDS patients when the Zambian government started providing ART in 2002. The cost was as high as K40,000 or US$9.3 and this was unaffordable to most of the Zambians requiring treatment given that more than 70% of the Zambians were living on less than a dollar per day. In 2005, calls for universal access to treatment prompted the government to launch a policy aimed at providing free and universal access to ART and related services. The government also decided to provide free health care services in all the public health facilities, in view of the regressive nature of the user fees and high cost for accessing health care services as experienced by the rural and peri-urban communities. Subsequently, in January 2006, a declaration was made during the official opening of the ninth session of the fifth National Assembly to abolish user fees in all primary health care facilities in 54 rural districts. In July 2007, this policy was extended to the 18 municipalities and cities in the country. However, user fees were retained at all the other levels of health care.
3.7.2 IMF Wage Bill Policies and Impact on Human Resources for Health and HIV/AIDS

47
The IMF economic reform process led to a massive loss of employment as workers were laid off while most companies collapsed after privatization. At the same time, the cash budget system brought in fiscal austerity that made it difficult to fully fund the BHCP and to complete infrastructural projects on time. Some of the projects were even abandoned when the cash budgeting system was introduced. This trend was prevalent in the social sectors, especially health. The restrictive wage policy initiated by IMF also perpetuated the loss of highly skilled staff to the private sector, international organizations and foreign nations. This was more evident in the health sector and it ultimately led to a decline in the quality of health service delivery. Restriction of employment in the midst of a critical shortage of health personnel necessary for delivery of health care services, including HIV/AIDS services, further increased the shortage of human resources in the health sector. Restriction on employment is evident if one looks at the recruitment as percentage of the total government health budget which declined from 8% in 2005 to 3% in 2006 and then 4% in 2007. In 2004, the MoH did not budget for recruitments and just a few new graduates were taken to replace the health workers that had died or left the sector. In short, employment was made against the already funded posts. The high attrition from pre-service training programmes was also identified as a major concern. It was estimated that the drop-out or training attrition for doctor and nurse training programmes in 2004 was 30% and was between 20-25% for other health training programmes (MoH, 2005b). These rates are similar to that reported in 2001 (ibid). A number of factors could be attributed to this. Some of the possible reasons could be failure to fulfil the course pre-requisites/requirements, failure to pay for school fees or dissatisfaction due to lack of future job prospects. In this case, lack of jobs at the end of the training programme (attributed to the IMF restriction on employment) could have made the students lose moral. Details on the progress made towards the recruitment of core health workers (doctors, Nurses, Clinical Officers, Pharmacists and other Paramedics) from 2004 to 2007 is provided in Table 15 below. The data presented in Table 15 reveal that only 3,897 health workers have been recruited through the Public Service Management Division (PSMD) between 2004 and 2007 out of an estimated 5,408 graduates over a period of 4 years. Thus, about 1,511 fresh graduates were not recruited between from 2004 to 2007. As highlighted in section 3.6.3, the MoH actually needed to employ an additional 28,048 doctors, clinical officers, nurses, midwives, pharmacists, and paramedical staff (248% more) between 1991 and 2006 but this was not the case.
Table 15: Trends in the recruitment of Core Health Workers 2004 – 2007
Year Actual Number of health workers
recruited
Estimated training Output per year (All
health cadres)
Budgetary allocation/Comments
2004 571 1352
Employment was made against funded posts to fill the gaps left by retirees, deserters and the deceased. No budget for recruitment
2005 1336 1352 MoFNP set aside K32 Billion for recruitment, retention & repatriation of health workers
2006 690 1352 The MoFNP set aside K14.4 Billion for recruitment, retention & repatriation of

48
health workers
2007 1300 1352
The MoFNP set aside K22 billion for new recruitments. MoH was advised by cabinet to recruit workers as it implemented the new structure. The old and new establishments had to be matched
Source: MoH, Human Resources database, 2007 The restrictions on employment did not only lead to fewer numbers in the health sector. It further led to inequitable allocation, poor staff mix, management problems, and low remuneration. By 2006, there were a lot of variations in the staffing levels by provinces and districts with the urban districts being more adequately staffed than the rural districts. For example, in 2006, urban provinces like Lusaka province had the highest number of medical personnel representing 23%, followed by Copperbelt province with 21% and then Southern province with 16% (MoH, 2007). Rural provinces like Luapula and Northern had 5% of the medical personnel each while Western had 6% (ibid). For HIV/AIDS, the effect of the wage ceilings is even more alarming. This has already been illustrated in Table 14 above. Resch et al., (2008) estimate that only 318 health workers (15%) were available (FTEs) to cater for HIV/AIDS interventions in 2007.
3.7.2 IMF Programmes, Poverty and HIV/AIDS Zambia paid dearly during her endeavour to qualify for debt cancellation under the HIPC Initiative. Zambia qualified for HIPC debt relief after reaching the 'completion point' in April 2005 (IMF website www.imf.org). This came after implementing a series of austerity measures prescribed by the IMF. Several people that were interviewed pointed out that cuts in government spending had increased poverty and at the same time seriously hampered Zambia's ability to tackle it. It is also evident that poverty has increased during the implementation of IMF programmes especially the SAPs of 1992. High poverty levels have in turn stimulated an increase in the number of HIV/AIDS cases. As highlighted above, evidence is available which point to the fact that the SAPs led to a massive loss of jobs, increase in the dependency ratios and a breakdown of socio-economic networks. The Central Statistics Office (1997) cited by Lake and others (2000) observe that formal employment rose from 362,000 workers in 1986 to a peak of 546,000 workers in 1992 and then dropped to 472,000 workers in 1996. They further point out that the main cause of poverty in urban areas was rising unemployment which was due to retrenchments. Poverty levels increased drastically during the reform period 1992-1998, attributed to the loss of employment. Poverty grew by 20% using a food-only poverty line between 1991 and 1996. The number of people living below the poverty line increased from 69.7% in 1991 to 78% in 1996 after which it reduced to 73% in 1998, 67% in 2002 and 64% in 2006 (Government of Zambia, 2002; MoFNP, 2004a; CSO, 2006; 2008). Zambia’s Human Development Index (HDI) has been declining over the period of interaction with the IMF. The HDI fell from 0.470 in 1980 to 0.461 in 1990, 0.386 in 2001, and 0.434 in 2007. The country ranked 165 out of 175 countries worldwide in 2007 as compared to the ranking of 130 in 1990 (www.hdrstats.undp.org). The Government of Zambia/UN (1996), describe poverty in Zambia as a social crisis whose critical symptoms are worsening problems in public health and a decreasing life expectancy that is linked with

49
the rising HIV/AIDS burden. Vulnerability to contracting HIV (mainly due to poverty) among the youth remains high with the proportion of 15-24 year olds who reported having sexual intercourse before the age of 15 years increasing from 10.3% in 2005 to 14.6% in 2007 (MoH/NAC, 2008). The MoH explains the relationship between HIV/AIDS and poverty. “High levels of poverty directly or indirectly promote behaviours which create vulnerability to HIV/AIDS. In turn, the consequences of HIV/AIDS can lead to poverty, resulting in a complex and mutually re-enforcing inter-relationship between HIV/AIDS and poverty, where the majority of the poor are women” (MoH/NAC, 2008).
Table 16: Linkages between Poverty and HIV/AIDS
1990-2000 2000-2005 2005-2006 Percentage Increase in the number of People Living with HIV/AIDS
183% 45% 8%
Percentage Increase in AIDS Related Deaths 624% 24% 1% Poverty Levels on Average during the time period
74% 67.5% 64%
Source: Authors’ construction using data from Table 3: Trends in HIV Morbidity and Mortality. Poverty data was obtained from Government of Zambia (2002); MoFNP (2004a); and CSO (2006; 2008). Having already shown that IMF programmes have contributed to the rise in the poverty levels and fall of the HDI in Zambia, Table 16 above looks percentage increases in the people living with HIV/AIDS and AIDS-related deaths between 1990 and 2006. The Table shows that between 1990 and 2000, the poverty levels were at their highest (74%) and at the same time, the percentage increase in the number of people living with HIV/AIDS and AIDS-related deaths were 183% and 624%, respectively. As the poverty levels reduced during the periods 2002-2005 and 2005-2006, the percentage increase in the number of people living with HIV/AIDS and AIDS-related deaths also reduced. The data can also be analyzed vice-versa to illustrate the impact of HIV/AIDS on poverty. Booysen (2003) cited by Greener (2004) shows that the incidence of poverty is higher for households affected by HIV/AIDS than for those not affected by it.
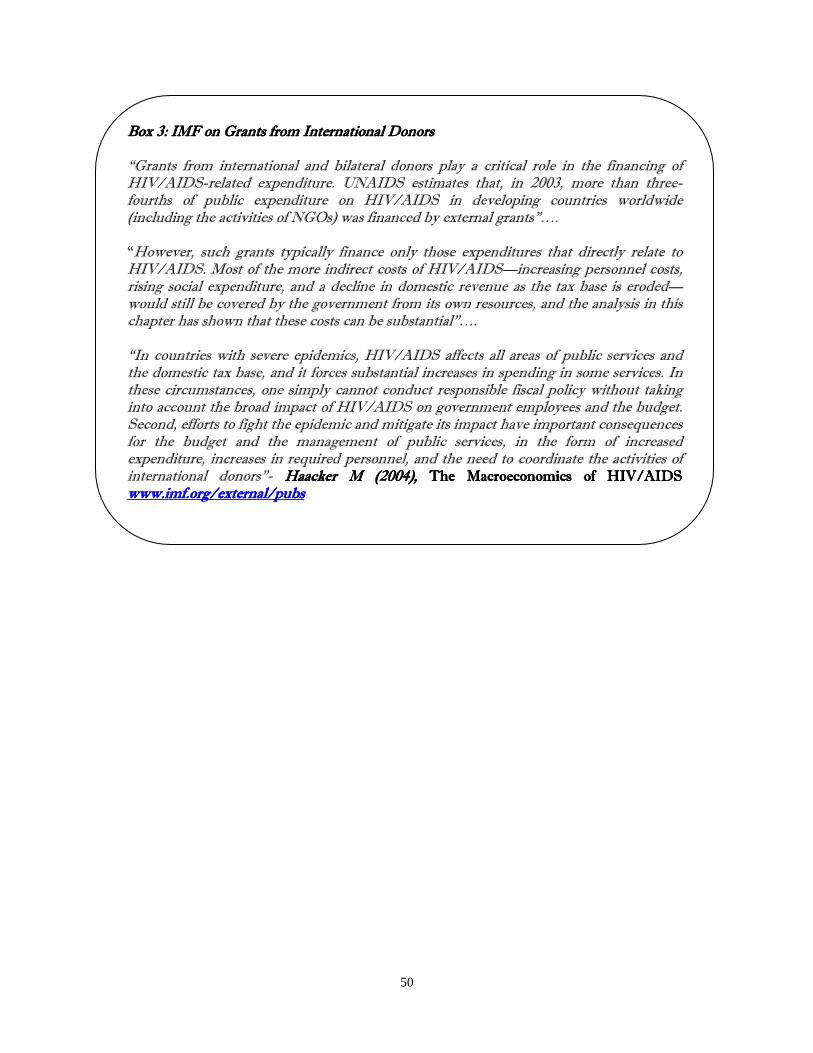
50
Box Box Box Box 3333: IMF on Grants from Intern: IMF on Grants from Intern: IMF on Grants from Intern: IMF on Grants from International Donors ational Donors ational Donors ational Donors “Grants from international and bilateral donors play a critical role in the financing of HIV/AIDS-related expenditure. UNAIDS estimates that, in 2003, more than three-fourths of public expenditure on HIV/AIDS in developing countries worldwide (including the activities of NGOs) was financed by external grants”…. “However, such grants typically finance only those expenditures that directly relate to HIV/AIDS. Most of the more indirect costs of HIV/AIDS—increasing personnel costs, rising social expenditure, and a decline in domestic revenue as the tax base is eroded—would still be covered by the government from its own resources, and the analysis in this chapter has shown that these costs can be substantial”…. “In countries with severe epidemics, HIV/AIDS affects all areas of public services and the domestic tax base, and it forces substantial increases in spending in some services. In these circumstances, one simply cannot conduct responsible fiscal policy without taking into account the broad impact of HIV/AIDS on government employees and the budget. Second, efforts to fight the epidemic and mitigate its impact have important consequences for the budget and the management of public services, in the form of increased expenditure, increases in required personnel, and the need to coordinate the activities of international donors”- Haacker M (2004)Haacker M (2004)Haacker M (2004)Haacker M (2004),,,, The Macroeconomics of HIV/AIDS The Macroeconomics of HIV/AIDS The Macroeconomics of HIV/AIDS The Macroeconomics of HIV/AIDS www.www.www.www.imfimfimfimf.org/external/pubs.org/external/pubs.org/external/pubs.org/external/pubs

51
4.1. Critical Review of Underlying Assumptions of the IMF Macroeconomic Framework in Zambia The policy priorities that inform the design of Zambia’s macroeconomic framework are to maintain a very restrictive degree of macroeconomic stability—as the IMF defines it with inflation at 5 percent per year and deficits below 1 percent of GDP. Health advocates must be aware that this particular policy priority subordinates other social goals and, consequently, the IMF’s framework does not allow for adequate “scaling up” of ODA inflows or increases in domestic spending to the degree projected to be needed to achieve the MDGs or fight HIV/AIDS and TB effectively. If health advocates want to see substantially increased public spending and investment on health budgets, they will need to champion different macroeconomic policies that are informed by different policy priorities. Moving beyond 30 years of frameworks based on “stabilization,” new frameworks are needed that will enable a scaling-up in spending and investment. This cannot be achieved until current IMF policy priorities are changed. This report critically reviewed several fundamental assumptions that underpin the IMF approach to monetary policy in Zambia which deserve greater public scrutiny by a broader group of public stakeholders: The IMF begins with a major assumption that macroeconomic stabilization—as the IMF defines it—must come first and be constantly maintained thereafter, and that this will create the conditions necessary for higher growth and poverty reduction over the long term. Therefore, it is assumed that in the short-term and medium term, the goals of maintaining low deficits and low inflation must take precedence over achieving the MDGs and fighting AIDS effectively. These social and health goals, it is assumed, will only be achieved eventually, after a sustained long-term commitment to maintaining low deficits and low inflation. According to the assumptions of this orthodox approach, the main monetary policy goal should be an inflation-focused monetary policy. Other important goals, such as rapid economic growth and employment creation, are seen as inappropriate direct targets of central bank policy. Therefore, this orthodox approach to monetary policy focuses on stabilization rather than growth or development, with an implicit assumption that once stabilization is achieved, it is believed that higher rates of economic growth, employment creation, and poverty reduction will follow. This orthodox view not only specifies the appropriate target of monetary policy, but also the appropriate tools or instruments. The orthodox approach has emphasized the use of “indirect”, market-based instruments of policy, such as short-term interest rates, as the primary and often exclusive tool of monetary policy. This is in contrast to the “direct”, quantitative tools often used by central banks which have involved credit allocation methods, interest rate ceilings, and other ways to direct credit to priority economic sectors and goals. In short, the IMF-sponsored orthodox approach has narrowed both the goals, options and the tools of monetary policy in Zambia. The IMF approach of targeting for very low inflation (often 5 percent or lower) informs the type of conditionality that the IMF imposes. As the IMF states: "Conditionality in Fund-supported programs is intended primarily to ensure that Fund resources are used to support adjustment toward sustained external viability, and thereby to safeguard the capacity to repay the Fund”. Traditionally, monetary conditionality consists of limits on monetary aggregates - specifically, a floor is set for the level of net international
CHAPTER FOUR

52
reserves (NIR) and a ceiling is established on the net domestic assets (NDA) or on base money” (IMF 2006b). Under the standard IMF financial programming methods, target ceilings are set for central bank monetary and credit expansion and floors are established on net foreign reserves. The original motivation for these restrictions was to ensure the ability of countries to reduce their foreign debt and remain solvent, including protecting the ability of the IMF to get repaid. Recently, other goals, such as reducing inflation, increasing foreign exchange reserves and "creating room for private investment," have been emphasized. According to Epstein (2006), however, the IMF is concerned that this NDA-NIR approach could allow for higher inflation than it finds appropriate, if, for example, larger than necessary increases in net international reserves result from inflows of capital (including foreign aid). As a result, some IMF programmes require a further tightening of monetary conditions in order to maintain inflation rates in the low single digits. Financial programming has been used since the 1970's as part of the IMF's lending programme to least developed countries. This programming has now been folded into the PRSP and HIPC processes without much alteration. The programming uses a set of "identities" and extremely simple models (at best, a set of assumptions about the structure of the economy) to establish a set of targets that the IMF will monitor and the government will have to meet in order to receive the next instalments of IMF loans, or qualify for HIPC relief and other donor support (Easterly 2002). The typical programme connects balance of payments constraints, the government fiscal deficit, and central bank policy in order to attempt to reduce indebtedness to a sustainable level, primarily by keeping economic growth in line with likely available foreign resources from export receipts, aid and capital inflows. Increasingly, reducing inflation into the mid single-digits has become a central focus. Therefore, two central assumptions of IMF macroeconomic programmes such as Zambia’s are (1) that inflation rates between 10 and 20 per cent are bad for economic growth and reducing inflation below that level will not reduce economic growth; and (2) that reducing government spending is good for the economy, because more government spending crowds out private investment. 1. Regarding the first assumption on inflation, it is important for readers to know that there is very little empirical evidence in the economics literature to justify pushing inflation down to the 5-7 percent level, with the consequences of lower growth, lower taxes and lower spending that result. This is often considered surprising, given the widespread belief that the IMF is the expert on such matters. While everyone agrees that high inflation is bad and must be prevented or reduced when it occurs, a more relevant question is how low must inflation be brought down and at what level must it be maintained. On this point, the IMF’s position that inflation must be brought down to and maintained at the 5-7 percent range is not backed up by the empirical literature or historical record. At least 9 major studies have examined this question and have tried to find the “kink” in the inflation-growth relationship, or at what level inflation begins to hurt a country’s long-term GDP growth rates: 1) Fischer (1993) found the point to be between 15-30 percent; 2) Bruno (1995) cites a major unpublished World Bank study of the link between inflation and economic growth in 127 countries from 1960 to 1992 that found that inflation rates below 20 percent had no obvious negative impacts for long-term economic growth rates; 3) Barro (1996) found that an increase by 10 percentage points in the annual inflation rate is associated on impact with a decline by only 0.24 percentage points in the annual growth rate of GDP but says nothing about the disinflation policy targets; 4) Sarel (1996) found the danger point at 8 percent; 5) Bruno and Easterly (1998) found the danger point to be as high as 40 percent; 6) Ghosh and Phillips (1998), found inflation-growth relationship is convex, so that the decline in growth associated with an increase from 10 percent to 20 percent inflation is much larger than that associated with moving from 40 percent to 50 percent inflation, but this says nothing about disinflation policy targets; 7) Khan and Senhadji (2001) found the danger point for inflation at between 11 percent-12 percent for developing countries and 1-3 percent for industrialized countries); 8) Gylfason and Herbertsson (2001) found the danger point for inflation at

53
between 10-20 percent; and 9) Pollin and Zhu (2005) found the danger point to be between 14-16 percent (for middle and low-income countries). What these 9 major studies show is that not only are the estimates are all over the place and further research is still needed, but as Pollin and Zhu note, “There is no justification for inflation-targeting policies as they are currently being practiced throughout the middle- and low-income countries” (Pollin and Zhu 2005). The same literature was reviewed by a 2007 study from the Washington-based Center for Global Developmen, which found, “Empirical evidence does not justify pushing inflation to these levels in low-income countries” (CGD 2007). The House Financial Services Committee of the US Congress wrote to the IMF in 2007, “We are concerned by the IMF’s adherence to overly-rigid macroeconomic targets,” and, “It is particularly troubling to us that the IMF’s policy positions do not reflect any consensus view among economists on appropriate inflation targets” (Financial Services Committee 2007). This approach has been the policy for 25 years; it has been effective at stabilization (or over-stabilization), but has done very poorly at generating higher economic growth that translates into poverty reduction, job creation and increased public investment as a percent of GDP. While it might seem obvious that stabilization-focused central bank policy represents the only proper role for central banks, history casts serious doubt on this claim. Far from being the historical norm, Epstein (2007) notes this focus by central banks on stabilization to the exclusion of development represents a sharp break from historical practice, not just in the developing world but also in the now-developed countries as well. In many of the successful currently developed countries, as well as in many developing countries in the post-Second World War period, development was seen as a crucial part of the central bank's tasks. Now, by contrast, development has been removed from the domain of central banks in most developing countries (Epstein 2006). This approach underscores why the IMF should not be in the “development business” and is not a “development organization.” As a 2007 report from the IMF’s Independent Evaluation Office explained, there were differences of views among the members of the IMF Executive Board about the IMF’s role and policies in poor countries; that after more than 7 years after adopting PRSPs and re-branding the ESAF as the PRGF and ostensibly claiming to back the MDGs, the IMF’s leadership never issued any direction as to how to change any of the macroeconomic policies to create an scaling-up environment. This IEO report found that “lacking clarity on what they should do,” the IMF staff “tended to focus on macroeconomic stability, in line with the institution’s core mandate and their deeply ingrained professional culture.” (IEO 2007). If this approach remains intact, countries will not reduce poverty or achieve the MDGs or get the health personnel in place needed to fight HIV/AIDS and other diseases. 2. Regarding the second assumption that reducing government spending is good for the economy, this is based on the IMF’s assumption that increased deficit spending by the government “crowds out” the limited available credit in the country, and limits the ability for further private sector investment, and therefore that deficit financing leads to inflation. There is little empirical evidence that deficits lead to higher inflation; and there is mounting evidence for the reverse of “crowding out” effect, as even noted by the IMF’s Sanjeev Gupta, et al., (IMF 2006b), that, depending on the nature of the public investments, public spending can actually have a “crowding-in” effect that creates new opportunities for private investment (IMF 2006b; Roy, et al, 2006). However, the IMF’s zero-sum approach (crowding out) has led to an overly restrictive stance on the government drawing from the limited supply of credit in the economy and continues to restrain government financing for increased public spending and investment. 3. A third assumption made by the IMF in the design of the macroeconomic framework for Zambia is that inflation can be effectively be controlled by having the central bank try to carefully restrict and modulate

54
the growth rate of the money supply in the economy. However, the empirical evidence shows that in most developing countries:
• Central banks have influence over a small portion of the money supply—only the currency and reserves of the banking system;
• Monetary policy is not always effective. Central banks may have limited influence over all of the multiple factors that contribute to the growth of the money supply (broadly defined);
• The link between the money supply and inflation is often weak; • Uncontrollable growth of the money supply will lead to hyper-inflation, but such targets often
cannot “fine tune” low rates of inflation; • Richer countries (like the US & Europe, Brazil, South Africa) target interest rates, not the money
supply; • Inflationary pressures in most low-income countries tend to come from price shocks (food,
energy price increases, etc) and therefore monetary policy is not effective in managing this type of inflation (non-monetary shocks);
• Adopting a tight monetary policy in response to a negative price shock can make the situation worse, but this is what Zambia is doing in the face of a global economic downturn;
• Many African countries have a history of fairly stable inflation, so the obsession with the need to constantly monitor and restrict inflation is misplaced;
• Other IMF reforms (like devaluing the currency) can actually contribute to inflation 4. A fourth major assumption of the macroeconomic framework for Zambia is that monetary policy should be dominant, that it should lead, and fiscal policy goals should follow and be constrained accordingly in order to help the monetary goal be achieved (monetary policy dominance). Such a policy approach limits and subordinates a developmental fiscal policy framework from being adopted, prioritized or realized, requiring that fiscal policy accommodate monetary policy targets. Under this approach, as long as the monetary policies are geared for tight stabilization goals, any “scaling up” of public spending or investment to meet the MDGs or fight HIV/AIDS will be extraordinarily limited and significant spending increases will simply not be possible. 5. A fifth major assumption of the macroeconomic framework is that inflation-reduction or “price stability” should be the only monetary policy target. This is an ideological preference of the monetarist school of thought within neoclassical economics, and neglects other possibilities from consideration. According to the Political Economy Research Institute (PERI) at University of Massachusetts, there is no reason why other or different targets cannot also be included on the central bank’s agenda and mandate (Epstein 2006). For example the US and European Central Bank are tasked with achieving targets for inflation as well as employment, and must balance the two objectives; other possible targets include a target for achieving certain growth rates or employment rates. 6. A sixth assumption of Zambia’s macroeconomic framework is that the private-sector will lead in job creation, and aggressive privatisation of state industries is the best approach. The IMF does not address the crisis of unemployment and underemployment in Zambia, or what proactive steps could be taken to increase employment. This is despite widespread agreement among economists that the best way to get people out of poverty is to create jobs. But the neoclassical assumption is that these jobs shall be mostly created by the dynamism of the private sector—and must not be public sector jobs. Yet, the use of high, market-based interest rates at 25 percent for commercial loans (part of the policy to drive inflation below 5 percent) prohibits companies from expanding employment and production, or from generating higher tax revenues. 7. A seventh assumption of the macroeconomic framework is that the market (bond investors) should determine high interest rates for government bonds based on the perception of risk of default by investors
55
in the market. The IMF assumes that it is most efficient for the state to not intervene and to not set artificially lower interest rates, and that the “market” should set rates. Health advocates should be concerned that it is precisely such high, market-determined interest rates that prevent governments from being able to affordably engage in higher deficit finance or health spending. High rates also prevent domestic companies from expanding production and employment and generating increased tax revenue. Consequently, currently in Zambia, the commercial banks lending rate was at about 25 percent between January and June 2008. However, all of the industrialized countries have a long tradition of using various mechanisms to create lower interest rates for public investments and more affordable credit.
56
CHAPTER FIVE
5.0 DISCUSSION, CONCLUSIONS AND RECOMMENDATIONS
5.1 Discussion The readership will appreciate that we did a comprehensive search (through document reviews and key informant interviews) of the evidence regarding the impact of IMF programmes on the capacity to address HIV/AIDS and TB crisis in Zambia and other countries. We took care to triangulate the information with other studies while providing our own analysis based on the results. We looked at IMF’s programmes historically, their impact along the process, effect today and how the new quantitative and structural conditionalities will affect the Zambian economy, and the size of the national budget, and particularly budgets for health and HIV/AIDS. The evidence gathered suggests that the IMF programmes in Zambia (SAPs, ESAF, PRGF, SMP) have been unsuccessful in creating sustainable and equitable growth, especially in the health sector. Market liberalization and privatization through the SAPs contributed significantly to massive loss of employment which in turn led to an increase in poverty, reduced human capital formation, and reduced life expectancy. Linkages between poverty and HIV/AIDS were established and it was shown that percentage increases in the number of HIV/AIDS patients and AIDS-related deaths increased with higher poverty levels. Claims by the IMF that it does not dictate policies and programmes to governments but merely provides technical assistance based on government-generated polices were found wanting. The study explored this IMF assertion and found that the IMF still has a great influence when it comes to macroeconomic policy formulation, including setting of the macroeconomic framework and quantitative targets that inform the confines of annual budget ceilings. Quantitative and structural conditionalities are still very much applicable as was highlighted in Table 8. These conditions have been implemented over many years and continue to be part of Zambia’s most recent PRGF which runs from 2008 to 2011. Consultations with other key stakeholders in the economy (line ministries, CSOs, parliamentarians, academia, etc) were not engaged in the consultation process at the appropriate and critical stages, but simply asked for informal consent on what had already been decided by IMF and the finance ministry behind closed doors. The IMF further claims that it does not restrict government funding but that the restrictions are applied only when the government wants to spend beyond its means. It further claims that it seeks to protect spending in priority sectors such as health, education, and infrastructure. However, the study clearly finds that the funding for health and HIV/AIDS have not been adequately protected, as can be seen from the declining annual nominal government budgets for health and HIV/AIDS, and declining GHE as a percentage of GDP. In addition, MoH has a financing gap of $US 756 million for it to fully implement the National Health Strategic Plan up to 2010. Funding from all sources was considered when estimating the total funding available and financing gap. A look at the contribution to THE, showed that donors and households jointly contributed 68% on an annual basis. The trends in HIV/AIDS expenditure by source further highlights Government’s declining role in the financing of health. This suggests that the macroeconomic framework is not enabling a meaningful
57
“scaling-up” of public spending. Donors’ contribution to HIV/AIDS has doubled over the 2002 levels while the Government’s contribution fell by almost half. Donors’ contribution was on average over 55% more than Government contribution between 2003 and 2006. Reduced spending for HIV/AIDS can be attributed to the low government funding to health, which is also attributable to constrained space for spending and investment that follow from the IMF’s tight monetary and fiscal programmes. Increased use of donor funding would eventually make the HIV/AIDS programme financially and system unsustainable. Another important aspect of funding for HIV/AIDS is the financial burden being borne by households, particularly the poorest households, and that the frequency of acquiring opportunistic infections among HIV/AIDS patients is high. The study found out that the percentage of households’ expenditure on HIV/AIDS has been declining since 2003 but was still higher than government expenditure on HIV/AIDS throughout the period 2003 to 2006. The high levels of household financing of HIV/AIDS care has implications on equity of access more so that many HIV/AIDS patients normally access additional resources (through assistance or credit) in order to finance their health care. The high households’ expenditure on HIV/AIDS implies that the financial burden on the poor is still high despite government’s provision of free ARVs since mid-2005. The free ARVs policy might not have fully reduced the frequency of opportunistic infections among HIV/AIDS patients and likelihood of incurring catastrophic health expenditures. Before the provision of free ARVs, government was charging close to $US10 per patient as a cost-sharing measure due to low government funding for health and HIV/AIDS. The government was looking for alternative ways of raising additional funding for health during the time of the IMF’s SAPs. Thus, before mid-2005, many HIV patients could not access ARVs as they were prohibitively expensive. Today the ARVs are free but other indirect cost and non-cost barriers prevent access to ART. With minimal cushioning from government, poor households still bear a high degree of financial burden in financing HIV/AIDS. It goes without question that the health sector is labour intensive and requires massive investments in human resources for quality health service delivery and better health. Unfortunately, this was not realized in 2000 as there was a freeze in the public sector wage bill and during the period 2003 to 2006, when the IMF’s SMP was being implemented. The wage bill target was removed as a binding IMF loan condition in 2007, but the IMF programme still retains a wage bill cap of about 8 percent of GDP and wages on the public health sector are still insufficient to meet projected needs. The study showed how the public sector health wage bill and recruitment declined when the wage polices were enforced. The health wage bill as percentage of total government health budget declined from 67% in 2004 to 47% in 2007. The health wage bill as percentage of total government discretionary budget also declined from 6.2% in 2004 to 5% in 2007. In terms of recruitment, there was no budget for recruitment in 2004 and MoH simply put new health workers to replace those that had died, resigned or migrated the public health sector. From 2005 to 2007, recruitments as a percentage of total government health budget declined from 8% in 2005 to 3% in 2006 and then 4% in 2007. The government has lost massive amounts of costs in terms of its publicly-trained health workers who have left for greener pastures upon graduation (also known as the “brain drain”). Conditions of service for those already in-service are also not improving due to the wage bill policies. With low salaries and poor conditions of service, it is difficult to retain health workers and to place fresh graduates in the rural areas. This continues to lead to severe under-staffing and imbalances in terms of numbers, skills/skills mix and geographical distribution. The situation is actually worse in rural areas. The shortage of health personnel is further compounded by the fact that the fight against HIV/AIDS and its opportunistic infections (especially TB and Malaria) require additional health personnel (over the recommended staff establishment) due to increased demand for HIV/AIDS related health care services. For HIV/AIDS, the effect of the wage ceilings is even more alarming. In 2007, it was estimated that only

58
318 health workers (15%) were available (FTEs) to cater for HIV/AIDS interventions in the public health sector. Poor conditions of service and restrictions on employment in the midst of a critical shortage of health workers led to a decline in the quality of health service delivery, as can be seen from the poor health and demographic indicators at that time. Recent evidence from WHO suggests that countries within Africa (e.g. Namibia and Botswana) that have achieved the recommended staff population ratios have shown a tremendous improvement in their national health indicators (WHO, 2005b). The MoH in Zambia is particularly concerned about the poor staffing levels for health and HIV/AIDS, and predicts that the National HIV/AIDS targets will be impossible to achieve without putting in place radical remedial measures. Regarding debt relief, Zambia religiously adhered to the prescriptions of the IMF and in the process endured a long and painstaking path towards HIPC completion. A large part of the debt was cancelled under the HIPC, MDRI, and G-8 initiatives which yielded a lesser debt burden but no corresponding increases in poverty-reducing expenditures in health and HIV/AIDS. We also established that some of the debt has not been cancelled by some Paris and non-Paris club members. We further noted that debt relief initiatives could have provided more fiscal space to Zambia if there were lesser restrictive fiscal and monetary policies from the IMF. With limited fiscal space, the ability to allocate more funds to health and HIV/AIDS is still constrained. We observed that the IMF is still using harmful structural conditionalities on its loans. Zambia was awarded a loan under the PRGF covering the period 2008-2011 but with it comes a lot of structural conditionalities. The most controversial conditionality is the gradual increase in the electricity tariffs to the cost of service. We strongly feel that increasing electricity tariffs will push more people to poverty and then ill-health. Zambia is still very dependent on the mining sector for its export earnings and over 50% of the electricity is consumed by the mines. Thus, increased electricity tariffs will significantly raise the capital costs for the mines leading to job losses, increased dependency ratios, poverty, and ill-health. The mines previously suffered a lot of increments in their capital costs due to a 35% increment in the electricity tariffs in January 2008, increase in the mineral royalty tax to 3% (from 0.6%), and an increase in the corporate income tax to 30% (from 25%). Zambia is also experiencing the economic crisis, that the rest of the world is experiencing, and with it has been a drop in world copper prices. If electricity tariffs continue to increase, Zambia will suffer further job losses. In fact, job cuts in the mines have already started. In December 2008, two mining companies announced 584 planned layoffs while others have responded by reducing production time. Electricity is also vital at household level, especially for improved livelihood, good health and education. Increases in the electricity tariffs will make it difficult for the poor to access the commodity. The study also questioned IMF’s role or real influence in Zambia and other countries in the world. While we believe that the IMF still has a strong influence on the formulation of fiscal and monetary policies in Zambia, we also provided evidence on how the IMF sent signals to other would-be donors on whether to put their money in Zambia or not. This was between May 1987 and August 1989 when the demands from the IMF were too much and Zambia broke away from the IMF and put in place its own home-grown economic recovery programme. The IMF sent signals to other donors to stop assisting Zambia. The study finds that unnecessarily restrictive macroeconomic policies within IMF programmes have yielded negative consequences in the health sector in Zambia. National spending for health and HIV/AIDS has reduced drastically, leading the HIV/AIDS programme to become largely dependent on external and household funding. This raises questions about the equity of access on the part of households, and whether the HIV/AIDS programme is sustainable (financially and system-wise), since it
59
is extremely donor-dependant. The study also concludes that the wage bill polices significantly contributed to the human resources crisis that is currently being experienced in the health sector in Zambia. With a massive shortfall in human resources, the study questions if the quality of care being provided and whether the HIV/AIDS programme can be scaled-up with skeleton staff. The study further concludes that the IMF programmes contribute to increases in poverty levels and HIV/AIDS. The IMF still applies contractionary quantitative and structural conditionalities on its loan programmes, and this has negative implications for foregone future growth, employment and tax revenue generation. Specifically, the structural conditionality on the increase in electricity tariffs has serious implications on capital formation, future investments, employment, and access to the commodity by the poor.
5.2 Findings Regarding Health Budgets, the study finds:
• During 1995-2006, Government health expenditure as a share of the GDP declined steadily, while health expenditure as a percentage of Total Health Expenditure remained steady at an annual average of 29 percent. On the other hand, Household Health Expenditure and Donor Health Expenditure as percentages of Total Health Expenditure averaged 32% and 26% per year, respectively, during the same period. This implies that about 68% of total funding to the health sector comes from households and donors.
• The level of funding to the health sector from all sources was insufficient to fully finance the current National Health Strategic Plan up to 2010. A financing gap of $756 million has been identified.
• Donor contribution to overall spending on HIV/AIDS was on average about 55% more than the government contribution between 2003 and 2006. Government’s reliance on donors to finance the HIV/AIDS programme can be attributed to the restrictive fiscal and monetary policies of the IMF, which limit the growth in the overall government health budget.
• The health sector faces a major human personnel crisis and there are shortages of health workers at every service delivery level. The population to staff ratios were also far above the WHO recommendations for almost all the health cadres.
• Employment of health workers reduced significantly while the staff workload increased. It was observed that recruitment as a percentage of the total Government Health Budget declined from 8% in 2005 to 3% in 2006 and then 4% in 2007. This led to an increase in the workload. The conditions of service were also poor leading to an increase in the migration of health workers to the private sector and foreign countries between 1990 and 2007.
The study examined IMF programmes in Zambia between 1990 and 2009. Macroeconomic policies were aimed at stabilizing the Zambian economy and were implemented through short-term measures such as reform of the public sector, liberalization of markets and a tight fiscal policy aimed at bringing down the public sector deficit. Zambia had to implement these fiscal and monetary policies in order to meet the conditions for receiving loans or bilateral aid. Review of the annual national government health budget showed that it has been fluctuating over the period 1990 to 2007 with the actual trend during the entire period showing a downward spiral. Zambia has not attained its Abuja commitment to spending 15 percent of its annual national budget on health, despite registering some positive economic growth in the last 3 years and reduced debt servicing owing to recent debt cancellation initiatives. Wage bill policies were aimed at limiting the overall government wage bill in order to reduce the domestic non-interest expenditures over the medium term. This included a hiring freeze and setting of ceilings on the government wage bill. The wage bill policies substantially contributed to the slowdown of employment in
60
the health sector, and increased migration of health workers due to worsening conditions of service, exacerbating a critical shortage of core health sector personnel. Regarding IMF programmes, the study finds:
• The current macroeconomic framework for 2008-2011 seeks to maintain a nearly balanced budget; a tight monetary policy of inflation below 5 percent; increase international currency reserves up towards 5 months worth of imports, and maintain market-determined interest rates and exchange rate. A major structural policy conditionality is the gradual increase in the electricity tariffs to the cost of service.
• A major problem is that the overall policy priority of the current macroeconomic framework is for stabilization, not scaling-up. The framework is designed for constraining public spending. It is not designed to enable the large scaling-up of public expenditure envisaged by the MDGs.
• Specifically, the restrictive fiscal and monetary policy targets and the neoliberal reform towards adoption of market-based interest rates, have greatly constrained the ability of the Government to engage in the more expansionary fiscal and monetary policy options that will be required for any major scaling-up scenarios.
• Such targets and policies in the current macroeconomic framework unduly limit the Government’s potential fiscal space, by constraining the overall national resource envelope. This in turn affects adversely allocations to the different ministries, including health ministry.
• IMF programmes are formulated through a closed and non-transparent process involving the IMF and the MoFNP. Other stakeholders, such as other government ministries, donors, civil society and NGOs are later consulted, but not at the initial and crucial stage of setting the policies, quantitative policy targets and budget formulation process.
This paper concludes that the current IMF macroeconomic programmes unduly restrict higher flows of financial and human resources to the health sector. By constraining overall national public spending and investment with its specific quantitative and policy conditionalities, the IMF programmes, in turn, have made it difficult to scale-up interventions for the fight against HIV/AIDS and TB. With limited resources for health and HIV/AIDS, the Government has not been able to significantly scale up interventions for HIV/AIDS from its own resources and it heavily depends on external donor support. With a continuing significant shortfall in human resources, the MoH in Zambia is particularly concerned about the poor staffing levels for health and HIV/AIDS, and predicts that the national HIV/AIDS targets will be impossible to achieve without putting in place radical remedial measures.
5.3 Recommendations 1) Eliminate harmful quantitative, structural and policy conditions attached to IMF programs IMF programmes come with harmful conditionalities which give the Zambian government little discretion to consider alternative options and make important decisions affecting economic management and attainment of national economic goals. We recommend the elimination of harmful conditionalities attached to loans and grants. CSOs and parliamentarians need to demand for the removal of all conditionalities that prevent the government from increasing investment in health, especially human resources. The government and IMF should encourage accountability of funds and prudent public financial management systems without any further economic policy targets or reforms as binding conditions. Macroeconomic management must encourage full spending and absorption of aid. 2) Open Macroeconomic Policy Decision Making to a Broader Group of Public Stakeholders

61
The process of deciding the policy priorities for Zambia’s macroeconomic framework—stabilization or scaling-up—should be subject to a broader national public debate and discussion involving parliament, academia, civil society, labour and the domestic media. Additionally, setting of specific fiscal and monetary targets should be made more transparent and involve broader public discussions of the costs and benefits of alternative policy options. The implementation and evaluation of policy reforms should be participatory and inclusive with all the stakeholders. 3) Open Debt Contraction to a Broader Group of Public Stakeholders The debt sustainability analysis (DSA) for Zambia carried out by the IFIs does not consider human development factors, which are critical for poor countries to meet the Millennium Development Goals. However, any viable DSA tool must include social development issues. Moreover, the current loan contraction procedures lack parliamentary oversight and are neither guided by a debt management strategy nor a comprehensive legal framework. Zambia urgently needs to put in place a comprehensive debt legal framework in order to avoid a resurgence of the debt which in the past was not only caused by economic, political and social reasons, but was also caused by inappropriate policy prescriptions by IFIs. We urge the Government of Zambia to pursue an appropriate and transparent debt contraction and management framework which will guarantee sustainable human and economic development. The Government’s pronouncements in the 2008 national budget indicated intentions to “intensify efforts to consolidate the legal framework governing the contraction and management of debt” this surely needs immediate follow – up with a clear map of action in order for Zambia to effectively put in place mechanisms that can weigh all policy advise against national requirements for development. We urge the Government to quickly produce a road map for this process. We point to the “Debt Management Bill”, proposed by the Jesuit Centre for Theological Reflection, which provides for parliamentary oversight and creates space for broader transparency and accountability to the Zambian people in the contraction and management of public debt (JCTR 2008). 4) Alternative Policies for Increased Public Spending & Investment Must Be Considered The underlying assumptions and policies informing the current macroeconomic framework in Zambia should be revisited, explored and reconsidered by a larger group of public stakeholders. The tight fiscal policy and monetary policy targets should be reviewed along with alternative policy options that could allow more flexibility in deficit financing, geared specifically to mobilize more resources for the health sector. For instance, within the IMF policies, there should be provisions that allow the country to affordably increase deficit financing to generate resources for scaling up health interventions. The IMF must allow the government to explore and adopt more expansionary fiscal and monetary policy options, especially in the context of exogenous shocks such as last year’s commodity price increases and the current continuing global economic and financial crisis. Excellent examples of how Zambia could adopt alternative, more expansionary policies to scale-up spending in public health have been proposed by UNDP’s International Poverty Centre 5) Conduct IMF Macroeconomic Literacy Trainings The CSOs, parliamentarians, labor unions, line ministry staff, academics and the domestic media all need to play a more active role in urging the government to negotiate demand for removal of all conditionalities that prevent the government from increasing investment in health and particularly on HIV/AIDS and TB. It is imperative for all of these public stakeholders in the country to be familiar with IMF program policies, the content of the policies, the context in which they are introduced and the effects of the policies in relation to health care delivery. A range of alternatives should be discussed and debated before such policies are decided. CSOs should therefore create awareness through hosting and convening

62
IMF Macroeconomic Literacy Trainings for public stakeholders so as to increase knowledge of the IMF policies and their effects. Such training is an essential prerequisite in order to collectively advocate for alternative, more expansionary macroeconomic policies that could more effectively reduce poverty and advance the health of Zambians. There is an immense and immediate need for training and awareness-raising among CSOs, labour, legislators, media reporters, and senior officials within the government who are responsible for mobilizing and spending resources for health about how IMF policies impact spending, as well as about basic introductory economics. 6) Eliminate the Wage Bill Ceiling In addition to a broader review o the whole policy framework, one immediate short-term step that could be taken is to remove the current wage bill restriction of 8.5 percent of GDP. The cap on the wage bill was shown to be one of the critical factors limiting the Ministry of Health efforts to recruit adequate personnel for the scale up of HIV/AIDS and TB services. In view of this, CSOs in collaboration with MPs, other national stakeholders and international advocacy partners need to advocate for the removal of wage bill ceilings by the Government. This will enable the Government the flexibility to employ additional personnel for the scaling up of health, HIV/AIDS and TB intervention 7) Example of Alternative Policy Approach to Consider: Managed Exchange Rates The rapid rise in the international price of copper resulted in a substantial appreciation of the Kwacha, which had negative fiscal effects, caused domestic welfare losses, and reduced external competitiveness, followed by a sudden reversal as the copper prices dropped. Such volatility suggests that exchange rates ought to be more carefully managed in the short term, although also done within a longer term development framework. According to Weeks (2008), given the openness of Zambia’s economy and its sensitivity to the copper price, an appropriate policy would be a managed fixed exchange rate. Over the last two decades, governments followed an IMF policy of “getting the short term economic management right and hoping the long run would take care of itself”. In a natural resource based country, this has been a recipe for slow growth and lingering copper dependence (Weeks 2008). 8) Example of Alternative Policy: Large Reinvestment in Public Water System The evidence indicates that investment did not increase after water sector liberalisation. Not only has the government underinvested in the sector, but it has also failed to maintain its plans for capital expenditure. Total capital expenditure, including donor funds, has remained a minor fraction of the spending needed to maintain existing rates of access to water. The policy dilemma is how to fund capital investment without high tariffs restricting access. So far, Zambia’s liberalisation strategy has emphasised tariff rationalisation. Yet, this has failed to ensure full cost recovery and has further constrained affordability and accessibility. According to Dagdeviren and Robertson (2008), an alternative policy approach for broader public consideration is for the Government to engage in a large, up-front public investment to renew and extend infrastructure of the public water system. This approach would reduce unit costs in the sector, make tariffs affordable and improve the sustainability of cost-recovery efforts, more than paying for itself over the long-term. 9) Example of Alternative Policy: No Electricity Price Increases for Consumers The proposed future increase in electricity tariffs should not be implemented. The IMF is requiring Zambia to increase electricity tariffs and this may have serious implications for future export earnings from the mining and other industries, employment opportunities, and national food security. The Government should instead explore alternative policy approaches, including the option of increasing the

63
operational efficiency of ZESCO and the rehabilitation and construction of new power generation projects.
64
REFERENCES Abel-Smith B (1986). ‘Funding Health for All –Is Insurance the Answer?’ World Health Forum. Vol no 3 pp 3-32 ActionAid USA, et al (2004). Blocking Progress: How the Fight against HIV/AIDS is being undermined by the World Bank and International Monetary Fund. Action Aid International USA, Global AIDS Alliance, Student Global AIDS Campaign, and RESULTS Educational Fund, September, Washington DC. ActionAid (2008). Changing IMF Policies to Get More Doctors, Nurses and Teachers Hired in Developing Countries. Retrieved online from: http://www.ifiwatchnet.org/?q=fr/node/7869 AFRODAD (2006). Assessing the Impact of the PRGF on Social Services: The Case of Zambia. Doc. No. ISBN 0-7974-3172-1. Harare, Zimbabwe Baker B.K (2008). How (and Why) the IMF Blocks the Response to HIV/AIDS. A paper presented at the 2008 International AIDS Conference. Global Village Skills Workshop, 4th August 2008 Bank of England (n.d.). Summary of Zambia’s Economic Reform Programmes, 1992-2006. Retrieved online from: www.bankofengland.co.uk/publications Barro, J. (1996) ‘Inflation and Economic Growth’, Federal Reserve Bank of St. Louis Review, Vol. 78, pp. 153-169. Blas E and Hearst N (2002). ‘Health sector reform and equity-learning from evidence?’ Health Policy and Planning Journal: 17 Page 1-4. Bruno, M. (1995) “Does Inflation Really Lower Growth?” Finance & Development. Vol. 32, No. 3 Sept., pp. 35-38. Bruno, M. and Easterly, W. (1998) ‘Inflation Crises and Long-Run Growth’, Journal of Monetary Economics, Vol. 41, pp. 3-26. Carlsson J, Chibbamullilo P, Orjuela C and Saasa O (2000). Poverty and European Aid in Zambia: A study of the Poverty Orientation of European Aid to Zambia. Overseas Development Institute, London. Published in collaboration with The Nordic Africa Institute Uppsala, Sweden CGD (2007). Does the IMF Constrain Health Spending in Poor Countries? Evidence and an Agenda for Action. Report of the Working Group on IMF Programs and Health Spending, Centre for Global Development (CGD), Washington DC. Central Statistical Office (2005). Epidemiological Projections. Lusaka: Government Printers Central Statistical Office (2006). Living Conditions and Monitoring Survey Report III of 2002/2003. Lusaka: Government Printers Central Statistical Office (2008). Living Conditions and Monitoring Survey Report 2006. Lusaka: Government Printers

65
Central Statistical Office, Ministry of Health & Marco International Inc (1997). Zambia Demographic and Health Survey 1996. Calverton, Maryland: Central Statistical Office and Marco International Inc. Central Statistical Office, Ministry of Health & Marco International Inc (2002). Zambia Demographic and Health Survey 2001/2. Calverton, Maryland: Central Statistical Office and Marco International Inc. Central Statistical Office, Ministry of Health & Marco International Inc (2008). Zambia Demographic and Health Survey 2007 Preliminary Report. Calverton, Maryland: Central Statistical Office and Marco International Inc Chansa C. (2006). A Critical Evaluation of the Sector Wide Approach in the Health Sector in Zambia. A research conducted as part of the requirements for the award of a Master of Public Health in Health Economics of the University of Cape Town, South Africa. Unpublished Chansa C. et al (2008). ‘Exploring SWAp’s contribution to the efficient allocation and use of resources in the health sector in Zambia’. London: Health Policy and Planning; 23: 244–251 Cheelo C (2008). Challenges in Donor Funding in Zambia: the Example of HIV/AIDS Funding: Preliminary Observations. A paper presented at the HEPNet Workshop on Donor funding on 27th May 2008. Livingstone, Zambia Cheelo C, Chitah B and Mwamba S (2007). Tracking the Effects of HIV/AIDS Funds and Operations on the Health System in Zambia: Initial Draft Report. Department of Economics, University of Zambia. Dagdeviren, H. (2008). “Waiting for Miracles: The Commercialisation of Urban Water Services in Zambia”, Development and Change, Vol. 39, No. 1. pp.101–121. Dagdeviren, H. and Hailu, D. (2008) “Tariff hikes with low investment: The story of the urban water sector in Zambia,” International Poverty Center, Policy Briefing, 15 June. Dagdeviren, H. and Robertson, S. (2008) “Reforming without resourcing: The case of the urban water supply in Zambia,” International Poverty Center, Policy Briefing, 1 September. Dawson, T.C (2004). A Response to ActionAid International and Other Organizations. Washington, D.C: IMF. Easterly (2002) “An Identity Crisis? Testing IMF Financial Programming”, Center for Global Development. Working Paper No. 2. August. Economics Association of Zambia (2009). Business Unusual: the Policy Implications for Zambia on the Global Economic Crisis. Lusaka, Zambia - Economics Association of Zambia. Ellyne M. J (2002). The Impact of HIV/AIDS on the Zambian Economy. A presentation made by Former IMF Resident Representative, Dr. Mark Ellyne. Lusaka, Zambia - 2nd December. Epstein (2006) “At Issue: Too much, too soon: IMF conditionality and inflation targeting”, Bretton Woods Project Update, No. 52. 11 September. Epstein (2007) “Central banks as agents of employment creation,” UN Department of Economic and Social Affairs (DESA) Working Paper No. 38. June 2007.

66
Eurodad (2008) “The World Bank and IMF’s long shadow in Zambia’s copper mines,” European Network on Debt and Development, 20 February, Brussels. Financial Services Committee (2007) Letter to the Managing Director of the IMF from the House Financial Services Committee of the US Congress, November 14, 2007. Fischer, S. (1993) ‘The Role of Macroeconomic Factors in Growth’, Journal of Monetary Economics, Vol. 32, pp. 45-66. Fraser, A. and Lungu, J. (2007) “For Whom the Windfalls? Winners & losers in the privatisation of Zambia’s copper mines,” Civil Society Trade Network of Zambia (CSTNZ), January, Lusaka. Genberg H (1993). “Macroeconomic Adjustment and the Health sector: A Review”. Macroeconomic Environment and Health. WHO, Geneva. Ghosh, A. and Phillips, S. (1998) “Warning: Inflation May be Harmful to Your Growth,” IMF Staff Papers, Vol. 45, pp. 672-710. Global Policy Forum (2005). Zambia: The Hard Road to HIPC Completion. Retrieved online from http://www.globalpolicy.org/socecon Goldsbrough D and Cheelo C (2007). IMF Programs and Health Spending: Case Study of Zambia. Centre for Global Development: Background Paper by the Working Group on IMF Programs and Health Expenditure Government of the Republic of Zambia (2002). Zambia Poverty Reduction Strategy Paper (2002 – 2004). Lusaka: Ministry of Finance & National Planning Government of the Republic of Zambia/UN (1996). Prospects for Sustainable Human Development in Zambia: More Choices for Our People. GRZ/UN, ZARD, UN, UNDP Greener R (2004). The impact of HIV/AIDS on Poverty and Inequality in Haacker M. Eds The Macroeconomics of HIV/AIDS. Retrieved online from www.imf.org/external/pubs Gylfason, T. and Herbertsson, T. (2001) ‘Does Inflation Matter for Growth?’, Japan and the World Economy, Vol. 13, pp. 405-428. Haacker M (2004). The Impact of HIV/AIDS on Government Finance and Public Services in Haacker M. Eds The Macroeconomics of HIV/AIDS. Retrieved online from www.imf.org/external/pubs Hailu, D. (2008) “The Macroeconomics of Scaling-Up Aid: What We Know in Kenya, Malawi and Zambia,” International Poverty Centre, One Pager No. 67, September. Hamoudi A.K (2000). Malaysia: Resolving the Economic Crisis without the IMF. Retrieved online from www.islamonline.net/servlet/Satellite Hjortsberg, C.A. and C. N. Mwikisa (2002). ‘Cost of access to health services in Zambia’. Health Policy and Planning Journal: 17 [1]: Page 71-77

67
Kombe, K., Galaty, D., Mtonga, V. and Banda, P. (2005). Human Resource Crisis in the Zambian Health System: A Call for Urgent Action. Lusaka, Zambia Koot, J. and Martineau, T. (2005). Mid Term Review: Zambian Health Workers Retention Scheme (ZHWRS). Lusaka, Zambia IEO (2007) “The IMF and Aid to Sub-Saharan Africa”, Independent Evaluation Office, The International Monetary Fund, April, Washington, DC. Inside Mining (2008). Drop in global copper prices triggers job cuts in Zambia. Retrieved online from www.insidemining.co.za International Labour organization (2008). Zambia Social Protection Expenditure and Performance Review and Social Budget. Geneva, Switzerland IMF (2005). IMF to extend 100 Percent Debt Relief to Zambia Under the Multilateral Debt Relief Initiative. IMF Press Release No. 05/306 IMF (2006a). Zambia: Selected Issues and Statistical Appendix. IMF Country Report No. 06/118. IMF: Washington D.C. IMF (2006b) “Macroeconomic Challenges of Scaling Up Aid to Africa: A Checklist for Practitioners”, by Sanjeev Gupta, Robert Powell, and Yongzheng Yang. The International Monetary Fund, August, Washington, DC. IMF (2008a) “Zambia: Request for a Three-Year Arrangement Under the Poverty Reduction and Growth Facility—Staff Report; Staff Statement; Press Release on the Executive Board Discussion; and Statement by the Executive Director for Zambia,” IMF Country Report No. 08/187, June 2008. International Monetary Fund, Washington DC. IMF (2008b) “The Macroeconomics of Scaling Up Aid: The Cases of Benin, Niger and Togo,” International Monetary Fund, Washington DC. IMF (2008c) “The Poverty Reduction and Growth Facility (PRGF): A Factsheet,” International Monetary Fund, October, Washington DC. IMF (2009) “Statement at the Conclusion of an IMF Staff Mission to Zambia,” Press Release No. 09/55, 4 March. International Monetary Fund, Washington DC. JCTR (2008) “IMF Advice for New Energy Borrowing Risks Creating a ‘Moral Hazard Syndrome’ Warns JCTR,” Press Release, March, The Jesuit Centre for Theological Reflection, Lusaka. Khan, M. and Senhadji, A. (2001) ‘Threshold effects in the Relation Between Inflation and Growth’, IMF Staff Papers, Vol. 48, pp. 1-21. Lake S (2000). Zambia Country Health Briefing Paper. A Paper Produced for the Department For International Development. Institute for Health Sector Development. Lake S, Daura M, Mabandhla M, Masiye F, Mulenga S, Antezana I, Mwikisa C, and Bennett S (2000). Analyzing the Process of Health Financing Reform in South Africa and Zambia: Zambia Country Report. Abt Associates Inc, Bethesda, Maryland.

68
Lewis, M (2005). Addressing the Challenge of HIV/AIDS. Macroeconomic, Fiscal and Institutional Issues. Washington, D.C: Centre for Global Development Masiye F, Seshamani V, Cheelo C, Mphuka C & Ödegaard K (2005). Health Care Financing In Zambia: A Study of the Possible Policy Options for Implementation. Lusaka: UNZA/Ministry of Health. Unpublished Masiye F, Chitah BM, Chanda P, Simeo F (2008). Removal of User Fees at Primary Health Care Facilities in Zambia: A study of the effects on Utilisation and Quality of Care. A study done on behalf of EQUINET. Retrieved online from www.equinetafrica.org McCulloch N, et al (2001). Poverty, Inequality and Growth in Zambia during the 1990s by Neil McCulloch, Bob Baulch and Milasoa Cherel-Robson, Discussion Paper No. 2001/123, World Institute for Development Economics Research – United Nations University (UNU/WIDER), November, Helsinki. McIntyre D, Thomas S, and Clearly, S (2004). ‘Globalization and Health Policy in South Africa’. Koninkligke Brill NY, Leiden 3, 1-12 Mills A and Gilson L. (1988). Health Economics for Developing Countries: A Survival Kit. HEFP working paper, LSHTM Ministry of Finance and National Planning (2002a). Transitional National Development Plan (2002 – 2005). Lusaka: Government Printers Ministry of Finance and National Planning (2002b). Poverty Reduction Strategy Paper 2002 – 2004. Lusaka, Zambia Ministry of Finance and National Planning (2003). Medium Term Expenditure Framework 2004 – 2006. Lusaka, Zambia Ministry of Finance and National Planning (2004a). Economic Report 2004. Lusaka, Zambia Ministry of Finance and National Planning (2004b). Medium Term Expenditure Framework 2005 – 2007. Lusaka, Zambia Ministry of Finance and National Planning (2005a). Medium Term Expenditure Framework 2006 – 2008. Lusaka, Zambia Ministry of Finance and National Planning (2006). Fifth National Development Plan. Lusaka, Zambia Ministry of Finance and National Planning (2007). Zambia Aid Policy and Strategy. Lusaka, Zambia Ministry of Finance and National Planning (2008a). 2008 Budget Speech to Parliament. Lusaka, Zambia Ministry of Finance and National Planning (2008b). Linkages between Budget and Aid Flows in Zambia within the Medium Term Expenditure Frame (MTEF). A paper presented at the Parliamentary Consultative Dialogue on Aid Effectiveness. Livingstone, Zambia. 4th -7th June 2008 Ministry of Health (1992). National Health Policies and Strategies. Lusaka: Ministry of Health, Zambia

69
Ministry of Health (2000). National Health Strategic Plan 2001 – 2005. Lusaka: Ministry of Health, Zambia Ministry of Health (2001). Joint Health (pre) Appraisal Report. Lusaka: Ministry of Health, Zambia. Ministry of Health (2002). National HIV/AIDS/STI/TB Policy. Lusaka: Ministry of Health, Zambia. Ministry of Health (2003). Mid Term Review of the National Health Strategic Plan 2001 – 2005. Lusaka: Ministry of Health, Zambia Ministry of Health (2004a). Institutional and Organisational Appraisal. Lusaka: Ministry of Health, Zambia. Unpublished Ministry of Health (2004b). Performance Audit Report of the National Health Strategic Plan 2001 – 2005. Lusaka: Ministry of Health, Zambia. Unpublished Ministry of Health (2005a). National Health Strategic Plan 2006 – 2010. Lusaka: Ministry of Health, Zambia Ministry of Health (2005b). Human Resources for Health Strategic Plan 2006 – 2010. Lusaka: Ministry of Health, Zambia Ministry of Health (2006a). National Health Accounts 2002-2004. Lusaka: Ministry of Health, Zambia Ministry of Health (2006b). 2005 Ministry of Health Annual Report. Lusaka: Ministry of Health, Zambia Ministry of Health (2007). 2006 Ministry of Health Annual Report. Lusaka: Ministry of Health, Zambia Ministry of Health (2008a). National Health Accounts 2005-2006 Draft Report. Lusaka: Ministry of Health, Zambia Ministry of Health (2008b). Mid Term Review of the National Health Strategic Plan 2006-2010. Lusaka: Ministry of Health, Zambia Ministry of Health (2008c). Speech by the Permanent Secretary of the Ministry of Health during the Health Sector Advisory Group Meeting – 23rd October 2008. Lusaka: Ministry of Health, Zambia Ministry of Health, National AIDS Council (2008). Zambia Country Report Multi-Sectoral AIDS Response Monitoring and Evaluation Biennial Report 2006-2007. A report submitted to the United Nations General Assembly special session on AIDS. Ministry of Health. Medium Term Expenditure Frameworks 2005-2007, 2006-2008, 2007-2009, 2008-2010. Lusaka: Ministry of Health, Zambia National AIDS Council (2004). The HIV/AIDS Epidemic in Zambia: Where Are We Now? Where Are We Going? Lusaka: National AIDS Council, Zambia. National AIDS Council (2006a). National HIV/AIDS Strategic Framework 2006-2010. Lusaka: National AIDS Council, Zambia. National AIDS Council (2006b). Joint Programme Review of the National HIV/AIDS/STI/TB Intervention Strategic Plan 2002-2005. Lusaka: National AIDS Council, Zambia.

70
Ndopu D.N. (2008). Fiscal Space and implications to the Health Sector in Zambia. A paper presented at a HEPNet workshop on donor funding for health in Africa. Livingstone, Zambia: 26th-28th May 2008. Phiri F and Tien M (2004). Zambia National Health Accounts 2002: Main Findings. Ministry of Health Zambia and Partners for Health Reformplus - Abt Associates Inc. Bethesda, Maryland. Pollin, R. and Zhu, A. (2005) “Inflation and Economic Growth: A Cross- Country Non-linear Analysis,” PERI Working Paper Series 109, Political Economy Research Institute, University of Massachusetts Amherst, October. Resch S, Lee M, Kombe G, Sinyinza E (2008). Sustainability Analysis of HIV/AIDS Services in Zambia. A publication produced for review by the United States Agency for International Development for the Health Systems 20/20 Project. Roy, R. et al. (2006) “Fiscal Space for Public Investment: Towards a Human Development Approach” by Rathin Roy, Antoine Heuty and Emmanuel Letouze. United Nations Development Program Paper Prepared for the G-24 Technical Meeting, Singapore, 13-14 September. Sarel, M. (1996) ‘Nonlinear Effects of Inflation on Economic Growth’, IMF Staff Papers, Vol. 43, pp. 199-215. Situmbeko L.C and Jack Jones Zulu J.J (2004). Zambia: Condemned to Debt. How the IMF and World Bank have undermined development. World Development Movement, UK Stiglitz J.E. (2002). Globalization and its Discontents. Published by Amazon UNDP (2006) ‘Human Development Report 2006’, United Nations Development Program. Watkins K (1995). The Oxfam Poverty Report. Published by Oxfam Weeks, J. (2008) “Is a ‘Resource Curse’ Inevitable in Resource-Rich Countries? Comparing Policies in Azerbaijan and Zambia,” Development Viewpoint, No. 13, September. Centre for Development Policy and Research, SOAS (UK). Weeks J and Mckinley T (2006). Does Debt Relief Increase Fiscal Space In Zambia? The MDG Implications. Country Study No. 5. Published by the International Poverty Centre, United Nations Development Programme. Weissman, R (2004). The IMF, the World Bank and the HIV/AIDS Crisis. Washington, D.C: Essential Action. WEO (2008). World Economic Outlook Database, 2008. International Monetary Fund, Washington DC. Wilkinson D, Gouws E, Sach M.E and Karim S.S.A (2001). ‘Effect of removing user fees on attendance for curative and preventive primary health care services in rural South Africa’. Bulletin of the World Health Organization, 79: 665-671. Wilks, A. and Ruiz, M. (2008) “A taxing agenda for the IMF,” Bretton Woods Project Update, No. 60, 1 April.

71
Wood A (2006). IMF Macroeconomic Policies and Health Sector Budgets. Amsterdam: Wemos Foundation. World Bank (1994). Better Health in Africa: Experience and Lesson Learned. Development or Practice. World Bank, Washington DC, USA World Bank (1987). Financing health services in developing countries: An agenda for reform. Washington DC, USA World Health Organization (2004). 2004 World Health Report, Health Systems: Finding New Strength, Geneva: WHO. Retrieved from www.who.org World Health Organization (2005a). Summary Country Profile for HIV/AIDS Treatment Scale-up. Retrieved online from www.who.int on 6th August 2008 World Health Organization (2005b). The World Health Report 2005 - Make Every Mother and Child Count. Retrieved online from http://www.who.int/whr/2005/en/ World Health Organization (2007). Everybody’s Business: Strengthening Health Systems to Improve Health Outcomes. Geneva, Switzerland ZAMBIA Daily Mail (2009). First Quantum cuts on production time. Retrieved online from http://www.daily-mail.co.zm