Embed Size (px)
Citation preview

© 2014 GfK Verein
1
Everything, everywhere –
and all the time?
Mobile communication
in Europe 2014 Results from 9 countries
GfK Verein 2014
© 2014 GfK Verein
2
Copyright GfK Verein
All rights reserved. No part of this publication may be reproduced,
or transmitted in any form without the prior (written) permission of
the copyright holders.
Responsible: Ronald Frank
GfK Verein
Gesellschaft für Konsum-, Markt- und Absatzforschung e.V.
Nordwestring 101, 90419 Nürnberg
Tel.: (0911) 395-2231 und 2368 – Fax: (0911) 395-2715
E-mail: [email protected]
Internet: www.gfk-verein.org

© 2014 GfK Verein
3
1. Introduction 4
2. Changes in everyday life 7
3. User behaviour 18
4. Countries and target groups 24
5. Shared basic needs 30
6. Methodology 34
Table of contents
GfK Technology, Media & Entertainment
Birgit Müller
GfK Verein
Ronald Frank
Mobile communication
in Europe 2014
© 2014 GfK Verein
4
1. Introduction
Super-
Connected
Semi-
Connected
Pre-
Connected
Non-
Connected
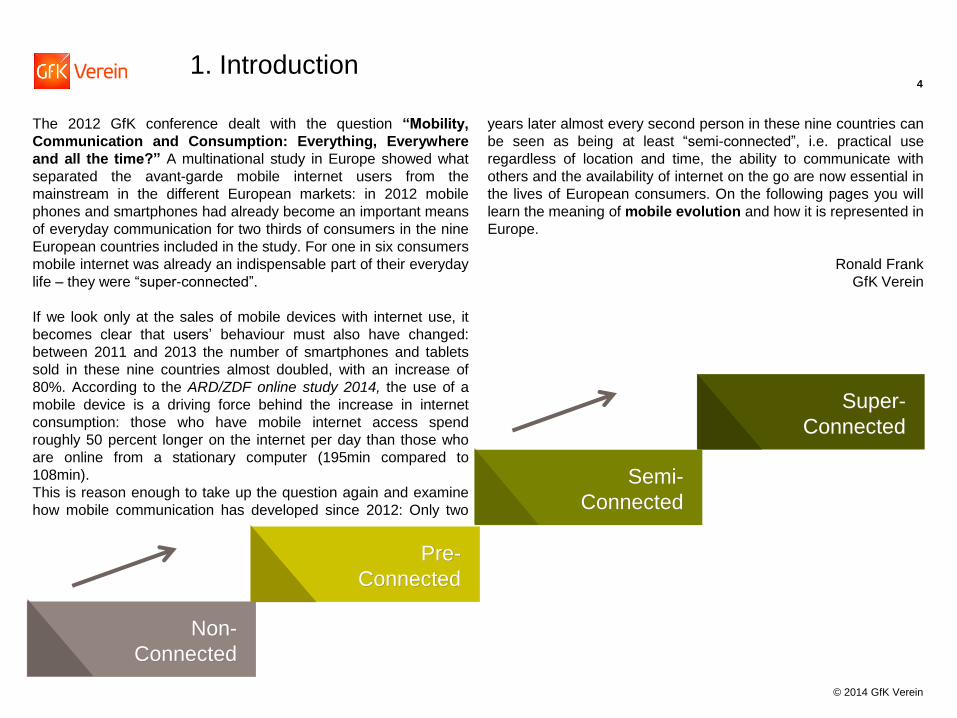
The 2012 GfK conference dealt with the question “Mobility,
Communication and Consumption: Everything, Everywhere
and all the time?” A multinational study in Europe showed what
separated the avant-garde mobile internet users from the
mainstream in the different European markets: in 2012 mobile
phones and smartphones had already become an important means
of everyday communication for two thirds of consumers in the nine
European countries included in the study. For one in six consumers
mobile internet was already an indispensable part of their everyday
life – they were “super-connected”.
If we look only at the sales of mobile devices with internet use, it
becomes clear that users’ behaviour must also have changed:
between 2011 and 2013 the number of smartphones and tablets
sold in these nine countries almost doubled, with an increase of
80%. According to the ARD/ZDF online study 2014, the use of a
mobile device is a driving force behind the increase in internet
consumption: those who have mobile internet access spend
roughly 50 percent longer on the internet per day than those who
are online from a stationary computer (195min compared to
108min).
This is reason enough to take up the question again and examine
how mobile communication has developed since 2012: Only two
years later almost every second person in these nine countries can
be seen as being at least “semi-connected”, i.e. practical use
regardless of location and time, the ability to communicate with
others and the availability of internet on the go are now essential in
the lives of European consumers. On the following pages you will
learn the meaning of mobile evolution and how it is represented in
Europe.
Ronald Frank
GfK Verein

© 2014 GfK Verein
5
Source: GfK Consumer Choices; Sales Units Smartphones, Netbooks, Media Tablets, January to December of the respective
year accumulated in Germany, France, Spain, Austria, Poland, Italy, the Netherlands, UK, Russia
in millions
2007 2008 2009 2010 2011 2012 2013
4.9 11.3 27.8
57.0
94.3
Other mobile devices Smartphones
131.3
168.1
Market development: Sale of devices for
mobile internet use
D
F
E
A
PL
I
NL UK RUS

© 2014 GfK Verein
6
Mobile communication in Europe
Super-
Connected
Semi-
Connected
Pre-
Connected
Non-
Connected
This report carefully examines the topic of internet, in
particular mobile internet. The following topics were
investigated: how mobile internet changes people’s everyday
lives – for example with new communication channels, the
ability to maintain social contacts, self-organisation, but also
basic consumer attitudes.
It is also examining Europeans’ specific user behaviour
concerning internet and mobile phones/smartphones, as well
as making calls using either a landline or a mobile device.
Cluster analysis was used to determine user types based on
attitudes and to update the results of the 2012 study. An
optimised process was used to produce more stable results.
Against this backdrop new clusters were created for 2012, but
the basic outcome remains the same: the analysis revealed
four progressive steps in mobile evolution: different consumer
attitudes and behaviours can be explained with help from the
Non-Connected through to the Super-Connected.
Because the steps of mobile evolution have already been
identified for the second time in 2014, we can not only
recognise the differences between the nine countries and the
status quo of each population, but we can also measure
developments that have taken place over the last two years.
It mainly concerns the differences that signify the evolutionary
steps. There are also similarities and basic needs spanning
all evolutionary steps; these will be described at the end of
this report.
© 2014 GfK Verein
7
2. Changes in everyday life

© 2014 GfK Verein
8
Cloud Computing
Completely/ mostly agree Completely/ mostly agree Completely/ mostly agree
Semi-Connected Super-Connected Pre-Connected
It’s very important for me
to be able to access my
data, pictures or music
from anywhere using
mobile devices
It is very important for me
to be able to program my
devices at home, for
example to record movies,
when I’m travelling using
my mobile phone,
smartphone, laptop or
tablet PC
5
6
2
3
49
54
15
19
81
88
63
66
Answers in %, Top 2 on the following scale: 1=Completely agree, 2=Mostly agree, 3=Agree less, 4=Completely disagree
Base 2014: 93.4 m Pre-Connected (n=2,359), 122.1 m Semi-Connected (n=2,821) 94.3 m Super-Connected (n=2,122)
2012
2014
2012
2014

© 2014 GfK Verein
9
Semi-Connected Super-Connected Pre-Connected
With social networks I
have already reconnected
with lots of people I’d
previously lost touch with*
My life has changed
completely because I can
communicate at any time
and anywhere with
anybody
I find it difficult to keep in
touch with friends and
family if they’re not
available online, e.g. on
social networks or by e-
mail*
Answers in %, Top 2 on the following scale: 1=Completely agree, 2=Mostly agree, 3=Agree less, 4=Completely disagree
*Subgroup internet users
Base 2014: 93.4 m Pre-Connected (n=2,359), 122.1 m Semi-Connected (n=2,821) 94.3 m Super-Connected (n=2,122)
Changes in communication channels
27
22
18
21
5
5
57
53
57
60
21
19
79
76
82
86
60
55
2012
2014
2012
2014
2012
2014
Completely/ mostly agree Completely/ mostly agree Completely/ mostly agree

© 2014 GfK Verein
10
Semi-Connected Super-Connected Pre-Connected
I only give out my mobile
phone number, not the
landline number*
If I have the option to
choose between landline
number and mobile phone
number, I always call the
mobile phone number first
If I have the option, I
always prefer to call
online/use Voice over IP,
e.g. via Skype, compared
to calling via the landline
or mobile phone*
It is a major plus for me
that I can also see the
other person when calling
by videophone***
Answers in %, Top 2 on the following scale: 1=Completely agree, 2=Mostly agree, 3=Agree less, 4=Completely disagree
*Subgroup mobile phone users; **Subgroup internet users; ***Subgroup mobile phone or internet users
Base 2014: 93.4 m Pre-Connected (n=2,359), 122.2 m Semi-Connected (n=2,826), 94.8 m Super-Connected (n=2,133)
Variety and choice of communication channels
41
34
9
11
73
67
24
29
84
82
50
56
Completely/ mostly agree Completely/ mostly agree Completely/ mostly agree
© 2014 GfK Verein
11
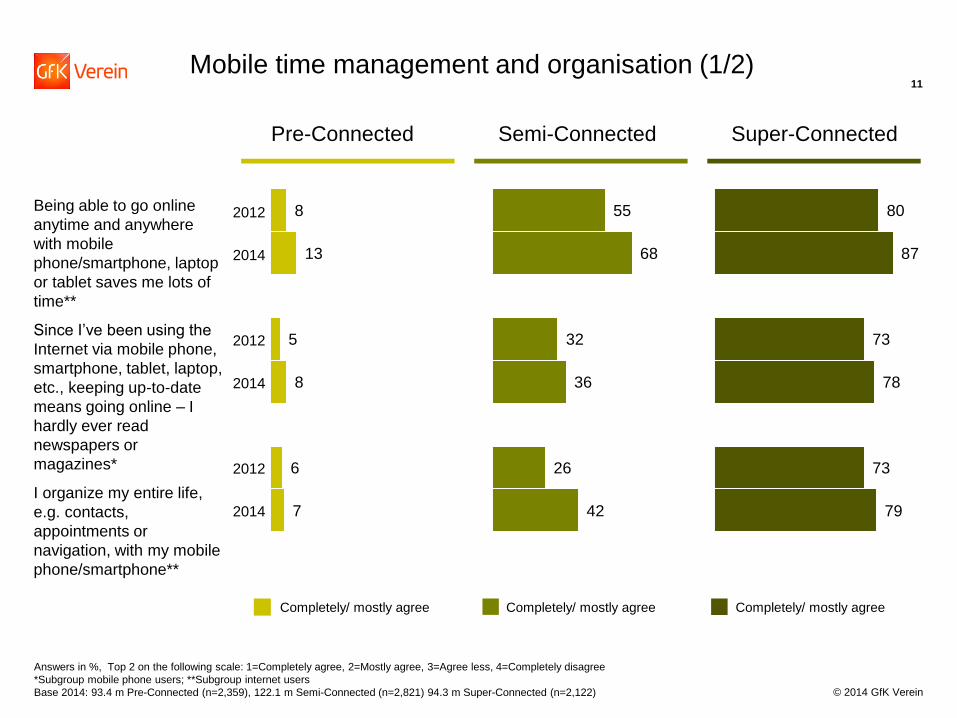
Semi-Connected Super-Connected Pre-Connected
Being able to go online
anytime and anywhere
with mobile
phone/smartphone, laptop
or tablet saves me lots of
time**
Since I’ve been using the
Internet via mobile phone,
smartphone, tablet, laptop,
etc., keeping up-to-date
means going online – I
hardly ever read
newspapers or
magazines*
I organize my entire life,
e.g. contacts,
appointments or
navigation, with my mobile
phone/smartphone**
Answers in %, Top 2 on the following scale: 1=Completely agree, 2=Mostly agree, 3=Agree less, 4=Completely disagree
*Subgroup mobile phone users; **Subgroup internet users
Base 2014: 93.4 m Pre-Connected (n=2,359), 122.1 m Semi-Connected (n=2,821) 94.3 m Super-Connected (n=2,122)
Mobile time management and organisation (1/2)
8
13
5
8
6
7
55
68
32
36
26
42
80
87
73
78
73
79
2012
2014
2012
2014
2012
2014
Completely/ mostly agree Completely/ mostly agree Completely/ mostly agree

© 2014 GfK Verein
12
Semi-Connected Super-Connected Pre-Connected
For me, it would be worse
to lose my mobile
phone/smartphone than
my wallet*
I can’t imagine not being
able to shop online or bid
at auctions via the Internet
from anywhere
Answers in %, Top 2 on the following scale: 1=Completely agree, 2=Mostly agree, 3=Agree less, 4=Completely disagree
* Subgroup mobile phone users
Basis 2014: 93.4 m Pre-Connected (n=2,359), 122.1 m Semi-Connected (n=2,821) 94.3 m Super-Connected (n=2,122)
8
8
6
5
25
33
21
18
58
65
55
56
2012
2014
2012
2014
Completely/ mostly agree Completely/ mostly agree Completely/ mostly agree
Mobile time management and organisation (2/2)

© 2014 GfK Verein
13
Roper Consumer Styles: eight lifestyle groups with individual
value preferences
Materialism, price orientation
Need: to be
Postmaterialism, quality orientation
Pu
ritan
ism
, se
cu
rity o
rien
tatio
n
Hed
on
ism
, p
lea
su
re
Need: to have
Nee
d: liv
e a
pa
ssio
nate
life
Nee
d: p
ea
ce
an
d s
ecu
rity Open-minded –
between self-realization, social responsibility and enjoyment
Organics – search for sustainability and intellectual enrichment
Settled – desire for peace and harmony
Demanding – sense of duty, discipline and enjoyment of life
Adventurers – living passions
Dreamers – dream of great fortune
Rational-realists – hard work and respect for the nature
Homebodies– yearning for material security and status

© 2014 GfK Verein
14
Super-
Connected
Semi-
Connected
Pre-
Connected
Non-
Connected
36%
Settled
17%
Homebodies
15%
Demanding
20%
Homebodies
19%
Open-minded
18%
Demanding
24%
Open-minded
21%
Homebodies
18%
Adventurers
33%
Adventurers
24%
Open-minded
Base 2014: 131.7 m Non-Connected (n=2,966), 93.4 m Pre-Connected (n=2,359), 122.2 m Semi-Connected (n=2,826), 94.8 m Super-Connected (n=2.133)
Roper Consumer Styles: Most important lifestyles per
evolutionary step

© 2014 GfK Verein
15
Answers in %
Base 2014: 131.7 m Non-Connected (n=2,966), 93.4 m Pre-Connected (n=2,359), 122.2 m Semi-Connected (n=2,826), 94.8 m Super-Connected (n=2,133)
Roper Consumer Styles by evolutionary step: an overview
36
11 5 4
17
20 21
13
6
7 11
12
2
6 18 33
8
19
24
24 8 11
6
5
7 8
6 4 15 18
10 6
Semi-Connected Super-Connected Pre-Connected Non-Connected
Settled
Homebodies
Dreamers
Adventurers
Open-minded
Organics
Rational-realists
Demanding

© 2014 GfK Verein
16
53
51
50
50
30
29
33
29
20
16
62
60
50
51
40
41
45
38
31
26
59
63
58
56
52
51
52
55
41
42
Semi-Connected Super-Connected Pre-Connected
Shopping is fun
(not annoying)
When shopping I pay
attention above all to
quality (not to the price)
A car also has to look good
(not only has to work)
Buying what I like
(not only what is
necessary)
I most prefer to buy things
no one else has
Answers in %; *bipolar scale with four characteristics, opposite poles in brackets
Base 2014: 93.4 m Pre-Connected (n=2,359), 122.2 m Semi-Connected (n=2,826), 94.8 m Super-Connected (n=2,133)
Consumer attitudes
Completely/ mostly agree Completely/ mostly agree Completely/ mostly agree
2012
2014
2012
2014
2012
2014
2012
2014
2012
2014

© 2014 GfK Verein
17
Indispensability of mobile
internet use in all areas
of life:
Organising everything
Media use: from print to
online
Social life: expanded
online
Values: “adventurer” or
“cosmopolitan”
Consumption: hedonism
and aesthetics; defining
oneself by the
possession of certain
things
Mobile evolution: attitudes, values and consumption
Super-
Connected
Semi-
Connected
Pre-
Connected
Non-
Connected
Use of a “normal” mobile
Nominal internet use
Values: “down-to-earth”
or “domestic”
Consumption: buys
what is needed; low
consumption of “unique”
products”
Generally little
enthusiasm for mobile
phones, internet and
the opportunities they
provide
But mobile
communication is well
received: 4 in 10 almost
always give out only
their mobile phone
number and a third call
the mobile number
first.
Recognition of added value, practical and useful qualities have priority:
Increasing amounts of time saved thanks to mobile internet
Revival of contacts thanks to social networks
Access to pictures, music in the Cloud
Communication with everyone, everywhere

© 2014 GfK Verein
18
3. User behaviour

© 2014 GfK Verein
19
Answers in %, multiple use possible
Base 2014, internet users: 93.2 m Pre-Connected (n=2,356), 114.1 m Semi-Connected (n=2,647), 84.3 m Super-Connected (n=1,928)
Internet use by location in Europe
94
96
28
28
16
28
At home
At work / training
place / college,
school
Somewhere outside
the home or on the
road
98
98
40
48
34
55
98
99
52
56
52
68
Semi-Connected Super-Connected Pre-Connected
2012
2014
2012
2014
2012
2014

© 2014 GfK Verein
20
Answers in %; *no time comparison possible as only included in 2014
Base 2014, internet users: 93.2 m Pre-Connected (n=2,356), 114.1 m Semi-Connected (n=2,647), 84.3 m Super-Connected (n=1,928)
81
72
50
56
22
38
16
4
14
PC
Laptop
Mobile phone/
Smartphone
TV/ games console*
Netbook/Tablet
81
71
59
67
46
70
24
9
21
82
70
66
71
67
85
33
16
32
Semi-Connected Super-Connected Pre-Connected
2012
2014
2012
2014
2012
2014
2012
2014
2012
2014
Internet use by device in Europe

© 2014 GfK Verein
21
Answers in %, multiple use possible
Base 2014: 131.7 m Non-Connected (n=2,966), 93.4 m Pre-Connected (n=2,359), 122.2 m Semi-Connected (n=2,826), 94.8 m Super-Connected (n=2,133)
Ownership of mobiles and smartphones in Europe
Semi-Connected Super-Connected Pre-Connected Non-Connected
2
5
72
75
2012
2014
2012
2014
11
28
86
70
31
61
69
41
44
72
57
29
“Yes, a
smartphone"
“Yes, a normal
mobile phone "

© 2014 GfK Verein
22
Answers in %
Base 2014: 131.7 m Non-Connected (n=2,966), 93.4 m Pre-Connected (n=2,359), 122.2 m Semi-Connected (n=2,826), 94.8 m Super-Connected (n=2,133)
Call behaviour in Europe
(almost)
exclusively via my
mobile phone
mainly via my
mobile phone
roughly equal split
between mobile
phone and landline
mainly via the
landline
(almost)
exclusively via the
landline
Don’t know
46
24
48 58
6
12
19
18
8
13
13
11
14 31
14 8
25 19
4 2 2 1 2 3
Semi-Connected Super-Connected Pre-Connected Non-Connected
thereof
45% Russians
14% Poles
13% Italians
12% Spaniards

© 2014 GfK Verein
23
Mobile evolution: devices, features and use
Super-
Connected
Semi-
Connected
Pre-
Connected
Non-
Connected
Use of a “normal” mobile
Nominal internet use
High percentage make
calls almost exclusively
using their mobile,
primarily in Russia and
Poland (reason: better
mobile avai-
lability/network)
General: Use of mobile
phone and internet
Mobile phone: Mostly
“normal” mobile
phones, but
smartphones are on the
increase
Internet is used mainly
on stationary PCs and
laptops, but also
increasingly on mobile
phones/smartphones
Use mainly landlines
for
making calls
Mobile phone: Now use mainly smartphones
Internet still used mainly stationary on a laptop
But: Internet now available on various devices; enormous increase in mobile phone/smartphone use and therefore internet on the go
Use mainly mobile phones for making calls
Smartphone percentage
clearly dominates
Three-quarters make
calls mainly using a
mobile phone
At least average internet
use on all devices,
including PC; internet
use on mobile
phone/smartphone has
taken over use on all
other devices.
Highest percentage of
internet users with tablet
PC and television/games
console (each a third)

© 2014 GfK Verein
24
4. Countries and target groups

© 2014 GfK Verein
25
Base 2014: 70.7 m Germans (n=2,076), 52.6 m French (n=1,007), 40.1 m Spaniards (n=1,034), 7.2 m Austrians (n=564), 32.7 m Poles (n=1,015),
51.9 m Italians (n=1,023), 13.9 m Nehterlands (n=501), 53.3 m Britons (n=1,041), 119.5 m Russians (n=2,023)
Non-Connected
Pre-Connected
Semi-Connected
151 m
Super-Connected
109 m
109 m
132 m
73 m
122 m
93 m
95 m 17 21
25 28
25 21
34 30
2012 2014
in %
Steps in mobile evolution:
Distribution in Europe

© 2014 GfK Verein
26
13 19
31 33
42 40
14 9 Netherlands
2012 2014
15 21
24 27
34 25
27 28
Austria
2012 2014
27 28
22 28 9 6
42 38
Russia
2012 2014
10 18 23
24
36 34
31 25
Germany
2012 2014
17 22
23 27
36 29
24 22
UK
2012 2014
14 20
25 30
24 17
37 33
Italy
2012 2014 14 21
26 29
22 17
38 33
Spain
2012 2014
11 21 26
26 23
17
40 36
Poland
2012 2014
12 14
29 29
32 34
27 23
France
2012 2014
in %
Pre-Connected
Semi-Connected
Super-Connected
Non-Connected
Base 2014: 70.7 m Germans (n=2,076), 52.6 m French (n=1,007), 40.1 m Spaniards (n=1,034), 7.2 m Austrians (n=564), 32.7 m Poles (n=1,015),
51.9 m Italians (n=1,023), 13.9 m Nehterlands (n=501), 53.3 m Britons (n=1,041), 119.5 m Russians (n=2,023)
Steps in mobile evolution:
Distribution by country

© 2014 GfK Verein
27
13 19
Netherlands
2012 2014
15 21
Austria
2012 2014
27 28
Russia
2012 2014
10 18
Germany
2012 2014
17 22
UK
2012 2014
14 20
Italy
2012 2014 14 21
Spain
2012 2014
11 21
Poland
2012 2014
12 14
France
2012 2014
in %
Super-Connected incl.
usage (= smartphone use
or internet use with laptop,
mobile phone or tablet/
netbook somewhere
outside the home
Super-Connected
excl. usage
79
21
94
6
42
58
59
41
59
41
31
69 91
9
81
19
94
6
81
19
91
9
74
26
81
19
50
50
90
10
64
36
93
7
82
18
Base 2014: 70.7 m Germans (n=2,076), 52.6 m French (n=1,007), 40.1 m Spaniards (n=1,034), 7.2 m Austrians (n=564), 32.7 m Poles (n=1,015),
51.9 m Italians (n=1,023), 13.9 m Nehterlands (n=501), 53.3 m Britons (n=1,041), 119.5 m Russians (n=2,023)
Steps in mobile evolution:
Deep Dive Super-Connectedy country

© 2014 GfK Verein
28
Answers in %
Base 2014: 131.7 m Non-Connected (n=2,966), 93.4 m Pre-Connected (n=2,359), 122.2 m Semi-Connected (n=2,826), 94.8 m Super-Connected (n=2,133)
32
45
18 23
8 9 3 2
42
39
29
36
14 18
4 5
17
10
31
24
30 29
10 16
8 5
22 17
49 44
83 77
Pre-Connected
Semi-Connected
Super-Connected
Non-Connected
2012 2014 2012 2014 2012 2014 2012 2014
14 to 29
years
30 to 49
years
70 years
and older
50 to 69
years
Steps in mobile evolution:
Distribution by age group over time

© 2014 GfK Verein
29
Mobile evolution: Countries and target groups
Super-
Connected
Semi-
Connected
Pre-
Connected
Non-
Connected
It comes as no surprise to discover that mobile evolution has
advanced in all of the studied countries over the last two
years. In total, the number of Pre-Connected and Non-
Connected has decreased in favour of the Semi-connected
and Super-Connected. The overview of individual countries
will include both the highest and second highest evolutionary
step.
At 20% and 21%, there is roughly the same percentage of
Super–Connected in Austria, Spain, Poland and Italy. Great
Britain lies just ahead with 22%, the Netherlands and
Germany just behind with 19% and 18% respectively. At 33%,
the Netherlands boast a very high number of Semi-
Connected – and with 9% they have the lowest number of
Non-Connected by far. In comparison, there are a great many
Non-Connected (33% and 36%) in Italy, Spain and Poland. In
comparison to other European countries, Germany has
neither a particularly high number of Super-Connected nor
Non-Connected.
Russia is a special case – and to a lesser a extent so is
Poland: With 28%, Russia has the highest percentage of
Super-Connected – and with 38% the most Non-Connected.
But only around 60% of Super-Connected in Russia use a
smartphone or use the internet on a mobile device away from
home, the rest have been allocated to this group because of
their attitudes – and would probably get started as soon as
they had the technical possibilities.
Almost half of 14-29 year-olds are “super connected”.
Although it has increased since 2012, the percentage is lower
in higher age groups – only the over-70s continue to be very
reticent.

© 2014 GfK Verein
30
5. Shared basic needs

© 2014 GfK Verein
31
Semi-Connected Super-Connected Pre-Connected
I am always careful to
disclose as little
information about myself
as possible on the
Internet*
I worry a lot about data
security if my data aren’t
stored on my own devices
but on the Internet
Answers in %, Top 2 on the following scale: 1=Completely agree, 2=Mostly agree, 3=Agree less, 4=Completely disagree
*Subgroup internet users
Base 2014: 93.4 m Pre-Connected (n=2,359), 122.1 m Semi-Connected (n=2,821) 94.3 m Super-Connected (n=2,122)
82
82
52
56
79
79
56
59
77
80
61
71
Completely/ mostly agree Completely/ mostly agree Completely/ mostly agree
2012
2014
2012
2014
Similarities: Security

© 2014 GfK Verein
32
60
45
42
93
50
47
87
44
44
Similarities: Availability & time management
Semi-Connected Super-Connected Pre-Connected
Answers in %, Top 2 on the following scale: 1=Completely agree, 2=Mostly agree, 3=Agree less, 4=Completely disagree
Base 2014 mobile phone users: 90.4 m Pre-Connected (n=2,282), 121.2 m Semi-Connected (n=2,799) 93.7 m Super-Connected (n=2,109)
The best way to reach me
is via my mobile phone
I deliberately switch off my
mobile phone now and
then so that nobody can
reach me
Completely/ mostly agree Completely/ mostly agree Completely/ mostly agree
2014
2012
2014

© 2014 GfK Verein
33
Mobile evolution: Shared basic needs
Super-
Connected
Semi-
Connected
Pre-
Connected
Non-
Connected
While the differences between the user types dominate, they
also have similarities that are best regarded as shared basic
needs.
This also includes the need for security: in each evolutionary
step there is widespread awareness of giving out as little
personal data as possible on the internet – even if it is surely
understood differently by the different types. Accordingly,
almost the same level of skepticism about data security
prevails across the different user groups, especially if the data
is saved online or in a Cloud, respectively.
The wish to manage one’s own time represents another key
need: for this reason roughly four in ten Europeans
consciously turn off their mobile phones so they cannot be
reached by anyone.
When these basic needs are accepted and taken into
consideration, not only socially but also by telecommunication
service providers and manufacturers, nothing will stand in the
way of mobile availability.
It will come as no surprise that the Super-Connected can be
reached far more easily on a mobile than on a landline. And
this is true even for 60% of the Pre-Connected. The
developments in this dynamic market continue to be exciting.

© 2014 GfK Verein
34
6. Methodology

© 2014 GfK Verein
35
Sample & Methodoloy
Country 2012 2014
Sample size Population in
million Sample size
Population in
million
Germany 2,099 71.7 2,076 70.7
France 1,005 52.5 1,007 52.6
Spain 1,011 40.5 1,034 40.1
Austria 525 7.2 564 7.2
Poland 1,016 32.4 1,015 32.7
Italy 1,029 52.7 1,023 51.9
Netherlands 514 13.8 501 13.9
Great Britain 1,056 52.2 1,041 53.3
Russia 2,017 119.6 2,023 119.5
Total 10,272 442.6 10,284 442.0
Fieldwork: Winter 2011/2012 and Winter 2013/2014
Methodology: Face-to-Face-Interviews via CAPI and PAPI (Russia)


![Mobile - Everywhere Your Customers Are [Part II]](https://img.pdfslide.us/doc/110x75/5555acd4d8b42a52568b49b6/mobile-everywhere-your-customers-are-part-ii.jpg)