Embed Size (px)
Citation preview

Development and Testing of Method for Assessing and Mapping Agricultural Areas Susceptible to Atrazine Leaching in the State of Washington
By Frank D. Voss
U.S. GEOLOGICAL SURVEY
Water-Resources Investigations Report 03-4173
Prepared in cooperation with the WASHINGTON STATE DEPARTMENT OF AGRICULTURE and WASHINGTON STATE DEPARTMENT OF ECOLOGY
Tacoma, Washington2003
U.S. DEPARTMENT OF THE INTERIORGALE A. NORTON, Secretary
U.S. GEOLOGICAL SURVEYCharles G. Groat, Director
Any use of trade, product, or firm names in this publication is for descriptive purposes only and does not imply endorsement by the U.S. Government.
For additional information write to:
Director, Washington Water Science CenterU.S. Geological Survey1201 Pacific Avenue – Suite 600Tacoma, Washington 98402http://wa.water.usgs.gov
Suggested citation:
Voss, F.D., 2003, Development and testing of method fsusceptible to atrazine leaching in the State of WashResources Investigations Report 03-4173, 13 p.
Copies of this report can be purchased from:
U.S. Geological SurveyInformation ServicesBuilding 810Box 25286, Federal CenterDenver, CO 80225-0286
or assessing and mapping agricultural areas ington: U.S. Geological Survey Water-

Contents iii
CONTENTS
Abstract ................................................................................................................................................................ 1Introduction .......................................................................................................................................................... 1
Purpose and Scope ...................................................................................................................................... 2Description of Study Area........................................................................................................................... 2Acknowledgments....................................................................................................................................... 2
Methods of Study ................................................................................................................................................. 4Model Selection and Description ................................................................................................................ 4Construction of Simulated Atrazine Leaching Map.................................................................................... 4Comparisons of Simulated Degree of Atrazine Leaching with Ground-Water Sampling Results ............. 7
Results .................................................................................................................................................................. 9Discussion ............................................................................................................................................................ 10Summary .............................................................................................................................................................. 12References Cited .................................................................................................................................................. 13

iv Figures
FIGURES
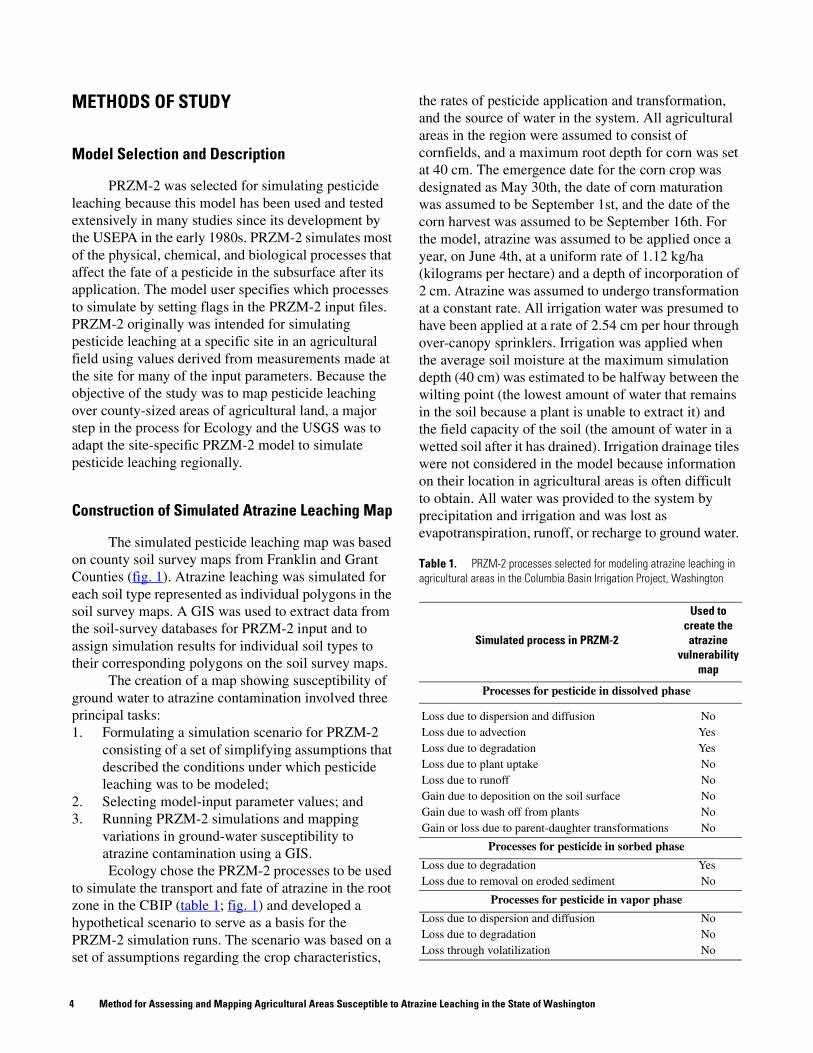
Figure 1. Map showing location of the Columbia Basin Irrigation Project in Washington.............................. 3

Tables v
TABLES
Table 1. PRZM-2 processes selected for modeling atrazine leaching in agricultural areas in the Columbia Basin Irrigation Project, Washington................................................................................ 4
Table 2. Soil input parameters derived from the Soil Survey Geographic database (SSURGO) for the PRZM-2 model of the Columbia Basin Irrigation Project, Washington ........................................... 5
Table 3. Input parameters derived from the PRZM-2 user's manual for the PRZM-2 model of the Columbia Basin Irrigation Project, Washington................................................................................ 5
Table 4. Input parameters derived from published studies, local experts, or the Pesticide Assessment Tool for Rating Investigations of Transport (PATRIOT) for the PRZM-2 model of the Columbia Basin Irrigation Project, Washington................................................................................ 6
Table 5. Meteorological input parameters from a weather station in Yakima, Washington, for the PRZM-2 model of the Columbia Basin Irrigation Project, Washington ........................................... 6
Table 6. Results of statistical testing of reliability of the map of susceptibility to atrazine leaching of areas in the Columbia Basin Irrigation Project, Washington ........................................................ 9
Table 7. Atrazine application rates reported in published studies ................................................................... 11
vi Conversion Factors and Datums
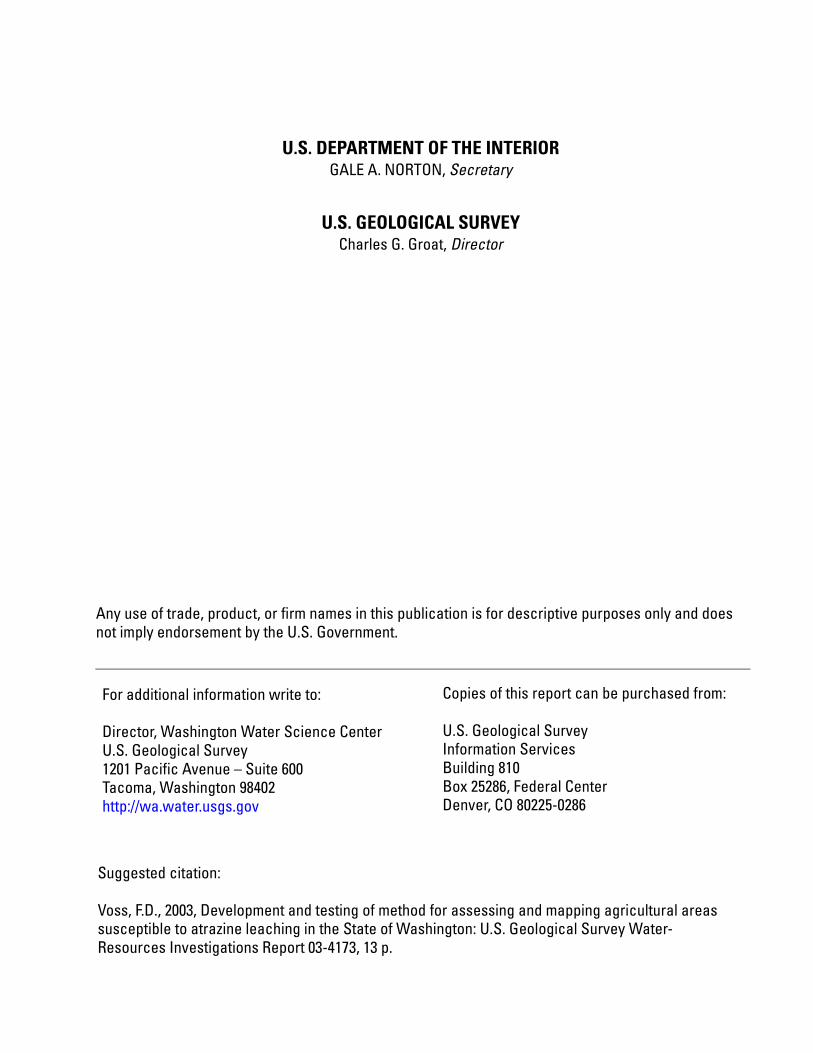
CONVERSION FACTORS AND DATUMS
CONVERSION FACTORS
Temperature in degrees Celsius (°C) may be converted to degrees Fahrenheit (°F) as follows:
°F=1.8 °C+32.
DATUMS
Vertical coordinate information is referenced to the National Geodetic Vertical Datum of 1929 (NGVD29); horizontal
coordinate information is referenced to the National American Datum of 1927 (NAD27).
Multiply By To obtain
Lengthcentimeter (cm) 0.3937 inch
meter (m) 3.281 foot kilometer (km) 0.6214 mile
Areahectare (ha) 2.471 acre
square kilometer (km2) 247.1 acre
Volumecubic centimeter (cm3) 0.06102 cubic inch
cubic meter (m3) 35.31 cubic foot cubic meter (m3) 1.308 cubic yard
Application Ratekilogram per hectare (kg/ha) 2.205 pound per acre
Development and Testing of Method for Assessing and Mapping Agricultural Areas Susceptible to Atrazine Leaching in the State of Washington
By Frank D. Voss
ABSTRACT
In a joint effort by the Washington State Department of Agriculture, the Washington State Department of Ecology, and the U.S. Geological Survey, the Environmental Protection Agency's Pesticide Root Zone Model and a Geographic Information System were used to develop and test a method for assessing and mapping the susceptibility of ground water in agricultural areas to pesticide contamination. The objective was to produce a map that would be used by the Washington State Department of Agriculture to allocate resources for monitoring pesticide concentrations in ground water. The method was tested by producing a map showing susceptibility to leaching of the pesticide atrazine for the Columbia Basin Irrigation Project, which encompasses an area of intensive agriculture in eastern Washington. The reliability of the atrazine map was assessed by using statistical procedures to determine whether the median of the percentage of atrazine simulated to leach below the root zone in wells where atrazine was detected was statistically greater than the median percentage at wells where atrazine was not detected (at or above 0.001 microgram per liter) in 134 wells sampled by the U.S. Geological Survey. A statistical difference in medians was not found when all 134 wells were compared. However, a statistical difference was found in medians for two subsets of
the 134 wells that were used in land-use studies (studies examining the quality of ground water beneath specific crops). The statistical results from wells from the land-use studies indicate that the model potentially can be used to map the relative susceptibility of agricultural areas to atrazine leaching. However, the distinction between areas of high and low susceptibility may not yet be sufficient to use the method for allocating resources to monitor water quality. Several options are offered for improving the reliability of future simulations.
INTRODUCTION
The U.S. Environmental Protection Agency (USEPA) has mandated that all States and Tribes develop a pesticide management plan (PMP) for the herbicides alachlor, atrazine, metolachlor, and simazine because these herbicides have been detected in ground water at concentrations exceeding health-based standards in agricultural areas in the United States (Barbash and others, 1999). All PMPs, including those for Washington, must ensure that none of the four herbicides will be detected in ground water at concentrations exceeding health-based criteria in agricultural areas; otherwise, the USEPA will restrict their sale and use (U.S. Environmental Protection Agency, 1996). The Washington State Department of Agriculture (WSDA) was designated as the agency responsible for developing the PMP for Washington.
Introduction 1
As a part of Washington's PMP, the WSDA decided to incorporate a method for mapping the susceptibility of ground water to pesticide leaching in agricultural areas. This capability would allow the WSDA to efficiently allocate management resources to locations where pesticide leaching was most likely to occur. The WSDA joined in a cooperative study with the Washington Department of Ecology (Ecology) and the U.S. Geological Survey (USGS) to develop, test, and evaluate a method that could be used to create maps characterizing the susceptibility of ground water to pesticide contamination in agricultural areas. The approach was to use a deterministic numerical model to simulate atrazine leaching and a Geographic Information System (GIS) to map susceptible areas, and then test the method in the Columbia Basin Irrigation Project (CBIP; fig. 1), an agricultural area in eastern Washington. Atrazine leaching was simulated for the years 1974-83, and the reliability of the resulting atrazine map was tested by comparing it with atrazine-concentration data from 134 wells in the CBIP, collected between 1993 and 1995 for another study. The study included options for improving the reliability of future simulations.
Purpose and Scope
The purpose of this report is to present the development and testing of a method for mapping areas susceptible to pesticide contamination in ground water and to provide options for improving this method for future studies. The report (1) describes the construction of the numerical model, simulation of atrazine leaching, and creation of an atrazine-susceptibility map for the CBIP; (2) compares the atrazine-susceptibility map with atrazine-concentration data collected in the study area; and (3) presents options for improving the method.
The method was developed using a geographic information system (GIS) and version 2.0 of the Pesticide Root Zone Model (PRZM-2) developed by the USEPA (Carsel and others, 1984). PRZM-2 is a site-specific model that simulates most of the physical, chemical, and biological processes that affect the fate of a pesticide in the subsurface following its application. For this study, PRZM-2 had to be adapted to simulate over a regional scale.
Description of Study Area
The Columbia Basin Irrigation Project (CBIP) includes about 6,500 km2 (square kilometers) of Grant, Adams, and Franklin Counties in eastern Washington, one of the most productive agricultural areas in the country (fig. 1). The climate in the area is arid, with less than 23 cm (centimeters) of rainfall a year, an amount that is insufficient to support perennial streams (Williamson and others, 1998). Because of the dry summers, most of the agricultural land is irrigated. To help irrigate these agricultural lands, the CBIP was created in the early 1930s (Williamson and others, 1998). The project currently diverts more than 3 billion m3 (cubic meters) of water per year from the Columbia River for irrigation. This extensive irrigation has greatly increased the rate of recharge (the movement of water downward from the land surface to ground water). The average rate of recharge in the CBIP is 30 cm per year, substantially higher than the 5 cm per year observed in adjacent, nonirrigated areas. Over the years, increased recharge from irrigation water has substantially raised the water table, creating or increasing base flow to many of the streams and wasteways. The result is an overall increase in annual streamflow controlled mostly by irrigation, with base flow dominating in the winter and high flows occurring mostly in the summer (Williamson and others, 1998). The combination of intensive agriculture, high rates of recharge, and a rising water table make the CBIP area potentially susceptible to ground-water contamination from pesticides and other agricultural chemicals.
Acknowledgments
Laurie Morgan, Washington State Department of Ecology, is acknowledged for her innovative work in unsaturated-zone modeling and for her generosity with time and information. Cindy Moore and Rod Baker, Washington State Department of Agriculture, are acknowledged for their cooperation and guidance on this project. Jack Barbash and Randall Bayless, U.S. Geological Survey, are acknowledged for their technical support.
2 Method for Assessing and Mapping Agricultural Areas Susceptible to Atrazine Leaching in the State of Washington

Othello
Quincy
Ephrata
Pasco
MosesLake
I 90I 90
SS22
EXPLANATION
CANALS AND STREAMS
ROADS
COUNTY BOUNDARY
COLUMBIA BASIN IRRIGATION
PROJECT BOUNDARY
0
0
10
10 20 MILES
20 KILOMETERS
WASHINGTON Columbia BasinIrrigation Project area
Base from U.S. Geological Survey digital data, 1:100 000, 2003 Universal Transverse Mercator projection, Zone 11
COLUM BIA
RIVER
GRANTCOUNTY ADAMS
COUNTY
FRANKLINCOUNTY
120˚
47˚
119˚
46˚30'
Introduction 3
Figure 1. Location of the Columbia Basin Irrigation Project in Washington.
METHODS OF STUDY
Model Selection and Description
PRZM-2 was selected for simulating pesticide leaching because this model has been used and tested extensively in many studies since its development by the USEPA in the early 1980s. PRZM-2 simulates most of the physical, chemical, and biological processes that affect the fate of a pesticide in the subsurface after its application. The model user specifies which processes to simulate by setting flags in the PRZM-2 input files. PRZM-2 originally was intended for simulating pesticide leaching at a specific site in an agricultural field using values derived from measurements made at the site for many of the input parameters. Because the objective of the study was to map pesticide leaching over county-sized areas of agricultural land, a major step in the process for Ecology and the USGS was to adapt the site-specific PRZM-2 model to simulate pesticide leaching regionally.
Construction of Simulated Atrazine Leaching Map
The simulated pesticide leaching map was based on county soil survey maps from Franklin and Grant Counties (fig. 1). Atrazine leaching was simulated for each soil type represented as individual polygons in the soil survey maps. A GIS was used to extract data from the soil-survey databases for PRZM-2 input and to assign simulation results for individual soil types to their corresponding polygons on the soil survey maps.
The creation of a map showing susceptibility of ground water to atrazine contamination involved three principal tasks:1. Formulating a simulation scenario for PRZM-2
consisting of a set of simplifying assumptions that described the conditions under which pesticide leaching was to be modeled;
2. Selecting model-input parameter values; and3. Running PRZM-2 simulations and mapping
variations in ground-water susceptibility to atrazine contamination using a GIS.Ecology chose the PRZM-2 processes to be used
to simulate the transport and fate of atrazine in the root zone in the CBIP (table 1; fig. 1) and developed a hypothetical scenario to serve as a basis for the PRZM-2 simulation runs. The scenario was based on a set of assumptions regarding the crop characteristics,
the rates of pesticide application and transformation, and the source of water in the system. All agricultural areas in the region were assumed to consist of cornfields, and a maximum root depth for corn was set at 40 cm. The emergence date for the corn crop was designated as May 30th, the date of corn maturation was assumed to be September 1st, and the date of the corn harvest was assumed to be September 16th. For the model, atrazine was assumed to be applied once a year, on June 4th, at a uniform rate of 1.12 kg/ha (kilograms per hectare) and a depth of incorporation of 2 cm. Atrazine was assumed to undergo transformation at a constant rate. All irrigation water was presumed to have been applied at a rate of 2.54 cm per hour through over-canopy sprinklers. Irrigation was applied when the average soil moisture at the maximum simulation depth (40 cm) was estimated to be halfway between the wilting point (the lowest amount of water that remains in the soil because a plant is unable to extract it) and the field capacity of the soil (the amount of water in a wetted soil after it has drained). Irrigation drainage tiles were not considered in the model because information on their location in agricultural areas is often difficult to obtain. All water was provided to the system by precipitation and irrigation and was lost as evapotranspiration, runoff, or recharge to ground water.
Table 1. PRZM-2 processes selected for modeling atrazine leaching in agricultural areas in the Columbia Basin Irrigation Project, Washington
Simulated process in PRZM-2
Used to create the atrazine
vulnerability map
Processes for pesticide in dissolved phase
Loss due to dispersion and diffusion NoLoss due to advection YesLoss due to degradation YesLoss due to plant uptake NoLoss due to runoff NoGain due to deposition on the soil surface NoGain due to wash off from plants NoGain or loss due to parent-daughter transformations No
Processes for pesticide in sorbed phase
Loss due to degradation YesLoss due to removal on eroded sediment No
Processes for pesticide in vapor phase
Loss due to dispersion and diffusion NoLoss due to degradation NoLoss through volatilization No
4 Method for Assessing and Mapping Agricultural Areas Susceptible to Atrazine Leaching in the State of Washington
Approximately 256 variables (the exact number depended on the type of soil being modeled) were set in the PRZM-2 input file for each simulation. Values for the parameters used to characterize the soil were changed for each polygon in the CBIP for which simulations were run; all other values for parameters in the input file were the same for all polygons simulated (for example, the crop root depth was the same for all polygons in the CBIP).
Values for the soil parameters used in the PRZM-2 simulations were obtained from the Soil Survey Geographic database (SSURGO) developed by the Natural Resources Conservation Service (table 2). The SSURGO database was designed primarily to aid land owners and local agencies in natural-resources planning and management (U.S. Department of Agriculture, 1995). Soil maps in SSURGO range in scale from 1:12,000 to 1:63,360 and are similar in appearance to maps found in county soil surveys. The SSURGO database is composed of a set of attribute tables that are linked by a key called a map unit identifier.
The values of parameters that were the same for all polygons were obtained from the user's manual that is included with the PRZM-2 software system (table 3) and from published information from previous studies, local experts such as county agents, and default values set by the Pesticide Assessment Tool for Rating Investigations of Transport (PATRIOT) (Imhoff and others, 1994), a program that can be used to generate PRZM-2 input files (table 4).
Three files are needed to run a PRZM-2 simulation: (1) a file with daily weather data, (2) a non-weather parameter file containing values for parameters used for calculations and model processing, and (3) a file for an uncertainty preprocessor that is part of the PRZM-2 software package. The USGS used the Visual Basic programming language to create programs to automate the generation of the three types of files for all polygons to be modeled.
Table 2. Soil input parameters derived from the Soil Survey Geographic database (SSURGO) for the PRZM-2 model of the Columbia Basin Irrigation Project, Washington
PRZM-2 parameter Parameter description
CN numbers Runoff curve numbersDepth of soil core Depth of soil coreNumber of soil horizons Number of horizons in soil coreThickness of soil horizon Thickness of soil horizonBulk density of soil
horizonSoil bulk density
Initial soil-water content in soil
Initial soil-water content at beginning of simulation period
Field capacity in soil horizon
Moisture content of a soil after it has been saturated and allowed to drain for 2 days
Wilting point in soil horizon
Moisture content of a soil where a plant can no longer extract moisture from soil
Organic carbon in soil horizon
Percentage of organic carbon in soil
Table 3. Input parameters derived from the PRZM-2 user's manual for the PRZM-2 model of the Columbia Basin Irrigation Project, Washington
PRZM-2 parameter Parameter description
Pan factor Dimensionless number used to convert daily pan evaporation to daily potential evaporation
Snowmelt factor Used to calculate snow melt rates in relation to air temperature
Minimum depth of which evaporation is extracted
Depth of soil evaporation loss during a fallow period
Maximum interception storage of the crop
Used to estimate the amount of rainfall that is intercepted by a fully developed crop canopy and retained on the plant surface
Maximum rooting depth of crop
Maximum active root depth of crop
Maximum areal coverage of crop
Area of ground a crop canopy will cover
Surface condition after crop harvest
Condition of field after harvests
Maximum canopy height at maturation date
Maximum height the plant will grow
Methods of Study 5

PRZM-2 requires daily values for several meteorological parameters during the period being simulated (table 5). These values are in a separate file that is read into PRZM-2 as it runs through a simulation period. The values for this study came from the National Oceanic and Atmospheric Administration (NOAA) weather station that was located closest to the CBIP area, in Yakima, Wash., approximately 80 km (kilometers) southwest. The file has one record for each day from January 1, 1974, to December 31, 1983. The precipitation value is the total accumulation for the day. Daily average values are used for pan evaporation, temperature, wind speed, and solar radiation.
Additional monthly precipitation averages from 20 weather stations within the CBIP were used to adjust the precipitation data from Yakima to reflect local conditions in the CBIP (Morgan, 2002). To make these adjustments, the CBIP was divided into 20 distinct weather zones by using the Thiessen method (Linsley and others, 1975) to create boundaries around each of the 20 weather stations in the area. The USGS developed a computer program to sum the precipitation for each month of the 10 years of daily precipitation data in the Yakima weather file (January 1, 1974-December 31, 1983). The monthly Yakima values were then compared with the monthly values at each of the 20 weather stations and the ratio of the average monthly precipitation for each weather station to that for the Yakima weather station was calculated for each month. Each daily precipitation value in the Yakima file was then multiplied by this ratio to create an adjusted weather file to be used for daily simulations in each weather zone.
For each soil type in each weather zone, a non-weather parameter file was created using a custom program written by the USGS in the Visual Basic programming language. The program read soils data from a database (developed by Ecology from processed SSURGO data) and inserted the values for soils into the PRZM-2 input files.
PRZM-2 was originally designed to simulate leaching at a site where the values for the input parameters (such as the percentage of organic matter in the soil and the pesticide transformation rate) were measured. Parameter values obtained from regional-scale data typically are averaged over large areas, and the averages may contain significant uncertainties that can introduce considerable variation in simulation results. Therefore, it is useful for the model user to quantify the effect of uncertainty in input values on the variability of simulation results. Uncertainty was modeled for field capacity of a soil and for the organic carbon content in the soil. Input fields for the uncertainty processor were created for each soil type in a given weather zone. A Monte Carlo routine was used in the uncertainty processor to randomly select numbers between user-specified minimum and maximum values for each of the parameters. The Monte Carlo routine in PRZM-2 runs for a user-selected number of times to generate a distribution of simulation output values.
Table 4. Input parameters derived from published studies, local experts, or the Pesticide Assessment Tool for Rating Investigations of Transport (PATRIOT) for the PRZM-2 model of the Columbia Basin Irrigation Project, Washington
PRZM-2 parameter Parameter description
Date of crop emergence Date crop emerges from soilDate of crop maturation Date crop maturesDate of crop harvest Date crop is harvestedDepth of pesticide
incorporation into soilDepth pesticide is plowed into soil
Pesticide application rate Rate pesticide is appliedLeaching factor Used to specify amount of
irrigation water used to leach salts from soil
Irrigation factor Specifies type of irrigation usedPesticide solubility Pesticide water solubilityDissolved-phase pesticide
decay rateRate pesticide disappears in
solution phaseAdsorbed-phase pesticide
decay rateRate pesticide disappears in
adsorbed phase
Table 5. Meteorological input parameters from a weather station in Yakima, Washington, for the PRZM-2 model of the Columbia Basin Irrigation Project, Washington
PRZM-2 parameter Parameter description
Precipitation Daily amount of rain or snowPan evaporation Rate of water evaporating from a
panAir temperature Average daily air temperatureWind speed Average daily wind speedSolar radiation Average daily amount of solar
radiation
6 Method for Assessing and Mapping Agricultural Areas Susceptible to Atrazine Leaching in the State of Washington

Ecology conducted this procedure, plotted the results on a graph, and then selected the pesticide-leaching value from the graph (in kilograms per hectare) that was exceeded by 90 percent of the simulations (Morgan, 2002). Ecology used this value to create the map showing the likelihood of atrazine contamination of ground water by writing the output values from the simulations to a table and relating them to a map of modeled polygons in a GIS. The output values then were color-coded into five levels using a Jenk's natural-break classification routine (Karnes, 1998) in the ArcView GIS software program.
Comparisons of Simulated Degree of Atrazine Leaching with Ground-Water Sampling Results
The USGS compared results from PRZM-2 simulations with data from ground-water sampling at 134 wells sampled for atrazine to determine whether simulated leaching occurred at higher levels in wells where atrazine has been detected than in wells where atrazine has not been detected. The 134 wells used in the statistical comparison were sampled between 1993 and 1995 as part of ground-water studies conducted by the USGS Central Columbia Plateau (CCPT) study unit (which included the CBIP) for the National Water Quality Assessment (NAWQA) Program. Three studies were used: a study unit survey, a land-use study for orchards, and a land-use study for row crops.
The study-unit survey was a large-scale assessment of ground-water quality throughout the entire CCPT NAWQA study area. Of the 121 public wells across the study-unit, 43 were sampled once in 1994 for major ions, nutrients, 85 pesticides, 60 volatile organic compounds, dissolved organic carbon, and radon, and 78 wells were sampled once in 1994 for 47 pesticides only (Jones and Roberts, 1998). In the study unit survey, 51 of the 121 wells were located in the CBIP and were used for comparison with the PRZM simulations.
The land-use studies for row crops and orchards were conducted exclusively in the CBIP and were designed to investigate relations between land use and shallow ground-water quality within specific, consistently defined land-use settings. The studies were
conducted in areas where agricultural chemicals were applied to crops, rather than in locations where these chemicals may have been spilled. The focus of the studies was on shallow ground water because it provides the earliest indication of contamination or other water-quality changes. It also minimizes the influence of factors other than land use on water quality prior to sampling (Jones and Roberts, 1998).
The land-use study for row crops investigated pesticide occurrence in ground water beneath areas where row crops (such as potatoes and corn) were predominant (the term "predominant crop" means the crop covered more area with in a 500-meter (m) radius of the sampled well than any other crop within that radius). Two types of wells were sampled:1. 30 (average depth 42 m) domestic wells that were
selected because they were easy to sample and provided water consumed by residence; and
2. 19 shallow (average depth 13 m) monitoring wells installed specifically for the NAWQA study at locations and depths that would provide the earliest indication of potential water-quality concerns. The wells were generally within 30 m of row
crop fields and were sampled once between 1993 and 1995 during the irrigation season for major ions, nutrients, 85 pesticides, 60 volatile organic compounds, dissolved organic carbon, and radon.
The land-use study for orchards specifically investigated pesticide occurrence in ground water beneath areas where orchards were the predominant crop. Samples included 18 domestic wells and 22 shallow monitoring wells. The wells were generally within 30 m of the orchard and were sampled once in 1994-95 for the same set of chemicals as the wells in the land-use study for row crops (Jones and Roberts, 1998).
Samples were collected using established NAWQA protocols, which required the use of noncontaminating sampling equipment, well purging, and quality-assurance sampling. Methods for well-site selection, sample collection, and chemical analysis for the land-use studies are reported in detail in Jones and Roberts (1998).
Methods of Study 7

The USGS used a GIS to link the sampling data at the well sites to the simulated amount of atrazine leaching below the root zone at the 134 well sites. First, a digital map of the 134 locations was created using the latitude and longitude coordinates of the wells. The map of the well locations was then combined with the map of simulated atrazine leaching using an overlay operation that produced a table containing the well identification number, the atrazine concentration found in the sampled ground water, and the kilograms of atrazine simulated to leach below the root zone for each well. The data in the table were then exported from the GIS into a database (Microsoft Access).
Two operations were performed in the database. The first operation was to calculate the percentage of the total amount of atrazine applied over the 10-year simulation period that leached below the root zone at each of the 134 well sites. This was done by dividing the kilograms of atrazine predicted to leach below the root zone by the total kilograms of atrazine applied (11.2 kg/ha) at the sites. The second operation was to add a new field to the database to store values that indicated whether atrazine was detected in ground water at the well at levels equal to or greater than the detection limit of 0.001 µg/L (micrograms per liter). The entry for the field was set to "detect" if atrazine was found in the ground water and to "no-detect" if it was not.
Finally, four fields were exported from the database into the statistical software program (S-PLUS®) in order to assess the reliability of the atrazine susceptibility maps: (1) well identification number, (2) ground-water study identification code, (3) flag indicating whether atrazine was detected at well site, and (4) percentage of total atrazine predicted to leach below the root zone at the well site.
The USGS used statistical procedures to test whether the median of the percentage of atrazine simulated to leach below the root zone in wells where atrazine was detected was significantly greater statistically than the median percentage simulated in wells where atrazine was not detected. The following
procedures were used for all 134 wells and for two subsets of the wells: the 46 wells in the land-use study where row crops were predominant and the 37 wells in the land-use study where orchards were predominant.
First, the wells were separated into two sets: one consisting of the wells where atrazine had been detected and the other consisting of the wells where atrazine had not been detected. The following null hypothesis (Ho1) and alternative hypothesis (Ha1) were constructed:
where
The significance level for the test was set at 95 percent.
Second, the Kolmogorov-Smirnov Test of Composite Normality (K-S Test) (Millard and Neerchal, 2001) was used to determine whether the values in the data sets were normally distributed. If the values were normally distributed, a parametric statistical method would be applied for testing the null hypothesis; if the values were not normally distributed, a nonparametric method would be used. The K-S Test was used to test the following null hypothesis (Ho2) and alternative hypothesis (Ha2):
Ho1: Ud < Und
Hal: Ud > Und
Ud is the median percentage of atrazine simulated to leach below the root zone at wells where atrazine was detected in the ground water; and
Und is the median percentage of atrazine simulated to leach below the root zone at wells where atrazine was not detected in the ground water.
Ho2: Values in data set are normally distributed; and
Ha2: Values in data set are not normally distributed.
8 Method for Assessing and Mapping Agricultural Areas Susceptible to Atrazine Leaching in the State of Washington

Finally, the nonparametric Wilcoxon rank sum test (Millard and Neerchal, 2001) was used to test the null hypothesis (Ho1) because results from the K-S Test showed the values in the data sets were not normally distributed. The nonparametric Wilcoxon rank sum test statistic is based on ranks of the observations instead of the observations themselves.
An examination of the PRZM-2 output files revealed that irrigation was misapplied during the simulations. Simulated irrigation in PRZM-2 is applied when the average soil-moisture content in the root zone reaches a level that is set by the model user, a value (cubic centimeters of water/cubic centimeters of soil) between the wilting point and field capacity of the soil in the maximum root zone. However, an inspection of the PRZM-2 output files revealed that irrigation in the simulations was not begun until 6 weeks after the plant started to grow.
The USGS conducted additional PRZM-2 simulations to explore the effect of underapplying irrigation on atrazine leaching. The irrigation process was set to off, and instead, irrigation was simulated by adding water as precipitation in the weather files. The median percentage of atrazine leaching increased from 47.9 percent to 74.5 percent for the 22 wells where atrazine was detected and from 38 percent to 66 percent for wells where atrazine was not detected. The same statistical methods that were used for wells in the study-unit survey and land-use studies were also applied to the wells in the land-use study for row crops where simulations were rerun to increase amounts of irrigation.
RESULTS
The purpose of the statistical comparison was to determine whether the median of the percentage of total atrazine to leach below the root zone was greater for wells where atrazine was detected compared to wells where atrazine was not detected.
For the 134 wells in the combined three NAWQA studies, the p value was 0.067 for the Wilcoxon rank sum test statistic (table 6). Therefore, the null hypothesis was accepted at a 95-percent significance level and no statistical difference was found between the medians of the two groups. For wells in the land-use study for orchards, the p value was 0.044, resulting in rejection of the null hypothesis at a 95-percent significance level. This indicates that the median percentage predicted by the model for atrazine leaching was statistically greater in the wells where atrazine had been detected than in the median for wells where atrazine had not been detected. For wells in the land-use study for row crops, the p value was 0.020, again resulting in rejection of the null hypothesis and indicating that the median percentage of atrazine predicted to leach below the root zone was statistically greater for wells where atrazine had been detected than in wells where atrazine had not been detected. Finally, for wells in the land-use study for row crops that were rerun with greater amounts of applied irrigation, the p value was 0.057. Therefore, the null hypothesis was accepted at a 95-percent significance level, indicating no statistical difference in medians of the two groups.
Table 6. Results of statistical testing of reliability of the map of susceptibility to atrazine leaching of areas in the Columbia Basin Irrigation Project, Washington
[Results of hypothesis testing are at 95-percent significance; Ho, null hypothesis]
Well group tested p-value Ho
All 134 wells 0.067 Accepted
Wells in orchard land-use study (37 wells)
0.044 Rejected
Wells in row-crop land-use study (46 wells)
0.020 Rejected
Wells in row-crop land-use study (with adjusted irrigation)
0.057 Accepted
Results 9
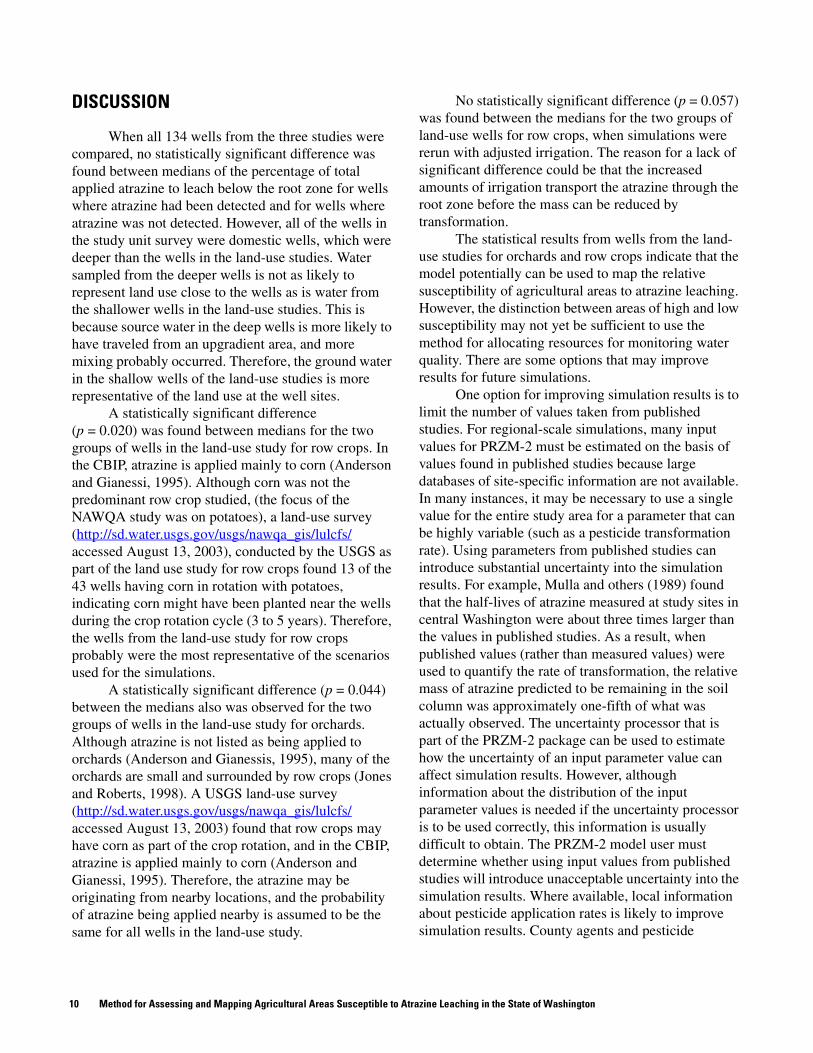
DISCUSSION
When all 134 wells from the three studies were compared, no statistically significant difference was found between medians of the percentage of total applied atrazine to leach below the root zone for wells where atrazine had been detected and for wells where atrazine was not detected. However, all of the wells in the study unit survey were domestic wells, which were deeper than the wells in the land-use studies. Water sampled from the deeper wells is not as likely to represent land use close to the wells as is water from the shallower wells in the land-use studies. This is because source water in the deep wells is more likely to have traveled from an upgradient area, and more mixing probably occurred. Therefore, the ground water in the shallow wells of the land-use studies is more representative of the land use at the well sites.
A statistically significant difference (p = 0.020) was found between medians for the two groups of wells in the land-use study for row crops. In the CBIP, atrazine is applied mainly to corn (Anderson and Gianessi, 1995). Although corn was not the predominant row crop studied, (the focus of the NAWQA study was on potatoes), a land-use survey (http://sd.water.usgs.gov/usgs/nawqa_gis/lulcfs/ accessed August 13, 2003), conducted by the USGS as part of the land use study for row crops found 13 of the 43 wells having corn in rotation with potatoes, indicating corn might have been planted near the wells during the crop rotation cycle (3 to 5 years). Therefore, the wells from the land-use study for row crops probably were the most representative of the scenarios used for the simulations.
A statistically significant difference (p = 0.044) between the medians also was observed for the two groups of wells in the land-use study for orchards. Although atrazine is not listed as being applied to orchards (Anderson and Gianessis, 1995), many of the orchards are small and surrounded by row crops (Jones and Roberts, 1998). A USGS land-use survey (http://sd.water.usgs.gov/usgs/nawqa_gis/lulcfs/ accessed August 13, 2003) found that row crops may have corn as part of the crop rotation, and in the CBIP, atrazine is applied mainly to corn (Anderson and Gianessi, 1995). Therefore, the atrazine may be originating from nearby locations, and the probability of atrazine being applied nearby is assumed to be the same for all wells in the land-use study.
No statistically significant difference (p = 0.057) was found between the medians for the two groups of land-use wells for row crops, when simulations were rerun with adjusted irrigation. The reason for a lack of significant difference could be that the increased amounts of irrigation transport the atrazine through the root zone before the mass can be reduced by transformation.
The statistical results from wells from the land-use studies for orchards and row crops indicate that the model potentially can be used to map the relative susceptibility of agricultural areas to atrazine leaching. However, the distinction between areas of high and low susceptibility may not yet be sufficient to use the method for allocating resources for monitoring water quality. There are some options that may improve results for future simulations.
One option for improving simulation results is to limit the number of values taken from published studies. For regional-scale simulations, many input values for PRZM-2 must be estimated on the basis of values found in published studies because large databases of site-specific information are not available. In many instances, it may be necessary to use a single value for the entire study area for a parameter that can be highly variable (such as a pesticide transformation rate). Using parameters from published studies can introduce substantial uncertainty into the simulation results. For example, Mulla and others (1989) found that the half-lives of atrazine measured at study sites in central Washington were about three times larger than the values in published studies. As a result, when published values (rather than measured values) were used to quantify the rate of transformation, the relative mass of atrazine predicted to be remaining in the soil column was approximately one-fifth of what was actually observed. The uncertainty processor that is part of the PRZM-2 package can be used to estimate how the uncertainty of an input parameter value can affect simulation results. However, although information about the distribution of the input parameter values is needed if the uncertainty processor is to be used correctly, this information is usually difficult to obtain. The PRZM-2 model user must determine whether using input values from published studies will introduce unacceptable uncertainty into the simulation results. Where available, local information about pesticide application rates is likely to improve simulation results. County agents and pesticide
10 Method for Assessing and Mapping Agricultural Areas Susceptible to Atrazine Leaching in the State of Washington
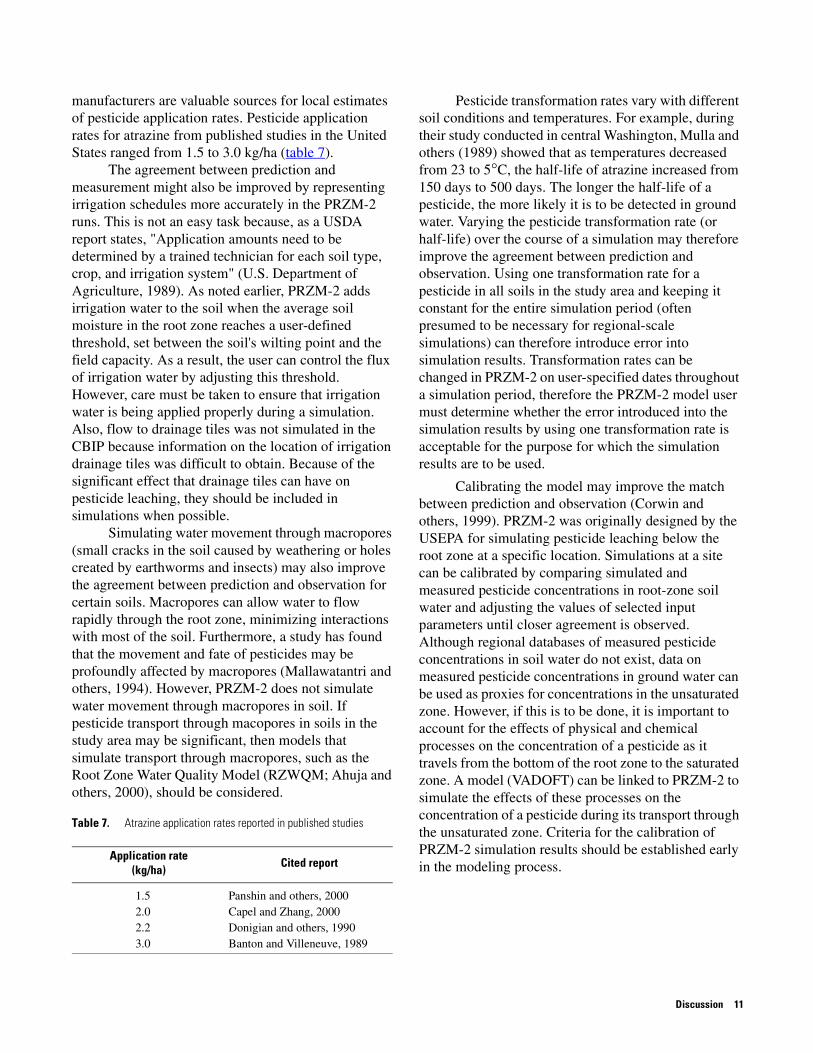
manufacturers are valuable sources for local estimates of pesticide application rates. Pesticide application rates for atrazine from published studies in the United States ranged from 1.5 to 3.0 kg/ha (table 7).
The agreement between prediction and measurement might also be improved by representing irrigation schedules more accurately in the PRZM-2 runs. This is not an easy task because, as a USDA report states, "Application amounts need to be determined by a trained technician for each soil type, crop, and irrigation system" (U.S. Department of Agriculture, 1989). As noted earlier, PRZM-2 adds irrigation water to the soil when the average soil moisture in the root zone reaches a user-defined threshold, set between the soil's wilting point and the field capacity. As a result, the user can control the flux of irrigation water by adjusting this threshold. However, care must be taken to ensure that irrigation water is being applied properly during a simulation. Also, flow to drainage tiles was not simulated in the CBIP because information on the location of irrigation drainage tiles was difficult to obtain. Because of the significant effect that drainage tiles can have on pesticide leaching, they should be included in simulations when possible.
Simulating water movement through macropores (small cracks in the soil caused by weathering or holes created by earthworms and insects) may also improve the agreement between prediction and observation for certain soils. Macropores can allow water to flow rapidly through the root zone, minimizing interactions with most of the soil. Furthermore, a study has found that the movement and fate of pesticides may be profoundly affected by macropores (Mallawatantri and others, 1994). However, PRZM-2 does not simulate water movement through macropores in soil. If pesticide transport through macopores in soils in the study area may be significant, then models that simulate transport through macropores, such as the Root Zone Water Quality Model (RZWQM; Ahuja and others, 2000), should be considered.
Pesticide transformation rates vary with different soil conditions and temperatures. For example, during their study conducted in central Washington, Mulla and others (1989) showed that as temperatures decreased from 23 to 5°C, the half-life of atrazine increased from 150 days to 500 days. The longer the half-life of a pesticide, the more likely it is to be detected in ground water. Varying the pesticide transformation rate (or half-life) over the course of a simulation may therefore improve the agreement between prediction and observation. Using one transformation rate for a pesticide in all soils in the study area and keeping it constant for the entire simulation period (often presumed to be necessary for regional-scale simulations) can therefore introduce error into simulation results. Transformation rates can be changed in PRZM-2 on user-specified dates throughout a simulation period, therefore the PRZM-2 model user must determine whether the error introduced into the simulation results by using one transformation rate is acceptable for the purpose for which the simulation results are to be used.
Calibrating the model may improve the match between prediction and observation (Corwin and others, 1999). PRZM-2 was originally designed by the USEPA for simulating pesticide leaching below the root zone at a specific location. Simulations at a site can be calibrated by comparing simulated and measured pesticide concentrations in root-zone soil water and adjusting the values of selected input parameters until closer agreement is observed. Although regional databases of measured pesticide concentrations in soil water do not exist, data on measured pesticide concentrations in ground water can be used as proxies for concentrations in the unsaturated zone. However, if this is to be done, it is important to account for the effects of physical and chemical processes on the concentration of a pesticide as it travels from the bottom of the root zone to the saturated zone. A model (VADOFT) can be linked to PRZM-2 to simulate the effects of these processes on the concentration of a pesticide during its transport through the unsaturated zone. Criteria for the calibration of PRZM-2 simulation results should be established early in the modeling process.
Table 7. Atrazine application rates reported in published studies
Application rate(kg/ha)
Cited report
1.5 Panshin and others, 20002.0 Capel and Zhang, 20002.2 Donigian and others, 19903.0 Banton and Villeneuve, 1989
Discussion 11

Sensitivity analysis could be used to determine variables to be input into the Monte Carlo routine in the uncertainty processor. Variables that are not measured at the sites for which simulations are conducted should be considered for inputting into the uncertainty processor. However, as the number of variables entered into the uncertainty processor increases, so does the time required to run the model. Potentially large amounts of computer processing time can be required if uncertainty is to be simulated for many variables for a large number of areas. By checking the sensitivity of model inputs, a few key variables can be input into the Monte Carlo routine and can reduce computer-processing time.
SUMMARY
The U.S. Geological Survey (USGS), the Washington State Department of Ecology, and the Washington State Department of Agriculture cooperatively developed a method for assessing and mapping susceptibility of ground water to pesticide leaching in agricultural areas of Washington. The method employed the deterministic Pesticide Root Zone Model (PRZM-2) and a Geographic Information System (GIS). The method was tested by creating a map of ground-water susceptibility to atrazine leaching for the Columbia Basin Irrigation Project (CBIP) and comparing the percentages of applied atrazine simulated to leach below the root zone with ground-water monitoring data from 134 sites within the mapped area.
Three principal steps were involved in creating the map of susceptibility to atrazine leaching for the CBIP. First, a simulation scenario for PRZM-2 was formulated by making simplifying assumptions about atrazine applications, application site characteristics, and transport processes. Second, values for the model input parameters were selected from previous pesticide leaching studies, PRZM-2 documentation, the recommendations of local experts, a PRZM-2 preprocessor software program (PATRIOT), and a U.S. Department of Agriculture (USDA) soils database (SSURGO). Finally, simulations were run and areas of ground-water susceptibility to atrazine leaching were mapped using a GIS.
The USGS used statistical procedures to test whether the median of the percentage of atrazine simulated to leach below the root zone in wells where atrazine was detected was statistically greater than the median percentage at wells where atrazine was not detected. For the first statistical comparison, 134 wells from the CBIP were separated into two sets: (1) wells where atrazine had been detected (at or above 0.001 micrograms per liter) and (2) wells where atrazine had not been detected. The comparison of the two sets of wells with the non-parametric Wilcoxon rank-sum test indicated that the percentages of applied atrazine simulated to have leached below the root zone for wells with detections was not significantly different (at the 95-percent level) from those for wells where atrazine had not been detected (p = 0.067). The same statistical comparisons were used for wells in the land-use study for orchards where a significant difference (at the 95-percent level) in medians was found (p = 0.044), and also for the wells in the land-use study for row crops where a significant difference (at the 95-percent level) in medians was found (p = 0.019). The statistical results from wells from the land-use studies indicate that the model potentially can be used to map the relative susceptibility of agricultural areas to atrazine leaching. However, the distinction between areas of high and low susceptibility may not yet be sufficient to use the method as a tool for allocating resources for monitoring water quality.
Adapting the PRZM-2 model to perform regional-scale simulations is challenging. Most large-scale datasets available for model input have large uncertainties associated with parameter values, and these uncertainties cause errors in simulation output values. Options for reducing the uncertainty in input data and improving future simulations include (1) limiting input values used from published studies and using more measured values, (2) more accurately representing irrigation schedules, (3) simulating water movement through macropores, (4) varying pesticide transformation rates over the course of the simulation, and (5) calibrating the simulation model.
12 Method for Assessing and Mapping Agricultural Areas Susceptible to Atrazine Leaching in the State of Washington

REFERENCES CITED
Ahuja, L.R., Rojas, K.W., Hanson, J.D., Shaffer, M.J., and Ma, L., 2000, Root Zone Water Quality Model—Modelling management effects on water quality and crop production: Highlands Ranch, Colorado, Water Resources Publications, LLC, p. 1-10.
Anderson, J.E., and Gianessi, L.P., 1995, Pesticide use in the Central Columbia Plateau: Washington D.C., The National Center for Food and Agricultural Policy, p. 24.
Banton, O., and Villeneuve, J.P., 1989, Evaluation of groundwater vulnerability to pesticides—A comparison between the pesticide DRASTIC index and the PRZM leaching quantities: Journal of Contaminant Hydrology, v. 4, p. 285-296.
Barbash, J.E., Thelin, G.P., Kolpin, D.W., and Gilliom, R.J., 1999, Distribution of major herbicides in ground water of the United Stated: U.S. Geological Survey Water-Resources Investigations Report 98-4245: accessed August 13, 2003 at http://ca.water.usgs.gov/ pnsp/rep/wrir984245.
Capel, P.D., and Zhang, H., 2000, Estimation of potential loss of two pesticides in runoff in Fillmore County, Minnesota, using a field-scale process-based model and a geographic information system: Washington, D.C., American Chemical Society, ACS Symposium series 751, p. 172-184.
Carsel, R.F., Smith, C.N., Mulkey, L.A., Dean, J.D., and Jowise, P., 1984, User's manual for the pesticide root zone model (PRZM) - Release 1: Athens, Ga., U.S. Environmental Protection Agency, EPA-600/3-84-109, 266 p.
Corwin, D.L., Letey, J., Jr., Carillo, M.L.K., 1999, Modeling non-point source pollutants in the vadose zone - Back to the basics, in American Geophysical Union, 1999, Assessment of non-point source pollution in the vadose zone: Washington, D.C., American Geophysical Union, Geophysical Monogram 108, p. 323-342.
Donigian, A.S., Jr., Patwardhan, A.S., Sharp-Hansen, S., Travers, C.L., and Raju, C.S., 1990, Preliminary RUSTIC application for atrazine simulation at Muscatine Island, Iowa: Athens, Ga., U.S. Environmental Protection Agency, 68-03-3513, 125 p.
Imhoff, J.C., Hummel, P.R., Kittle, J.L., and Carsel, R.F., 1994, PATRIOT—A methodology and decision support system for evaluating the leaching potential of pesticides: U.S. Environmental Protection Agency, Environmental research brief 600S93010: accessed April 10, 2001, at http://www.aquaterra.com/ patriot.html.
Jones, J.L., and Roberts, L.M., 1998, Shallow ground-water quality beneath row crops and orchards in the Columbia Basin Irrigation Project Area, Washington: U.S. Geological Survey Water-Resources Investigations Report 97-4238, 29 p.
Karnes, Daniel, 1998, Virtual Geography Department Jenk's optimization method for numeric data classification module: Hanover, N.H., Dartmoth College: accessed April 10, 2001, at http://www.dartmouth.edu/ ~dbkarnes/jenks/jenks.html.
Linsley, R.K., Kohler, M.A., and Paulhus, J.L.H., 1975, Hydrology for engineers (2 ed.): New York, McGraw-Hill, p. 82-84.
Mallawatantri, A.P., Mulla, D.J., and Ogram, A.V., 1994, Pesticide sorption and degradation in macropores and soil horizons in the Palouse: Pullman, Washington, Washington State University, State of Washington Water Research Center Report A-180-WASH, 27 p.
Millard, S.P., and Neerchal, N.K., 2001, Environmental statistics with S-PLUS: New York, CRC Press, p. 384; 432-434.
Morgan, Laurie, 2002, Aquifer vulnerability analysis using the Pesticide Root-Zone Model (PRZMZ): Washington State Department of Ecology, publication no. 01-10-027, p. 134.
Mulla, D., Cheng, H., Tuxhorn, G., and Sounhein, R., 1989, Management of ground water contamination in Washington's Columbia Basin: Pullman, Washington: Washington State University, State of Washington Water Research Center Report 72, 29 p.
Panshin, Sandra Y., Carter, Donna S., and Bayless, E., Randall, 2000, Analysis of atrazine and four degradation products in pore water of the vadose zone, central Indiana: Environmental Science and Technology, v. 34, no. 11, p. 2131-2137.
U.S. Department of Agriculture, 1989, Irrigation scheduling—A water quality must: Pasco, Wash., Franklin Conservation District, 15 p.
U.S. Department of Agriculture, 1995, Soil survey geographic (SSURGO) data base: Fort Worth, Tex., National Soil Survey Center, Miscellaneous Publication 1527, p. 31.
U.S. Environmental Protection Agency, 1996, 40 CFR Parts 152 and 156, Pesticides and Ground Water State Management Plan Regulation, proposed rule: Federal Register, v. 61, no. 124, 43 p.
Williamson A.K., Munn, M.D., Ryker, S.J., Wagner, R.J., Ebbert, J.C., and Vanderpool A.M., 1998, Water quality in the Central Columbia Plateau, Washington and Idaho, 1992-95: U.S. Geological Survey Circular 1144, p. 35.
References Cited 13


![book review roundtable - National Bureau of Asian … · [ 108 ] bokb revkiw India’s Foreign Policy Transformation C. Raja Mohan A ssessing India’s evolution since 1980 is a compelling](https://img.pdfslide.us/doc/110x75/5b89065a7f8b9aa81a8b7c66/book-review-roundtable-national-bureau-of-asian-108-bokb-revkiw-indias.jpg)