Embed Size (px)
Citation preview
i
Forest Resources Assessment Working Paper 166
CASE STUDIES ON MEASURING AND ASSESSING
FOREST DEGRADATION
GLOBAL MAPPING AND MONITORING THE EXTENT OF
FOREST ALTERATION:
THE INTACT FOREST LANDSCAPES METHOD
PETER POTAPOV
LARS LAESTADIUS
ALEXEY YAROSHENKO
SVETLANA TURUBANOVA
December, 2009
ii
Sustainably managed forests have multiple environmental and socio-economic functions which
are important at the global, national and local scales, and they play a vital part in sustainable
development. Reliable and up-to-date information on the state of forest resources - not only on
area and area change, but also on such variables as growing stock, wood and non-wood
products, carbon, protected areas, use of forests for recreation and other services, biological
diversity and forests’ contribution to national economies - is crucial to support decision-making
for policies and programmes in forestry and sustainable development at all levels.
Under the umbrella of the Global Forest Resources Assessment 2010 (FRA 2010) and together
with members of the Collaborative Partnership on Forests (CPF) and other partners, FAO has
initiated a special study to identify the elements of forest degradation and the best practices for
assessing them. The objectives of the initiative are to help strengthen the capacity of countries
to assess, monitor and report on forest degradation by:
� Identifying specific elements and indicators of forest degradation and degraded forests;
� Classifying elements and harmonizing definitions;
� Identifying and describing existing and promising assessment methodologies;
� Developing assessment tools and guidelines
Expected outcomes and benefits of the initiative include:
� Better understanding of the concept and components of forest degradation;
� An analysis of definitions of forest degradation and associated terms;
� Guidelines and effective, cost-efficient tools and techniques to help assess and monitor
forest degradation; and
� Enhanced ability to meet current and future reporting requirements on forest degradation.
The Global Forest Resources Assessment programme is coordinated by the Forestry Department
at FAO headquarters in Rome. The contact person is:
Mette Løyche Wilkie
Senior Forestry Officer
FAO Forestry Department
Viale delle Terme di Caracalla
Rome 00153, Italy
E-mail: [email protected]
Readers can also use the following e-mail address: [email protected]
More information on the Global Forest Resources Assessment programme can be found at:
www.fao.org/forestry/fra
The coordinators of this work would like to acknowledge the financial contributions made by
the Governments of Finland and Norway and by FAO, the GEF BIP programme and ITTO.
DISCLAIMER
The Forest Resources Assessment (FRA) Working Paper Series is designed to reflect the
activities and progress of the FRA Programme of FAO. Working Papers are not authoritative
information sources – they do not reflect the official position of FAO and should not be used for
official purposes. Please refer to the FAO forestry website (www.fao.org/forestry ) for access to
official information.
The FRA Working Paper Series provides an important forum for the rapid release of
information related to the FRA programme. Should users find any errors in the documents or
would like to provide comments for improving their quality they should contact [email protected].
iii
Forestry Department Food and Agriculture Organization of the United Nations
Forest Resources Assessment Working Paper
Case Studies on Measuring and Assessing
Forest Degradation
Global Mapping and Monitoring the Extent of Forest Alteration:
The Intact Forest Landscapes Method
Peter Potapov
Lars Laestadius
Alexey Yaroshenko
Svetlana Turubanova
December, 2009
___________________________________________________________ Forest Resources Assessment Programme Working Paper 166
Rome, Italy, 2009

iv
v
Abstract
This paper presents the IFL Method—a novel approach for mapping and monitoring the extent of
forest alteration. High spatial resolution satellite images are used to identify and map large un-
degraded areas called Intact Forest Landscapes (IFL), defined as unbroken expanses of natural
ecosystems in the zone of current forest landscapes extent without signs of significant human
activity and at least 50,000 hectares in size. The method produces an IFL map which shows the
boundary between unaltered forest landscapes (where most components, including species and site
diversity, dynamics and ecological functions remain intact) and altered or fragmented forests
(where some level of timber extraction, species composition change, anthropogenic fragmentation
and/or alteration of ecosystem dynamics has taken place).
The paper describes the IFL Method and presents results of its use for a global baseline assessment
of the extent of forest alteration along with several examples of regional-level monitoring. The
extent of forest alteration (understood in this context as a reduction in ecological integrity across a
forest landscape) was measured at the global, biome and national levels based on the distribution
and proportion of IFL areas. A detailed boundary between ‘intact’ and ‘non-intact’ forest
landscapes was established and used as a baseline. The IFL method represents a practical, rapid, and
cost-effective approach for assessing forest intactness, alteration and degradation at the global and
regional scales.
In the context of Reduced Emissions from Deforestation and Forest Degradation (REDD), IFLs are
strongly associated with issues of permanence, biodiversity, and indigenous peoples. Countries that
wish to make an early commitment under REDD that is capable of being monitored, verified, and
reported may therefore find that the IFL Method offers interesting opportunities. The method can be
elaborated to also measure the depth or intensity of forest alteration. It thus represents an approach
that should be of interest to FAO’s Forest Resources Assessment, for example for monitoring of
forest degradation.
The IFL method was developed by a group of scientists and environmental non-governmental
organizations under the framework of Global Forest Watch, an initiative of the World Resources
Institute. IFL maps, monitoring reports and other publications are available on a dedicated web site
(http://www.intactforests.org ).
Key Words: Forest degradation, Intact forest landscapes, Global degradation assessment, Global
degradation monitoring

vi
1
1. Introduction
Assessing forest degradation is difficult for at least two reasons. Degradation is a complex concept
and thus difficult to define. It is also difficult to measure. The human impact on a forest is complex
and varies significantly both in kind and in degree. To make matters worse, what little information
is available is often inadequate, lacking in detail and richness, and lacking in consistency,
particularly across jurisdictional boundaries. The non-productive aspects of forests (for example
biodiversity) tend to be particularly poorly quantified, making it difficult to assess rates and patterns
of degradation. The information problem is particularly difficult at the regional and global scales.
In the late 1990s, Greenpeace Russia and Global Forest Watch (an initiative of the World Resources
Institute) initiated an effort to harness the emerging potential of remote sensing to assess the
ecological integrity of large forest landscapes. The work resulted in a rigorous original method and
a map at the scale of 1:1 million of the remaining virgin forest landscapes (called Intact Forest
Landscapes or IFL) of Northern European Russia. The results were presented in a report
(Yaroshenko et al., 2001) which, apart from a map, also contains an extensive, illustrated
presentation of the concept and definition of an IFL and the mapping method.
In subsequent years (2002–2006), the method was refined and its application extended, first across
the boreal region and then to the entire world. The boreal studies were carried out by a group of
scientists and environmental non-governmental organizations under the framework of Global Forest
Watch (Aksenov et al., 2002, Lee et al., 2002, Strittholt et al., 2006), resulting in a number of
regional IFL maps (Russia, Canada, Alaska). A global IFL map was prepared in 2005–2006 under
the leadership of Greenpeace, with contributions from Global Forest Watch, Biodiversity
Conservation Center, International Socio-Ecological Union (Russia), Transparent World (Russia),
Luonto Liitto (Finnish Nature League), and Forest Watch Indonesia (Potapov et al., 2008).
In the following, this method – called the IFL Method – is described along with the results of a
global assessment of forest landscape alteration and some examples of ongoing, regional-level
monitoring initiatives.
2. Materials and Methods
Approach
For the purposes of this analysis, forest alteration is defined as a reduction in the ecological
integrity of a forest landscape due to human influence (including conversion, alteration and
fragmentation of the natural landscape). The alteration varies in intensity within and among forest
landscapes. The IFL method for mapping and monitoring which is presented below represents a
simple and feasible approach to measuring the extent of forest alteration at the global and national
scales. The method as presented here does not address the intensity of alteration. It can, however, be
elaborated to do so.
The IFL Method
The purpose of the IFL Method is to map large, possibly inaccessible forest landscapes at a cost that
is non-prohibitive in terms of time and resources. The results are replicable and consistent in time
and space (for example for a country, a continent, or the world). The IFL Method was developed to
map forest landscapes of high ecological integrity using satellite images and publicly available
maps.
2
The method consists of two parts which combine to form an integrated whole: an assessment logic
and a set of definitions and criteria. The assessment logic has three major characteristics:
1. A binary classification of the landscape
Ecological integrity is measured on a binary scale. Forest landscapes are classified as being either
intact (un-degraded) or non-intact (altered, including possibly degraded). The degree of alteration
within non-intact landscapes is not captured by this scale.
An Intact Forest Landscape (IFL) is an unbroken expanse of natural ecosystems that shows no
signs of significant human activity and is large enough to maintain all native biodiversity, including
viable populations of wide-ranging species. An IFL may contain significant portions of naturally
tree-less ecosystems. The assessments reported below have all used 50,000 hectares as the
minimum size of an IFL.
2. Criteria of two types
Intact and non-intact landscapes are separated on the basis of two types of criteria: degree of
human-caused alteration and anthropogenic fragmentation. The entire area of study is assessed for
its eligibility to be a part of an IFL. First, the level of human-caused alteration is determined and
ineligible parts are rejected. Remaining eligible parts are then assessed for their degree of
fragmentation and ineligible parts rejected. Criteria and indicators for the eligibility assessment are
described in Box 1.
Box 1. Criteria and indicators
A. Human-caused alteration
Portions of the study area with evidence of significant human-caused alteration
are considered disturbed and not eligible for inclusion in an IFL. Such evidence
includes:
(1) Settlements (including a buffer zone of 1 km);
(2) Infrastructure used for transportation between settlements or for industrial
development of natural resources. This includes roads (except unpaved trails),
railways, navigable waterways (including seashore), pipelines, and power
transmission lines (including in all cases a buffer zone of 1 km on either side);
(3) Agriculture and forest plantations;
(4) Industrial activities during the last 30–70 years, such as logging, mining, oil
and gas exploration and extraction, peat extraction;
(5) Areas affected by stand-replacing wildfires during the last 30–70 years if
located in the vicinity of infrastructure or developed areas.
Old or low intensity human influence is considered insignificant. Portions with
such “background” influence remain eligible for inclusion in an IFL. Sources of
background influence include diffuse grazing by domestic animals, low-intensity
selective logging, and hunting.
B. Fragmentation
Portions of the study area that remain eligible for inclusion in an IFL are then
assessed for fragmentation. Otherwise eligible portions that are too small or too
narrow are eliminated. An IFL must satisfy the following criteria:
(1) Larger than 50,000 ha;
(2) At least 10 km wide at the broadest place (measured as a diameter of the
largest circle that can be fitted inside the patch);
(3) At least 2 km wide in narrow parts connecting wider patches and in
appendages.
3
3. Intact until proven otherwise
The method finds intact areas by identifying and eliminating their opposites. The reason for this
“inverse” logic is that it is easier to spot the evidence of the presence of human-caused alteration
and fragmentation than to prove their absence. The initial assumption of the assessment process is
therefore that the entire area of study is intact. The method contains a set of well-defined rules for
assessing the study area by trying to disprove the initial assumption (see Box 1). These have been
designed to be globally applicable and easily replicable, allowing for repeated assessments over
time as well as independent verification.
The final result is a map on which intact forest landscapes appear as a residual once all non-intact
areas have been eliminated. The intact forest landscapes on this map are those portions of the study
area for which no evidence of significant human-caused alteration or fragmentation could be found.
The map can be used for targetting of conservation and monitoring efforts if made based on satellite
images of sufficient quality and spatial resolution (for example, Landsat TM/ETM+).
The possibilities for refining and adapting the method for other purposes, for example, for assessing
the intensity of alteration, are discussed below.
Global assessment of forest alteration
The IFL Method was used to assess the ecological integrity of the world’s forest landscapes within
their current global extent (referred to in the following as the forest landscape zone1). The concept
of a forest landscape, as it is used here, is a mosaic of land cover types that are naturally
interspersed. A forest landscape is dominated by forests but may include extensive naturally treeless
areas (for example, small lakes, wetlands, rivers, and rocky outcroppings) as these components co-
exist naturally within the broader forest ecosystem.
The forest landscape zone boundary was defined using a global tree canopy cover dataset (part of
the Vegetation Continuous Fields MODIS 500m product, hereafter referred to as VCF) (Hansen et
al., 2003). Forest was defined as an area with a tree canopy cover greater than 20 percent in the year
2000. Forest patches smaller than 4 km2 were excluded. The forest landscape zone as defined here
includes all treeless areas (including lakes and rivers) that occur naturally within forest ecosystems.
Forest landscape fragments smaller than 500 km2 were not considered in the analysis.
The forest landscape zone was assessed in two steps. First, a preliminary fragmentation analysis
was carried out for those countries for which GIS datasets on a scale 1:500,000 or finer for
transportation infrastructure and settlements were available. Buffer zones were assigned to roads,
pipelines, power lines and settlements which were subsequently eliminated from the area of study.
Our goal was to identify fragments free from major elements of infrastructure and greater than
50,000 hectares in size. Areas that did not qualify were eliminated from further consideration, while
other areas were retained as candidates for IFL.
The second step was to use high spatial resolution Landsat TM (global coverage representing an
average date of 1990) and ETM+ (global coverage representing an average date of 2000) imagery to
systematically assess all remaining candidate IFL areas for human-caused alteration and to delineate
developed and fragmented areas. The Landsat images were obtained free of charge from the
GeoCover Landsat Orthorectified image collection (Tucker et al., 2004).
1 The forest landscape zone is different from what FAO calls the forest zone in that it includes treeless areas (such as
lakes, wetlands, and rivers) that occur naturally within the broader ecosystem that we call a forest landscape. The term
forest landscape zone is used here to make the distinction clear.
4
The image analysis was conducted through expert-based visual interpretation, using Geographic
Information System (GIS) overlays with additional thematic and topographic map layers. The
purpose was to detect evidence of significant human-caused alteration and fragmentation (see Box
1). Patches with such evidence were eliminated from the area of study and remaining areas, if large
enough, were classified as IFL.
Regional monitoring of forest alteration
The IFLs found in the global map were re-assessed, using the same criteria as in the baseline
assessment. The work was conducted through expert-based visual interpretation, and could proceed
much more quickly than the initial IFL baseline mapping because only areas within already
identified IFLs needed to be assessed (no gain in intactness is assumed to be possible on a decadal
time scale).
The re-assessment product—an updated IFL map—can be used to measure and differentiate rates of
forest alteration and degradation across a landscape. If large-scale changes are mapped separately
(e.g. clearcuts, fire scars, and agricultural clearings) the map can also be used to differentiate causes
of alteration.
The re-assessment was performed at a regional scale, using satellite imagery from the same
(Landsat) or comparable (ASTER, IRS/LISS) sensors that were used for the baseline assessment.
The Landsat images for year 2005 were obtained from the Global Land Survey image collection
(Gutman et al., 2008), ASTER images were obtained from USGS TerraLook collection
(http://glovis.usgs.gov/ ), and IRS/LISS images were provided by R&D center ScanEx.
3. Results and Discussion
Global assessment of forest alteration and intact forest landscapes
The current extent of the world’s forest landscape zone, as defined above, is 5,587.6 million ha
(Mha) or 37.3 percent of the Earth’s total land surface. This area can be divided into three major
ecosystem types, based on tree canopy density (Hansen et al., 2003):
(1) Closed forests with a tree canopy density greater than 40 percent (49.2 percent of the forest
landscape zone);
(2) Open forests and woodlands with a tree canopy density of 20-40 percent (24.7 percent of the
forest landscape zone);
(3) Naturally treeless areas with a tree canopy density below 20 percent, e.g. savannas, grasslands,
wetlands, agriculture areas, mountain ecosystems, lakes (26.1 percent of the forest landscape zone).
IFLs make up 23.5 percent of the forest landscape zone (1,312.9 Mha). The remainder of the forest
landscape zone (4,274.7 Mha) is affected by development or fragmentation (Figure 1). In the
context of the IFL method this part is considered non-intact, i.e. altered, and includes areas that are
degraded. The extent of alteration differs for closed, open and non-forest ecosystems (Table 1).
Table 1. Altered proportion by forest type
Forest type Total Area
(Mha)
Altered Area
(Mha)
Proportion
altered (percent)
Intact Area
(Mha)
Proportion intact
(percent)
Closed forests 2748.4 1901.3 69.2 847.1 30.8
Open forests 1377.6 1108.0 80.4 269.6 19.6
Naturally treeless areas 1461.5 1265.3 86.6 196.2 13.4
Forest landscape zone total 5587.6 4274.7 76.5 1312.9 23.5
5
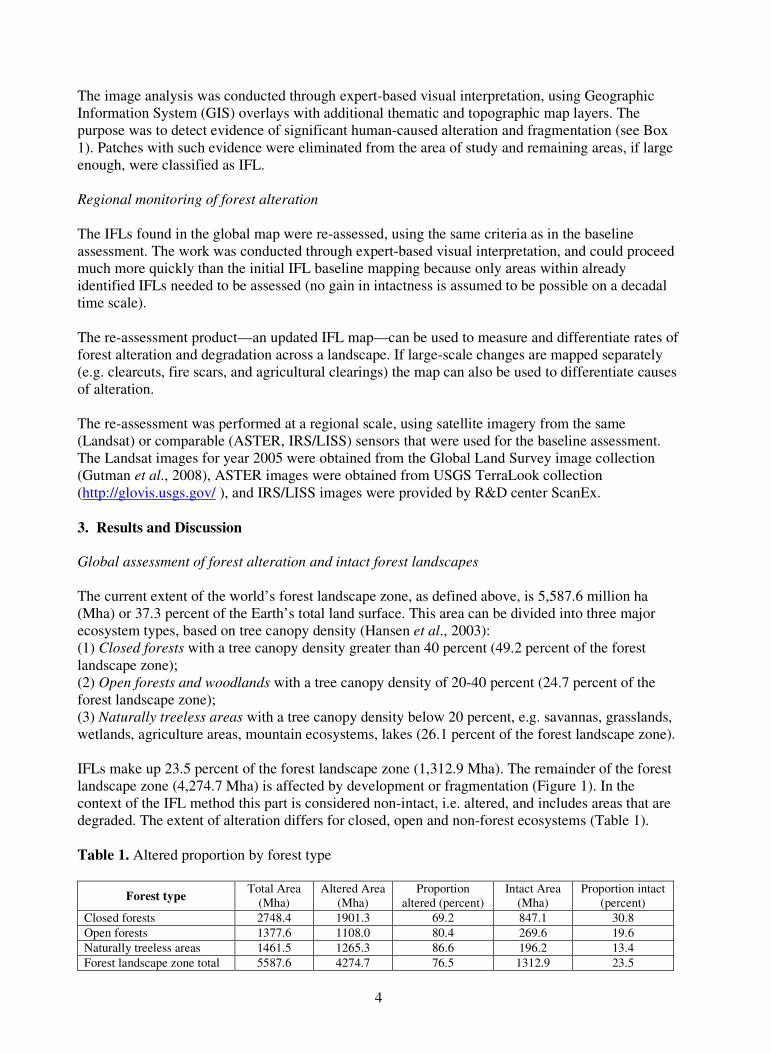
Figure 1. The world’s intact and altered forest landscapes. The IFL Method produces maps that are
relevant for planning and monitoring at the global, national and regional scales. The regional scale
map shows non-intact forests in light green and treeless areas in yellow.
Approximately two-thirds (69.2 percent) of the world’s closed forests are non-intact because of
alteration or fragmentation. Within the remaining areas of the forest landscape zone (open canopy
and naturally tree-less), IFLs remain in the boreal and subtundra zones of the north but not in the
southern regions, where the extent of alteration is significantly greater in these ecosystem types than
in the dense forests. A long history of human activities has transformed the original woodlands and
savanna-type ecosystems of the tropics and the temperate forest-steppes into croplands, pastures, or
pyrogenic shrubland or grassland communities.
6
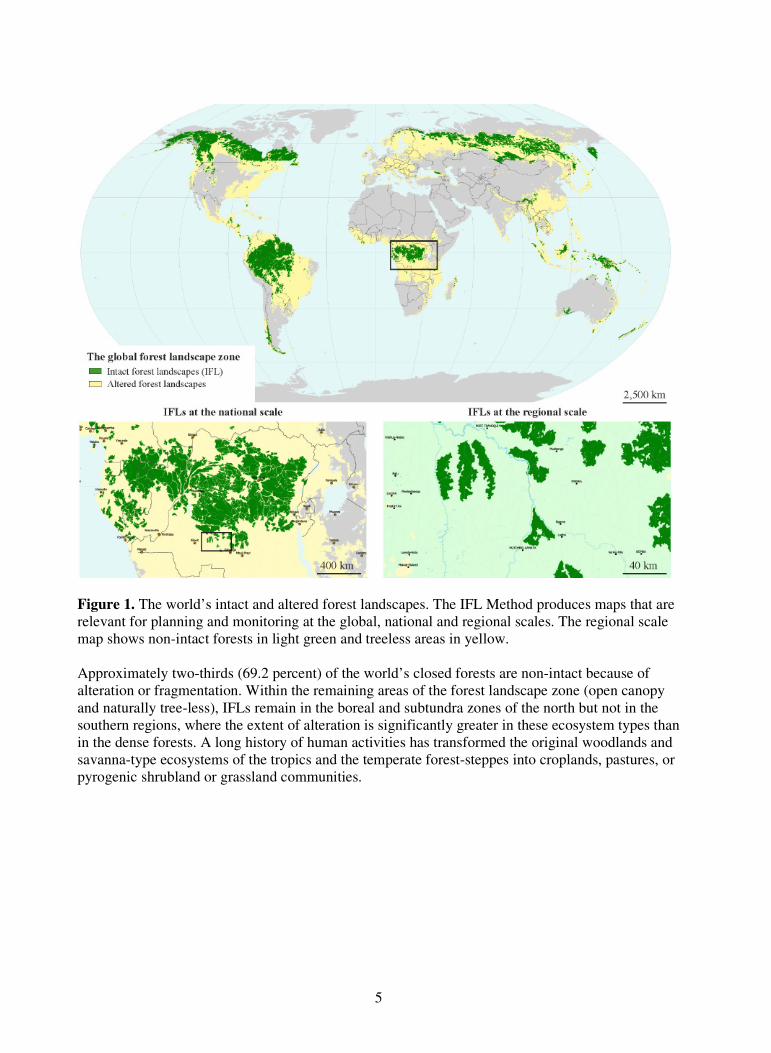
Country level assessment
The country-level assessment was limited to countries with at least 10 million hectares of area in the
forest landscape zone (Figure 2). Out of these 62 countries, the forest has been almost entirely
altered in a group of 19 (less than 1 percent of the forest landscape zone remains as IFL). This
group consists of European countries other than Russia, Finland, and Sweden, and African countries
outside the Congo Basin. Major levels of alteration are seen in a group of 21 countries, featuring a
proportion of remaining IFLs between 1 and 10 percent. This group includes African countries on
the edge of the humid tropical forest biome, Central American countries, Northern Europe, and
countries in Southeast Asia. China and India also belong to this group. The remaining 22 countries
have an IFL proportion that is greater than 10 percent. Only five of them, however, have an IFL
proportion greater than 50 percent (Canada, French Guyana, Guyana, Peru and Suriname).
Figure 2. Forest alteration, expressed as the proportion of degraded (non-intact) landscapes within
the forest landscape zone of selected countries. Countries included in the analysis are shown in dark
gray (62 countries total).
7
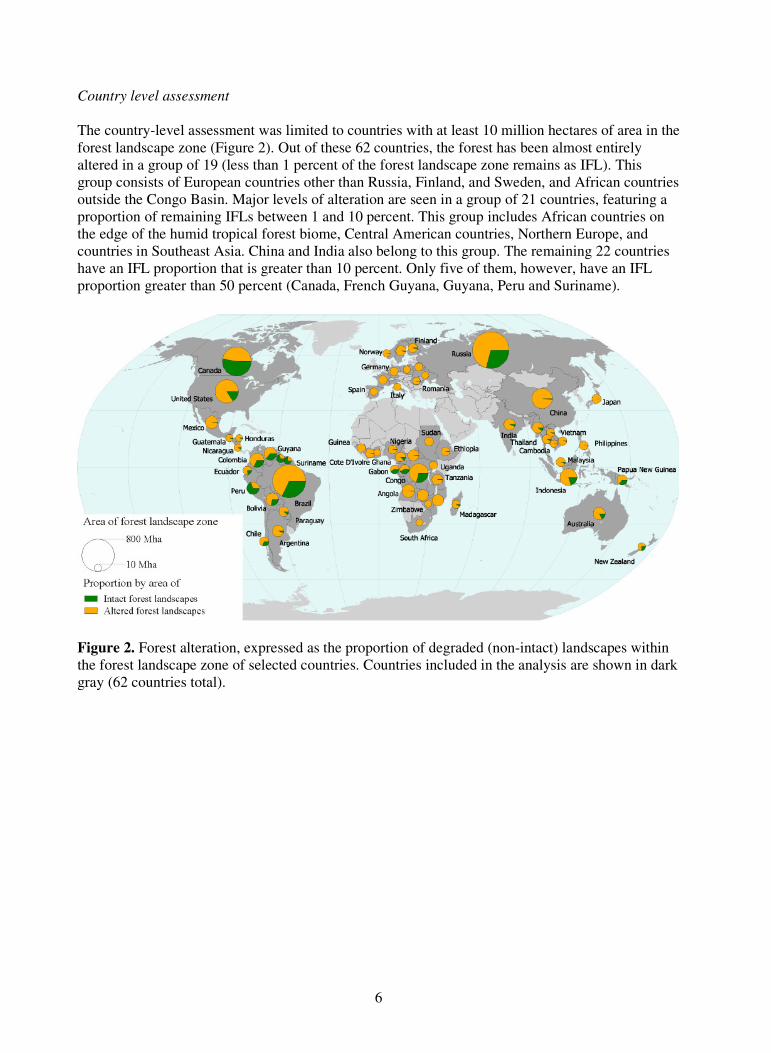
A study of different ecosystem types (closed, open, and non-forest ecosystems) within remaining
IFLs (see Figure 3) reveals two different groups of countries. The first group is made up of
developed countries with industrial forest management, where the densest and most productive
forests have been fragmented, altered by management, or converted to plantations. Outside the
forest management zone where tree canopy density tends to be low most areas remain intact (for
example mountainous regions, wetlands, and the north of the boreal zone).
A different pattern prevails in the second group where accessible forests have been cleared for
agriculture or grazing, while inaccessible tracts of dense forests remain largely intact. The least
degraded dense forests are found among the countries of Central Africa, in Latin America, and in
Papua New Guinea. The large proportion of dense forests within the IFLs of these countries makes
them important repositories of carbon and their degradation (either because of deforestation or
reduction in tree canopy cover) would lead to significant carbon emissions.
Figure 3. Intact forest landscapes in selected countries and their composition by forest canopy
density. Countries included in analysis shown in dark gray (62 countries total).
8
Regional IFL monitoring
A. Africa IFL monitoring 2000-2005
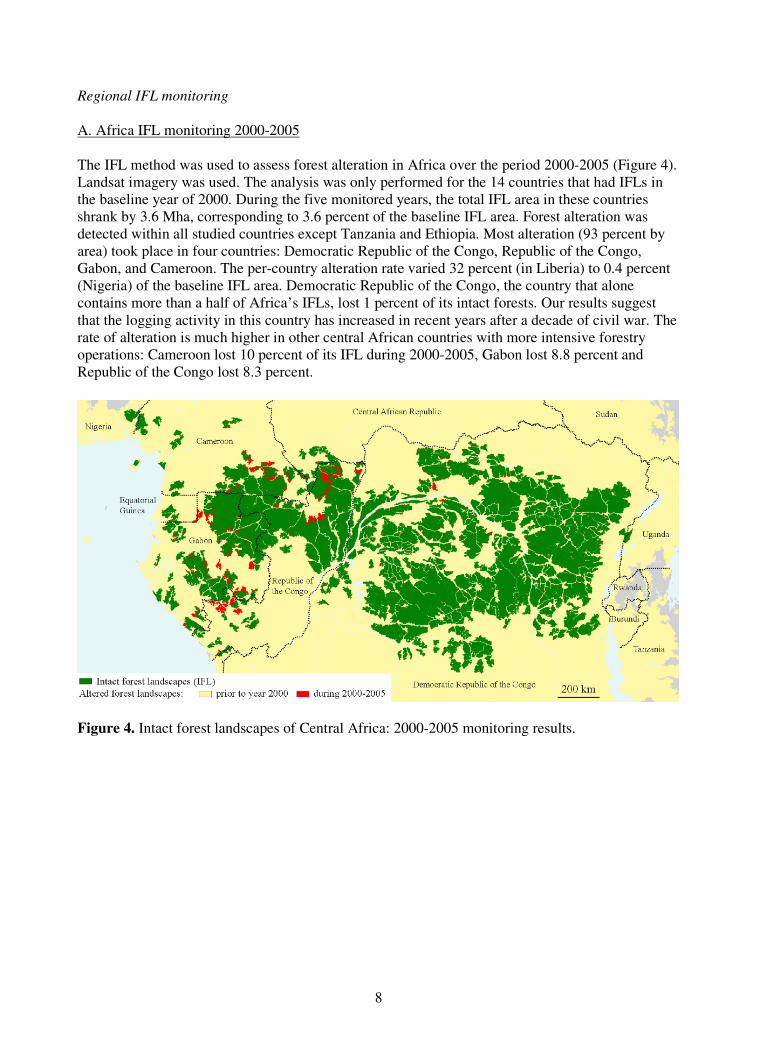
The IFL method was used to assess forest alteration in Africa over the period 2000-2005 (Figure 4).
Landsat imagery was used. The analysis was only performed for the 14 countries that had IFLs in
the baseline year of 2000. During the five monitored years, the total IFL area in these countries
shrank by 3.6 Mha, corresponding to 3.6 percent of the baseline IFL area. Forest alteration was
detected within all studied countries except Tanzania and Ethiopia. Most alteration (93 percent by
area) took place in four countries: Democratic Republic of the Congo, Republic of the Congo,
Gabon, and Cameroon. The per-country alteration rate varied 32 percent (in Liberia) to 0.4 percent
(Nigeria) of the baseline IFL area. Democratic Republic of the Congo, the country that alone
contains more than a half of Africa’s IFLs, lost 1 percent of its intact forests. Our results suggest
that the logging activity in this country has increased in recent years after a decade of civil war. The
rate of alteration is much higher in other central African countries with more intensive forestry
operations: Cameroon lost 10 percent of its IFL during 2000-2005, Gabon lost 8.8 percent and
Republic of the Congo lost 8.3 percent.
Figure 4. Intact forest landscapes of Central Africa: 2000-2005 monitoring results.
9
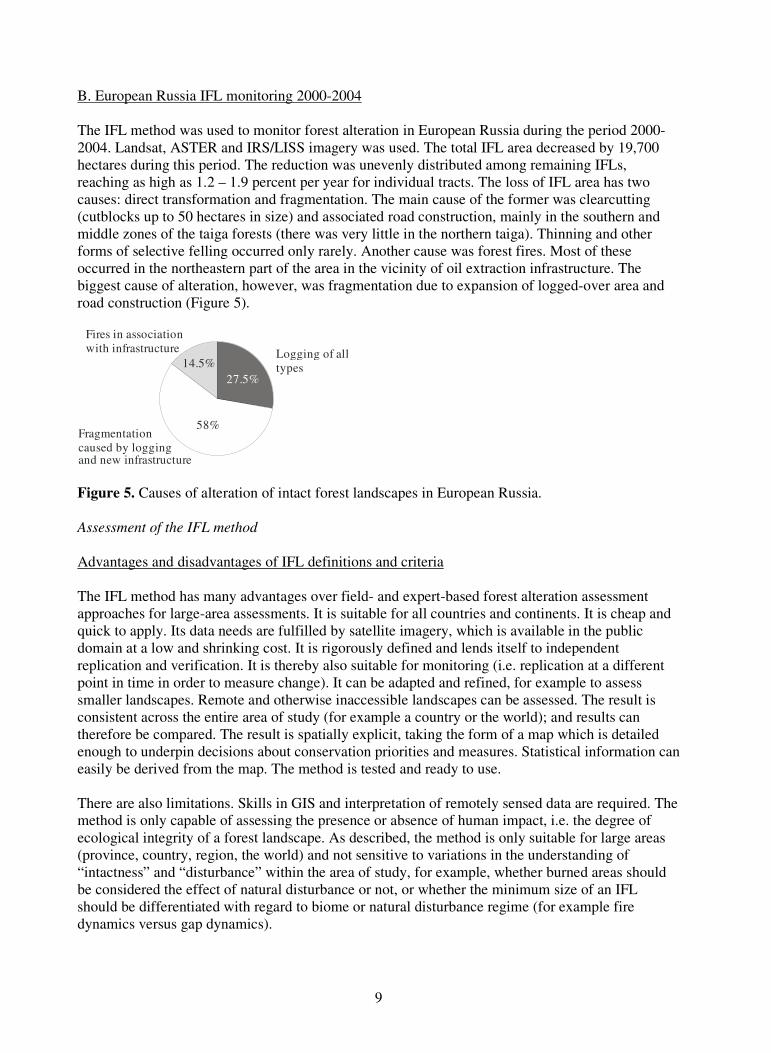
B. European Russia IFL monitoring 2000-2004
The IFL method was used to monitor forest alteration in European Russia during the period 2000-
2004. Landsat, ASTER and IRS/LISS imagery was used. The total IFL area decreased by 19,700
hectares during this period. The reduction was unevenly distributed among remaining IFLs,
reaching as high as 1.2 – 1.9 percent per year for individual tracts. The loss of IFL area has two
causes: direct transformation and fragmentation. The main cause of the former was clearcutting
(cutblocks up to 50 hectares in size) and associated road construction, mainly in the southern and
middle zones of the taiga forests (there was very little in the northern taiga). Thinning and other
forms of selective felling occurred only rarely. Another cause was forest fires. Most of these
occurred in the northeastern part of the area in the vicinity of oil extraction infrastructure. The
biggest cause of alteration, however, was fragmentation due to expansion of logged-over area and
road construction (Figure 5).
Logging of all
types
Fragmentation
caused by loggingand new infrastructure
58%
Fires in association
with infrastructure
14.5%
27.5%
Figure 5. Causes of alteration of intact forest landscapes in European Russia.
Assessment of the IFL method
Advantages and disadvantages of IFL definitions and criteria
The IFL method has many advantages over field- and expert-based forest alteration assessment
approaches for large-area assessments. It is suitable for all countries and continents. It is cheap and
quick to apply. Its data needs are fulfilled by satellite imagery, which is available in the public
domain at a low and shrinking cost. It is rigorously defined and lends itself to independent
replication and verification. It is thereby also suitable for monitoring (i.e. replication at a different
point in time in order to measure change). It can be adapted and refined, for example to assess
smaller landscapes. Remote and otherwise inaccessible landscapes can be assessed. The result is
consistent across the entire area of study (for example a country or the world); and results can
therefore be compared. The result is spatially explicit, taking the form of a map which is detailed
enough to underpin decisions about conservation priorities and measures. Statistical information can
easily be derived from the map. The method is tested and ready to use.
There are also limitations. Skills in GIS and interpretation of remotely sensed data are required. The
method is only capable of assessing the presence or absence of human impact, i.e. the degree of
ecological integrity of a forest landscape. As described, the method is only suitable for large areas
(province, country, region, the world) and not sensitive to variations in the understanding of
“intactness” and “disturbance” within the area of study, for example, whether burned areas should
be considered the effect of natural disturbance or not, or whether the minimum size of an IFL
should be differentiated with regard to biome or natural disturbance regime (for example fire
dynamics versus gap dynamics).
10
A significant limitation of the method as presented here is that it exclusively measures the extent of
alteration without being sensitive to its intensity.
The method can be modified to become more sensitive to the intensity of alteration by introducing
more classes into the measuring scale. The scale for human influence can be refined by adding
classes that are less strict in terms of what triggers the exclusion of an area, and the patch size
threshold can also be further differentiated, for example by inclusion of smaller areas (“fragments
of intactness”), thereby making the method more suitable for assessment of small landscapes (Lee
et al., 2006, Mollicone et al., 2007).
It is also technically possible to go from a “seamless” assessment to a “quilt” assessment by
allowing different criteria to be used in different biomes or countries. A price for this must be paid,
however, in terms of loss of consistency and comparability across the area of study. We propose
using the presented set of criteria for the global forest alteration analysis, while regional-based
criteria can be developed and used for national or biome/ecoregion level assessments if needed.
Data issues, methods and accuracy
The IFL method was specifically designed to utilize satellite imagery as the main source of
information. This makes it possible to assess large, even inaccessible, landscapes at a low cost and a
short time. Suitable historical satellite images (Landsat) are available in public archives since
approximately 1980, making retrospective assessments possible. The availability and technical
quality of satellite images are gradually improving, while the price is gradually going down. The
IFL method must be regarded as highly cost-effective in relation to the size of the area assessed.
Monitoring of change takes significantly less time and resources than the initial baseline mapping,
as only IFLs that have already been mapped need to be re-assessed. The main data source is visually
interpreted satellite imagery of high and medium resolution. The regional monitoring studies
presented above suggest that visual interpretation can be effective for rapid and effective re-
assessment of IFLs across large regions. Unlike automated satellite image analysis approaches,
visual interpretation using our IFL criteria is not sensitive to data gaps (i.e. the use of Landsat SLC-
off data), atmospheric effects and differences among sensors. Such IFL monitoring can be
supplemented (but not replaced) by analysis of automatically derived forest cover change products.
The IFL method is biased towards under-estimation of alteration (overestimating the area of IFLs).
This is because of its basic premise that all landscapes are considered un-degraded until the
opposite can be proven. The method may fail to register human influence that is difficult to detect in
satellite imagery, such as selective logging, small-scale slash-and-burn agricultural practices, and
hunting (for example poaching in Central Africa).
The accuracy of the result benefits from field verification in cases when the interpretation of
available satellite imagery is unclear (for example due to poor imagery), when the evidence of
human influence is difficult to classify (for example when it is diffuse rather than distinct), or when
a landscape is subject to human influence which is invisible from space (for example because it is
small scale or happening under the canopy of tree crowns). There is a certain degree of subjectivity
in determining IFL boundaries across transition zones from intact to disturbed areas, especially
within non-forest territories, savannas, woodlands, and in mountain areas. Resources for field work
should be focused on verifying the interpretation at important points of unclarity, rather than on a
random or systematic sampling. The method is capable of generating useful results without field
verification if applied by experienced analysts with expert knowledge of the landscape they are
assessing.
11
4. Conclusions
The IFL method provides a cost-effective way to assess the degree of human influence across a
large forest landscape (for example a country or the world). The result is a map that shows the
precise location and boundaries of intact forest landscapes, i.e. the remaining patches of un-altered
land in the forest landscape zone. The map provides a guide for policy-making and priority setting
as well as a baseline for monitoring by recurrent application of the IFL method to remaining intact
forest landscapes. The distinction between intact and non-intact forests used here is consistent with
experience from satellite-based deforestation measurements and can be used to provide important
background data for accounting of carbon loss from forest alteration.
The method can be refined to become more sensitive to the intensity of alteration without changing
its logic or data requirements, thus enabling it to measure degrees of alteration.
The method will benefit from improvements in the quality, price, and public access of satellite
images, as it is designed to use satellites as the main source of data. The effect of such
improvements will be particularly strong in the humid tropics where persistent cloudiness makes
image acquisition difficult.
In the context of REDD (Reduction of Deforestation and Degradation in Developing Countries),
IFLs are strongly associated with issues of permanence, biodiversity, and indigenous peoples.
Countries that wish to make an early commitment under REDD that is capable of being monitored,
verified, and reported may therefore find that the IFL Method offers interesting opportunities. It
should also be of interest for global monitoring of forest degradation, for example within the Forest
Resources Assessment.
The usefulness of the method can be expanded through at least three types of measures:
− Capacity building. The method requires from an analyst a combination of two types of
expertise: experience in satellite images interpretation and GIS, and knowledge about forest
ecology and management. This combination is still rare, particularly in developing countries.
Concerted training efforts can certainly help in this regard.
− Transparency and review of results. The results of the IFL Method are relatively easy to
communicate and understand because they can be articulated on maps. These maps need to be
reviewed by regional and local experts as well as by relevant stakeholders but the logistical
challenges for a paper based review process are prohibitive, particularly for a regional or global
assessment. Fortunately it is possible to let reviewers access the maps and provide feedback via
the Internet. Development of a web-based platform for transparency and review is therefore
needed.
− Funding for development and application. The IFL method has been developed thanks to
financial contributions from corporations and foundations in the private sector. Government
engagement in the further development and application of the method would be extremely
beneficial.
The authors envision that the global IFL map will be periodically updated and improved to reflect
changes due to alteration, degradation and deforestation. The continual improvement of satellite-
borne sensors and analytical techniques will gradually reduce the necessary effort. A continuous
external review process has been organized on a dedicated web site (http://www.intactforests.org ).
12
References
Aksenov, D., Dobrynin, D., Dubinin, M., Egorov, A., Isaev, A., Karpachevskiy, M.,
Laestadius, L., Potapov, P., Purekhovskiy, A., Turubanova, S., & Yaroshenko, A. 2002. Atlas
of Russia’s intact forest landscapes. Global Forest Watch, Moscow, Russia. URL:
http://www.globalforestwatch.org/common/russia/Atlas_report_pdfs/Cover-032.pdf
Gutman, G., Byrnes, R., Masek, J., Covington, S., Justice, C., Franks, S., & Headley R. 2008.
Towards monitoring land-cover and land-use changes at a global scale: The global land survey
2005. Photogrammetric Engineering & Remote Sensing, 74(1): 6–10.
Hansen, M.C., DeFries, R.S., Townshend, J.R.G., Carroll, M., Dimiceli, C., & Sohlberg R.A. 2003. Global percent tree cover at a spatial resolution of 500 meters: First results of the MODIS
vegetation continuous fields algorithm. Earth Interactions, 7:1-15. [online] DOI: 10.1175/1087-
3562(2003)007
Lee, P., Aksenov, D., Laestadius, L., Nogueron, R., & Smith, W. 2002. Canada’s large intact
forest landscapes. Global Forest Watch Canada, Edmonton, Canada. URL:
http://www.globalforestwatch.org/english/canada/pdf/Canada_LIFL-Text_Section.pdf
Lee, P., Gysbers, J.D, & Stanojevic, Z. 2006. Canada’s forest landscape fragments: A first
approximation. Global Forest Watch Canada, Edmonton, Canada.
Mollicone, D., Achard, F., Federici, S., Eva, H.D., Grassi, G., Belward, A., Raes, F., Seufert, G., Stibig, H.-J., Matteucci, G., &. Schulze, E.-D. 2007. An incentive mechanism for reducing
emissions from conversion of intact and non-intact forests. Climatic Change, 83: 477–493.
Potapov P., Yaroshenko, A., Turubanova, S., Dubinin, M., Laestadius, L., Thies, C., Aksenov,
D., Egorov, A., Yesipova, Y., Glushkov, I., Karpachevskiy, M., Kostikova, A., Manisha, A.,
Tsybikova, E., & Zhuravleva, I. 2008. Mapping the world's intact forest landscapes by remote
sensing. Ecology and Society, 13(2) URL: http://www.ecologyandsociety.org/vol13/iss2/art51/
Strittholt, J.R., Nogueron, R., Alvarez, M., & Bergquist, J. 2006. Mapping undisturbed
landscapes in Alaska. World Resources Institute, Washington, DC. URL:
http://www.globalforestwatch.org/english/us/pdf/GFW-Alaska_report_final.pdf
Tucker, C.J., Grant, D.M., & Dykstra, J.D. 2004. NASA's global orthorectified Landsat data set.
Photogrammetric Engineering and Remote Sensing, 70: 313-322.
Yaroshenko, A.Y., Potapov, P.V., & Turubanova, S.A. 2001. The last intact forest landscapes of
northern European Russia. Greenpeace Russia and Global Forest Watch, Moscow. URL:
http://www.globalforestwatch.org/english/russia/pdf/GFW_Russia_Report_en.pdf


![Monitoring Forest Cover Change and Fragmentation Using ...[20]. Landsat data have been mostly used for determining forest cover and measuring forest cover changes and the rate of change](https://img.pdfslide.us/doc/110x75/5ea79059fe19d968e27f998e/monitoring-forest-cover-change-and-fragmentation-using-20-landsat-data-have.jpg)