Embed Size (px)
Citation preview

i
Forest Resources Assessment Working Paper 163
CASE STUDIES ON MEASURING AND ASSESSING
FOREST DEGRADATION
FOREST DEGRADATION IN NEPAL:
REVIEW OF DATA AND METHODS
K. P. ACHARYA
R.B. DANGI
ii
Sustainably managed forests have multiple environmental and socio-economic functions which are important
at the global, national and local scales, and they play a vital part in sustainable development. Reliable and up-
to-date information on the state of forest resources - not only on area and area change, but also on such
variables as growing stock, wood and non-wood products, carbon, protected areas, use of forests for
recreation and other services, biological diversity and forests’ contribution to national economies - is crucial
to support decision-making for policies and programmes in forestry and sustainable development at all
levels.
Under the umbrella of the Global Forest Resources Assessment 2010 (FRA 2010) and together with
members of the Collaborative Partnership on Forests (CPF) and other partners, FAO has initiated a special
study to identify the elements of forest degradation and the best practices for assessing them. The objectives
of the initiative are to help strengthen the capacity of countries to assess, monitor and report on forest
degradation by:
� Identifying specific elements and indicators of forest degradation and degraded forests;
� Classifying elements and harmonizing definitions;
� Identifying and describing existing and promising assessment methodologies;
� Developing assessment tools and guidelines
Expected outcomes and benefits of the initiative include:
� Better understanding of the concept and components of forest degradation;
� An analysis of definitions of forest degradation and associated terms;
� Guidelines and effective, cost-efficient tools and techniques to help assess and monitor forest
degradation; and
� Enhanced ability to meet current and future reporting requirements on forest degradation.
The Global Forest Resources Assessment programme is coordinated by the Forestry Department at FAO
headquarters in Rome. The contact person is:
Mette Løyche Wilkie
Senior Forestry Officer
FAO Forestry Department
Viale delle Terme di Caracalla
Rome 00153, Italy
E-mail: [email protected]
Readers can also use the following e-mail address: [email protected]
More information on the Global Forest Resources Assessment programme can be found at:
www.fao.org/forestry/fra
The coordinators of this work would like to acknowledge the financial contributions made by the
Governments of Finland and Norway and by FAO, the GEF BIP programme and ITTO.
DISCLAIMER
The Forest Resources Assessment (FRA) Working Paper Series is designed to reflect the activities and
progress of the FRA Programme of FAO. Working Papers are not authoritative information sources – they
do not reflect the official position of FAO and should not be used for official purposes. Please refer to the
FAO forestry website (www.fao.org/forestry ) for access to official information.
The FRA Working Paper Series provides an important forum for the rapid release of information related to
the FRA programme. Should users find any errors in the documents or would like to provide comments for
improving their quality they should contact [email protected].

iii
Forestry Department Food and Agriculture Organization of the United Nations
Forest Resources Assessment Working Paper
Case Studies on Measuring and Assessing
Forest Degradation
Forest Degradation in Nepal:
Review of Data and Methods
K. P. Acharya
R.B. Dangi
December, 2009
________________________________________________________________ Forest Resources Assessment Programme Working Paper 163
Rome, Italy, 2009

iv

v
Abstract
Forests provide a wide range of provisioning, regulating, cultural and supporting services for human
well being collectively known as ecosystem services. The sustainability of forest ecosystems
depends on sustained management, efficient utilization and effective protection measures against
deforestation and forest degradation. Present global discussions on forest degradation have been
focused on reduction of emissions from source and removal of enhancement from the sink i.e.
carbon services. In Nepal, the role of other ecosystem services such as water harvesting, soil
conservation, biodiversity conservation are also equally important for sustaining rural livelihoods
and maintaining environmental condition. Hence, it is imperative to develop common understanding
on forest degradation among the forest users, professionals, policy makers, and the politicians. This
will be helpful developing appropriate public policy to address the problem of forest degradation.
This paper aims to review the past forest resource assessments, methodologies and findings on
forest degradation. The study observed that differentiation on forest quality was recognized since
the first forest resources assessment in the early 1960s. Similarly, all forest resource assessments
have identified criteria and indicators for capturing forest degradation. Forest degradation has been
understood as reduction in production capacity of commercial timber volume. Change in tree
canopy cover was used as a key criterion in assessments. Degradation was assessed through canopy
closure, tree density, regeneration capacity, stand maturity, lopping, species dominancy, grazing,
and soil surface erosion. Forest with no well defined stems has been defined as a shrub land which
increased at a rate of 5.57 percent per year from 1978/79 to 1994. The assessment methodologies
include field survey, satellite images, aerial photography, ground checks or a combination of these.
Finally the paper concludes by offering potential methods for assessing forest degradation in Nepal.
These assessments focused on investigating the association of canopy cover with the commercial
timber volume. This approach neither recognizes ongoing degradation within the dense canopy
forests nor the under storey degradation. In addition, the trade off of different kinds of ecosystem
services was not considered. The use of satellite images with field survey could be a suitable
approach for assessing forest degradation based on the resultant outcomes of all kinds of forest
ecosystem services. A participatory valuation approach using Ecosystem Service Index (ESI) to
assess forest degradation is recommended rather than accounting of individual services. Finally, the
paper argues that the scale of forest services should be understood comprehensively to prevent the
emergence of new drivers of degradation. Hence, forest degradation should be understood as the
reduction in the capacity of forests to produce ecosystem services.
Keywords: Forest, shrub, degradation, method, ecosystem valuation

vi

1
1. Introduction
Forests are an integral part of the farming system in Nepal. Farmers must have access to forest
products such as leafy biomass for fodder and animal bedding, fuel wood for energy, and timber for
building and agricultural implements (Mahat, 1987; Gilmour and Fisher, 1991; Malla, 2000). In the
high altitude Jumla area, it was estimated that maintaining of one hectare (ha) of paddy land
requires up to 50 ha of forest and grazing land (Whitemand, 1980). Similarly, for middle hills,
Wyatt-Smith (1982) estimated a requirement of 3.5 ha of forest to maintain one ha of agricultural
land. In the whole country, fuel wood derived from forest constituted 84 percent of the total energy
consumed in 2006/07 (WECS, 2006). Similarly, about 42 percent of the fodder requirement for
livestock production is derived from the forests (WECS, 2006; Pandey, 1982). In addition, a
number of forest resources such as high value medicinal and aromatic plants are facing excessive
and unsustainable harvest pressure and degradation (MoEST, 2008). The forestry sector contributes
9.45 percent from direct products and 27.55 percent including indirect services to the national gross
domestic product. On the other hand, over 28 percent of the country’s land is estimated to be in
degraded condition (DFRS, 2008; MoEST, 2008).
The Ministry of Forests and Soil Conservation, Department of Forest Research and Survey (DFRS)
and Government of Nepal have carried out a number of forest resource assessments since the 1960s.
The resource assessment ranges from national level to community level. These inventories differ in
objectives and methodology. The paper reviewed strategic level forest inventories from Nepal. In
addition, two economic studies in Nepal were evaluated. This paper aims to discuss major findings
of different methodologies used and to offer a potential approach that could be utilised for assessing
forest degradation.
The next part of this section presents a brief review on the forest assessment studies conducted in
the past indicating linkages with the thematic elements of sustainable forest management. Section 2
begins with an examination of methodologies, criteria and indicators used for assessing forest
degradation. Section 3 focuses on results of different assessments; it describes the advantages and
disadvantages of various methodologies with respect to cost and accuracy of information. The
discussion section highlights the lesson learned in relation to the drivers of degradation and
detectability of the methods used. It further discusses appropriate methods for assessing forest
degradation such as Ecosystem Service Index (ESI). The paper concludes with a recommendation
that forest degradation should be understood as resultant outcomes of the different services
available from the forest.
Forest resource assessment in Nepal
1. Forest Resources Survey Office (FRSO)1963/64
The forest resource survey office conducted the first forest inventory during the period of 1963-67
using 1953-58 and 1963-64 aerial photography. It used visual interpretation of aerial photographs
and mapping combined with field inventory. The land categories include forest, crop, grass, urban,
water, badly eroded and barren lands. The forest land was subdivided into commercial and non-
commercial forest (HMG 1961; 1969; 1973). The inventory was concentrated only on assessing
extent of forest area, growing stock/ha up to 10 cm top diameter. It does not cover high altitude
forests areas.

2
2. Land Resource Mapping Project (LRMP)1978/79
The LRMP was jointly implemented by the Government of Nepal and Kenting Earth Sciences
Limited Canada with financial support from the Government of Canada. The objectives were to
develop appropriate forest land use maps based on forest types, composition, structure and land
degradation status. The project was implemented during 1977 to 1884 (LRMP 1985; 1986). The
forest resource assessment was made through the combined use of aerial photographs (1977-79),
extensive ground truth checks by helicopter, land surveys and topographic maps.
3. Master Plan for the Forestry Sector (MPFS)1986
The Master Plan for the Forestry Sector (MPFS) was implemented by the Ministry of Forests and
Soil Conservation. The data were based on LRMP information and forest inventory data from
Forest Survey and Research Office (MPFS 1989a; MPFS 1989b). The aim was to update resource
information changes that occurred during the intervening period of LRMP.
4. National Forest Inventory (NFI)1994
The National Forest Inventory (NFI) was started in the early 1990s and completed in 1998 with a
base year of 1994. The programme was implemented by the DFRS with support from the
Government of Finland. The NFI used satellite image analysis - Landsat, aerial photographs and
field measurements.
5. Forest Cover Change Analysis of the Terai Districts (DoF) 2005
The study estimated extent of forest cover and annual rate of change of 20 terai districts. It was
commissioned by the Department of Forests. The forest cover change was estimated by analysing
satellite images of different time periods, supported by ground verification (DoF 2005).
6. Economic Valuation of Ecological Goods and Services (ESE) 2005
The study was commissioned by the Ministry of Forests and Soil Conservation, Government of
Nepal. The study estimated the value of goods and services of forest ecosystems representing
different ecological zones and management regimes (MoFSC 2005). However, the study could not
cover all the ecological regions.
7. Contribution of Forestry Sector to Gross Domestic Product in Nepal (GDP) 2008
The DFRS conducted this study to estimate the actual contribution of forestry sector in national
GDP. Both, use and non-use values had been taken in to consideration in estimating the
contribution. The use values include consumptive goods like timber, fuel wood,
grass/fodder/bedding materials, NTFPs, sand and boulders. Similarly, non use value includes
recreation, eco-tourism, soil conservation and green carbon sequestration (DFRS 2008).
Resource Assessment and the thematic elements of Sustainable Forest Management
A summary of major resource assessment studies and their linkages with thematic elements of
Sustainable Forest Management (SFM) is presented in Table 1. The information reveals that not all
elements of SFM were covered in these measurements. The table shows that resource assessments
were focused to investigate extent of forest area and estimation of timber volume. Two recent
economic studies on the valuation of forest services have added carbon, biodiversity and protective

3
function of the forests in assessments. The forest health and vitality has yet to be considered in the
assessment.
Table 1: Strategic level forest assessment in Nepal and SFM linkages
S.N. Study Year Responsible
Organisation SFM thematic
element 1. Forest Resources Survey 1974 FRSO(DFRS) 1, 5
2. Land Resource Mapping Project 1978/79 LRMP/WECS 1, 5
3. Master Plan for the Forestry Sector 1986 MoFSC/DFRS 1, 5, 7
4. National Forest Inventory 1994 DFRS 1, 5
5. Forest Cover Change Analysis of the Terai Districts 2005 DoF 1
6. Economic Valuation of Ecological Goods and
Services
2005 MoFSC 2, 4,5, 6, 7
7. Contribution of Forestry Sector to Gross Domestic
Product in Nepal,
2008 DFRS 2, 4, 5, 6, 7
Thematic elements of sustainable forest management are. 1. Extent of forest resources; 2. Contribution to the Carbon cycle, forests
and climate change; 3. Forest health and vitality; 4. Biological diversity; 5. Productive functions of forests; 6. Protective functions of
forests; and 7. Socio-economic functions of forests. (Source: FAO 2009)
2. Assessment Methodology
Assessment and tools
It is commonly agreed that measuring forest degradation is more complex and difficult than
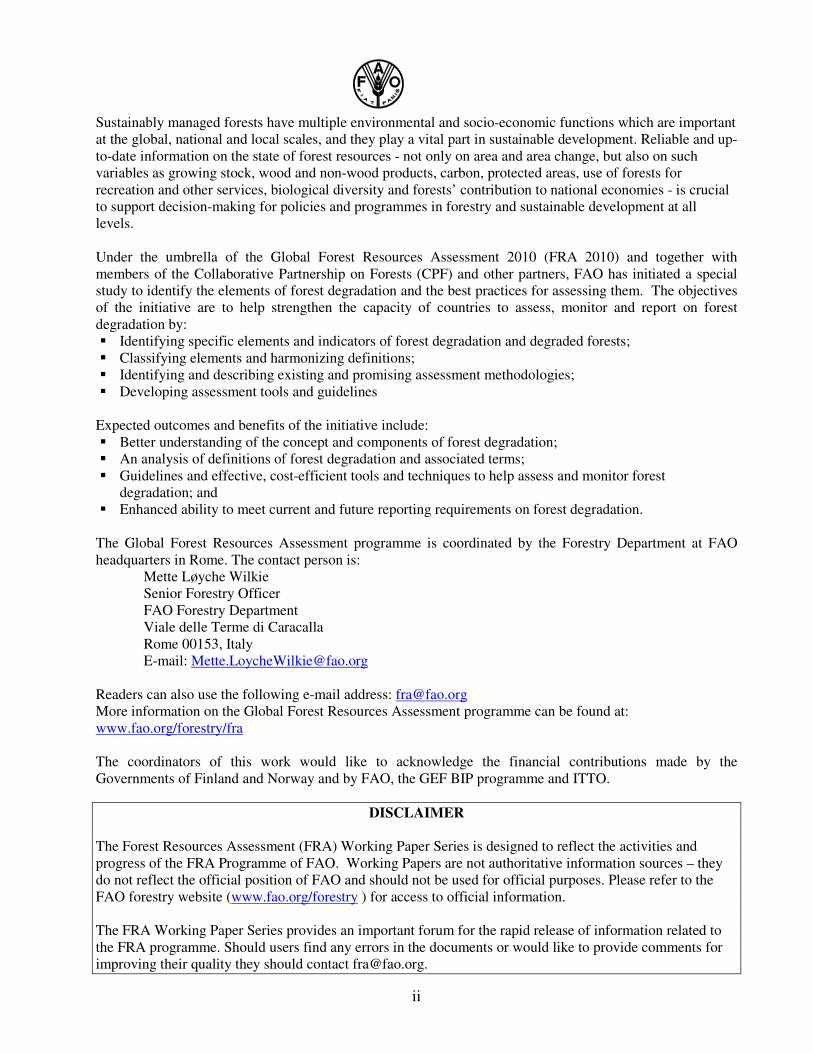
deforestation (Panta et al., 2008; Lambin, 1999; Souza et al., 2003). Table 2 summarises the criteria
and methods used in defining and assessing forest degradation. The table reveals that all reviewed
assessments have accepted differences in forest quality. The tree canopy stocking level was found to
be the main criterion used in all assessment. Hence, common acceptance on forest degradation of a
forest in these assessments is the reduction in production capacity of timber volume. The stocking
level was linked with forest productivity. Proxies used include canopy closure, number of mature
trees, the number of preferred trees, density, cut stump, growing stock, regeneration capacity, stand
maturity, lopping, species composition, grazing, and soil surface erosion.
The table shows that 10 percent canopy cover was used to distinguish forest and non-forest areas.
However, there was confusion among the definition of forest and shrub land, shrub lands and scrub,
forest and degraded forests. The most commonly used indicators are crown closure and number of
regeneration sized trees per unit areas. In addition, some qualitative indicators such as lopping and
encroachments were considered as a factor for degradation.
Table 2: Review on methodology of forest assessment studies
Study Degradation
criteria
Indicators Methods Procedure
1. FRSO Stocking
class (Crown
cover <10 %
as a non
forest area)
and density
class)
Scrub and
shrub
• Crown closure and number of
reproduction size trees/ha (well
stocked- >70 % and above 799
reproduction size tree/acre,
Medium 40-69% or 400-699
reproduction size tree/acre; 10-
39 % or 100-399 reproduction
size tree/acre)
• Lands with unmerchantable
tree and shrub species growing
in bush-like clumps.
• Means estimator
• Visual
interpretation of
aerial photographs
• 1:12,000 to
1:60,000 aerial
photographs
• Dot counting
• Area rectification
and adjustment
• Field inventory in
• 1”= 1 mile land use map prepared
using aerial photographs,
• Physiographic regions divided
• Forest, Cropland, Grass, Urban,
Water, Badly eroded and Barren
• Forest subdivided into
commercial/non commercial forest
• Area rectification
• Forest mapping 3”=1 mile
Forest inventory for volume and
growth information
4
Encroached
forest
• Heavy and repeated fuel wood
cuttings
• Lands 10 % or more covered
by tree crown and containing
commercial timbers but
currently being cultivated,
unlikely to remain as forests
• No legitimate ownership
commercial forest
• Systematic grid of 3.2 km x 16.1 km
• Cluster of 5, 800 m² rectangular plot
• Stumps recorded with species & size
• Location of measured trees mapped
• 5 circular sub-plots of 5.27 ft radius
used to record reproduction and
dominant crown cover.
• Conifer growth estimated by borings
2. LRMP Stand
stocking
Soil surface
erosion
• Crown density is % of ground
area covered by tree crowns as
viewed on the photograph or
from air (Crown density < 10
% as non-forest, crown cover
<40 % with an average of
25%)
• Few scattered trees
• Grazing -number of livestock
• Forest fire
• Visual
interpretation of
aerial photographs
(black and white
1: 20,000 to
1:50,000)
• Ground truth
checks by
helicopter
• Land surveys
• Topographic maps
• Land utilisation classification in 4
physiographic regions
• Aerial and ground reconnaissance
• Forest reconnaissance, ground check
• Forest, cultivated, grass lands, shrub
lands and other lands,
• Forest classification
• Interpretation and typing
• Topographic maps and transferring,
• Field work and data collection
• Drafting, planimetry & compilation
3. MPFS Crown
closure
Regeneration
• 10 to 40 % under stocking or
degraded
• 10 to 40 % crown closure or, if
immature containing 250 to
999 regeneration sized trees/ha
• If immature containing 999 or
less regeneration sized trees/ha
• Stands with mature or over
mature trees
• Desk review
• Visual
interpretation of
aerial photographs
and field
verification
• Creation of data base from LRMP
and FSRO research plots, five
physiographic regions
• Field verification using aerial
photographs
• Modelling to update information
4. NFI Crown cover
- stand
density
• <10% crown cover or well
defined stems not found
• Satellite images,
GIS, topographic
maps, vector data-
boundary
• Ground based
inventory
• Visual
interpretation of
aerial photographs
of scale 1:50,000
• Land use categories, forest & shrub
• Forest area into reachable, non
-reachable and encroached, field
verification, data transfer manually
onto planimetric sheets, digitisation
• Development regions separation
• Satellite image analysis - Landsat
TM, NDVI used
District Forest, Churiya forest and
remaining hills districts inventory
• Photo point sampling, two stage
cluster designing, 4x4 km, manual
transfer, stereoscope for land use
5. DoF Crown cover
• Degraded forest means
sparsely distributed trees or
forest land with < 10 % crown
cover including shrub
• GIS, Satellite
images analysis
and ground
verification
• Satellite image analysis and field
verification
• Landsat TM 1990/91 and 2000/01
• Districts level outputs
6. ESE Crown cover
Use value of
ecosystem
services
• <10 % crown cover as
degraded forest or shrub land
• Forest inventory
• Questionnaires
• Market price
• Market price of
substitutes
• Benefits transfer
• Total net stock
• Terai, siwaliks and middle hills
regions in 12 districts covering Sal,
Terai hardwood, Pine, Sub-temperate
forest and shrub land.
• Community forests, protected area
system and government managed
regimes surveyed
7. GDP Crown cover
• <10 % crown cover and shrub
as degraded forest
• Ground based
forest inventory
• Questionnaire
• Market price
• Market price of
substitutes
• Benefits transfer
• Total net stock
• High-Hills, Mid-Hills & Terai regions
• Sal, Terai Mixed Hardwood, Khair/
Sissoo, Lower Slope Mixed
Hardwood, Chir pine, Upper Slope
Mixed Hardwood, Oak /
Castanopsis and others forest types,
• Management regimes – Leasehold,
Government managed, Religious,
Community & protected areas.

5
3. Results
Table 3 highlights the extent of forest and shrub categories while more details are presented in
Annex 1. The FRSO survey recognised the forest quality differentiation primarily based on stand
size, density classes, crown closure, merchantable volume, although, there is no clear definition and
assessment of forest degradation. It was characterised by fewer number of trees, lopped trees,
unwanted species (i.e. not commercial tree species), heavy grazing pressure, unpalatable species,
and bushy species. However, it has identified encroached forest as a kind of degraded forest.
Table 3: Extent of forest and shrub land cover in Nepal
Table 4: Estimation of forest degradation rate in terms of increase in shrub land
Shrub land Study Year
Area 000 ha %
Forest degradation % per year
(1978/79 to 1994)
LRMP 1978/79 689 4.7
NFI 1994 1,560 10.6
5.57
Tables 3 and 4 revealed that the total forest area has not changed very much, although the forest
cover has been degrading. Table 3 shows that shrub was not included as a separate land use
category until LRMP, since then it is one of the important land use categories. From the definition
of shrub land (DFRS, 1999) and the above tables, it is clear that shrub lands are those forest areas
from where tree stems were removed but the area still meets other criteria of forests such as canopy
closure. It leads to a conclusion that shrub land is an outcome of forest degradation or is a kind of
degraded forest. The forest and shrub area analysis (DFRS, 1999) result is presented in Box 1.
Box 1: Forest and shrub area results
• Forest covers 29 % and shrub covers 10.6%, both forest and shrub together cover 39.6%.
• In Terai plains, forest area has decreased at annual rate of 1.3% from 1978/79 to 1990/91.
• In the Hilly Area, forest area has decreased at an annual rate of 2.3% from 1978/79 to 1994, whereas
forest and shrub together have decreased at annual rate of 0.2%.
• In the whole country, from 1978/79 to 1994, forest area has decreased at an annual rate of 1.7%,
whereas forest and shrub together have decreased at an annual rate of 0.5%.
Box 1 indicates that deforestation and degradation have been understood in terms of forest and
shrub areas. A comparison of NFI with LRMP shows that the area under shrub land increased by
126 percent during 1978/79 to 1994 or at a minimum rate of 5.57 percent per year. However, the
result shows that there is no substantial change in the total of forest and shrub land area. The
degradation estimate does not include the degradation that remains within the forest category i.e.
Forest
Shrub
Forest and Shrub total
Study Year
Area ‘000 ha % Area ‘000 ha % Area ‘000 ha %
1. FSRO 1964 6,402 45.5 - - 6,402 45.5
2. LRMP 1978/79 5,616 38.1 689 4.7 6,285 42.8
3. MPFS 1985/86 5,424 37.4 706 4.8 6,210 42.2
4. NFI 1994 4,268 29 1,560 10.6 5,828 39.6

6
above 10 percent crown cover. The DoF (2005) definition on degraded forest also includes shrub
land as a part of degraded forests. Other elements among different inventories are less comparable
due to different definition and coverage.
Degradation assessment methods
The methodologies used in past assessments can be grouped into Aerial Photography, Field Survey,
Satellite Image and Ecosystem Service Valuation. The following table compares the strengths and
weakness among these methodologies and accuracy level. In the table, the analysis indicates that
forest degradation assessment accuracy increases if it is supported by the ground based information.
Table 5: Relevancy of different forest degradation assessment methodologies in Nepal (Based on
Photographs 1:12,000 to 1: 60,000 and Landsat TM images experiences) Methodology Advantageous Disadvantageous Accuracy
level
Costs Implications
for Nepal Aerial
photography • Easy to understand to
local community
• Visible to
demonstrate forest
degradation such as
crown cover change,
shifting cultivation,
forest fragmentation
• Long experience
• Infrastructure exits
• Require low input on
technology
• Difficulty in mountain area
• High costs,
• High time requirement,
• Nearly abandoned and
replaced by new technologies.
• No latest aerial photographs
available
• Degradation elements such
as grazing, fire damage, forest
NTFPs and understorey
damage, encroachment is not
completely detectable
High High No recent aerial
photographs
available - less
useful
Field survey • Data available for
comparison
• More accurate,
• Widely understood,
• Cheap labour
• Considerable
experience
• Simple technology
• Capture all kinds of
ecosystem services
• National to local scale
possible
• Scattered case study
and academic, research
data available
• More resources,
• Long time requirement
• Difficult in mountain
terrain
• No recent data available
High
(Std. Error
for the top 4
“volume
ranged from
2.61% to
6.66 %).
Medium Considerable
experience
exists, labour is
cheap- still a
good option,
community
involvement is
available,
proposed
FINNIDA
assistance
survey will
generate new
data
Satellite image
analysis and
GIS
• Global uniformity
• Rapidly advancing
technology
• Easy interpretation in
high resolution images
• High resolution
images usable as a map
for demonstration
• Requires low forest
inventory
• Technical capacity and
infrastructure demanding,
• Cloud, shadow and slope in
hilly areas,
• Few control plots for ground
verification,
• Seasonal images
availability,
• Limited data to replace
ground inventory
• Difficult to assess under
storey including NTFPs.
Medium to
high
(67 to 98%
to
distinguish
in different
stocking
class)
Free to
moderately
expensive
(Landsat
to
IKONOS)
Low or
medium
Difficult terrains
support it. Needs
capacity
development, if
combined with
field survey, is
one of the best
option
Ecosystem
service
valuation
• Recognizes broader
value of forest
ecosystem
• Technically demanding
• Outside forestry discipline
Medium to
High
Low to
Moderate
Community
participation,
true valuation of
forest services.

7
4. Discussion
Nepal has a substantial experience on ground based forest inventory which has established
considerable data sources. However, inventories seem to be focused to investigate commercial
timber volume of the forest and not designed for forest degradation assessment in particular.
Further, compared with forest inventory, recent economic studies are much wider, incorporating
concepts of ecosystem services. The average rate of forest conversion to shrub land (5.57
percent/year) is significantly higher than deforestation (1.7 percent/year) for the same period of
1978/79 to 1994. It indicates that the forest degradation is more important for countries like Nepal
for carbon emission or ecosystem services accounting. Although the factors responsible for forest
degradation in Nepal are not clearly understood, a list of possible factors and their detectability is
presented in Table 6.
The most commonly used methods are ground based forest inventory, aerial photography, and
satellite image analysis and a combination of these. Crown cover is taken as a proxy of degradation,
which is unable to address forest degradation until it remains as forest or in under storey. Canopy
reduction will reduce biomass but may enhance watershed conservation and carbon removal or
biodiversity. Table 6 shows that under storey loss is also a fundamental way of forest degradation.
Crown cover base assessment alone is unable to account for many of the drivers of degradation.
Similarly, the table reveals that, field survey combined with image analysis will be able to capture
the key degradation elements and their consequences.
The NFI defined shrubland as an area the same as forests but well-defined stems cannot be found.
By contrast the DoF study defined degraded forest to mean sparsely distributed trees or forest land
with less than 10 percent crown cover including shrub. These definitions indicate that shrub land is
a degraded forest. However, in some cases, these studies have used different definition of degraded
forests and shrub lands, creating confusion. Fuzzy boundaries between land cover categories need to
be removed by providing clear, simple and consistent definition for all assessments.
Table 6: Drivers of degradation and detectability of different methods
Detectability (low to high, 1 - 3) Drivers of degradation Level of
significance
Key degradation element
Field
survey
Aerial
Photographs
Images
Fuel wood removal High Biomass, understorey 3 2 1
Timber removal High Crown cover, biomass 3 2 1
Fodder, leaf litter removal High Biomass, understorey 3 2 1
Over extraction of medicinal
& other species
High Understorey, biomass, biodiversity 3 1 1
Encroachment High Crown cover, habitat, biomass,
understorey
3 2 2
Overgrazing High Understorey, soil, habitat 3 1 1
Development activities- Road High Crown cover, habitat, biomass,
fragmentation
3 3 2
Wild fire Medium Understorey, biomass, soil,
biodiversity
2 1 2
Settlements to landless Medium Crown cover, habitat, biomass 3 2 2
Invasive species Low Biomass, understorey, habitat,
biodiversity
3 1 1
Rot disease Low Biomass 3 1 1
Floods Medium Biomass, understorey, biodiversity 2 1 2
Wind throw Low Biomass, species 3 2 2

8
Past assessments have done spatial and temporal mapping of forest conditions of Nepal which
suggest that forest degradation is causing changes in the forest structure, composition, stocking and
forest types, change of the vertical structure or alteration of other attributes. Sharma and Suoheimo
(1995) found that about 45 percent of trees are affected by the rot diseases in Makawanpur and
Rautahat districts. Similarly, Acharya (2000) stated that there is degradation on existing forest stock
due to repeated logging practices resulting in lower quality forest types. It was illustrated through
conversion of Sal forest (>60 percent of basal area) to Sal Terai Hardwood and finally to Terai
Hardwood (sal basal area <20 percent).
Nepal is suffering acutely from different sources of forest degradation. Forest encroachment is a
serious problem in the Terai plains. An estimate shows that 100,000 ha of forest is under
encroachment in the Terai and many more coming under threat of encroachment by illegal
squatters. High altitude forests are degraded due to the stocking of livestock units 9 times higher
than their carrying capacities (MoEST, 2008; NBS, 2002). Table 6 illustrates that degradation can
be the result of a single factor or a combination of multiple factors. It is highly significant for
maintaining subsistence economy which is based on the exploitation of natural resources as a major
source of livelihoods. The detection of such drivers is extremely limited with remote sensing unless
it reaches to serious level or it is supported by ground based information. Any methodological
innovations should consider the ground reality. Forest degradation may occur in following ways:
1. Reduction in biophysical attributes of forests such as crown cover in such a way that forest
remains as forest, up to10 percent.
2. Reduction of crown cover from shrub land or degraded forest until it is converted to other land
use. It has implications for services including carbon sequestration.
3. National area statistics will show both 1 and 2 on forest or shrub/degraded forest category
undermining the degradation.
4. Degradation may occur in under storey canopy due to removal of NTFPs and other resources.
The proposed field based inventory, with the assistance from the Government of Finland, will
generate substantial spatial and temporal information in Nepal. In addition, regional cooperation
through South Asian Association for Regional Cooperation (SAARC) could be a very practical
solution for such assessment specifically for small developing countries such as Nepal.
There is a need for the development of a comprehensive methodology to understand and value
forest degradation from ecosystem services perspectives. It could be based on the use of satellite
images combined with field survey. In addition, a participatory ecosystem services valuation
approach (PESVA) is recommended for understanding ecosystem services comprehensively to
capture degradation factor as shown in Table 6. This is simple but manageable by community
institutions for community forest management and will clearly help understanding forest
degradation. The PESVA requires expert inputs on the methodological template development, index
development, default value; key and simple procedure. In addition, satellite images supported by
ground observations could be the most efficient way to estimate rates of forest degradation by
locations to know where and how forests are being degraded.
The conceptual clarity on issues such as what is forest degradation, its impacts on ecosystem
services, fragmentation, local drivers of degradation, and opportunity costs is essential. The use of
satellite images and field based inventory requires additional capacity development, data sharing
mechanisms, permanent field plots, biomass studies, NTFPs and wildlife inventory. Likewise,
9
research to assess under storey vegetation in different conditions using images needs special
consideration.
4. Conclusions
Forest degradation is a unique process affecting forest ecosystem services (MEA, 2005). These
drivers are different in across and within the countries. A detailed and more specific understanding
of these drivers is necessary to address forest degradation. There is a need for a comprehensive
methodology to understand and value forest degradation from ecosystem services perspectives for
subsistence economy, poor people and forest dwellers depending on ecosystem services for daily
needs.
Nepal has a substantial experience on ground based forest inventory which has established
considerable data sources on forest stock. The methods used are aerial photographs, field inventory
and satellite images analysis. The further development of methodologies in assessing degradation
will largely depend on definitions. Different organizations have used different definitions and a
consensus definition is needed. Similarly, the clear distinction between shrub land and degraded
forest and methods to assess shrub lands are required. Similarly, several policy documents have
used forest degradation differently, which needs to be resolved. It should consider full ranges of
biophysical and socio-economic conditions. Nevertheless, in Nepal, a robust methodology which
can capture a range of drivers causing forest degradation (Table 6) is necessary. The present
methodologies can be improved in two ways. First, the use of satellite images supported by ground
based inventory. It should cover major forest types, physiographic regions and management
regimes. The use of satellite images and field based inventory is suitable to assess biomass, growing
stock, basal area, species composition, structure and forest type related assessment. This approach
will combine the strengths of both methods.
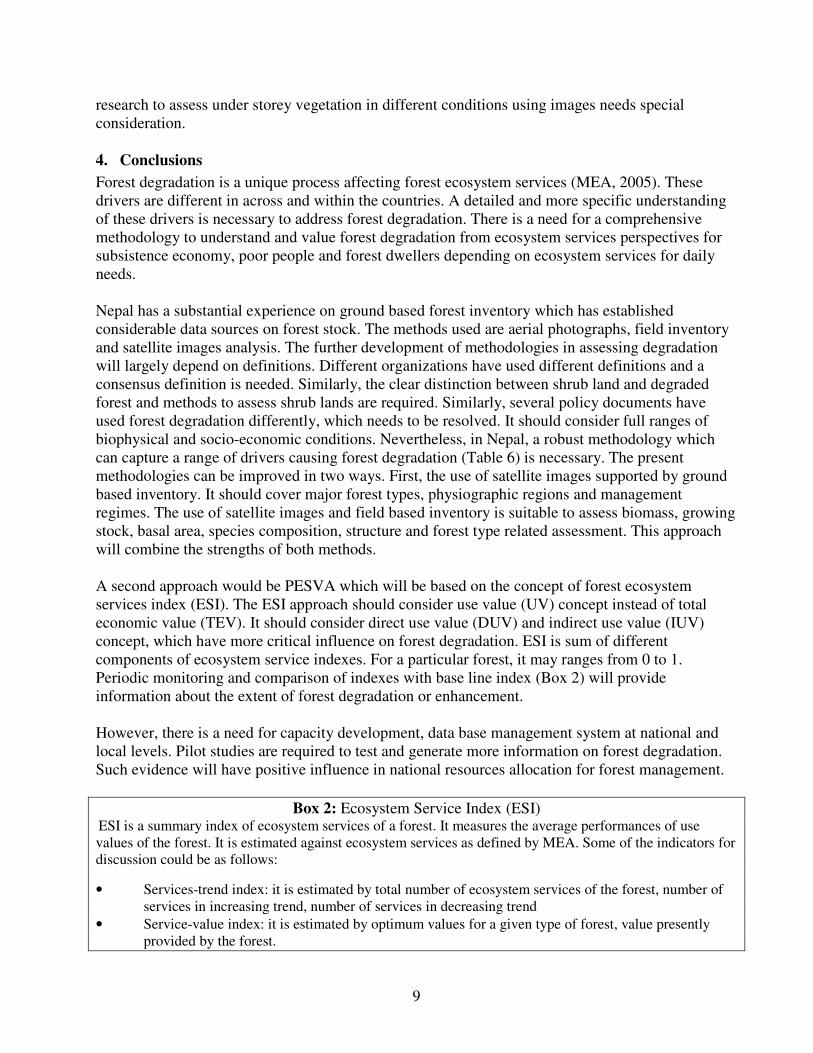
A second approach would be PESVA which will be based on the concept of forest ecosystem
services index (ESI). The ESI approach should consider use value (UV) concept instead of total
economic value (TEV). It should consider direct use value (DUV) and indirect use value (IUV)
concept, which have more critical influence on forest degradation. ESI is sum of different
components of ecosystem service indexes. For a particular forest, it may ranges from 0 to 1.
Periodic monitoring and comparison of indexes with base line index (Box 2) will provide
information about the extent of forest degradation or enhancement.
However, there is a need for capacity development, data base management system at national and
local levels. Pilot studies are required to test and generate more information on forest degradation.
Such evidence will have positive influence in national resources allocation for forest management.
Box 2: Ecosystem Service Index (ESI) ESI is a summary index of ecosystem services of a forest. It measures the average performances of use
values of the forest. It is estimated against ecosystem services as defined by MEA. Some of the indicators for
discussion could be as follows:
• Services-trend index: it is estimated by total number of ecosystem services of the forest, number of
services in increasing trend, number of services in decreasing trend
• Service-value index: it is estimated by optimum values for a given type of forest, value presently
provided by the forest.

10
The better understandings of forest degradation needs commitments at political and bureaucratic
level, infrastructure, legal measures of forest monitoring and national strategy, coordination of
agencies using remote sensing data, understanding diverse nature of local drivers of degradation and
measurement and opportunity cost. Similarly, there is a strong need for establishing an effective
degradation monitoring system.
Nepal can move ahead with the development of guidelines for forest monitoring, clear definition,
procedure for consistency, piloting covering major ecological zones and forest types, and
management regimes. Regional cooperation with India through SAARC could be a practical option
for cost effective assessment of forest degradation and its periodic monitoring every five years.
Nepal may request for remote sensing data from India and produce a periodic report based on
ground inventory by DFRS. PESVA needs additional exercises on creating default values developed
through available information and expert consultation. A programme framework that can be applied
at community level, especially in Nepal, where communities are managing forests is essential. It
also needs the development of simple format, guidelines and procedures. The paper concludes that
isolated approaches such as carbon sequestration to perceive forest degradation will create new
problems or drivers of forest degradation. Therefore, this paper concludes that forest degradation is
the reduction in ecosystem services capacity of forest.
Figure: Foresters undertaking a ground based inventory. (Source: WWF, Nepal)

11
References
Acharya, K.P. 2000. Unfavourable Structure of Forest in the Terai of Nepal Needs Immediate
Management, Banko Janakari, 10(2):25-28.
Bajracharya, M.K. 1986. Forests of Nepal: an introduction.
DFRS, 2008. Contribution of Forestry Sector to Gross Domestic Product in Nepal, Department of
Forest Research and Survey, Kathmandu, Nepal.
DFRS, 1999. Forest Resources of Nepal, Department of Forest Research and Survey, Publication no
74. Kathmandu, Nepal.
DoF, 2005. Forest Cover Change Analysis of the Terai districts (1990/91-2000/01. Department of
Forest, Kathmandu, Nepal.
FAO, 2009. Terms of Reference for the Preparation of Case Studies on Forest Degradation.
Gilmour, D.A. and Fisher, R..J. 1991. Villagers, Forest and Foresters: the Philosophy, Process and
Practice of Community Forestry in Nepal. Kathmandu, Sahayogi Press. 212 pp.
HMG, 1966. Forest statistics of Terai and Adjoining Regions. Forest Resources Survey, Department
of Forestry, Nepal.
HMG, 1969. Timber Resources and Development Opportunities in the Lower Bheri and Karnali
Region. Forest Resources Survey, Department of Forestry, Nepal.
HMG, 1973. Forest statistics: Hill region, Forest Resources Survey, Department of Forestry, Nepal.
Lambin, E.F. 1999. Monitoring forest degradation in tropical regions by remote sensing: some
methodological issues. Global Ecology and Biogeography 8: 191-198.
LRMP, 1985. Land Utilization Report, HMG/Kenting Earth Science Limited.
LRMP, 1986. Summary Report, HMGN/Government of Canada. Kenting Earth Sciences Limited,
Kathmandu, Nepal.
Malla, Y.B. 2000. Impacts of Community Forestry Policy in Rural Livelihoods and Food Security
in Nepal. Unasylva 200:38–45.
Mahat, T.B.S. 1987. Forestry-Farming Linkages in the Mountains. ICIMOD Occasional Paper No.
7, Kathmandu, 48 pp.
MEA, 2005. Millennium Ecosystem Assessment. ecosystem and Human Well Being: Synthesis
report. Island Press, Washington DC. USA.
MoEST, 2008. State of the Environment (Agriculture, Forest and Biodiversity), Ministry of
Science, Technology and Environment, Singh Durbar, Kathmandu.
MoFSC, 2005. Economic Valuation of Ecological Goods and Services, Ministry of Forest and Soil
Conservation, Kathmandu, Nepal.
MPFS, 1989a. Master Plan for Forestry Sector, Main report. Ministry of Forest and Soil
Conservation, Kathmandu, Nepal.
MPFS, 1989b. Master Plan for Forestry Sector, Forestry Resource Information and Planning
Report. Ministry of Forest and Soil Conservation, Kathmandu, Nepal.
NBS, 2002. Nepal Biodiversity Strategy, Ministry of Forests and Soil Conservation, Kathmandu,
Nepal.
12
Pandey, K.K. 1982. Fodder trees and tree fodder in Nepal. Swiss Development Corporation and
Swiss Federal Institute of Forest Research, Switzerland.
Panta, M., Kyrhyun, K. and Joshi, C. 2008. Temporal mapping of deforestation and forest
degradation in Nepal: Applications to forest conservation, Forest Ecology and Management.
256:1587-1595
Sharma, S. and Suoheimo, J. 1995. Observation on rot in sal forests in the Terai, FMUDP working
paper no 20, HMGN/FINNIDA, Kathmandu.
Souza, C., Firestone L., Moreira Silva L. and Roberts, D. 2003. Mapping Forest Degradation in the
Eastern Amazon from SPOT 4 through Spectral Mixture Models. Remote Sensing of
Environment 87: 494-506
WECS, 2006. Structure of Energy Consumption in Nepal. WECS, Kathmandu (unpublished office
record).
Whitemand, P.T.S. 1980. Agronomy research in the hills areas of Nepal. Terminal report, FAO,
Rome.
Wyatt-Smith, J. 1982. The Agriculture System in the Hills of Nepal. APPROSC 1982.

13
Annex 1: Findings of the past assessments in Nepal
Study Key findings related to forest degradation Inferences 1. FRSO
Area
45.5 % of land covered by forest, out of which 47 % is
commercial. Whereas in hills 58.1 % forest lands, commercial
forest area in the hill 34.4 %
Composition
Sal covers 20.7%, sawn timber stands 77 % and 23 %
pole/sapling/regeneration stand
Stocking
Average volume 63 m3/ha. In Hills, 35.1 % of commercial
forest is well stocked, 28.5 % medium and 8.7 % is poorly
stocked, over storey poor with understory medium 7.6,
overstorey poor understory well stocked well stocked 3.3% and
overstorey medium with understory well stocked 16.8 %
Tree distribution
In hills, 47 % of tree below 22 inch diameter class are from
undesirable species (not used for industrial wood, desirable
species are sal, Asna, Khair, Chirpine, Blue Pine, Spruce, Fir
and Hemlock)
Non commercial forest
In hills, encroachment: 0.06 percent of non commercial forest
area (5,236 acre); Scrub and shrub: 5.28 % (797,203 acre)
Focus was on total merchantable
volume of selected species in
commercial forest area.
Forest encroachment was
recognised due to fuelwood
extraction and lopping.
2. LRMP Area Forest area 5,616,800 ha (38.01 %), shrub 689,900 ha
(4.68 %), >40 % crown cover is 28.1%,
Stocking 34% (excluding High Himal) of forest is under stocked
degraded forests; 55% of forest is in very poor condition in
middle mountains;
Forest areas are converting into
degraded forest-shrub.
3. MPFS Area Forest 37.4 %, Shrublands and degraded forests: 5 % (706,000
ha) P 24, MPFS
Composition
59 % hardwoods, 17 % conifers and 24 % mixed forests. Pole
reproduction size constitutes only 1% of volume/ha, whereas
small timber 65.2% and remaining 1/3rd
by large timber.
Stocking and Degraded forest
Only 15% of forest area has >70 % crown cover, <40 % crown
cover is in 26.3% of the total forest, 59% have 40-70%. Per ha
growing stock is 96 m3 whereas total forest biomass is 628
million ton.
Shrublands increased due to
over cut for fuel wood and
lopping for fodder.
Other causes of degradation are
fire, cross border timber
smuggling, almost 60% shrub
lands are in middle mountains.
Rate of conversion of forest area
into degraded forest/shrub not
reduced.
Some of deforested area remains
as degraded forests.
4. NFI Area Forest 29 % (4,268,800), shrub 10.6 % (1,559,200 ha), In terai,
forest has decreased at annual rate of 1.3% from 1978/79 to
1990/91. In the hilly area, forest area has decreased at an annual
rate of 2.3 % from 1978/79 to 1994, whereas forest and shrub
together have decreased t an annual rate of 0.2%. In the whole
country, from 1978/79 to 1994, forest area has decreased at an
annual rate of 1.7 %, whereas forest and shrub together have
decrease at an annual rate of 0.5%.
Composition
28.2 % of total stem volume is occupied by sal followed by
Quercus – 9.3 %. All together 229 species identified in
inventory.
Stocking
Mean stem volume is 178m3/ha in 408 stem/ha bigger than 10
Rate of conversion of forest area
into degraded forest-shrub is
significantly increased. There is
higher degradation rate in hilly
region whereas deforestation is
prominent in the terai.
Forest degradation rate is double
than the deforestation rate for
1978/79 to 1994. (Degradation
is 3.5 % per year compared to
1.7 % per year of deforestation)
NFI assumed no shrubland in
terai, would have been higher
rate of degradation. Please refer
to DoF study.

14
cm dbh. Total stem volume of reachable forest is 387.5 million
m3 and biomass is 428.5 million ton
Non reachable forest About 51.5 % of the forests of Nepal are reachable.
Forest degradation
The shrub land area is result of forest degradation, which has
increased from 689,900 ha in 1978/79 LRMP estimates to
1,559,200 ha in NFI. It is an increase of 869,300 ha in 16 years
at a rate of 56 % or at an annual rate of 3.5 %. The degradation
within the forest category is not accounted in the estimate.
5. DoF Total forest area in 20 terai districts is 1,149,494 ha (excluding
protected area). Out of the total, 88 % (1,011,362 ha) is forest
and 12 % (138,132) is degraded forest.
Decreasing trend in land cover
change in erai plains during
1990/91 to 2000/01.
Encroachment has profound
effects on forest decline.
6. ESE The highest absolute value per ha was found in the Sal forest
(Nrs 3 million).
Within the Terai forest ecosystems, the absolute value of shrub
land (Nrs 0.76million is half than Terai Mixed Hardwood Forest
(Nrs 1.5 million).
The shrub lands have lower per ha values compared to forests
ecosystems in respected region.
Pine forest has lowest values within the forest ecosystems.
There is variation in TUV per ha in six research sites. It is
mainly due to variation in existing stock of the forest.
The ecosystem services vary
accordingly land use,
physiographic regions and forest
types.
Values of all three terai
ecosystems are higher than hills
Forest ecosystem services can
be valued by use value of the
ecosystem services
7. GDP Forestry sector contribution to GDP in the past was generally
estimated 4.4% compared to 9.45%, whereas it is 27.55%
including intangible benefits.
Forests contribute significantly
on national gross production.
Indirect use value of forest
ecosystem must be valued to
realise forest benefits.