Embed Size (px)
Citation preview

218
J Pharmacol Sci 124, 218 – 229 (2014) Journal of Pharmacological Sciences© The Japanese Pharmacological Society
Full Paper
Introduction
Acetaminophen (paracetamol, N-acetyl-p-aminophenol, APAP) is a widely used analgesic/antipyretic drug with proven safety at therapeutic doses (1). However, the hepatotoxicity induced by an APAP overdose in suicidal or unintentional ingestions is a critical issue, and it is the most frequent cause of acute liver failure in the United States (2), United Kingdom (3), and other countries
(4, 5). Liver injury induced by APAP overdose is charac-terized by extensive hepatocellular necrosis, which is initiated by N-acetyl-p-benzoquinone imine (NAPQI), a reactive metabolite of APAP, that is mainly metabolized by cytochrome P450 (CYP) 2E1 (6, 7). Although some cellular events, such as glutathione (GSH) depletion, mitochondrial dysfunction, and the JNK pathway, may be involved in APAP-induced hepatotoxicity, the precise mechanisms of toxicity have not been identified (8 – 10).
In general, to evaluate pathophysiological mechanisms and screen new drugs against diseases, detailed in vivo and in vitro models of disease are essential. Most knowledge of APAP-induced liver injury has been obtained in studies on rodents. However, differences
Evaluation of Three-Dimensional Cultured HepG2 Cells in a Nano Culture Plate System: an In Vitro Human Model of Acetaminophen HepatotoxicityKohei Aritomi1,#, Yoichi Ishitsuka1,#,*, Yoshiro Tomishima1, Daisuke Shimizu1, Nazuki Abe1, Tsuyoshi Shuto2, Mitsuru Irikura1, Hirofumi Kai2, and Tetsumi Irie1,3
1Department of Clinical Chemistry and Informatics, Graduate School of Pharmaceutical Sciences, 2Department of Molecular Medicine, Graduate School of Pharmaceutical Sciences, 3Center for Clinical Pharmaceutical Sciences, Faculty of Pharmaceutical Sciences, Kumamoto University, 5-1 Oe-honmachi, Chuo-ku, Kumamoto 862-0973, Japan
Received August 4, 2013; Accepted December 13, 2013
Abstract. Overdoses of acetaminophen (paracetamol, N-acetyl-p-aminophenol; APAP) cause severe liver injury, yet there is no common or high throughput in vitro human APAP model. This study examined the characteristics and usefulness of HepG2 cells grown in a nano culture plate (NCP) system, a three-dimensional culture method, as an in vitro human model for APAP-induced hepatotoxicity. The NCP-cultured HepG2 cells showed higher expression of mRNA and protein levels of cytochrome P450 2E1, which metabolizes APAP to a toxic metabolite, APAP-cysteine adduct formation, and higher sensitivity against APAP-induced cell injury compared with conventionally cultured cells. We demonstrated that treatment of APAP in NCP-cultured HepG2 cells shows key mechanistic features of APAP-induced hepatotoxicity, such as decreases in intracellular glutathione and mitochondrial membrane potential, activation of JNK, and cellular injury; and pharmacological agents, such as Cyclosporine A (a mitochondrial permeability transi-tion inhibitor) and SP600125 (a JNK inhibitor), prevented cell injury induced by APAP exposure. In addition, the antidote of APAP-induced hepatotoxicity, N-acetylcysteine, could attenuate cellular injury induced by APAP in NCP-cultured HepG2 cells. We suggest that cellular injury induced by APAP treatment using an NCP-HepG2 system is a useful human model to study mechanisms and screen drug candidates of APAP-induced hepatotoxicity.[Supplementary Figures: available only at http://dx.doi.org/10.1254/jphs.13135FP]
Keywords: acetaminophen, liver injury, HepG2 cell, three-dimensional culture, human model
#These authors equally contributed to this work.*Corresponding author. [email protected] online in J-STAGE on February 4, 2014doi: 10.1254/jphs.13135FP
219A Human Model of Acetaminophen Hepatitis
in the pathogenesis of APAP-induced hepatotoxicity between rodents and humans appear to be considerable (11 – 13). To address the limitations of animal models of APAP-induced hepatotoxicity, a human in vitro system may be useful. HepG2 cells, a human hepatoma cell line, have been widely used as a model of hepato-cytes because of its broad utility, stability, and ease of handling compared with primary hepatocytes. Unfortu-nately, fundamental liver functions, such as CYP enzyme expression and albumin production, generally deteriorate over time in HepG2 cells. Therefore, HepG2 cells have not been considered useful as an in vitro system for an APAP-induced hepatotoxicity model (14, 15).
Recent reports have demonstrated that the micro-space cell culture plate method, a three-dimensional (3D) culture system, can induce hepatocyte-specific functions, including CYP2E1 expression, in HepG2 cells, which results in an increase in cytotoxicity by acetaminophen compared with a conventional two-dimensional (2D) culture system (16). These results suggest that 3D- cultured HepG2 cells may be a useful tool as an in vitro human model of APAP-induced hepatotoxicity. Other studies have reported on a new 3D-cultured HepG2 system using a nano culture plate (NCP) that shows higher expression of albumin and some CYP enzymes in NCP-cultured HepG2 cells compared with conven-tionally cultured cells (17). However, it remains to be demonstrated whether cell injury induced by APAP in 3D-cultured HepG2 cells in vitro was produced by corresponding human and rodent mechanisms of in vivo APAP-induced hepatotoxicity, and if antidotes such as NAC or other agents also show protective potential against APAP-induced hepatotoxicity in the 3D-cultiva-tion system.
This study was conducted to gain insight into the value of 3D-cultured HepG2 cells as a human system to study APAP-induced hepatotoxicity. We evaluated whether 3D-cultured HepG2 cells by the NCP method showed distinctive mechanistic characteristics, such as decreases in intracellular GSH and mitochondrial membrane poten-tial and the phosphorylation of JNK during APAP- induced cell injury. In addition, we assessed the effects of NAC or other antidotes of APAP-induced hepato-toxicity on cellular injury induced by APAP in this system.
Materials and Methods
Chemicals and materialsNanoCulture® plates (NCPs; 96- or 24-well micro
square pattern type, Catalog No. NCP-LS96 for 96-well and NCP-LS24 for 24-well plate) were purchased from SIVAX Co. (Kawasaki). Acetaminophen (> 99%), N-
acetylcysteine (NAC), protease from Aspergillus oryzae, and sodium acetate were purchased from Sigma Chemical Co. (St. Louis, MO, USA). Cyclosporine A (CyA) and anthrax [1-9-cd] pyrazol-6 (2H)-one (SP600125) were purchased from LC Laboratories (Woburn, MA, USA). Acetaminophen-cysteine adduct (APAP-CYS) was ob-tained from Santa Cruz Biotechnology (Heidelberg, Germany). NANOSEP® 30K OMEGA was purchased from Pall Corporation (Port Washington, NY, USA). Methanol of the highest grade was purchased from Wako Pure Chemical Industries, Ltd. (Osaka). Dimethyl sulf-oxide, dehydrated (DMSO) was purchased from Wako Pure Chemical Industries, Ltd. The cell counting kit and Cellstain® Double Staining Kit were obtained from Dojindo Laboratories (Kumamoto). A High Capacity cDNA Reverse Transcription Kit and Fast SYBR® Green Master Mix were purchased from Applied Biosystems (Life Technologies Japan, Tokyo). An RNeasy Plus Mini Kit® was purchased from Qiagen (Hilden, Germany). BIOXYTECH GSH/GSSG-412TM was purchased from OXIS Health Products, Inc. (Portland, OR, USA). Dulbecco’s modified Eagle’s medium containing a low glucose concentration (DMEM) was purchased from Gibco® Life Technologies (Life Technologies Japan, Tokyo). HyCloneTM fetal bovine serum (FBS) was pur-chased from Thermo Scientific (Logan, UT, USA). Other reagents and solvents were of reagent grade. Deionized and distilled water was used throughout the study.
Cell cultures and morphologyThe human hepatoblastoma cell line HepG2 (RIKEN
Bio Resource Center, Tokyo) was incubated at 37°C under an atmosphere of 95% air and 5% CO2 in DMEM containing 10% FBS, 100 U/mL penicillin, and 100 mg/mL streptomycin. Confluent cultures were washed with phosphate-buffered saline (PBS), pH 7.4, detached with trypsin, centrifuged, and sub-cultured. In the convention-ally cultured group, the HepG2 cells were seeded onto a NuncTM 96- or 24-well culture plate (Thermo Scientific) at a density of 3 × 10⁴ cells/well in 100 mL culture medium in 96-well plates or 1.5 × 10⁵ cells/well in 500 mL culture medium in 24-well plates. In contrast, 96- or 24-well NCPs were used in the NCP-cultured group, and the cells were seeded at the same density compared with the conventionally cultured group. The cell morphologies were photographed and analyzed using a microscope system (BIOREVO BZ-9000; Keyence Co., Osaka).
Quantitative real-time PCR analysisQuantitative reverse transcription polymerase chain
reaction assays (qRT-PCR) were performed to measure the mRNA expression levels as previously described
220 K Aritomi et al
with minor modifications (18). Briefly, total RNA was extracted using an RNeasy Plus Mini Kit® according to the manufacturer’s instructions. The qRT-PCR for human cytochrome P450, family 2, subfamily E, poly-peptide 1 (CYP2E1; NM_000773.3), and b-actin (NM_001101.3) was performed using the following primers: CYP2E1 sense, TTCAGCGGTTCATCACCCT and antisense, GAGGTATCCTCTGAAAATGGTGTC-3′; b-actin sense, AGATGGCCACGGCTGCT and anti-sense, AACCGCTCATTGCCAATGG. Total RNA was transcribed to cDNA using a High Capacity cDNA Reverse Transcription Kit, and qRT-PCR analysis was then performed using a StepOnePlusTM Real-time PCR System (Applied Biosystems Life Technologies Japan) with Fast SYBR® Master Mix according to the manufac-turer’s instructions. The PCR quality and specificity were verified using melting curve analysis. The variation in the initial amount of total RNA in the different samples was normalized in every assay using b-actin gene expres-sion as an internal standard.
Immunoblot analysisHepG2 cells cultured in a 24-well conventional plate
or NCP were detached and lysed in lysis buffer [25 mM Tris·HCl pH 7.6, 150 mM NaCl, 1% NP-40, 1% sodium deoxycholate, 0.1% SDS, and a 1% HaltTM protease inhibitor cocktail (Thermo Scientific)] and stored at −30°C until further analysis. Cell lysates were subjected to SDS-PAGE on a 10% polyacrylamide gel. Proteins were electroblotted onto a PVDF membrane (Millipore Corp., Bedford, MA, USA). After blocking with 5% skim milk, the membranes were washed three times and treated with the primary antibody. Primary antibodies were diluted in 5% skim milk at the following dilutions: anti-CYP2E1 antibodies (Abcam, Inc., Cambridge, MA, USA) (1:2500) or anti-b-actin (Cell Signaling Technol-ogy, Danvers, MA, USA) (1:1000), incubated overnight at 4°C. To determine the JNK signaling, Phospho-SAPK/JNK and SAPK/JNK rabbit Ab (Cell Signaling Technol-ogy) were used at a dilution of 1:1000 and incubated overnight at 4°C. Subsequently, the membranes were washed three times with TBS in Tween-20 and counter-stained with the corresponding secondary antibodies conjugated to anti-rabbit IgG (1:3000). The membranes were visualized using Pierce enhanced chemilumines-cence (ECL) western blotting reagents and ECL film.
Determination of APAP-cysteine adduct by high perfor-mance liquid chromatography with electrochemical detection system (HPLC-ECD)
We examined APAP-CYS adducts formation, a mea-sure of NAPQI production (Supplementary Fig. 1: avail-able in the online version only), in NCP-cultured and
conventionally-cultured HepG2 cells. After protease digestion of the cellular protein, APAP-cysteine (APAP-CYS) adducts were measured in cells and in the culture medium by ECD-HPLC. The determination was per-formed by the methods previously described by McGill et al. (19) and Muldrew et al. (20) with minor modifica-tions. In brief, HepG2 cells cultured in a 24-well conven-tional plate or NCP and exposed to 15 mM APAP for 24 h were detached and lysed in lysis buffer (25 mM Tris and HCl pH 7.6, 150 mM NaCl, 1% NP-40, 1% sodium deoxycholate, 0.1% SDS) and stored at −30°C until analysis. A 100-mL aliquot of the sample was placed on a NANOSEP® centrifugal device with a membrane molecular weight cutoff of 30 kDa (previously condi-tioned by wetting with 200 mL of distilled water and drying by centrifugation at 12,000 × g for 10 min) and was centrifuged at 12,000 × g for 10 min. The protein retained on the membrane was washed three times with 100-mL portions of distilled water, with centrifugation at 12,000 × g for 10 min after each washing, and then quantitatively dislodged from the membrane with the aid of a spatula and 100 mL portions of distilled water until a 200 mL volume of protein dispersion had been collected. This protein dispersion was mixed, in succes-sion, with 12.5 mL of protease solution (8 units/mL) and then incubated at 50°C for 16 h on a heating block. The digest was transferred to a conditioned NANOSEP® centrifugal device and centrifuged at 12,000 × g for 10 min to collect the filtrate. A 50-mL aliquot of this solution was injected into the liquid chromatography system. The linearity of the ECD-HPLC method was confirmed by preparing a calibration curve from serial dilutions (0.2, 0.5, 1, 2.5, 5, and 10 mg/mL) of the stan-dard sample of APAP-CYS (Santa Cruz). ECD-HPLC analysis was performed at 25°C under isocratic condi-tions using PU-980 from JASCO Corp. (Tokyo) and a Coulochem II model 5200 detector from ESA (Bedford, MA, USA). An automated injection (25 mL) was per-formed using an 851-AS from JASCO Corp. The mobile phase was 50 mM sodium acetate and 7% methanol, pH 4.8. The flow rate was 1.0 mL/min through a reversed phase packed column (5C18–MS-II, 4.6 ID × 150 mm, COSMOSIL; Nacalai Tesque, Kyoto). The run time was 20 min. The peak detection limit was set to 1 mA. In this study, the optimal potential for analysis of APAP-CYS was 400 mV. APAP-CYS levels in the unknown samples were quantified using peak height of the channel and standard curves for APAP-CYS. APAP-CYS values in unknown samples were expressed as mg of APAP- CYS per mg protein by whole cell protein quantitative determination. The detection limit of APAP-CYS was approximately 0.8 ng/mg of protein in our assay conditions.
221A Human Model of Acetaminophen Hepatitis
Cell viability and cell death assaysAPAP-induced viability of HepG2 cells was evaluated
by a cell viability assay and by the calcein-acetomethoxy (calcein-AM) and propidium iodide (PI) (which stain viable and dead cells, respectively) dual-staining assay as previously described (21). Cell viability was measured using a modified 3-(4,5-dimethylthiazol-2-yl)-2,5- diphenyltetrazolium bromide (MTT) assay, namely, the water-soluble tetrazolium salt (WST-8) assay, using a Cell Counting Kit (Dojindo Laboratories) according to the manufacturer’s protocol. HepG2 cells were seeded at 3 × 10⁴ cells/well into a 96-well conventional plate or NCP for 48 h before APAP exposure. The cells were treated with APAP (0 – 20 mM) for 3 to 48 h at 37°C and 5% CO2. The cells were then incubated with 10 mL of WST-8 reagents that were added to each well followed by incubation for 3 h and measured at an absorbance of 450 nm using a micro plate reader (Tecan Co., Ltd., Männedorf, Switzerland). Cell viability was expressed as a percentage of the viable cells relative to the untreated controls. Moreover, cell death was observed by measur-ing the fluorescence of calcein-AM and PI at the excita-tion/emission wavelengths of 490/510 nm and 530/ 580 nm, respectively, using a fluorescent microscope (Biorevo, Keyence Co.). NAC (1 – 100 mM) was dis-solved in DMEM, and CyA and SP600125 were dis-solved in DMSO (final concentrations of DMSO were always < 0.1%, which has been shown to have no effects on cell viability). To evaluate the effects of these pharmacological reagents against APAP-induced cell injury, HepG2 cells cultured in a conventional plate or NCP were exposed to 15 mM APAP in the presence or absence of the reagents at various concentrations. Cell viability was measured 48 h after APAP exposure.
Measurement of intracellular glutathione, phosphoryla-tion of JNK, and mitochondrial membrane potential
The intracellular GSH concentration was measured in accordance with methods described previously in our laboratory with minor modifications (18). HepG2 cells were seeded at 3 × 10⁴ cells/well into a 96-well conven-tional plate or NCP for 48 h before APAP exposure. The cells were exposed to APAP (15 mM) for 0 – 48 h at 37°C and 5% CO2. Subsequently, the cells were detached from the plates and aliquoted into test tubes. After centrifugation and removal of the supernatant, 300 ml of 5% metaphosphoric acid (Wako Pure Chemical Industries) aqueous solution was added to the samples that were then vortexed for 20 – 30 s. Glutathione con-centrations were determined using BIOXYTECH GSH/GSSG-412 according to the manufacturer’s instructions. Changes in intracellular GSH levels were expressed as a percentage of the untreated controls.
The activation of the JNK pathway was assessed by the measurement of phosphorylation of JNK. HepG2 cells were seeded at 1.5 × 10⁵ cells/well into a 24-well conventional plate or NCP for 48 h before APAP exposure. Cells were treated with 15 mM APAP for 0 – 12 h at 37°C and 5% CO2, and the cells were col-lected at each time point. As described above, JNK and phosphorylated JNK were determined by immunoblot analysis.
Mitochondrial membrane potential was determined with the JC-1 Mitochondrial Membrane Potential Assay Kit (Cayman Chemical Company, Ann Arbor, MI, USA). In intact cells, the dye preferentially localizes to mito-chondria, where it forms aggregates that fluoresce red. When the mitochondria membrane potential decreases, that is membrane permeability transition (MPT), with cellular injury, the dye transports to the cytosol and fluoresces green. Therefore, the ratio of red-to-green fluorescence reflects mitochondrial membrane integrity. HepG2 cells were seeded at 3 × 10⁴ cells/well into a 96-well conventional plate or NCP for 48 h before the APAP exposure. The cells were exposed to APAP (15 mM) for 0 – 48 h at 37°C and 5% CO2. Subsequently, the cells were stained with JC-1 fluorescence reagent according to the manufacturer’s instructions. The cells were photographed and analyzed using a microscope system (BIOREVO BZ-9000) and quantitatively deter-mined using Image J (http://rsb.info.nih.gov/ij/). Total mitochondrial membrane potential in treated cells was expressed as a percentage of the fluorescence ratio compared with the untreated controls.
Statistical analysesResults were expressed as the mean ± S.D. Statistical
analyses were performed using GraphPad Prism ver. 5.01 (GraphPad Software, San Diego, CA, USA). Multiple comparisons were made to examine the statistical signifi-cance of the data. When uniform variance was identified by Bartlett’s analysis (P > 0.05), one-way analysis of variance (ANOVA) was used to test for statistical signifi-cance. When significant differences (P < 0.05) were identified, the data were further analyzed using the Tukey (or Tukey–Kramer) multiple range test.
Results
Morphological and functional differences and variation of cell viability following exposure to APAP in conven-tionally and NCP-cultured HepG2 cells
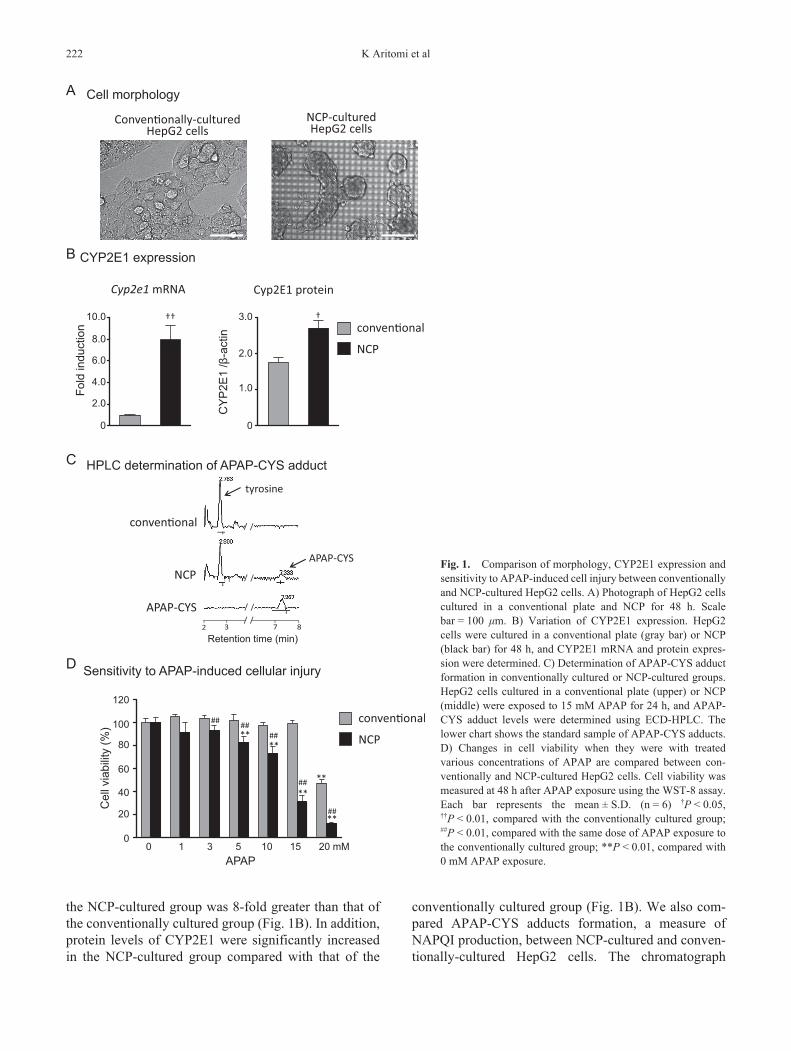
As shown in Fig. 1A, conventionally-cultured HepG2 cells adhered to the bottom of the plate, whereas NCP-cultured HepG2 cells were aggregated and became spheroids. The mRNA expression level of CYP2E1 in
222 K Aritomi et al
the NCP-cultured group was 8-fold greater than that of the conventionally cultured group (Fig. 1B). In addition, protein levels of CYP2E1 were significantly increased in the NCP-cultured group compared with that of the
conventionally cultured group (Fig. 1B). We also com-pared APAP-CYS adducts formation, a measure of NAPQI production, between NCP-cultured and conven-tionally-cultured HepG2 cells. The chromatograph
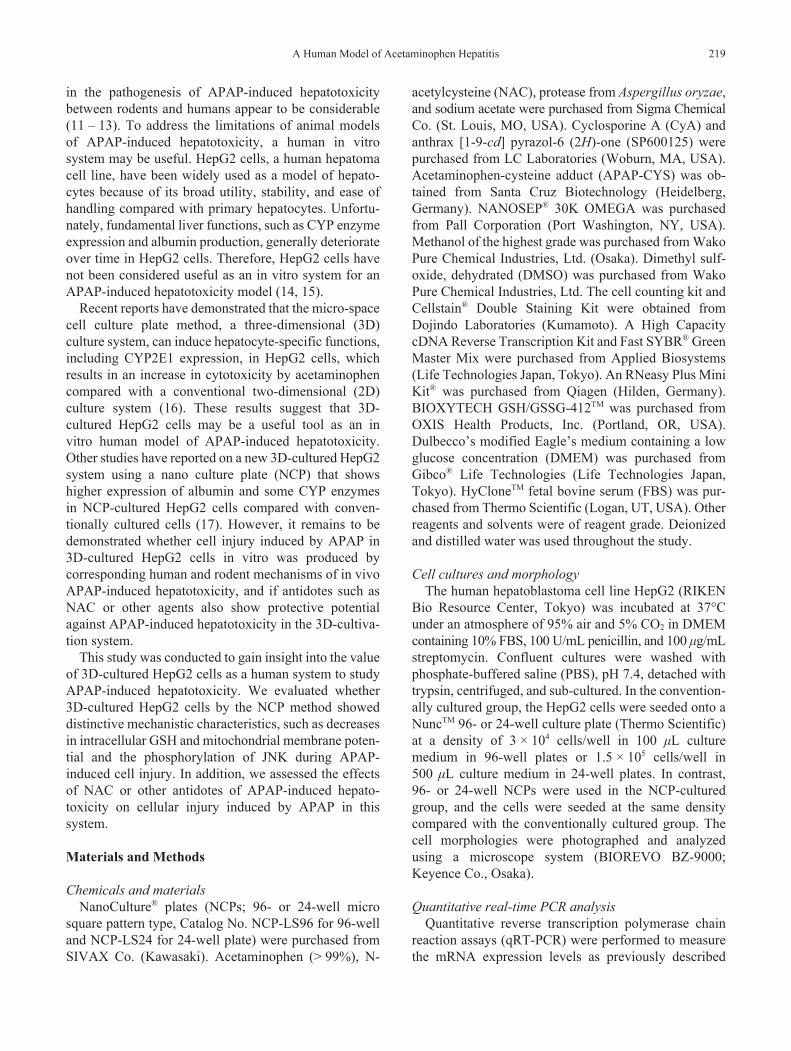
Fig. 1. Comparison of morphology, CYP2E1 expression and sensitivity to APAP-induced cell injury between conventionally and NCP-cultured HepG2 cells. A) Photograph of HepG2 cells cultured in a conventional plate and NCP for 48 h. Scale bar = 100 mm. B) Variation of CYP2E1 expression. HepG2 cells were cultured in a conventional plate (gray bar) or NCP (black bar) for 48 h, and CYP2E1 mRNA and protein expres-sion were determined. C) Determination of APAP-CYS adduct formation in conventionally cultured or NCP-cultured groups. HepG2 cells cultured in a conventional plate (upper) or NCP (middle) were exposed to 15 mM APAP for 24 h, and APAP-CYS adduct levels were determined using ECD-HPLC. The lower chart shows the standard sample of APAP-CYS adducts. D) Changes in cell viability when they were with treated various concentrations of APAP are compared between con-ventionally and NCP-cultured HepG2 cells. Cell viability was measured at 48 h after APAP exposure using the WST-8 assay. Each bar represents the mean ± S.D. (n = 6) †P < 0.05, ††P < 0.01, compared with the conventionally cultured group; ##P < 0.01, compared with the same dose of APAP exposure to the conventionally cultured group; **P < 0.01, compared with 0 mM APAP exposure.
223A Human Model of Acetaminophen Hepatitis
charts of HPLC-ECD analysis are shown in Fig. 1C. A peak of the standard sample of APAP-CYS was ob-served, and the retention time was approximately 7.3 min (Fig. 1C, lower lane). Although we observed a peak of tyrosine, an internal standard of cellular proteins, APAP-CYS adducts were not detected in the conventionally cultured group at 24 h after APAP exposure. In contrast, a peak of APAP-CYS was identified in the NCP-cultured group at 24 h after APAP treatment, and the amount of APAP-CYS was approximately 0.177 mg/mg cellular protein. Next, we compared the effects of APAP on cell viability in HepG2 cells 48 h after APAP exposure between the NCP-cultured and conventionally cultured groups (Fig. 1D). In the NCP-cultured HepG2 cells, APAP (5 – 20 mM) significantly decreased cell viability 48 h after treatment in a dose-dependent manner. Al-though a significant decrease was also observed with 20 mM APAP, statistically significant differences were not observed when the cells were treated with 15 mM or less of APAP in the conventionally cultured group. In addition, there were significant differences in cell viability between the conventionally and NCP-cultured groups.
Time-course parameters of APAP-induced liver injury in NCP-cultured HepG2 cells
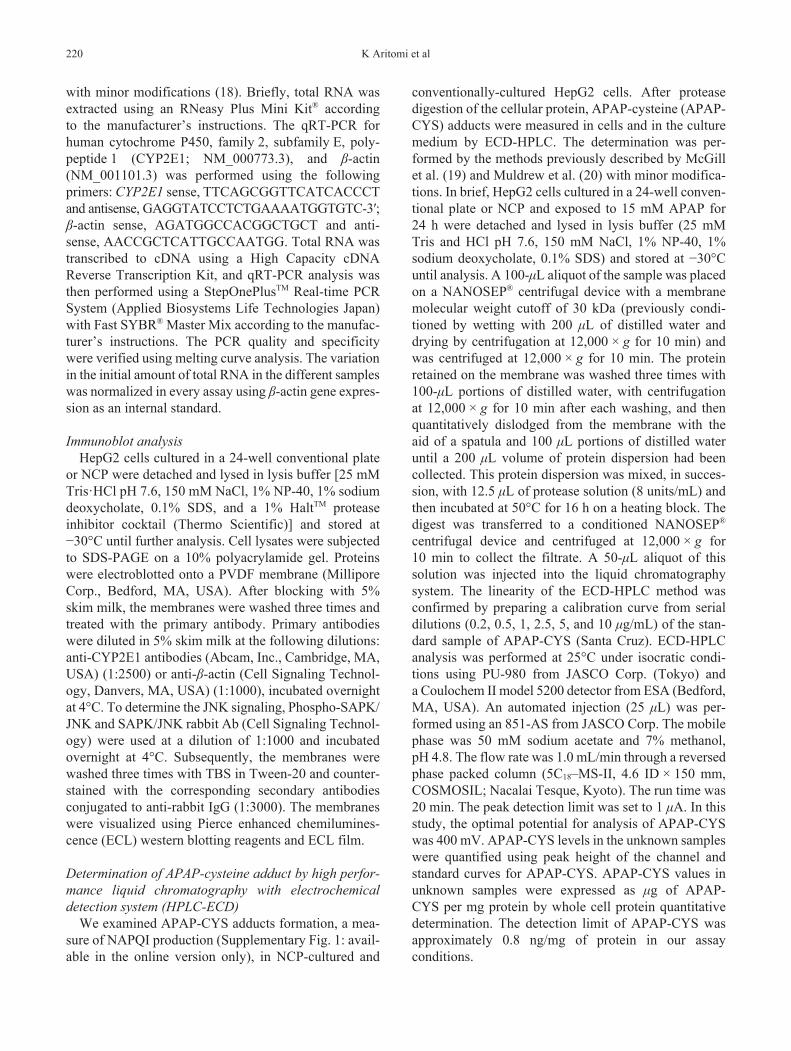
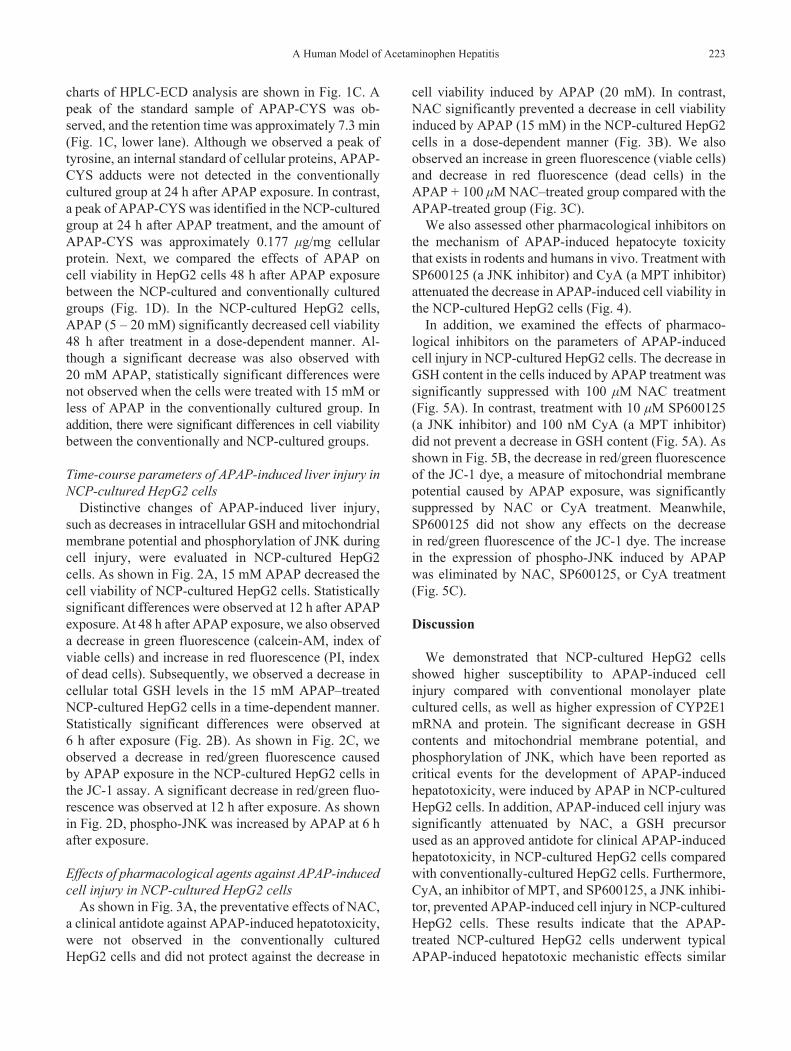
Distinctive changes of APAP-induced liver injury, such as decreases in intracellular GSH and mitochondrial membrane potential and phosphorylation of JNK during cell injury, were evaluated in NCP-cultured HepG2 cells. As shown in Fig. 2A, 15 mM APAP decreased the cell viability of NCP-cultured HepG2 cells. Statistically significant differences were observed at 12 h after APAP exposure. At 48 h after APAP exposure, we also observed a decrease in green fluorescence (calcein-AM, index of viable cells) and increase in red fluorescence (PI, index of dead cells). Subsequently, we observed a decrease in cellular total GSH levels in the 15 mM APAP–treated NCP-cultured HepG2 cells in a time-dependent manner. Statistically significant differences were observed at 6 h after exposure (Fig. 2B). As shown in Fig. 2C, we observed a decrease in red/green fluorescence caused by APAP exposure in the NCP-cultured HepG2 cells in the JC-1 assay. A significant decrease in red/green fluo-rescence was observed at 12 h after exposure. As shown in Fig. 2D, phospho-JNK was increased by APAP at 6 h after exposure.
Effects of pharmacological agents against APAP-induced cell injury in NCP-cultured HepG2 cells
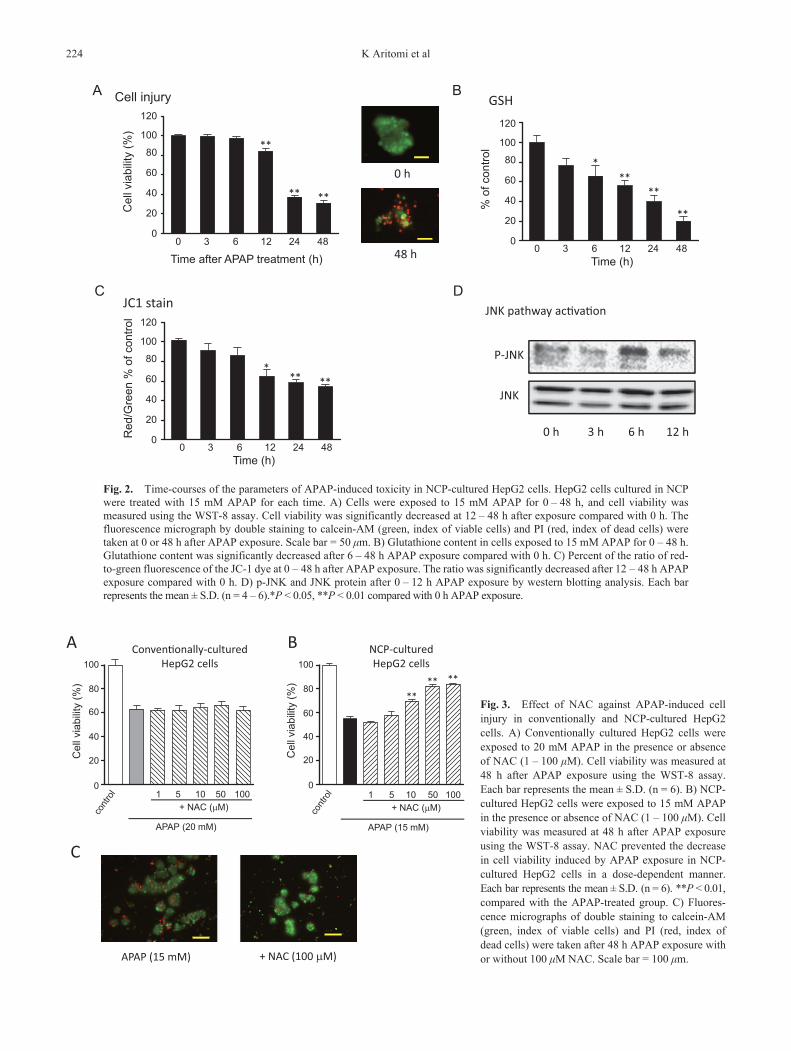
As shown in Fig. 3A, the preventative effects of NAC, a clinical antidote against APAP-induced hepatotoxicity, were not observed in the conventionally cultured HepG2 cells and did not protect against the decrease in
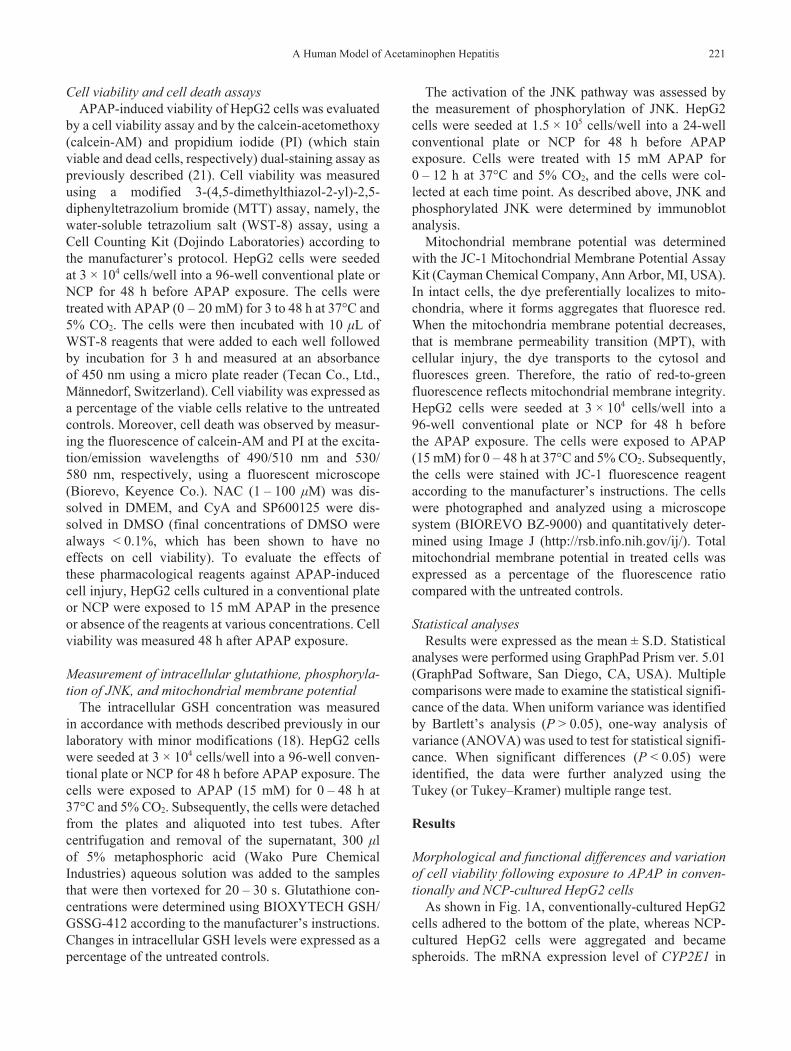
cell viability induced by APAP (20 mM). In contrast, NAC significantly prevented a decrease in cell viability induced by APAP (15 mM) in the NCP-cultured HepG2 cells in a dose-dependent manner (Fig. 3B). We also observed an increase in green fluorescence (viable cells) and decrease in red fluorescence (dead cells) in the APAP + 100 mM NAC–treated group compared with the APAP-treated group (Fig. 3C).
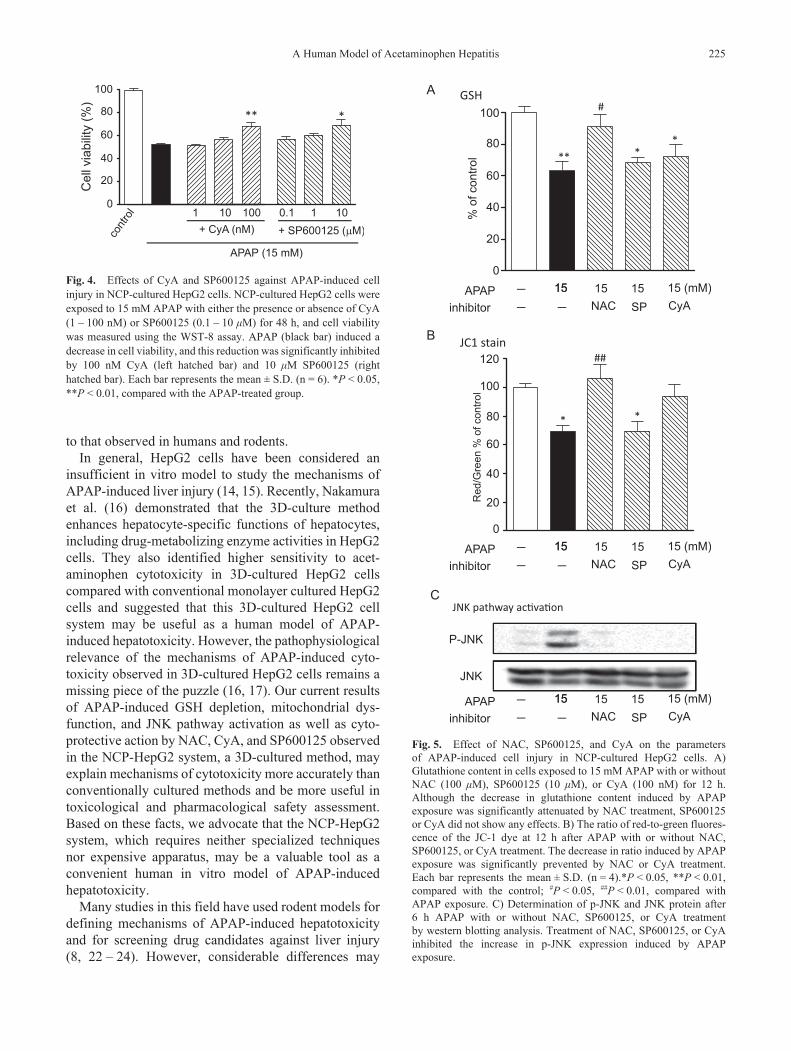
We also assessed other pharmacological inhibitors on the mechanism of APAP-induced hepatocyte toxicity that exists in rodents and humans in vivo. Treatment with SP600125 (a JNK inhibitor) and CyA (a MPT inhibitor) attenuated the decrease in APAP-induced cell viability in the NCP-cultured HepG2 cells (Fig. 4).
In addition, we examined the effects of pharmaco-logical inhibitors on the parameters of APAP-induced cell injury in NCP-cultured HepG2 cells. The decrease in GSH content in the cells induced by APAP treatment was significantly suppressed with 100 mM NAC treatment (Fig. 5A). In contrast, treatment with 10 mM SP600125 (a JNK inhibitor) and 100 nM CyA (a MPT inhibitor) did not prevent a decrease in GSH content (Fig. 5A). As shown in Fig. 5B, the decrease in red/green fluorescence of the JC-1 dye, a measure of mitochondrial membrane potential caused by APAP exposure, was significantly suppressed by NAC or CyA treatment. Meanwhile, SP600125 did not show any effects on the decrease in red/green fluorescence of the JC-1 dye. The increase in the expression of phospho-JNK induced by APAP was eliminated by NAC, SP600125, or CyA treatment (Fig. 5C).
Discussion
We demonstrated that NCP-cultured HepG2 cells showed higher susceptibility to APAP-induced cell injury compared with conventional monolayer plate cultured cells, as well as higher expression of CYP2E1 mRNA and protein. The significant decrease in GSH contents and mitochondrial membrane potential, and phosphorylation of JNK, which have been reported as critical events for the development of APAP-induced hepatotoxicity, were induced by APAP in NCP-cultured HepG2 cells. In addition, APAP-induced cell injury was significantly attenuated by NAC, a GSH precursor used as an approved antidote for clinical APAP-induced hepatotoxicity, in NCP-cultured HepG2 cells compared with conventionally-cultured HepG2 cells. Furthermore, CyA, an inhibitor of MPT, and SP600125, a JNK inhibi-tor, prevented APAP-induced cell injury in NCP-cultured HepG2 cells. These results indicate that the APAP-treated NCP-cultured HepG2 cells underwent typical APAP-induced hepatotoxic mechanistic effects similar
224 K Aritomi et al
Fig. 2. Time-courses of the parameters of APAP-induced toxicity in NCP-cultured HepG2 cells. HepG2 cells cultured in NCP were treated with 15 mM APAP for each time. A) Cells were exposed to 15 mM APAP for 0 – 48 h, and cell viability was measured using the WST-8 assay. Cell viability was significantly decreased at 12 – 48 h after exposure compared with 0 h. The fluorescence micrograph by double staining to calcein-AM (green, index of viable cells) and PI (red, index of dead cells) were taken at 0 or 48 h after APAP exposure. Scale bar = 50 mm. B) Glutathione content in cells exposed to 15 mM APAP for 0 – 48 h. Glutathione content was significantly decreased after 6 – 48 h APAP exposure compared with 0 h. C) Percent of the ratio of red-to-green fluorescence of the JC-1 dye at 0 – 48 h after APAP exposure. The ratio was significantly decreased after 12 – 48 h APAP exposure compared with 0 h. D) p-JNK and JNK protein after 0 – 12 h APAP exposure by western blotting analysis. Each bar represents the mean ± S.D. (n = 4 – 6).*P < 0.05, **P < 0.01 compared with 0 h APAP exposure.
Fig. 3. Effect of NAC against APAP-induced cell injury in conventionally and NCP-cultured HepG2 cells. A) Conventionally cultured HepG2 cells were exposed to 20 mM APAP in the presence or absence of NAC (1 – 100 mM). Cell viability was measured at 48 h after APAP exposure using the WST-8 assay. Each bar represents the mean ± S.D. (n = 6). B) NCP-cultured HepG2 cells were exposed to 15 mM APAP in the presence or absence of NAC (1 – 100 mM). Cell viability was measured at 48 h after APAP exposure using the WST-8 assay. NAC prevented the decrease in cell viability induced by APAP exposure in NCP-cultured HepG2 cells in a dose-dependent manner. Each bar represents the mean ± S.D. (n = 6). **P < 0.01, compared with the APAP-treated group. C) Fluores-cence micrographs of double staining to calcein-AM (green, index of viable cells) and PI (red, index of dead cells) were taken after 48 h APAP exposure with or without 100 mM NAC. Scale bar = 100 mm.
225A Human Model of Acetaminophen Hepatitis
to that observed in humans and rodents.In general, HepG2 cells have been considered an
insufficient in vitro model to study the mechanisms of APAP-induced liver injury (14, 15). Recently, Nakamura et al. (16) demonstrated that the 3D-culture method enhances hepatocyte-specific functions of hepatocytes, including drug-metabolizing enzyme activities in HepG2 cells. They also identified higher sensitivity to acet-aminophen cytotoxicity in 3D-cultured HepG2 cells compared with conventional monolayer cultured HepG2 cells and suggested that this 3D-cultured HepG2 cell system may be useful as a human model of APAP- induced hepatotoxicity. However, the pathophysiological relevance of the mechanisms of APAP-induced cyto-toxicity observed in 3D-cultured HepG2 cells remains a missing piece of the puzzle (16, 17). Our current results of APAP-induced GSH depletion, mitochondrial dys-function, and JNK pathway activation as well as cyto-protective action by NAC, CyA, and SP600125 observed in the NCP-HepG2 system, a 3D-cultured method, may explain mechanisms of cytotoxicity more accurately than conventionally cultured methods and be more useful in toxicological and pharmacological safety assessment. Based on these facts, we advocate that the NCP-HepG2 system, which requires neither specialized techniques nor expensive apparatus, may be a valuable tool as a convenient human in vitro model of APAP-induced hepatotoxicity.
Many studies in this field have used rodent models for defining mechanisms of APAP-induced hepatotoxicity and for screening drug candidates against liver injury (8, 22 – 24). However, considerable differences may
Fig. 4. Effects of CyA and SP600125 against APAP-induced cell injury in NCP-cultured HepG2 cells. NCP-cultured HepG2 cells were exposed to 15 mM APAP with either the presence or absence of CyA (1 – 100 nM) or SP600125 (0.1 – 10 mM) for 48 h, and cell viability was measured using the WST-8 assay. APAP (black bar) induced a decrease in cell viability, and this reduction was significantly inhibited by 100 nM CyA (left hatched bar) and 10 mM SP600125 (right hatched bar). Each bar represents the mean ± S.D. (n = 6). *P < 0.05, **P < 0.01, compared with the APAP-treated group.
Fig. 5. Effect of NAC, SP600125, and CyA on the parameters of APAP-induced cell injury in NCP-cultured HepG2 cells. A) Glutathione content in cells exposed to 15 mM APAP with or without NAC (100 mM), SP600125 (10 mM), or CyA (100 nM) for 12 h. Although the decrease in glutathione content induced by APAP exposure was significantly attenuated by NAC treatment, SP600125 or CyA did not show any effects. B) The ratio of red-to-green fluores-cence of the JC-1 dye at 12 h after APAP with or without NAC, SP600125, or CyA treatment. The decrease in ratio induced by APAP exposure was significantly prevented by NAC or CyA treatment. Each bar represents the mean ± S.D. (n = 4).*P < 0.05, **P < 0.01, compared with the control; #P < 0.05, ##P < 0.01, compared with APAP exposure. C) Determination of p-JNK and JNK protein after 6 h APAP with or without NAC, SP600125, or CyA treatment by western blotting analysis. Treatment of NAC, SP600125, or CyA inhibited the increase in p-JNK expression induced by APAP exposure.
226 K Aritomi et al
exist in the mechanism of APAP-induced hepatotoxicity between rodents and humans. For example, although increased plasma aminotransferase activity is observed within 2 – 6 h of administration of a toxic dose of APAP [with peak activity achieved around 12 – 24 h in rodents (25)], an increased plasma transaminase activity is rarely observed before 12 – 24 h following ingestion and does not peak until 48 – 72 h in humans (26). In the present study, the first statistically significant decrease in cell viability was observed at 12 h after APAP treatment in NCP-cultured HepG2 cells, and a noticeable decrease was observed at 24 and 48 h after APAP treatment. The time course of cell injury and changes in GSH content and mitochondrial membrane potential induced by APAP in the NCP-cultured HepG2 system is not observed in rodents but was similar to that in humans and HepaRG cells, which is a human hepatoma cell line with high activity of CYP2E1 enzymes and has been reported to be useful as a human model for APAP-induced liver injury (27). In contrast, cell injury, decreased GSH con-tent, and mitochondrial membrane potential induced by APAP treatment were observed within 3 – 5 h in a mouse primary hepatocyte system (28, 29). These facts also support the potential of the NCP-HepG2 system as a human in vitro model of APAP-induced hepatotoxicity.
NAC, a precursor of GSH that causes NAPQI detoxi-fication, has been shown to produce remarkable effects against APAP-induced hepatotoxicity in rodents and humans (22, 30, 31). In the present study, NAC demon-strated such preventive effects against APAP-induced cell injury in NCP-cultured HepG2 cells but did not exhibit any effects on cell injury in the conventionally-cultured HepG2 cells. In addition, we demonstrated that SP600125 and CyA, which showed protective effects against APAP-induced hepatotoxicity in rodents in vivo (29, 32, 33), also attenuated APAP-induced cell injury in NCP-cultured HepG2 cells in vitro. These results indicate that APAP-induced cellular injury in this NCP-cultured HepG2 system share the same cell death mechanisms of APAP-induced hepatotoxicity in humans and rodents. In addition, these facts support the relevancy of this in vitro model of APAP-induced hepatotoxicity and suggest the utility of this APAP- induced hepatotoxicity model as an in vitro screening system of drug candidates (antidotes) against APAP- induced liver injury.
Molecular mechanisms of APAP-induced hepatocyte cell death have been evaluated by many researchers and seem to have become clearer (Supplementary Fig. 2: available in the online version only) (9, 34, 35). The toxic reactive metabolite NAPQI is detoxified by GSH resulting in extensive hepatic GSH depletion. Concur-rently, an increasing amount of NAPQI binds to cellular
proteins including mitochondrial proteins. Mitochondrial protein adducts cause generation of reactive oxygen species in mitochondria to induce the activation of glycogen synthase kinase-3b (GSK-3b), mixed-lineage kinase-3 (MLK3), and apoptosis signal-regulating kinase-1 (ASK-1) (36). The early phase of JNK activa-tion in APAP-induced hepatotoxicity most likely involves GSK-3b and MLK3, and the rate phase seems to involve ASK-1 through MAP Kinase Kinase (MKK) 4/7 activation (33, 37). JNK phosphorylation amplified further mitochondrial damage and induced subsequent mitochondrial permeability transition (MPT). The feed-back loop between JNK pathway activation and mito-chondrial damage may be involved in further MPT induction and mitochondrial damage (38). The signifi-cant opening of the MPT pore in the mitochondria with collapse of the membrane potential induce the release of mitochondrial intermembrane proteins such as apop-tosis inducing factor (AIF) (10). The collapse of the mitochondrial membrane potential with ATP depletion and nuclear degradation are key events leading to hepa-tocyte necrosis (39). It has been reported that knockout mice of ASK-1, JNK1, JNK2, or AIF gene showed low hepatotoxicity against APAP injection (40). In addition, pharmacological inhibition of JNK or MPT using SP600125 or CyA, respectively, showed marked inhibition of hepatotoxicity induced by APAP in mice (40, 41). Therefore, these molecules and events may play an important part in the development of cellular injury in APAP-induced hepatotoxicity. In this study, we demonstrated that SP600125 or CyA showed cytoprotec-tive effects against APAP-induced cell injury in NCP-cultured HepG2 cells and suggested that activation of the JNK pathway and MPT, at least in part, play impor-tant roles in the development of cell injury in our model.
In this study, a GSH precursor, NAC, prevented GSH depression, decrease in mitochondrial membrane potential, and JNK phosphorylation as well as cell injury induced by APAP in NCP-cultured HepG2 cells. As mentioned above, GSH depression is one of the most upstream events of the mechanisms of APAP- induced hepatotoxicity. NAC facilitated NAPQI detoxi-fication through GSH supplementation and may be able to inhibit changes in all of the parameters examined in this study. Besides, other mechanisms, such as anti-oxidant effects (42), anti-inflammatory effects (43) may be involved in the attenuating effects of NAC against APAP hepatotoxicity. Although the MPT inhibitor CyA significantly attenuated the decrease in mitochondrial membrane potential and JNK phosphorylation, GSH depression was not prevented by CyA. These results indicated that the preventive effects of CyA against APAP-induced cell injury were of little relevance to
227A Human Model of Acetaminophen Hepatitis
NAPQI production or GSH content. The reason for the inhibiting mechanisms of JNK phosphorylation by CyA may be discontinuation of the feedback loop between JNK pathway activation and mitochondrial damage. In fact, phosphorylation of JNK and subsequent mito-chondrial damage is not one-way; mitochondrial damage may induce further JNK phosphorylation (2nd hit), and it may amplify the decrease in mitochondrial membrane potential or mitochondrial damage in APAP-induced hepatotoxicity (34, 44) (Supplementary Fig. 2). By contrast, the JNK inhibitor SP600125 did not prevent the decrease in mitochondrial membrane potential in-duced by APAP exposure in NCP-cultured HepG2 cells, Nevertheless, JNK phosphorylation was almost completely prevented. Although the exact mechanisms of the lack of response to the mitochondrial membrane potential by SP600125 are unclear, less selectivity to the JNK1 or JNK2 of SP600125 may be involved. Bourdi et al. (45) demonstrated that JNK2 knockout mice had a higher mortality rate compared with wild-type mice and suggested that JNK2 is involved in the protec-tion against APAP-induced hepatotoxicity through the stimulation of hepatocyte proliferation and repair. Recently, Ni et al. (46) advocated that the effects of JNK inhibitors should be carefully evaluated on both injury mechanisms and regeneration. Therefore, further study will be warranted using selective JNK1 or JNK2 inhibition to solve this issue.
In the present study, SP600125 and CyA were dis-solved in DMSO and applied in the culture medium. DMSO has been commonly used in biological studies as an inert solvent to dissolve drugs with low water solu-bility. However, DMSO has been known to attenuate liver injury induced by APAP overdose in rodents, and often the facts confound evaluation of the protective effects of compounds with poor water solubility against APAP-induced liver injury (47, 48). In this study, we also confirmed that the treatment with 5% DMSO attenuated the increase in serum alanine aminotrans-ferase levels and hepatocellular necrosis induced by APAP (400 mg/kg, i.p.) in mice (Supplementary Fig. 3: available in the online version only). In contrast, 0.01% – 0.1% DMSO did not show any effects on APAP-induced cellular injury in NCP-cultured HepG2 cells (Supplementary Fig. 4: available in the online version only). One postulated reason for this is a slower NAPQI generation rate in NCP-cultured HepG2 cells in vitro than that in rodents in vivo, quantitated as the GSH depletion rate caused by CYP inhibition by DMSO. Alternatively, Masson et al. (49) reported that DMSO can reduce APAP-induced hepatotoxicity through the activation of natural killer T cells and natural killer cells in mice. These conflicting results of the effects of
DMSO between mice and the NCP–HepG2 system may be due to the existence of a type of cells other than hepatocytes, such as natural killer cells. Therefore, it should to be noted that if the test compound protects against APAP-induced liver injury only through the modulation of inflammatory cell activity, such as the inhibition of Kupffer cells or natural killer cells, it would not be able to exert a protective action in this in vitro model. These results suggest that the APAP-induced hepatotoxicity model using the NCP-cultured HepG2 system can evaluate the direct effects of test compounds on hepatocytes and that DMSO can be used as a solvent for lipophilic compounds in this system.
Other reports suggest that APAP-induced hepato-toxicity in humans has demonstrated mechanism-related consistency between the in vitro model compared with in vivo models or in patients (27, 50, 51). However, no reports have examined whether antidotes of APAP- induced hepatotoxicity, such as NAC, SP600125, and CyA, could attenuate APAP-induced cellular injury in in vitro models. In addition, we also examined the effects of antidotes on APAP-induced cell injury in an NCP-cultured HepG2 cell system, which suggests its useful-ness as a screening system for drug candidates against APAP-induced hepatotoxicity. Furthermore, our system using HepG2 cells can be conveniently and easily used compared with other expensive cells such as Hepa RG cells or human primary hepatocytes. These points are characteristic of our in vitro human APAP-induced hepatotoxicity model compared with other in vitro human models. Of course, further study will be needed to demonstrate the usefulness of the model using NCP-cultured HepG2 cells.
In summary, we have demonstrated that NCP-cultured HepG2 cells show key mechanistic features of APAP-induced hepatotoxicity, such as a decrease in intracellular GSH and mitochondrial membrane potential, activation of JNK, and cellular injury, after APAP treatment. In addition, we showed that antidotes of APAP-induced hepatotoxicity, such as NAC, SP600125, and CyA, could attenuate APAP-induced cellular injury in NCP-cultured HepG2 cells. These results suggest that cellular injury induced by APAP treatment using the NCP-cultured HepG2 system is a useful human model to study toxicity mechanisms and to screen drug candidates against APAP-induced hepatotoxicity.
Acknowledgments
The authors gratefully acknowledge the financial support from the Japan Society for the Promotion of Science (Grants-in-Aid for Scientific Research for Young Scientists (B), No. 21790524 and 23790603 to Y.I.).
228 K Aritomi et al
Conflicts of Interest
The authors declare that they have no competing interests.
References
1 Graham GG, Scott KF, Day RO. Tolerability of paracetamol. Drug Saf. 2005;28:227–240.
2 Li C, Martin BC. Trends in emergency department visits attribut-able to acetaminophen overdoses in the United States, 1993–2007. Pharmacoepidemiol Drug Saf. 2011;20:810–818.
3 Craig DG, Bates CM, Davidson JS, Martin KG, Hayes PC, Simpson KJ. Overdose pattern and outcome in paracetamol- induced acute severe hepatotoxicity. Br J Clin Pharmacol. 2011;71:273–282.
4 Gow PJ, Jones RM, Dobson JL, Angus PW. Etiology and out-come of fulminant hepatic failure managed at an Australian liver transplant unit. J Gastroenterol Hepatol. 2004;19:154–159.
5 Wei G, Bergquist A, Broomé U, Lindgren S, Wallerstedt S, Almer S, et al. Acute liver failure in Sweden, etiology and outcome. J Intern Med. 2007;262:393–401.
6 Lee SS, Buters JT, Pineau T, Fernandez-Salguero P, Gonzalez FJ. Role of CYP2E1 in the hepatotoxicity of acetaminophen. J Biol Chem. 1996;271:12063–12067.
7 Gonzalez FJ. Role of cytochromes P450 in chemical toxicity and oxidative stress, studies with CYP2E1. Mutat Res. 2005; 569:101–110.
8 Hanawa N, Shinohara M, Saberi B, Gaarde WA, Han D, Kaplowitz N. Role of JNK translocation to mitochondria leading to inhibition of mitochondria bioenergetics in acetaminophen-induced liver injury. J Biol Chem. 2008;283:13565–13577.
9 Hinson JA, Roberts DW, James LP. Mechanisms of acetamino-phen-induced liver necrosis. Handb Exp Pharmacol. 2010; 196:369–405.
10 Kon K, Kim JS, Jaeschke H, Lemasters JJ. Mitochondrial per-meability transition in acetaminophen-induced necrosis and apoptosis of cultured mouse hepatocytes. Hepatology. 2004;40: 1170–1179.
11 Ward J, Bala S, Petrasek J, Szabo G. Plasma microRNA profiles distinguish lethal injury in acetaminophen toxicity, a research study. World J Gastroenterol. 2012;18:2798–2804.
12 Noh JR, Kim YH, Hwang JH, Gang GT, Kim KS, Lee IK, et al. Davallialactone protects against acetaminophen overdose- induced liver injuries in mice. Food Chem Toxicol. 2013;58: 14–21.
13 Latchoumycandane C, Goh CW, Ong MM, Boelsterli UA. Mitochondrial protection by the JNK inhibitor leflunomide res-cues mice from acetaminophen-induced liver injury. Hepatology. 2007;45:412–421.
14 Manov I, Hirsh M, Iancu TC. N-acetylcysteine does not protect HepG2 cells against acetaminophen-induced apoptosis. Basic Clin Pharmacol Toxicol. 2004;94:213–225.
15 Thedinga E, Ullrich A, Drechsler S, Niendorf R, Kob A, Runge D, et al. In vitro system for the prediction of hepatotoxic effects in primary hepatocytes. ALTEX. 2007;24:22–34.
16 Nakamura K, Mizutani R, Sanbe A, Enosawa S, Kasahara M, Nakagawa A, et al. Evaluation of drug toxicity with hepatocytes cultured in a micro-space cell culture system. J Biosci Bioeng. 2011;111:78–84.
17 Nakamura K, Kato N, Aizawa K, Mizutani R, Yamauchi J,
Tanoue A. Expression of albumin and cytochrome P450 enzymes in HepG2 cells cultured with a nanotechnology-based culture plate with microfabricated scaffold. J Toxicol Sci. 2011;36: 625–633.
18 Tomishima Y, Ishitsuka Y, Matsunaga N, Nagatome M, Furusho H, Irikura M, et al. Ozagrel hydrochloride, a selective throm-boxane A2 synthase inhibitor, alleviates liver injury induced by acetaminophen overdose in mice. BMC Gastroenterol. 2013; 13:21.
19 McGill MR, Lebofsky M, Norris HR, Slawson MH, Bajt ML, Xie Y, et al. Plasma and liver acetaminophen-protein adduct levels in mice after acetaminophen treatment, dose-response, mechanisms, and clinical implications. Toxicol Appl Pharmacol. 2013;269:240–249.
20 Muldrew KL, James LP, Coop L, McCullough SS, Hendrickson HP, Hinson JA, et al. Determination of acetaminophen-protein adducts in mouse liver and serum and human serum after hepatotoxic doses of acetaminophen using high-performance liquid chromatography with electrochemical detection. Drug Metab Dispos. 2002;30:446–451.
21 Kondo Y, Ishitsuka Y, Kadowaki D, Fukumoto Y, Miyamoto Y, Irikura M, et al. Phosphoenolpyruvate, a glycolytic intermediate, as a cytoprotectant and antioxidant in ex-vivo cold-preserved mouse liver, a potential application for organ preservation. J Pharm Pharmacol. 2013;65:390–401.
22 James LP, McCullough SS, Lamps LW, Hinson JA. Effect of N-acetylcysteine on acetaminophen toxicity in mice, relationship to reactive nitrogen and cytokine formation. Toxicol Sci. 2003; 75:458–467.
23 Liang YL, Zhang ZH, Liu XJ, Liu XQ, Tao L, Zhang YF, et al. Melatonin protects against apoptosis-inducing factor (AIF)- dependent cell death during acetaminophen-induced acute liver failure. PLoS One. 2012;7:e51911.
24 Igusa Y, Yamashina S, Izumi K, Inami Y, Fukada H, Komatsu M, et al. Loss of autophagy promotes murine acetaminophen hepatotoxicity. J Gastroenterol. 2012;47:433–443.
25 Knight TR, Kurtz A, Bajt ML, Hinson JA, Jaeschke H. Vascular and hepatocellular peroxynitrite formation during acetaminophen toxicity, role of mitochondrial oxidant stress. Toxicol Sci. 2001; 62:212–220.
26 Singer AJ, Carracio TR, Mofenson HC. The temporal profile of increased transaminase levels in patients with acetaminophen-induced liver dysfunction. Ann Emerg Med. 1995;26:49–53.
27 McGill MR, Yan HM, Ramachandran A, Murray GJ, Rollins DE, Jaeschke H. HepaRG cells, a human model to study mecha-nisms of acetaminophen hepatotoxicity. Hepatology. 2011;53: 974–982.
28 Moon MS, Richie JP, Isom HC. Iron potentiates acetaminophen-induced oxidative stress and mitochondrial dysfunction in cultured mouse hepatocytes. Toxicol Sci. 2010;118:119–127.
29 Burke AS, MacMillan-Crow LA, Hinson JA. Reactive nitrogen species in acetaminophen-induced mitochondrial damage and toxicity in mouse hepatocytes. Chem Res Toxicol. 2010;23: 1286–1292.
30 Woodhead JL, Howell BA, Yang Y, Harrill AH, Clewell HJ, Andersen ME, et al. An analysis of N-acetylcysteine treatment for acetaminophen overdose using a systems model of drug- induced liver injury. J Pharmacol Exp Ther. 2012;342:529–540.
31 Blackford MG, Felter T, Gothard MD, Reed MD. Assessment of the clinical use of intravenous and oral N-acetylcysteine in
229A Human Model of Acetaminophen Hepatitis
the treatment of acute acetaminophen poisoning in children, a retrospective review. Clin Ther. 2011;33:1322–1330.
32 Masubuchi Y, Suda C, Horie T. Involvement of mitochondrial permeability transition in acetaminophen-induced liver injury in mice. J Hepatol. 2005;42:110–116.
33 Saito C, Lemasters JJ, Jaeschke H. c-Jun N-terminal kinase modulates oxidant stress and peroxynitrite formation indepen-dent of inducible nitric oxide synthase in acetaminophen hepato-toxicity. Toxicol Appl Pharmacol. 2010;246:8–17.
34 Jaeschke H, Williams CD, McGill MR, Xie Y, Ramachandran A. Models of drug-induced liver injury for evaluation of phytothera-peutics and other natural products. Food Chem Toxicol. 2013; 55:279–289.
35 Jaeschke H, McGill MR, Ramachandran A. Oxidant stress, mito-chondria, and cell death mechanisms in drug-induced liver injury, lessons learned from acetaminophen hepatotoxicity. Drug Metab Rev. 2012;44:88–106.
36 Shinohara M, Ybanez MD, Win S, Than TA, Jain S, Gaarde WA, et al. Silencing glycogen synthase kinase-3beta inhibits acetaminophen hepatotoxicity and attenuates JNK activation and loss of glutamate cysteine ligase and myeloid cell leukemia sequence 1. J Biol Chem. 2010;285:8244–8255.
37 Win S, Than TA, Han D, Petrovic LM, Kaplowitz N. c-Jun N-terminal kinase (JNK)-dependent acute liver injury from acetaminophen or tumor necrosis factor (TNF) requires mito-chondrial Sab protein expression in mice. J Biol Chem. 2011; 286:35071–35078.
38 LoGuidice A, Boelsterli UA. Acetaminophen overdose-induced liver injury in mice is mediated by peroxynitrite independently of the cyclophilin D-regulated permeability transition. Hepatology. 2011;54:969–978.
39 Cover C, Liu J, Farhood A, Malle E, Waalkes MP, Bajt ML, et al. Pathophysiological role of the acute inflammatory response during acetaminophen hepatotoxicity. Toxicol Appl Pharmacol. 2006;216:98–107.
40 Nakagawa H, Maeda S, Hikiba Y, Ohmae T, Shibata W, Yanai A, et al. Deletion of apoptosis signal-regulating kinase 1 attenuates acetaminophen-induced liver injury by inhibiting c-Jun N-terminal kinase activation. Gastroenterology. 2008;135: 1311–1321.
41 Kon K, Ikejima K, Okumura K, Aoyama T, Arai K, Takei Y, et al. Role of apoptosis in acetaminophen hepatotoxicity. J Gastro-enterol Hepatol. 2007;22:Suppl 1S49–1S52.
42 Bajt ML, Knight TR, Lemasters JJ, Jaeschke H. Acetaminophen-induced oxidant stress and cell injury in cultured mouse hepato-cytes, protection by N-acetyl cysteine. Toxicol Sci. 2004;80: 343–349.
43 Bémeur C, Vaquero J, Desjardins P, Butterworth RF. N-acetyl-cysteine attenuates cerebral complications of non-acetamino-phen-induced acute liver failure in mice, antioxidant and anti- inflammatory mechanisms. Metab Brain Dis. 2010;25:241–249.
44 Han D, Dara L, Win S, Than TA, Yuan L, Abbasi SQ, et al. Regu-lation of drug-induced liver injury by signal transduction pathways, critical role of mitochondria. Trends Pharmacol Sci. 2013;34:243–253.
45 Bourdi M, Korrapati MC, Chakraborty M, Yee SB, Pohl LR. Protective role of c-Jun N-terminal kinase 2 in acetaminophen-induced liver injury. Biochem Biophys Res Commun. 2008;374: 6–10.
46 Ni HM, Williams JA, Jaeschke H, Ding WX. Zonated induction of autophagy and mitochondrial spheroids limits acetaminophen-induced necrosis in the liver. Redox Biol. 2013;1:427–432.
47 Park Y, Smith RD, Combs AB, Kehrer JP. Prevention of acetaminophen-induced hepatotoxicity by dimethyl sulfoxide. Toxicology. 1988;52:165–175.
48 Yoon MY, Kim SJ, Lee BH, Chung JH, Kim YC. Effects of dimethylsulfoxide on metabolism and toxicity of acetaminophen in mice. Biol Pharm Bull. 2006;29:1618–1624.
49 Masson MJ, Carpenter LD, Graf ML, Pohl LR. Pathogenic role of natural killer T and natural killer cells in acetaminophen- induced liver injury in mice is dependent on the presence of dimethyl sulfoxide. Hepatology. 2008;48:889–897.
50 Schyschka L, Sánchez JJ, Wang Z, Burkhardt B, Müller-Vieira U, Zeilinger K, et al. Hepatic 3D cultures but not 2D cultures preserve specific transporter activity for acetaminophen-induced hepatotoxicity. Arch Toxicol. 2013;87:1581–1593.
51 Prot JM, Briffaut AS, Letourneur F, Chafey P, Merlier F, Grandvalet Y, et al. Integrated proteomic and transcriptomic investigation of the acetaminophen toxicity in liver microfluidic biochip. PLoS One. 2011;6:e21268.