Embed Size (px)
Citation preview
Evaluation of the
Science Learning
Centre Network:
annex
Charlotte Clarke & Graham Thom
Department for Education and the
Wellcome Trust

This research report was commissioned before the new UK Government took office on 11 May 2010. As a result the content may not reflect current Government policy and may make reference to the Department for Children, Schools and Families (DCSF) which has now been replaced by the Department for Education (DfE). The views expressed in this report are the authors’ and do not necessarily reflect those of the Department for Education.
Contents
Annex A: Core evaluation questions ................................................................................. A-1
Annex B: Summary of methodology .................................................................................. B-1
Annex C: Summary of findings from e-survey of SLC users and follow-up interviewsC-1
Annex D: Summary of findings from the national educator telephone survey ............. D-1
Annex E: Relationship between usage of SLCs and attainment in schools.................. E-1
Annex F: Locations of Science Learning Centres ............................................................ F-1
A-1
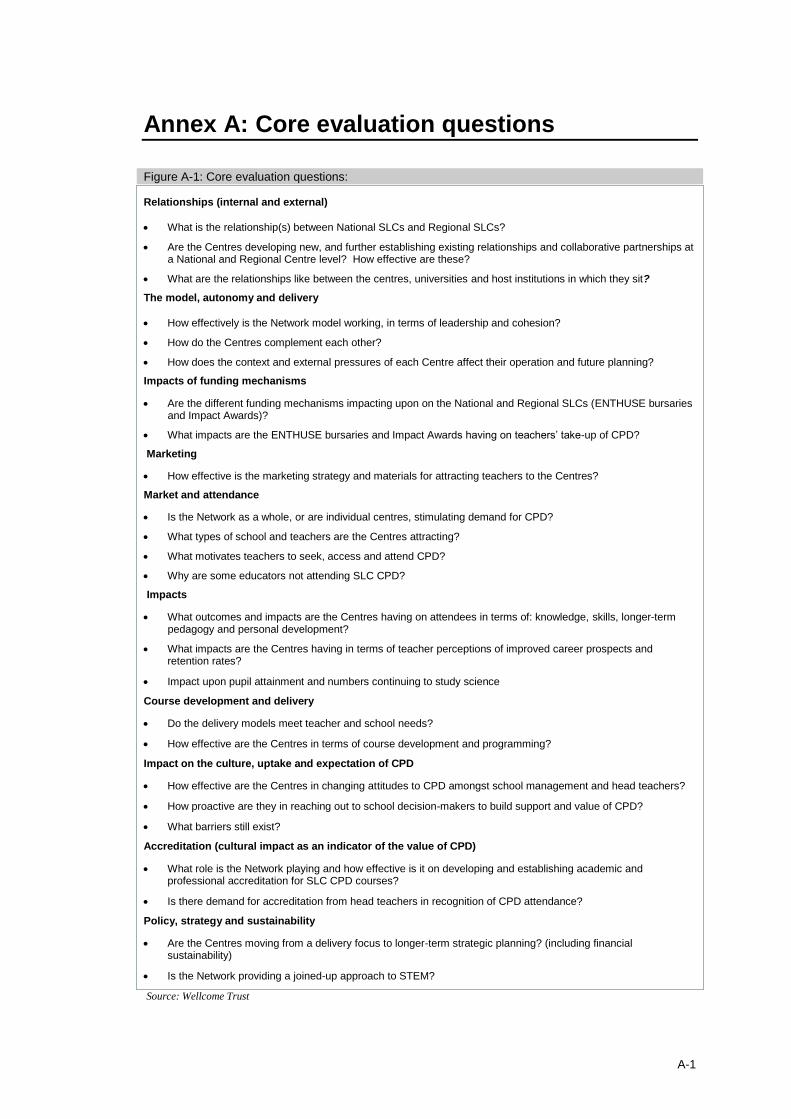
Annex A: Core evaluation questions
Figure A-1: Core evaluation questions:
Relationships (internal and external)
What is the relationship(s) between National SLCs and Regional SLCs?
Are the Centres developing new, and further establishing existing relationships and collaborative partnerships at a National and Regional Centre level? How effective are these?
What are the relationships like between the centres, universities and host institutions in which they sit?
The model, autonomy and delivery
How effectively is the Network model working, in terms of leadership and cohesion?
How do the Centres complement each other?
How does the context and external pressures of each Centre affect their operation and future planning?
Impacts of funding mechanisms
Are the different funding mechanisms impacting upon on the National and Regional SLCs (ENTHUSE bursaries and Impact Awards)?
What impacts are the ENTHUSE bursaries and Impact Awards having on teachers’ take-up of CPD?
Marketing
How effective is the marketing strategy and materials for attracting teachers to the Centres?
Market and attendance
Is the Network as a whole, or are individual centres, stimulating demand for CPD?
What types of school and teachers are the Centres attracting?
What motivates teachers to seek, access and attend CPD?
Why are some educators not attending SLC CPD?
Impacts
What outcomes and impacts are the Centres having on attendees in terms of: knowledge, skills, longer-term pedagogy and personal development?
What impacts are the Centres having in terms of teacher perceptions of improved career prospects and retention rates?
Impact upon pupil attainment and numbers continuing to study science
Course development and delivery
Do the delivery models meet teacher and school needs?
How effective are the Centres in terms of course development and programming?
Impact on the culture, uptake and expectation of CPD
How effective are the Centres in changing attitudes to CPD amongst school management and head teachers?
How proactive are they in reaching out to school decision-makers to build support and value of CPD?
What barriers still exist?
Accreditation (cultural impact as an indicator of the value of CPD)
What role is the Network playing and how effective is it on developing and establishing academic and professional accreditation for SLC CPD courses?
Is there demand for accreditation from head teachers in recognition of CPD attendance?
Policy, strategy and sustainability
Are the Centres moving from a delivery focus to longer-term strategic planning? (including financial sustainability)
Is the Network providing a joined-up approach to STEM?
Source: Wellcome Trust
B-1
Annex B: Summary of methodology
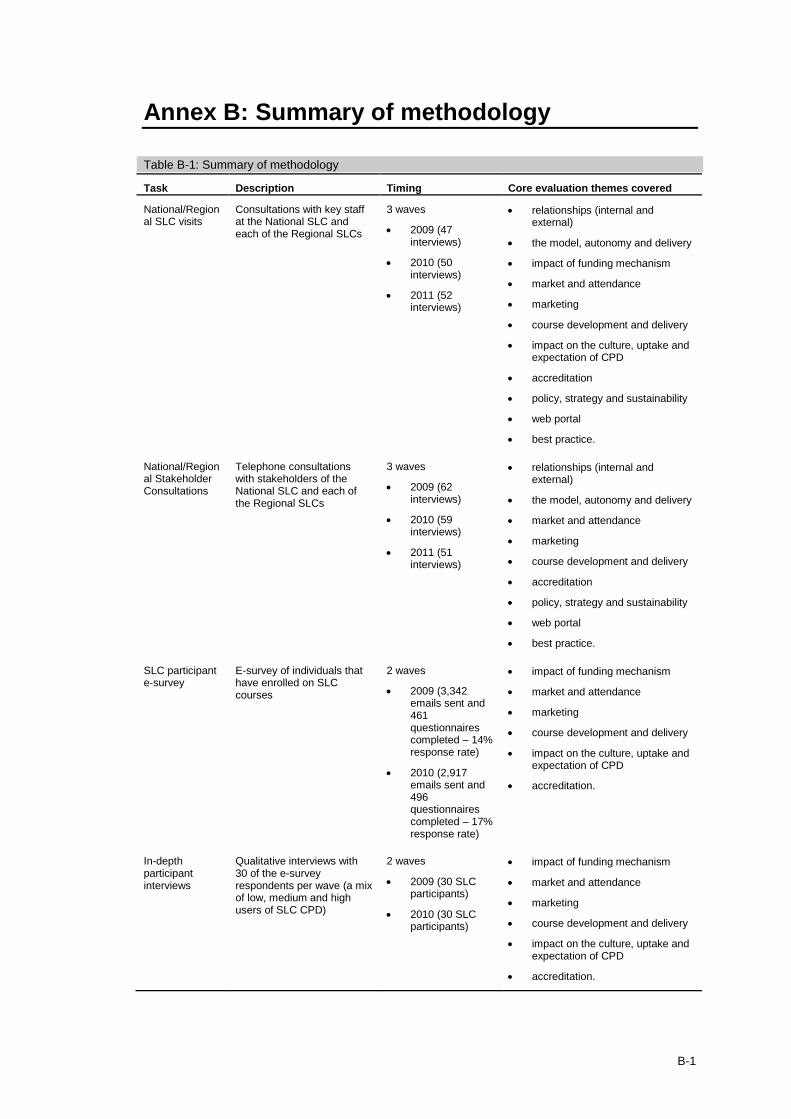
Table B-1: Summary of methodology
Task Description Timing Core evaluation themes covered
National/Regional SLC visits
Consultations with key staff at the National SLC and each of the Regional SLCs
3 waves
2009 (47 interviews)
2010 (50 interviews)
2011 (52 interviews)
relationships (internal and external)
the model, autonomy and delivery
impact of funding mechanism
market and attendance
marketing
course development and delivery
impact on the culture, uptake and expectation of CPD
accreditation
policy, strategy and sustainability
web portal
best practice.
National/Regional Stakeholder Consultations
Telephone consultations with stakeholders of the National SLC and each of the Regional SLCs
3 waves
2009 (62 interviews)
2010 (59 interviews)
2011 (51 interviews)
relationships (internal and external)
the model, autonomy and delivery
market and attendance
marketing
course development and delivery
accreditation
policy, strategy and sustainability
web portal
best practice.
SLC participant e-survey
E-survey of individuals that have enrolled on SLC courses
2 waves
2009 (3,342 emails sent and 461 questionnaires completed – 14% response rate)
2010 (2,917 emails sent and 496 questionnaires completed – 17% response rate)
impact of funding mechanism
market and attendance
marketing
course development and delivery
impact on the culture, uptake and expectation of CPD
accreditation.
In-depth participant interviews
Qualitative interviews with 30 of the e-survey respondents per wave (a mix of low, medium and high users of SLC CPD)
2 waves
2009 (30 SLC participants)
2010 (30 SLC participants)
impact of funding mechanism
market and attendance
marketing
course development and delivery
impact on the culture, uptake and expectation of CPD
accreditation.

B-2
Task Description Timing Core evaluation themes covered
National science educator survey
National telephone survey of 1,402 science educators to explore issues related to science CPD activity
1.
2010 impact on the culture, uptake and expectation of CPD.
Analysis of performance data
Analysis of centrally held data on course attendances and cancellations.
3 waves
2009
2010
2011
impact of funding mechanism
market and attendance
impact on the culture, uptake and expectation of CPD.
School case studies
Case studies of science CPD activity in schools that have engaged with the SLC Network (details of schools that have engaged with the Network were provided by the Regional and National SLCs and a sample of these were selected – providing coverage of all the regions and of school types)
These were conducted as face-to-face visits in 2009 and 2010, with telephone follow-ups in 2011.
3 waves
2009 (21 schools)
2010 (24 schools)
2011 (23 schools – comprising a mix of those interviewed in previous years)
impact of funding mechanism
market and attendance
marketing
course development and delivery
impact on the culture, uptake and expectation of CPD
accreditation.
Source: SQW
Approach to qualitative data analysis
B.2 In the Annexes that follow we provide a detailed summary of the methodology that was
adopted in undertaking the quantitative aspects of this evaluation, as well as the detailed
findings of the different quantitative research strands.
B.3 The qualitative strands of this evaluation comprised three key elements as described in Table
B-1 (above). These were:
in-depth face-to-face interviews with staff at the Regional and National SLCs
telephone interviews with stakeholders of the Regional and National SLCs
school case study visits
B.4 For all aspects of the qualitative fieldwork, the research team used structured topic guides
(agreed by the Wellcome Trust and DfE) which focused on the core research questions
outlined in Annex A. Notes of interviews were compiled against the research themes and
internal meetings were held to refine and test findings. The findings of the qualitative
research were presented in detail in our first interim report, and were updated in detail in the
second interim report to reflect any changes between the two reporting points. In this final
report we have reviewed the qualitative feedback from staff, stakeholders and schools in the
most recent wave of fieldwork to identify any changes in perceptions and opinions, or indeed
consistent views, over the lifetime of the evaluation, and we have summarised the findings in
the main body of the report
1 This is a follow-up survey to one undertaken by GHK (as part of the Stage 1 evaluation) and published in January
2008
C-1
Annex C: Summary of findings from e-survey of SLC users and follow-up interviews
Introduction
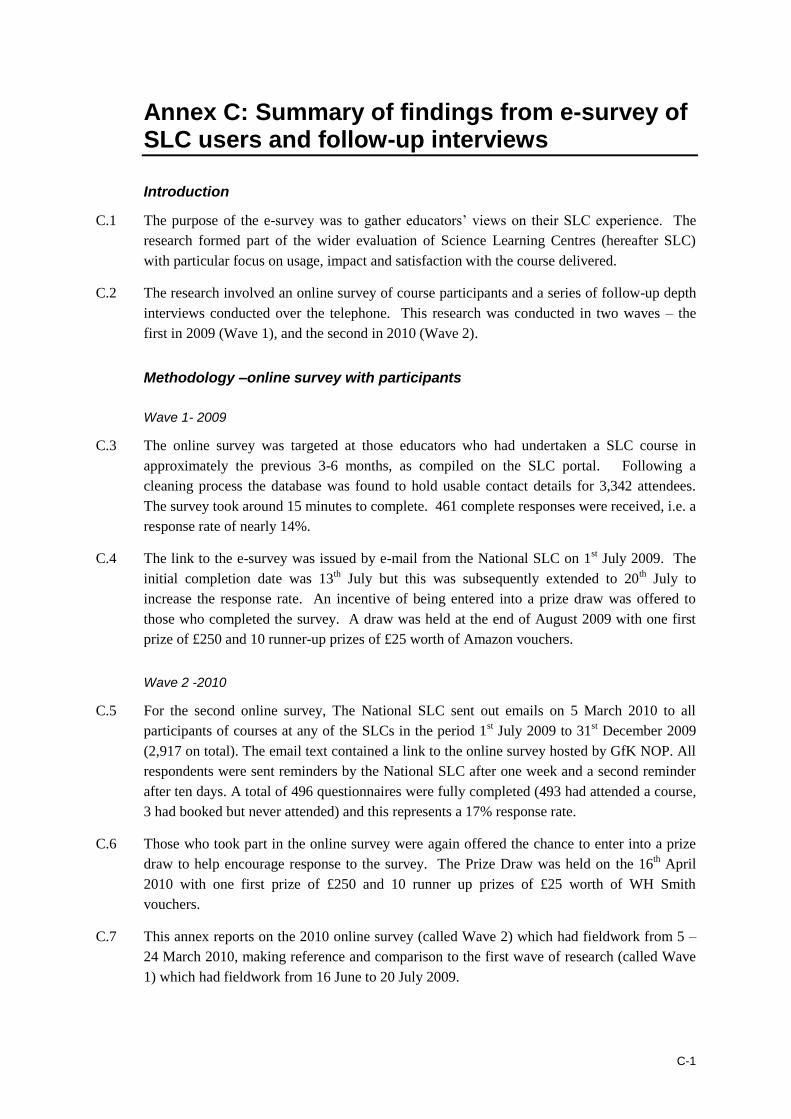
C.1 The purpose of the e-survey was to gather educators’ views on their SLC experience. The
research formed part of the wider evaluation of Science Learning Centres (hereafter SLC)
with particular focus on usage, impact and satisfaction with the course delivered.
C.2 The research involved an online survey of course participants and a series of follow-up depth
interviews conducted over the telephone. This research was conducted in two waves – the
first in 2009 (Wave 1), and the second in 2010 (Wave 2).
Methodology –online survey with participants
Wave 1- 2009
C.3 The online survey was targeted at those educators who had undertaken a SLC course in
approximately the previous 3-6 months, as compiled on the SLC portal. Following a
cleaning process the database was found to hold usable contact details for 3,342 attendees.
The survey took around 15 minutes to complete. 461 complete responses were received, i.e. a
response rate of nearly 14%.
C.4 The link to the e-survey was issued by e-mail from the National SLC on 1st July 2009. The
initial completion date was 13th July but this was subsequently extended to 20
th July to
increase the response rate. An incentive of being entered into a prize draw was offered to
those who completed the survey. A draw was held at the end of August 2009 with one first
prize of £250 and 10 runner-up prizes of £25 worth of Amazon vouchers.
Wave 2 -2010
C.5 For the second online survey, The National SLC sent out emails on 5 March 2010 to all
participants of courses at any of the SLCs in the period 1st July 2009 to 31
st December 2009
(2,917 on total). The email text contained a link to the online survey hosted by GfK NOP. All
respondents were sent reminders by the National SLC after one week and a second reminder
after ten days. A total of 496 questionnaires were fully completed (493 had attended a course,
3 had booked but never attended) and this represents a 17% response rate.
C.6 Those who took part in the online survey were again offered the chance to enter into a prize
draw to help encourage response to the survey. The Prize Draw was held on the 16th April
2010 with one first prize of £250 and 10 runner up prizes of £25 worth of WH Smith
vouchers.
C.7 This annex reports on the 2010 online survey (called Wave 2) which had fieldwork from 5 –
24 March 2010, making reference and comparison to the first wave of research (called Wave
1) which had fieldwork from 16 June to 20 July 2009.
C-2
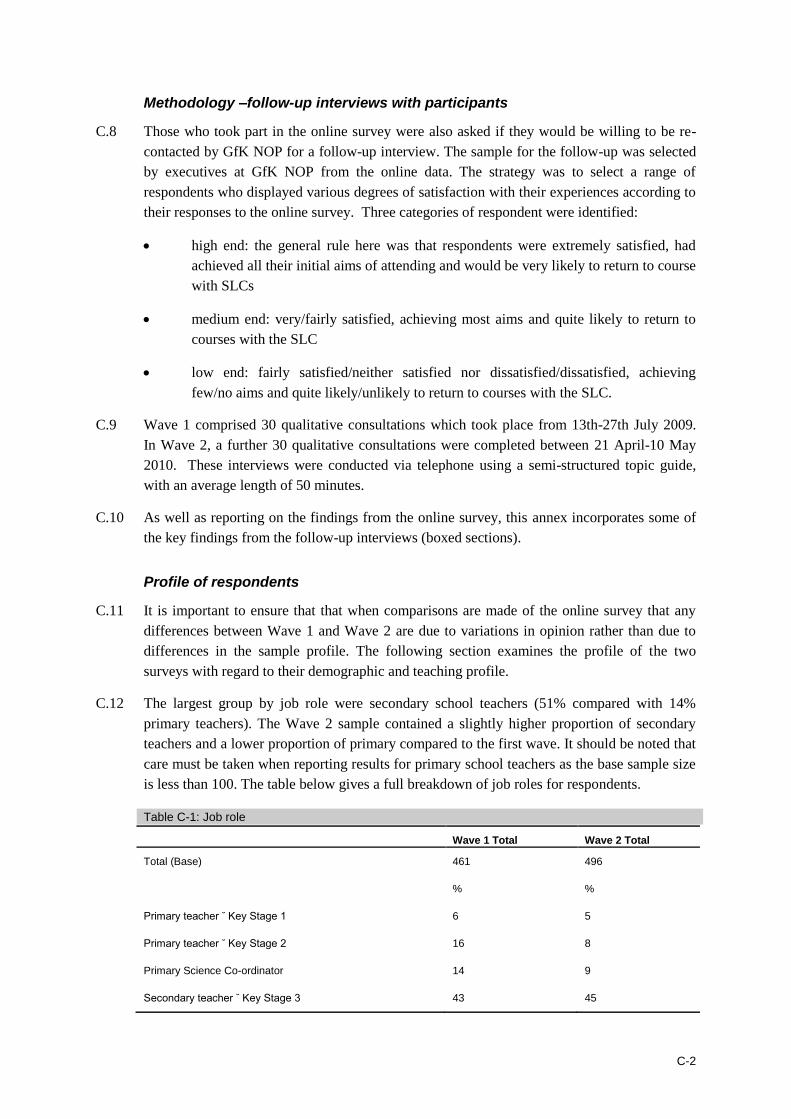
Methodology –follow-up interviews with participants
C.8 Those who took part in the online survey were also asked if they would be willing to be re-
contacted by GfK NOP for a follow-up interview. The sample for the follow-up was selected
by executives at GfK NOP from the online data. The strategy was to select a range of
respondents who displayed various degrees of satisfaction with their experiences according to
their responses to the online survey. Three categories of respondent were identified:
high end: the general rule here was that respondents were extremely satisfied, had
achieved all their initial aims of attending and would be very likely to return to course
with SLCs
medium end: very/fairly satisfied, achieving most aims and quite likely to return to
courses with the SLC
low end: fairly satisfied/neither satisfied nor dissatisfied/dissatisfied, achieving
few/no aims and quite likely/unlikely to return to courses with the SLC.
C.9 Wave 1 comprised 30 qualitative consultations which took place from 13th-27th July 2009.
In Wave 2, a further 30 qualitative consultations were completed between 21 April-10 May
2010. These interviews were conducted via telephone using a semi-structured topic guide,
with an average length of 50 minutes.
C.10 As well as reporting on the findings from the online survey, this annex incorporates some of
the key findings from the follow-up interviews (boxed sections).
Profile of respondents
C.11 It is important to ensure that that when comparisons are made of the online survey that any
differences between Wave 1 and Wave 2 are due to variations in opinion rather than due to
differences in the sample profile. The following section examines the profile of the two
surveys with regard to their demographic and teaching profile.
C.12 The largest group by job role were secondary school teachers (51% compared with 14%
primary teachers). The Wave 2 sample contained a slightly higher proportion of secondary
teachers and a lower proportion of primary compared to the first wave. It should be noted that
care must be taken when reporting results for primary school teachers as the base sample size
is less than 100. The table below gives a full breakdown of job roles for respondents.
Table C-1: Job role
Wave 1 Total Wave 2 Total
Total (Base) 461 496
% %
Primary teacher ˘ Key Stage 1 6 5
Primary teacher ˘ Key Stage 2 16 8
Primary Science Co-ordinator 14 9
Secondary teacher ˘ Key Stage 3 43 45
C-3
Wave 1 Total Wave 2 Total
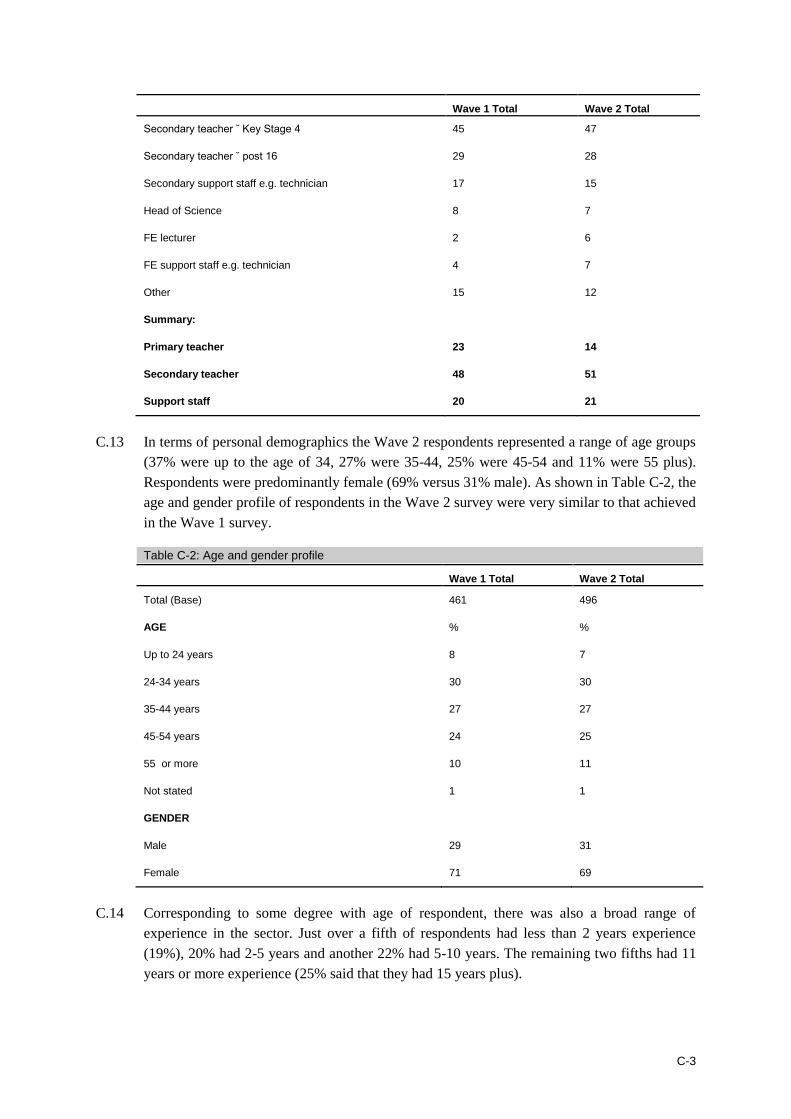
Secondary teacher ˘ Key Stage 4 45 47
Secondary teacher ˘ post 16 29 28
Secondary support staff e.g. technician 17 15
Head of Science 8 7
FE lecturer 2 6
FE support staff e.g. technician 4 7
Other 15 12
Summary:
Primary teacher 23 14
Secondary teacher 48 51
Support staff 20 21
C.13 In terms of personal demographics the Wave 2 respondents represented a range of age groups
(37% were up to the age of 34, 27% were 35-44, 25% were 45-54 and 11% were 55 plus).
Respondents were predominantly female (69% versus 31% male). As shown in Table C-2, the
age and gender profile of respondents in the Wave 2 survey were very similar to that achieved
in the Wave 1 survey.
Table C-2: Age and gender profile
Wave 1 Total Wave 2 Total
Total (Base) 461 496
AGE % %
Up to 24 years 8 7
24-34 years 30 30
35-44 years 27 27
45-54 years 24 25
55 or more 10 11
Not stated 1 1
GENDER
Male 29 31
Female 71 69
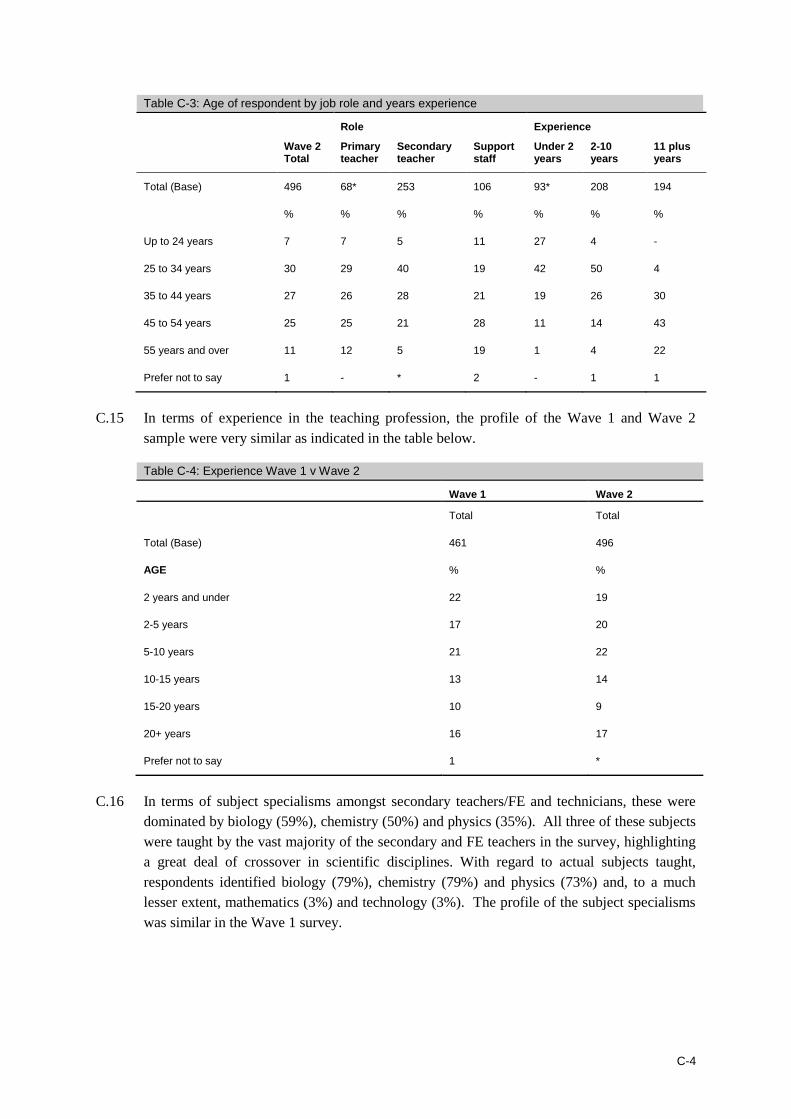
C.14 Corresponding to some degree with age of respondent, there was also a broad range of
experience in the sector. Just over a fifth of respondents had less than 2 years experience
(19%), 20% had 2-5 years and another 22% had 5-10 years. The remaining two fifths had 11
years or more experience (25% said that they had 15 years plus).
C-4
Table C-3: Age of respondent by job role and years experience
Role Experience
Wave 2 Total
Primary teacher
Secondary teacher
Support staff
Under 2 years
2-10 years
11 plus years
Total (Base) 496 68* 253 106 93* 208 194
% % % % % % %
Up to 24 years 7 7 5 11 27 4 -
25 to 34 years 30 29 40 19 42 50 4
35 to 44 years 27 26 28 21 19 26 30
45 to 54 years 25 25 21 28 11 14 43
55 years and over 11 12 5 19 1 4 22
Prefer not to say 1 - * 2 - 1 1
C.15 In terms of experience in the teaching profession, the profile of the Wave 1 and Wave 2
sample were very similar as indicated in the table below.
Table C-4: Experience Wave 1 v Wave 2
Wave 1 Wave 2
Total Total
Total (Base) 461 496
AGE % %
2 years and under 22 19
2-5 years 17 20
5-10 years 21 22
10-15 years 13 14
15-20 years 10 9
20+ years 16 17
Prefer not to say 1 *
C.16 In terms of subject specialisms amongst secondary teachers/FE and technicians, these were
dominated by biology (59%), chemistry (50%) and physics (35%). All three of these subjects
were taught by the vast majority of the secondary and FE teachers in the survey, highlighting
a great deal of crossover in scientific disciplines. With regard to actual subjects taught,
respondents identified biology (79%), chemistry (79%) and physics (73%) and, to a much
lesser extent, mathematics (3%) and technology (3%). The profile of the subject specialisms
was similar in the Wave 1 survey.

C-5
Table C-5: Subject specialisms (secondary/FE)
Wave 1 Wave 2
Total secondary/FE(Base) 332 401
% %
Biology 65 59
Chemistry 44 50
Physics 42 35
Mathematics 4 3
Technology 3 3
Psychology 2 1
Applied sciences 1 -
Environmental science 1 -
Others 6 6
No answer * *
None 1 *
Table C-6: Subjects taught (secondary/FE)
Wave 1 Wave 2
Total secondary/FE(Base) 332 401
% %
Biology 86 79
Chemistry 84 79
Physics 83 73
Mathematics 8 9
Technology 4 6
General science/science (unspecified) 2 2
Psychology 2 1
Health/healthcare/health and social care 2 1
Applied sciences 1 1
IT/ICT 2 *
Environmental science 1 *
All/everything 1 *
PE 1 *
Others 5 5
C-6
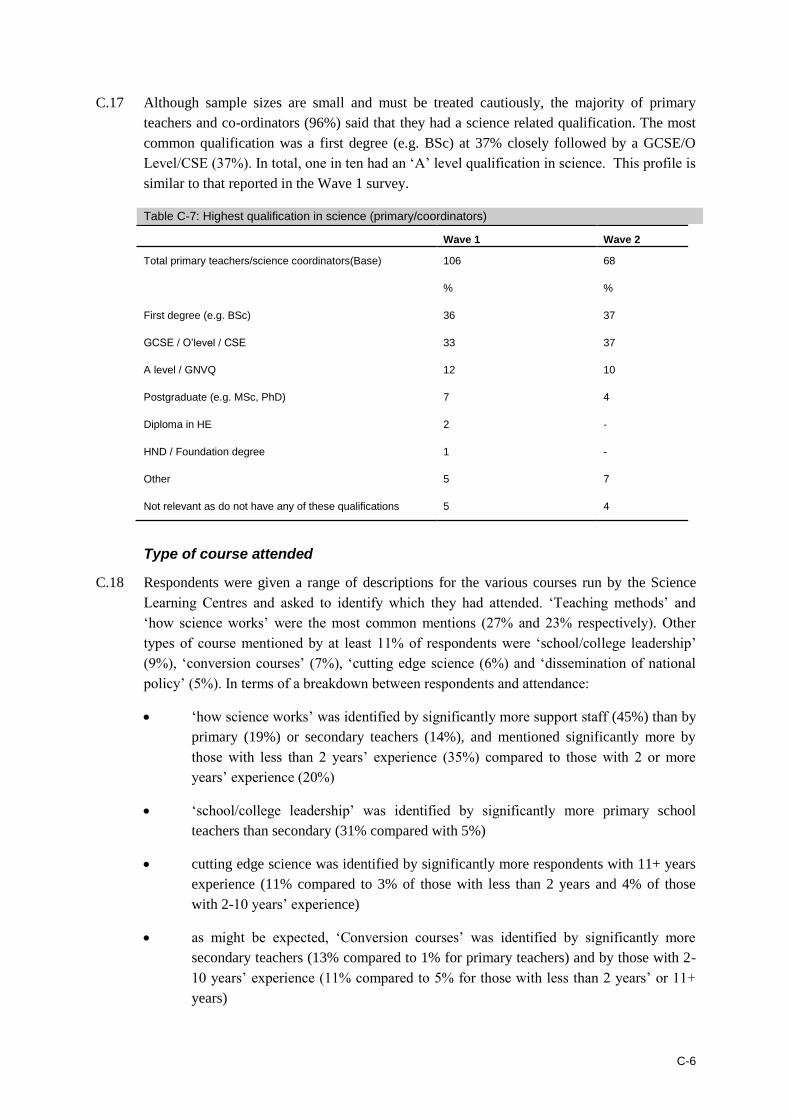
C.17 Although sample sizes are small and must be treated cautiously, the majority of primary
teachers and co-ordinators (96%) said that they had a science related qualification. The most
common qualification was a first degree (e.g. BSc) at 37% closely followed by a GCSE/O
Level/CSE (37%). In total, one in ten had an ‘A’ level qualification in science. This profile is
similar to that reported in the Wave 1 survey.
Table C-7: Highest qualification in science (primary/coordinators)
Wave 1 Wave 2
Total primary teachers/science coordinators(Base) 106 68
% %
First degree (e.g. BSc) 36 37
GCSE / O’level / CSE 33 37
A level / GNVQ 12 10
Postgraduate (e.g. MSc, PhD) 7 4
Diploma in HE 2 -
HND / Foundation degree 1 -
Other 5 7
Not relevant as do not have any of these qualifications 5 4
Type of course attended
C.18 Respondents were given a range of descriptions for the various courses run by the Science
Learning Centres and asked to identify which they had attended. ‘Teaching methods’ and
‘how science works’ were the most common mentions (27% and 23% respectively). Other
types of course mentioned by at least 11% of respondents were ‘school/college leadership’
(9%), ‘conversion courses’ (7%), ‘cutting edge science (6%) and ‘dissemination of national
policy’ (5%). In terms of a breakdown between respondents and attendance:
‘how science works’ was identified by significantly more support staff (45%) than by
primary (19%) or secondary teachers (14%), and mentioned significantly more by
those with less than 2 years’ experience (35%) compared to those with 2 or more
years’ experience (20%)
‘school/college leadership’ was identified by significantly more primary school
teachers than secondary (31% compared with 5%)
cutting edge science was identified by significantly more respondents with 11+ years
experience (11% compared to 3% of those with less than 2 years and 4% of those
with 2-10 years’ experience)
as might be expected, ‘Conversion courses’ was identified by significantly more
secondary teachers (13% compared to 1% for primary teachers) and by those with 2-
10 years’ experience (11% compared to 5% for those with less than 2 years’ or 11+
years)

C-7
‘networking’ was identified significantly more by those with 2-10 years’ experience
than those with 11+ years (5% compared with 1%).
Table C-8: Type of course by job role and experience in role
Wave 2 Total
Role Experience
Total Primary teacher
Secondary teacher
Support staff
Under 2 years
2-10 years
11 plus years
Base: All who attended a course
493 68* 251 105 93* 206 193
% % % % % % %
Teaching methods (e.g. Teaching Electricity for Non-physicists)
27 31 37 6 25 29 26
How science works (e.g. The Role of Practical Work)
23 19 14 45 35 20 19
School / college leadership (e.g. How to be a Primary Science Co-ordinator)
9 31 5 6 4 10 11
Conversion courses (e.g. Physics for Biologists)
7 1 13 2 5 11 5
Cutting edge science (e.g. Introduction to Nanotechnology)
6 1 8 6 3 4 11
Dissemination of national policy (e.g. Getting More Girls to Study Physics)
5 4 6 1 2 5 6
Networking (e.g. Schools Offering 21st Century Science)
4 3 3 3 2 5 4
Health and safety 2 - * 8 3 1 2
Skills for technicians 4 - * 19 6 4 4
Management skills * - * - - - 1
Planning STEM courses 1 - 2 - 1 1 2
Others 11 9 11 6 12 10 10
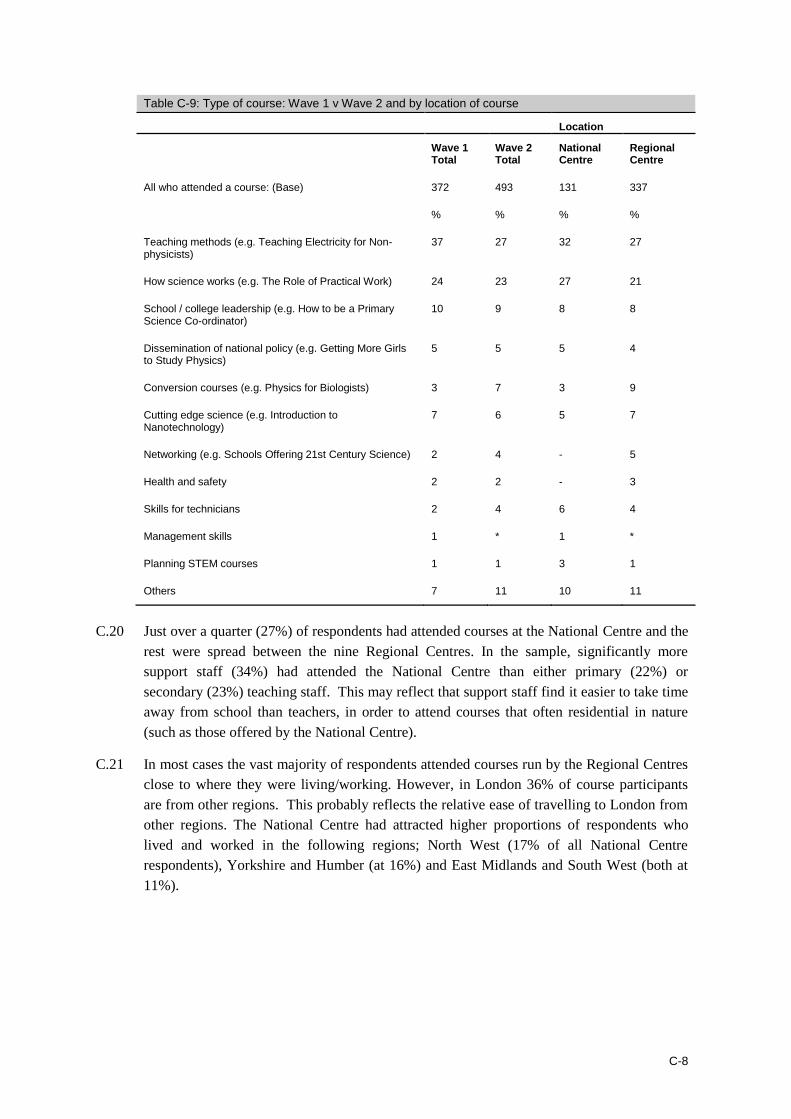
C.19 Comparing the course taken by respondents in the two samples, the range of course taken was
fairly similar, although there were fewer respondents who took the ‘Teaching methods’
course in Wave 2 (27% compared to 37% in Wave 1). The National Centres hosted a similar
range of courses to the Regional Centres as shown in Table C-9.
C-8
Table C-9: Type of course: Wave 1 v Wave 2 and by location of course
Location
Wave 1 Total
Wave 2 Total
National Centre
Regional Centre
All who attended a course: (Base) 372 493 131 337
% % % %
Teaching methods (e.g. Teaching Electricity for Non-physicists)
37 27 32 27
How science works (e.g. The Role of Practical Work) 24 23 27 21
School / college leadership (e.g. How to be a Primary Science Co-ordinator)
10 9 8 8
Dissemination of national policy (e.g. Getting More Girls to Study Physics)
5 5 5 4
Conversion courses (e.g. Physics for Biologists) 3 7 3 9
Cutting edge science (e.g. Introduction to Nanotechnology)
7 6 5 7
Networking (e.g. Schools Offering 21st Century Science) 2 4 - 5
Health and safety 2 2 - 3
Skills for technicians 2 4 6 4
Management skills 1 * 1 *
Planning STEM courses 1 1 3 1
Others 7 11 10 11
C.20 Just over a quarter (27%) of respondents had attended courses at the National Centre and the
rest were spread between the nine Regional Centres. In the sample, significantly more
support staff (34%) had attended the National Centre than either primary (22%) or
secondary (23%) teaching staff. This may reflect that support staff find it easier to take time
away from school than teachers, in order to attend courses that often residential in nature
(such as those offered by the National Centre).
C.21 In most cases the vast majority of respondents attended courses run by the Regional Centres
close to where they were living/working. However, in London 36% of course participants
are from other regions. This probably reflects the relative ease of travelling to London from
other regions. The National Centre had attracted higher proportions of respondents who
lived and worked in the following regions; North West (17% of all National Centre
respondents), Yorkshire and Humber (at 16%) and East Midlands and South West (both at
11%).
C-9
Table C-10: Location of course by job role
Role
Total Primary teacher
Secondary teacher
Support staff
Total (Base) 493 68* 251 105
% % % %
National Centre 27 22 23 34
London Centre 15 10 14 20
South East of England Centre 12 15 14 13
East of England Centre 8 12 10 6
North West of England Centre 7 10 7 1
North East of England Centre 6 10 6 3
East Midlands Centre 6 1 5 14
Yorks and Humber Centre 5 6 7 2
West Midlands Centre 5 6 5 -
South West of England Centre 4 6 3 4
Don’t know 4 1 5 3
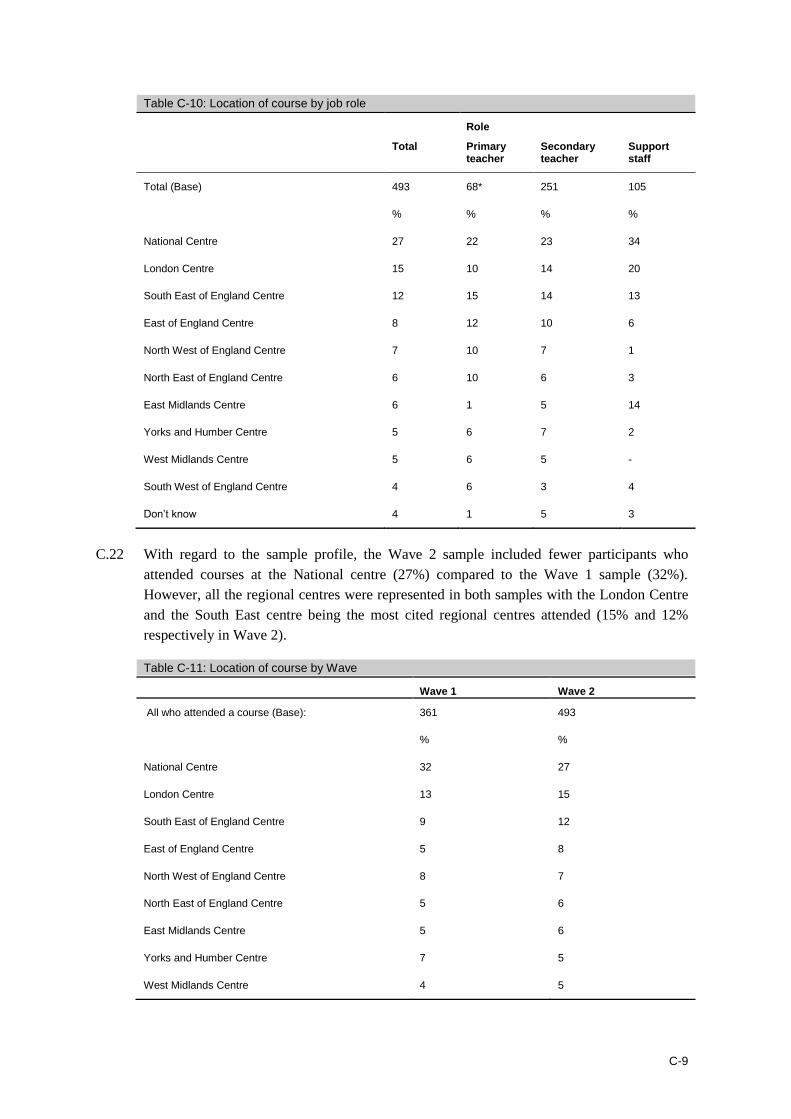
C.22 With regard to the sample profile, the Wave 2 sample included fewer participants who
attended courses at the National centre (27%) compared to the Wave 1 sample (32%).
However, all the regional centres were represented in both samples with the London Centre
and the South East centre being the most cited regional centres attended (15% and 12%
respectively in Wave 2).
Table C-11: Location of course by Wave
Wave 1 Wave 2
All who attended a course (Base): 361 493
% %
National Centre 32 27
London Centre 13 15
South East of England Centre 9 12
East of England Centre 5 8
North West of England Centre 8 7
North East of England Centre 5 6
East Midlands Centre 5 6
Yorks and Humber Centre 7 5
West Midlands Centre 4 5
C-10
Wave 1 Wave 2
South West of England Centre 9 4
Don’t know 2 4
Prefer not to say - 1
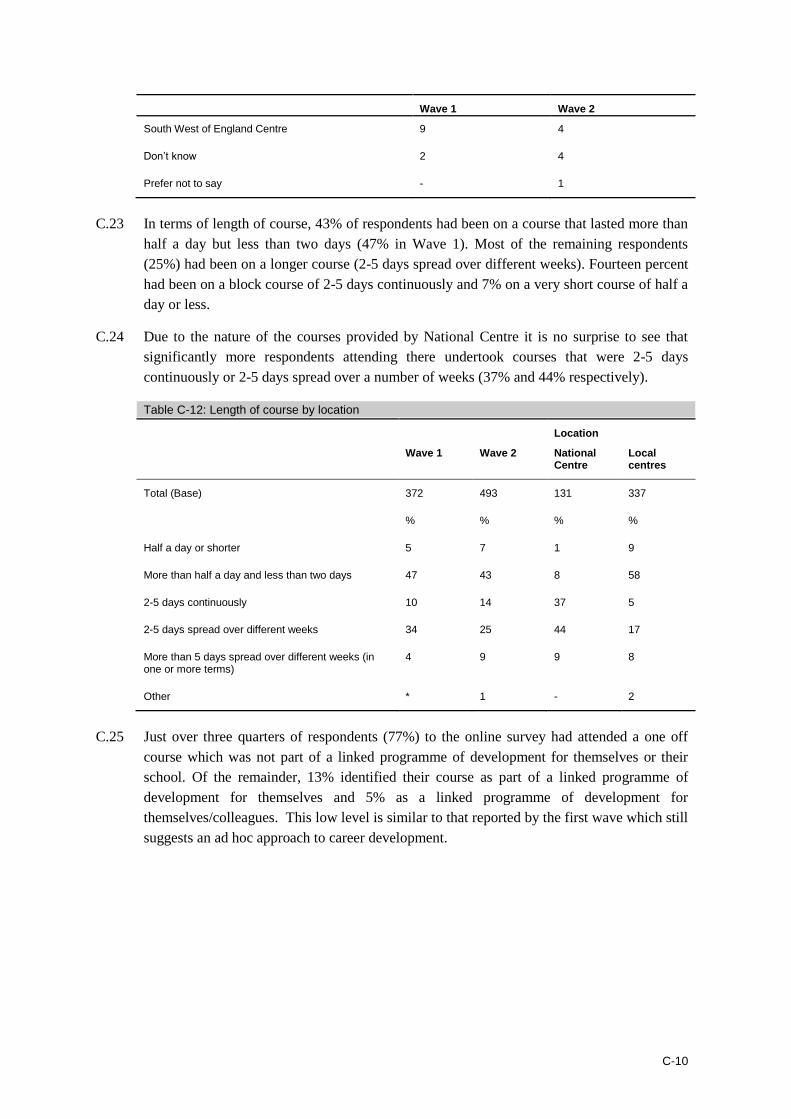
C.23 In terms of length of course, 43% of respondents had been on a course that lasted more than
half a day but less than two days (47% in Wave 1). Most of the remaining respondents
(25%) had been on a longer course (2-5 days spread over different weeks). Fourteen percent
had been on a block course of 2-5 days continuously and 7% on a very short course of half a
day or less.
C.24 Due to the nature of the courses provided by National Centre it is no surprise to see that
significantly more respondents attending there undertook courses that were 2-5 days
continuously or 2-5 days spread over a number of weeks (37% and 44% respectively).
Table C-12: Length of course by location
Location
Wave 1 Wave 2 National Centre
Local centres
Total (Base) 372 493 131 337
% % % %
Half a day or shorter 5 7 1 9
More than half a day and less than two days 47 43 8 58
2-5 days continuously 10 14 37 5
2-5 days spread over different weeks 34 25 44 17
More than 5 days spread over different weeks (in one or more terms)
4 9 9 8
Other * 1 - 2
C.25 Just over three quarters of respondents (77%) to the online survey had attended a one off
course which was not part of a linked programme of development for themselves or their
school. Of the remainder, 13% identified their course as part of a linked programme of
development for themselves and 5% as a linked programme of development for
themselves/colleagues. This low level is similar to that reported by the first wave which still
suggests an ad hoc approach to career development.

C-11
Table C-13: Type of course
Wave 1 Wave 2
Total (Base) 372 493
% %
A one-off course 77 77
Part of a linked programme of development comprising more than one course for you
14 13
Part of a linked programme of development comprising more than one course for you and your colleagues
7 5
Other 2 3
Don’t know 2 2
What the participants say: course information
Towards the beginning of the depth interviews, respondents were asked to confirm a
number of details about the course they referred to during the online survey they completed.
The courses respondents had taken part in were varied, from Physics for non-specialists,
Chemical Safety to Teaching Science to special needs.
Respondents were also asked whether the courses they had been on were discrete courses
or whether they were on a programme of continuing professional development (CPD).
Thirteen of the respondents that took part were on a programme of CPD, and the remaining
seventeen were on discrete courses. All quota groups (high, medium and low) included a
mix of respondents on a programme of CPD and those on discrete courses.
Eighteen respondents said that the course they had been on was non-residential (either at
their school or at a Regional Centre). The remaining twelve had been on a residential
course, which were mainly held at the National Centre in York. Whilst there were more
respondents that had been on non-residential courses than residential, each of the quota
groups contained a mix of respondents who had attended residential and non-residential
courses.
In terms of course length, this varied greatly amongst the sample, with some respondents
attending one off one day courses whilst others attended courses that involved four
sessions of three days each, over a period of 2 years. The majority of respondents had
been on a course that was one or two days in length, with some being a one off course and
others being a one or two day course that occurred periodically.
Almost all respondents, both those on residential and non-residential courses, said that the
courses were delivered face to face. Two respondents said that there was an online
element to the course, but these were in additional to the face to face element: no
respondents said the course was solely online. Everyone was asked for their views on the
course and if they would have preferred it to have been delivered in a different way. In
general, views of the courses tended to be very positive:
“Perfect.”
High end/residential.
“It was brilliant.”
High end/non-residential.
“I totally agree with the way they’re doing it.”
C-12
Medium end/non-residential.
Very few respondents offered any suggestion for delivering the course in another way, but
one respondent who attended a discrete course said they would like the course to have
been split over two days, with the first day being a full day, the second a half day and a four
month gap in between, as that would have given her enough time to
“Come back and be able to discuss what we did in the course and shared a bit of practice
around that.” Medium end/non-residential.
Current CPD practice
Identification of training needs/training plans
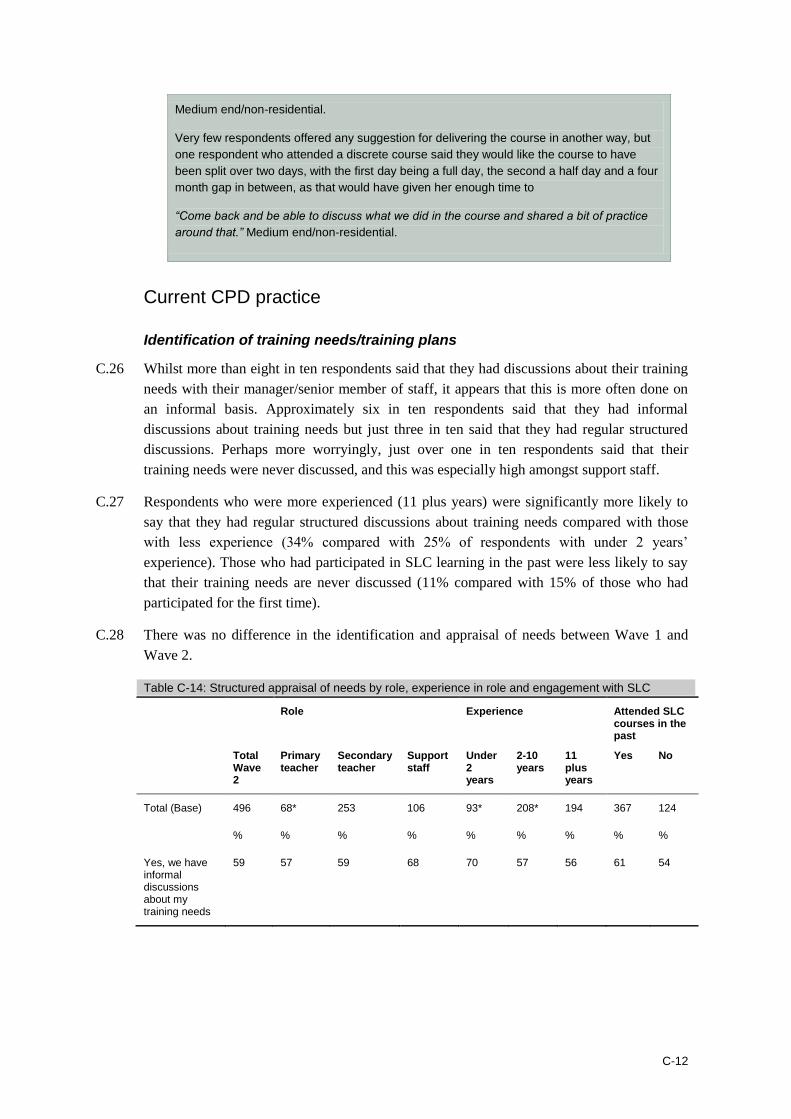
C.26 Whilst more than eight in ten respondents said that they had discussions about their training
needs with their manager/senior member of staff, it appears that this is more often done on
an informal basis. Approximately six in ten respondents said that they had informal
discussions about training needs but just three in ten said that they had regular structured
discussions. Perhaps more worryingly, just over one in ten respondents said that their
training needs were never discussed, and this was especially high amongst support staff.
C.27 Respondents who were more experienced (11 plus years) were significantly more likely to
say that they had regular structured discussions about training needs compared with those
with less experience (34% compared with 25% of respondents with under 2 years’
experience). Those who had participated in SLC learning in the past were less likely to say
that their training needs are never discussed (11% compared with 15% of those who had
participated for the first time).
C.28 There was no difference in the identification and appraisal of needs between Wave 1 and
Wave 2.
Table C-14: Structured appraisal of needs by role, experience in role and engagement with SLC
Role Experience Attended SLC courses in the past
Total Wave 2
Primary teacher
Secondary teacher
Support staff
Under 2 years
2-10 years
11 plus years
Yes No
Total (Base) 496 68* 253 106 93* 208* 194 367 124
% % % % % % % % %
Yes, we have informal discussions about my training needs
59 57 59 68 70 57 56 61 54
C-13
Role Experience Attended SLC courses in the past
Total Wave 2
Primary teacher
Secondary teacher
Support staff
Under 2 years
2-10 years
11 plus years
Yes No
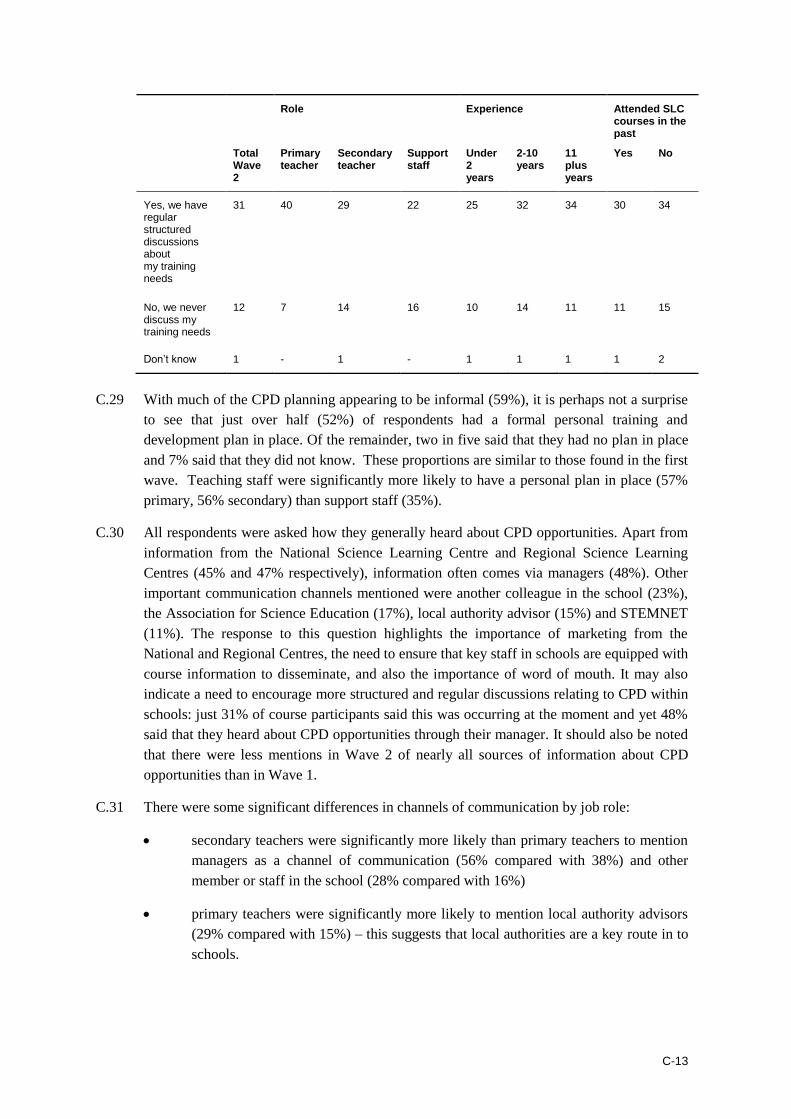
Yes, we have regular structured discussions about my training needs
31 40 29 22 25 32 34 30 34
No, we never discuss my training needs
12 7 14 16 10 14 11 11 15
Don’t know 1 - 1 - 1 1 1 1 2
C.29 With much of the CPD planning appearing to be informal (59%), it is perhaps not a surprise
to see that just over half (52%) of respondents had a formal personal training and
development plan in place. Of the remainder, two in five said that they had no plan in place
and 7% said that they did not know. These proportions are similar to those found in the first
wave. Teaching staff were significantly more likely to have a personal plan in place (57%
primary, 56% secondary) than support staff (35%).
C.30 All respondents were asked how they generally heard about CPD opportunities. Apart from
information from the National Science Learning Centre and Regional Science Learning
Centres (45% and 47% respectively), information often comes via managers (48%). Other
important communication channels mentioned were another colleague in the school (23%),
the Association for Science Education (17%), local authority advisor (15%) and STEMNET
(11%). The response to this question highlights the importance of marketing from the
National and Regional Centres, the need to ensure that key staff in schools are equipped with
course information to disseminate, and also the importance of word of mouth. It may also
indicate a need to encourage more structured and regular discussions relating to CPD within
schools: just 31% of course participants said this was occurring at the moment and yet 48%
said that they heard about CPD opportunities through their manager. It should also be noted
that there were less mentions in Wave 2 of nearly all sources of information about CPD
opportunities than in Wave 1.
C.31 There were some significant differences in channels of communication by job role:
secondary teachers were significantly more likely than primary teachers to mention
managers as a channel of communication (56% compared with 38%) and other
member or staff in the school (28% compared with 16%)
primary teachers were significantly more likely to mention local authority advisors
(29% compared with 15%) – this suggests that local authorities are a key route in to
schools.

C-14
C.32 It is interesting to note that 56% of respondents who had attended a course at the National
Science Learning Centre said the National Centre was how they usually heard about CPD
opportunities.
Table C-15: Awareness of CPD by location of SLC learning
Location
Wave 1 Wave 2 National Centre
Regional Centres
Total (Base) 461 496 131 337
% % % %
From one of the regional Science learning centres 59 47 37 53
From my manager/ a senior member of staff within my school
52 48 44 47
From the national Science Learning Centres 51 45 56 41
From another member of staff within my school 28 23 21 23
Through the Association for Science Education 27 17 11 19
From a local authority adviser 20 15 15 15
Through STEMNET 11 11 7 14
From an educator in another school 7 5 5 5
On the internet (unspecified) 3 2 2 1
Through CLEAPSS 2 1 2 1
Own research 2 2 5 1
Mailshots/through the post 2 2 1 2
Leaflets/flyers 1 1 2 *
By e-mail 1 1 1 1
Others 7 6 5 5
Don’t know 1 1 - 2
No answer * * - -

C-15
Previous participation in Science Learning Centre courses and other CPD
C.33 CPD activity appears to run relatively high among the survey sample. Almost all
respondents (99%) had participated in CPD activities run through the SLCs including the
National Centre in the last two years. The majority of respondents had been on between one
and two courses (69%). There is evidence of the SLCs attracting a significant level of
“repeat business”, with 30% having attended 3 or more courses in the last 2 years. This
proportion is similar to that reported in Wave 1.
Table C-16: Participated in CPD
Wave 1 Wave 2
Total (Base) 461 496
% %
Never 2 1
1-2 times 63 69
3-5 times 29 25
6-9 times 4 3
10+ 1 2
Don’t Know 1 1
C.34 However, the SLCs are far from being the only suppliers of science specific training to
course attenders. Three quarters of the respondents (75%) said that they had participated in
science specific training provided by other organisations in the last two years. The most
commonly cited suppliers of this training were the local authority/LEA (30%), exam
board/awarding bodies (25%) and private sector/commercial training providers (15%).
C.35 Primary teachers were significantly more likely than secondary to say that they had not been
on any such training in the last two years (34% compared with 21% respectively). This may
suggest that the SLCs are filling a gap in the market for science CPD aimed at primary
educators.
Table C-17: Suppliers of science specific CPD over the last 2 years by job role
Role
Wave 1 Wave 2 Primary teacher
Secondary teacher
Support staff
Total (Base) 461 496 68* 253 106
% % % % %
Local Authorities/LEA/Local Education Authority
38 30 49 35 10
Exam board/ Awarding Bodies 20 25 6 38 2
Private sector/ commercial training providers
15 15 7 18 12
CLEAPSS 11 15 - 5 51

C-16
Role
Wave 1 Wave 2 Primary teacher
Secondary teacher
Support staff
Association for Science Education, ASE 13 12 15 11 9
Universities 13 11 4 13 7
Professional bodies/ organisations 10 11 7 13 2
Secondary National Strategies (Science) 10 8 1 9 -
Equipment suppliers 6 5 4 3 9
Scientific companies who also put on training for teachers e.g. Glaxo Smith Kline
5 4 7 3 6
FE colleges 2 4 - 1 2
Inhouse/internal training 2 * - * -
Trusts/fellowships 1 - - - -
Others 3 2 - 2 3
I have not undertaken any other science specific training
25 25 34 21 29
Don’t know 1 1 - 2 1
Booking the SLC course
C.36 Identifying and booking courses through the SLC was largely driven by individual
teachers/technicians as opposed to managers/senior staff. Almost two thirds (59%) said that
they themselves had initially had the idea of attending the course in question, 29% said that
their manager or head of department had had the idea and the remainder stated that it was
another contact in or outside their school. These proportions were similar to those recorded
in Wave 1.
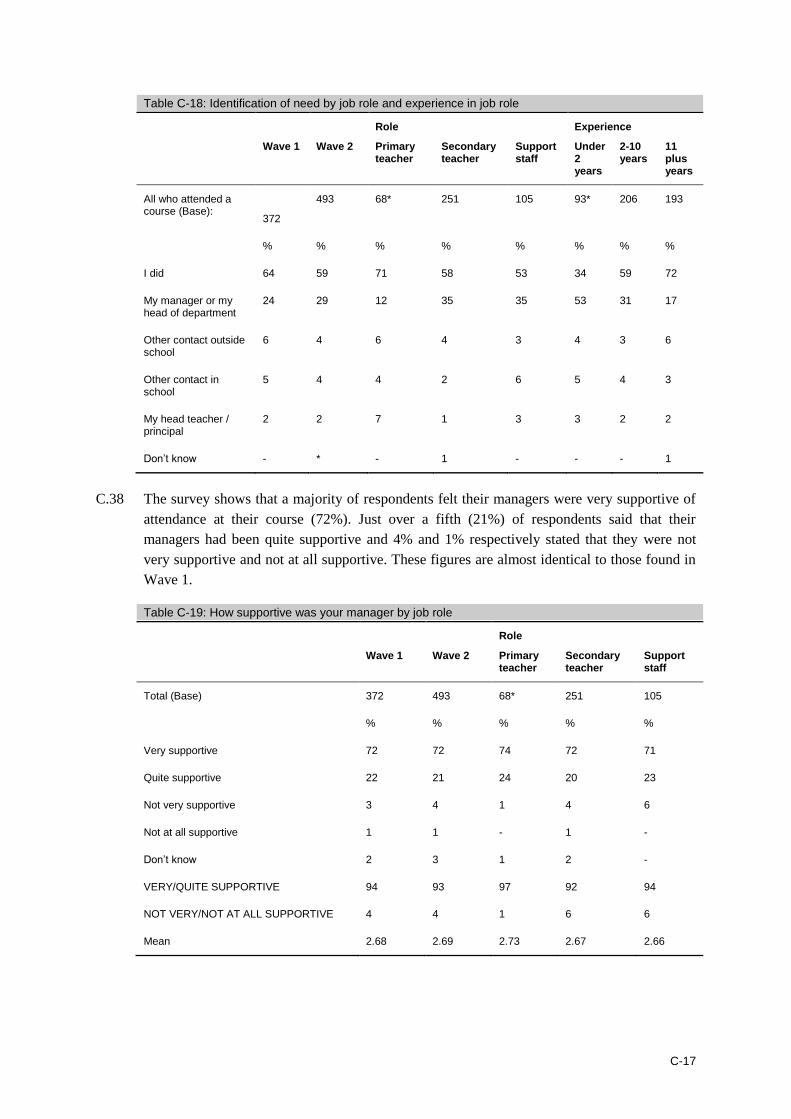
C.37 Some types of respondent were more likely to say that they had identified courses
themselves: these included teachers in primary schools compared with secondary (71%
versus 58%), those with more experience in their roles (72% of those with 11 years plus
experience compared with 59% of those with 2-10 years and 34% of those with less than 2
years) and those who had participated in other science training (63% compared with 51%).
C-17
Table C-18: Identification of need by job role and experience in job role
Role Experience
Wave 1 Wave 2 Primary teacher
Secondary teacher
Support staff
Under 2 years
2-10 years
11 plus years
All who attended a course (Base):
372
493 68* 251 105 93* 206 193
% % % % % % % %
I did 64 59 71 58 53 34 59 72
My manager or my head of department
24 29 12 35 35 53 31 17
Other contact outside school
6 4 6 4 3 4 3 6
Other contact in school
5 4 4 2 6 5 4 3
My head teacher / principal
2 2 7 1 3 3 2 2
Don’t know - * - 1 - - - 1
C.38 The survey shows that a majority of respondents felt their managers were very supportive of
attendance at their course (72%). Just over a fifth (21%) of respondents said that their
managers had been quite supportive and 4% and 1% respectively stated that they were not
very supportive and not at all supportive. These figures are almost identical to those found in
Wave 1.
Table C-19: How supportive was your manager by job role
Role
Wave 1 Wave 2 Primary teacher
Secondary teacher
Support staff
Total (Base) 372 493 68* 251 105
% % % % %
Very supportive 72 72 74 72 71
Quite supportive 22 21 24 20 23
Not very supportive 3 4 1 4 6
Not at all supportive 1 1 - 1 -
Don’t know 2 3 1 2 -
VERY/QUITE SUPPORTIVE 94 93 97 92 94
NOT VERY/NOT AT ALL SUPPORTIVE 4 4 1 6 6
Mean 2.68 2.69 2.73 2.67 2.66
C-18
What the participants say: Use of Science Learning Centre
Advantage and disadvantages of residential and non-residential
All respondents were asked what they thought the advantages and disadvantages were of
the courses being residential/non-residential.
Looking first at residential courses, advantages of attending these courses tended to relate
to networking and building up relationships with other participants, being able to focus on
the task at hand and digest the information without being sidetracked and being able to
concentrate on the task without work pressures:
“It allows you to share experiences with other teachers, especially in my position, and then
you get their ideas”.
Medium end/residential.
“Get immersed with the thinking, it sort of continues, your focus remains into the second
day”.
Low end/residential.
The main disadvantages to attending residential courses included having time away from
home and families, arranging cover for the days spent out of school, the distance and the
cost for those not eligible for a bursary:
[COST] “I think that was a bit unfair because if you’re going to do it for one you should do it
for all because you are all paid the same amount of money”
Medium end/residential.
There were many advantages for attending non-residential courses, including convenience
in being closer to home, lower costs, ease of arranging cover at school/not being away from
school for too long, not being away from family, having time to do background reading in
between sessions/digest information and being able to go away, try things and then share
ideas about what has and hasn’t worked well.
“I’m not doing large chunks out of the lab”.
Medium end/non-residential.
“For me, it’s such a short travelling distance, it’s absolutely fine”.
Medium end/non-residential.
“It’s very different from a one-off course of 2-3 days. It is designed at building up
progression”.
High end/non-residential.
“Well if you’ve got family commitments, it’s just one day”.
Medium end/non-residential.
There were not many disadvantages of the non-residential courses, but the disadvantages
that were mentioned tended to focus on not having time to digest the information and not
having a chance to build relationships with other participants.
“Because you meet them on that day and that’s it you don’t see them again”.
High end/non-residential.
“Only that there was no way of following up or finding out where colleagues took that course
so it was embedded in schools”.
Low end/non-residential.

C-19
Delivery method
Respondents were asked for their views on the delivery method, and whether the method
had an impact on the knowledge they gained. Almost all respondents were incredibly
positive about the delivery method. In particular, respondents were very positive about the
techniques that could be used in face to face delivery: they were viewed as practical,
interactive and a better way of learning than just learning theory or reading from a book.
“You hear the professional’s view; you get to ask questions, you listen to other people’s and
the answers. You pick up so much to be honest”.
Medium end/non-residential.
The teachers/course leaders were also praised as being enthusiastic and aware of the
issues that teachers face.
“They gave very good concrete examples that you can use straight away. They don’t seem
detached from life in teaching”.
Medium end/non-residential.
Just one respondent (low end/residential) said that they did not learn anything from the
course.
Information about courses on offer by the SLCs
Across all groups, the most popular way of accessing information about courses on offer by
the SLCs were through the SLC website itself, receiving emails from the SLC or via leaflets
which are sent to the school or colleagues. Colleagues, searching for courses via Google or
CLEAPS were also mentioned as sources for finding out about SLC courses, but to a lesser
extent.
Virtually all respondents received leaflets, newsletters or emails from the SLC, which are
sent to them either directly or to the school/another colleague. This information was viewed
as both easy to read and relevant:
“Easy, and simple to follow”.
High end/residential.
“Very self explanatory and is backed up by websites which is very useful”.
High end/non-residential.
“It’s very straightforward”.
Medium end/non-residential.
“And it’s really high quality, interesting stuff to read, all the material they generate”.
Low end/residential.
One respondent felt that not all of the literature was relevant to her, but there were definitely
parts of it that were.
On the whole, the details in the literature/emails that respondents had received were seen
to be very accurate. There were a few cases where the information was not perceived to be
accurate but this tended to be a result of the speaker not turning up or not having time to
cover everything that was planned. One respondent felt the literature they’d received was
not accurate for the following reason:
“The first thing is they said it was for primary and my colleague and I were the only people
there from primary school… There was only one other person working in a special needs
school and the others were in mainstream. The kind of needs they were talking about were
C-20
very different”.
Low end/residential.
Those who felt the literature was inaccurate tended to be in the low end group. No
respondents in the high end group felt the details were inaccurate.
Reasons for attending the course
Twenty one said that this was their first experience of SLC and this is spread across all
three quota groups (high end, medium end and low end). Just nine had been on a SLC
course previously. Whilst the majority said it was their first time on the course, seventeen
said that others in their school had attended these before. Course attendance was part of
wider departmental activity in around half of case, whilst the other half said it was not part of
wider departmental activity.
Reasons for attending the course were varied, and tended to focus on personal reasons:
- Improve knowledge , particular knowledge on less familiar projects
“I knew next to nothing about microbiology and it was something I needed to know about “.
High end/non-residential.
- Relevance and career progression
“Because I was new to the job and it was relevant”
Low end/non-residential.
“to gain skills for my future as Head of Department”.
High end/residential.
- Networking and sharing experiences
“Because all schools are going down the same path. You’ve got your triple award science,
you’ve got your double award science and now you’ve got your BTECS coming through so
everyone is tending to develop the same sort of approaches”.
Medium end/non-residential.
“…learn new ideas from other teachers”.
Medium end/residential.
- Increase confidence/personal fulfilment
“I want to teach my physics topics with confidence”.
High end/residential.
“Just to get more confidence in doing experiments in chemistry because my specialism is
biology”.
Medium end/residential.
Comparison of SLC against other suppliers
Respondents were asked how their experience of the SLC course compared to that of
courses run by other suppliers. Seven respondents had not been on other courses and
therefore we unable to comment. Twenty three respondents had used other suppliers and
these included courses that were run by the LA, CLEAPSS, NUT, QCA and Keynote. Of the
twenty-three who had attended courses with other suppliers, a fair amount (nine
respondents) said they didn’t know which was better or that they the courses were not
C-21
comparable. Of the remaining fourteen, twelve respondents said they preferred the course
that was run by the SLC. Reasons cited for the preference of the SLC as a supplier were:
- Course itself: practical, hands on, relevant
“It was more practical, more hands on and relevant to what I needed”.
High end/residential.
- Good facilities, resources and equipment
“So the environment we are working in is much more conducive to the environment we are
in.”
High end/residential.
“The Science Learning Centre is a specially kitted out venue specifically for science with the
resource centre, library and resource centre”.
Low end/residential.
- Professional
“The delivery was far more professional and the way it was structured was very good”.
High end/residential.
What the learners say (tele-depth interviews): CULTURE AND IMPACT OF CPD IN
SCHOOL
Reviewing and identifying CPD needs
All respondents were asked about their CPD needs, in terms of how these are reviewed and
identified, who was involved in the process, whether the system was effective and who the
needs were driven by.
In general, the processes involved in reviewing and identifying CPD needs varied a great
deal. Eleven respondents said that they identified their CPD needs themselves and then it
had to be approved by either their line manager, Head of Department or in some cases the
Headmaster. Most respondents felt that this was an effective way of identifying their needs
because it allows them to manage their own development and they feel they are best placed
to identify what they need help with and where their knowledge gaps are. However, one
respondent felt it would have been more useful if the head had been more proactive in this
process.
Ten respondents said that their needs were identified between themselves and their line
manager/head, often through yearly appraisals. These were also viewed as positive but one
respondent felt that termly reviews would be more appropriate, given that needs change
throughout the year:
“What could be important in September has lost importance by Christmas”.
Medium end/non-residential.
In some cases the CPD needs were driven by the individual themselves, but an equal
amount of respondents said that the needs were driven by both their individual needs and
the school needs:
“I feel it’s my responsibility to identify my needs and hopefully they’ll fulfil the needs of the
school”.
Medium end/non-residential.
“In my role it is what is relevant so that is driven by me and the organisation”.
Low end/non-residential.
There was a great deal of variation in terms of whether there was a training and
C-22
development plan in place at each of the respondent’s schools. Some respondents said that
they have a training and development plan which they work towards, others said they don’t
have a plan but their needs are assessment by a performance manager, whilst some
respondents didn’t appear to have either and arrangements seemed to be much more
informal:
“I can’t say that I do anything formal. It’s very sort of ad-hoc to be honest. As I say, there’s
no programme in the school. It’s just a case of sometimes you see a course and think ‘Ah
that would be relevant because I’m a bit rusty in that area.’”.
Medium end/residential.
“We have a training questionnaire that we have to fill out as part of our appraisal. We also
have access to the training plan to see if there is something that we want to do that is
applicable.”
Low end/residential.
Frequency of CPD/training as part of discussions
Respondents were asked if CPD and training were regular features of meetings and
appraisals and whether they thought that more should be made of CPD within the school
setting. Responses varied greatly between respondents, with some saying that CPD is a
regular feature of meetings and others saying CPD was never discussed. There were also
varying levels in between: some say discussions about CPD were a yearly thing or
something that only happens at appraisals whilst others say it is more ad hoc and an
ongoing topic that is discussed as necessary.
For those who said that CPD was a regular feature, nine said that it was discussed in
meetings, five said that CPD was brought up during appraisals and four respondents said
that CPD was discussed during performance management.
When asked whether more could be made of CPD within schools, as you might expect
views were mixed, dependent on the level of importance given to CPD. Those in schools
where CPD was discussed regularly were, unsurprisingly, most likely to say that they were
happy with the amount CPD is discussed and didn’t think that more should be made of it:
“A lot of it happens on an informal basis in that we’re quite a small close knit department…
We talk and share ideas informally a lot”.
High end/non-residential.
However, other respondents felt more could be made of CPD and this tended to be
amongst those who felt that it was not a regular feature:
“I would like to discuss it more because there are very good courses going on”.
High end/residential.
“It’s a big area that the whole school is lacking in”.
Medium end/non-residential.
“It’s not given enough time as it perhaps ought to because there is always pressing needs of
admin that comes in unfortunately.”
Medium end/non-residential.
Support for CPD activity
On the whole, respondents felt that their line managers, department heads and
Headmasters were supportive of CPD activity in general as well as science specific CPD:
“Whenever I’ve asked to go on these courses, that’s it. I’ve gone.”

C-23
High end/residential.
“The head of Department is absolutely fine if there are courses available and it’s not going
to cost the department too much money”.
Medium end/non-residential.
“Very supportive. They’ve actually put me forward for the radiation one… They’ve always
been supportive. I think they realise that if I do it does have a knock on effect on the
department”.
Medium end/non-residential.
Whilst senior staff were seen as supportive of courses in general, six respondents did
mentioned that, whilst they felt supported, it was very much dependent on the cost and
budget constraints:
“If I was to put in a request for a course there is usually no disagreement. It just depends on
the budget”.
Medium end/non-residential.
Respondents who felt less supported tended to be those whose line manager did not work
in the science department, although this was not the case for all whose line manager
worked in a separate department. There was one technician (low end) who felt that senior
staff were not very supportive of CPD for technicians and felt that they may be more
supportive of teachers:
“We’re the after-force”.
Low end/non-residential.
All respondents were asked how knowledgeable they felt their line manager/department
head/headmaster was of the CPD opportunities that were available and the majority of
respondents felt that the senior staff were knowledgeable about the opportunities that were
available:
“Most of the information initially goes to him so he’s probably more aware of it than most
lower staff”.
Low end/residential.
“He receives the emails and quite often he will pass it on to us and say ’This might be
relevant, how do you fancy doing it?’ or just opens it up to the whole department”.
Medium end/residential.
As with support, there were some respondents who didn’t feel their managers were very
knowledgeable and this tended to be when the respondent’s line manager was not working
in the science department.
Key decision makers in relation to CPD
All respondents were asked who they thought the key decision makers were in relation to
CPD. Headmasters and departmental heads tended to be the key decision makers, but the
senior leadership team, line managers and performance management coordinators also
play a part. In some instances, there was just one key decision maker but in others, there
was a more hierarchical structure. For example, the line manager may need to give
agreement in the first instance and then this would be authorised by the head of department
or headmaster.
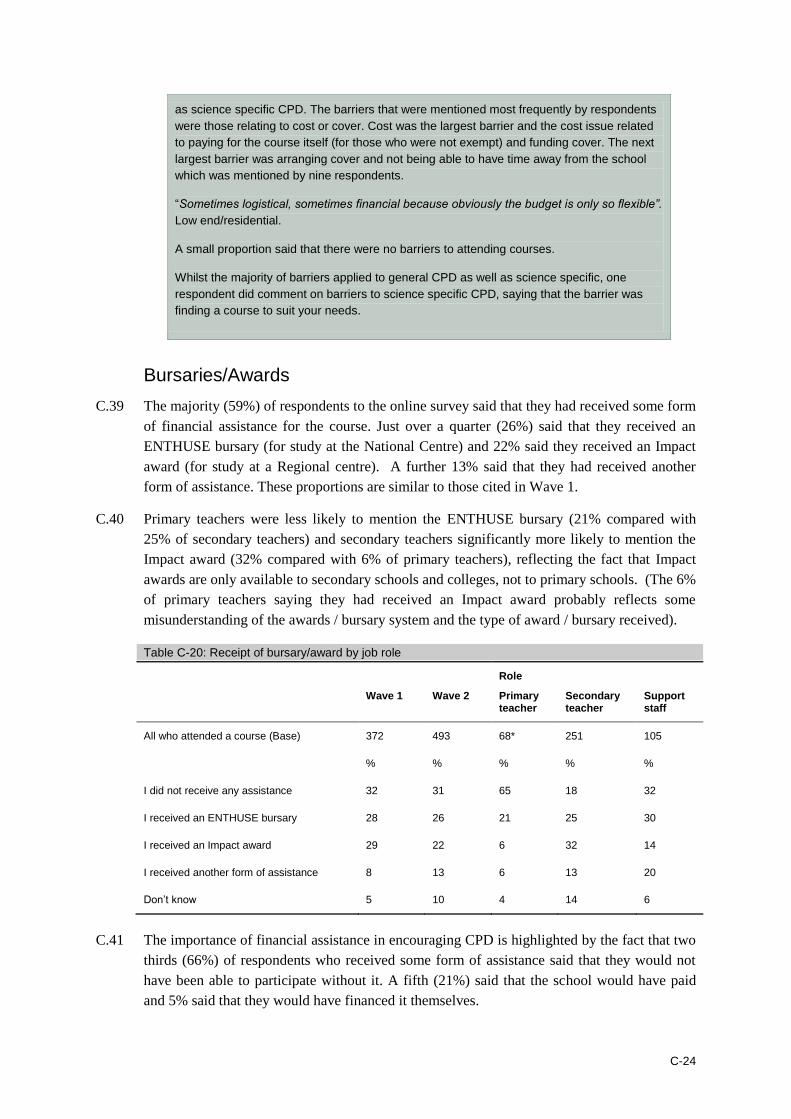
Barriers to participating in CPD: general and science specific
The majority of barriers mentioned to participating in CPD applied to CPD in general as well
C-24
as science specific CPD. The barriers that were mentioned most frequently by respondents
were those relating to cost or cover. Cost was the largest barrier and the cost issue related
to paying for the course itself (for those who were not exempt) and funding cover. The next
largest barrier was arranging cover and not being able to have time away from the school
which was mentioned by nine respondents.
“Sometimes logistical, sometimes financial because obviously the budget is only so flexible”.
Low end/residential.
A small proportion said that there were no barriers to attending courses.
Whilst the majority of barriers applied to general CPD as well as science specific, one
respondent did comment on barriers to science specific CPD, saying that the barrier was
finding a course to suit your needs.
Bursaries/Awards
C.39 The majority (59%) of respondents to the online survey said that they had received some form
of financial assistance for the course. Just over a quarter (26%) said that they received an
ENTHUSE bursary (for study at the National Centre) and 22% said they received an Impact
award (for study at a Regional centre). A further 13% said that they had received another
form of assistance. These proportions are similar to those cited in Wave 1.
C.40 Primary teachers were less likely to mention the ENTHUSE bursary (21% compared with
25% of secondary teachers) and secondary teachers significantly more likely to mention the
Impact award (32% compared with 6% of primary teachers), reflecting the fact that Impact
awards are only available to secondary schools and colleges, not to primary schools. (The 6%
of primary teachers saying they had received an Impact award probably reflects some
misunderstanding of the awards / bursary system and the type of award / bursary received).
Table C-20: Receipt of bursary/award by job role
Role
Wave 1 Wave 2 Primary teacher
Secondary teacher
Support staff
All who attended a course (Base) 372 493 68* 251 105
% % % % %
I did not receive any assistance 32 31 65 18 32
I received an ENTHUSE bursary 28 26 21 25 30
I received an Impact award 29 22 6 32 14
I received another form of assistance 8 13 6 13 20
Don’t know 5 10 4 14 6
C.41 The importance of financial assistance in encouraging CPD is highlighted by the fact that two
thirds (66%) of respondents who received some form of assistance said that they would not
have been able to participate without it. A fifth (21%) said that the school would have paid
and 5% said that they would have financed it themselves.

C-25
C.42 The impact of financial assistance was particularly clear amongst National Centre participants
and primary teachers:
77% of those who attended courses at the National Centre and received assistance to
do so said that they would not have attended the course without the help
81% of primary teachers compared with 69% of secondary teachers said that they
relied on the assistance to attend.
Table C-21: Impact of bursary/award by Wave and by job role
Role
Wave 1 Wave 2 Primary teacher
Secondary teacher
Support staff
All who attended a course (Base) 236 290 21** 172 65*
% % % % %
No, I would have been unable to participate in the CPD (Continuing Professional Development) without it
64 66 81 69 55
Yes, my school would have financed it 25 21 5 17 34
Yes, I would have financed it myself 3 5 - 6 3
Yes, another funder would have financed it 2 - - - -
Don’t know 7 8 14 8 8
Table C-22: Impact of bursary/award by location of course
Location
Wave 2 National Centre
Regional Centres
All who attended a course (Base) 290 116 159
% % %
No, I would have been unable to participate in the CPD (Continuing Professional Development) without it
66 77 57
Yes, my school would have financed it 21 10 30
Yes, I would have financed it myself 5 4 6
Yes, another funder would have financed it - - -
Don’t know 8 9 8
C-26
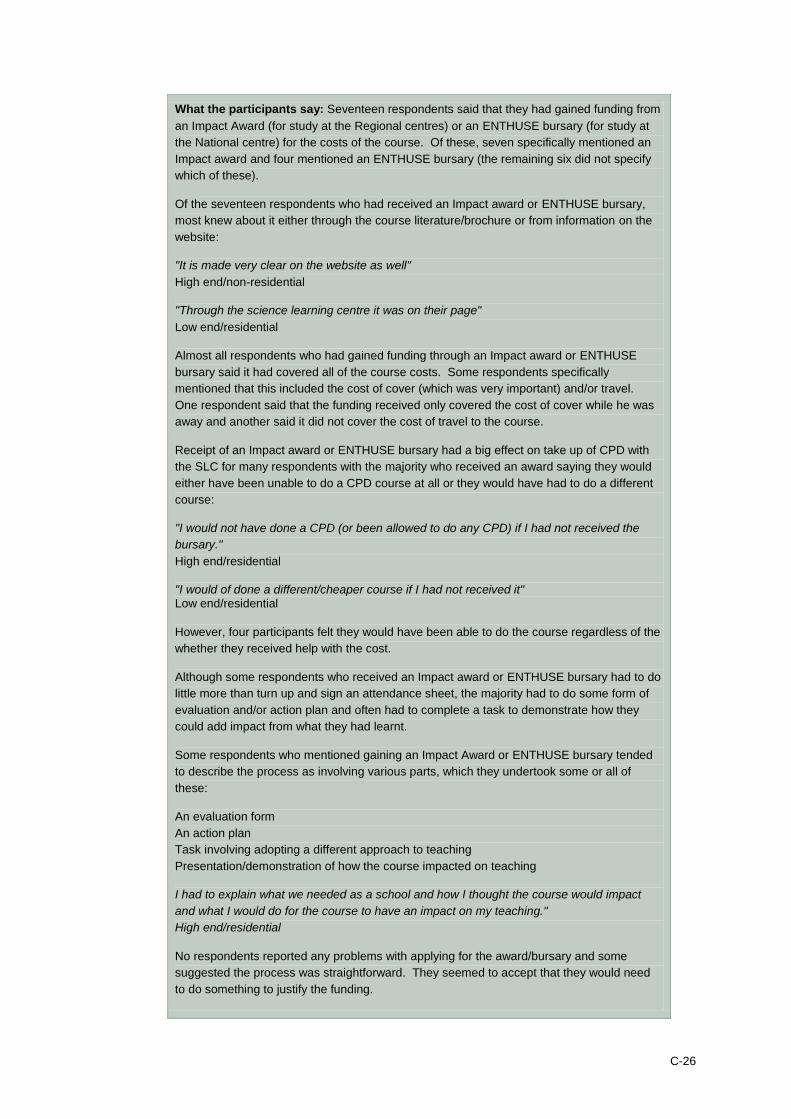
What the participants say: Seventeen respondents said that they had gained funding from
an Impact Award (for study at the Regional centres) or an ENTHUSE bursary (for study at
the National centre) for the costs of the course. Of these, seven specifically mentioned an
Impact award and four mentioned an ENTHUSE bursary (the remaining six did not specify
which of these).
Of the seventeen respondents who had received an Impact award or ENTHUSE bursary,
most knew about it either through the course literature/brochure or from information on the
website:
"It is made very clear on the website as well"
High end/non-residential
"Through the science learning centre it was on their page"
Low end/residential
Almost all respondents who had gained funding through an Impact award or ENTHUSE
bursary said it had covered all of the course costs. Some respondents specifically
mentioned that this included the cost of cover (which was very important) and/or travel.
One respondent said that the funding received only covered the cost of cover while he was
away and another said it did not cover the cost of travel to the course.
Receipt of an Impact award or ENTHUSE bursary had a big effect on take up of CPD with
the SLC for many respondents with the majority who received an award saying they would
either have been unable to do a CPD course at all or they would have had to do a different
course:
"I would not have done a CPD (or been allowed to do any CPD) if I had not received the
bursary."
High end/residential
"I would of done a different/cheaper course if I had not received it" Low end/residential
However, four participants felt they would have been able to do the course regardless of the
whether they received help with the cost.
Although some respondents who received an Impact award or ENTHUSE bursary had to do
little more than turn up and sign an attendance sheet, the majority had to do some form of
evaluation and/or action plan and often had to complete a task to demonstrate how they
could add impact from what they had learnt.
Some respondents who mentioned gaining an Impact Award or ENTHUSE bursary tended
to describe the process as involving various parts, which they undertook some or all of
these:
An evaluation form
An action plan
Task involving adopting a different approach to teaching
Presentation/demonstration of how the course impacted on teaching
I had to explain what we needed as a school and how I thought the course would impact
and what I would do for the course to have an impact on my teaching."
High end/residential
No respondents reported any problems with applying for the award/bursary and some
suggested the process was straightforward. They seemed to accept that they would need
to do something to justify the funding.

C-27
Thirteen respondents had not received an Impact Award or ENTHUSE bursary – most of
these were medium or low end respondents, as only three high end respondents had not
taken up the funding. This tended to be a result of respondents not having applied, rather
than not being aware (four respondents were not aware). The main reasons for not
applying were perceived ineligibility (for example, one respondent though the funding only
applied to state schools and they worked in a private school), or that the funding only
applied to some CPD courses and not the one they went on. One respondent said they
didn’t apply due to a lack of time.
Aims/motivations
C.43 All respondents were asked what their main aims were for attending the course. They were
given a choice of aims which covered options from developing knowledge and acquisition of
practical skills to confidence building, building networks and enhancing career prospects.
Respondents were asked to prioritise their ‘top two’ aims.
C.44 The aims most widely mentioned by respondents were
developing knowledge in a specific area (43%)
developing new skills (32%)
gain confidence as a teacher/technician (20%).
C.45 Other aims that achieved a relatively high recognition amongst respondents were:
improving attainment in school/as part of the school/department improvement plan
(19%)
freshening approach to teaching/technician work (18%)
producing new teaching or technical resources (15%).
Figure C-1: Aims of the course (items mentioned as among “top two” only)
Base: All respondents (493) unweighted
6
6
11
15
18
19
20
32
43
0 10 20 30 40 50
Additional motivation
Make useful new contacts
Enhance career prospects
New teaching/technical resources
Freshen approach
Improve attainment of dept/school
Gain confidence
Develop new skills
Knowledge in specific area
C-28
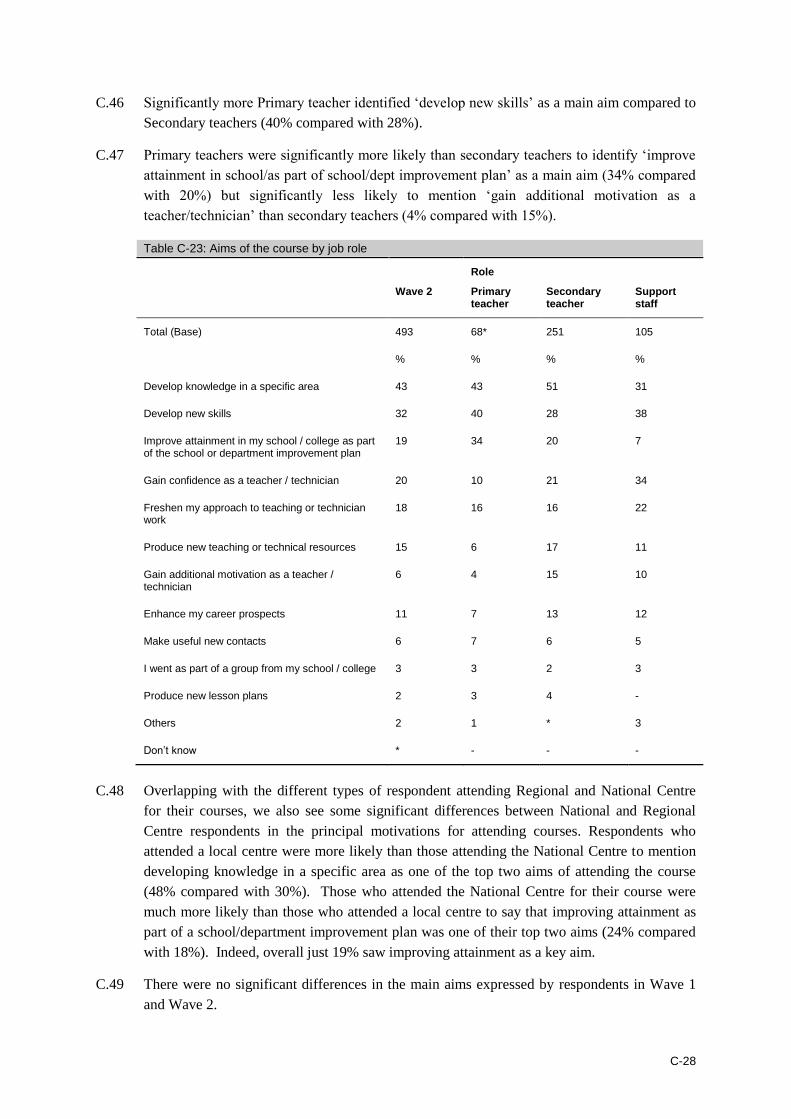
C.46 Significantly more Primary teacher identified ‘develop new skills’ as a main aim compared to
Secondary teachers (40% compared with 28%).
C.47 Primary teachers were significantly more likely than secondary teachers to identify ‘improve
attainment in school/as part of school/dept improvement plan’ as a main aim (34% compared
with 20%) but significantly less likely to mention ‘gain additional motivation as a
teacher/technician’ than secondary teachers (4% compared with 15%).
Table C-23: Aims of the course by job role
Role
Wave 2 Primary teacher
Secondary teacher
Support staff
Total (Base) 493 68* 251 105
% % % %
Develop knowledge in a specific area 43 43 51 31
Develop new skills 32 40 28 38
Improve attainment in my school / college as part of the school or department improvement plan
19 34 20 7
Gain confidence as a teacher / technician 20 10 21 34
Freshen my approach to teaching or technician work
18 16 16 22
Produce new teaching or technical resources 15 6 17 11
Gain additional motivation as a teacher / technician
6 4 15 10
Enhance my career prospects 11 7 13 12
Make useful new contacts 6 7 6 5
I went as part of a group from my school / college 3 3 2 3
Produce new lesson plans 2 3 4 -
Others 2 1 * 3
Don’t know * - - -
C.48 Overlapping with the different types of respondent attending Regional and National Centre
for their courses, we also see some significant differences between National and Regional
Centre respondents in the principal motivations for attending courses. Respondents who
attended a local centre were more likely than those attending the National Centre to mention
developing knowledge in a specific area as one of the top two aims of attending the course
(48% compared with 30%). Those who attended the National Centre for their course were
much more likely than those who attended a local centre to say that improving attainment as
part of a school/department improvement plan was one of their top two aims (24% compared
with 18%). Indeed, overall just 19% saw improving attainment as a key aim.
C.49 There were no significant differences in the main aims expressed by respondents in Wave 1
and Wave 2.
C-29
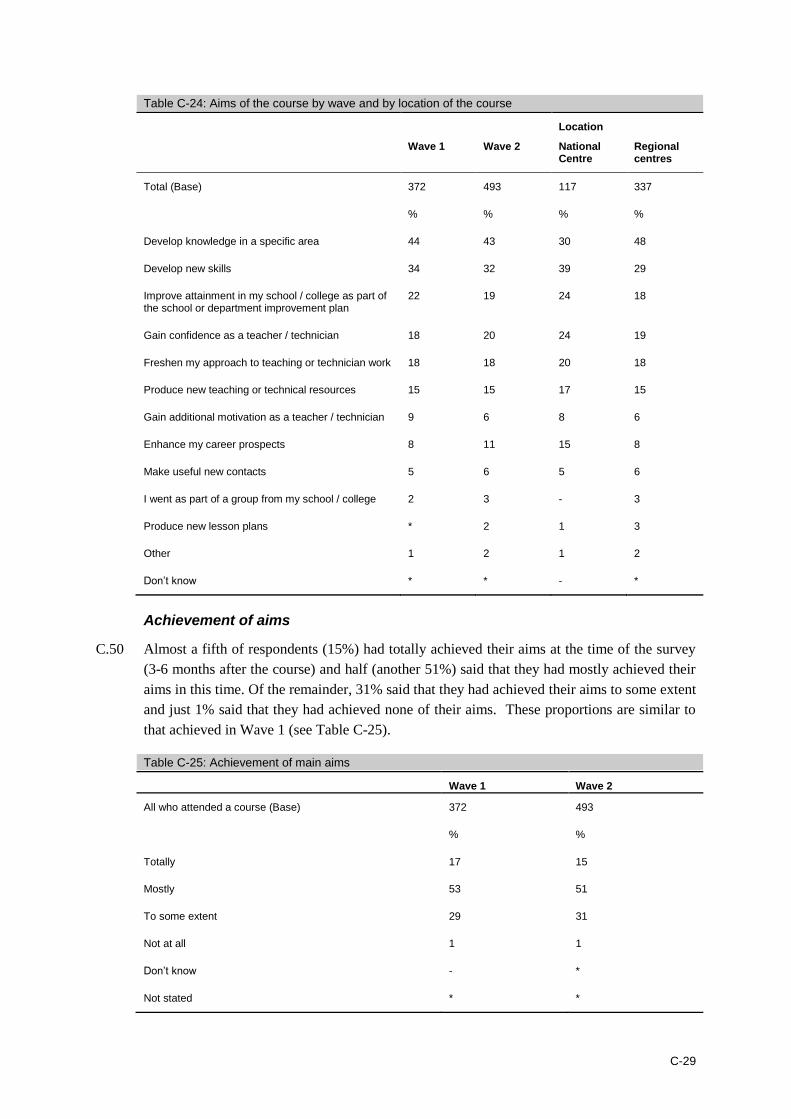
Table C-24: Aims of the course by wave and by location of the course
Location
Wave 1 Wave 2 National Centre
Regional centres
Total (Base) 372 493 117 337
% % % %
Develop knowledge in a specific area 44 43 30 48
Develop new skills 34 32 39 29
Improve attainment in my school / college as part of the school or department improvement plan
22 19 24 18
Gain confidence as a teacher / technician 18 20 24 19
Freshen my approach to teaching or technician work 18 18 20 18
Produce new teaching or technical resources 15 15 17 15
Gain additional motivation as a teacher / technician 9 6 8 6
Enhance my career prospects 8 11 15 8
Make useful new contacts 5 6 5 6
I went as part of a group from my school / college 2 3 - 3
Produce new lesson plans * 2 1 3
Other 1 2 1 2
Don’t know * * - *
Achievement of aims
C.50 Almost a fifth of respondents (15%) had totally achieved their aims at the time of the survey
(3-6 months after the course) and half (another 51%) said that they had mostly achieved their
aims in this time. Of the remainder, 31% said that they had achieved their aims to some extent
and just 1% said that they had achieved none of their aims. These proportions are similar to
that achieved in Wave 1 (see Table C-25).
Table C-25: Achievement of main aims
Wave 1 Wave 2
All who attended a course (Base) 372 493
% %
Totally 17 15
Mostly 53 51
To some extent 29 31
Not at all 1 1
Don’t know - *
Not stated * *

C-30
C.51 Those who said that they had not achieved all their aims by the time of the survey were asked
if they thought they would achieve them in the next 12 months. Of this group, just over a fifth
thought that they would achieve them totally (22%) while 52% expected to “mostly” achieve
them. Most of the remainder expected to achieve them “to some extent” within this time
period (25%). If we combine the responses to the two questions we can see that, in the 15-18
months that followed the course one fifth (19%) of respondents thought they would fully
achieve their main aims for attending. More than half (51%) said that they would mostly fulfil
their objectives, 28% said to some extent and just 1% said either not at all or that they did not
know. These proportions are similar to those recorded at Wave 1.
Table C-26: Achievement of main aims in next 12 months
Wave 1 Wave 2
Total (Base) 309 416
% %
Totally 20 22
Mostly 60 52
To some extent 18 25
Not at all 1 *
Don’t know 1 1
C.52 Reasons for the perception that aims will not be met largely relate to lack of time on the
respondent’s part. The top two reasons given accounted for a majority of respondents who
were negative about achieving their aims:
not having the time to initiate everything in class (51%)
not having the time for follow up work (36%).
C.53 The remaining reasons mentioned by over 5% of respondents were relevance of the course
(13%), the content of the course was not as expected (6%), lack of support from colleagues
(5%) and take time to achieve/develop/bear fruit (5%).
C.54 Comparing Wave 1 and Wave 2, although there were some variations in the percentage, the
reasons given for not achieving their main aims were broadly similar.

C-31
Table C-27: Reasons for not achieving main aims of the course
Wave 1 Wave 2
Those not achieving all aims (Base) 244 320
% %
I do not have the time to initiate everything I want to in class 43 51
I have not had the time for follow up work 42 36
The course was not as relevant to me as I hoped 8 13
The content of the course was not as expected 5 6
I have not had the support from colleagues 4 5
Aims will take time to achieve/develop/bear fruit 2 5
The course did not give me the materials/information I needed 5 4
I have not had the support from my manager 8 3
I have not had the support from my head teacher 5 3
The course did not motivate me as much as hoped 4 3
On going process/always looking to improve 8 2
Going on leave/having a break/retiring 1 2
Timetable does not allow it/ not teaching the appropriate subjects 3 1
Lack of school resources 2 1
The follow up materials have not been relevant 1 *
Others 9 7
Don’t know 1 4
Not stated * -
Impact of the course and dissemination of learning
C.55 All respondents were asked what level of impact the course had had on a series of measures.
They were given the options of major impact, minor impact, no impact or too early to say
(they could also say if the measure was not applicable).
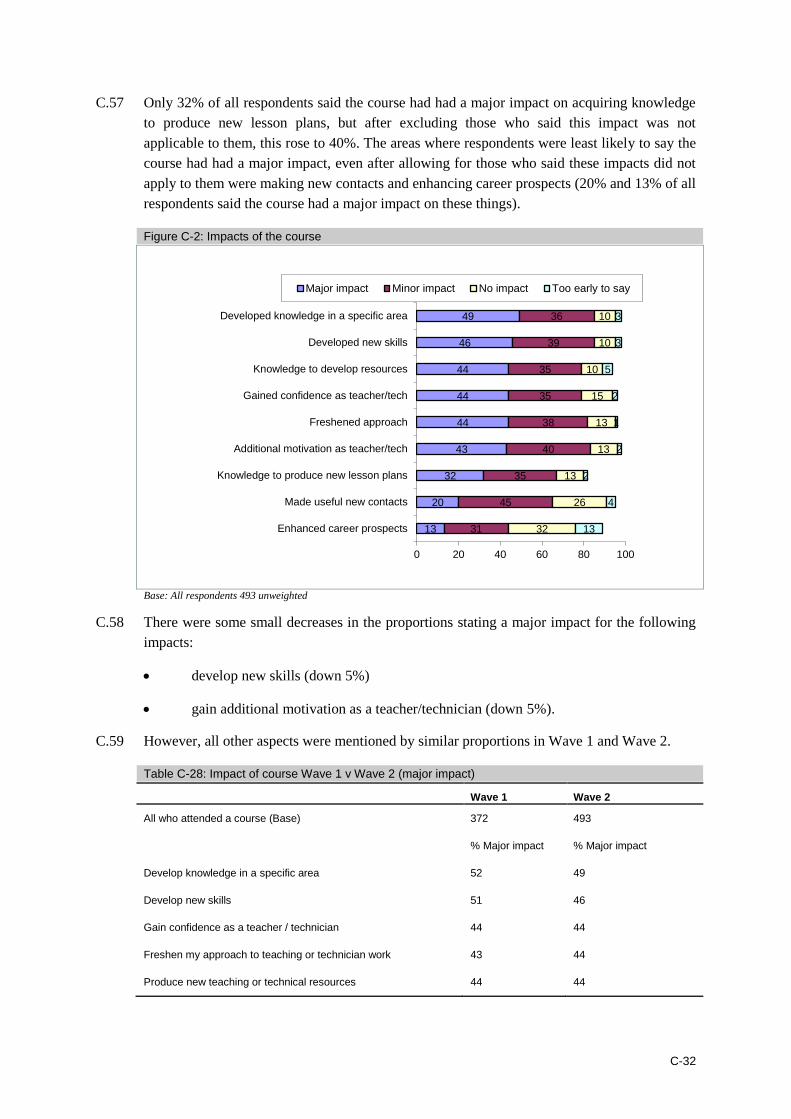
C.56 The areas in which the respondents as a whole were most likely to say the course had had a
major impact were developing their knowledge in a specific area and developing new skills
(49% and 46% respectively). Between four and five in ten respondents agreed that it had had
a major impact on the following:
giving knowledge to help develop resources (44%)
gaining confidence (44%)
freshening their approach to teaching (44%)
gaining additional motivation as a teacher/technician (43%).
C-32
C.57 Only 32% of all respondents said the course had had a major impact on acquiring knowledge
to produce new lesson plans, but after excluding those who said this impact was not
applicable to them, this rose to 40%. The areas where respondents were least likely to say the
course had had a major impact, even after allowing for those who said these impacts did not
apply to them were making new contacts and enhancing career prospects (20% and 13% of all
respondents said the course had a major impact on these things).
Figure C-2: Impacts of the course
Base: All respondents 493 unweighted
C.58 There were some small decreases in the proportions stating a major impact for the following
impacts:
develop new skills (down 5%)
gain additional motivation as a teacher/technician (down 5%).
C.59 However, all other aspects were mentioned by similar proportions in Wave 1 and Wave 2.
Table C-28: Impact of course Wave 1 v Wave 2 (major impact)
Wave 1 Wave 2
All who attended a course (Base) 372 493
% Major impact % Major impact
Develop knowledge in a specific area 52 49
Develop new skills 51 46
Gain confidence as a teacher / technician 44 44
Freshen my approach to teaching or technician work 43 44
Produce new teaching or technical resources 44 44
13
20
32
43
44
44
44
46
49
31
45
35
40
38
35
35
39
36
32
26
13
13
13
15
10
10
10
13
4
2
2
1
2
5
3
3
0 20 40 60 80 100
Enhanced career prospects
Made useful new contacts
Knowledge to produce new lesson plans
Additional motivation as teacher/tech
Freshened approach
Gained confidence as teacher/tech
Knowledge to develop resources
Developed new skills
Developed knowledge in a specific area
Major impact Minor impact No impact Too early to say
C-33
Wave 1 Wave 2
Gain additional motivation as a teacher / technician 47 43
Produce new lesson plans 34 32
Make useful new contacts 22 20
Enhance my career prospects 11 13
C.60 There is a strong relationship between impacts, satisfaction and the achievement of initial
aims. For each of the impacts above, respondents who were very satisfied overall (as opposed
to less than very satisfied) or who said that they would meet all their initial aims, were more
likely than other respondents to state that the course had a major impact in all instances.
Table C-29: Impact of course by satisfaction and achievement of aims
Wave 2 All Very satisfied (overall satisfaction)
Totally achieving main aims
All who attended a course (Base) 493 324 169
Percentages (Major impact) % Major impact % Major impacted % Major impact
Develop knowledge in a specific area 49 61 64
Develop new skills 46 60 63
Gain confidence as a teacher / technician 44 57 59
Freshen my approach to teaching or technician work
44 57 57
Produce new teaching or technical resources 44 58 56
Gain additional motivation as a teacher / technician
43 57 59
Produce new lesson plans 32 39 41
Make useful new contacts 20 26 27
Enhance my career prospects 13 16 24
C.61 In another exploration of impact, respondents were asked which of a number of possible
outcomes, if any, had happened as a result of the course they attended. Options ranged from a
measure of advocacy (recommendation) to behaviour at school, specifically the way they
prepared or taught as a result of the course. Advocacy runs high with three in five (60%)
recommending the Science Learning Centres to colleagues as a result of their course. Half
(53%) of course attenders said they had implemented new teaching/technician approaches.
About one third thought that the aims of the schools/dept improvement plans had been
supported (28%) and that they (participants) had changed the way they planned for lessons
(28%).
C.62 This survey aimed to capture the reach of impacts by allowing the respondents to mention
impacts which they thought the course had had on colleagues as well as themselves. With
20% of respondents saying that colleagues had implemented new approaches, 18% saying
that colleagues had signed up for CPD at Science Learning Centres and 11% saying that

C-34
colleagues have changed the way they prepare for lessons as a direct result of the respondent
attending the course, there seems to be evidence that courses are having an impact beyond the
individual participant.
C.63 In terms of changes in their own behaviour as a result of the course, 53% had implemented
new teaching/technician approaches, 28% said that they had changed the way they planned
and prepared for lessons and 13% had taken students outside the classroom. Over and above
this just over a quarter (27%) recognised that they were more engaged with CPD than they
were previously. In total 60% had recommended the Science Learning Centres to colleagues.
C.64 Teachers with least experience were least likely on all counts (and significantly so on many)
to report any of these impacts of the course. It seems that those with more experience
identified a greater ‘reach’ in terms of impacts (this may be due to their resulting seniority
over other staff).
C.65 Those attending courses in the National Centre were significantly more likely to report a
number of impacts; I have implemented new teaching or technician approaches (60%
compared to 50% of those on courses in local centres), colleagues have implemented new
teaching or technician approaches (29% compared to 17%). Significantly more respondents
who attended courses at the National Centre had recommended science learning centres to
colleagues (85% compared to 53% of those who attended local centres).
C.66 Primary teachers were significantly more likely than secondary or support staff to mention
both impacts on themselves:
I have changed the way I plan and prepare for lessons (50% compared to 34 and 12%
respectively)
I have brought in outside speakers to the classroom (13% compared to 5% and 1%)
I have taken students outside the classroom to learn in different environments (29%
compared to 12% and 4%).
and impacts on their colleagues:
their colleagues had changed the way they planned or prepared for lessons (32%
compared to 9% and 10% respectively)
colleagues had implemented new teaching or technician approaches (37% compared
to 19% and 14%)
colleagues had taken students outside the classroom to learn in different environments
(12% compared to 4% and 5%).
C.67 There appears to be a correlation between whether a respondent had implemented new
approaches at school and whether or not they had achieved their aims and/or recognised some
major impacts of the course. More than three in five (63%) of those who stated that all their
aims had/would be achieved had implemented new teaching or technician approaches at
school compared to 51% of those who thought that most aims would be achieved and 38% of
those that thought some would be achieved. Almost three in five (59%) of those who reported
C-35
some major impact said that they had implemented new teaching approaches. The data
indicates that good experiences and impact on the course could be catalyst for change within
schools.
C.68 There were some impacts which were mentioned less in Wave 2 than in Wave 1:
my colleagues have implemented new teaching or technician approaches (down 11%)
I have implemented new teaching or technician approaches (8%)
I have recommended Science Learning Centres to colleagues (down 5%)
the aims of the school/college/dept improvement plan have been supported (down
5%)
other staff have signed up for CPD (down 5%).
C.69 These changes may be a reflection of the mix of courses attended by respondents in each
Wave.
Table C-30: Impacts of the course on teacher/technician behaviour – participants and colleagues
Role Location
Wave 1 Wave 2 Primary teacher
Secondary teacher
Support staff
National Centre
Regional centres
Total (Base) 372 493 68* 251 105 131 337
% % % % % % %
I have recommended Science Learning Centres to colleagues
65 60 57 61 62 85 53
I have implemented new teaching or technician approaches
61 53 56 60 48 60 50
The aims of the school/college/dept improvement plans have been supported
33 28 31 31 20 31 26
I have changed the way I plan and prepare for lessons
30 28 50 34 12 34 27
I am more engaged in CPD than I was
27 27 24 26 33 33 25
My colleagues have implemented new teaching or technician approaches
31 20 37 19 14 29 17
Other staff have signed up to CPD at Science Learning Centres
23 18 18 20 18 24 16
I have taken students outside the classroom to learn in different environment
15 13 29 12 4 16 12
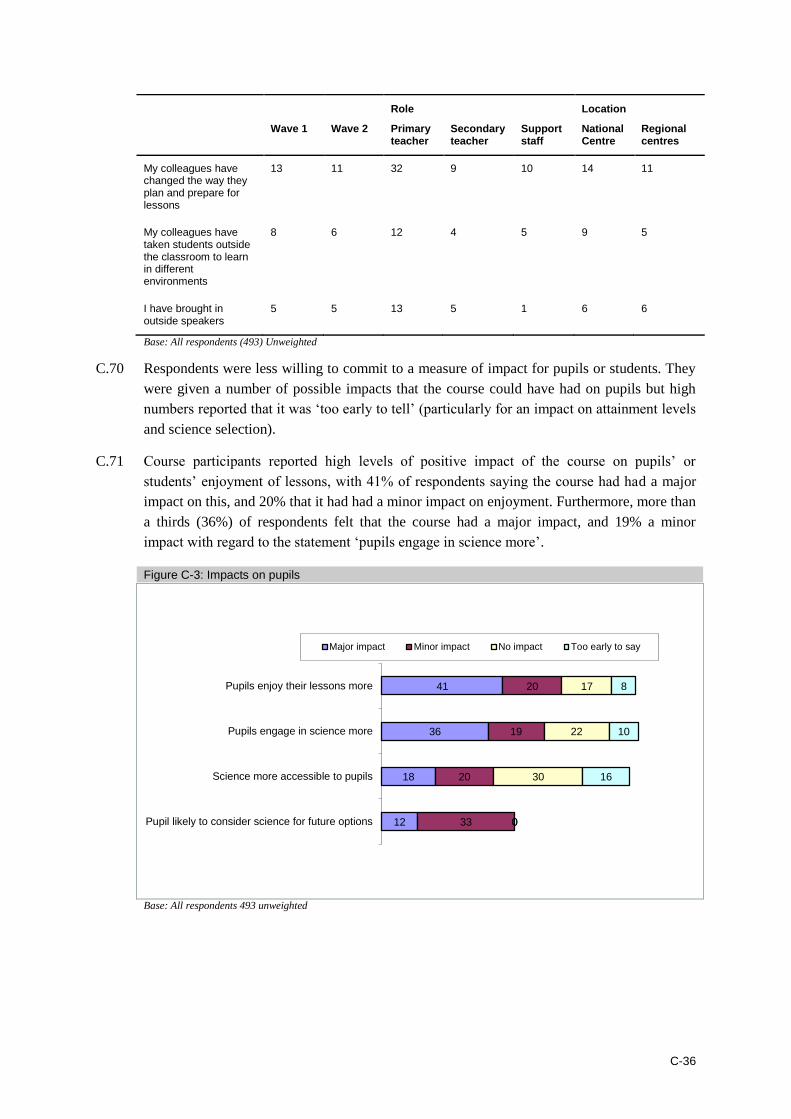
C-36
Role Location
Wave 1 Wave 2 Primary teacher
Secondary teacher
Support staff
National Centre
Regional centres
My colleagues have changed the way they plan and prepare for lessons
13 11 32 9 10 14 11
My colleagues have taken students outside the classroom to learn in different environments
8 6 12 4 5 9 5
I have brought in outside speakers
5 5 13 5 1 6 6
Base: All respondents (493) Unweighted
C.70 Respondents were less willing to commit to a measure of impact for pupils or students. They
were given a number of possible impacts that the course could have had on pupils but high
numbers reported that it was ‘too early to tell’ (particularly for an impact on attainment levels
and science selection).
C.71 Course participants reported high levels of positive impact of the course on pupils’ or
students’ enjoyment of lessons, with 41% of respondents saying the course had had a major
impact on this, and 20% that it had had a minor impact on enjoyment. Furthermore, more than
a thirds (36%) of respondents felt that the course had a major impact, and 19% a minor
impact with regard to the statement ‘pupils engage in science more’.
Figure C-3: Impacts on pupils
Base: All respondents 493 unweighted
12
18
36
41
33
20
19
20
0
30
22
17
0
16
10
8
Pupil likely to consider science for future options
Science more accessible to pupils
Pupils engage in science more
Pupils enjoy their lessons more
Major impact Minor impact No impact Too early to say

C-37
What the participants say: Impact of recent SLC learning in the school
Respondents were asked about the impact the course had on them in relation to various
aspects relating to their approach to teaching:
Knowledge development: the majority of respondents cited a boost to their confidence
through increased knowledge of the subject-
"It gave me some ideas and I have more confidence now. I can now teach classes with
confidence.”
High end/residential
“Through the knowledge I've gained from this course I'm actually teaching the higher order."
This respondent did not feel confident teaching A level Chemistry before the course
“doing this APP course allows you to look at these skills and knowledge and take them
forward" to the department and build that confidence”.
Low end/non-residential
Skill development: not all respondents felt they had developed new skills. However
among those that did confidence in what they were teaching was cited by a few
respondents, while others felt they had developed skills with either practical work or
teaching methods that would be beneficial in the classroom:
“Confidence has rocketed by 1000%. It's nice to know you're doing something right.”
“Skills learning that is impacted on children is as relevant as knowledge now, and that's a
big shift in teaching. It's a significant shift” this respondent reported that the skills set they're
trying to develop in children is new, previously teachers said they have to know and learn
something but now the skills balance and knowledge balance has shifted and he thinks in 3
years time it will be 50 - 50 rather than 30 - 70 in favour of knowledge. He like the idea of
getting children to present their data and sharing their knowledge within a group and using
technology not just to gather information but present it in a different way, "they're sharing
their knowledge in a way they didn't have to do before and to develop that skill is quite
exciting."
Low end/non residential
Longer term pedagogy: most respondents felt the course would have a longer term benefit
to the school and some cited their career, low end respondents were less likely to say the
course had an impact in this respect:-
“It's less teacher led and I'm more a facilitator for their learning." "There's a lot more active
learning going on, they're not just passive and sitting it there absorbing it like a sponge”
High end/residential
“I'm incorporating some of this stuff into the schemes of work really that we use in the
school and for everyone else to use."
Medium end/residential
"I feel it will benefit my career development long term now that I can offer 2 subjects to A
Level”.
Medium end/non residential.
Personal development: Some felt that the course had directly enhanced their personal
development by giving them greater confidence:
"I think it's made me more aware of the different options that I can take after my
probationary period."
C-38
Medium end/residential
"It has made me more effective in my role and knowledgeable."
Medium end/non-residential
"Now, I'm keener to develop myself."
High end/residential
New contacts: the majority made new contact(s) as a result of the course and felt this was
very beneficial:
One respondent reported that “He developed new contacts. Found the people on the course
were very friendly. There is a forum to share ideas and resources which has been very
useful. He regularly reviews what is on it. Hasn't contributed very frequently- monthly if that
but "I've definitely picked up useful things from there" High end/non residential
Another said that she met the head of science that is going to be their partner school. "It is
very easy to then share ideas about things and make plans to work together more in the
future."
Career plans: high end respondents were more likely to report an impact on their career
plans than medium and low end respondents:
One respondent reported that they had always thought about going for Head of Chemistry
but could now go for a 2nd in Science or even a Head of Chemistry & Physics. "It's given
me a broader range of jobs to apply for."
High end/non-residential
"Certainly opened up jobs as a Physics specialist I wouldn't have been able to apply for
before"
High end/non residential
Impact on other staff: The majority of respondents reported the course having some
impact on other members of staff through the dissemination of information, skills and
approaches to learning:
"I pass on any immediate things I've learnt to whoever needs them straightaway and go
over what I've learnt and formulate a summary for the rest."
Low end/non residential
There's always at least one thing I can tell them."
High end/residential.
Returning from course: impact upon school
All respondents were asked what helped ensure the course had an impact on their return to
the school. The key aspects of ensuring the course made an impact once back at school
were:
Sharing ideas/feeding back to colleagues (both formally and informally)
“I actually tell teachers on my courses the ideas I got on the course”.
High end/non-residential.
“Obviously they had invested the time to send me on a course so they wanted it to have an
impact and see the benefit of it. That again made me much more keen to get on and do I
because I felt they had given me the opportunity and I needed to re-pay that”.
High end/residential.
“And there was a lot of disseminating that I’d done”.

C-39
Medium end/non-residential.
Fewer respondents mentioned encouraging other teachers to attend courses and buying
additional equipment/resources to allow their knowledge to be used.
On the whole, respondents didn’t feel that there was anything hindering the course having
an impact back in the school setting. Where respondents did mention barriers to the course
having an impact, these tended to be in relation to time constraints: not having time to use
what they’d learnt, other teachers not having time and conflicting deadlines.
Impact of course on: Pupils enjoying lessons more
Fourteen respondents felt that the course had made a major impact upon pupil’s enjoyment
of lessons. This was particularly evident amongst the high end group, with all nine
respondents saying that the course had made a major impact on pupil’s enjoyment of
lessons. Respondents generally felt that they had more confidence, which resulted in pupils
being more confident, asking more questions and generally seeming to engage and enjoy
lessons to a greater extent.
“When I teach with confidence, my pupils can get confidence or enjoy it more… it make a
difference when I try new ideas or a new way of teaching and learning in the class”.
High end/residential.
A few respondents felt that the course had made a minor impact whilst others felt that it had
not made an impact of pupil’s enjoyment of lessons at all. For those who felt that no impact
had been made, this tended to be because they felt it was too early to tell or because
technicians generally felt that they did not have an impact on lesson enjoyment amongst
pupils as they weren’t in direct contact with pupils.
The means of measuring levels of lesson enjoyment amongst pupils varied across the
sample, with some using informal measures such as general perceptions and verbal
feedback and others measuring enjoyment in a more formal manner, such as feedback
assignments and pupil surveys.
Impact of course on: Pupils engaging in science more
Nine respondents said that they thought the course they went on had had a major impact on
pupil’s engagement in science. This tended to be because pupils are more interested,
asking more questions and generally keener.
“It is seeing then enjoying it and raising up their hands asking questions and they like to
learn about it”.
Medium end/non-residential.
This again seems to stem from the respondent’s increased confidence and new ways of
teaching:
“Making it pleasant to learn and fun to learn. I don’t muck about with dangerous things but
you can actually have a bit of a laugh and a joke even in the science lab and the kids will
take that on board, they’ll remember it then”.
High end/non-residential.
One teacher mentioned that there had been an increase in pupils wishing to take two
sciences, rather than the mandatory one science and felt this was evidence of them being
more engaged in science. Other teachers mentioned pupils wishing to stay longer to find out
more and an increased attendance in after school revision sessions showed their increased
engagement.
Again, methods of measuring this increased engagement were mixed, with some using

C-40
formal measurement tools (such as assessments, interviews and questionnaires) whilst
others used more informal methods (e.g. how interested they look, how many turn up to
additional sessions).
“…how interested the children were in the activities”.
High end/residential.
Some respondents said that they didn’t feel that the course had made any impact and the
reasons given for this were mixed. Again, some respondents that weren’t teachers felt that
their course did not impact on the pupil’s themselves, others felt that their pupils were
already engaged whilst others felt they weren’t able to use the knowledge they had gained
because they did not have the resources/equipment.
Impact of course on: Science more accessible to broader range of pupils and abilities
Reviews as to whether the course had made science more accessible to a broader range of
pupils and abilities were mixed. Some respondents felt the course had made a major impact
on the accessibility of science and one respondent even mentioned that feedback from
other teaches on the course prompted his school to change courses to make them more
accessible.
However, other respondents felt it had made less of an impact, with some feeling their
schools were quite generous in terms of what they were already offering and others feeling
that they cannot change the courses and can only allow a certain amount to do science or
that it’s down to the pupils:
“I don’t think it’s really made a difference in how they access it really. Again, I think that’s
more down to the pupils”.
Medium end/residential.
“We’re already quite generous with who we will take on the course”.
Low end/residential.
One respondent said it was too early to tell because “I simply don’t think one particular
course could have a major impact on that”,
Low end/residential.
Impact of course on: Pupils more likely to choose science for future options
All respondents were asked what impact they thought the course they went on could have
on whether pupils were more likely to choose science for future options.
A handful thought that the course had a major impact on whether pupils would choose
science as a future option and respondents generally said this because they have evidence
that the take up of science courses had increased and there were more pupils saying they
wanted to take up science related careers.
However, the majority felt that the course had only made a minor impact on take up of
science or that it wasn’t applicable, for the following reasons:
it’s too early to tell: pupils they are teaching had already chosen their options before
the respondent went on their course
the course was not relevant/would not make an impact upon the uptake of science,
either because they did not work directly with pupils or because the course was not
aimed at doing this

C-41
curriculum constraints.
How else has CPD benefitted department/school and how is this measured?
All respondents were asked whether they thought that the CPD has benefitted their school,
college or department in any other way. The responses given tended to focus around the
impacts that had already been discussed:
sharing knowledge/ideas with colleagues
increasing qualifications of staff
increasing confidence in day to day tasks
increasing engagement and enjoyment amongst pupils.
Respondents also mentioned that the SLC provided them with useful materials that could be
used straight away:
“Rather than information that just sits on your desk it has actually been tangible so we can
go in and teach”.
High end/residential.
The benefits to CPD were measured in a variety of ways, from progress reports to student
feedback.
What more is needed to ensure these impacts are sustained
All respondents were asked what, if anything, was needed to ensure that the impacts of the
course are sustained over time. The most frequently mentioned thing was communication.
Respondents felt that to ensure the benefits of the course were sustained, it was key to
share information with colleagues, making sure all teachers were using some aspect of it
where possible, keeping up to date with current ways of thinking and one respondent even
suggested setting up a blog to let others know the impact that the course was having on the
school.
Respondents also mentioned the need to attend more courses, attend refresher courses
and that encouragement to attend courses was necessary to ensure the benefits were
sustained over time.
Other responses related to bringing in external individuals to build on these impacts. One
suggestion was that the SLC should come into schools and give demonstrations whilst
another respondent thought that inviting scientists working in a variety of careers into the
school to talk about their careers would help pupils to engage with science and understand
the opportunities that science can bring.
The recurring theme of time was also mentioned as something that was needed to ensure
the benefits are sustained over time:
“The key thing is having time in schools to actually work through and to put things into
actual schemes of work and to spend time with other colleagues, which is very difficult
because of pressure of time and it only seems to get harder and harder in schools”.
Medium end/non-residential.
Instigating learning in schools
All respondents were asked whether they had had time to instigate what they had learnt on

C-42
the course in school. The majority of respondents said that they had been able to do this by
using their own time, either coming in early, staying late or working at weekends, to find
ways to integrate and build their learnings into lessons.
“I’ve just had to put the extra time in which I don’t mind obviously for the greater benefit of
the pupils”.
Medium end/non-residential.
For those who had not been able to instigate what they had learnt, the barriers tended to
related to workload/time constraints or lack of equipment.
All respondents were asked whether the SLC could do anything to aid integration into
schools and two respondents said that the SLC could offer courses or follow up courses to
aid this process. However, most respondents said they didn’t know or didn’t think there was
anything the SLC could do to aid this process. One respondent was particularly positive
towards the SLC at this point:
“[the SLC] dong a very good job outside of this course of monitoring the changes that are
happening in education and by responding to that by putting on relevant CPD”.
High end/non-residential.
Encouraging other staff to attend CPD courses
All respondents were asked how, if at all, they had encouraged other staff to attend CPD
courses at SLC. The majority of respondents said that they had encouraged other staff to
attend CPD courses and the most popular way of doing this was just by telling them the
benefits of the course, how good the course was and generally encouragement:
“Every time I get the opportunity, I do tell people how interesting they are and how useful
they are”.
High end/residential.
“I’ve tried to stress the benefits of them and the enjoyment more importantly and the
developmental skills that they can get”.
Medium end/residential.
“It’s not just here’s four or five hours worth of information. It’s a chance to go and have some
information and then think about how you’re going to implement that because usually there
is a chance to write some sort of action plan and think through what you’re going to do and
discuss with other people”.
Medium end/non-residential.
Other means of encouragement were passing on emails and literature that discussed the
courses that were available:
“Whenever I get sent the science learning stuff I do pass it on to anybody I feel might be
interested in it”.
Medium end/non-residential.
C.72 Whilst very few respondents (6%) stated that they had no opportunities to disseminate their
learning at all, dissemination does appear to have been informal with close colleagues on a
similar level. Just under two thirds (63%) reported that they had talked through their learning
informally with other teachers/technicians at the school and just over half (51%) informally
shared their materials from the course on an ad hoc basis. A quarter (25%) had talked through
their learning informally with their head teacher/senior colleague. A third (30%) had actually
presented the materials they had taken away with them at a staff meeting.
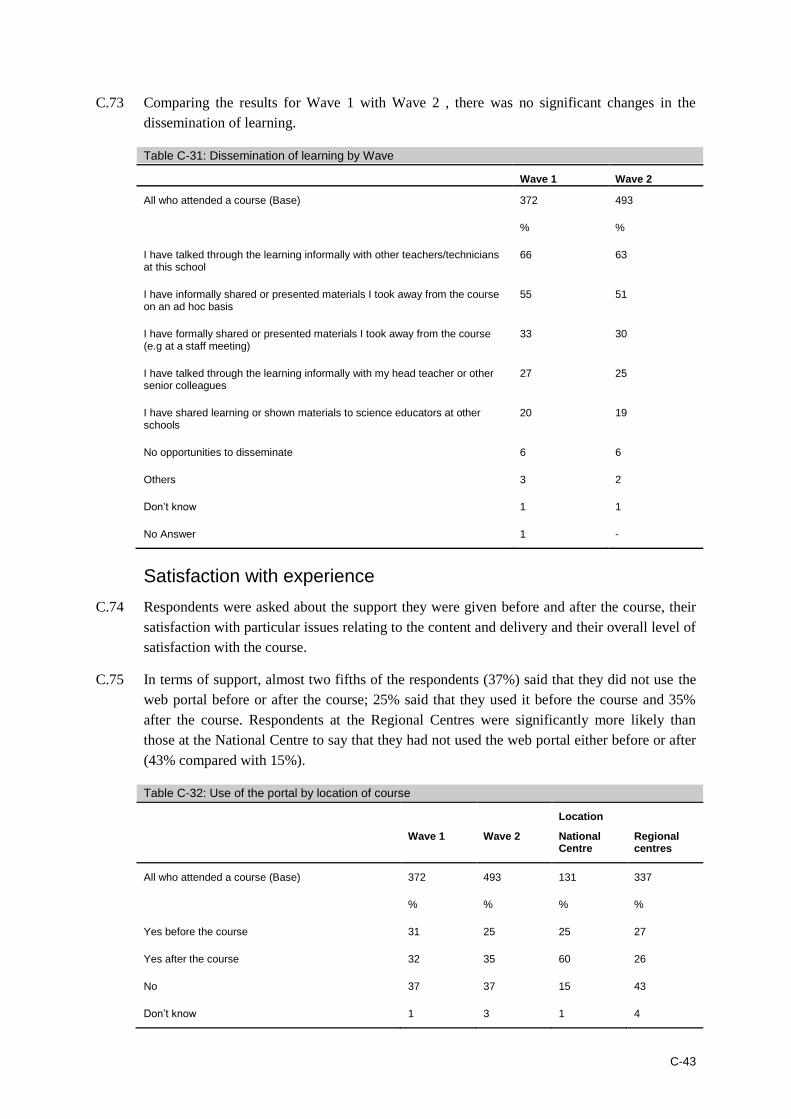
C-43
C.73 Comparing the results for Wave 1 with Wave 2 , there was no significant changes in the
dissemination of learning.
Table C-31: Dissemination of learning by Wave
Wave 1 Wave 2
All who attended a course (Base) 372 493
% %
I have talked through the learning informally with other teachers/technicians at this school
66 63
I have informally shared or presented materials I took away from the course on an ad hoc basis
55 51
I have formally shared or presented materials I took away from the course (e.g at a staff meeting)
33 30
I have talked through the learning informally with my head teacher or other senior colleagues
27 25
I have shared learning or shown materials to science educators at other schools
20 19
No opportunities to disseminate 6 6
Others 3 2
Don’t know 1 1
No Answer 1 -
Satisfaction with experience
C.74 Respondents were asked about the support they were given before and after the course, their
satisfaction with particular issues relating to the content and delivery and their overall level of
satisfaction with the course.
C.75 In terms of support, almost two fifths of the respondents (37%) said that they did not use the
web portal before or after the course; 25% said that they used it before the course and 35%
after the course. Respondents at the Regional Centres were significantly more likely than
those at the National Centre to say that they had not used the web portal either before or after
(43% compared with 15%).
Table C-32: Use of the portal by location of course
Location
Wave 1 Wave 2 National Centre
Regional centres
All who attended a course (Base) 372 493 131 337
% % % %
Yes before the course 31 25 25 27
Yes after the course 32 35 60 26
No 37 37 15 43
Don’t know 1 3 1 4

C-44
C.76 Respondents were asked to think about a number of issues and rate them on a scale ranging
from very satisfied to very dissatisfied. On a general note, as with the Wave 1 survey, stated
dissatisfaction in Wave 2 was very low. The highest levels of stated dissatisfaction
(combined responses of very and fairly dissatisfied) were given for convenience of location
(5%) and training delivered being what was expected (also 5%).
C.77 Most measures received a majority very satisfied rating. Between six and seven out of ten
respondents gave a very satisfied rating to quality of training presentation, use of your time,
course materials and materials to take away.
C.78 Slightly fewer respondents gave a very satisfied rating to relevance of course materials (59%),
timing of sessions (59%), training delivered to what was expected (58%) and value for money
course fees (52%).
C.79 About half (49%) of participants were very satisfied with the location, and slightly fewer gave
this rating to value for money including cover (40% very satisfied). Follow up support was
given the lowest rating of all the course aspects measured, with just 29% very satisfied with
this aspect of the course, though 13% of participants either said this aspect was not applicable
or did not know how to rate the course on this aspect. There may perhaps be some scope for
improving these aspects.
C.80 It is interesting to note that substantial proportions of respondents used the “don’t know” or
“not applicable” options when answering the measures relating to value for money. This
could be due to use of awards or bursaries, or not knowing the actual cost of the course and
cover, or perhaps the lack of a suitable “yardstick” for assessing value for money of the
courses.
Figure C-4: Satisfaction with aspects of the course
Base: All respondents 493 unweighted
29
40
49
52
58
59
59
60
61
62
62
27
17
32
21
30
35
32
28
30
29
31
28
11
13
9
7
5
5
7
7
6
6
3
2
5
2
5
1
3
2
2
2
1
Follow up support
Value for money inc cover
Convenience of location
Value for money course fees
Training delivered to what was expected
Timing of sessions
Relevance of content
Materials to take away
Course materials
Use of your time
Quality of training presentation
Very satisfied Fairly satisfied Neither/nor Dissatisfied
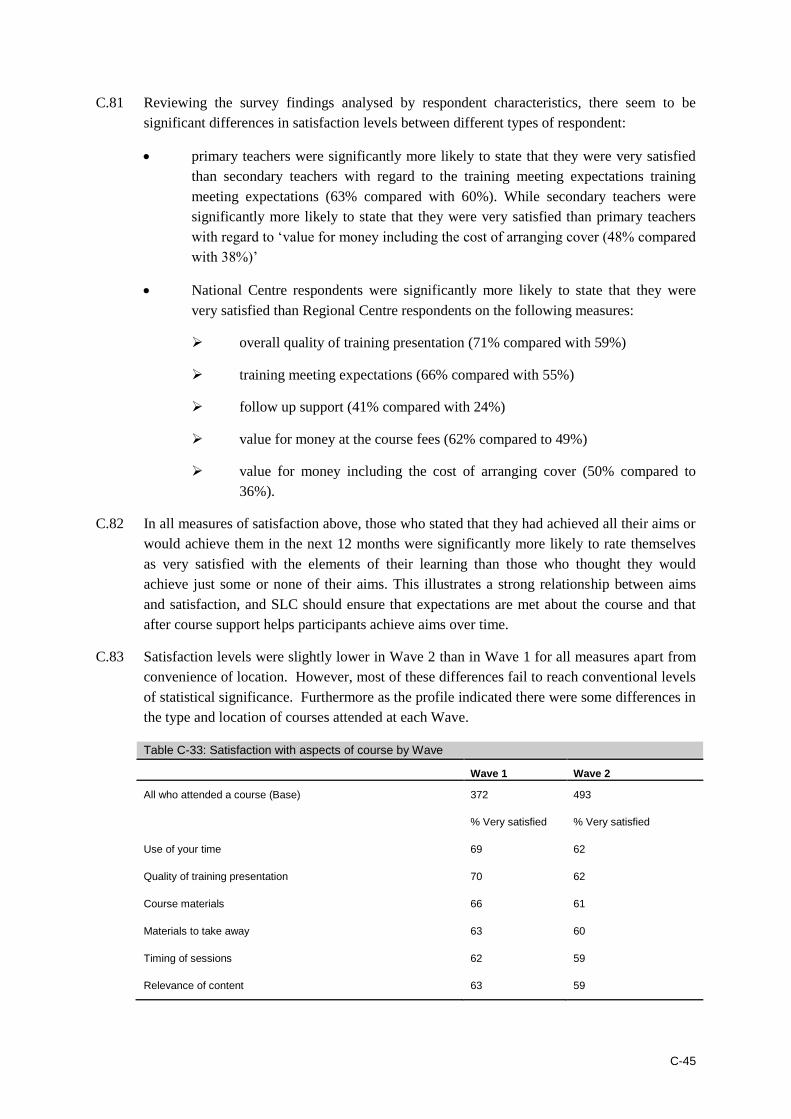
C-45
C.81 Reviewing the survey findings analysed by respondent characteristics, there seem to be
significant differences in satisfaction levels between different types of respondent:
primary teachers were significantly more likely to state that they were very satisfied
than secondary teachers with regard to the training meeting expectations training
meeting expectations (63% compared with 60%). While secondary teachers were
significantly more likely to state that they were very satisfied than primary teachers
with regard to ‘value for money including the cost of arranging cover (48% compared
with 38%)’
National Centre respondents were significantly more likely to state that they were
very satisfied than Regional Centre respondents on the following measures:
overall quality of training presentation (71% compared with 59%)
training meeting expectations (66% compared with 55%)
follow up support (41% compared with 24%)
value for money at the course fees (62% compared to 49%)
value for money including the cost of arranging cover (50% compared to
36%).
C.82 In all measures of satisfaction above, those who stated that they had achieved all their aims or
would achieve them in the next 12 months were significantly more likely to rate themselves
as very satisfied with the elements of their learning than those who thought they would
achieve just some or none of their aims. This illustrates a strong relationship between aims
and satisfaction, and SLC should ensure that expectations are met about the course and that
after course support helps participants achieve aims over time.
C.83 Satisfaction levels were slightly lower in Wave 2 than in Wave 1 for all measures apart from
convenience of location. However, most of these differences fail to reach conventional levels
of statistical significance. Furthermore as the profile indicated there were some differences in
the type and location of courses attended at each Wave.
Table C-33: Satisfaction with aspects of course by Wave
Wave 1 Wave 2
All who attended a course (Base) 372 493
% Very satisfied % Very satisfied
Use of your time 69 62
Quality of training presentation 70 62
Course materials 66 61
Materials to take away 63 60
Timing of sessions 62 59
Relevance of content 63 59

C-46
Wave 1 Wave 2
Training delivered to what was expected 63 58
Value for money course fees 61 52
Convenience of location 49 49
Value for money inc cover 46 40
Follow up support 31 29
C.84 Participants were also asked a rating question about their overall satisfaction with the course.
About seven out of ten (66%) said that they were very satisfied, 27% fairly satisfied, 4%
neither satisfied nor satisfied and 3% stated some level of dissatisfaction.
C.85 Comparing Wave 1 and 2, the proportion giving the top rating ‘very satisfied’ was 6% lower
in Wave 2 than in Wave 1, although there was no real difference in the levels of
dissatisfaction which were very low at both waves.
Table C-34: Overall satisfaction with the training received
Wave 1 Wave 2
Total who attended a course (Base) 372 493
% %
Very satisfied 72 66
Fairly satisfied 22 27
Neither satisfied nor dissatisfied 3 4
Fairly dissatisfied 2 2
Very dissatisfied 1 *
Don’t know/not applicable * *
VERY/FAIRLY SATISFIED 94 92
VERY/FAIRLY DISSATISFIED 3 3
Mean 1.62 1.56
C.86 There were some significant differences in ratings of overall satisfaction:
respondents attending courses at the National Centre were significantly more likely to
say they were very satisfied than those at Regional Centres (71% compared with
64%)
those respondents who received an ENTHUSE bursary or Impact award were
significantly more satisfied than those who did not (70% compared to 60%)
again there was a correlation between satisfaction and achieving main aims (81% of
respondents who had/thought they would achieve all their aims were very satisfied
compared with 50% of those who thought they might achieve some/none of their
aims).

C-47
C.87 Reasons for satisfaction mainly related to the quality of what was delivered and of those
delivering the material. Open responses about reasons for being satisfied were collected from
respondents and coded, and the proportions mentioning the main reasons for being satisfied
are shown in the chart below. Some of those who were satisfied did sound a note of less than
total satisfaction: 5% of those satisfied commented that some parts of the course had been less
relevant than others and 5% said they had found it too general or lacked depth.
Figure C-5: Reasons for satisfaction with the course
High level mentions (9% or more of those satisfied)
Acquired new skills/learned a lot (13%)
Heard lots of ideas/gave me new/useful ideas (12%)
Resources/well resourced/quality of materials (12%)
Relevance/course relevant to what I do (11%)
Confidence/gave me confidence in my subject area (9%)
Used ideas on return/implemented what I learned/impact (9%)
Mid level mentions (5-8% of those satisfied)
Expectations had been met (8%)
Information/an informative course (8%)
Good excellent course (7%)
Good/excellent teaching/speakers (7%)
Knowledgeable instructors/trainers (6%)
Enjoyable/enjoyed the course (6%)
Not relevant/not wholly relevant (5%)
Delivery was excellent (5%)
Base: Those satisfied with the course (456)
Key drivers of satisfaction
C.88 Overall satisfaction levels are high with the quality of the training received. However in
order to improve these high satisfaction levels it is important to determine the factors which
are most driving high satisfaction. It is possible to determine the derived importance of the
key drivers of satisfaction using a ridge regression. The table below shows the beta
coefficients from a ridge regression with the scores normalised to a 100% format for ease of
interpretation. The scores show the derived importance of each variable in determining the
outcome of the dependant variable – overall satisfaction with the training received. Those
variables with the highest beta scores have the greatest impact on overall satisfaction.
C.89 The two best drivers of overall satisfaction are the quality of the training presentation and the
relevance of the content materials. This means that the delivery of the course as well as the
content are deemed very important with regard to how participants feel with regard to their
overall satisfaction. The next most important driver of satisfaction is the course materials,
followed by the materials given to take away and follow-up support. Convenience of location
and timing of sessions were the least important drivers of overall satisfaction
Table C-35: Satisfaction with different aspects of training
Drivers of:
How satisfied were you overall with the training received? : Beta Index Rank
% Very satisfied
Convenience of location : 5 7 49
Timing of sessions : 6 6 59
Relevance of content : 23 2 59
Course materials : 18 3 62
Any materials given to take away : 14 4 62
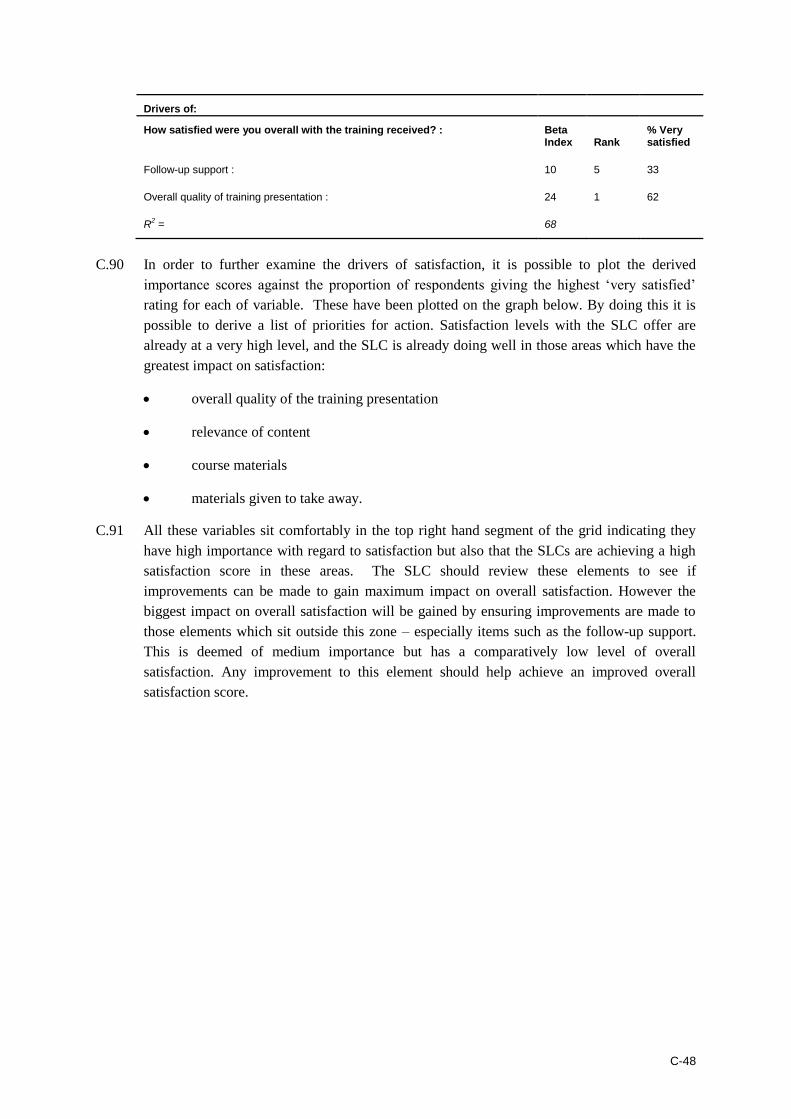
C-48
Drivers of:
How satisfied were you overall with the training received? : Beta Index Rank
% Very satisfied
Follow-up support : 10 5 33
Overall quality of training presentation : 24 1 62
R2 = 68
C.90 In order to further examine the drivers of satisfaction, it is possible to plot the derived
importance scores against the proportion of respondents giving the highest ‘very satisfied’
rating for each of variable. These have been plotted on the graph below. By doing this it is
possible to derive a list of priorities for action. Satisfaction levels with the SLC offer are
already at a very high level, and the SLC is already doing well in those areas which have the
greatest impact on satisfaction:
overall quality of the training presentation
relevance of content
course materials
materials given to take away.
C.91 All these variables sit comfortably in the top right hand segment of the grid indicating they
have high importance with regard to satisfaction but also that the SLCs are achieving a high
satisfaction score in these areas. The SLC should review these elements to see if
improvements can be made to gain maximum impact on overall satisfaction. However the
biggest impact on overall satisfaction will be gained by ensuring improvements are made to
those elements which sit outside this zone – especially items such as the follow-up support.
This is deemed of medium importance but has a comparatively low level of overall
satisfaction. Any improvement to this element should help achieve an improved overall
satisfaction score.

C-49
Figure C-6: Strategic Improvement Chart
What the participants say:
Support prior to the course: This was felt to be good by respondents across all groups.
Respondents were generally emailed the course details and content, any travel and hotel
arrangements as well as the time and location. The details provided were generally
deemed to be sufficient and clear so respondents knew what to expect. Some were also
emailed details of a pre-course task.
"The support was very good, it was fantastic. The programme was sent by email." High end/residential
There was one respondent who felt the details provided for the location of the course were
inadequate and another felt that receiving details just one week before the course was too
late. However, there was a feeling that the pre-course support was at least adequate and
provided all they needed at that time.
One respondent commented at this point that the support materials received prior to the
course meant that…"I'll be totally honest, the day didn't live up to what I expected. That
wasn't necessarily because I was necessarily mis-informed by the information. It was more
to do with the fact that I had quite high expectations and I was disappointed."
Low end/residential.
About half the respondents received some pre course materials to read or complete prior to
the course, these were mainly directed at those on a residential course. In most cases
respondent were happy with the materials received and the tasks set. However one
Strategic Improvement Chart
Overall quality of
training presentation
Follow -up support
Any materials given to
take aw ay
Course materials
Relevance of content
Timing of sessions
Convenience of location
20
30
40
50
60
70
80
0 5 10 15 20 25
Derived Importance
% V
ery
sa
tis
fie
d
Strategic Improvement Chart
Overall quality of
training presentation
Follow -up support
Any materials given to
take aw ay
Course materials
Relevance of content
Timing of sessions
Convenience of location
20
30
40
50
60
70
80
0 5 10 15 20 25
Derived Importance
% V
ery
sa
tis
fie
d

C-50
respondent noted that they did the pre task and was disappointed that:
"no-body actually looked at it or took much notice of it"
Low end/residential
One respondent said he would have liked to have received some pre-course tasks as it
would have helped him with the course but they never received anything.
Support after the course: respondents were asked to rate the quality of support after the
course on three aspects – the materials provided, support from the SLC and support from
their manager.
Materials Provided: the materials provided by the course were generally deemed good and
for some far exceeded their expectations:
"I think the course cost £130 yet we were given resources in access of £160 …you were given the puppets to use with DVDs…that was beyond my expectations"
High end/non-residential.
“I got cards on human reproductive system, key stage 3 and 4". The material was good
because that's what I used with my students which they liked"
Medium end/non-residential
One high end respondent felt the materials provided were “Average, materials could
definitely have been improved. He would have appreciated more information and a
summary of what was learnt over the 5 day period. The information should not be delivered
online but instead by post
Support from SLC, most participants were offered contact details (email/phone numbers)
should they wish to follow-up any issues after the course. In reality few had used them but
those that had felt the support offered was generally good:
“Excellent whenever I've phoned up they've been very good and they've always phoned
back”
High end/residential
"There's lots of people that leave telephone numbers and email address to get in touch if you want any help but if you didn't want to take it any further you didn't have to” High end/non-residential.
Support from manager/head of science:
Support from the respondent’s manager was mixed. While some felt they received positive
encouragement and support from their manager with some reporting that their manager
allows them time and helps organise sessions to allow them to feedback their learning to
other teachers. One respondents also mentioned that their managers are keen to build on
their learning and will discuss others course which may benefit them. However many
respondents report that there is a lack of support after the course from their managers who
tend to leave any dissemination of information to the individual.
One respondent reported “there is no real support from the line manager or school because
we're so busy all you get is ' what was the course like, was it useful? And that's about it"
Medium end/residential.
Some respondents formed part of the senior management team in their establishments and
hence did not expect to receive any support after the course.
Use of and improvement to web portal. Most respondents had used the web portal.
Generally speaking the high and medium end users demonstrated a greater knowledge

C-51
about the site than low end users. Seven respondents had not accessed the site, all of
whom had attended a non-residential course. This may indicate a different usage of the site
depending on the type of course attended.
The general reaction to the site by those who had used it was very positive.
Content and relevance
There were some very positive comments regarding the content of the site:
..range of content is "excellent because they have things for the key stages. They also have
things for teaching assistants as well as teachers so there's something there for everybody"
High end/residential
Regarding the quality of materials on the site, one respondent stated "they are accessible to
use, you can use them immediately for lessons."
Medium end/residential
“It's very relevant to the course and there's a mixture of all the areas they looked at through
web site links and PowerPoint presentations. The quality is very good "it's very
professionally done" it's the same materials they were using on the course.”
High end/residential
One respondent suggested that the site would be better if there was a more defined split of
content directed at teachers and that directed at technicians:
"it could be slightly more split for teachers and technicians. Quite often I find having to weed
out the technician stuff from the teachers stuff…They could just have a section that is aimed
at the technicians"
Medium end/non-residential
Navigation
A minority of respondents made references to the navigation of the site being difficult at first:
“The only area that could be improved is the navigation”, this respondent reported that it
took him a long time to find the place where they he could store 20 megabytes of their own
resources and he is quite computer literate. He suggests having a heading 'My Documents'
would make it more straightforward.
Navigation is fine although respondent has struggled in the past to log in but once he is in
he is able to work his way around efficiently, "it's a nice simple site."
"I felt a little bit hard going to be honest. A couple of times I ended up going round in circles.
Medium end/residential
One respondent commented that he was irritated by the updates sent out by the site:
"It is one of these things which drives me mad. You are signed up to this web type blog
thing and everytime anyone put anything on it or commented on it you got an email saying
something else has being added to this thing and to be honest it was at the point where it
was so irritating, getting numerous emails, that I unsubscribed from it."
Low end/non-residential
Improvements
One respondent commented the site could be improved by displaying a menu of courses
currently running and in the next month on the home page. Another respondent felt it would
be useful to have more videos on the site which demonstrate experiments. Another
C-52
suggestion was to have "some more topics in." These topics should be relevant to what is
on the school curriculum and relevant to those subject areas.
Overall satisfaction: All respondents were reminded what they said in the online interview
and asked why they recorded that particular level of satisfaction in the quantitative survey.
The high end respondents all recorded extremely satisfied in the online survey and key
drivers were the fact that the course met and exceeded very high expectations, respondents
found the format and content useful, practical and engaging and/or that the delivery by the
tutors was of a high quality. It also gave the participant more confidence when teaching the
subject.
“I learnt a lot in 5 days. It gave me some confidence from ideas about practical activities and
some misconceptions I had were cleared about the physics course and I enjoyed it.”
High end/residential
"I thought it was that good I'd have spent my money. I'd actually have paid to go on that
course with my money”
High end/residential
“It was an all round great course, it benefited my CV, it benefited my career, it benefited my
kids."
High end/non residential
“The delivery of the course so far has been of very high quality. It Is well thought out and
well planned even though it is running for the first time. I think they are quite clear about
what they want to achieve with it"
High end/non residential
“As far as the use of CPD has being far the best course I've been on in terms of the impact
it has had on my teaching and the class. The number of ideas and resources I have made
use of in the six months since I've attended the course have been worthwhile."
High end/residential
Low end and medium end respondents had previously stated that they were less than
extremely satisfied. Reasons for this were:
coverage (one respondent said they didn’t cover the items advertised in the course
literature possibly as they ran out of time and another felt subject were not covered in
enough depth)
administration (one respondent had problems locating the centre)
relevance
lack of follow-up
a mismatch between expectations and reality.
"Lighter things in the morning and fairly deeper things in the afternoon and it might have
been wiser to switch them around a little bit" to when they were less tired
Low end/residential
" because it wasn't directly relevant."
Low end/non residential
" If I gained something and I was completely astounded then I think it would've gained a
higher score".
Low end/non residential
Key stage 3 and key stage 4 tended to dominate the agendas. It didn't dominate the
advertised agenda it was almost like when it was about talking and networking these were
the things that tended to come out like changes to key stage 3 and key stage 4 level
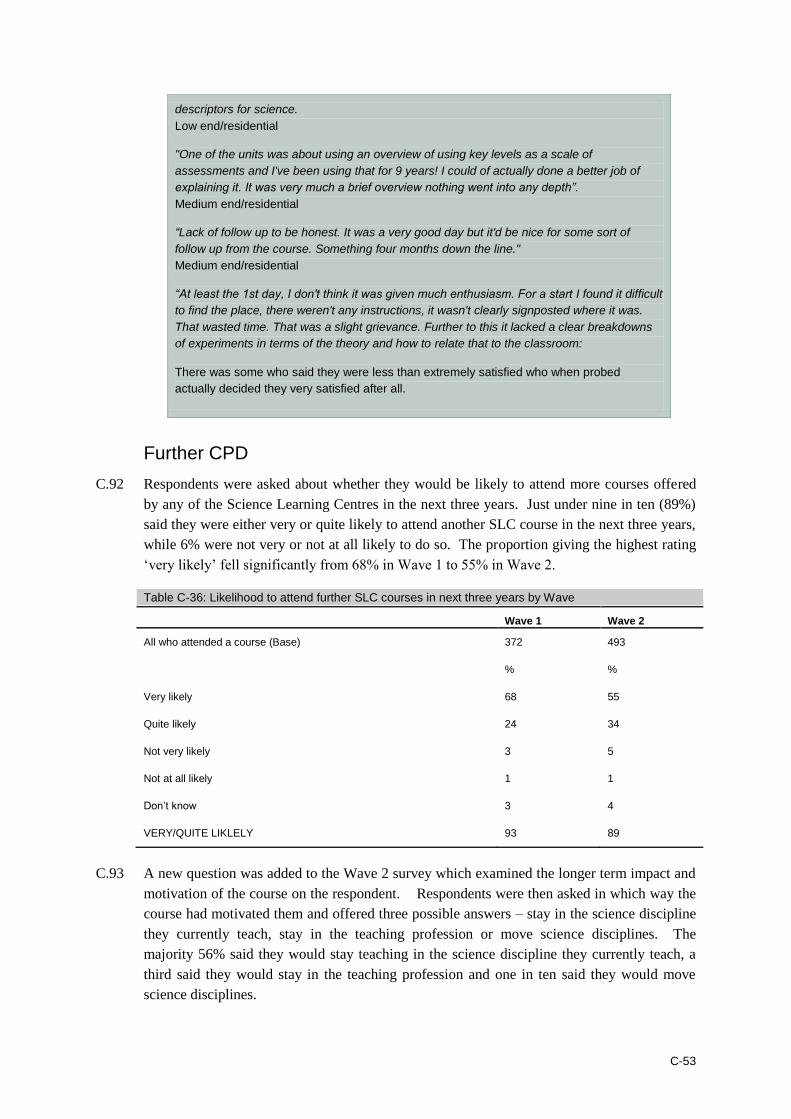
C-53
descriptors for science.
Low end/residential
"One of the units was about using an overview of using key levels as a scale of
assessments and I've been using that for 9 years! I could of actually done a better job of
explaining it. It was very much a brief overview nothing went into any depth”.
Medium end/residential
“Lack of follow up to be honest. It was a very good day but it'd be nice for some sort of
follow up from the course. Something four months down the line."
Medium end/residential
“At least the 1st day, I don't think it was given much enthusiasm. For a start I found it difficult
to find the place, there weren't any instructions, it wasn't clearly signposted where it was.
That wasted time. That was a slight grievance. Further to this it lacked a clear breakdowns
of experiments in terms of the theory and how to relate that to the classroom:
There was some who said they were less than extremely satisfied who when probed
actually decided they very satisfied after all.
Further CPD
C.92 Respondents were asked about whether they would be likely to attend more courses offered
by any of the Science Learning Centres in the next three years. Just under nine in ten (89%)
said they were either very or quite likely to attend another SLC course in the next three years,
while 6% were not very or not at all likely to do so. The proportion giving the highest rating
‘very likely’ fell significantly from 68% in Wave 1 to 55% in Wave 2.
Table C-36: Likelihood to attend further SLC courses in next three years by Wave
Wave 1 Wave 2
All who attended a course (Base) 372 493
% %
Very likely 68 55
Quite likely 24 34
Not very likely 3 5
Not at all likely 1 1
Don’t know 3 4
VERY/QUITE LIKLELY 93 89
C.93 A new question was added to the Wave 2 survey which examined the longer term impact and
motivation of the course on the respondent. Respondents were then asked in which way the
course had motivated them and offered three possible answers – stay in the science discipline
they currently teach, stay in the teaching profession or move science disciplines. The
majority 56% said they would stay teaching in the science discipline they currently teach, a
third said they would stay in the teaching profession and one in ten said they would move
science disciplines.

C-54
Table C-37: Long term impact/motivation resulting from attendance at SLC course
Type of teacher/technician
Experience
Total Primary teacher
Secondary teacher
Support staff
Under 2 years
2-10 years
11 Plus years
Total (Base) 493 68* 251 105 93* 206 193
% % % % % % %
Stay teaching in the science disciplines you currently teach
56 40 60 61 57 53 59
Stay in teaching as a profession
33 57 28 22 29 34 35
Move science disciplines
10 3 12 17 14 13 6
What the participants say:
Future demand for science specific CPD
Seventeen respondents had identified future science-specific needs for themselves, with
most of these having targeted a course accordingly. Three of these respondents had
identified training needs for other staff:
"We're hoping to get our colleague on an initial course for a technician and then to go onto
to do a physics course"
Medium end/residential
"I think any course that I do in the near future I would be looking for work with interactive
boards and science"
High end/non—residential
Some respondents suggested the type of courses they would like to go on. With one
respondent stating that there is a “lack of practical based activities for genetics”. This
respondent would like the SLC to expand on this area as there are no courses currently
focusing on this. This respondent would also like to see an animal dissection course
provided.
Of the remaining respondents who said they had not identified any science-specific training
needs, most didn’t give a reason. However one respondent said that it was due to the
school having a new Headteacher.
When asked if they would attend another SLC course, six respondents had already
identified a course they were either booked on or would like to go on in the future. A further
14 respondents said they would like to attend an SLC course in the future but had not
identified the one they would attend. Reasons for wishing to attend another SLC course
were two-fold – to increase their knowledge in a specific area and more generally “because
I've had a really good experience with them, it was high quality." High end/non-residential
Just two respondents said they would not consider doing another SLC course. Reasons
given were:
" We just felt that being senior leaders we didn't gain much from it but if we had a younger
member of staff like a teaching assistant they may get more out of it"
C-55
Low end/residential
"I was only interested in this course because of the Stem initiative". If they did more Stem related ones she would consider attending. Medium end/residential
Respondents were asked if there were any specific development opportunities they would
like the SLCs to offer which they do not at present. Although most felt that they offered a
good range of courses, some suggestions were put forward:
course on leading a department
A level courses/A level chemistry
course covering the Scottish curriculum as there is limited CPD opportunities in
Scotland
“AMP” courses
animal dissection
more practicals
networking meetings
Stage 4 curriculum to cover the new Science GCSE in 2011
staff development course
more specific courses for young children with specific learning difficulties.
Marketing: respondents were asked their opinion on the way the SLCs “market”
themselves. Most respondents had no complaint about the way the SLCs promote
themselves and could suggest nothing more:
"They come across very professional actually. The way they market themselves, they seem
genuinely interested in science and teaching it."
Medium end/residential
“They do inspire you a bit with their brochures"
Medium/non-residential
"I think it's generally efficient. I can't think of any improvements off hand."
Low end/residential.
"I don’t think they're marketing themselves any better or worse than they should be"
Low end/residential
"From what I've seen it's absolutely fine. All I get is the mail shots occasionally on what's
going on and the portal. I don't actually see much else"
Medium end/residential
A few respondents suggested that the SLCs should do more to advertise the funding
available, especially making Headteachers/Heads of Departments aware of the Impact
award, as funding is a major stumbling block affecting the decision to attend a course.
Furthermore the SLC should outline the benefits to senior staff of sending their staff on
these courses.
A couple of respondents gave some suggestions to improve the SLCs marketing:
advertise their courses in the national press (eg The Times)
sending out SLC representatives to talk to staff in schools/colleges
sending out a regular bulletin or newsletter through the school "I don't think they're
particularly aggressive in the market" medium end/non-residential.
C-56
With regard to the location of the courses, all respondents apart from two, would be willing
to attend courses either at the national centre or at a regional centre (and indeed 8
respondents had already attended courses held at both the national centre and a regional
centre). The main reasons cited were that they would attend the venue that offered the
most appropriate course :
"If there was something pertinent or it was suggested to me that I should go on something
like that then I would consider it.
Low end/residential
Some respondents had heard good feedback about the national centre and so were positive
about attending a course there:
“The national centre for a residential course is really well equipped"
High end/non-residential
A few respondents would prefer to attend course at a regional centre to avoid too much time
out of school or to fit in better with their home commitments.
Accreditation of courses:
Respondents were equally divided in opinion on whether they would be more interested in a
CPD courses that had an academic or professional accreditation. Those in favour cited
formal recognition and possible career (and/or pay) enhancement:
“If you were to get credits after every course it would make it very good”
High end/residential.
"It's something that does help further your career as well."
Medium end/residential
"Absolutely yes." "I think it provides some sort of kudos and recognition of the development
you've undergone."
Medium end/non-residential
"I would be more motivated because it would be recognised more I think in the teaching
profession"
Low end/residential
Some respondent, especially those holding senior positions and /or have been in the
profession for a long number of years, were much less positive about the need for the
course to be accredited. However, they understood that accreditation may be of benefit to
those starting out on their career.
It was interesting to note that several respondents felt accreditation was not necessary but
felt that their line manager would be keen on this. While for others they were keen on doing
accredited CPD but felt their line manager would be less inclined. One respondent cited “If it
involved dissertations” it would put her off because she doesn't have the time. She doesn't
think the head teacher would be 'bothered' because of the extra time that might be involved
gaining that accreditation.

C-57
What the participants say: Final comments
All participants were asked if they would like to add anything about the concept of the
Science Learning Centres and the general impact they are having in their sector. Those
who gave an answers were generally very positive across all respondent types:
"I think it's a brilliant idea and I only wish more people could get involved in going on them.
They're useful. I honestly can't find anything wrong with it…I think the set up that it's got is
phenomenal."
High end/residential
“I think they've created a buzz of people wanting to and doing courses which are of a high
level and coming back and talking about them and being enthusiastic. This is sustained
from the first time the SLC centre was open, "I mean the first year when a number of us
went on different courses and the talk in the science staffroom was definitely more about
science and how we can make more impact with the students than it had being before and
people wanting to share ideas." Medium end/non-residential
"I think it is important and I think it is more important now because of the proposed changes
to the national curriculum. There is this concern about science becoming a non-core subject
and therefore, marginalised so I think the national science centre have a big part to play in
getting the kudos of science in the curriculum." Low end/residential.
There were a couple of reservations about the impact of the SLCs with one respondent
saying:
"I think they need to try and get a niche which isn't provided elsewhere. I think when they
were set up their focus should have being around contemporary science and improving
teachers subject knowledge." This respondent felt many of the courses the SLC are running
compete with what is being delivered at a local level.
Medium end/non residential
Finally respondents were asked if there was anything else they would like to say about the
SLC experience specifically and CPD educator CPD more generally. The messages
offered were generally very positive:
“quite well thought out. The strategic planning of it is good. It seems to be meeting the
teacher's needs".
High end/non-residential
One respondent did offer some advice:
"I think if you get enough people going it will really make a difference to how science is
taught in schools." This respondent would like the courses to be taught across all schools,
"So if it is happening across the country in all schools at the same time you don't get these
pockets of a new school having a new initiative and other schools being twenty years
behind." But it is the issue of getting teachers to these courses, "I think in some schools just
trying to get anybody out and do anything is still a big problem."
Medium end/residential
C-58
Summary and Conclusions
Sample Profile
C.94 There were only small differences in the profile of the demographic profile of the samples in
Wave 1 and Wave 2. Both samples had a similar age and sex profile. There were some slight
variations in the samples with regard to job role, with the wave 2 sample containing a lower
proportion of secondary school teachers than the wave 1 sample. The samples had a similar
profile with regard to years of experience, subjects taught, type of course undertaken and in
the length and duration of the course taken. However the Wave 2 sample contained slightly
less National Centre participants (27%) compared to wave 1 (32%) and this difference must
be considered when interpreting the results.
Current CPD practice:
as found in Wave 1, discussions about training needs tend to be informal. Just 31%
reported that they had regular structured discussions with their line manager/senior
staff, the same proportion as in Wave 1. Similarly, 12% said they never discussed
their training needs (in both Waves). The idea for attending the SLC course in the
majority of cases came from the course participants (59%). It is therefore important
for the SLCs to promote the training and ongoing development of staff at all levels
and to help encourage an increase in take up of SLC courses
apart from information from the National Science Learning Centre and Regional
Science Learning Centres (45% and 47% respectively), information about CPD
usually comes via managers (48%). Other important communication channels
mentioned were another colleague in the school (23%), the Association for Science
Education (17%), local authority advisor (15%) and STEMNET (11%). The
proportions were all slightly lower than in Wave 1 but the rank order remains the
same. The responses to this question highlights the importance of marketing from the
National and Regional Centres, as well as word of mouth, but also ties into the need
to ensure that managers are equipped with course information
30% had participated in three or more CPD activities through the SLCs in the last 2
years indicating the importance of “repeat business” to the SLCs and importance of
having a positive experience while on the course. The SLCs face competition from
other providers of science specific CPD and 75% of respondents had been on science
specific training elsewhere. The Local Authority (30%) and exam board/awarding
bodies (25%) were the most frequently mentioned alternative suppliers.
The vast majority of course participants were very impressed with the content, format and
delivery of the courses. They also found the information on course very accessible and
relevant whether on the website or via leaflets, newsletters or emails.

C-59
Bursaries/Awards
C.95 Two thirds of respondent (66%) received some form of financial assistance (Impact Award of
ENTHUSE Bursary) to attend the SLC course. Financial assistance is deemed critical for the
majority of respondents who say they would not have been able to attend the course without
it.
Although course participants had found out about the awards through the course literature
or on the website, some felt that the SLC should do more to promote the fact that financial
assistance is available to senior staff who the may be more willing to encourage staff to do
CPD through the SLCs.
Aims/motivations
C.96 In the 15-18 months that followed the course a third (19%) of respondents thought they would
fully achieve their main aims for attending. More than half (51%) said that they would mostly
fulfil their objectives, 28% said to some extent and just 1% said either not at all or that they
did not know. The proportion who felt they would achieve all their aims was significantly
lower than in Wave 1 (19% compared to 33% Wave 1). When probed, the main reasons for
not achieving all their aims were lack of time to initiate their learning in class and not having
time to do the follow-up work. Reducing the requirement for follow-up work and perhaps
offering easy solutions for transferring learning directly to the classroom may enable those
with limited time to implement some of their learning more immediately in the classroom.
Impacts of the course and dissemination of learning
C.97 About half of the course participant respondents agreed that the course had had a major
impact on developing their knowledge in a specific area and/or developing new skills (49%
and 46% respectively). These proportions were similar to Wave 1. As in Wave 1, the next
most mentioned items to have a major impact were: gaining confidence, freshening their
approach to teaching/technician work, gaining additional motivation as a teacher/technician,
giving knowledge to help develop resources. The areas where the course had least impact
were enhancing career prospects and making new contacts.
C.98 There is a strong relationship between impacts, satisfaction and the achievement of initial
aims. For each of the impacts we asked about, significantly more respondents who were very
satisfied (as opposed to less than very satisfied) or who said that they would meet all their
initial aims, stated that the course had a major impact in all instances.
C.99 Another question in the survey aimed to see how behaviour had changed in school as a direct
impact of attending the course. The three main ways in which it had were participants
recommending SLCs to colleagues (60%), implementing new approaches (53%), school
development plans had been supported (28%) and/or changing the way they plan for lessons
(28%).
C.100 With 20% saying that colleagues had implemented new approaches, 18% saying that
colleagues had signed up for CPD at Science Learning Centres and 11% saying that
colleagues have changed the way they prepare for lessons, as a direct result of the respondent

C-60
attending the course, there seem to be grounds to say that impacts are reaching beyond the
individual participant.
C.101 Respondents were less able to report impacts on students/pupils with many saying that it is
too early to tell (particularly for an impact on attainment levels or science selection). The only
measures that reported a relatively high level of impact was enjoyment in lessons with 41%
reporting a major impact on pupils/students as a result of the course (and 20% reporting a
minor impact) and pupils engage in science more (with 36% recording a major impact and
19% a minor one).
C.102 Just 6% said they had had no opportunity to disseminate at all, what has been done is largely
informal and with colleagues at a similar level. Just under two thirds (63%) reported that they
had talked through their learning informally with other teachers/technicians at the school and
just over half (51%) informally shared their materials from the course on an ad hoc basis.
However, if the impacts shown mentioned above are true then the dissemination of learning is
quite effective at a range of levels. going back to the earlier point about impact, if the third of
participants who believe that colleagues have implemented new approaches, the quarter who
believe colleagues have signed up for CPD at SLC and the eighth who believe colleagues
have changed the way they prepare for lessons as a result of the respondent’s participation in
the course are correct, then clearly some fairly effective dissemination is going on.
Course participants were asked what, if anything, was needed to ensure that the impacts of
the course are sustained over time. The most frequently mentioned thing was
communication. Respondents felt that to ensure the benefits of the course were sustained, it
was key to share information with colleagues, making sure all teachers were using some
aspect of it where possible. One respondent suggested setting up a blog to let others know
the impact that the course was having on the school.
Satisfaction
C.103 At least half of all course participants in the survey were very satisfied with all measures
except convenience of location, value for money and follow up support. The measures about
value for money attracted large numbers of “don’t know” responses. Satisfaction with follow
up support was substantially lower than with any other aspect covered in the survey.
However, the fact that most of the course participants had been on previous SLC courses and
were therefore “repeat business” says something in itself about perceptions of the quality of
the SLCs’ offerings.
C.104 Two thirds (66%) of course participants in the survey were very satisfied overall with their
experience. Reasons for satisfaction mainly related to quality of teaching/content and
delivery, though a proportion of respondents explicitly related their satisfaction to
expectations having been met. The level is slightly lower than in Wave 1 (72%).
C.105 In all measures of satisfaction above, those who stated that they had achieved all their aims or
would achieve them in the next 12 months were significantly more likely to rate themselves
as very satisfied (80%) with the elements of their learning than those who thought they would
achieve just some or none of their aims (50%). This again illustrates a strong relationship

C-61
between aims and satisfaction and SLC needs to ensure that expectations are met about the
course and that follow up support helps participants achieve aims over time.
C.106 The key drivers of satisfaction are the quality of the training presentation and the relevance of
content, both items on which the SLC already scores high satisfaction levels. Improving the
follow-up support was identified as a variable which has room for improvement and thus the
potential to drive up the level of overall satisfaction.
Further CPD
C.107 Some 55% said they were very likely to attend a further SLC course in the next three years
and a further 34% said they were quite likely to. These proportions were similar to Wave 1
(68% and 24% respectively).
The majority of course participants were keen to attend another SLC course and some had
already identified a course they wished to take and were booked onto this. There were
some suggestions for courses ranging from topic specific suggestions to general requests
for such as “more practicals”.
Opinion on accreditation was divided with some (younger, less experiences) participants in
favour as it may enhance their pay and job prospects, while others were less in favour as
they felt it was the course content rather than the accreditation that was important.

D-1
Annex D: Summary of findings from the national educator telephone survey
Research objectives
D.1 This annex updates the earlier Survey of Science Educators which was carried out in 2006 by
TNS. The aim of the two surveys was to collect quantitative data from the UK science
educator population about their experience of, and attitudes towards, undertaking training and
Continuing Professional Development, particularly science specific training.
D.2 Importantly, the 2010 survey evaluates science educators’ knowledge of, and interaction with,
Science Learning Centres, including attendance at training courses or other events. As a
repeat of the 2006 survey, this allows for a robust assessment of the Science Learning Centre
initiative, highlighting changes over time.
Methodology and Sampling
D.3 The survey replicated the approach taken by the initial Survey of Science Educators which
was carried out in 2006, interviewing a sample of science educators across the UK. Whilst
the main focus was on science educators in England due to the fact that Science Learning
Centres are located in England only, a sample of science educators from the rest of the UK
was also included, given that the National Science Learning Centre in York serves educators
across the whole of the UK.
D.4 The science educator population included all teaching staff in primary schools, heads of
science and science teachers in secondary schools, and FE/Sixth Form College heads of
science and science teachers, as well as all science technicians in secondary schools and
FE/Sixth Form Colleges. Teaching assistants in primary schools, and teachers and assistants
in special schools and pupil referral units were excluded from the population.
D.5 1,402 interviews were conducted by telephone between 25 January and 21 May 2010. They
were carried out by trained and briefed members of GfK NOP’s Telephone Interviewing
Services interviewer panel from a telephone interviewing centre in London. Interviews lasted
17 minutes on average, with the questionnaire remaining unchanged from the initial survey.
Due to the fact that individual contact details are not available for science educators in the
UK, it was necessary to draw a sample of primary and secondary schools and FE/Sixth Form
Colleges, contacting school switchboards and asking to speak with a relevant science
educator. Quotas were set for each group of science educator within country (England / Non-
England) and closely monitored throughout fieldwork.
D.6 The sample design ensured that a sufficient number of interviews were obtained with each
particular educator group in England to allow robust comparisons to be made between them.
Aggregated data were weighted by educator group within each individual country to reflect
the population of science educators within the UK. The overall unweighted and weighted
profiles by country are shown in Table D-44 and Table D-45 of this report.

D-2
D.7 The strength of weighting in aggregated data (i.e. at UK, England or Non England level) was
much greater than is normally considered acceptable. As shown by Table D-44 and Table D-
45, the effective sample size2 was much reduced compared with the actual sample size, which
reduces our ability to make robust comparisons. Given this, discussion of aggregated data has
been avoided throughout the report as much as possible.
D.8 A full technical summary is included in section at the end of this annex. A guide to the
confidence intervals relating to the survey data and the magnitude of the differences in survey
findings required for them to be statistically significant are given in Table D-46 and Table D-
47.
Notes on reading this annex
D.9 The following points explain the way in which the results have been commented upon in this
report.
all survey findings reported on are based on weighted data
all of the differences which have been commented upon within this annex are
statistically significant
the significance tests which have been used are two-tailed and are based on the 95%
confidence level. This means that we are 95% certain of detecting a difference where
one exists in the population
in this annex we have not commented on findings based on sub-groups of less than 30
as we feel these data are not sufficiently reliable
throughout this annex ‘*’ indicates a proportion of less than 0.5% but greater than 0.
‘-’ indicates a 0 proportion
at some questions, respondents are able to give more than one answer, and because of
this in some instances proportions in charts and tables may add up to more than
100%.
D.10 The remainder of the this annex is set out under the following key headings:
perceptions and use of Science Learning Centres
current uptake of training and development
outcomes of training and development activity recently undertaken
attitudes to science training and development
barriers and enablers
attitudinal segmentation of teachers in England.
2 The effective sample size is the sample size once the strength of weighting, design effects etc have been taken
into account. If we say the effective sample size is x, this means that the data is as robust as if it had been obtained
using a simple random sample of x cases and confidence intervals etc should be calculated accordingly.

D-3
Perceptions and use of Science Learning Centres
Knowledge of science training providers
D.11 Before being asked any questions which mentioned Science Learning Centres, all educators
were asked (without prompting) to name any organisations which might provide an
appropriate course if they wanted to undertake some science specific training.
D.12 Table D-1 shows the responses given by educators in England. Key findings on awareness of
science training providers are that:
Science Learning Centres were the most mentioned providers amongst secondary
heads of science (39%) and science teachers (36%), and the joint highest mention
amongst FE/Sixth Form College heads of science and science teachers (34%
mentioned Science Learning Centres and the same proportion mentioned Exam
Boards). They were the second most mentioned organisation among technicians at
29%. However, mentions of Science Learning Centres were significantly lower
amongst primary school teachers (3%) and science co-ordinators (13%), compared
with secondary and FE educators
LEAs were the most commonly mentioned provider of science specific training
amongst primary school teachers (42%) and primary science co-ordinators (32%)
CLEAPSS was the top mention amongst technicians, being mentioned by more than
half (57%)
primary school teachers (36%) and science co-ordinators (33%) were least able to
think of an organisation that might provide science specific training.
Table D-1: Organisations that might provide science specific training
Base: All educators in England
Primary science co-ordinators
Primary teachers
Secondary heads of science
Secondary science teachers
FE/6th form science heads/ teachers
Techni-cians
Unweighted base 241 149 161 208 163 180
Weighted base 84 858 16 135 15 54
Effective base 241 149 161 208 163 180
LEA 32% 42% 28% 23% 5% 9%
SLC 13% 3% 39% 36% 34% 29%
ASE 12% 9% 15% 15% 7% 17%
Universities 9% 8% 11% 13% 19% 6%
Prof bodies 7% 5% 21% 17% 26% 6%
Private sector training providers
5% 10% 14% 12% 15% 8%
Charities 1% 1% 1% 1% 5% 2%

D-4
Base: All educators in England
Primary science co-ordinators
Primary teachers
Secondary heads of science
Secondary science teachers
FE/6th form science heads/ teachers
Techni-cians
Exam board 1% - 19% 20% 34% 1%
CLEAPSS 2% - 5% 5% 4% 57%
Don’t know 33% 36% 11% 15% 15% 14%
D.13 Levels of spontaneous awareness (i.e. awareness without prompting) of Science Learning
Centres have increased significantly amongst all groups with the exception of primary school
teachers since the initial survey. As shown by Figure D-1, the most notable increase was in
the proportion of technicians who mentioned Science Learning Centres, which increased from
7% at the initial survey to 29% at the 2010 survey.
Figure D-1: Organisations that might provide science specific training - % mentioning Science Learning Centre (without prompting)
Base: All educators in England
Unweighted base sizes: primary science co-ordinators (2006: 244, 2010: 241), primary school teachers (2006: 153, 2010: 149),
secondary heads of science (2006: 149, 2010: 161), secondary science teachers (2006: 226, 2010: 208), FE/6 th form science
heads/ teachers (2006: 173, 2010: 163), Technicians (2006: 179, 2010: 180)
Organisations that currently provide science specific training
D.14 All educators who were able to name one or more organisations that might provide science
specific training were then asked which organisation they got the majority of their science
learning provision from. The key trends (which mirrored those from the initial survey) were:
amongst primary school educators, LEAs were predominantly the main provider of
science specific training (mentioned as the main provider by 79% of primary school
teachers and 64% of science co-ordinators)
7%
3%
23%
14%
17%
7%
13%
3%
39%
36%
34%
29%
Primary science co-
ordinators
Primary teachers
Secondary heads of
science
Secondary science
teachers
FE/6th form science
heads/ teachers
Technicians
2006 2010
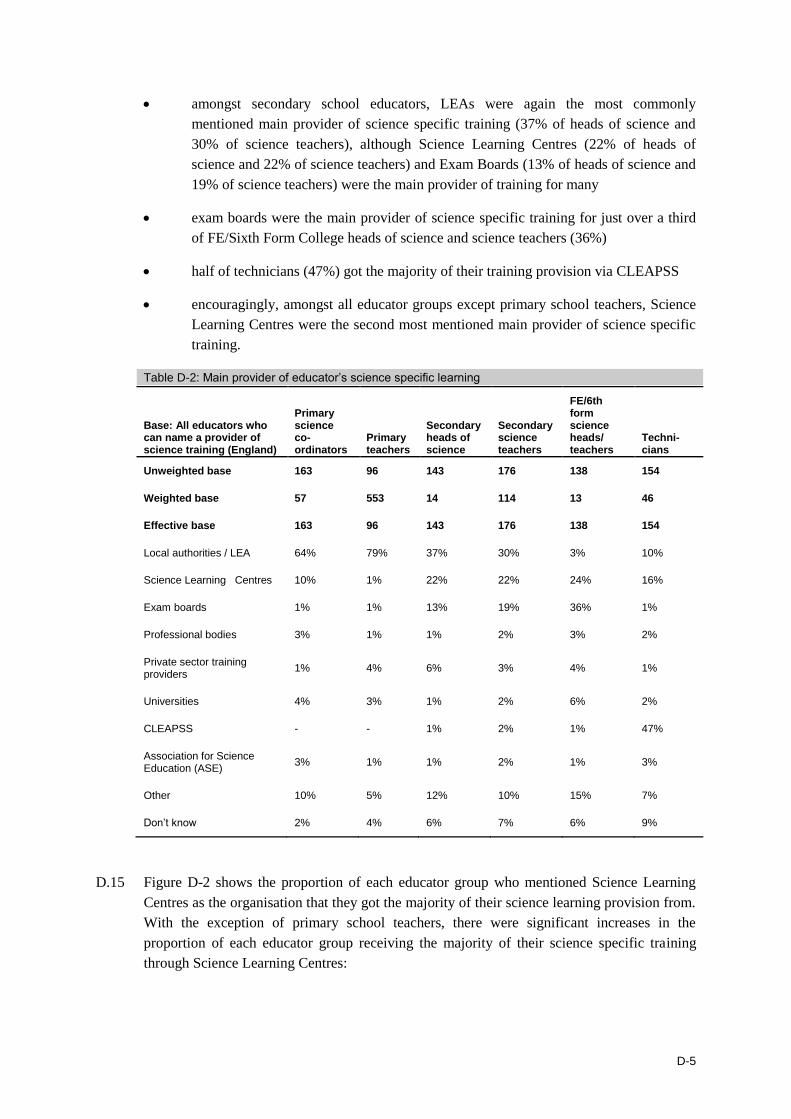
D-5
amongst secondary school educators, LEAs were again the most commonly
mentioned main provider of science specific training (37% of heads of science and
30% of science teachers), although Science Learning Centres (22% of heads of
science and 22% of science teachers) and Exam Boards (13% of heads of science and
19% of science teachers) were the main provider of training for many
exam boards were the main provider of science specific training for just over a third
of FE/Sixth Form College heads of science and science teachers (36%)
half of technicians (47%) got the majority of their training provision via CLEAPSS
encouragingly, amongst all educator groups except primary school teachers, Science
Learning Centres were the second most mentioned main provider of science specific
training.
Table D-2: Main provider of educator’s science specific learning
Base: All educators who can name a provider of science training (England)
Primary science co-ordinators
Primary teachers
Secondary heads of science
Secondary science teachers
FE/6th form science heads/ teachers
Techni-cians
Unweighted base 163 96 143 176 138 154
Weighted base 57 553 14 114 13 46
Effective base 163 96 143 176 138 154
Local authorities / LEA 64% 79% 37% 30% 3% 10%
Science Learning Centres 10% 1% 22% 22% 24% 16%
Exam boards 1% 1% 13% 19% 36% 1%
Professional bodies 3% 1% 1% 2% 3% 2%
Private sector training providers
1% 4% 6% 3% 4% 1%
Universities 4% 3% 1% 2% 6% 2%
CLEAPSS - - 1% 2% 1% 47%
Association for Science Education (ASE)
3% 1% 1% 2% 1% 3%
Other 10% 5% 12% 10% 15% 7%
Don’t know 2% 4% 6% 7% 6% 9%
D.15 Figure D-2 shows the proportion of each educator group who mentioned Science Learning
Centres as the organisation that they got the majority of their science learning provision from.
With the exception of primary school teachers, there were significant increases in the
proportion of each educator group receiving the majority of their science specific training
through Science Learning Centres:

D-6
the proportion of primary school science co-ordinators for whom Science Learning
Centres were their main provider increased from 2% at the initial survey to one in ten
(10%)
three times as many technicians and secondary science teachers said that Science
Learning Centres were their main provider compared with the initial survey (16%
compared with 5% amongst technicians and 22% compared with 7% amongst
secondary science teachers) whilst amongst FE/Sixth Form College heads of science
and science teachers the proportion rose fourfold (from 6% to 24%)
most notably, the proportion of secondary Heads of Science giving Science Learning
Centres as their main provider increased from just 3% at the initial survey to 22%.
Figure D-2: Main provider of educator’s science specific learning - % mentioning Science Learning Centre
Base: All educators in England
Unweighted base sizes: primary science co-ordinators (2006: 244, 2010: 241), primary school teachers (2006: 153, 2010: 149), secondary heads of science (2006: 149, 2010: 161), secondary science teachers (2006: 226, 2010: 208), FE/6 th form science
heads/ teachers (2006: 173, 2010: 163), Technicians (2006: 179, 2010: 180)
D.16 In conjunction with this, LEAs were less likely to be mentioned as the main provider of
science specific learning by the following educator groups:
primary school science co-ordinators (64% compared with 77% at the initial survey)
secondary school heads of science (37% compared with 50% at the initial survey).
Total Awareness of Science Learning Centres
D.17 All educators who had not spontaneously mentioned Science Learning Centres were
subsequently asked whether they had heard of Science Learning Centres. Figure D-3 shows
all educators in England who answered “yes” when prompted, combined with those who had
2%
0
3%
7%
6%
5%
10%
1%
22%
22%
24%
16%
Primary science co-
ordinators
Primary teachers
Secondary heads of
science
Secondary science
teachers
FE/6th form science
heads/ teachers
Technicians
2006 2010

D-7
spontaneously mentioned Science Learning Centres, giving a measure of total awareness,
which is compared against the initial survey.
Figure D-3: Total awareness of Science Learning Centres
Base: All educators in England:
Unweighted base sizes: primary science co-ordinators (2006: 244, 2010: 241), primary school teachers (2006: 153, 2010: 149), secondary heads of science (2006: 149, 2010: 161), secondary science teachers (2006: 226, 2010: 208), FE/6 th form science
heads/ teachers (2006: 173, 2010: 163), Technicians (2006: 179, 2010: 180)
D.18 As shown by the chart, levels of awareness have increased significantly since the initial
survey amongst all educator types with the exception of primary school teachers. This is not
necessarily surprising, however, given that they are the only educator group who are not
science specialists.
D.19 In conjunction with the increases in levels of spontaneous awareness discussed previously, the
biggest increase in total awareness was seen amongst technicians (from 61% to 85%),
meaning that 85% or more of all the secondary and FE educator groups had heard of Science
Learning Centres. Secondary school science heads were the group most likely to have heard
of them, with 96% aware (up from 90% at the initial survey).
D.20 Awareness remained significantly lower amongst primary science co-ordinators (61%) than
among the secondary and FE science educators, in spite of a substantial increase since 2006.
D.21 All educators who had heard of Science Learning Centres were asked a follow-up question to
ascertain how they had heard about them. As shown by Table D-3, the main source of
awareness came from Science Learning Centre literature (mentioned by between a quarter
and a half of educator groups) with secondary school heads of science most likely to have
become aware through this route (47%), closely followed by technicians (43%). FE/Sixth
Form College heads of science and science teachers were least likely to have heard of Science
Learning Centres through their literature (24%). In addition:
48%
29%
90%
73%
80%
61%
61%
32%
96%
85%
90%
85%
Primary science co-
ordinators
Primary teachers
Secondary heads of
science
Secondary science
teachers
FE/6th form science
heads/ teachers
Technicians
2006 2010

D-8
primary school science co-ordinators were more likely to have heard of Science
Learning Centre through a magazine/publication than all other educator groups (14%
compared with 5% or less)
FE/Sixth Form College educators were most likely to have been made aware by
teachers at their establishment who had attended a Science Learning Centre.
Table D-3: Source of awareness of Science Learning Centres (Top 5 mentions)
Base: All educators who have heard of Science Learning Centres (England)
Primary science co-ordinators
Primary teachers
Secondary heads of science
Secondary science teachers
FE/6th form science heads/ teachers
Techni-cians
Unweighted base 241 149 161 208 163 180
Weighted base 84 858 16 135 15 54
Effective base 241 149 161 208 163 180
Literature from the Science Learning Centres
36% 35% 47% 34% 24% 43%
Email/ internet 8% 17% 12% 9% 13% 7%
Letters/flyers (unspecific) 9% 4% 10% 6% 5% 9%
From teachers at my school who have attended Science Learning Centre provision
2% 6% 6% 8% 12% 8%
From a magazine/ publication
14% 4% 3% 5% 1% 3%
D.22 A number of interesting trends emerge when compared with the sources of awareness given at
the initial survey. In particular:
email/ internet has increased as a source of awareness amongst a number of the
educator groups. This was particularly the case amongst primary school teachers
(17% compared with 4% at the initial survey), FE/Sixth Form College educators
(13% compared with 3%) and secondary heads of science (12% compared with 4%)
there has been a marked decrease in the proportion of FE/Sixth Form College
educators who found out about Science Learning Centres via SLC literature (from
46% at the initial survey to 24%)
the proportion of educators who heard about Science Learning Centres from a
magazine/ publication has also declined amongst secondary school heads of science
(from 18% at the initial survey to 3%), secondary school science teachers (from 10%
to 5%) and FE/Sixth Form College heads of science and science teachers (from 7% to
1%).

D-9
Contact with Science Learning Centres
D.23 All educators who had heard of Science Learning Centres were asked whether they had had
done any of the following:
looked at or used the Science Learning Centre web portal
attended courses organised by a Science Learning Centre
attended other activities or events organised by a Science Learning Centre.
D.24 Responses have been re-percentaged on all educators in England (and not just those aware of
Science Learning Centres) and Table D-4 shows the proportions of each educator type who
have had each type of contact.
D.25 About half of secondary science teachers (48%) and just over half of secondary heads of
science and science heads/teachers in FE/Sixth Form Colleges (53% and 55% respectively)
reported that they had attended courses organised by a Science Learning Centre, as had two
fifths (42%) of technicians. Attendance among primary educators was much lower, as only
17% of science co-ordinators and 5% of primary teachers had done so.
D.26 When participation at other kinds of Science Learning Centre event is taken into account, half
of secondary science teachers (52%), three fifths of secondary heads of science and science
heads/teachers in FE/Sixth Form Colleges (60% in each case) and two fifths of technicians
(44%) have attended some kind of Science Learning Centre course or event, as have one fifth
of primary science co-ordinators (19%) and one in twenty primary teachers (5%).
Figure D-4: Changes in the proportions who have attended any Science Learning Centre course or other activity
Base: All educators in England:
Unweighted base sizes: primary science co-ordinators (2006: 244, 2010: 241), primary school teachers (2006: 153, 2010: 149),
secondary heads of science (2006: 149, 2010: 161), secondary science teachers (2006: 226, 2010: 208), FE/6th form science heads/ teachers (2006: 173, 2010: 163), Technicians (2006: 179, 2010: 180)
9%
2%
32%
24%
31%
21%
19%
5%
60%
52%
60%
44%
Primary science co-
ordinators
Primary teachers
Secondary heads of
science
Secondary science
teachers
FE/6th form science
heads/ teachers
Technicians
2006 2010

D-10
D.27 Use of the Science Learning Centre web portal is widespread among secondary and FE
educators: about half of secondary educators have used it (51% of secondary science teachers,
53% of secondary heads of science), as have three fifths of science heads/teachers in FE/Sixth
Form Colleges (58%) and two fifths of technicians (44%). One fifth of primary science co-
ordinators (20%) and one in ten primary teachers (9%) also reported that they had used it.
Table D-4: Contact with Science Learning Centres
Base: All educators in England
Primary science co-ordinators
Primary teachers
Secondary heads of science
Secondary science teachers
FE/6th form science heads/ teachers
Techni-cians
Unweighted base 241 149 161 208 163 180
Weighted base 84 858 16 135 15 54
Effective base 241 149 161 208 163 180
Looked at or used the SLC web portal 20% 9% 53% 51% 58% 44%
Attended courses organised by an SLC 17% 5% 53% 48% 55% 42%
Attended other activities organised by SLCs 8% 0% 35% 26% 31% 21%
Attended any SLC course or event 19% 5% 60% 52% 60% 44%
D.28 In England, the proportions who have visited the Science Learning Centre web portal have
increased significantly amongst all educator groups since the initial survey (Figure D-5).
Among several groups the percentage who have visited the web portal has roughly doubled.
The exceptions are:
science Heads and teachers in FE/Sixth Form Colleges, who started from a high
baseline of 43% at the initial survey and have increased to 58% at the 2010 survey
primary school teachers, who have increased from a very low baseline figure of 1% at
the initial survey, to one in ten (9%) at the 2010 survey.
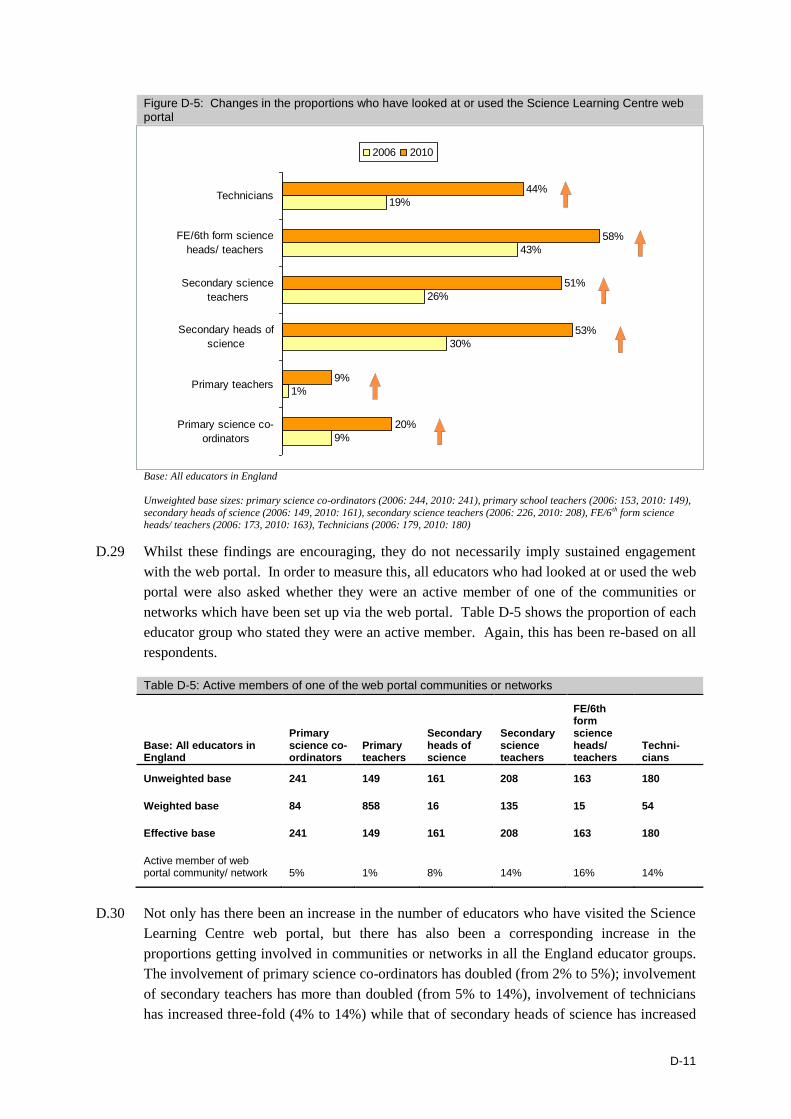
D-11
Figure D-5: Changes in the proportions who have looked at or used the Science Learning Centre web portal
Base: All educators in England
Unweighted base sizes: primary science co-ordinators (2006: 244, 2010: 241), primary school teachers (2006: 153, 2010: 149),
secondary heads of science (2006: 149, 2010: 161), secondary science teachers (2006: 226, 2010: 208), FE/6 th form science heads/ teachers (2006: 173, 2010: 163), Technicians (2006: 179, 2010: 180)
D.29 Whilst these findings are encouraging, they do not necessarily imply sustained engagement
with the web portal. In order to measure this, all educators who had looked at or used the web
portal were also asked whether they were an active member of one of the communities or
networks which have been set up via the web portal. Table D-5 shows the proportion of each
educator group who stated they were an active member. Again, this has been re-based on all
respondents.
Table D-5: Active members of one of the web portal communities or networks
Base: All educators in England
Primary science co-ordinators
Primary teachers
Secondary heads of science
Secondary science teachers
FE/6th form science heads/ teachers
Techni-cians
Unweighted base 241 149 161 208 163 180
Weighted base 84 858 16 135 15 54
Effective base 241 149 161 208 163 180
Active member of web portal community/ network 5% 1% 8% 14% 16% 14%
D.30 Not only has there been an increase in the number of educators who have visited the Science
Learning Centre web portal, but there has also been a corresponding increase in the
proportions getting involved in communities or networks in all the England educator groups.
The involvement of primary science co-ordinators has doubled (from 2% to 5%); involvement
of secondary teachers has more than doubled (from 5% to 14%), involvement of technicians
has increased three-fold (4% to 14%) while that of secondary heads of science has increased
9%
1%
30%
26%
43%
19%
20%
9%
53%
51%
58%
44%
Primary science co-
ordinators
Primary teachers
Secondary heads of
science
Secondary science
teachers
FE/6th form science
heads/ teachers
Technicians
2006 2010

D-12
four-fold (2% to 8%). There has been a less dramatic increase in the involvement of FE heads
of science and teachers (from 12% to 16%), but this was from the highest baseline measure.
D.31 In addition to the rise in visits to the web portal, there have also been significant increases in
the proportion of educators in England who have attended a Science Learning Centre course
or other organised activity. As shown by Figure D-4, attendance at Science Learning Centre
courses and events has doubled amongst all educator groups compared with the initial survey.
Number of Science Learning Centre courses and events attended
D.32 All educators who had attended either a course or another activity organised by a Science
Learning Centre were asked about their attendance during the previous two academic years.
Table D-6, Table D-7 and Table D-8 show the mean number of courses and events attended
during the 2007/summer 2008 and 2008/summer 2009 academic years as well as the mean
number of days spent in attendance. The mean scores include those who answered zero (for
example, if educators had not attended a course or event during a particular year).
D.33 Amongst those who had ever attended a Science Learning Centre course, the mean number of
courses attended was 0.9 in 2007/08 and 1.0 in 2008/09. This was comparable to the initial
survey which found that educators had attended an average of 1.9 Science Learning Centre
courses across the two academic years 2007/09.
Table D-6: Number of Science Learning Centres courses attended
Base: All who have attended a SLC course (England) 2006 2010
Unweighted base 178 398
Weighted base N/A 158
Effective base N/A 87
Mean number of SLC courses attended during 2008/09 - 1.0
Mean number of SLC courses attended during 2007/08 - 0.9
Total mean number of SLC courses attended during 2007/09 - 1.9
Mean number of SLC courses attended during 2005/06 1.5 -
Mean number of SLC courses attended during 2004/05 0.4 -
Total mean number of SLC courses attended during 2004/06 1.9 -
D.34 Findings between the two surveys were broadly similar for the number of Science Learning
Centre events attended during the previous two academic years. As shown by Table D-7, an
average of 2.4 events had been attended during 2007/09 (amongst those who had ever
attended a Science Learning Centre event), compared to 2.6 events during 2004/06.

D-13
Table D-7: Number of Science Learning Centre events attended
Base: All who have attended a SLC event (England) 2006 2010
Unweighted base 112 218
Weighted base N/A 63
Effective base N/A 136
Mean number of SLC events attended during 2008/09 - 1.3
Mean number of SLC events attended during 2007/08 - 1.1
Total mean number of SLC events attended during 2007/09 - 2.4
Mean number of SLC events attended during 2005/06 1.6 -
Mean number of SLC events attended during 2004/05 1.0 -
Total mean number of SLC events attended during 2004/06 2.6 -
D.35 Table D-8 shows the mean number of days spent attending Science Learning Centre courses
and events (amongst those who have ever attended one) during the previous two academic
years. An average of 1.5 days were spent at Science Learning Centre courses or events
during 2008/09 and an average of 0.9 days during 2007/08. This compared with 1.6 days in
2005/06 and just 0.3 in 2004/05.
Table D-8: Number of days spent attending Science Learning Centre courses and events
Base: All who have attended a SLC course or event (England) 2006 2010
Unweighted base 218 435
Weighted base N/A 169
Effective base N/A 98
Mean number of days spent during 2008/09 - 1.5
Mean number of days spent during 2007/08 - 0.9
Total mean number of days spent during 2007/09 - 2.4
Mean number of days spent during 2005/06 1.6 -
Mean number of days spent during 2004/05 0.3 -
Total mean number of days spent during 2004/06 1.9 -
Satisfaction with aspects of Science Learning Centre courses and events
D.36 All educators who had attended a Science Learning Centre course, activity or event were
asked how satisfied they were with the following specific aspects of the provision:
the range of courses available and other provision available via the Science Learning
Centre
the availability of this provision in terms of the timing of sessions and location of
provision
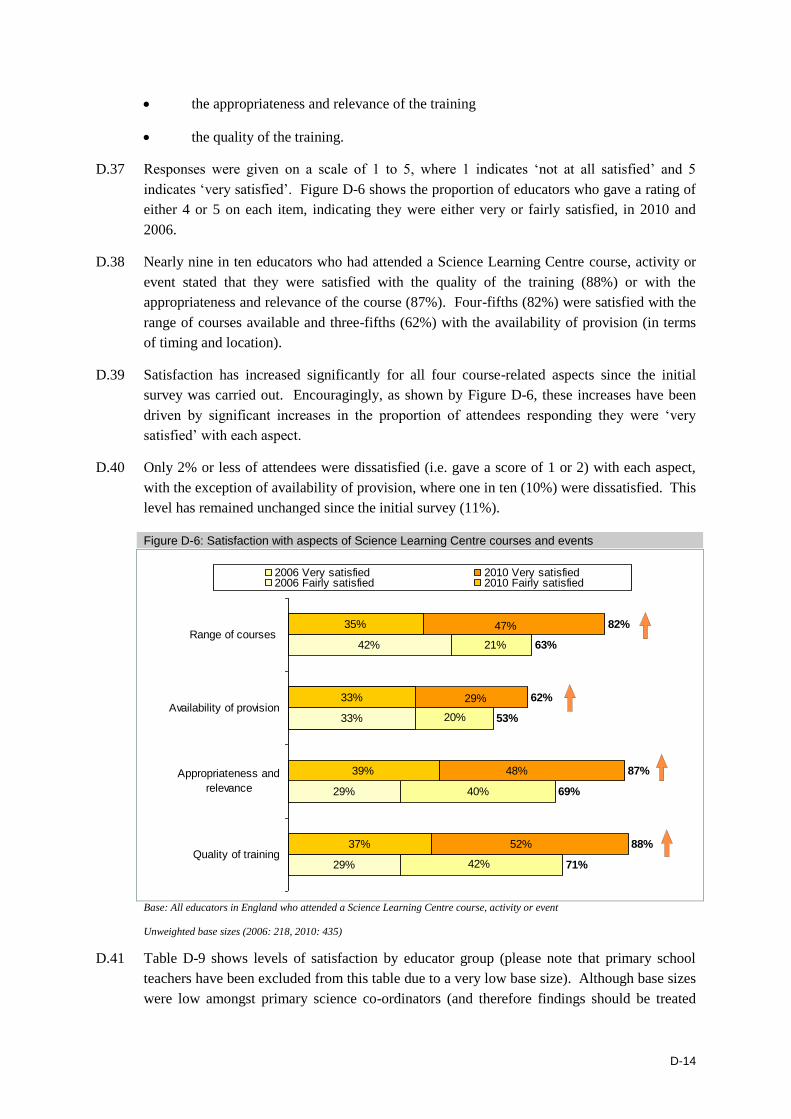
D-14
the appropriateness and relevance of the training
the quality of the training.
D.37 Responses were given on a scale of 1 to 5, where 1 indicates ‘not at all satisfied’ and 5
indicates ‘very satisfied’. Figure D-6 shows the proportion of educators who gave a rating of
either 4 or 5 on each item, indicating they were either very or fairly satisfied, in 2010 and
2006.
D.38 Nearly nine in ten educators who had attended a Science Learning Centre course, activity or
event stated that they were satisfied with the quality of the training (88%) or with the
appropriateness and relevance of the course (87%). Four-fifths (82%) were satisfied with the
range of courses available and three-fifths (62%) with the availability of provision (in terms
of timing and location).
D.39 Satisfaction has increased significantly for all four course-related aspects since the initial
survey was carried out. Encouragingly, as shown by Figure D-6, these increases have been
driven by significant increases in the proportion of attendees responding they were ‘very
satisfied’ with each aspect.
D.40 Only 2% or less of attendees were dissatisfied (i.e. gave a score of 1 or 2) with each aspect,
with the exception of availability of provision, where one in ten (10%) were dissatisfied. This
level has remained unchanged since the initial survey (11%).
Figure D-6: Satisfaction with aspects of Science Learning Centre courses and events
Base: All educators in England who attended a Science Learning Centre course, activity or event
Unweighted base sizes (2006: 218, 2010: 435)
D.41 Table D-9 shows levels of satisfaction by educator group (please note that primary school
teachers have been excluded from this table due to a very low base size). Although base sizes
were low amongst primary science co-ordinators (and therefore findings should be treated
87%
71%
69%
53%
63%
88%
62%
82%
29%
29%
33%
42%
37%
39%
33%
35%
Quality of training
Appropriateness and
relevance
Availability of provision
Range of courses
2006 Very satisfied 2010 Very satisfied2006 Fairly satisfied 2010 Fairly satisfied
47%
21%
29%
20%
48%
40%
52%
42%
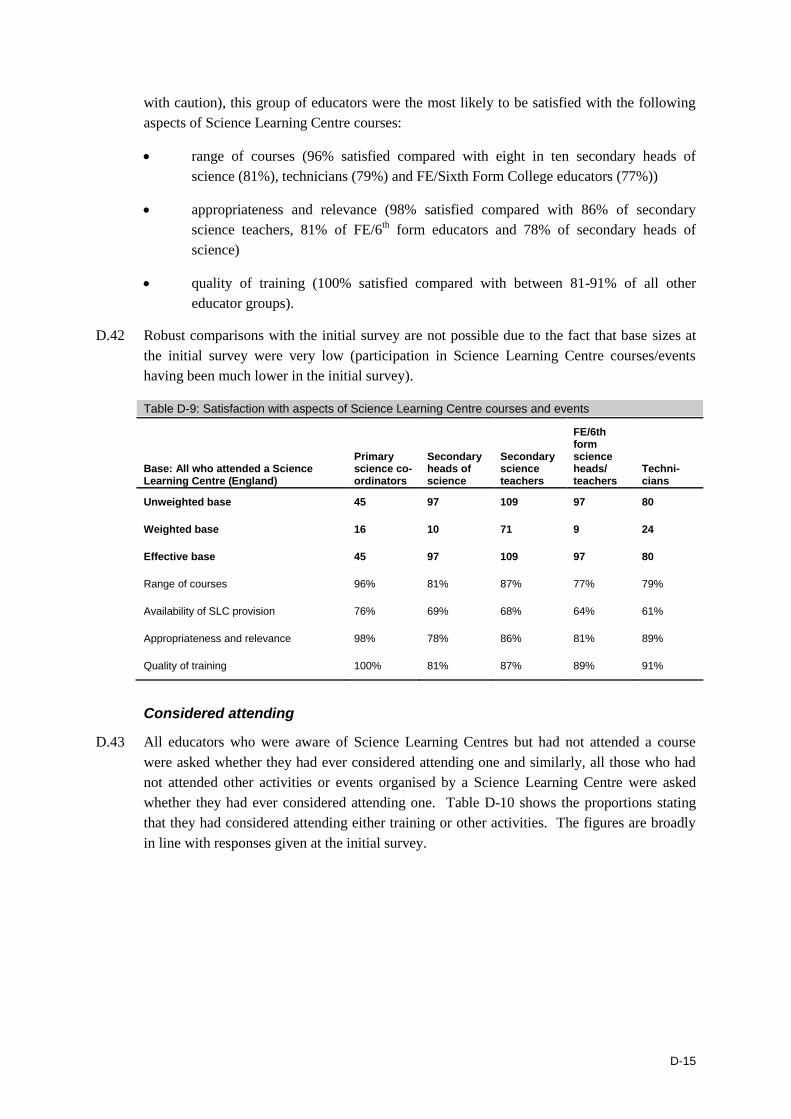
D-15
with caution), this group of educators were the most likely to be satisfied with the following
aspects of Science Learning Centre courses:
range of courses (96% satisfied compared with eight in ten secondary heads of
science (81%), technicians (79%) and FE/Sixth Form College educators (77%))
appropriateness and relevance (98% satisfied compared with 86% of secondary
science teachers, 81% of FE/6th form educators and 78% of secondary heads of
science)
quality of training (100% satisfied compared with between 81-91% of all other
educator groups).
D.42 Robust comparisons with the initial survey are not possible due to the fact that base sizes at
the initial survey were very low (participation in Science Learning Centre courses/events
having been much lower in the initial survey).
Table D-9: Satisfaction with aspects of Science Learning Centre courses and events
Base: All who attended a Science Learning Centre (England)
Primary science co-ordinators
Secondary heads of science
Secondary science teachers
FE/6th form science heads/ teachers
Techni-cians
Unweighted base 45 97 109 97 80
Weighted base 16 10 71 9 24
Effective base 45 97 109 97 80
Range of courses 96% 81% 87% 77% 79%
Availability of SLC provision 76% 69% 68% 64% 61%
Appropriateness and relevance 98% 78% 86% 81% 89%
Quality of training 100% 81% 87% 89% 91%
Considered attending
D.43 All educators who were aware of Science Learning Centres but had not attended a course
were asked whether they had ever considered attending one and similarly, all those who had
not attended other activities or events organised by a Science Learning Centre were asked
whether they had ever considered attending one. Table D-10 shows the proportions stating
that they had considered attending either training or other activities. The figures are broadly
in line with responses given at the initial survey.
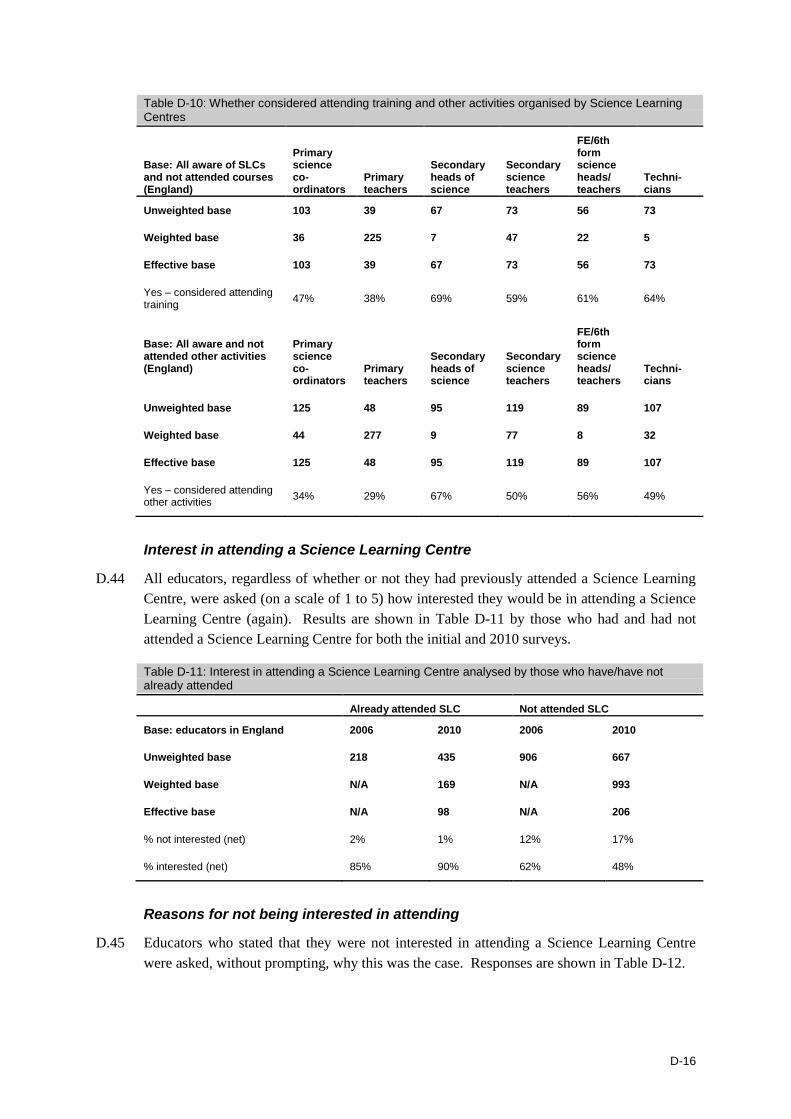
D-16
Table D-10: Whether considered attending training and other activities organised by Science Learning Centres
Base: All aware of SLCs and not attended courses (England)
Primary science co-ordinators
Primary teachers
Secondary heads of science
Secondary science teachers
FE/6th form science heads/ teachers
Techni-cians
Unweighted base 103 39 67 73 56 73
Weighted base 36 225 7 47 22 5
Effective base 103 39 67 73 56 73
Yes – considered attending training
47% 38% 69% 59% 61% 64%
Base: All aware and not attended other activities (England)
Primary science co-ordinators
Primary teachers
Secondary heads of science
Secondary science teachers
FE/6th form science heads/ teachers
Techni-cians
Unweighted base 125 48 95 119 89 107
Weighted base 44 277 9 77 8 32
Effective base 125 48 95 119 89 107
Yes – considered attending other activities
34% 29% 67% 50% 56% 49%
Interest in attending a Science Learning Centre
D.44 All educators, regardless of whether or not they had previously attended a Science Learning
Centre, were asked (on a scale of 1 to 5) how interested they would be in attending a Science
Learning Centre (again). Results are shown in Table D-11 by those who had and had not
attended a Science Learning Centre for both the initial and 2010 surveys.
Table D-11: Interest in attending a Science Learning Centre analysed by those who have/have not already attended
Already attended SLC Not attended SLC
Base: educators in England 2006 2010 2006 2010
Unweighted base 218 435 906 667
Weighted base N/A 169 N/A 993
Effective base N/A 98 N/A 206
% not interested (net) 2% 1% 12% 17%
% interested (net) 85% 90% 62% 48%
Reasons for not being interested in attending
D.45 Educators who stated that they were not interested in attending a Science Learning Centre
were asked, without prompting, why this was the case. Responses are shown in Table D-12.

D-17
D.46 A third of those not interested in attending a Science Learning Centre (33%) stated that this
was because training was not needed, whilst a quarter (25%) felt that it was too far away to
attend. Other reasons mentioned included time constraints (mentioned by 21% of those not
interested in attending) and the fact that it was not a priority (21%).
Table D-12: Reasons for not being interested in attending a Science Learning Centre
Base: All not interested in attending SLC (England) Total
Unweighted base 80
Weighted base 172
Effective base 33
Not needed 33%
Location/distance/too far away 25%
Time constraints 21%
Not a priority 21%
Expense/cost 14%
Sufficient training already available 13%
Content is not relevant/specific enough 8%
Need more information *
Comparisons with the rest of the UK
D.47 It is important to note that the sample design and weighting profiles employed by the initial
and 2010 surveys mean that the effective base sizes for all England educators (aggregated)
and for the rest of the UK (aggregated) are considerably smaller than the unweighted sample
sizes, such that differences have to be of considerable magnitude for us to be confident that
they are real.
D.48 We found that on all the topics covered in this section of the report, where sample sizes
allowed us to make robust comparisons between educators in England and the rest of the UK,
findings seemed to be fairly consistent between the two – no significant differences were
identified.
Summary – perceptions and use of SLCs
three in ten or more of all secondary and FE educator groups were spontaneously
aware of Science Learning Centres as a provider of science-specific training, as were
13% of primary science co-ordinators, but only 3% of primary school teachers
after prompting, 85% or more of all secondary and FE educator groups were aware of
Science Learning Centres, as were three in five primary science co-ordinators and a
third of primary school teachers
just over a fifth of secondary educators mentioned Science Learning Centres as their
main provider of science-specific learning, as did a similar proportion of science
D-18
heads/teachers in FE/Sixth Form Colleges. About one sixth of technicians and one in
ten primary science co-ordinators said SLCs were their main providers. Just 1% of
primary teachers said the same
nearly half of secondary science teachers and just over half of secondary heads of
science and science heads/teachers in FE/Sixth Form Colleges reported that they had
attended courses organised by an SLC, as had two fifths of technicians. Attendance
among primary educators was much lower, as only 17% of science co-ordinators and
5% of primary teachers had done so
when participation at other kinds of SLC event was taken into account, half of
secondary science teachers, three fifths of secondary heads of science and science
heads/teachers in FE/Sixth Form Colleges and two fifths of technicians had attended
some kind of SLC course or event, as had one fifth of primary science co-ordinators
and 5% of primary teachers
use of the SLC web portal was widespread among secondary and FE educators: about
half of secondary educators have used it as have three fifths of science heads/teachers
in FE/Sixth Form Colleges and two fifths of technicians. One fifth of primary science
co-ordinators and one in ten primary teachers also reported that they had used it
active membership of web portal communities or networks was particularly strong
among secondary science teachers (14%), science heads/teachers in FE/Sixth Form
Colleges (16%) and technicians (14%). Eight per cent of secondary science teachers
and 5% of primary science co-ordinators also reported that they were active members
of a community or network. Only 1% of primary teachers did so
the average number of SLC courses and events attended per individual who has
attended any has remained stable since the initial survey with a mean of 1.0 course
and 1.3 other events reported in 2008/9
the average number of days spent attending SLC courses and events per individual
who has attended any also seems to have remained stable since the initial survey, with
a mean of 1.5 days reported as spent during 2008/9
nearly nine in ten educators who had attended an SLC course, activity or event were
satisfied with the quality of the training and with the appropriateness and relevance of
the course. Four-fifths were satisfied with the range of courses available and three-
fifths were satisfied with the availability of provision in terms of timing and location
primary science co-ordinators tended to express the highest levels of satisfaction with
these aspects of SLC courses and events
when those who had heard of SLCs and who had not attended any courses were asked
whether they had considered doing so, three-fifths or more of those in secondary
schools and FE/Sixth Form colleges said they had, as did half of primary science co-
ordinators and two fifths of primary teachers
about half of those who had not attended said they were interested in doing so
D-19
among those who had already attended a Science Learning Centre course or event,
nine out of ten were interested in attending one again
the main reason given by respondents for not being interested in attending a Science
Learning Centre was that they did not think they needed to do so, but other reasons
given included distance/too far away, time constraints and competing priorities
a number of positive changes have been identified since the initial survey. Indeed, on
the topics covered in this chapter, where changes have been identified at all they have
generally been in a positive direction:
levels of both spontaneous and prompted awareness of Science Learning
Centres have risen significantly since the 2006 study among all educator
groups except primary school teachers
Science Learning Centres are now considerably more likely to be mentioned
as the main provider of science-specific training by all educator groups
except primary school teachers
there have been substantial increases in the proportions of all educator groups
reporting that they have taken part in Science Learning Centre courses or
other activities – generally speaking these have doubled
there are also substantial increases in the proportions of all educator groups
who are active members of web communities or networks – membership of
these has doubled or more than doubled among most educator groups
satisfaction with SLC courses and events among attenders has increased
significantly since the initial survey
however, one less positive change is that those who had not attended an SLC
course/event in the 2010 were less likely to be interested in attending one in
the future, compared with the equivalent group in the 2006 survey
on the topics covered in this chapter we identified no significant differences between
science educators in England and their counterparts in the rest of the UK.
Current uptake of training and development
CPD infrastructure
Discussion of training needs
D.49 All educators were asked whether they discuss their training needs with their manager or
another senior member of staff. Around nine in ten of most educator groups in England
discussed their training needs, which represented no significant change from the initial
survey. The one exception was science technicians, who were less likely to discuss their
training needs than teaching staff: three-quarters (76%) of technicians did this, representing a

D-20
significant increase since the initial survey which found that just two-thirds (67%) of
technicians discussed their training needs.
Table D-13: Whether discuss training needs with manager or senior member of staff
Base: All educators in England
Primary science co-ordinators
Primary teachers
Secondary heads of science
Secondary science teachers
FE/6th form science heads/ teachers
Techni-cians
Unweighted base 241 149 161 208 163 180
Weighted base 84 858 16 135 15 54
Effective base 241 149 161 208 163 180
Yes 89% 89% 88% 87% 92% 76%
No 9% 11% 8% 5% 4% 14%
Sometimes 2% 1% 4% 8% 4% 11%
Personal training and development plan
D.50 Similarly, when asked whether they had a personal training and development plan,
technicians were once again less likely than other educators to respond that they had (Table
D-14). However, whilst the proportions of teaching staff with a personal training and
development plan remained consistent with the initial survey, this figure has increased
amongst technicians from around a third (36%) at the initial survey to half (51%) at the 2010
survey.
Table D-14: Whether have a personal training and development plan
Base: All educators in England
Primary science co-ordinators
Primary teachers
Secondary heads of science
Secondary science teachers
FE/6th form science heads/ teachers
Techni-cians
Unweighted base 241 149 161 208 163 180
Weighted base 84 858 16 135 15 54
Effective base 241 149 161 208 163 180
Yes 76% 76% 62% 65% 74% 51%
No 22% 23% 35% 35% 25% 48%
Don’t know 2% 1% 2% * 1% 2%
D.51 All educators who responded that they did have a personal training and development plan
were asked a follow-up question to ascertain how often their plan is reviewed. As shown by
Table D-15 , the majority of training plans were reviewed on an annual basis, although
between one in five and three in ten teaching staff (i.e. excluding technicians) had their
training plan reviewed more frequently. Technicians were more likely than teaching staff to
receive annual reviews of their training plans (86% received an annual review whilst 10%
received one at least every term).

D-21
Table D-15: How often training plan is reviewed
Base: All educators in England who have a personal training and development plan
Primary science co-ordinators
Primary teachers
Secondary heads of science
Secondary science teachers
FE/6th form science heads/ teachers
Techni-cians
Unweighted base 183 113 100 135 120 91
Weighted base 64 651 10 87 11 27
Effective base 183 113 100 135 120 91
More than once a term 2% 5% 1% 8% 3% 2%
At least every term 28% 26% 20% 21% 23% 8%
At least annually 68% 67% 78% 69% 69% 86%
Less than annually 2% 1% 0% 1% 1% 1%
Never / not reviewed 0% 0% 1% 1% 3% 1%
Discussion of training
D.52 All educators were asked whether they discuss the training they have received with their
manager. There was a greater tendency amongst primary school educators to have discussed
the training they received with their manager (87% of primary science co-ordinators and 86%
of primary school teachers), whilst secondary heads of science were least likely to do so (18%
answered that they did not discuss this), possibly reflecting their position as departmental
heads. Encouragingly, technicians were significantly more likely to discuss their training
when compared with the initial survey (79% answered yes compared with 68%).
Table D-16: Whether discusses training received with manager
Base: All educators in England
Primary science co-ordinators
Primary teachers
Secondary heads of science
Secondary science teachers
FE/6th form science heads/ teachers
Techni-cians
Unweighted base 241 149 161 208 163 180
Weighted base 84 858 16 135 15 54
Effective base 241 149 161 208 163 180
Yes 87% 86% 70% 77% 81% 79%
No 6% 9% 18% 12% 10% 13%
Sometimes 6% 3% 12% 10% 9% 7%
Establishment policy on Continuing Professional Development (CPD)
D.53 All educators were asked whether their school or college has a policy on continuing
professional development (CPD). In this context, CPD is defined as an individually tailored
plan of training and other development activities, which supports educator performance and
contributes towards individual career development. Secondary school science teachers (94%)
and FE/Sixth Form College heads of science and science teachers (93%) were more likely
than other educator groups to respond that their school or college did have a policy on CPD.

D-22
Surprisingly (given that they were answering at establishment level), technicians (78%) and
secondary heads of science (85%) were less likely to state that their establishment had a
policy on CPD than either of these two educator groups. This was the case also amongst
technicians at the initial survey where it was considered that technicians may have been
excluded from such policies.
Table D-17: Whether establishment has a policy on CPD
Base: All educators in England
Primary science co-ordinators
Primary teachers
Secondary heads of science
Secondary science teachers
FE/6th form science heads/ teachers
Techni-cians
Unweighted base 241 149 161 208 163 180
Weighted base 84 858 16 135 15 54
Effective base 241 149 161 208 163 180
Yes
No
Don’t know
Sharing the learning
D.54 All educators were asked whether they routinely disseminate or share the learning from any
training or professional development activities with their colleagues when they return to
school. As shown by Table D-18 , routine dissemination was widely undertaken by around 9
in 10 of all educator groups. This was similar to the levels of dissemination found at the
initial survey with the exception of technicians, who were previously much less likely to share
their learning with colleagues (74% of technicians reported this in the initial survey compared
with 89% of technicians in the 2010 survey).
Table D-18: Whether routinely disseminate the learning from training to colleagues
Base: All educators in England
Primary science co-ordinators
Primary teachers
Secondary heads of science
Secondary science teachers
FE/6th form science heads/ teachers
Techni-cians
Unweighted base 241 149 161 208 163 180
Weighted base 84 858 16 135 15 54
Effective base 241 149 161 208 163 180
Yes 94% 93% 90% 91% 88% 89%
No 1% - 2% 3% 2% 5%
Sometimes 5% 7% 8% 5% 10% 4%
D.55 All those who routinely disseminated the learning from training to colleagues were asked
whether this done on a formal or informal basis, and also whether this was done verbally or in
writing. Similar to the initial survey, it was found that FE/Sixth Form College heads of
science and science teachers (28%) and, in particular, technicians (61%) only disseminated

D-23
learning from training to colleagues in an informal manner. In conjunction with this,
technicians were also more likely to feed back learning from training verbally only (as
opposed to in writing, or both verbally and in writing) than other educator groups (48% of
technicians fed back just verbally compared with 24% or less of other educator groups).
Table D-19: How learning from training is usually disseminated to colleagues
Base: All educators who disseminate learning
Primary science co-ordinators
Primary teachers
Secondary heads of science
Secondary science teachers
FE/6th form science heads/ teachers
Techni-cians
Unweighted base 227 138 145 190 143 161
Weighted base 79 795 14 123 13 48
Effective base 227 138 145 190 143 161
Formal or informal?
Just formally
Just informally
Both
Verbally or in writing?
Just verbally
Just in writing
Both
Training undertaken
D.56 Educators were asked about training they had undertaken in the previous academic year (2008
to summer 2009). This section provides an overview of the number of days spent on general
and science specific training in the previous academic year.
General CPD and science specific training
D.57 All educators were asked to think about all the training that they had undertaken in the
previous academic year (including any training within INSET days and also attendance at
conferences and other events associated with their personal development). Those who had
undertaken any training in the previous academic year were subsequently asked how many
days in total were spent on science specific training (again, including attendance at
conferences and other events associated with their personal development). Detailed responses
to these questions are included in the appendices to this report (Table D-48 and Table D-49).
D.58 Figure D-7 shows the mean number of days of general and science specific training
undertaken by each educator group, compared with the responses from the initial survey.
Similar to patterns observed at the initial survey, technicians had undertaken fewer days of
general training than teaching staff (4 days on average compared with around 6-7 days
amongst teaching staff). Amongst all non- primary educators, science specific training
accounted for around half the number of days spent on all training, whilst amongst primary
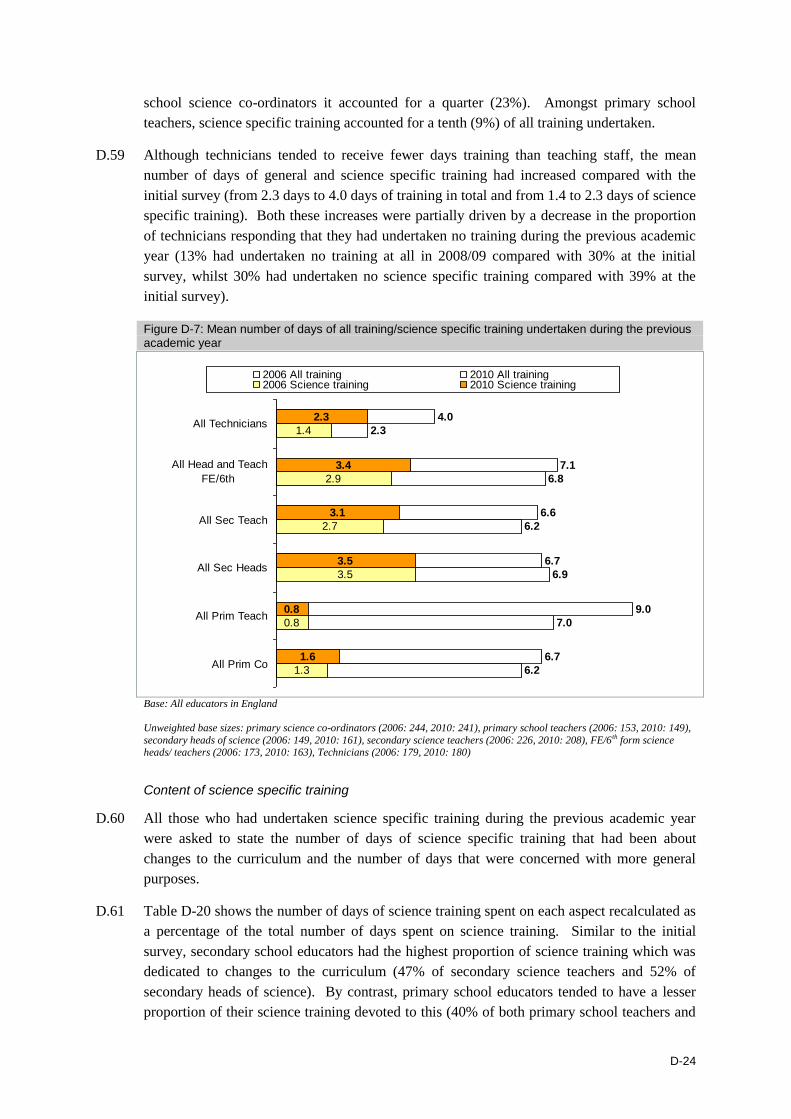
D-24
school science co-ordinators it accounted for a quarter (23%). Amongst primary school
teachers, science specific training accounted for a tenth (9%) of all training undertaken.
D.59 Although technicians tended to receive fewer days training than teaching staff, the mean
number of days of general and science specific training had increased compared with the
initial survey (from 2.3 days to 4.0 days of training in total and from 1.4 to 2.3 days of science
specific training). Both these increases were partially driven by a decrease in the proportion
of technicians responding that they had undertaken no training during the previous academic
year (13% had undertaken no training at all in 2008/09 compared with 30% at the initial
survey, whilst 30% had undertaken no science specific training compared with 39% at the
initial survey).
Figure D-7: Mean number of days of all training/science specific training undertaken during the previous academic year
Base: All educators in England
Unweighted base sizes: primary science co-ordinators (2006: 244, 2010: 241), primary school teachers (2006: 153, 2010: 149),
secondary heads of science (2006: 149, 2010: 161), secondary science teachers (2006: 226, 2010: 208), FE/6 th form science heads/ teachers (2006: 173, 2010: 163), Technicians (2006: 179, 2010: 180)
Content of science specific training
D.60 All those who had undertaken science specific training during the previous academic year
were asked to state the number of days of science specific training that had been about
changes to the curriculum and the number of days that were concerned with more general
purposes.
D.61 Table D-20 shows the number of days of science training spent on each aspect recalculated as
a percentage of the total number of days spent on science training. Similar to the initial
survey, secondary school educators had the highest proportion of science training which was
dedicated to changes to the curriculum (47% of secondary science teachers and 52% of
secondary heads of science). By contrast, primary school educators tended to have a lesser
proportion of their science training devoted to this (40% of both primary school teachers and
6.8
2.3
9.0
7.1
4.0
6.2
7.0
6.9
6.2
6.7
6.7
6.6
1.3
0.8
3.5
2.7
2.9
1.4
1.6
0.8
3.5
3.1
3.4
2.3
All Prim Co
All Prim Teach
All Sec Heads
All Sec Teach
All Head and Teach
FE/6th
All Technicians
2006 All training 2010 All training2006 Science training 2010 Science training
D-25
science co-ordinators). Given that science technicians do not have responsibility for the
actual delivery of the curriculum, it was unsurprising that only 14% of their training focussed
on changes to the curriculum.
D.62 Amongst FE/Sixth Form College heads of science and science teachers, the proportion of
science training which concerned changes to the curriculum had risen compared with the
initial survey, from 28% to 45%, which was more in line with other teaching staff (i.e.
excluding technicians).
Table D-20: Proportion of science training that concerns changes to curriculum v. more general science issues
Base: All who have undertaken science specific training in 2008/09 (England)
Primary science co-ordinators
Primary teachers
Secondary heads of science
Secondary science teachers
FE/6th form science heads/ teachers
Techni-cians
Unweighted base 143 68 140 177 140 120
Weighted base 50 392 14 114 13 36
Effective base 143 68 140 177 140 120
% of all science training received that concerns changes to the curriculum
40% 40% 52% 47% 45% 14%
% of all science training received that is more general
60% 60% 48% 53% 55% 86%
Trends in science specific training
D.63 All educators who had received science training in 2008/09 were asked whether this had been
more, the same or less than in the previous academic year. As shown by Table D-21,
responses were fairly consistent across all educator groups with between 18-25% stating it
was more than the previous year, 58-69% that it was about the same and between 9-17% that
it was less than the previous year.
Table D-21: Whether have had more or less science specific training in 2008/09 than in previous years
Base: All who have undertaken science specific training in 2008/09 (England)
Primary science co-ordinators
Primary teachers
Secondary heads of science
Secondary science teachers
FE/6th form science heads/ teachers
Techni-cians
Unweighted base 143 68 140 177 140 120
Weighted base 50 392 14 114 13 36
Effective base 143 68 140 177 140 120
More in 2008/09 than usual
20% 25% 22% 21% 18% 22%
About the same 60% 62% 63% 61% 69% 58%
Less in 2008/09 than usual
17% 12% 13% 13% 11% 9%
D-26
The quality of science specific training
D.64 Those who had undertaken science training in the previous academic year were also asked to
rate the quality of this training undertaken, using a five point scale ranging from “Always
good” through to “Always poor”. As shown by Table D-22, quality ratings were broadly
similar amongst all educator groups with around three-quarters responding that their training
was “Always good” or “Usually good”. The notable exception in satisfaction with science
training was amongst primary school science co-ordinators, with 9 out of 10 responding it
was “Always good” or “Usually good”. Encouragingly, only a handful of educators felt that
their science training had been poor, although between 16-26% of most educator groups (9%
of primary school science co-ordinators) felt it had been “somewhat mixed”.
Table D-22: Rating of quality of science specific training
Base: All who have undertaken science specific training in 2008/09 (England)
Primary science co-ordinators
Primary teachers
Secondary heads of science
Secondary science teachers
FE/6th form science heads/ teachers
Techni-cians
Unweighted base 143 68 140 177 140 120
Weighted base 50 392 14 114 13 36
Effective base 143 68 140 177 140 120
% GOOD (net) 90% 72% 74% 79% 76% 83%
Somewhat mixed 9% 26% 24% 21% 24% 16%
% POOR (net) 1% - 1% - 1% -
D.65 When compared with ratings of science training given at the initial survey, findings were
encouraging, with significant increases in the proportions giving a ‘good’ rating amongst the
following educator groups:
primary school science co-ordinators (from 82% to 90%)
secondary school science teachers (from 70% to 79%)
technicians (from 69% to 83%).
D.66 The only decline in the proportion giving a ‘good’ rating was amongst primary school
teachers (from 86% to 72%).
Comparisons with the rest of the UK
D.67 No differences were apparent between science educators in England and the rest of the UK
when asked about the provision for Continuing Professional Development (CPD) at their
establishment.
D.68 There were no differences either between educators in England and the rest of the UK in the
average number of days spent on all training in the previous academic year 2008/ summer
2009. However, the survey found that educators in the rest of the UK spent a greater number
of days on average engaged in science specific training in the previous academic year, 2007-
2008 (1.84 compared with 1.27). This difference was due to a smaller proportion of
D-27
educators in the rest of the UK not having undertaken any science specific training in the
previous academic year (27% compared with 42% of educators in England).
D.69 There were also differences between educators in England and the rest of the UK with respect
to the content of the science specific training undertaken. Amongst educators in England,
40% of their science training concerned changes to the curriculum, whilst amongst those in
the rest of the UK, the figure was 58%.
D.70 All educators who had undertaken any science specific training in the previous academic year
were asked to rate the quality of the training undertaken. Although the proportions of
educators in England and those in the rest of the UK who rated their science training as
‘good’ was similar (76% compared to 72%), differences were apparent between the
proportions answering “Always good” and “Usually good”. A third of educators in the rest of
the UK (35%) gave a rating of “Always good” compared with one in five educators in
England (18%).
Summary – current uptake of training and development
about nine in ten of all teacher groups and three-quarters of technicians in England
have discussed their training needs with a manager or senior member of staff
two-thirds to three-quarters of teacher groups and half of technicians in England had a
personal training and development plan
in the main these plans were reviewed annually (for two-thirds or more of each
educator group in England) though smaller proportions had more frequent reviews
between seven in ten and nine in ten of each educator group in England have
discussed the training they have received with their manager
from three-quarters up to nine in ten of each educator group believed their school has
a policy on CPD
about nine in ten of all educator groups in England routinely disseminated the
learning from training they had taken part in, and most educators did so both formally
and informally (except technicians, the majority of whom disseminated informally
only); most educators in England also disseminated the learning both verbally and in
writing
secondary science teachers and science heads and primary science co-ordinators
reported having just under seven days of training in total in the academic year 2008-
2009 while science heads/teachers of science in FE and Sixth Form Colleges had just
over seven days and primary teachers had nine days. Within this, the time devoted to
science specific training was about three and a half days for secondary science heads
and for science heads/teachers of science in FE and Sixth Form Colleges, just over
three days for secondary science teachers, about one and a half days for primary
science co-ordinators and just under one day for primary teachers. For technicians
the average number of science-specific days’ training reported was just over two

D-28
for technicians, only 14% of science specific training received related to curriculum
changes – the remainder was more general. For other educator groups it was reported
that two-fifths to half of all science training received related to changes in the
curriculum
about three-fifths of all educators in England reported that they had had similar
amounts of science-specific training in 2008/2009 to what they received in previous
years, around one fifth reported having had more and smaller proportions said they
had had less science-specific training
the quality of science specific training received was described as “usually” or “always
good” by three-quarters to nine in ten of each educator group
a number of significant and positive changes are evident for technicians. Compared
with the 2006 survey, in 2010 they were:
more likely to have discussed their training needs and to have a personal
training and development plan
more likely to have discussed the training received with their manager
more likely to routinely disseminate the learning from training to colleagues
more likely to describe the science-specific training undertaken as usually or
always good
in addition, the average numbers of days’ general and science-specific
training received by technicians increased.
other notable changes since the 2006 survey were that primary science co-ordinators
and secondary science teachers were more likely to rate the science-specific training
they had received as “good”, while primary teachers were less likely to do so
compared with science educators in the rest of the UK, the 2010 survey found that
science educators in England had reported a lower average number of days of
science-specific training in the academic year 2007-8 (1.27 in England compared
with 1.84 for the rest of the UK), and were less likely to describe the quality of the
science-specific training received as “always good”. No significant differences
between England and the rest of the UK were identified on the other topics covered in
this chapter.
Outcomes of training and development undertaken recently
D.71 This chapter discusses the outcomes of training undertaken in the previous academic year,
including science-related and more general outcomes.
D.72 All educators were asked to think specifically about any training and professional
development undertaken during the previous academic year (2008 to summer 2009). They
were then read a list of possible training outcomes and asked to indicate whether they

D-29
considered their training had been of great benefit, of some benefit or of no benefit to them
personally in each of these areas.
D.73 The statements explored the benefits of training on general teaching skills and knowledge, as
well on the delivery of science teaching. In addition, two statements were asked specifically
of science technicians and related to training outcomes relevant to their role. Whilst each of
these themes is discussed in more detail in the following sections, the areas in which all
educator groups (with the exception of technicians) identified themselves as having benefited
the most were:
introducing more creative approaches in the classroom
general pedagogy
developing effective teaching styles that encourage pupils to find science interesting
improving knowledge of the science curriculum (Secondary and FE/Sixth Form
College educators).
D.74 Whilst these match the main benefit areas identified at the initial survey, primary educators
were more likely to recognise the general benefits of training than the science specific
benefits at the 2010 survey when compared with secondary and FE/Sixth Form College
educators.
Training outcomes relating to general teaching skills and knowledge
D.75 Six statements related to the outcomes of training and professional development undertaken
on general teaching skills and knowledge. Table D-23 shows the proportion of each educator
group who responded that training undertaken during the previous academic year had been of
“Great benefit” or “Some benefit” to each of these.
D.76 All educator groups (with the exception of technicians) were equally likely to consider that
their training had been of benefit in the following areas:
introducing more creative approaches in the classroom
receiving materials for use in the classroom
government initiatives.
D.77 However, primary educators were more likely than FE/Sixth Form College and secondary
educators to have benefited in the following areas:
general pedagogy (94% of primary school teachers and 92% of primary science co-
ordinators compared with 85% of other educator groups)
improving the use of ICT in the classroom (86% of primary school teachers compared
with 76% of primary science co-ordinators, 68% of FE/Sixth Form College educators
and 64% of secondary science teachers. Just half of secondary heads of science and
technicians had benefited in this respect (both 49%))

D-30
pastoral issues (76% of primary school teachers and 65% of primary science co-
ordinators compared with half (52%) of FE/Sixth Form College educators, four in ten
(41%) secondary science teachers and three in ten (31%) secondary heads of science).
Table D-23: Rating of benefits of training undertaken (% saying ‘great benefit’ or ‘some benefit’)
Base: All educators except those answering ‘not applicable’ to each statement (England)
Primary science co-ordinators
Primary teachers
Secondary heads of science
Secondary science teachers
FE/6th form science heads/ teachers
Techni-cians
NOTE: BASE SIZE VARIES FOR EACH STATEMENT
Introducing more creative approaches into the classroom
93% 93% 83% 87% 91% 64%
General pedagogy 92% 94% 85% 85% 85% n/a
Improving the use of ICT in the classroom
76% 86% 49% 64% 68% 49%
Receiving materials that can be used in the classroom
84% 80% 81% 78% 77% 65%
Government initiatives 80% 77% 81% 80% 83% 44%
Pastoral issues 65% 76% 31% 41% 52% n/a
Training outcomes related to science teaching
D.78 Six further statements related specifically to the outcomes of training on educators’ science
knowledge and the teaching of science (Table D-24). A number of key trends were apparent
between different educator groups:
secondary science teachers were more likely than primary educators to report that
training undertaken had benefited them in developing effective teaching styles that
encourage pupils to find science interesting (86% compared with 77%). This was due
to a decrease since the initial survey in the proportion of primary school teachers
stating they had benefited in this area (from 88% at the initial survey)
technicians (54%) and primary educators (61% of primary school teachers and 70%
of primary science co-ordinators) were less likely than secondary and FE/Sixth Form
College educators to have benefited from training improving their knowledge of the
science curriculum (85-86% amongst these educator groups). Again, the proportion
of primary school teachers who felt their training had benefited them in this respect
fell from 74% at the initial survey
primary school teachers were less likely to consider that their training had benefited
them by updating their knowledge of, and engaging with, contemporary science
(60%) than primary science co-ordinators (74%), FE/Sixth Form College educators
(75%) and secondary science teachers (76%). Once again, this was the result of a
decrease amongst primary school teachers (from 73% at the initial survey)
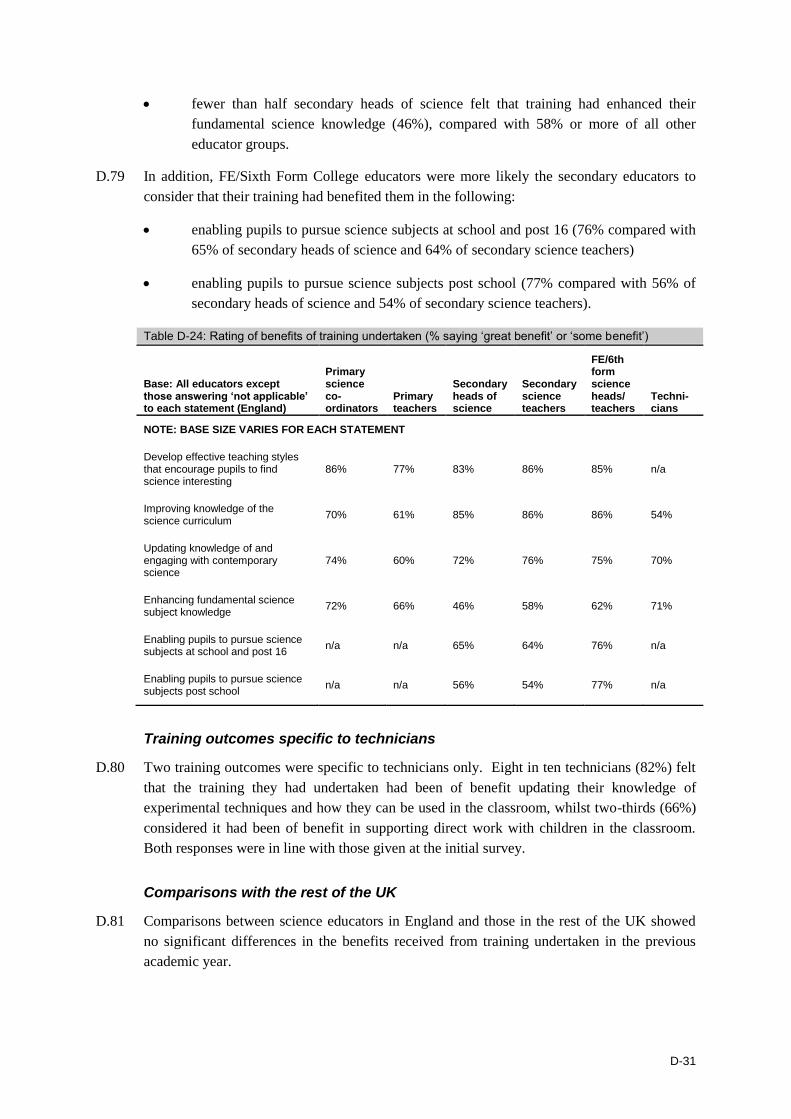
D-31
fewer than half secondary heads of science felt that training had enhanced their
fundamental science knowledge (46%), compared with 58% or more of all other
educator groups.
D.79 In addition, FE/Sixth Form College educators were more likely the secondary educators to
consider that their training had benefited them in the following:
enabling pupils to pursue science subjects at school and post 16 (76% compared with
65% of secondary heads of science and 64% of secondary science teachers)
enabling pupils to pursue science subjects post school (77% compared with 56% of
secondary heads of science and 54% of secondary science teachers).
Table D-24: Rating of benefits of training undertaken (% saying ‘great benefit’ or ‘some benefit’)
Base: All educators except those answering ‘not applicable’ to each statement (England)
Primary science co-ordinators
Primary teachers
Secondary heads of science
Secondary science teachers
FE/6th form science heads/ teachers
Techni-cians
NOTE: BASE SIZE VARIES FOR EACH STATEMENT
Develop effective teaching styles that encourage pupils to find science interesting
86% 77% 83% 86% 85% n/a
Improving knowledge of the science curriculum
70% 61% 85% 86% 86% 54%
Updating knowledge of and engaging with contemporary science
74% 60% 72% 76% 75% 70%
Enhancing fundamental science subject knowledge
72% 66% 46% 58% 62% 71%
Enabling pupils to pursue science subjects at school and post 16
n/a n/a 65% 64% 76% n/a
Enabling pupils to pursue science subjects post school
n/a n/a 56% 54% 77% n/a
Training outcomes specific to technicians
D.80 Two training outcomes were specific to technicians only. Eight in ten technicians (82%) felt
that the training they had undertaken had been of benefit updating their knowledge of
experimental techniques and how they can be used in the classroom, whilst two-thirds (66%)
considered it had been of benefit in supporting direct work with children in the classroom.
Both responses were in line with those given at the initial survey.
Comparisons with the rest of the UK
D.81 Comparisons between science educators in England and those in the rest of the UK showed
no significant differences in the benefits received from training undertaken in the previous
academic year.

D-32
Summary – outcomes from training and development
all educator groups in England, with the exception of technicians, were equally likely
to consider that their training had been of benefit in relation to introducing more
creative approaches in the classroom, receiving materials for use in the classroom and
Government initiatives. About nine in ten, eight in ten and eight in ten who
expressed an opinion in each case said that the training was of great benefit or of
some benefit in these respects. The proportion of technicians reporting benefit was
lower
primary educators were more likely than secondary and FE/Sixth Form College
educators to report benefiting from training in terms of general pedagogy, improving
the use of ICT in the classroom and pastoral issues
around eight in ten or more educators who expressed an opinion said the training had
been of benefit in relation to developing effective teaching styles that encourage
pupils to find science interesting – this figure was lower than average among primary
teachers
the proportion who said they had benefited in improving knowledge of the science
curriculum ranged from half of technicians up to nearly nine in ten of secondary and
FE/Sixth Form college teachers and heads of science
about seven out of ten of each group said that they had benefited in updating their
knowledge of and engaging with contemporary science, with the exception of
primary teachers where six out of ten said they had benefited in this way
the proportion who said they had benefited through having their fundamental science
knowledge enhanced ranged from 46% of secondary heads of science up to 71% of
technicians and 72% of primary science co-ordinators. (The lower figure for
secondary heads of science is presumably due to their higher knowledge base at the
outset)
two-thirds of secondary science educators and three-quarters of those in FE/Sixth
Form Colleges said the training benefited them in enabling pupils to pursue science
subjects at school and post 16
half of secondary science educators and three-quarters of those in FE/Sixth Form
Colleges said the training benefited them in enabling pupils to pursue science subjects
post school
eight in ten technicians felt that the training they had undertaken had been of benefit
updating their knowledge of experimental techniques and how they can be used in the
classroom
two thirds of technicians considered the training had been of benefit in supporting
direct work with children in the classroom
D-33
comparing the findings on these topics with the initial survey, the key changes
identified are that in 2010 primary teachers were less likely to report having benefited
from their training in terms of :
developing effective teaching styles that encourage pupils to find science
interesting
improving their knowledge of the science curriculum
updating their knowledge of and engaging with contemporary science
no significant differences between science educators in England and those in the rest
of the UK were found on the topics covered in this chapter.
Attitudes to science training and development
Benefits and value
D.82 This section looks at educators’ perceptions of the benefits and value to them of undertaking
science training. Educators were read a number of statements and asked to indicate the extent
to which they agreed or disagreed with each (using a five-point scale where 1 meant “disagree
strongly” and 5 meant “agree strongly”. The statements covered a number of issues related to
undertaking science training such as the personal benefits, the value of science training, the
institutional benefits and the impact on pupils. Each is discussed in detail in the following
paragraphs.
Personal benefits of science training
D.83 Educators were asked to indicate the extent to which they agreed with two statements about
science specific training and professional development. These statements related to personal
benefits of participating in science specific training. They covered the extent to which science
training can have a positive effect on career prospects and confidence in performing well in
one’s role.
D.84 There were high levels of agreement with the statement about engaging in science training
making them more confident in performing their roles (two-thirds to four-fifths of each
educator group agreed with this). There was a wider range of opinion on science training
having a positive effect on career prospects, with levels of agreement ranging from just two-
fifths up to three-quarters. Some clear differences between different educator groups can be
seen:
primary educators and technicians were significantly more likely to agree that
participating in science training makes them more confident in performing their role
than to agree that it can have a positive effect on their career prospects
primary school teachers were significantly less likely than all other groups to agree
that science training can have a positive effect on their career prospects, with just
42% agreeing with this statement

D-34
secondary educators were most likely to agree that science training can have a
positive effect on their career prospects, with around three-quarters of each group
agreeing
primary science co-ordinators (80%) were significantly more likely than primary
teachers (68%) and secondary science heads (69%) to agree that science specific
training makes them more confident in performing their role.
Table D-25: Perceptions of personal benefits
Base: All educators in England
Primary science co-ordinators
Primary teachers
Secondary heads of science
Secondary science teachers
FE/6th form science heads/ teachers
Techni-cians
Unweighted base 241 149 161 208 163 180
Weighted base 84 858 16 135 15 54
Effective base 241 149 161 208 163 180
Undertaking science training can have a positive effect on my career prospects
% disagree (net) 9% 19% 12% 8% 12% 12%
% agree (net) 61% 42% 73% 77% 65% 66%
Engaging in science specific training makes me more confident in performing my role
% disagree (net) 5% 7% 7% 7% 9% 4%
% agree (net) 80% 68% 69% 77% 74% 77%
D.85 Looking at changes since the initial survey, the proportion of primary teachers agreeing that
science training can have a positive effect on their career prospects has fallen significantly
since 2006 (from 59% to 42%). The greatest change relating to the belief that science specific
training makes educators more confident in performing their role can be seen amongst heads
and teachers of FE and Sixth Form Colleges, where the level of agreement has risen
significantly from 61% in 2006 to 74% in 2010.
The value of science training
D.86 The next set of statements related to the value that educators place upon science specific
training. Educators were asked whether it was difficult for them to see the value of science
training and whether they considered it to be a luxury.
D.87 Across all groups, the vast majority disagreed that it was difficult for them to see the value of
science training. Disagreement levels were significantly higher amongst secondary science
teachers (93%) and heads and teachers of FE and Sixth Form Colleges (93%) when compared
with those amongst primary educators (85% of co-ordinators and 83% of teachers) and
technicians (78%). Those in the technician group were least likely to disagree with this
statement.
D.88 All groups were significantly less likely to disagree that science training is a luxury than to
disagree that it was difficult to see the value of science training. Two-thirds to three-quarters

D-35
of each group disagreed with this statement. There were no significant differences in levels of
disagreement across the groups.
Table D-26: Perceptions of value of training
Base: All educators in England
Primary science co-ordinators
Primary teachers
Secondary heads of science
Secondary science teachers
FE/6th form science heads/ teachers
Techni-cians
Unweighted base 241 149 161 208 163 180
Weighted base 84 858 16 135 15 54
Effective base 241 149 161 208 163 180
It is difficult for me to see the value of science training
% disagree (net) 85% 83% 89% 93% 93% 78%
% agree (net) 6% 5% 6% 3% 4% 8%
Science training is a luxury
% disagree (net) 67% 69% 74% 67% 75% 68%
% agree (net) 13% 15% 16% 17% 12% 17%
D.89 Secondary science teachers were significantly less likely in 2010 than they were in 2006 to
disagree that science training is a luxury (77% in 2006 compared with 67% in 2010) – in
other words, a negative attitudinal change. The same can be seen amongst heads of science
and teachers in FE/Sixth Form Colleges (84% in 2006 compared with 75% in 2010).
Institutional benefits of science training
D.90 All educators were then asked a set of statements relating to the institutional benefits of
participating in science specific training: the impact science specific training can have on
increasing staff morale and benefiting the whole school.
D.91 Overall the majority of educators agreed with both statements. Primary educators were
significantly more likely to agree that science training benefits the whole school rather than
just them as a professional than they were to agree that it can increase staff morale, whereas
secondary and FE/Sixth Form College educators were significantly more likely to agree that
the provision of science training opportunities can increase staff morale than to agree that
science training benefits the whole school.
D.92 In relation to whether the provision of science training opportunities can increase staff
morale, primary educators were less likely than others to agree, particularly those in primary
teaching roles. Levels of agreement ranged from half among primary teachers (53%) and 64%
among primary science co-ordinators up to just over four-fifths of secondary science heads
(83%), science teachers (82%) and science heads/teachers in FE and Sixth Form Colleges
(82%). Technicians fell in between the primary educators and the other secondary and FE
educators at 72%. However, when asked whether science training benefits the whole school
rather than just them as a professional, it was the primary educators who were significantly
more likely to agree. Levels of agreement ranged from 86% among primary science co-
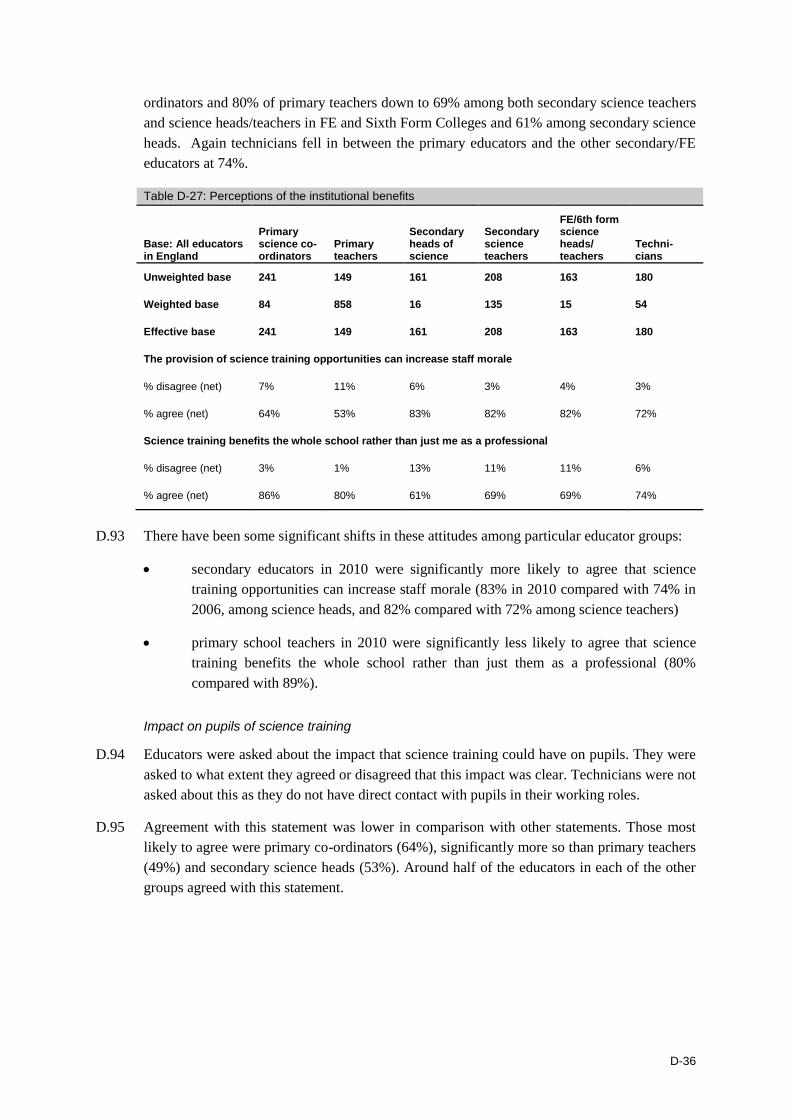
D-36
ordinators and 80% of primary teachers down to 69% among both secondary science teachers
and science heads/teachers in FE and Sixth Form Colleges and 61% among secondary science
heads. Again technicians fell in between the primary educators and the other secondary/FE
educators at 74%.
Table D-27: Perceptions of the institutional benefits
Base: All educators in England
Primary science co-ordinators
Primary teachers
Secondary heads of science
Secondary science teachers
FE/6th form science heads/ teachers
Techni-cians
Unweighted base 241 149 161 208 163 180
Weighted base 84 858 16 135 15 54
Effective base 241 149 161 208 163 180
The provision of science training opportunities can increase staff morale
% disagree (net) 7% 11% 6% 3% 4% 3%
% agree (net) 64% 53% 83% 82% 82% 72%
Science training benefits the whole school rather than just me as a professional
% disagree (net) 3% 1% 13% 11% 11% 6%
% agree (net) 86% 80% 61% 69% 69% 74%
D.93 There have been some significant shifts in these attitudes among particular educator groups:
secondary educators in 2010 were significantly more likely to agree that science
training opportunities can increase staff morale (83% in 2010 compared with 74% in
2006, among science heads, and 82% compared with 72% among science teachers)
primary school teachers in 2010 were significantly less likely to agree that science
training benefits the whole school rather than just them as a professional (80%
compared with 89%).
Impact on pupils of science training
D.94 Educators were asked about the impact that science training could have on pupils. They were
asked to what extent they agreed or disagreed that this impact was clear. Technicians were not
asked about this as they do not have direct contact with pupils in their working roles.
D.95 Agreement with this statement was lower in comparison with other statements. Those most
likely to agree were primary co-ordinators (64%), significantly more so than primary teachers
(49%) and secondary science heads (53%). Around half of the educators in each of the other
groups agreed with this statement.
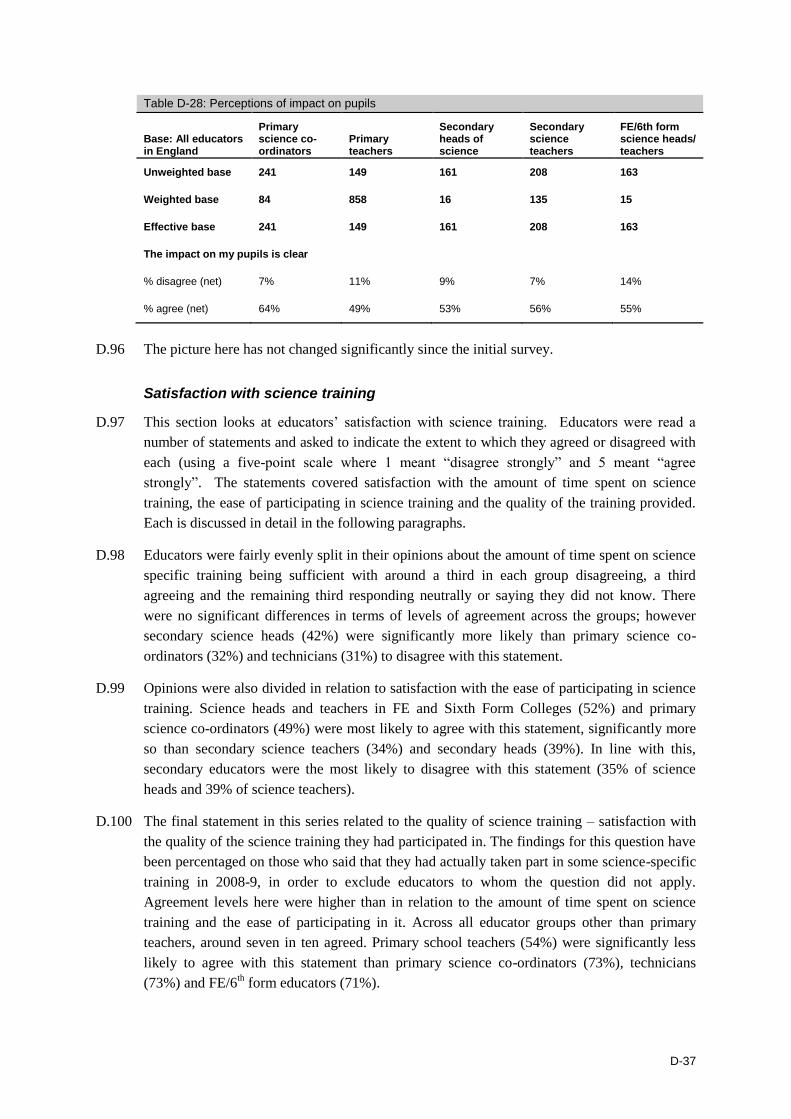
D-37
Table D-28: Perceptions of impact on pupils
Base: All educators in England
Primary science co-ordinators
Primary teachers
Secondary heads of science
Secondary science teachers
FE/6th form science heads/ teachers
Unweighted base 241 149 161 208 163
Weighted base 84 858 16 135 15
Effective base 241 149 161 208 163
The impact on my pupils is clear
% disagree (net) 7% 11% 9% 7% 14%
% agree (net) 64% 49% 53% 56% 55%
D.96 The picture here has not changed significantly since the initial survey.
Satisfaction with science training
D.97 This section looks at educators’ satisfaction with science training. Educators were read a
number of statements and asked to indicate the extent to which they agreed or disagreed with
each (using a five-point scale where 1 meant “disagree strongly” and 5 meant “agree
strongly”. The statements covered satisfaction with the amount of time spent on science
training, the ease of participating in science training and the quality of the training provided.
Each is discussed in detail in the following paragraphs.
D.98 Educators were fairly evenly split in their opinions about the amount of time spent on science
specific training being sufficient with around a third in each group disagreeing, a third
agreeing and the remaining third responding neutrally or saying they did not know. There
were no significant differences in terms of levels of agreement across the groups; however
secondary science heads (42%) were significantly more likely than primary science co-
ordinators (32%) and technicians (31%) to disagree with this statement.
D.99 Opinions were also divided in relation to satisfaction with the ease of participating in science
training. Science heads and teachers in FE and Sixth Form Colleges (52%) and primary
science co-ordinators (49%) were most likely to agree with this statement, significantly more
so than secondary science teachers (34%) and secondary heads (39%). In line with this,
secondary educators were the most likely to disagree with this statement (35% of science
heads and 39% of science teachers).
D.100 The final statement in this series related to the quality of science training – satisfaction with
the quality of the science training they had participated in. The findings for this question have
been percentaged on those who said that they had actually taken part in some science-specific
training in 2008-9, in order to exclude educators to whom the question did not apply.
Agreement levels here were higher than in relation to the amount of time spent on science
training and the ease of participating in it. Across all educator groups other than primary
teachers, around seven in ten agreed. Primary school teachers (54%) were significantly less
likely to agree with this statement than primary science co-ordinators (73%), technicians
(73%) and FE/6th form educators (71%).

D-38
D.101 Some significant differences can also be seen between the three statements:
primary science co-ordinators and heads of science/ teachers in FE and Sixth Form
Colleges were significantly more likely to agree that they were satisfied with the ease
with which they can participate in science training than with the amount of time they
spend on it being sufficient (49% compared with 38% in the case of primary science
co-ordinators and 52% compared with 39% in the case of heads of science/ teachers
in FE and Sixth Form Colleges)
conversely, primary teachers, science heads and teachers in FE and Sixth Form
Colleges) and technicians were all significantly more likely to disagree that they were
satisfied with the amount of time they spend on science specific training being
sufficient than with the ease with which they can participate in it (37% compared
with 22% in the case of primary teachers, 36% compared with 23% in the case of
heads of science and teachers in FE and Sixth Form Colleges, 31% compared with
21% in the case of technicians)
aside from primary teachers, all groups were significantly more likely to agree that
they were satisfied with the quality of the science training they have participated in
than they were with both the amount of time spent on it and the ease with which they
can participate in it.
Table D-29: Satisfaction with science training
Base: All educators in England
Primary science co-ordinators
Primary teachers
Secondary heads of science
Secondary science teachers
FE/6th form science heads/ teachers
Techni-cians
Unweighted base 241 149 161 208 163 180
Weighted base 84 858 16 135 15 54
Effective base 241 149 161 208 163 180
I am satisfied that the amount of time I spend on science training is sufficient
% disagree (net) 32% 37% 42% 39% 36% 31%
% agree (net) 38% 32% 33% 32% 39% 40%
I am satisfied with the ease with which I can participate in science training
% disagree (net) 26% 22% 35% 39% 23% 21%
% agree (net) 49% 42% 39% 34% 52% 43%
Base: All educators in England who undertook science specific training in the previous academic year
Primary science co-ordinators
Primary teachers
Secondary heads of science
Secondary science teachers
FE/6th form science heads/ teachers
Techni-cians
Unweighted base 143 68 140 177 140 120
Weighted base 50 392 14 114 13 36
Effective base 143 68 140 177 140 120

D-39
Base: All educators in England
Primary science co-ordinators
Primary teachers
Secondary heads of science
Secondary science teachers
FE/6th form science heads/ teachers
Techni-cians
I am satisfied with the quality of science training I have participated in
% disagree (net) 6% 15% 6% 9% 5% 3%
% agree (net) 73% 54% 66% 66% 71% 73%
D.102 Some significant changes in attitudes have developed since the initial survey:
primary science co-ordinators and technicians in 2010 were both significantly more
likely to agree that they were satisfied that the amount of time spent on science
training is sufficient: up from 28% to 38% in the case of primary science co-
ordinators and up from 30% to 40% in the case of technicians
secondary science teachers in 2010 were significantly less likely to agree that they
were satisfied with the ease of participating in science training (34% in 2010
compared with 44% in 2006)
technicians in 2010 were significantly less likely to disagree that they were satisfied
with the ease of participating in science training (21% in 2010 compared with 34% in
2006)
in 2010, primary school teachers who had received science-specific training in the
previous academic year were significantly less likely to agree that they were satisfied
with the quality of the science training they have participated in, compared with their
counterparts in 2006 (54% in 2010 compared with 72% in 2006).
Availability of science training
D.103 This section looks at educators’ views surrounding the availability of science training. They
were read a series of statements covering perceptions of the availability of science training
and perceptions of the training itself and asked how strongly they agreed or disagreed with
each one. Each statement is discussed in detail in the following paragraphs.
Availability of provision
D.104 The statements relating to the availability of provision covered wanting more opportunities to
undertake science training and satisfaction with the availability of science training.
D.105 Generally speaking, educators were more likely to agree that they wanted more opportunities
than to agree that they were satisfied with the availability of science training.
D.106 In each group, the majority of educators agreed that they would like more opportunities than
they currently have to undertake science training. The proportions agreeing ranged from 40%
among primary teachers to 67% among secondary science teachers. Secondary and FE
science teachers/heads of science were most likely to agree with this statement, especially
secondary science teachers (67%) who were significantly more likely to agree than primary
science co-ordinators (50%), primary teachers (40%) and technicians (53%).
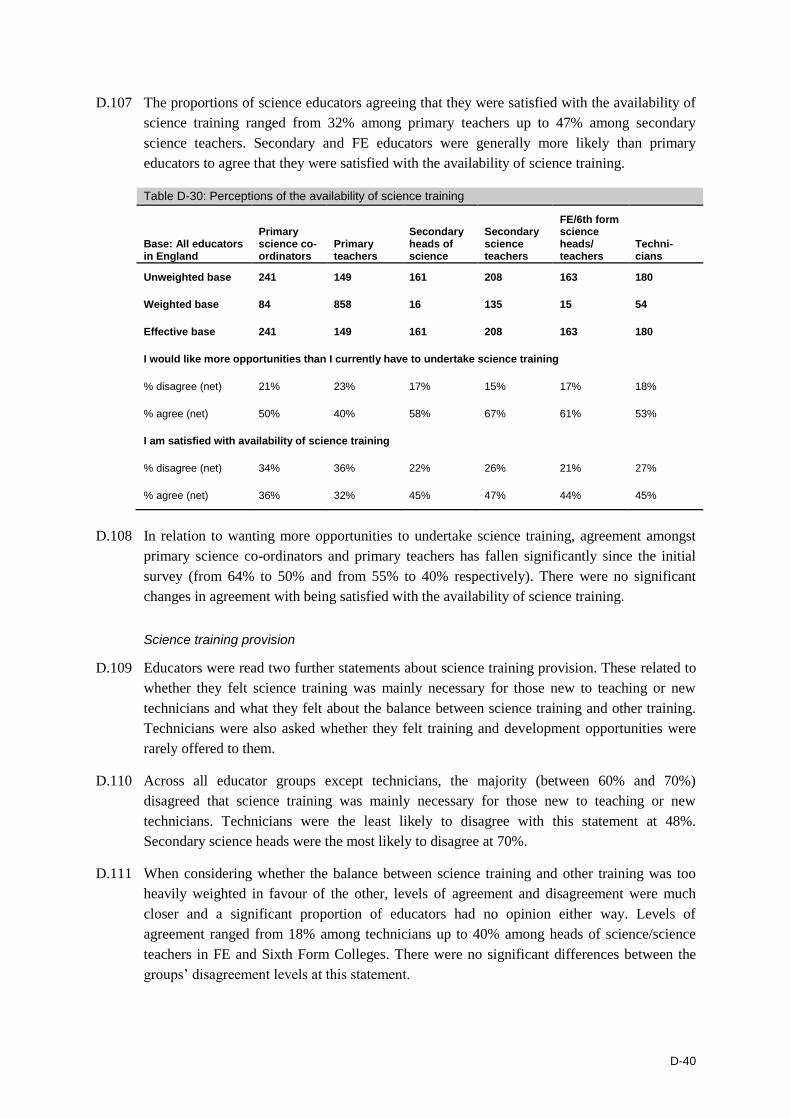
D-40
D.107 The proportions of science educators agreeing that they were satisfied with the availability of
science training ranged from 32% among primary teachers up to 47% among secondary
science teachers. Secondary and FE educators were generally more likely than primary
educators to agree that they were satisfied with the availability of science training.
Table D-30: Perceptions of the availability of science training
Base: All educators in England
Primary science co-ordinators
Primary teachers
Secondary heads of science
Secondary science teachers
FE/6th form science heads/ teachers
Techni-cians
Unweighted base 241 149 161 208 163 180
Weighted base 84 858 16 135 15 54
Effective base 241 149 161 208 163 180
I would like more opportunities than I currently have to undertake science training
% disagree (net) 21% 23% 17% 15% 17% 18%
% agree (net) 50% 40% 58% 67% 61% 53%
I am satisfied with availability of science training
% disagree (net) 34% 36% 22% 26% 21% 27%
% agree (net) 36% 32% 45% 47% 44% 45%
D.108 In relation to wanting more opportunities to undertake science training, agreement amongst
primary science co-ordinators and primary teachers has fallen significantly since the initial
survey (from 64% to 50% and from 55% to 40% respectively). There were no significant
changes in agreement with being satisfied with the availability of science training.
Science training provision
D.109 Educators were read two further statements about science training provision. These related to
whether they felt science training was mainly necessary for those new to teaching or new
technicians and what they felt about the balance between science training and other training.
Technicians were also asked whether they felt training and development opportunities were
rarely offered to them.
D.110 Across all educator groups except technicians, the majority (between 60% and 70%)
disagreed that science training was mainly necessary for those new to teaching or new
technicians. Technicians were the least likely to disagree with this statement at 48%.
Secondary science heads were the most likely to disagree at 70%.
D.111 When considering whether the balance between science training and other training was too
heavily weighted in favour of the other, levels of agreement and disagreement were much
closer and a significant proportion of educators had no opinion either way. Levels of
agreement ranged from 18% among technicians up to 40% among heads of science/science
teachers in FE and Sixth Form Colleges. There were no significant differences between the
groups’ disagreement levels at this statement.

D-41
Table D-31: Perceptions of training provision
Base: All educators in England
Primary science co-ordinators
Primary teachers
Secondary heads of science
Secondary science teachers
FE/6th form science heads/ teachers
Techni-cians
Unweighted base 241 149 161 208 163 180
Weighted base 84 858 16 135 15 54
Effective base 241 149 161 208 163 180
Science training is mainly necessary for those new to teaching/new technicians
% disagree 62% 60% 70% 62% 61% 48%
% agree 22% 27% 20% 23% 23% 34%
Balance between science training and other training is too heavily weighted in favour of the other
% disagree (net) 29% 29% 26% 31% 25% 28%
% agree (net) 35% 34% 32% 35% 40% 18%
D.112 With the exceptions of secondary science heads and technicians, educators were significantly
less likely to disagree that science training was mainly necessary for those new to teaching or
new technicians than they were in the initial survey. Secondary science heads were
significantly less likely to disagree that the balance between science training and other
training was too heavily weighted in favour of the other than they were in the initial survey
(26% compared with 38%). There were no significant differences in the views held by
technicians.
Science training opportunities for technicians
D.113 In addition to the statements read out to all educators, technicians were also asked to what
extent they agreed or disagreed that training and development opportunities were rarely
offered to them. One third agreed with the statement but nearly half (46%) disagreed with it.
Table D-32: Science training opportunities for technicians
Base: All technicians in England All Technicians
Unweighted base 180
Weighted base 54
Effective base 180
Training and development opportunities are rarely offered to technicians
% disagree (net) 46%
% agree (net) 33%
D.114 There were no significant differences in the levels of agreement compared to the initial
survey.

D-42
Comparisons with the rest of the UK
D.115 There was a very similar picture between England and the rest of the UK across the attitudinal
statements. However, there are a small number of statements where a significant difference
can be seen:
educators in England were less likely to agree that undertaking science training can
have a positive effect on their career prospects (49% in England compared with 69%)
educators in England were less likely to agree that engaging in science specific
training makes them more confident in performing their role (71% in England
compared with 85%)
educators in England were significantly less likely to disagree that they were satisfied
with the availability of science provision (34% in England compared with 48%)
technicians in England were significantly more likely to disagree that training and
development opportunities were rarely offered to them (46% compared with 28% in
the rest of the UK).
D.116 These findings show a shift in some areas since the initial survey, when no significant
differences in agreement levels were noted with regards to these attitudinal statements
between educators in England and those in the rest of the UK.
Summary – attitudes to science training and development
between two-thirds and four fifths of all science educator groups in England agreed
that engaging in science-specific training made them more confident in performing
their role; primary science co-ordinators were particularly likely to agree with this,
when compared with primary teachers and secondary science heads
between two-fifths and three-quarters of science educators in England agreed that
undertaking science training could have a positive effect on their career prospects.
Secondary educators were particularly likely to agree with this
the vast majority of all groups in England disagreed that it was difficult for them to
see the value of science training. Secondary and FE/Sixth Form college educators
were especially likely to disagree with this view
two-thirds to three-quarters of educator groups in England disagreed that science
training was a luxury
between half and four fifths of each science educator group agreed that the provision
of science training opportunities can increase staff morale. Among secondary and
FE/Sixth Form College educators the level of agreement was over 80%
between three and four fifths of each group agreed that science training benefited the
whole school rather than just them as a professional; it was the primary educators
who were most likely to agree with this statement
between half and two-thirds of each group agreed that the impact on pupils was clear
D-43
about a third of science educators agreed that they were satisfied that the amount of
time they spent on science training was sufficient, but within each group, the
proportion who disagreed with this statement was either nearly as higher or slightly
higher
between a third and half of science educators agreed that they were satisfied with the
ease with which they could participate in science training. Within primary and
FE/Sixth Form College educators and technicians, those who agreed with this
outnumbered those who disagreed. However, both science heads and teachers in
secondary schools felt more negatively about ease of participation as they were quite
evenly split between agreeing and disagreeing
the proportions of science educators who had received science-specific training in the
previous academic year and who were satisfied with the quality of science training
participated in ranged from half of primary teachers up to around seven in ten of all
other educators
about three fifths of secondary and FE/Sixth Form College science heads and teachers
would like more opportunities to undertake science training. This is also the case for
about half of technicians and primary science co-ordinators and two fifths of primary
teachers
about one third of primary educators and just over two fifths of secondary and
FE/Sixth Form College educators were satisfied with the availability of science
training
between half and two-thirds of each group disagreed with the view that science
training is mainly necessary for those new to teaching/new technicians – the
technicians were least likely to disagree with this
nearly half of technicians disagreed with the view that training and development
opportunities are rarely offered to technicians while one third agreed with this
the key changes identified since 2006 on these topics are that:
primary teachers were less likely to agree that science training could have a
positive effect on their career prospects, and also less likely to agree that
science training benefited the whole school rather than them as a professional
– a negative shift in perceptions of the value of science-specific training from
both angles. At the same time they were less likely to agree that they were
satisfied with the quality of the science training they had participated in
science heads and teachers in FE/Sixth Form Colleges were more likely to
agree that science specific training made them more confident in performing
their roles
both secondary science teachers and science heads and teachers in FE/Sixth
Form Colleges were less likely to disagree that science training is a luxury (a
negative change)

D-44
secondary educators were more likely to agree that science training
opportunities could increase staff morale, but secondary science teachers
were also less likely to agree that they were satisfied with the ease of
participating in science training
primary science co-ordinators and technicians were more likely to agree that
they were satisfied that the amount of time spent on science training was
sufficient
technicians had another positive change, which was that they were less likely
to disagree that they were satisfied with the ease of participating in science
training.
compared with science educators in the rest of the UK, those in England were:
less likely to agree that undertaking science training could have a positive
effect on their career prospects or that engaging in science specific training
made them more confident in performing their role
more likely to agree that they were satisfied with the availability of science
training provision
technicians in England were more likely to disagree that training and
development opportunities were rarely offered to them.
Barriers and enablers
D.117 A number of potential barriers exist to participation in science specific training and
professional development. Educators were read out a number of statements and asked to
indicate the extent to which they agreed or disagreed that each statement was a potential
influence on their participation in science specific training. Statements related to barriers
such as cost and arranging classroom cover, awareness and availability of training, impact on
workload and teaching, and the suitability of courses available. Each of these themes is
discussed in detail below.
Cost and cover
D.118 Educators were asked how much they agreed or disagreed with three statements relating to
the influence of the cost of courses and having to arrange teaching cover on their participation
in science specific training.
D.119 Although the cost of attending courses appeared to be more of a barrier across most educator
groups, arranging and paying for cover tended to be a particular issue for secondary school
educators. For example:
just over two fifths (43%) of both secondary heads of science and science teachers
agreed that paying for cover means they cannot attend training in school time,
compared with between a quarter and a third of other educator groups

D-45
almost half of secondary heads of science (48%) and secondary teachers (45%)
agreed that arranging cover is difficult and means being unable to attend training in
school time, compared with a quarter of primary school educators (23% of primary
science co-ordinators and 25% of primary school teachers). This was also an issue
for 40% of FE/Sixth Form College heads of science and science teachers.
Table D-33: Perceptions of cost and cover as a potential influence on participation
Base: All educators in England
Primary science co-ordinators
Primary teachers
Secondary heads of science
Secondary science teachers
FE/6th form science heads/ teachers
Techni-cians
Unweighted base 241 149 161 208 163 180
Weighted base 84 858 16 135 15 54
Effective base 241 149 161 208 163 180
The cost of courses meaning it is not possible to attend training outside of school
% disagree (net) 32% 36% 30% 27% 37% 24%
% agree (net) 44% 37% 44% 52% 45% 49%
Arranging cover is difficult and means being unable to attend training in school time
% disagree (net) 53% 56% 39% 36% 41% n/a
% agree (net) 23% 25% 48% 45% 40% n/a
Paying for cover means I cannot attend training in school time
% disagree (net) 47% 51% 39% 32% 52% n/a
% agree (net) 33% 29% 43% 43% 26% n/a
Feeling guilty if other teachers/technicians have to cover lessons in my absence
% disagree (net) 64% 54% 35% 41% 40% 38%
% agree (net) 16% 21% 43% 42% 38% 38%
D.120 These differences amongst secondary school educators mirror trends observed at the initial
survey. However, it is encouraging to note that cost and cover barriers have become less of
an obstacle to participation within both primary and secondary schools since the initial
survey. As shown by Figure D-8 and Figure D-9, levels of agreement that the cost of courses
and the difficulties of arranging cover make it impossible to attend training have declined
significantly amongst all primary and secondary educators. Levels of agreement with these
statements have remained similar amongst FE/Sixth Form College staff.
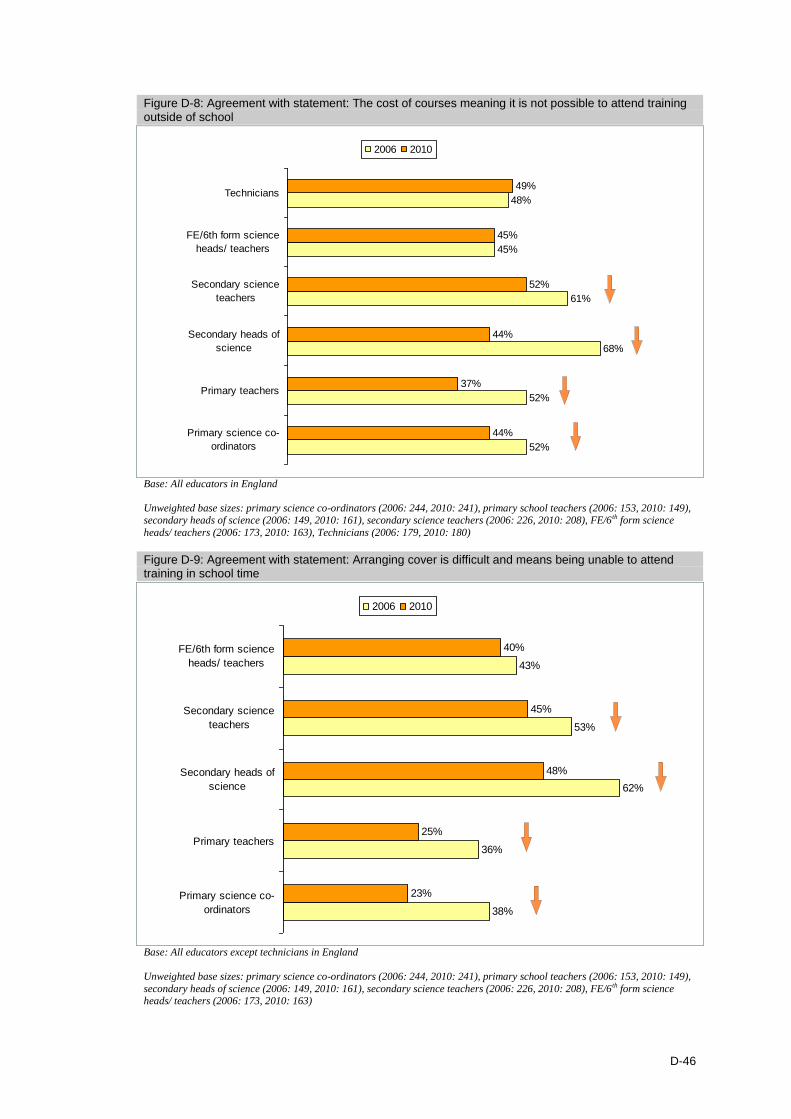
D-46
Figure D-8: Agreement with statement: The cost of courses meaning it is not possible to attend training outside of school
Base: All educators in England
Unweighted base sizes: primary science co-ordinators (2006: 244, 2010: 241), primary school teachers (2006: 153, 2010: 149), secondary heads of science (2006: 149, 2010: 161), secondary science teachers (2006: 226, 2010: 208), FE/6 th form science
heads/ teachers (2006: 173, 2010: 163), Technicians (2006: 179, 2010: 180)
Figure D-9: Agreement with statement: Arranging cover is difficult and means being unable to attend training in school time
Base: All educators except technicians in England
Unweighted base sizes: primary science co-ordinators (2006: 244, 2010: 241), primary school teachers (2006: 153, 2010: 149),
secondary heads of science (2006: 149, 2010: 161), secondary science teachers (2006: 226, 2010: 208), FE/6 th form science heads/ teachers (2006: 173, 2010: 163)
52%
52%
68%
61%
45%
48%
44%
37%
44%
52%
45%
49%
Primary science co-
ordinators
Primary teachers
Secondary heads of
science
Secondary science
teachers
FE/6th form science
heads/ teachers
Technicians
2006 2010
38%
36%
62%
53%
43%
23%
25%
48%
45%
40%
Primary science co-
ordinators
Primary teachers
Secondary heads of
science
Secondary science
teachers
FE/6th form science
heads/ teachers
2006 2010
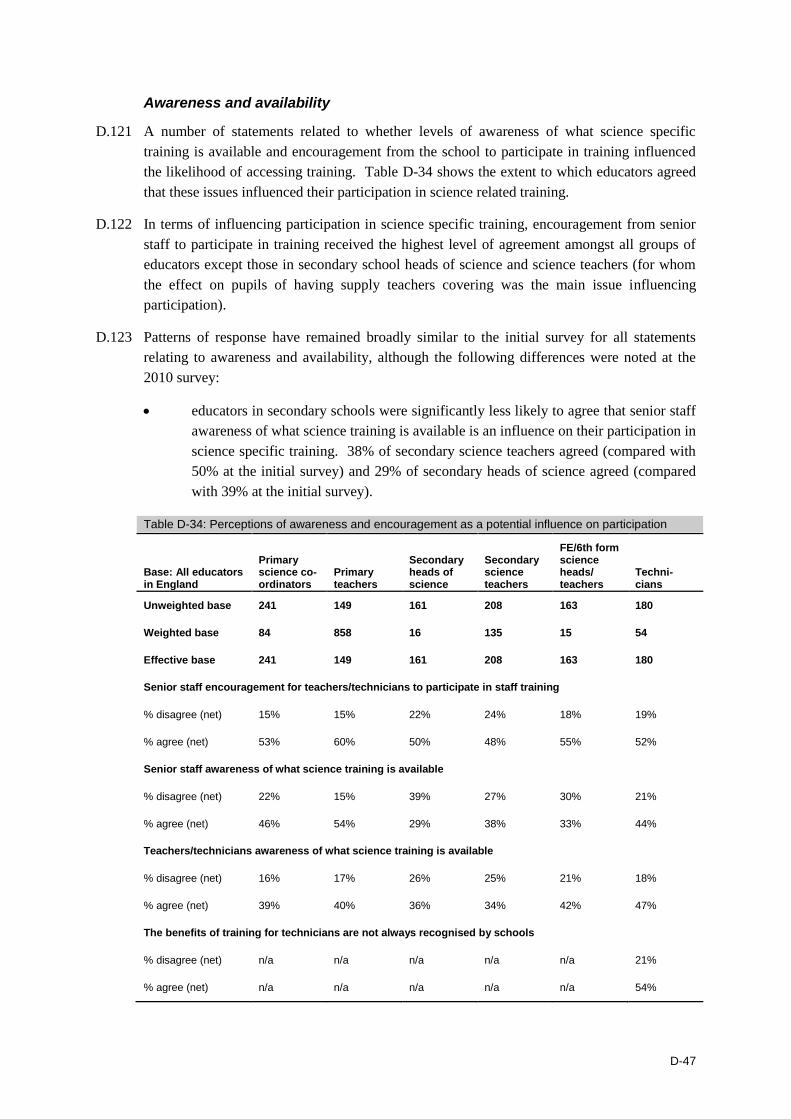
D-47
Awareness and availability
D.121 A number of statements related to whether levels of awareness of what science specific
training is available and encouragement from the school to participate in training influenced
the likelihood of accessing training. Table D-34 shows the extent to which educators agreed
that these issues influenced their participation in science related training.
D.122 In terms of influencing participation in science specific training, encouragement from senior
staff to participate in training received the highest level of agreement amongst all groups of
educators except those in secondary school heads of science and science teachers (for whom
the effect on pupils of having supply teachers covering was the main issue influencing
participation).
D.123 Patterns of response have remained broadly similar to the initial survey for all statements
relating to awareness and availability, although the following differences were noted at the
2010 survey:
educators in secondary schools were significantly less likely to agree that senior staff
awareness of what science training is available is an influence on their participation in
science specific training. 38% of secondary science teachers agreed (compared with
50% at the initial survey) and 29% of secondary heads of science agreed (compared
with 39% at the initial survey).
Table D-34: Perceptions of awareness and encouragement as a potential influence on participation
Base: All educators in England
Primary science co-ordinators
Primary teachers
Secondary heads of science
Secondary science teachers
FE/6th form science heads/ teachers
Techni-cians
Unweighted base 241 149 161 208 163 180
Weighted base 84 858 16 135 15 54
Effective base 241 149 161 208 163 180
Senior staff encouragement for teachers/technicians to participate in staff training
% disagree (net) 15% 15% 22% 24% 18% 19%
% agree (net) 53% 60% 50% 48% 55% 52%
Senior staff awareness of what science training is available
% disagree (net) 22% 15% 39% 27% 30% 21%
% agree (net) 46% 54% 29% 38% 33% 44%
Teachers/technicians awareness of what science training is available
% disagree (net) 16% 17% 26% 25% 21% 18%
% agree (net) 39% 40% 36% 34% 42% 47%
The benefits of training for technicians are not always recognised by schools
% disagree (net) n/a n/a n/a n/a n/a 21%
% agree (net) n/a n/a n/a n/a n/a 54%
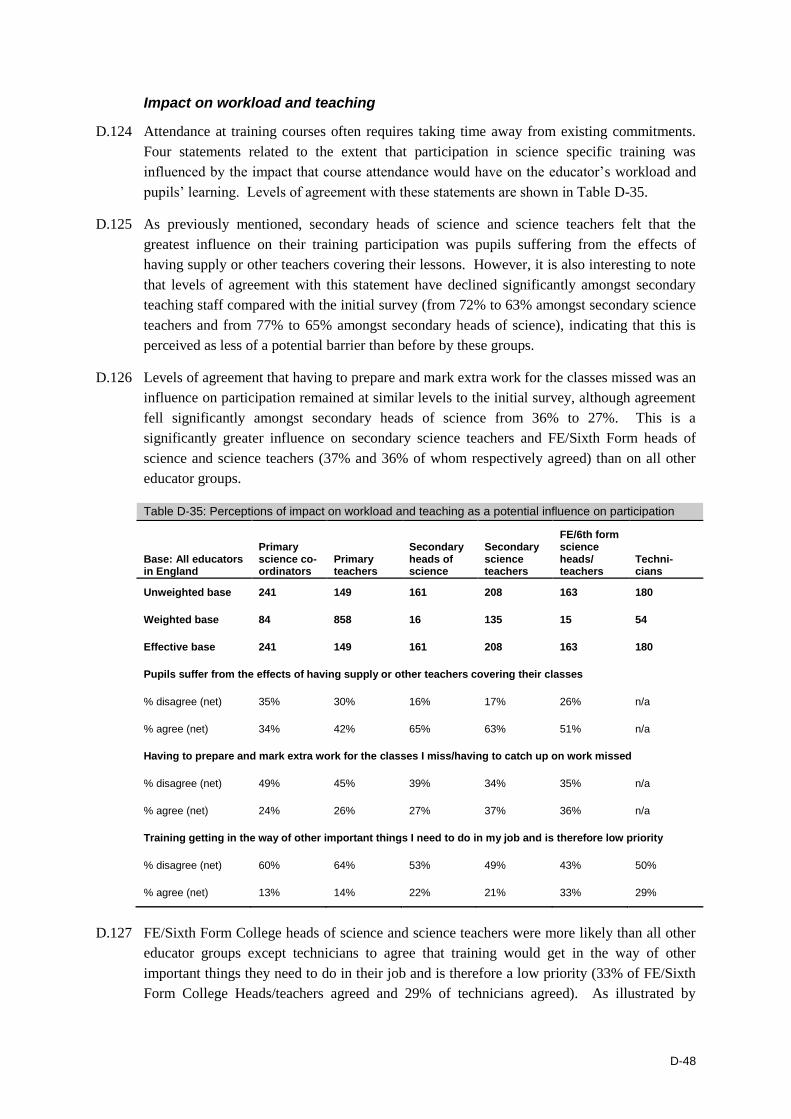
D-48
Impact on workload and teaching
D.124 Attendance at training courses often requires taking time away from existing commitments.
Four statements related to the extent that participation in science specific training was
influenced by the impact that course attendance would have on the educator’s workload and
pupils’ learning. Levels of agreement with these statements are shown in Table D-35.
D.125 As previously mentioned, secondary heads of science and science teachers felt that the
greatest influence on their training participation was pupils suffering from the effects of
having supply or other teachers covering their lessons. However, it is also interesting to note
that levels of agreement with this statement have declined significantly amongst secondary
teaching staff compared with the initial survey (from 72% to 63% amongst secondary science
teachers and from 77% to 65% amongst secondary heads of science), indicating that this is
perceived as less of a potential barrier than before by these groups.
D.126 Levels of agreement that having to prepare and mark extra work for the classes missed was an
influence on participation remained at similar levels to the initial survey, although agreement
fell significantly amongst secondary heads of science from 36% to 27%. This is a
significantly greater influence on secondary science teachers and FE/Sixth Form heads of
science and science teachers (37% and 36% of whom respectively agreed) than on all other
educator groups.
Table D-35: Perceptions of impact on workload and teaching as a potential influence on participation
Base: All educators in England
Primary science co-ordinators
Primary teachers
Secondary heads of science
Secondary science teachers
FE/6th form science heads/ teachers
Techni-cians
Unweighted base 241 149 161 208 163 180
Weighted base 84 858 16 135 15 54
Effective base 241 149 161 208 163 180
Pupils suffer from the effects of having supply or other teachers covering their classes
% disagree (net) 35% 30% 16% 17% 26% n/a
% agree (net) 34% 42% 65% 63% 51% n/a
Having to prepare and mark extra work for the classes I miss/having to catch up on work missed
% disagree (net) 49% 45% 39% 34% 35% n/a
% agree (net) 24% 26% 27% 37% 36% n/a
Training getting in the way of other important things I need to do in my job and is therefore low priority
% disagree (net) 60% 64% 53% 49% 43% 50%
% agree (net) 13% 14% 22% 21% 33% 29%
D.127 FE/Sixth Form College heads of science and science teachers were more likely than all other
educator groups except technicians to agree that training would get in the way of other
important things they need to do in their job and is therefore a low priority (33% of FE/Sixth
Form College Heads/teachers agreed and 29% of technicians agreed). As illustrated by

D-49
Figure D-10, levels of agreement with this statement have increased from the initial survey
amongst all groups except primary school educators.
Figure D-10: Agreement with statement: Training getting in the way of other important things I need to do in my job and is therefore low priority
Base: All educators in England
Unweighted base sizes: primary science co-ordinators (2006: 244, 2010: 241), primary school teachers (2006: 153, 2010: 149),
secondary heads of science (2006: 149, 2010: 161), secondary science teachers (2006: 226, 2010: 208), FE/6 th form science heads/ teachers (2006: 173, 2010: 163), Technicians (2006: 179, 2010: 180)
Suitability of courses
D.128 Three statements related to how the suitability of training courses available influenced
participation in science training. Levels of agreement tended to be lower in relation to these
statements compared with those previously discussed, suggesting that the suitability of
courses available does not present a major barrier to participation. However, for some groups
of educators, it was found that the suitability of courses presented more of an issue than for
others. In particular, it was found that:
science technicians were more likely than all other educator groups to agree that
courses not always being accredited had an influence on their participation in training
(33% of technicians agreed with this statement). Encouragingly, levels of agreement
with this statement have declined significantly since the initial survey amongst
secondary school educators (from 21% to 12% amongst secondary heads of science
and from 26% to 19% amongst secondary school science teachers)
as was found at the initial survey, educators in FE/Sixth Form Colleges were more
likely than other educator groups to agree that most science training is too general
(27% agreed with this statement). Amongst this group, levels of agreement that the
main areas of science training they are interested in are not available have also
increased since the initial survey, from 24% to 34%. It can be argued that FE/Sixth
11%
10%
14%
13%
17%
18%
13%
14%
22%
21%
33%
29%
Primary science co-
ordinators
Primary teachers
Secondary heads of
science
Secondary science
teachers
FE/6th form science
heads/ teachers
Technicians
2006 2010
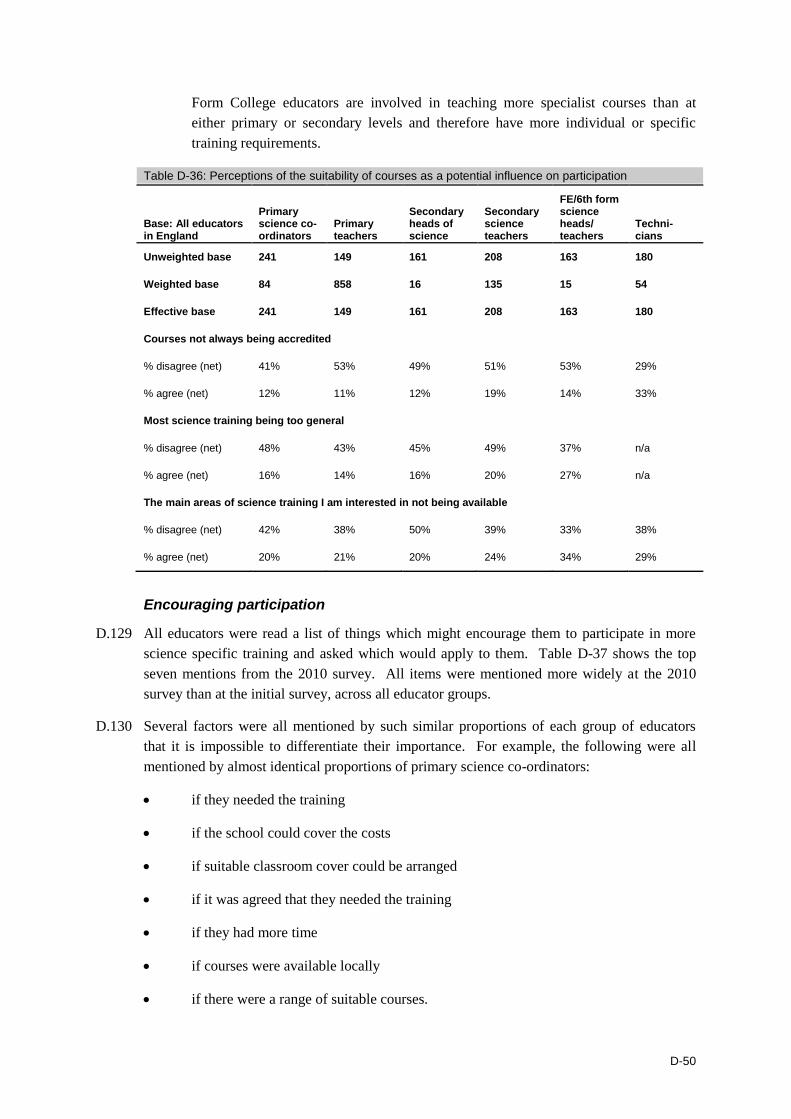
D-50
Form College educators are involved in teaching more specialist courses than at
either primary or secondary levels and therefore have more individual or specific
training requirements.
Table D-36: Perceptions of the suitability of courses as a potential influence on participation
Base: All educators in England
Primary science co-ordinators
Primary teachers
Secondary heads of science
Secondary science teachers
FE/6th form science heads/ teachers
Techni-cians
Unweighted base 241 149 161 208 163 180
Weighted base 84 858 16 135 15 54
Effective base 241 149 161 208 163 180
Courses not always being accredited
% disagree (net) 41% 53% 49% 51% 53% 29%
% agree (net) 12% 11% 12% 19% 14% 33%
Most science training being too general
% disagree (net) 48% 43% 45% 49% 37% n/a
% agree (net) 16% 14% 16% 20% 27% n/a
The main areas of science training I am interested in not being available
% disagree (net) 42% 38% 50% 39% 33% 38%
% agree (net) 20% 21% 20% 24% 34% 29%
Encouraging participation
D.129 All educators were read a list of things which might encourage them to participate in more
science specific training and asked which would apply to them. Table D-37 shows the top
seven mentions from the 2010 survey. All items were mentioned more widely at the 2010
survey than at the initial survey, across all educator groups.
D.130 Several factors were all mentioned by such similar proportions of each group of educators
that it is impossible to differentiate their importance. For example, the following were all
mentioned by almost identical proportions of primary science co-ordinators:
if they needed the training
if the school could cover the costs
if suitable classroom cover could be arranged
if it was agreed that they needed the training
if they had more time
if courses were available locally
if there were a range of suitable courses.
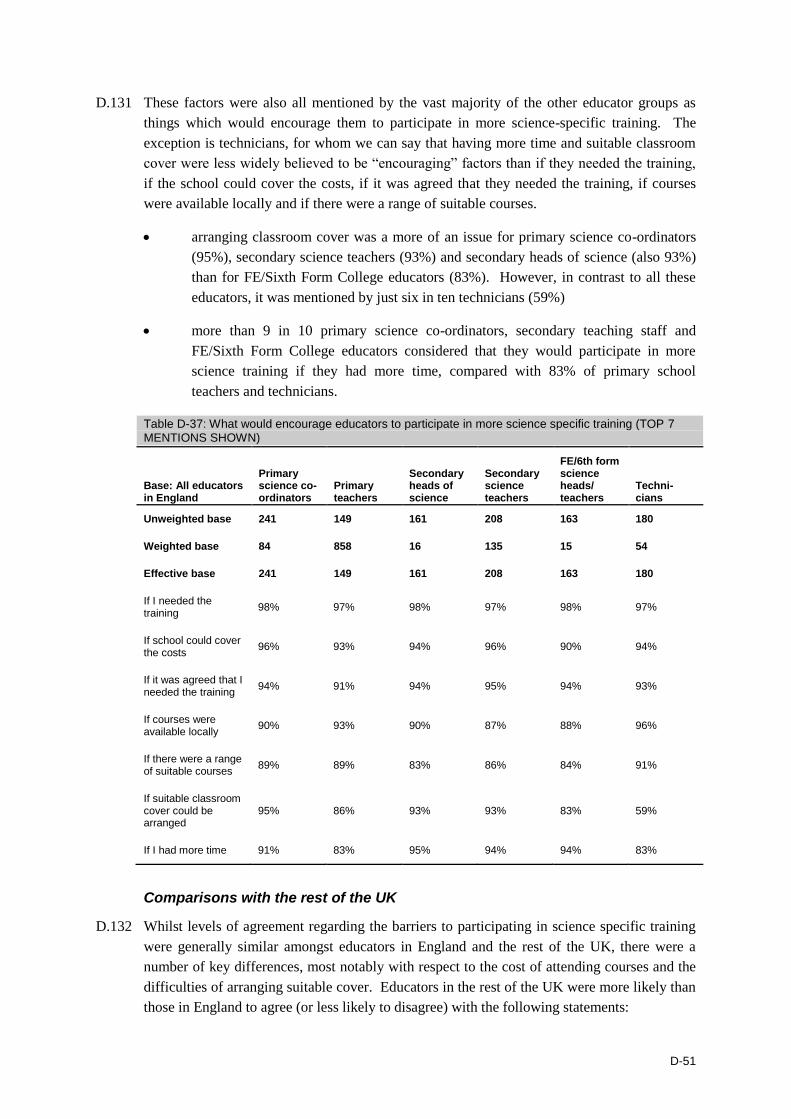
D-51
D.131 These factors were also all mentioned by the vast majority of the other educator groups as
things which would encourage them to participate in more science-specific training. The
exception is technicians, for whom we can say that having more time and suitable classroom
cover were less widely believed to be “encouraging” factors than if they needed the training,
if the school could cover the costs, if it was agreed that they needed the training, if courses
were available locally and if there were a range of suitable courses.
arranging classroom cover was a more of an issue for primary science co-ordinators
(95%), secondary science teachers (93%) and secondary heads of science (also 93%)
than for FE/Sixth Form College educators (83%). However, in contrast to all these
educators, it was mentioned by just six in ten technicians (59%)
more than 9 in 10 primary science co-ordinators, secondary teaching staff and
FE/Sixth Form College educators considered that they would participate in more
science training if they had more time, compared with 83% of primary school
teachers and technicians.
Table D-37: What would encourage educators to participate in more science specific training (TOP 7 MENTIONS SHOWN)
Base: All educators in England
Primary science co-ordinators
Primary teachers
Secondary heads of science
Secondary science teachers
FE/6th form science heads/ teachers
Techni-cians
Unweighted base 241 149 161 208 163 180
Weighted base 84 858 16 135 15 54
Effective base 241 149 161 208 163 180
If I needed the training
98% 97% 98% 97% 98% 97%
If school could cover the costs
96% 93% 94% 96% 90% 94%
If it was agreed that I needed the training
94% 91% 94% 95% 94% 93%
If courses were available locally
90% 93% 90% 87% 88% 96%
If there were a range of suitable courses
89% 89% 83% 86% 84% 91%
If suitable classroom cover could be arranged
95% 86% 93% 93% 83% 59%
If I had more time 91% 83% 95% 94% 94% 83%
Comparisons with the rest of the UK
D.132 Whilst levels of agreement regarding the barriers to participating in science specific training
were generally similar amongst educators in England and the rest of the UK, there were a
number of key differences, most notably with respect to the cost of attending courses and the
difficulties of arranging suitable cover. Educators in the rest of the UK were more likely than
those in England to agree (or less likely to disagree) with the following statements:

D-52
the cost of courses meaning it is not possible to attend outside of school (63% of
educators in the rest of the UK agreed compared with 40% of those in England)
paying for cover means I cannot attend training in school time (58% of educators in
the rest of the UK agreed compared with 31% of those in England)
arranging cover is difficult and means being unable to attend training in school time
(33% of educators in the rest of the UK disagreed compared with 53% of those in
England).
D.133 In addition, a quarter of educators in the rest of the UK (27%) agreed that courses not always
being accredited influenced their participation in science specific training, compared with
13% of educators in England.
Summary – barriers and enablers
substantial proportions of educators perceived cost issues as being a barrier to their
participation in training. Between two-fifths and half of educators agreed that the
cost of courses meant it was not possible to attend training outside of school, and
between three and four in ten agreed that paying for cover meant that they could not
attend training in school time. Secondary school science teachers and heads of
science were particularly likely to see paying for cover as an obstacle
other issues relating to cover during absence were also seen as obstacles to
participation in training, though to a lesser extent. Two fifths of secondary and
FE/Sixth Form educators, and about half as many primary educators, agreed that
feeling guilty if other teachers/technicians had to cover lessons in their absence would
be a potential influence on their participation. Nearly half of secondary science
educators and two fifths of FE/Sixth Form College educators agreed that arranging
cover was difficult and meant being unable to attend training in school time; about a
quarter of primary educators felt the same
the input of senior staff was seen as a strong influence on participation in training,
particularly the active encouragement of senior staff, which half to three fifths of all
educator groups agreed would influence their own participation; senior staff’s
awareness of what training is available was also a relatively strong influence, and for
most educator groups it was on a par with their own awareness of what science
training was available, while for primary teachers senior staff’s awareness was rated
as even more important than their own awareness
just over half of technicians agreed that the benefits of training for technicians not
always being recognised by schools was an influence on their own participation in
training
fear of pupils suffering adverse effects of having supply or other teachers covering
remained a strong influence on all educator groups, but particularly on secondary
educators, two-thirds of whom agreed that this influenced them. There were lower
levels of agreement that participation in training was influenced by having to prepare

D-53
and mark extra work/catch up or by training getting in the way of other important
things. A quarter to a third of all teacher groups agreed that having to do extra
work/catch up was an influence, while one sixth to one third agreed that training
getting in the way of other important things was an influence
lack of suitable provision appeared to be less of an obstacle than the issues around
cost, cover and the possible negative effects of their absence from the classroom on
pupils and on their own workload. One fifth to one third of science educators – those
in FE/Sixth Form Colleges and technicians in particular – agreed that the main areas
of science training they were interested in not being available was an influence; from
about one sixth to one quarter agreed that most science training being too general was
an influence. Courses not always being accredited was more of an issue for
technicians than for other educator groups – one third of technicians agreed this was
an influence, whereas the proportions of other groups agreeing ranged from 11% to
19%
compared with 2006:
levels of agreement that the cost of courses and the difficulties of arranging
cover make it impossible to attend training have declined significantly among
all primary and secondary educators
educators in secondary schools were significantly less likely to agree that
senior staff’s awareness of what science training is available is an influence
on their participation in science-specific training. One possible explanation
for this would be that educators in secondary schools are becoming more
aware of ways to find out for themselves what training is available, and
therefore feel less dependent on the guidance of senior staff
secondary science teachers and heads were less likely to agree that pupils
suffering from the effects of having supply or other teachers covering their
lessons would affect their own participation in training
secondary science heads were less likely to agree that having to prepare and
mark extra work for the classes missed or catch up was an influence on
participation
both secondary and FE/Sixth Form College educators were more likely agree
that training would get in the way of other important things that they needed
to do in their job
secondary school educators were less likely to agree that courses not always
being accredited had an influence on their participation in science training
heads and teachers of science in FE/Sixth Form Colleges were more likely to
agree that the main areas of science training they were interested in were not
available

D-54
compared with science educators in the rest of the UK, science educators in England
were less likely to feel that the following were influences on their participation in
science-specific training:
the cost of courses meaning it is not possible to attend courses outside school
paying for cover meaning they cannot attend training in school time
arranging cover is difficult and means being unable to attend training in
school time
courses not always being accredited.
Attitudinal segmentation of teachers in England
D.134 At the analysis phase of the baseline survey, an attitudinal segmentation of teachers in
England was carried out, with the aim of identifying clusters of people who responded in
similar ways to issues related to training. A six cluster solution was chosen, in which roughly
equal numbers of respondents fell into each cluster (based on unweighted data). The clusters
(or segments) had the characteristics described in the boxes below (text taken from the TNS
baseline report).
Cluster 1 – Encouraged
Science educators in this cluster were the most likely to be influenced to participate in
science training and development by the encouragement of senior staff. Specifically the
factors that they felt would encourage them to participate were:
their awareness of the science training that is available
the awareness of their senior staff and
the encouragement of their senior staff to take part in training and development.
Conversely they were the least likely to say that the costs of courses, as well as arranging
and paying for cover affected their decision to participate in training.
Cluster 2 – Advocates
Science educators in this cluster were the most satisfied with a range of issues concerning
science training and development. They were also the most satisfied with the availability of
science training, and the ease with which they could participate in training. They were the
most satisfied with the quality of science training they had participated in, and most likely to
indicate that the science training they had received was sufficient. This cluster was also the
most likely to say that they were clear about the impact training has on their pupils. Their
satisfaction with science training was also revealed in that fewest in this cluster felt that
most science training was too general.

D-55
Cluster 3 – Disgruntled
In converse to Cluster 2, this cluster were the least likely to be satisfied with the same range
of issues concerning science training and development. In particular they were dissatisfied
with the availability of training and the ease with which they could participate in training.
They were least satisfied with the training and development they had received, and with the
quality of the science training they had participated in. This cluster wanted more training –
and they were the most likely to say they would like more opportunities to undertake science
training. Those in this cluster were also were the most likely to agree that the costs of
courses, arranging cover and paying for cover were factors that would influence their levels
of participation in science training and development.
Cluster 4 – Guilty
Science educators in this cluster were the most likely to say that their own participation in
science training and development was affected by concerns that pupils suffer from the
effects of having other teachers covering their classes. They were also the most likely to say
that their participation levels were affected by feeling guilty if other teachers have to cover
their lessons. Nonetheless they were the cluster most likely to reject the view that science
training is a luxury, and that it is mainly for those new to teaching. So while they valued
training they felt guilty about the consequences of participating in training.
Cluster 5 – Positive with unmet needs
Science educators in this cluster were convinced of the benefits of science training and
development, but they were less happy that the provision met their needs. …. This cluster
were the most likely to say that science training can have a positive effect on their career
prospects, and can make them more confident in performing their role. They also felt that
science training had wider benefits – they were the most likely to think that training
opportunities can increase staff morale, and that training benefits the whole school.
However they were the most likely to say that most science training was too general, and
that the main areas of science training which they are interested in, are not available. This
cluster was also the most likely to say that courses were not always accredited.
Cluster 6 – Rejecters
This cluster was the most negative about science training and development. Science
educators in this cluster were the most likely to say that it was difficult for them to see the
value of science training, and to say that they considered it to be a luxury. Those in this
cluster were also more likely to say that science training is mainly necessary for those new
to teaching. They were also more likely to say that training gets in the way of other
important things they need to do in their job and is therefore of a low priority. This cluster
were most likely to say that having to prepare and mark extra work for the classes they miss
would potentially influence their decision to participate in training and development.
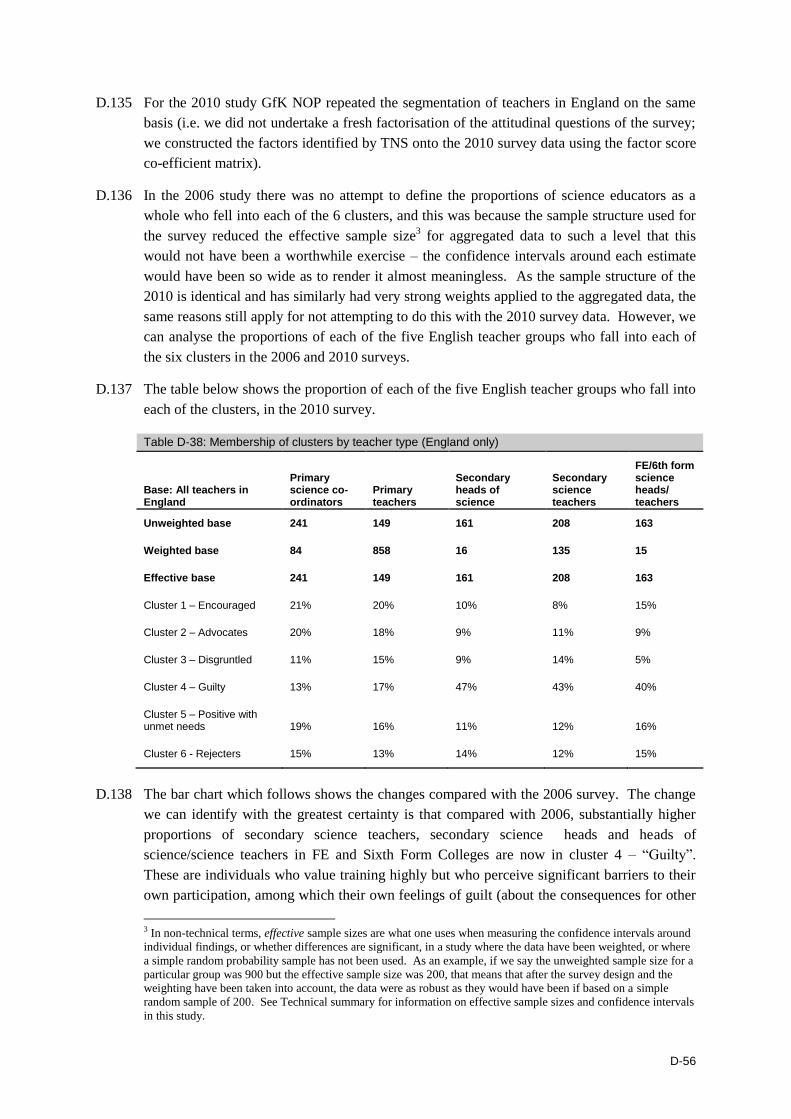
D-56
D.135 For the 2010 study GfK NOP repeated the segmentation of teachers in England on the same
basis (i.e. we did not undertake a fresh factorisation of the attitudinal questions of the survey;
we constructed the factors identified by TNS onto the 2010 survey data using the factor score
co-efficient matrix).
D.136 In the 2006 study there was no attempt to define the proportions of science educators as a
whole who fell into each of the 6 clusters, and this was because the sample structure used for
the survey reduced the effective sample size3 for aggregated data to such a level that this
would not have been a worthwhile exercise – the confidence intervals around each estimate
would have been so wide as to render it almost meaningless. As the sample structure of the
2010 is identical and has similarly had very strong weights applied to the aggregated data, the
same reasons still apply for not attempting to do this with the 2010 survey data. However, we
can analyse the proportions of each of the five English teacher groups who fall into each of
the six clusters in the 2006 and 2010 surveys.
D.137 The table below shows the proportion of each of the five English teacher groups who fall into
each of the clusters, in the 2010 survey.
Table D-38: Membership of clusters by teacher type (England only)
Base: All teachers in England
Primary science co-ordinators
Primary teachers
Secondary heads of science
Secondary science teachers
FE/6th form science heads/ teachers
Unweighted base 241 149 161 208 163
Weighted base 84 858 16 135 15
Effective base 241 149 161 208 163
Cluster 1 – Encouraged 21% 20% 10% 8% 15%
Cluster 2 – Advocates 20% 18% 9% 11% 9%
Cluster 3 – Disgruntled 11% 15% 9% 14% 5%
Cluster 4 – Guilty 13% 17% 47% 43% 40%
Cluster 5 – Positive with unmet needs 19% 16% 11% 12% 16%
Cluster 6 - Rejecters 15% 13% 14% 12% 15%
D.138 The bar chart which follows shows the changes compared with the 2006 survey. The change
we can identify with the greatest certainty is that compared with 2006, substantially higher
proportions of secondary science teachers, secondary science heads and heads of
science/science teachers in FE and Sixth Form Colleges are now in cluster 4 – “Guilty”.
These are individuals who value training highly but who perceive significant barriers to their
own participation, among which their own feelings of guilt (about the consequences for other
3 In non-technical terms, effective sample sizes are what one uses when measuring the confidence intervals around
individual findings, or whether differences are significant, in a study where the data have been weighted, or where
a simple random probability sample has not been used. As an example, if we say the unweighted sample size for a
particular group was 900 but the effective sample size was 200, that means that after the survey design and the
weighting have been taken into account, the data were as robust as they would have been if based on a simple
random sample of 200. See Technical summary for information on effective sample sizes and confidence intervals
in this study.

D-57
people) have been most clearly identified. Whilst this cannot be interpreted as a positive
development in itself, it could at least help simplify the range of marketing messages required
to attract science educators into greater participation in science-specific training.
D.139 Now looking at changes within each of the five English teacher groups in turn:
primary school teachers: among this group none of the apparent differences in
cluster membership are large enough to be statistically significant at the 95%
confidence level, therefore we cannot be sure whether any real change has taken
place
primary science co-ordinators: the only statistically significant change is that the
proportion belonging to cluster 3, “Disgruntled”, has fallen from 20% to 11%, though
it does look as though there has been some movement towards the “Positive with
unmet needs” cluster
secondary science teachers: the proportion of this group who belong to the “Guilty”
cluster has jumped from 26% to 43%. While their membership of several clusters has
been reduced, the “Encouraged” cluster has been particularly affected, while the
proportions who are “Advocates” or “Rejecters” have stayed quite stable
secondary heads of science: the proportion of this group who belong to the “Guilty”
cluster has jumped from 27% to 47%. While membership of several other clusters
has been reduced, the proportions who are “Encouraged” or “Rejecters” have stayed
quite stable
heads of science and science teachers in FE/Sixth Form Colleges: the proportion
of this group who belong to the “Guilty” cluster has jumped from 18% to 40%, with
significant drops in the proportions belong to the “Advocates” and “Disgruntled”
clusters.
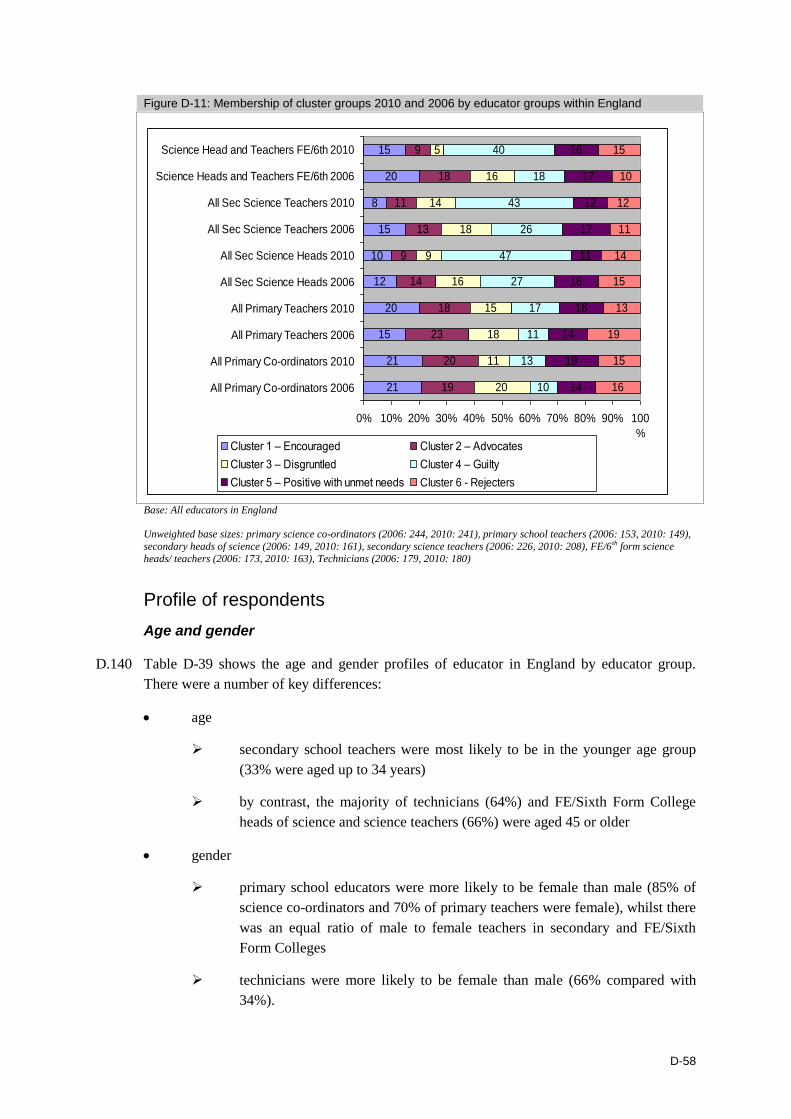
D-58
Figure D-11: Membership of cluster groups 2010 and 2006 by educator groups within England
Base: All educators in England
Unweighted base sizes: primary science co-ordinators (2006: 244, 2010: 241), primary school teachers (2006: 153, 2010: 149),
secondary heads of science (2006: 149, 2010: 161), secondary science teachers (2006: 226, 2010: 208), FE/6 th form science
heads/ teachers (2006: 173, 2010: 163), Technicians (2006: 179, 2010: 180)
Profile of respondents
Age and gender
D.140 Table D-39 shows the age and gender profiles of educator in England by educator group.
There were a number of key differences:
age
secondary school teachers were most likely to be in the younger age group
(33% were aged up to 34 years)
by contrast, the majority of technicians (64%) and FE/Sixth Form College
heads of science and science teachers (66%) were aged 45 or older
gender
primary school educators were more likely to be female than male (85% of
science co-ordinators and 70% of primary teachers were female), whilst there
was an equal ratio of male to female teachers in secondary and FE/Sixth
Form Colleges
technicians were more likely to be female than male (66% compared with
34%).
21
21
15
20
12
10
15
8
20
15
19
20
23
18
14
9
13
11
18
9
20
11
18
15
16
9
18
14
16
5
10
13
11
17
27
47
26
43
18
40
14
19
14
16
16
11
17
12
17
16
16
15
19
13
15
14
11
12
10
15
0% 10% 20% 30% 40% 50% 60% 70% 80% 90% 100
%
All Primary Co-ordinators 2006
All Primary Co-ordinators 2010
All Primary Teachers 2006
All Primary Teachers 2010
All Sec Science Heads 2006
All Sec Science Heads 2010
All Sec Science Teachers 2006
All Sec Science Teachers 2010
Science Heads and Teachers FE/6th 2006
Science Head and Teachers FE/6th 2010
Cluster 1 – Encouraged Cluster 2 – Advocates
Cluster 3 – Disgruntled Cluster 4 – Guilty
Cluster 5 – Positive with unmet needs Cluster 6 - Rejecters

D-59
Table D-39: Age and gender profiles
Base: All educators in England
Primary science co-ordinators
Primary teachers
Secondary heads of science
Secondary science teachers
FE/6th form science heads/ teachers Technicians
Unweighted base 241 149 161 208 163 180
Weighted base 84 858 16 135 15 54
Effective base 241 149 161 208 163 180
Age
Up to 34 years 26% 22% 20% 33% 14% 16%
35 – 44 years 27% 28% 43% 31% 18% 20%
45 years or more 47% 50% 37% 36% 66% 64%
Average age 43 44 42 41 47 47
Gender
Male 15% 30% 53% 50% 52% 34%
Female 85% 70% 47% 50% 48% 66%
Teaching qualifications
D.141 Table D-40 shows the teaching qualifications held by teaching staff in England. The key
differences between educators at different phases of education were:
primary school educators were less likely to hold a PGCE than secondary and
FE/Sixth Form College educators. For example, 46% of primary teachers and 42% of
science co-ordinators held a degree and PGCE compared with 70% or more of all
other educator groups
primary and FE/Sixth Form College educators were more likely to only hold a
Diploma or Certificate of Education than secondary school educators (around one in
ten of primary and FE/Sixth Form College educators compared with 2-3% of
secondary educator groups).
Table D-40: Teaching qualifications held
Base: All educators in England (except technicians)
Primary science co-ordinators
Primary teachers
Secondary heads of science
Secondary science teachers
FE/6th form science heads/ teachers
Unweighted base 241 149 161 208 163
Weighted base 84 858 16 135 15
Effective base 241 149 161 208 163
Qualifications:
Degree and PGCE 42% 46% 81% 75% 70%

D-60
Base: All educators in England (except technicians)
Primary science co-ordinators
Primary teachers
Secondary heads of science
Secondary science teachers
FE/6th form science heads/ teachers
Degree only 33% 26% 6% 14% 9%
Diploma or certificate of Education
10% 11% 3% 2% 12%
Other 14% 16% 9% 9% 8%
D.142 All those who held a degree or PGCE were asked which subject their degree had been in.
Responses have been categorised into either science-related subjects or non science-related
subjects. These are shown in Table D-41 by educator group.
D.143 Unsurprisingly, it was found that FE/Sixth Form College heads of science and science
teachers (92%), secondary heads of science (91%) and (to a slightly lesser extent) secondary
science teachers (84%) were more likely to have studied a science subject for their degree
than primary school educators. However, amongst primary educators who had a degree,
science co-ordinators were more likely to have studied a science related subject than primary
teachers (27% compared with 10%).
Table D-41: Degree subject
Base: All educators in England (except technicians) with a degree or PGCE
Primary science co-ordinators
Primary teachers
Secondary heads of science
Secondary science teachers
FE/6th form science heads/ teachers
Unweighted base 181 108 141 185 129
Weighted base 63 622 14 120 12
Effective base 181 108 141 185 129
Subject:
Science-related 27% 10% 91% 84% 92%
Non science-related 69% 88% 8% 15% 5%
Qualifications held by technicians
D.144 Technicians were asked what the highest qualification that they held was. The top responses
are shown in Table D-42.
Table D-42: Highest qualifications held by technicians (ALL RESPONSES OVER 5% SHOWN)
Base: All technicians in England Technicians
Unweighted base 180
Weighted base 54
Effective base 180
Qualifications:
Degree, Masters, PhD 35%
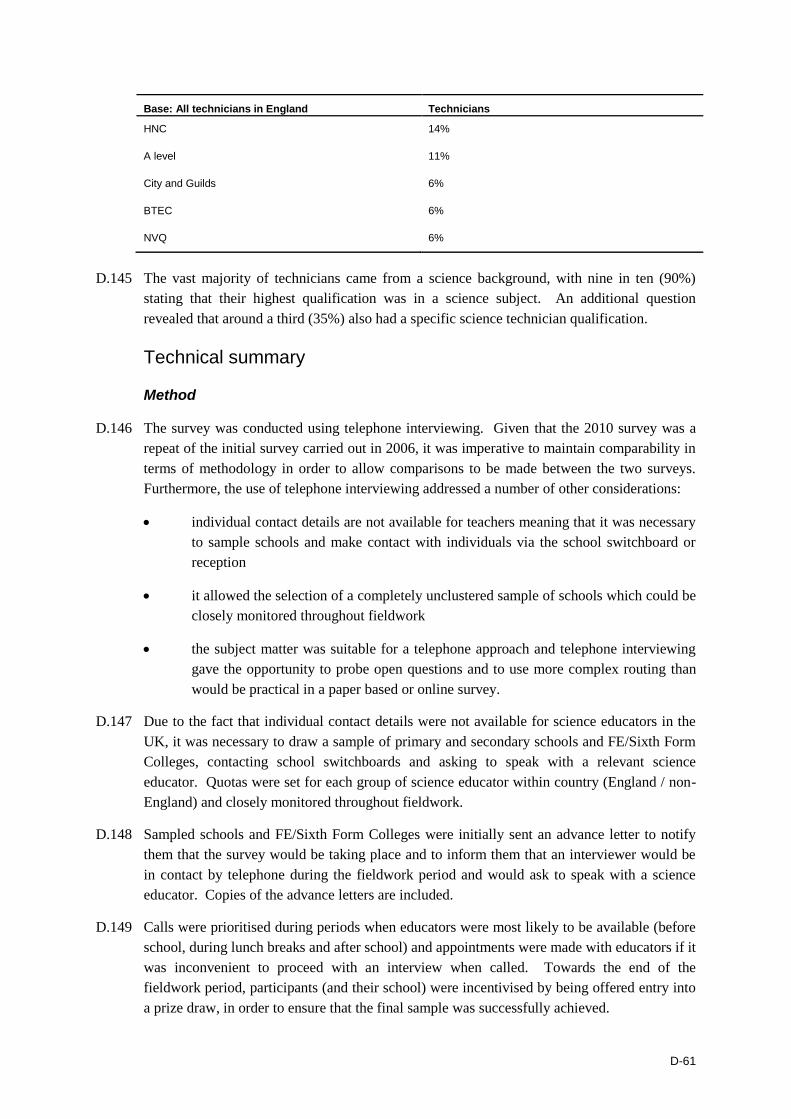
D-61
Base: All technicians in England Technicians
HNC 14%
A level 11%
City and Guilds 6%
BTEC 6%
NVQ 6%
D.145 The vast majority of technicians came from a science background, with nine in ten (90%)
stating that their highest qualification was in a science subject. An additional question
revealed that around a third (35%) also had a specific science technician qualification.
Technical summary
Method
D.146 The survey was conducted using telephone interviewing. Given that the 2010 survey was a
repeat of the initial survey carried out in 2006, it was imperative to maintain comparability in
terms of methodology in order to allow comparisons to be made between the two surveys.
Furthermore, the use of telephone interviewing addressed a number of other considerations:
individual contact details are not available for teachers meaning that it was necessary
to sample schools and make contact with individuals via the school switchboard or
reception
it allowed the selection of a completely unclustered sample of schools which could be
closely monitored throughout fieldwork
the subject matter was suitable for a telephone approach and telephone interviewing
gave the opportunity to probe open questions and to use more complex routing than
would be practical in a paper based or online survey.
D.147 Due to the fact that individual contact details were not available for science educators in the
UK, it was necessary to draw a sample of primary and secondary schools and FE/Sixth Form
Colleges, contacting school switchboards and asking to speak with a relevant science
educator. Quotas were set for each group of science educator within country (England / non-
England) and closely monitored throughout fieldwork.
D.148 Sampled schools and FE/Sixth Form Colleges were initially sent an advance letter to notify
them that the survey would be taking place and to inform them that an interviewer would be
in contact by telephone during the fieldwork period and would ask to speak with a science
educator. Copies of the advance letters are included.
D.149 Calls were prioritised during periods when educators were most likely to be available (before
school, during lunch breaks and after school) and appointments were made with educators if it
was inconvenient to proceed with an interview when called. Towards the end of the
fieldwork period, participants (and their school) were incentivised by being offered entry into
a prize draw, in order to ensure that the final sample was successfully achieved.

D-62
Questionnaire
D.150 The questionnaire was unchanged from the initial survey carried out in 2006, with a survey
length of 17 minutes on average. Given that the questionnaire had already been successfully
implemented, there was no requirement for any further piloting ahead of the 2010 survey.
D.151 The main topics covered by the survey were:
current uptake of training and professional development
science specific training and professional development
attitudes to training and professional development
barriers and enablers to training and professional development
awareness and knowledge of Science Learning Centres
participation to date in Science Learning Centre courses and events
satisfaction with Science Learning Centre courses and events.
D.152 A copy of the full questionnaire is included.
Sampling
D.153 As per the initial survey, the survey sought to interview a sample of science educators across
the UK. The rationale for this was that while Science Learning Centres are located in
England only, the National Science Learning Centre in York was intended to serve educators
across the whole of the UK. Therefore, whilst the main focus was on science educators in
England, a smaller sample of science educators from the rest of the UK was also included.
D.154 The science educator population included all teaching staff in primary schools, heads of
science and science teachers in secondary schools, and FE/Sixth Form College heads of
science and science teachers, as well as all science technicians in secondary schools and
FE/Sixth Form Colleges. Teaching assistants in primary schools, and teachers and assistants
in special schools and pupil referral units were excluded from the population.
D.155 Whilst there is no single data source available for the UK science educator population, the
initial survey derived this information from a number of available sources. This is shown in
Table D-43.
Table D-43: Universe of science educators
England Wales Scotland Northern Ireland
UK
Primary science co-ordinators 17,642 1,572 2,190 912 22,320
Primary teachers 180,558 7,988 20,679 7,088 216,313
Secondary heads of science 3,385 227 385 232 4,229
Secondary science teachers 28,300 1,321 3,210 1,313 34,144

D-63
England Wales Scotland Northern Ireland
UK
FE/6th form heads of science and science teachers 3,192 133 382 91 3,798
Science technicians in secondary, FE/6th form colleges 11,295 750 1293 744 14,082
Total 244,371 11,991 28,139 10,380 294,882
D.156 The 2010 survey followed the sampling approach employed at the initial survey. As
discussed earlier, due to the fact that no source of individual science educators exists, the
survey sampled primary and secondary schools, and FE/Sixth Form Colleges, in each of the
countries of the UK. The sample sources used were EduBase for schools and colleges located
in England; lists publicly available on the Welsh Assembly Government and Scottish
Government websites for those located in Wales and Scotland respectively; lists publicly
available on the websites of the School Board Areas in Northern Ireland. Within the list for
each nation, the lists were stratified by phase of school and then further stratified by a number
of additional variables including geographical area. Individual schools were then selected
using random probability sampling methods in proportion to the number of schools required,
on the basis of one teacher interview being requested per school.
Fieldwork
D.157 In total, 1,402 interviews were conducted between 25th January and 21st May 2010. The data
was captured using Computer Assisted Telephone Interviewing (CATI) which allowed
automatic routing and the GfK NOP project team to monitor fieldwork progress continually.
Quotas were set for each group of science educator within country (England / Non-England)
and closely monitored throughout fieldwork.
D.158 All interviewers were IQCS trained and were personally briefed by a member of the GfK
NOP executive team. The briefing was used to describe to interviewers the background to
and purpose for the survey, as well as covering interviewing procedures and the questionnaire
itself.
Weighting
D.159 Aggregated data were weighted by educator group within each individual country to reflect
the population of science educators within the UK (see Table D-43 earlier). The overall
unweighted and weighted profiles by country are shown in Table D-44 below, whilst the
corresponding profiles of the six educator groups in England are shown in Table D-45. (Just
to re-iterate the report introduction, all the survey findings presented in this report are based
on weighted data.)
D.160 The strength of weighting in aggregated data (i.e. at UK, England or non-England level) was
much greater than is normally considered acceptable. As shown by Table D-44, the effective
sample size was much reduced compared with the actual sample size4, which reduces our
4 Generally speaking, the stronger the weights which need to be applied to a dataset, the bigger the difference
between the unweighted (or actual) sample size and the effective sample size will be.
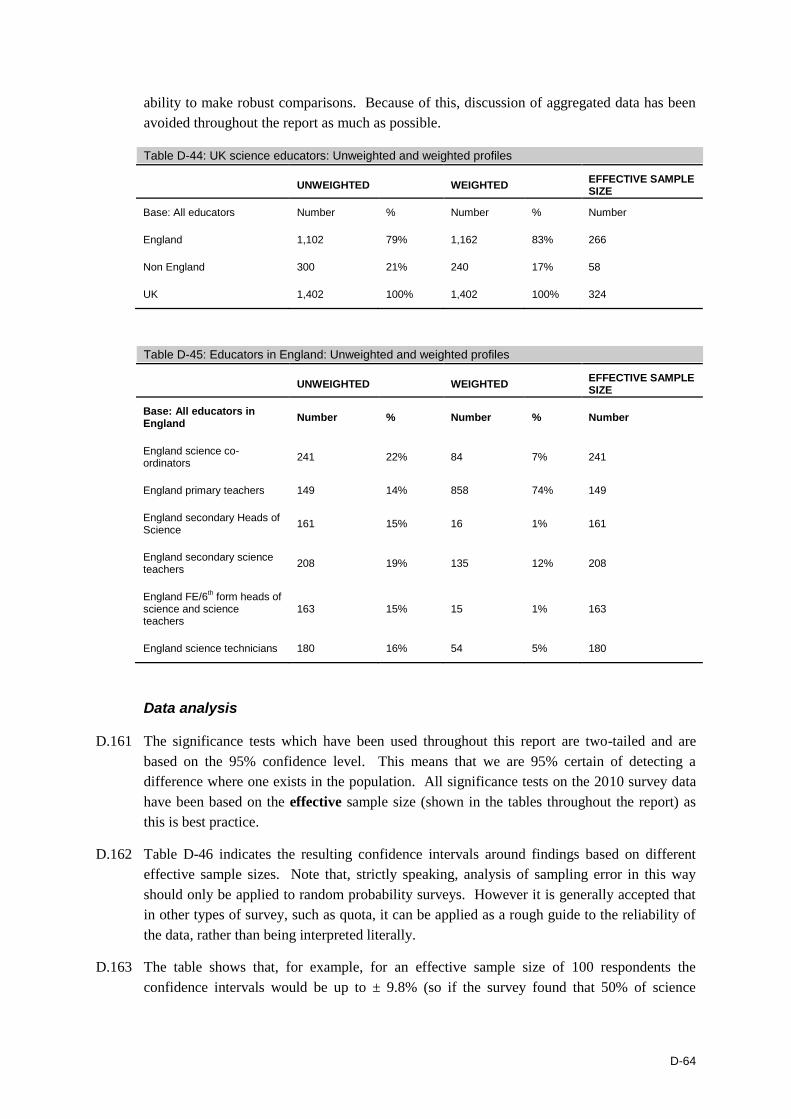
D-64
ability to make robust comparisons. Because of this, discussion of aggregated data has been
avoided throughout the report as much as possible.
Table D-44: UK science educators: Unweighted and weighted profiles
UNWEIGHTED WEIGHTED EFFECTIVE SAMPLE SIZE
Base: All educators Number % Number % Number
England 1,102 79% 1,162 83% 266
Non England 300 21% 240 17% 58
UK 1,402 100% 1,402 100% 324
Table D-45: Educators in England: Unweighted and weighted profiles
UNWEIGHTED WEIGHTED EFFECTIVE SAMPLE SIZE
Base: All educators in England
Number % Number % Number
England science co-ordinators
241 22% 84 7% 241
England primary teachers 149 14% 858 74% 149
England secondary Heads of Science
161 15% 16 1% 161
England secondary science teachers
208 19% 135 12% 208
England FE/6th form heads of
science and science teachers
163 15% 15 1% 163
England science technicians 180 16% 54 5% 180
Data analysis
D.161 The significance tests which have been used throughout this report are two-tailed and are
based on the 95% confidence level. This means that we are 95% certain of detecting a
difference where one exists in the population. All significance tests on the 2010 survey data
have been based on the effective sample size (shown in the tables throughout the report) as
this is best practice.
D.162 Table D-46 indicates the resulting confidence intervals around findings based on different
effective sample sizes. Note that, strictly speaking, analysis of sampling error in this way
should only be applied to random probability surveys. However it is generally accepted that
in other types of survey, such as quota, it can be applied as a rough guide to the reliability of
the data, rather than being interpreted literally.
D.163 The table shows that, for example, for an effective sample size of 100 respondents the
confidence intervals would be up to ± 9.8% (so if the survey found that 50% of science

D-65
educators held a certain view, we could be 95% sure that the true proportion of science
educators that hold that view would be between 40.2% and 59.8%).
Table D-46: Confidence intervals for different effective sample sizes
Effective sample size 10%/90% 30%/70% 50%/50%
50 8.3% 12.7% 13.9%
100 5.9% 9.0% 9.8%
150 4.8% 7.3% 8.0%
200 4.2% 6.4% 6.9%
250 3.7% 5.7% 6.2%
500 2.6% 4.0% 4.4%
D.164 Throughout the report, comparisons have been made between the initial survey and the 2010
survey. Table D-47 estimates the magnitude of change required for a finding to be considered
statistically significantly different (at the 95% confidence level) from the initial survey5.
D.165 As shown by the table, if it was found that 50% of England secondary science teachers gave a
particular view at the 2006 survey, we would require 60% or more to hold this view at the
2010 survey to be confident that the increase was statistically significant. If we were
comparing aggregated data based on all science educators in England and all those in the rest
of the UK in the 2010 dataset, if 50% of those in England gave a particular view, we would
need 65% or more of those in the rest of the UK to express that view in order to be sure that
the two were significantly different.
Table D-47: Magnitude of change or difference required for significance, for different effective sample sizes
Findings around these levels:
Sub-group comparison
Effective sample size
2006*
Effective sample size
2010
10%/
90%
30%/
70% 50%
England Science co-ordinators 2006 v 2010
244 241 6% 9% 9%
England Primary Teachers 2006 v 2010 153 149 8% 11% 12%
England Secondary Heads of Science 2006 v 2010
149 161 8% 11% 12%
England Secondary Science Teachers 2006 v 2010
226 208 7% 9% 10%
England FE/6th form Heads of Science and Science Teachers 2006 v 2010
173 163 8% 11% 11%
England Science Technicians 2006 v 2010 179 180 8% 10% 11%
5 Please note that we have used the effective sample sizes from the 2010 survey in making these calculations;
effective sample sizes from the 2006 survey were not available to us when making comparisons, so in each
calculation we assumed that the 2006 effective sample sizes would have been the same as the 2010 ones. This
should have only minor impact on the accuracy of our calculations.

D-66
Findings around these levels:
England science educators 2006 v 2010 266* 266 6% 9% 9%
Non-England science educators 2006 v 2010
58* 58 14% 18% 18%
Sub-group comparison
Effective sample size England
Effective sample size Non-England
10%/90%
30%/70% 50%
England science educators v Non-England science educators 2010
266 58 10% 14% 15%
* Effective base sizes from the 2006 survey have been estimated based on those in the 2010 survey.
E-1
Annex E: Relationship between usage of SLCs and attainment in schools
Introduction
E.1 During the course of the evaluation we undertook additional data analysis to identify whether
there were any emerging patterns between attendance at SLC and school performance. For
secondary schools, the following performance indicators were identified:
science attainment using the Key Stage 4 measurement of the proportion of pupils
achieving two grades A* - C which cover the Key Stage 4 science programme of
study
overall attainment using the Key Stage 4 measurement of the proportion of pupils
achieving five or more grades A*-C including English and Maths GCSEs.
E.2 The secondary science attainment we used related to 2009 and 2010. The final secondary
school variable which we used is the proportion of pupils who were eligible for free school
meals6. We have used free school meals as a proxy poverty measure. This can give an
indication of the type of schools which are using the SLCs: is it schools with, overall, a pupil
intake from better off backgrounds, or schools with higher numbers of pupils from poorer
households?
Attendance at SLCs
E.3 For the period September 2006 to March 2009, data for all enrolments by SLC event was
downloaded from the SLC portal. This gave details of all participants in courses over this
period. Using this data, all participating educators’ schools were identified. Enrolments which
were not confirmed as attendances were excluded from the analysis. Secondly, schools for
which KS4 data were not available (e.g. because of the risk of disclosing personal
performance data in the case of schools with a small number of pupils sitting GCSEs) were
also excluded from the analysis.
E.4 Schools were then assigned to three categories:
high users - 15 or more attendances (667 schools)
medium users - 5 to 14 attendances (1,202 schools)
low users - 1 to 4 attendances (914 schools).
E.5 Comparing SLC attendance against each of the variables identified above allowed us to
identify whether there were any relationships between uptake of SLC courses and the other
measures. While we draw no conclusions on causality, for example whether SLC attendance
leads to improvements in school performance, the impact analysis is nonetheless a worthwhile
exercise which helps answer questions about the types of schools which use the SLCs such as:
6 Free school meal data available by school for 2002, 2003 and 2004 from:
http://www.dcsf.gov.uk/foischeme/subPage.cfm?action=collections.displayCollection&i_collectionID=157

E-2
is there a relationship between SLC network usage and attainment in science?
is it schools with already high levels of achievement in science or schools who are
trying to catch up which are using the SLC network?
is it schools which are generally good that use the network, as measured by the
overall attainment at KS4?
is there a difference between improvements in science attainment and overall
attainment for SLC network users?
can we draw any conclusions about use of SLCs by schools according to how well off
their catchment areas are?
SLC Network attendance and attainment in science
E.6 In order to identify whether there was a link between SLC usage and science attainment, we
plotted all secondary schools which had used the SLC network between 2006 and 2009
against their performance in science at KS4 in 2009 and 2010, with the different time periods
intended to capture effects as new approaches were introduced in schools following
attendance at an SLC.
E.7 Figure E-1 maps science attainment against the number of SLC visits that each school had
undertaken (this could be one teacher attending multiple courses or a number of teachers
attending a single course - we have simply taken the total number of attendance days of
educators from each school) between 2005 and 2009. As with our previous findings for 2007
and 2008, the linear trend line for both 2009 and 2010 shows that there was a (weak) link
between SLC network usage and science attainment: as usage of the SLC network increases,
the proportion of pupils achieving two grades A-C* which cover the KS4 science programme
increases. The association is fairly weak, with the 2008 data generating the highest R2 value,
equal to 0.004.7 By its nature, association does not prove causality i.e. that involvement with
the SLC network leads to increased performance in science.
7 The model developed by NAO was also reported to have weak explanatory power, perhaps indicating the wide
range of factors at play in determining school performance.

E-3
Figure E-1: Relationship between SLC visits and KS4 science attainment
2009
2010
Source: SQW

E-4
Science Learning Centre Network Attendance and change in science attainment
E.8 It was also possible to map the change in a school’s average KS4 science attainment against
their attendance at SLC courses. The science performance data used related to change
between 2007 and 2009 and change between 2007 and 2010.
E.9 Table E-1 shows the average KS4 science attainment for 2007 to 2010. For all mainstream
secondaries in England, the average proportion of pupils achieving two grades A* - C which
cover the Key Stage 4 science programme of study was 53.7% in 2009 and 60.3% in 2010. In
2007, low and medium use schools performed slightly below the national average but high
use schools outperformed the average. In 2008, only low use schools underperformed
compared to the average but medium and high use schools outperformed the national average.
By 2010, low, medium and high use schools all, on average, outperformed the English
average. As such, it appears that schools with have higher attainment in science are more
likely attend SLCs.
E.10 Between 2007 and 2010, the average percentage point improvement across all English
maintained secondaries in the proportion of pupils achieving two grades A* - C which cover
the Key Stage 4 science programme of study was 10%. Again, the percentage point
improvement among SLC Network using schools is higher; low using schools saw a 17%
point increase, medium using schools achieved a 16% point increase and high using schools
saw a 12% point increase. This would suggest that SLC using schools have been
improving their science attainment faster than the national average, and this despite
beginning from a higher base.
Table E-1: Average KS4 science attainment (% of pupils achieving two grades A* - C which cover the Key Stage 4 science programme of study)
2007 2008 2009 2010 % point change 2007-10
All England mainstream schools 50% 50% 54% 60% 10%
High use schools 52% 54% 57% 64% 12%
Medium use schools 48% 50% 56% 64% 16%
Low use schools 45% 47% 54% 62% 17%
Source: DfE performance tables data
E.11 Although these results are positive, there are a number of caveats that need to be recognised:
there is limited data on which to base the improvements in science attainment: one
“good” or “bad” year could easily skew the results and not reflect underlying
improvements in teaching and learning quality which will only be apparent by
investigating longer run changes in attainment
this is by no means a statistical model: there are many other variables which will
influence attainment in science aside from use of SLC resources. Bearing in mind that
this analysis does not provide any comment on causality, but it does suggest
relationship between SLC usage and improved performance in science, both over
time and compared to the national average.

E-5
Comparing overall attainment and science attainment
E.12 A further question is how far schools which use the SLC Network are improving in science
alone or are the improvements in science attainment (as outlined above) part of a wider trend
within these schools, e.g as part of an overall school improvement . By comparing the
percentage point improvement in science and overall attainment between 2007 and later
years, we can go some way to answering this question.
E.13 Table E-2 presents comparable KS4 data across schools. It suggests a fairly even pattern of
improvement across the different SLC user groups. This contrast with the Table E-1, which
suggested a faster rate of improvement for SLC using schools; again suggesting a positive
association between attainment and usage.
Table E-2: Average KS4 attainment (% of pupils achieving five + grades A* - C including English and Maths GCSEs)
2007 2008 2009 2010 % point change 2007-10
All England mainstream schools 47% 48% 50% 54% 7%
High use schools 52% 54% 55% 59% 7%
Medium use schools 49% 51% 53% 57% 8%
Low use schools 48% 49% 52% 56% 8%
Source: DfE performance tables data
E.14 Between 2007 and 2009 and 2007 and 2010, there was a greater improvement in science
attainment compared to overall attainment across England. However, among SLC using
schools, there were larger improvements in science attainment compared to overall
attainment. This suggests that while science attainment across England is improving at a
faster rate than overall attainment, those schools which use the SLC are seeing even
greater improvements in science than the average across England.

E-6
Figure E-2: 2007 to 2009 and 2007 to 2010percentage point improvements in science and overall attainment at KS4
Source: SQW

E-7
SLC network usage and poverty
E.15 A further interesting line of investigation was comparing the take up of courses by schools
based in more and socio-economically less well-off catchment areas. Using the proportion of
pupils who are eligible for free school meals as a proxy, it was possible to map this
measurement of poverty against SLC usage.
E.16 Based on the 2004 data available, the average proportion of pupils who were eligible for free
school meals across all schools (including secondary and primary) is 18%. Schools using
SLCs had lower proportions of pupils eligible for free school meals: 15% of low use schools’
pupils were eligible for free school meals, 14% of pupils attending medium use schools were
eligible and only 12% of pupils at high use schools were eligible. Figure E-6 also shows that
the range of eligibility tightens dramatically as the number of SLC visits increases. For
example, among schools which had attended more than 40 SLC courses, there were very few
which had an above average proportion of pupils eligible for free school meals.
E.17 This evidence provides a consistent finding: schools which have high SLC usage tend to have
a lower proportion of pupils who are eligible for free school meals. Although this was not a
perfect proxy for poverty, it does suggest that it is schools located in socio-economically
better off catchment areas which are getting involved with the SLC Network. This may have
consequences for future targeting of harder to reach schools which are located in poorer
catchment areas.
Figure E-3: Free school meal eligibility and SLC usage
Source: SQW Consulting
England average
0%
10%
20%
30%
40%
50%
60%
70%
80%
90%
100%
0 10 20 30 40 50 60 70 80
Number of SLC visits (05 - 09)
Pro
port
ion o
f pupils
know
n t
o b
e e
ligib
le f
or
free s
chool
me
als
(2004)
High use schools Medium use schools Low use schools

E-8
Summary of findings from analysis
there is an apparent association between SLC usage and attainment in science; as use
of the network increases, so does attainment in KS4 science
schools attending the SLCs appear to show attainment in science increasing at a faster
rate than both their own school performance and science attainment in non-attenders
schools located in socio-economically better off catchment areas seem to be more
involved with the SLC Network than schools located in poorer catchment areas. This
may have consequences for future targeting of harder to reach schools which are
located in poorer catchment areas.

F-1
Annex F: Locations of Science Learning Centres

Ref: DFE-RR
ISBN: 978-1-78105-186-3
©
2012