Embed Size (px)
Citation preview

1
Date 25/09/2019
Evaluation of Biodiversity 2020
Evaluation Report
A report submitted by CEH and ICF
Authors: Charlotte Hawkins, Liza Papadopoulou, Michael Pocock, Rupert Haines and Nick Isaac

Evaluation of Biodiversity 2020
2
Title Evaluation of Biodiversity 2020
Client Defra
CEH contact details Nick Isaac
CEH Wallingford Maclean Building Benson Lane Crowmarsh Gifford Wallingford OX10 8BB e: [email protected]
Author Charlotte Hawkins (CEH), Michael Pocock (CEH), Liza Papadopoulou (ICF), Rupert Haines (ICF) and Nick Isaac (CEH)
Date 31/07/2019
This report is the copyright of Defra and has been prepared by CEH under contract to Defra. The contents of this report may not be reproduced in whole or in part, nor passed to any other organisation or person without the specific prior written permission of Defra.
CEH has used reasonable skill and care in checking the accuracy and completeness of information supplied by the client or third parties in the course of this project under which the report was produced. CEH is however unable to warrant either the accuracy or completeness of such information supplied by the client or third parties, nor that it is fit for any purpose. CEH does not accept responsibility for any legal, commercial or other consequences that may arise directly or indirectly as a result of the use by CEH of inaccurate or incomplete information supplied by the client or third parties in the course of this project or its inclusion in this project or its inclusion in this report.

Evaluation of Biodiversity 2020
3
Contents Contents ...................................................................................................................................... 3
List of Abbreviations and Acronyms .............................................................................................. 5
Executive Summary ...................................................................................................................... 7
1 Introduction ....................................................................................................................... 19
1.1 Purpose and scope of the evaluation .................................................................................... 19
1.2 Overview of Biodiversity 2020 .............................................................................................. 20
2 Evaluation framework ........................................................................................................ 24
2.1 Intervention logic .................................................................................................................. 24
2.2 Evaluation questions ............................................................................................................. 24
2.3 Evaluation methodology ....................................................................................................... 26
3 Progress against the Strategy Outcomes ............................................................................. 29
3.1 Outcome 1 ............................................................................................................................. 29
3.2 Outcome 3 ............................................................................................................................. 30
3.3 Outcome 4 ............................................................................................................................. 30
4 Evaluation findings: Theme 1 .............................................................................................. 37
4.1 Key findings for Theme 1 (A more integrated large-scale approach to conservation on land) ………………………………………………………………………………………………………………………………………….37
4.2 Introduction to Theme 1 ....................................................................................................... 39
4.3 Priority Action 1.1: Establish coherent and resilient ecological networks ............................ 40
4.4 Priority Action 1.3: Recovery of Priority species ................................................................... 60
4.5 Priority Action 1.4: Conserving Agricultural Genetic Diversity .............................................. 74
5 Evaluation findings: Theme 2 .............................................................................................. 79
5.1 Summary of key findings for Theme 2 (Putting people at the heart of biodiversity policy) . 79
5.2 Priority Action 2.1: Engaging people in biodiversity and the wider natural environment ... 80
5.3 Priority Action 2.2: Incorporating biodiversity values into decision-making ........................ 91
5.4 Priority Action 2.3: New and innovative financing mechanisms ......................................... 104
6 Evaluation findings: Theme 3 ............................................................................................. 111
6.1 Key findings for Theme 3 (reducing environmental pressures) .......................................... 111
6.2 Introduction to Theme 3 ..................................................................................................... 112
6.3 Q1. What actions and activities have been delivered? ....................................................... 112
6.4 Q2. Have the targeted environmental pressures been reduced? ....................................... 112
6.5 Q3. What progress has been made towards integrating biodiversity into the work of key sectors? ........................................................................................................................................... 117

Evaluation of Biodiversity 2020
4
6.6 Q4. What factors have influenced progress, and what lessons can be learnt for future activities that seek to integrate biodiversity thinking in order to reduce environmental pressures? 119
7 Evaluation findings: Theme 4 ............................................................................................. 122
7.1 Key findings for Theme 4 (improving our knowledge) ........................................................ 122
7.2 Introduction to Theme 4 ..................................................................................................... 123
7.3 Q1. What progress has been made, and what has influenced progress towards: ............. 123
7.4 Q2. What lessons can be learnt for future activities that aim to improve knowledge? ..... 128
8 Conclusions ....................................................................................................................... 130
8.1 Strategy objectives, targets and progress evaluation ......................................................... 130
8.2 Resources, planning and prioritisation ................................................................................ 131
8.3 Working together, engagement and communication ......................................................... 132
8.4 Regulatory and policy drivers, and incentives ..................................................................... 133
8.5 Integration of biodiversity across sectors and policy areas ................................................ 134
List of Annexes .......................................................................................................................... 136

Evaluation of Biodiversity 2020
5
List of Abbreviations and Acronyms AES Agri-environment Scheme
AONB Area of Outstanding Natural Beauty
CaBA Catchment-based Approach
CBD Convention on Biological Diversity
CEH Centre for Ecology and Hydrology
CS Countryside Stewardship
CSF Catchment Sensitive Farming
DBPB Defra’s Biodiversity Programme Board
DEFRA Department for Environment, Food and Rural Affairs
EA Environment Agency
EKN Ecosystems Knowledge Network
EMS Environmental Management Systems
EMTF Ecosystem Markets Taskforce
ES Environmental Stewardship
FAnGR Farm Animal Genetic Resources Committee
FC Forestry Commission
GES Good ecological status
GHGAP Greenhouse Gas Action Plan for Agriculture
ICF ICF Consulting Services Ltd
IFM Innovative Financing Mechanism
INNS Invasive non-native species
IPENS Improvement Programme for England’s Natura 2000 Sites
LGS Local Green Space
LNP Local Nature Partnership
MENE Monitoring of Engagement with the Natural Environment
MLG Major Landowners Group
NBN National Biodiversity Network
NCC Natural Capital Committee
NE Natural England
NERC Act Natural Environment and Rural Communities Act, 2006
NGO Non-Government Organisation
NIA Nature Improvement Area
NLHF National Lottery Heritage Fund

Evaluation of Biodiversity 2020
6
NNR National Nature Reserve
NP National Park
PA Priority Action
PEG People Engagement Group
PES Payment for Ecosystem Services
RBMP River Basin Management Plans
RDPE Rural Development Programme for England
S41 Species listed under Section 41 of the NERC Act. These are priority species.
SAC Special Areas of Conservation
SPA Special Protection Areas
SSSI Site of Special Scientific Interest
SRP Species Recovery Programme
TBG Terrestrial Biodiversity Group
TEPoP Terrestrial Evidence Partnership of Partnerships
TSDA Terrestrial Surveillance Development and Analyses
UKPGR UK Plant Genetic Resources Committee
WFD Water Framework Directive
Evaluation of Biodiversity 2020
7
Executive Summary Background and objectives In the 25 Year Environment Plan1, published in 2018, the Government committed to publishing a new strategy for nature to take forward international commitments on biodiversity and build upon the current Strategy, ‘Biodiversity 2020: a Strategy for England’s wildlife and ecosystem services’2 (hereafter ‘Biodiversity 2020’ or the ‘Strategy’). This report provides an evaluation of the outcomes and actions under Biodiversity 2020 to provide an evidence base for ensuring any new strategy is targeted and effective.
The evaluation aimed to:
1. assess progress towards the Outcomes set out in Biodiversity 2020 (relating to land and freshwater only);
2. evaluate what worked well and why, and the factors that have influenced progress;
3. identify lessons and opportunities to improve delivery in the future (i.e. under a new strategy).
The Strategy grouped action under four Themes, to contribute to the Outcomes (see Table E1 for detail of Outcomes):
• Theme 1 – “A more integrated and large-scale approach to conservation”
• Theme 2 – “Putting people at the heart of biodiversity policy”
• Theme 3 - “Reducing environmental pressures”
• Theme 4 – “Improving our knowledge”
Within each Theme, the Strategy outlined several Priority Actions describing priority areas of work
Approach and method The evaluation was carried out at a Theme level. Evaluation was based on: (i) a synthesis of existing quantitative indicators, (ii) evidence from evaluations and reports of activities undertaken since 2011, and (iii) expert opinions drawn from questionnaires, interviews, and four workshops with stakeholders.
The workshops were a key component of the evaluation, and comprised participants from the project team, Defra, other government agencies (usually involved in delivery of activities directly supporting the Strategy), NGOs, businesses (Theme 2) and research and academia. Facilitated discussions amongst workshop participants provided further insight into progress and the factors that have influenced progress, drawing on participants’ experiences and knowledge.
More information on the approach and methods can be found in Section 2.3.
1 HM Government (2018) A Green Future: Our 25 Year Plan to Improve the Environment. https://assets.publishing.service.gov.uk/government/uploads/system/uploads/attachment_data/file/693158/25-year-environment-plan.pdf 2 HM Government (2011) Biodiversity 2020: A Strategy for England’s wildlife and ecosystem services. https://www.gov.uk/government/uploads/system/uploads/attachment_data/file/69446/pb13583-biodiversity-strategy-2020-111111.pdf

Evaluation of Biodiversity 2020
8
Progress towards Strategy Outcomes
A summary of progress against the Outcomes based on quantitative indicators, is shown in Table E1 below. Further details on progress towards Outcomes can be found in Section 3.
Table E 1 Summary of progress towards Strategy Outcomes
Outcome Assessment
1A3 90% of priority habitats (PH) in favourable or recovering condition
In 2011 47.2% of recorded priority habitat was in favourable or recovering condition (England Biodiversity Indicator 2a)4, in March 2019 this had increased to 64.2%. A separate target of 70% of woodland was later set, to reflect delivery practicalities5, to which 49% of qualifying woodland is under management. If woodland was excluded from the overall assessment, 72% of priority habitat would be in favourable or recovering condition. Whilst there has been useful progress there has been little change since 2015, with delivery at 64.9% in 2015/16 and 64.4% in 2016/176. In short, there has been progress in improving the status of priority habitat, however this is insufficient to meet the target by 2020.
At least 50% of SSSIs in favourable condition
In 2011, 36.6% of SSSIs were in favourable condition (England Biodiversity Indicator
1b)4 which by March 2019 rose to 38.8%5, an increase of 2.2%. There has been only
small progress in increasing the percentage of SSSIs in favourable condition, which is insufficient to meet the target by 2020.
At least 95% of SSSIs in favourable or recovering condition
In 2011, 96.6% of SSSIs were recorded in favourable or recovering condition (England
Biodiversity Indicator 1b)4, this fell to 93.5% as of March 2019. This decrease reflects
3,614 ha recorded as no longer recovering in 2017/18, due to the latest evidence that some existing measures will be insufficient to achieve favourable condition;
mainly water quality remedies over large estuarine and coastal sites’6. However, the
shortfall is small compared to that for the favourable condition target and recording against this target tends to fluctuate. Having said this the target risks not being met in 2020.
1B3 No net loss of priority habitat and an increase in the overall extent of priority habitats by at least 200000 ha
All increases in the extent of priority habitat since 2011 count towards the target. In January 2015, delivery was reported at 60,377 Ha7 however as of January 2019 154,000 ha of priority habitat had been created, or land brought into management
to create priority habitat. This represents 77% of target5. Increases since 2015 partly
reflect inclusion of new data. Despite significant progress, this is insufficient to meet the target in 2020 (Additionally, it has not been possible to establish mechanisms to report habitat losses and therefore assess ‘no net loss’).
1C3 At least 17% of land and inland water, especially areas of particular importance for biodiversity and ecosystem services, conserved through effective, integrated and joined up approaches to safeguard biodiversity and ecosystem services
Outcome 1C, a process- focused outcome, was interpreted as a commitment to taking an Ecosystem Approach in the landscape scale delivery of the strategy’s
targets for terrestrial biodiversity6. There has been significant progress towards
implementation of an Ecosystems Approach, using an agreed methodology, in National Parks and AONBs. Both National Parks England and The National Association for AONBs have undertaken projects to support National Parks and AONBs to embed and apply the Ecosystem Approach for biodiversity and public benefits. Once ‘self- assessment’ work by the Protected Landscape family has been completed and embedded into their management plans, the area of National Parks and AONBs embedding an ecosystem approach should meet the 17% target in due course but this is unlikely before 2020.
3 Outcome 1 is: ‘By 2020, measures put in place so that biodiversity is maintained and enhanced, further degradation has been halted and where possible, restoration is underway, helping deliver more resilient and coherent ecological networks, healthy and well-functioning ecosystems, which deliver multiple benefits for wildlife and people’, including the targets in 1A-D shown in Table E1. 4 England Biodiversity Indicators, available at https://www.gov.uk/government/statistics/england-biodiversity-indicators. 5 Natural England Paper 44.2B - Biodiversity 2020 Outcome 1 Habitats and Ecosystems – Progress update, presented to DBPB Meeting 24th July 2019. 6 Natural England Paper 41.2B - Biodiversity 2020 Outcome 1 Habitats and Ecosystems – Progress update, presented to DBPB Meeting 5th July 2018. 7 TBG Progress report TBG20-3b, 16th March 2016

Evaluation of Biodiversity 2020
9
Outcome Assessment
including through management of our existing systems of protected areas and the establishment of nature improvement areas.
1D3 15% of degraded ecosystems restored as a contribution to climate change mitigation and adaptation.
For this outcome, targets representing 15% of the baseline have been set across broad habitat types. For terrestrial coastal and wetland areas a target of 153,581ha was set which as of March 2019, 93,141 ha was underway or completed, equivalent
to 60.6% of the target5. A target of 161,135 ha was set to represent 15% of the
baseline for open freshwater and transitional and coastal water habitats which 1,430 ha was under restoration or completed as of March 2019, equivalent to 0.9% of
target5. Woodland areas have not yet been assessed as the methodology is under
development5. Under the current assessment some useful progress has been made
but this is insufficient to meet the target in 2020.
3
By 2020, we will see an overall improvement in the status of our wildlife and will have prevented further human-induced extinctions of known threatened species.
The assessment of progress has been made on the basis of: changes in the distribution and numbers of well-monitored species, notably many birds and butterflies, and some plants and moths; progress in the execution of actions identified by the expert Taxon Groups as integral to the recovery of Priority Species; the position of Priority Species on their ‘species recovery curve’; International Union for Conservation of Nature (IUCN) status assessments to provide an overall evaluation of the risk of extinction for a large number of species; and, the status of species on the list of those likely to be lost from England by 2020 using a definition that preventing ‘human-induced extinctions of known threatened species’ is considered as equivalent to not knowingly allowing or causing the loss of the last wild population of any English native species from England’.
The England Biodiversity Indicators show across taxon groups the picture is mixed (see Section 3 Table 1), with 6 out of 10 indicators showing significant long-term declines and only 2 (bat populations and wintering waterbirds) showing significant increases in the long-term. In the short term, four out of ten indicators show significant declines, with the others showing no significant trend. Of the 3759 actions identified as priority actions to aid the recovery of priority species 3% have been completed whilst another 38% are underway (as of Dec 2018). Furthermore, of the 670 species assessed in 2006 and 2014, 34.3% had moved along their recovery
curve by at least one step (last assessed in 2014)8. Of the 9276 species assessed
against International Union for Conservation of Nature (IUCN) status criteria, approximately 15% are threatened; when looking within taxonomic groups, between 10 and 43% are threatened8. Expert Taxon Groups have advised that 361 species are
at high risk of being lost from England by 20208. A total of 161 of these are listed as
Priority Species. Some have been lost from England including Golden Eagle, Dotterel, Golden Oriole, Witham Orb Mussel, and the fly Dolichopus melanopus.
Whilst major knowledge gaps remain regarding the number and trends of threatened species there is evidence to show ongoing decline, though there are some limited cases of progress being made for individual species. However, there has been insufficient progress to improve the overall status of wildlife in England and so to meet the outcome. Though not all species have had their risk of extinction assessed and the evidence base is partial, there is however evidence of some national extinctions in England over the timeframe of Strategy.
8 Natural England Paper 41.3 - Biodiversity 2020 Outcome 3 Species – Progress update, presented to DBPB Meeting 5th July 2018

Evaluation of Biodiversity 2020
10
Outcome Assessment
4 By 2020, Significantly more people will be engaged in biodiversity issues, aware of its value and taking positive action
There have been positive movement in some indicators, for example the proportion of adults taking visits in the natural environment at least once a week increased, from 54% in 2009/10 to 62% in 2017/189; and the proportion of adults choosing to walk or cycle instead of using their car, when they can, increased from 40% to 48% over 2009/10-2017/1810. Other indicators, for example England Biodiversity
Indicator 14 on taking action for the natural environment4 showed no or little
positive change. There is no update for England Biodiversity Indicator 13 on ‘awareness, understanding and support for conservation’ since 2015, so it is not possible to determine progress. Overall there are some limited signs of progress however It is not possible to make a full assessment if the outcome will be achieved, as the target for ‘significantly more people’ has not been defined.
Evaluation Key Lessons
Through the evaluation, we sought to understand the factors that had supported or hindered progress towards the Strategy Outcomes. The following eleven key lessons were identified, because they were particularly important for a Theme, or occurred through several Themes.
Strategy objectives, targets and progress evaluation
KL1. Clearly communicable, specific, measurable targets support action, particularly when they are scalable and have stakeholder buy-in.
• Experts reported that a lack of clear, specific, measurable targets leads to a lack of
clarity over the actions needed and who is accountable for ensuring Outcomes are
met. This results in a lack of action. Targets which are specific, clearly communicable,
and linked to the actions needed to achieve them, are easier to engage stakeholders
with, encouraging stakeholder action (see Sections 4.3.8, 4.4, 6.6). Furthermore,
experts said that intermediate targets or milestones would support more effective
delivery because they allow interim reflection on progress (Section 4.3.8).
• Experts said that scaled targets, to regional and local levels, enable the setting of local
priorities and objectives, which aids local planning and motivates local action towards
national goals (see Sections 4.3.7, 4.3.8 and Annex 1).
KL2. The lack of monitoring and evaluation capacity hindered progress assessment, and
progress itself.
• The evaluation highlighted several areas where there has been a lack of monitoring or
metrics aligned to the Outcomes For example, there is a lack of up-to-date data on: (i)
condition of SSSIs (Section 4.3.5), (ii) condition of priority habitat outside of SSSIs and
AES-management (Section 4.3.3), (iii) position of Priority species along their recovery
curve (Section 4.4.3), and (iv) loss of priority habitat (Section 4.3.3); there is no
meaningful set of monitoring indicators associated with Theme 2.
9 Natural England (2018). Monitor of Engagement with the Natural Environment. The national survey on people and the natural environment. Headline report 2018. 10 Natural England (2018). Monitor of Engagement with the Natural Environment. The national survey on people and the natural environment. Headline report 2018.

Evaluation of Biodiversity 2020
11
• Experts indicate that a lack of effective monitoring hinders progress. It limits
knowledge of current status and management required and hence effective planning
and resourcing (Section 4.3.5, 4.4.4)
• Where monitoring and evaluation enables progress to be demonstrated, this builds
confidence in the approach, enhances stakeholder engagement and uptake, and
improves delivery. Ongoing evaluation also enables evidence-based activity
improvements during implementation. For example, the Catchment Sensitive Farming
programme demonstrates how ongoing evaluation has led to improved delivery (See
Annex 5 Sections 1.3.3.2.4 and 2.2).
• There has been only partial monitoring and evaluation coverage of Strategy actions.
Where it does occur, evaluation is rarely resourced beyond the end of a formal activity,
which hinders assessment of their long-term contribution towards the overall
Outcomes of the Strategy.
Resources, planning and prioritisation
KL3. Long-term funding supports progress
• Biodiversity requires sustained action to show measurable change, especially at large
spatial scales. Experts said long term funding enables more effective planning for
action across extended time-scales (Section 4.4.5, 4.5.4).
• Long term funding for AES has manifested in significant contribution towards delivery
of Outcome 1 (see Annex 1 Table 1.7 and Figure 2.4).
• Experts said that long-term planning and resourcing signals commitment by
government, which can build confidence and facilitate participation by other
stakeholders.
• Long-term resourcing facilitates continuity in project staff, enabling effective
relationships to be built with stakeholders, which experts said are important to
support uptake of action by stakeholders (see Section 4.3.6, 4.3.8, 4.4.4).
KL4. Progress is hindered by a lack of spatial planning and targeting.
• Experts strongly felt that a lack of spatial planning for biodiversity has hindered
progress, by limiting the integration of habitat creation, restoration and improvement
goals into local and regional planning, and thus limiting action (see Section 4.3.8 and
Annex 1.2).
• Evidence from literature and experts suggests the lack of spatial targeting of uptake of
AES prescriptions, hindered the contribution of AES to achieving Strategy Outcomes
(see Section 4.3.6 and Annex 2.2).
KL5. There is limited capacity to access and interpret research, tools and data at local
scales
• Experts suggested a lack of capacity, in terms of local experts to advise stakeholders
and landowners, hinders the integration of the latest data and evidence into local
planning and decision-making (see Section 7).

Evaluation of Biodiversity 2020
12
Working together, engagement and communication
KL6. Partnerships and collaborative working support progress
• Partnerships among stakeholders have many benefits, including shared ownership of
activities leading to increased collective resources (e.g. Government investment in the
Species Recovery Programme elicited a two-fold additional investment in cash or in
kind from partners – see Section 4.4), and sharing of expertise and knowledge, as
evidenced in the NIA evaluation (See Annex 1).
• Experts suggested targeted/tailored communication of these benefits to stakeholder
groups can encourage stakeholder buy-in.
• Involving the right people in partnerships, including those able to influence or
authorise the delivery of action (for example landowners), and having a dedicated
coordinator, was considered by experts and in the literature to be an important factor
of partnership success (See Section 4.3.4 and Annex 1).
KL7. One-to-one engagement with stakeholders is important
• One-to-one engagement and provision of advice and guidance to land-owners
supports: (i) uptake of incentive schemes, (ii) appropriate targeting of agri-
environment agreements, and (iii) correct implementation of agri-environment
management actions. This is strongly supported by expert opinion, and evidenced
through the literature, which suggests one-to-one advice was key to improving uptake
and effectiveness of AES (see Section 4.3.6), and is a key component of success in the
Catchment-Sensitive Farming programme (see Section 6.6 and Annex 5).
KL8. Lack of communication infrastructure hinders engagement and limits sharing of
knowledge and best practise
• Experts suggested that a lack of effective central communication pathways (e.g. a
dedicated website) hampers engagement and action. For example, the inaccessibility
of the list of actions for the recovery of priority species, limited the effectiveness of
this list for engaging stakeholders and driving collective action across spatial scales
(see Section 4.4.5).
• Sharing of knowledge and best practise between stakeholders at multiple scales is
hindered by lack of infrastructure for storing and disseminating information, which can
lead to a lack of efficiency, and ‘re-inventing the wheel’ (See Sections 4.4.5 and 7, and
Annex 2 and Annex 6).
• The extent to which research is informed by delivery needs is hindered by the lack of
links between the researcher and practitioner communities (see Section 7 and Annex 6)
Regulatory and policy drivers, and incentives
KL9. Regulatory approaches and statutory frameworks provide confidence to stakeholders and can help drive action to support progress towards Outcomes.
• A strong mandate (e.g. on local authorities to improve air quality – See Annex 5) or a regulatory underpinning (e.g. the Water Framework Directive – See Annex 5) has focussed action and supported progress. Experts suggested that regulatory

Evaluation of Biodiversity 2020
13
approaches help to demonstrate what the government prioritises, thus building confidence for stakeholder investment and action.
KL10. Uptake of incentive schemes and voluntary uptake of action, even when there is a financial incentive, is not sufficient.
• Uptake of some voluntary schemes has been lower than expected: e.g. Countryside Stewardship, voluntary measures under the Campaign for Farmed Environment, and biodiversity offsetting (See Sections 4.3.6, 5, 6.5.3).
• Evidence from experts and literature suggests that support from Government improved uptake of voluntary actions or incentives. Support took many forms: provision of advice, guidance, practical support/capacity building, market infrastructure to reduce the perceived risk of uptake, or through the presence of a clear mandate. Examples include advisors facilitating uptake of AES (see Section 4.3.6 and Annex 1), and a suggested mandatory approach to biodiversity offsetting to improve stakeholder confidence and take-up (see Section 5 and Annex 4).
Integration of biodiversity across sectors and policy areas
KL11. Where there has been integration of biodiversity goals, this has led to action for
biodiversity
• For example, AES have delivered substantial biodiversity improvements (see Section 4.3.6), and there has been significant investment by water companies in environmental improvements to benefit biodiversity (see Section 6 and Annex 5).
• However, workshop participants strongly indicated that in general, a lack of integration of biodiversity goals across sectors and policy areas, has prevented tackling some larger scale issues such as water and air pollution, which will have hindered habitat quality improvement and species recovery (See Annex 1 Section 2.2.4 and Annex 2.2).
• A lack of integration of species recovery goals and conservation of genetic resources into landscape-scale measures such as designated sites and AES was commonly cited by experts as an area preventing further progress (See Section 4.4.4.3, 4.5.4 and Annexes 2 and 3).
• Experts suggested the proliferation of tools for the integration of biodiversity considerations in policy and decision-making can be overwhelming. Guidance can only support users to some extent (See Section 5 and Annex 4).
• Experts suggested better integration of biodiversity across sectors and policy areas would be supported by more consistent methods for the valuation of biodiversity, and through greater focus on biodiversity, rather than nature or the environment more generally (See Section 5.3.3.2, Annex 4, and Annex 5 Section 2.2.4).

Evaluation of Biodiversity 2020
14
Theme level findings
Along with findings across all Themes contributing to the Evaluation Key Lessons, several Theme-specific findings were also identified for each Theme. These are summarised in the sections below.
Key findings for Theme 1: A more integrated and large scale approach to conservation on land (see Section 4 for full evaluation of Theme 1) T1.1 Progress towards the goals of Theme 1 has mostly been ‘minor’. There seems to
have been greater focus on Priority Action 1 (to establish more coherent and resilient ecological networks) than others. This may be because the Strategy focuses on landscape-scale conservation, for which there are specific targets under Outcome 1, unlike other Priority Actions which had no specific targets.
T1.2 Progress has been greater for implementation of activities and processes, rather than achieving the overall aims of the Theme. For example, activities such as establishing Nature Improvement Areas or agreeing actions for priority species were largely delivered, but the overall aims were not (e.g. establishing coherent, resilient ecological networks; improving the condition of SSSIs and priority habitat; improving the status of priority species). Implementing specific actions has had local impacts, but this has not necessarily scaled-up to improvements across large spatial scales, or to measurable improvements in the biodiversity indicators.
T1.3 Lack of evaluation and metrics hinders monitoring and assessment of progress. Some centrally-funded activities were thoroughly evaluated on completion, such as NIAs, but many have not been, e.g. the effectiveness of management of protected sites. Data for several metrics are out-dated, including site condition of SSSIs, condition of priority habitat outside of SSSIs or AES-management, and progress of species along their recovery curve.
T1.4 There has been a lack of a coherent framework for spatially targeting activities under Priority Action 1.1; experts agreed that this hindered incorporation of biodiversity goals into local and regional planning, which hindered progress towards the Strategy Outcomes. Conversely, the development of a prioritised list of actions for the recovery of priority species under PA 1.2 provided a focus for action and resources across stakeholders. Improving the communication and accessibility of the list would further enhance its use for engaging stakeholders at local scales, but there is currently no mechanism for doing this.
T1.5 Where there have been strong and effective partnerships and collaboration, this has supported progress by providing the greater scale of activity valuable to better access funding, resources and knowledge. For example, Government investment in the Species Recovery Programme elicited a two-fold additional investment in cash or in kind from partners. Conversely a lack of joined up working has been cited as a reason for lack of progress in tackling off-site issues impacting SSSIs. Dedicated project coordinators were considered by experts and literature, to be important in enabling effective partnerships.
T1.6 Advice, guidance and training is important to support effective uptake and correct implementation of agri-environment agreements. AES are a key delivery mechanism for landscape scale conservation; the provision of advice and guidance through one-to-one advisors is crucial for engaging landowners and motivate action, and for the correct implementation of management actions to ensure benefits for biodiversity.

Evaluation of Biodiversity 2020
15
T1.7 Short-term funding hindered the longevity of partnerships, uptake of incentives and efficiency of planning and delivery of action. Partnerships take time to develop and, in the case of NIAs, there is limited evidence of their ongoing sustainability once government funding ceased. Experts said that short-term funding can signal a short-term commitment from Government, which can hinder the building of trust with stakeholders, potentially resulting in a lack of uptake or buy-in. Conversely, where long-term funding has been available, particularly through the commitment of NGO’s to support action for priority species, this has provided stability to support effective planning, building on previous activity to improve progress.
T1.8 Experts agreed that a key challenge for the improvement of habitats and recovery of priority species, is a lack of integration of biodiversity goals across sectors and policy areas, which prevents tackling of some larger scale issues such as water and air pollution. A lack of mechanism to integrate actions to support the recovery of species and to conserve agricultural genetic diversity, into landscape-scale measures such as designated sites and AES, was also cited by experts as a barrier to progress.
Key findings for Theme 2: Putting people at the heart of biodiversity policy (see Section 5 for full evaluation of Theme 2)
T2.1 It is not clear whether there has been any meaningful change in people’s engagement with biodiversity. There has been progress in the delivery of Theme 2 Priority Actions. However, judging the extent of progress is challenging, in part due to insufficient evidence. With regards Outcome 4, which is closely related to Theme 2, there are some indications that awareness has increased and concern for the environment remains relatively high, but there does not appear to have been significant changes in the extent of positive environmental action (particularly environmental action focussed on biodiversity issues) being taken.
T2.2 The People Engagement Group could have provided greater support over a longer period. A ‘People Engagement Group’ was established by Defra, and commissioned useful research on how to engage people. However, the group was dissolved part way through the Strategy implementation period. Stakeholders indicated that the group could have played a more substantive and ongoing role in providing research and supporting partnership working. In general, a wide variety of actions and activities directly seeking to enhance people’s engagement with the environment have been delivered, some with Government support and others independently.
T2.3 Organisations are becoming increasingly aware of green market opportunities, but this is not translating into take-up. Awareness of the opportunities and benefits and availability of tools to help organisation incorporate the value of biodiversity into their decision making, have increased. However, take-up is not widespread. This includes both the private and public sector.
T2.4 Innovative financing mechanisms are not making a meaningful contribution to biodiversity funding. Innovative financing mechanisms are increasingly being trialled. However, they remain innovative and their anticipated potential as contributors to biodiversity funding is not yet being realised.
T2.5 How and with what information people and organisations are engaged is an important determinant of meaningful action. This includes the language used, the framing of the issue and how it relates to the audience, as well as the communication channels and communicators used. The lack of a dedicated communication channel

Evaluation of Biodiversity 2020
16
of virtual space (e.g. website) in support of the Biodiversity 2020 programme was a missed opportunity in raising the profile of actions delivered as part of the programme and in facilitating engagement. In engaging citizens, evidence is increasingly showing the importance of fostering a meaningful ‘connection’ with the natural environment.
T2.6 A number of barriers – real or perceived – remain, which inhibit people and organisations from better taking account of the environment in their decision making and daily lives. These range from uncertainty in whether actions will have the desired effect, including both their environmental and/or economic viability; to how to improve accessibility (for population groups to visit natural areas, or to match financiers with projects); to whether people know what actions to take, or how to take them, and whether the supporting market or physical infrastructure is in place to allow them to do so.
Key findings for Theme 3: Reducing environmental pressures (see Section 6 for full evaluation of Theme 3)
T3.1 There has been mixed progress in reducing environmental pressures; there has been a reduction in emissions of several pollutants, although ammonia emissions have continued to increase; and a reduction in area of land exceeding the critical loads for sulphur and nitrogen. There has also been some progress in increasing the extent of woodland, and land managed under AES. However there has been a reduction in the area of surface water bodies in high or good ecological status. There is mixed evidence for progress in the planning and development sector, with evidence of some local authorities taking action for biodiversity, but also evidence of shortcomings in the way that planning policy is applied and the level of consideration given to biodiversity, particularly with respect to development in AONBs. Despite the progress made, it is clear that pressures across all these sectors continue to adversely impact SSSIs (see Annex 5 Table 1.3).
T3.2 Most activities to reduce environmental pressures are: a) implementation of (new or amended) policies and guidance to address key pressures; or b) incentivising voluntary uptake of action through programmes and initiatives aimed at changing stakeholder behaviour. Many of the processes for reducing pressures have been implemented in the past few years and there is expected to be a long time lag between implementation of policy or uptake of actions, and measurable beneficial outcomes for biodiversity. Therefore, it is too soon to evaluate whether these activities have been effective.
T3.3 There is some evidence that consideration for biodiversity is being increasingly integrated into the work of key sectors, however voluntary initiatives have had mixed uptake, although stakeholder-led initiatives in some sectors have supported progress. There is evidence from literature and expert opinion that uptake of incentive schemes and voluntary initiatives is unlikely to be sufficient to reduce environmental pressures. Uptake of schemes such as Countryside Stewardship, voluntary measures under the Campaign for Farmed Environment, and biodiversity offsetting, for example, have been lower than expected.
T3.4 Effective delivery of advice and guidance supports uptake and implementation of voluntary initiatives. Continuity of projects and project staff aids building

Evaluation of Biodiversity 2020
17
relationships with stakeholders and land-owners, aiding delivery of advice and supporting uptake.
T3.5 Ongoing evaluation of activities supports progress because it allows for evidence-based improvements in delivery and demonstration of success, building stakeholder confidence and improving uptake, as demonstrated by the Catchment Sensitive Farming programme.
T3.6 Where there is a strong mandate (e.g. on local authorities to improve air quality) or regulatory underpinning (e.g. the Water Framework Directive) to reduce pressures, this has led to positive action. The regulatory underpinning is perceived by experts to demonstrate government commitment, and so builds confidence across stakeholders, that supports action. Conversely a lack of regulation, or a lack of capacity to carry out regulation, was cited by experts as a reason for lack of positive action (e.g. following the UK Forestry Standards).
T3.7 Positive public engagement can support progress towards reducing environmental pressures, both through changing individual behaviour (e.g. checking equipment to reduce spread of aquatic invasive species) and through consumers influence on companies (e.g. investment by water companies to reduce impacts on biodiversity). Experts believed that a lack of strategic public communications hinders progress – clear communication involves highlighting interventions and also communicating successes.
Key findings for Theme 4: Improving our knowledge (see Section 7 for full evaluation of Theme 4)
T4.1 There are few quantitative metrics to assess progress towards Theme 4, so the evaluation is largely based on expert opinion.
T4.2 In general, experts believe there is a good evidence base to guide decisions, so in many cases lack of evidence is not what hinders progress, although gaps remain. There is no evaluative evidence of whether external research agendas have helped to fill gaps in understanding and there is mixed opinion whether public sector research is directed to the highest priority issues to deliver the Outcomes and priorities set out in the Strategy (see Section 7.3.1 and Annex 6)
T4.3 Availability of biodiversity monitoring data is growing, through investment in new data collection via earth observation or volunteer schemes, and through enhanced analysis adding value to existing data. However, experts believed that monitoring is not adequate to assess progress towards Strategy Outcomes. This is supported by the evaluation, which found data for several metrics lacking, or out of date (e.g. condition of SSSIs (See Section 4.3.5), condition of priority habitat outside of protected areas or AES management (See Section 4.3.3), movement of species along their recovery curve (See Section 4.4.3)).
T4.4 There is clear progress towards data being more openly-accessible, although experts believe that a lack of resourcing of data providers and data curators hinders the provision of data. However, experts stated that there is often limited capacity to interpret data at and translate research to local scales, and a lack of infrastructure for sharing knowledge and best practice. This hinders the integration of data and evidence into planning and decision-making.

Evaluation of Biodiversity 2020
18
T4.5 A lack of infrastructure for knowledge exchange and communication between researchers and stakeholders hinders understanding of the data and evidence needs of different sectors and stakeholders, and therefore the extent to which research needs are informed by practice.
T4.6 Experts consider that in general, the impacts of interventions are not well monitored or evaluated, which makes it difficult to draw conclusions about the effectiveness of different actions, which can hinder effective decision-making. However, when there is structured monitoring and evaluation built in from the start of projects, this can help to demonstrate their impacts, as shown by the Catchment Sensitive Farming project.

Evaluation of Biodiversity 2020
19
1 Introduction
On behalf of Defra, CEH and ICF undertook an evaluation of ‘Biodiversity 2020: A Strategy for England’s wildlife and ecosystem services’11 (hereafter ‘Biodiversity 2020’). The evaluation was based on a synthesis of existing indicators and evaluative evidence, and a series of expert workshops.
This document presents the draft final report of the evaluation. It is supported by a set of separate annexes which present reviews of evidence available from data and literature, along with findings from expert workshops.
The report is structured as follows:
• Section 2: Evaluation Framework
• Section 3: Progress against Strategy Outcomes
• Section 4: Evaluation findings: Theme 1 – A more integrated and large-scale approach to conservation
• Section 5: Evaluation findings: Theme 2 – Putting people at the heart of biodiversity policy
• Section 6: Evaluation findings: Theme 3 – Reducing environmental pressures
• Section 7: Evaluation findings: Theme 4 – Improving our knowledge
• Section 8: Conclusions
A number of annexes are also included:
• Annex 1: Supporting evidence for Theme 1 PA 1.1 – Establish more coherent and resilient ecological networks
• Annex 2: Supporting evidence for Theme 1 PA 1.3 – Take targeted action for the recovery of priority species
• Annex 3: Supporting evidence for Theme 1 PA 1.4 – Conservation of agricultural genetic diversity
• Annex 4: Supporting evidence for Theme 2 – Putting people at the heart of biodiversity policy
• Annex 5: Supporting evidence for Theme 3 – Reducing environmental pressures
• Annex 6: Supporting evidence for Theme 4 – Improving our knowledge
The evaluation is part of a wider programme of evidence gathering on Biodiversity 2020. Other reports include: a review of progress made towards delivery of outputs related to climate change adaptation and resilience within the Biodiversity 2020 Strategy; and an evaluation of the UK Marine Strategy, through which marine aspects of the Biodiversity 2020 are implemented.
1.1 Purpose and scope of the evaluation
1.1.1 Purpose
Biodiversity 2020 was published in August 2011, building on the Natural Environment White Paper12 and setting out the strategic direction for biodiversity policy to 2020 on land (including rivers and
11 HM Government (2011) Biodiversity 2020: A Strategy for England’s wildlife and ecosystem services. https://www.gov.uk/government/uploads/system/uploads/attachment_data/file/69446/pb13583-biodiversity-strategy-2020-111111.pdf 12HM Government (2011) The Natural Choice: securing the value of nature. http://www.officialdocuments.gov.uk/document/cm80/8082/8082.pdf
Evaluation of Biodiversity 2020
20
lakes) and at sea in England. In the 25 Year Environment Plan13 the Government committed to publish a new strategy for nature building upon Biodiversity 2020, and to evaluate the current Strategy to learn lessons that can strengthen the future strategy.
The purpose of this evaluation was to assess progress towards the Outcomes set out in Biodiversity 2020 (relating to land and freshwater only), and to identify lessons and opportunities to improve delivery in the future (i.e. under a new strategy).
Specifically:
1. What progress has been made towards delivering the Strategy Outcomes?
2. What worked and why? Which actions or activities had the greatest benefit in terms of
delivering the desired Outcomes? And, conversely, what has prevented progress?
3. What lessons can be learned, and opportunities identified for furthering progress under a future strategy?
1.1.2 Scope
Content: The evaluation considered the actions and activities that have taken place under the Strategy since 2011, and the impacts they have had in enabling progress towards achieving the Strategy goals. However, whilst the evaluation focussed on Biodiversity 2020, it was also recognised that a range of initiatives have potentially contributed to achieving the Outcomes of Biodiversity 2020, including activities not explicitly incorporated in the Strategy. The evaluation therefore also considered other key activities which were not specifically stated in Biodiversity 2020. As the evaluation took place in 2018/19, it was not possible to evaluate the entire timeframe of the Strategy until 2020.
Attribution: The evaluation did not focus on determining causal attribution i.e. the extent to which the actions delivered and the observed effects on the Strategy Outcomes can be attributed to the Strategy (including its implementation plan). Rather, the focus was on learning lessons from what has or hasn’t worked well and why, that can inform a future strategy.
Governance: whilst governance may be a relevant component of understanding what works and why with regards particular activities, a wider evaluation of the governance of Biodiversity 2020 was not within the scope of this evaluation. The governance of the Strategy (for managing, coordinating and reporting on delivery of the Strategy) has been the subject of a ‘light-touch’ assessment undertaken by Natural England.
Geography: The Strategy is for England and hence the evaluation focussed on actions and Outcomes of relevance to England. The evaluation addressed the terrestrial and freshwater elements of Biodiversity 2020, but not the marine elements. Activities on the marine aspects of Biodiversity 2020 are primarily delivered through the UK Marine Strategy, which will be reviewed and refreshed separately in 2019.
1.2 Overview of Biodiversity 2020 Biodiversity 2020 is a national Strategy for England’s wildlife and ecosystem services, implementing the Convention on Biological Diversity (CBD) in England. It sets out the Government’s ambition by
13HM Government (2018) A Green Future: Our 25 Year Plan to Improve the Environment. https://assets.publishing.service.gov.uk/government/uploads/system/uploads/attachment_data/file/693158/25-year-environment-plan.pdf

Evaluation of Biodiversity 2020
21
2020 ‘To halt overall biodiversity loss, support healthy well- functioning ecosystems and establish coherent ecological networks, with more and better places for nature for the benefit of wildlife and people’, in line with the CBD Aichi Targets. In accordance with the aim to meet the Aichi targets, the Strategy has four intended Outcomes, which relate to habitats and ecosystems on land; marine habitats, ecosystems and fisheries; species; and people:
• Outcome 1: Habitats and ecosystems on land: ‘By 2020 we will have put in place measures so that biodiversity is maintained and enhanced, further degradation has been halted and where possible, restoration is underway, helping deliver more resilient and coherent ecological networks, healthy and well-functioning ecosystems, which deliver multiple benefits for wildlife and people’, including:
o 1a. Better wildlife habitats with 90% of priority habitats in favourable or recovering condition and at least 50% of SSSIs in favourable condition, while maintaining at least 95% in favourable or recovering condition;
o 1b. More, bigger and less fragmented areas for wildlife, with no net loss of priority habitat and an increase in the overall extent of priority habitats by at least 2000 km2;
o 1c. By 2020, at least 17% of land and inland water, especially areas of particular importance for biodiversity and ecosystem services, conserved through effective, integrated and joined up approaches to safeguard biodiversity and ecosystem services including through management of our existing systems of protected areas and the establishment of nature improvement areas.
o 1d. Restoring at least 15% of degraded ecosystems as a contribution to climate change mitigation and adaptation.
• Outcome 2: Marine habitats, ecosystems and fisheries: Activities on the marine aspects of Biodiversity 2020 are primarily delivered through the UK Marine Strategy, which is being evaluated separately.
• Outcome 3: Species: ‘By 2020, we will see an overall improvement in the status of our wildlife and will have prevented further human-induced extinctions of known threatened species.’
• Outcome 4: People: ‘By 2020, significantly more people will be engaged in biodiversity issues, aware of its value and taking positive action.’
Actions under the Strategy are delivered under four Themes, each of which links to multiple Strategy Outcomes (see Figure 1). Within each Theme, a number of Priority Actions specify the priorities for that Theme and the actions that will be delivered to achieve the aim of the Theme:
▪ Theme 1: A more integrated large-scale approach to conservation on land and at sea. Priority Actions under Theme 1 aim to establish more coherent and resilient ecological networks through integrated landscape scale approaches, along with conserving priority species and agricultural genetic diversity through targeted actions.
• Priority Action 1.1: Establish more coherent and resilient ecological networks on land that safeguard ecosystem services for the benefit of wildlife and people.
• Priority Action 1.3: Take targeted action for the recovery of priority species, whose conservation is not delivered through wider habitat-based and ecosystem measures.
• Priority Action 1.4: Ensure that ‘agricultural’ genetic diversity is conserved and enhanced wherever appropriate.
(Priority Action 1.2 relates to the marine environment and is therefore out of scope of this report)
▪ Theme 2: Putting people at the heart of biodiversity policy

Evaluation of Biodiversity 2020
22
Priority Actions under Theme 2 aim to engage, educate and promote positive behavioral change, as well as changing how biodiversity is valued and seeking new financing mechanisms.
• Priority Action 2.1: Work with the biodiversity partnership to engage significantly more people in biodiversity issues, increase awareness of the value of biodiversity and increase the number of people taking positive action.
• Priority Action 2.2: Promote taking better account of the values of biodiversity in public and private sector decision-making, including by providing tools to help consider a wider range of ecosystem services.
• Priority Action 2.3: Develop new and innovative financing mechanisms to direct more funding towards the achievement of biodiversity outcomes.
▪ Theme 3: Reducing environmental pressures Priority Actions under Theme 3 aim to reduce pressures on the environment by working with key sectors and stakeholders, reforming policies and providing incentives, regulations and guidance to deliver sustainable management of natural resources, whilst ensuring environmental outcomes are integrated into the work of key sectors.
• Priority Action 3.1: Improve the delivery of environmental outcomes from agricultural land management practices, whilst increasing food production.
• Priority Action 3.2: Reform the Common Agricultural Policy to achieve greater environmental benefits.
• Priority Action 3.3: Bring a greater proportion of our existing woodlands into sustainable management and expand the area of woodland in England.
• Priority Action 3.4: Through reforms of the planning system, take a strategic approach to planning for nature within and across local areas.
• Priority Action 3.5: Establish a new, voluntary approach to biodiversity offsets and test our approach in pilot areas
• Priority Action 3.6: Align measures to protect the water environment with action for biodiversity, including through the river basin planning approach under the EU Water Framework Directive
• Priority Action 3.7: Continue to promote approaches to flood and erosion management which conserve the natural environment and improve biodiversity
• Priority Action 3.8: Reform the water abstraction regime to meet water needs and protect ecosystem functioning. Priority Action 3.11: Reduce air pollution impacts on biodiversity through approaches at national, UK, EU and international levels targeted at the sectors which are the source of the relevant pollutants (nitrogen oxides, ozone, Sulphur dioxide, ammonia)
• Priority Action 3.12: Continue to implement the Invasive Non-Native Species Framework Strategy for Great Britain
Priority actions 3.9 and 3.10 relate to the marine environment and are therefore out of scope of this report.
▪ Theme 4: Improving our knowledge Priority Actions under Theme 4 aim to improve the capacity and evidence base for decision making, through supporting research and development, better monitoring and surveillance,

Evaluation of Biodiversity 2020
23
and better access to data. This will support delivery of the Strategy and enable better monitoring of progress towards Strategy Outcomes.
• Priority Action 4.1: Work collaboratively across Defra and the relevant agencies to direct research investment within Government to areas of highest priority to deliver the outcomes and priorities set out in this strategy, and in partnership with the Research Councils and other organisations in the UK and Europe to build the evidence base
• Priority Action 4.2: Put robust, reliable and more co-ordinated arrangements in place, to monitor changes in the state of biodiversity and also the flow of benefits and services it provides us, to ensure that we can assess the outcomes of this strategy
• Priority Action 4.3: Improve public access to biodiversity data and other environmental information – putting power into the hands of people to act and hold others to account. Also communicate progress towards the outcomes and priorities of this strategy and make available information to support decision-making at a range of scales to help others contribute to the outcomes.
Figure 1 The overall structure of The Strategy. Note that Outcome 2 is outside of the scope of this evaluation.
Mission ‘To halt overall biodiversity loss, support healthy well- functioning ecosystems and establish coherent ecological networks, with more and better places for nature for the benefit of wildlife and people’
Outcome 2 - Marine habitats, ecosystems and fisheries
Biodiversity is maintained, further degradation is halted and where possible, restoration is underway, helping deliver good environmental status and clean, healthy, safe productive and biologically diverse oceans and seas.
Outcome 3 – Species
An overall improvement in the status of our wildlife and prevention of further human-induced extinctions of known threatened species.
Outcome 4 – People
Significantly more people engaged in biodiversity issues, aware of its value and taking positive action.
Outcome 1 - Habitats and ecosystems on land
Biodiversity is maintained and enhanced, further degradation is halted and where possible, restoration is underway, helping deliver more resilient and coherent ecological networks, healthy and well-functioning ecosystems, which deliver multiple benefits for wildlife and people.
Theme 1: A more integrated large-scale approach to conservation on land and at sea
Theme 2: Putting people at the heart of biodiversity policy
Theme 3: Reducing environmental pressures
Theme 4: Improving our knowledge
Evaluation of Biodiversity 2020
24
2 Evaluation framework
2.1 Intervention logic
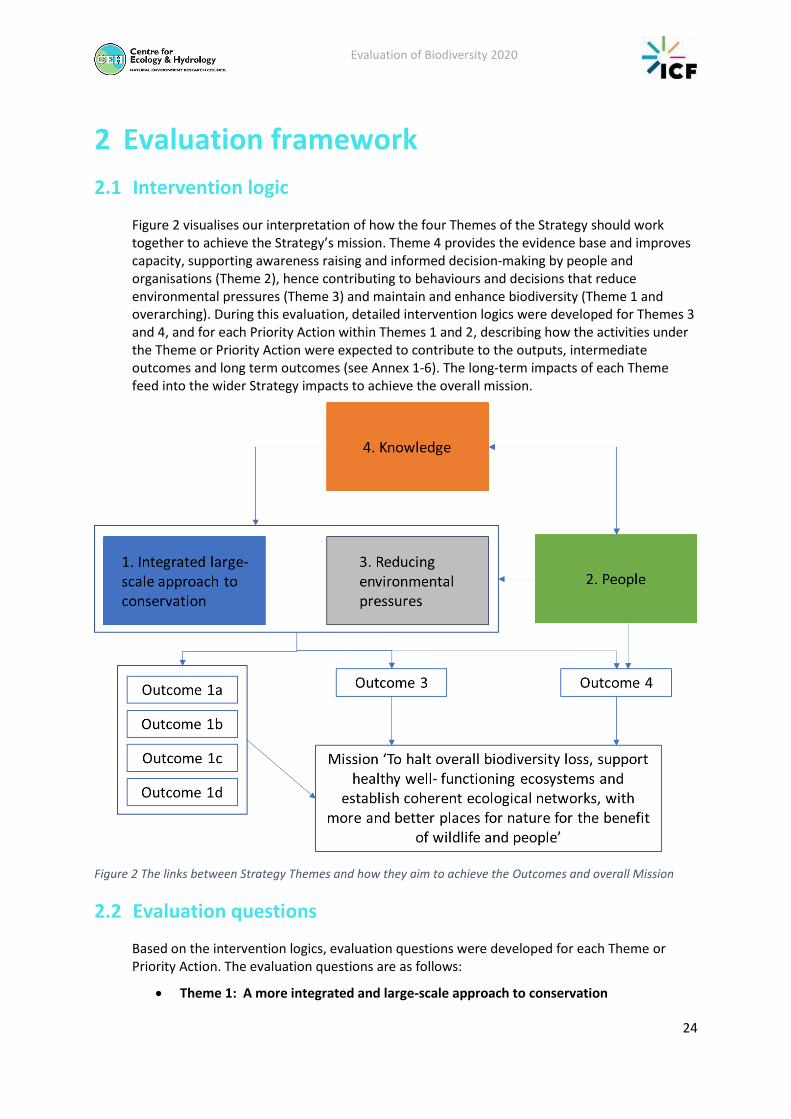
Figure 2 visualises our interpretation of how the four Themes of the Strategy should work together to achieve the Strategy’s mission. Theme 4 provides the evidence base and improves capacity, supporting awareness raising and informed decision-making by people and organisations (Theme 2), hence contributing to behaviours and decisions that reduce environmental pressures (Theme 3) and maintain and enhance biodiversity (Theme 1 and overarching). During this evaluation, detailed intervention logics were developed for Themes 3 and 4, and for each Priority Action within Themes 1 and 2, describing how the activities under the Theme or Priority Action were expected to contribute to the outputs, intermediate outcomes and long term outcomes (see Annex 1-6). The long-term impacts of each Theme feed into the wider Strategy impacts to achieve the overall mission.
Figure 2 The links between Strategy Themes and how they aim to achieve the Outcomes and overall Mission
2.2 Evaluation questions
Based on the intervention logics, evaluation questions were developed for each Theme or Priority Action. The evaluation questions are as follows:
• Theme 1: A more integrated and large-scale approach to conservation

Evaluation of Biodiversity 2020
25
o Priority Action 1.1 – Establish more coherent and resilient ecological networks
1) What actions and activities have been delivered?
2) What progress has been made towards achieving the long-term goal of
establishing more coherent and resilient ecological networks?
3) How effective have partnership approaches been and what factors have influenced progress? What influence have partnership approaches had on delivering the long-term Outcomes? Have they resulted in partners working together to achieve integrated/landscape scale delivery?
4) How effective has management of designated areas been and the public estate been, and what factors have influenced progress?
5) How effective have incentive schemes been and what factors have influenced progress? What influence have incentive schemes had on delivering the long-term Outcomes? Are the schemes ensuring that individual actions are working together at a landscape scale?
6) Which approaches were most effective and how cost-effective are the
different approaches to landscape-scale conservation?
7) What lessons can be learnt for future strategic actions to support the
establishment of more coherent and resilient ecological networks?
o Priority Action 1.3 - Recovery of priority species 1) What actions/activities have been delivered? 2) Has the status of priority species improved? 3) What actions and activities, to include species-specific actions,
legislation and actions to combat wildlife crime, have been effective in supporting the recovery of priority species? What factors have influenced progress?
4) What lessons can be learnt for future strategic actions to support recovery of priority species?
o Priority Action 1.4 – Conservation of agricultural genetic resources 1) What actions/activities have been delivered? 2) What progress has been made towards ensuring conservation of
agricultural genetic resources in England? 3) What factors/actions have improved or hindered the management of
genetic resources? 4) Considering the progress since 2010, what more could be done in
future to conserve and enhance agricultural genetic resources? What opportunities are there, and what are the barriers/challenges that need to be addressed?
• Theme 2: Putting people at the heart of biodiversity policy o Priority Action 2.1 – Engaging people
1) Is there increased awareness and improved understanding of the value of biodiversity?
2) Are more people engaging with the natural environment? 3) Are more people taking positive action for nature? 4) Why have some schemes and initiatives been more effective in
engaging people with the natural environment? o Priority Action 2.2 – Incorporating biodiversity values into decision-making

Evaluation of Biodiversity 2020
26
1) Do businesses and organisations have better awareness of green market opportunities?
2) Has relevant guidance and tools been developed to support integration of natural values in impact assessments? To what extent is that helpful? Are some more helpful for that others and for which audiences - why?
3) Are natural values better integrated into private and public sector decision-making?
o Priority Action 2.3 – Innovative funding mechanisms 1) Are new tools or innovative mechanisms making a meaningful
contribution to overall funding levels for nature? 2) Are there some (tools/financing mechanisms) that worked better that
others? Why / why not? Have they directed more funding towards nature?
1) Theme 3: Reducing environmental pressures
1) What actions/activities have been delivered? 2) Have the targeted environmental pressures been reduced? 3) What progress has been made towards integrating biodiversity into
the work of key sectors? 4) What factors have influenced progress, and what lessons can be learnt
for future activities that seek to integrate biodiversity thinking in order to reduce environmental pressures?
2) Theme 4: Improving our knowledge 1) What progress has been made, and what has influenced progress
towards: a) Filling knowledge gaps and building the evidence base? b) Improving monitoring of biodiversity and enabling assessment of
Strategy Outcomes? c) Improving public access to biodiversity data and other
environmental information? 2) What lessons can be learned for future activities that aim to improve
knowledge?
2.3 Evaluation methodology
The evaluation is based on a review of indicators and evidence from published literature and reports14, combined with insights gained through expert stakeholder workshops, and surveys or interviews with stakeholders. Further details of methodology relevant to the evaluation of each Theme can be found in the relevant Theme annexes.
Quantitative and qualitative evidence from indicators, evaluations and reports of activities undertaken since 2011, were drawn together to respond to the evaluation questions for each Theme or Priority Action. The identification of relevant literature for the review was carried
14 As this evaluation was carried out in 2018/19, evidence draws on the 2018 version of the Biodiversity Indicators, along with reports published prior to 2019. We acknowledge that further evidence and updated indicators may have since been published, which were not available at the time of this evaluation.

Evaluation of Biodiversity 2020
27
out through online searches using a combination of key terms which varied for each Theme and Priority Action. The search criteria were refined to focus on the identification of both academic and grey literature, from 2010 onwards. Literature from the UK was prioritised, followed by literature from Europe and excluding any literature in languages other than English. A snowballing approach was used for the identification of additional literature, and the list of documents reviewed was complimented by those provided by Defra, members of the Steering Group, through requests to the Terrestrial Biodiversity Group (TBG) and the Major Landowners Group (MLG)15 and those referenced by interviewees and workshop participants. This was not a comprehensive review of literature but a focused effort to identify existing reviews and evaluations.
Where a lack of review or evaluative type evidence was found to exist, questionnaires or interviews with experts were conducted to gain insights.
Evidence is presented in six evidence packs, as follows:
1) Theme 1 Priority Action 1.1 – Establishing more coherent and resilient ecological networks (Annex 1);
2) Theme 1 Priority Action 1.3 – Recovery of priority species (Annex 2);
3) Theme 1 Priority Action 1.4 – Conservation of agricultural genetic resources (Annex 3)
4) Theme 2 Priority Actions 2.1, 2.2 & 2.3 - Engaging people in biodiversity and the wider natural environment, incorporating biodiversity values into decision-making, and innovative funding mechanisms (Annex 4);
5) Theme 3 – Reducing environmental pressures (Annex 5).
6) Theme 4 – Improving our knowledge
For evidence packs 1, 2, 4 and 5 (with the exception of evidence on Theme 2 Priority Action 2.1), a group of experts selected to represent Defra and Defra-family organisations, NGOs and civil society organisations, businesses and academia, were invited to review the evidence, and to participate in a workshop (alternative methods were used to gain expert input for evidence packs 3 and 6 – see below). The evaluation team endeavoured to invite representatives from as many relevant NGOs/civil society organisations as possible, along with those across Defra, Natural England, Environment Agency and Forestry Commission who have been involved in delivering activities under Biodiversity 2020. Academics with a broad knowledge of the field were invited to provide an unbiased view. The list of invitees was reviewed by Defra and circulated to wider members of the Steering Group. Additional suggestions of experts were added to the list of invitees, to minimise researcher selection bias. A limitation of this approach is participant self-selection bias, however positive responses were received by the majority of participants invited in the first instance. A second round of invites were sent to complement expert numbers where necessary. The workshops were designed to be held with circa 15 attendees to ensure discussions were effectively steered by facilitators and all participants had the opportunity to contribute to the discussion. All workshops included break-out sessions to smaller groups, followed by a plenary discussion of results across groups, in a way that highlighted areas of consensus and minimised ‘group think’. Prior to the workshop, participants completed a brief online questionnaire to provide their views on progress towards
15 TBG is the delivery group for Outcomes 1 & 3 and MLG is one if its Task and Finish Groups, for the SSSI component of Outcome 1A

Evaluation of Biodiversity 2020
28
the Theme or Priority Action objectives, and to identify key facilitating and hindering factors and lessons that could be learned. Participants were also asked to rate the confidence in their assessment.
The four expert workshops were held between March and May 2019, with between 12 and 17 participants (a total of 59 participants across the four workshops). Workshops presented evidence and facilitated expert discussions to gain further insight into progress and the factors that have influenced progress, drawing on participants’ experiences and knowledge. Participants also highlighted any additional evidence sources missing from evidence packs, which were subsequently incorporated into the evidence packs. Within the workshops, participants were asked to identify key influencing factors, or lessons/priorities, and consensus on the most important factors was gathered either through participants scoring factors within the workshop, or through a short online post-workshop survey.
For the following Themes/Priority Actions, slightly different or additional methodology was used to gather evidence to respond to the evaluation questions, as outlined below:
Theme 1 Priority Action 1.3 – Recovery of Priority Species
To inform the evidence pack, questionnaire surveys and follow up interviews were held with eight Natural England taxon specialists covering a range of taxonomic groups, to learn from their experience of delivering projects under the Species Recovery Programme, including the impacts it has had and the factors influencing progress, along with views on knowledge improvement, and progress in species recovery. Further views from a broader range of people, including those from partner organisations involved in delivering species recovery projects, were obtained through discussions at the Theme 1 PA 1.3 workshop. Further details can be found in Annex 2.
Theme 1 Priority Action 1.4 – Conserving agricultural genetic diversity
Along with a review of the available evidence from literature, the opinions of the UK Plant Genetic Resources Committee (UKPGR), and the Farm Animal Genetic Resources Committee (FAnGR) were sought through a brief questionnaire, to gather opinion on what factors had influenced progress under this Priority Action (Annex 3). Members of these committees include representatives from government and partner organisations, and NGOs. We received 10 responses to the questionnaire, providing some limited expert opinion.
Theme 2 Priority Action 2.1 – Engaging people
Along with a review of the available evidence from literature, the opinions of government agencies, NGOs and academics were sought via semi-structured telephone interviews, to gather opinion on progress and factors influencing it (Annex 4). A total of 13 interviews were held and the additional evidence provided by experts was reviewed.
Theme 4 – Improving our knowledge
Within each pre-workshop survey, questions were also asked around the subject of Theme 4 – Improving our Knowledge, to gather expert opinion of the extent to which knowledge, monitoring and data were available to support delivery of each Theme. This was then discussed in each workshop to gain insight into how knowledge, monitoring and data could better support delivery of the Strategy. These discussions and survey responses were combined with evidence from literature, to produce an evidence summary to respond to the evaluation questions for Theme 4 (Annex 6).

Evaluation of Biodiversity 2020
29
3 Progress against the Strategy Outcomes A number of indicators and outcome measures have been developed to assess progress towards Strategy Outcomes. A summary of relevant indicators and metrics, along with the progress they show, is presented in Table 1 below. For several metrics, data has not been gathered since 2014/2015, hindering assessment of recent progress.
3.1 Outcome 1
There has been variable progress across the targets in Outcome 1. There has only been small progress towards the Outcome 1A target of achieving 50% of SSSIs by area to be in favourable condition, which is insufficient to meet the target by 2020. More substantive progress has been made towards the Outcome 1A target for 90% of priority habitat to be in favourable or recovering condition (currently at 64.2% and 72% if the woodland component is excluded); and towards the Outcome 1B target for 200,000 ha of priority habitat creation, where creation of new habitat reached 154,000 ha on 1st January, 2019, or 77% of the target. However, progress is insufficient to meet the target by 2020.
Significant progress has been made towards Outcome 1C – to embed an ecosystem approach to management across 17% of land and inland water. Once self-assessment work by the Protected Landscape family has been completed and embedded into their management plans), the area of National Parks and AONBs embedding an ecosystem approach should meet the 17% target in due course; however this is unlikely to be completed by 2020.
For Outcome 1D, the restoration of degraded ecosystems towards climate change mitigation and adaptation, some progress has been made e.g. progress for coastal and wetland restoration is currently 93,141 ha against a target of 153,581 ha – equivalent to 60.6% of the target), and work is underway to develop a methodology for assessing the contribution
Outcome 1 - Habitats and ecosystems on land: ‘By 2020 we will have put in place measures so that biodiversity is maintained and enhanced, further degradation has been halted and where possible, restoration is underway, helping deliver more resilient and coherent ecological networks, healthy and well-functioning ecosystems, which deliver multiple benefits for wildlife and people’, including:
1a. Better wildlife habitats with 90% of priority habitats in favourable or recovering condition and at least 50% of SSSIs in favourable condition, while maintaining at least 95% in favourable or recovering condition;
1b. More, bigger and less fragmented areas for wildlife, with no net loss of priority habitat and an increase in the overall extent of priority habitats by at least 2000 km2;
1c. By 2020, at least 17% of land and inland water, especially areas of particular importance for biodiversity and ecosystem services, conserved through effective, integrated and joined up approaches to safeguard biodiversity and ecosystem services including through management of our existing systems of protected areas and the establishment of nature improvement areas.
1d. Restoring at least 15% of degraded ecosystems as a contribution to climate change mitigation and adaptation.

Evaluation of Biodiversity 2020
30
through woodland creation and management. Progress is insufficient to meet the target by 2020.
3.2 Outcome 3
In the absence of specific targets (as exist for Outcome 1) a methodology for assessing progress was agreed by TBG and Defra’s Biodiversity Programme Board. This requires a combination of trend measures to enable a progress assessment for the status of species. However, there has been insufficient monitoring and survey work to enable a comprehensive assessment of whether there have been ‘no further human-induced extinctions of known threatened species’.
Whilst major knowledge gaps remain regarding the number and trends of threatened species there is evidence to show ongoing declines and national extinctions of some native species, though there are some limited cases of progress being made for individual species. However, there has been an insufficient progress to improve the overall status of wildlife in England and so to meet the outcome
3.3 Outcome 4
The lack of specificity in Outcome 4 makes assessing progress difficult. There are some limited signs of progress; there has been an increase in the frequency with which people participate in activities in the natural environment. However, several indicators – on awareness, taking positive action – show little or no discernible change. Overall, it is not possible to make a full assessment of whether the outcome will be achieved, as the target for ‘significantly more people’ has not been defined.
Table 1 Progress towards Strategy Outcomes measured by relevant indicators and metrics.
16 England Biodiversity Indicators, available at https://www.gov.uk/government/statistics/england-biodiversity-indicators. 17 Natural England Paper 44.2B - Biodiversity 2020 Outcome 1 Habitats and Ecosystems – Progress update, presented to DBPB Meeting 24th July 2019.
Outcome Indicator/metric Baseline Extent of progress Likelihood of meeting outcome
by 2020
1A 90% of priority habitats (PH) in favourable or recovering condition
England Biodiversity Indicator 2a. Measured and reported on by Natural England. Favourable or recovering condition includes PH in SSSIs classed as favourable
In 2011 47.2% of recorded priority habitat was in favourable or recovering condition16.
As of March 2019, 64.2% of recorded PH was in favourable or recovering condition17. There has been little change since 2015, with delivery at
The relevant England Biodiversity Indicators and supplementary habitat information show there is progress in improving the status of priority
Outcome 3 - Species: ‘By 2020, we will see an overall improvement in the status of our wildlife and will have prevented further human-induced extinctions of known threatened species.’
Outcome 4 - People: ‘By 2020, significantly more people will be engaged in biodiversity issues, aware of its value and taking positive action.’

Evaluation of Biodiversity 2020
31
18 Natural England Paper 41.2B - Biodiversity 2020 Outcome 1 Habitats and Ecosystems – Progress update, presented to DBPB Meeting 5th July 2018.
or recovering, and PH under higher tier agri-environmental management.
64.9% in 2015/16 and 64.4% in 2016/1718 A separate target of 70% of woodland was set, to reflect delivery practicalities, to which 49% of qualifying woodland is under
management17. If
woodland was excluded from the overall assessment, 72% of priority habitat would be in favourable or recovering condition.
habitat however this is insufficient to meet the target by 2020.
50% of SSSIs in favourable condition
England Biodiversity Indicator 1b. Measured and reported on by Natural England.
As of 2011, 36.6% of SSSIs were in favourable condition (Indicator
1b)16
As of March 2019,
38.8%17 of SSSIs
were in favourable condition, which represents an increase of 2.2%.
There has been only small progress in increasing the percentage of SSSIs in favourable condition, which is insufficient to meet the target by 2020
95% of SSSIs in favourable or recovering condition
England Biodiversity Indicator 1b. Measured and reported on by Natural England.
In 2011, 96.6% of SSSIs were recorded in favourable or recovering
condition16.
As of March 2019, 93.5% of SSSIs were in favourable or recovering condition which shows a decrease since
201117. This decrease
reflects 3,614 ha recorded as no longer recovering in 2017/18, due to the latest evidence that some existing measures will be insufficient to achieve favourable condition, mainly water quality remedies over large estuarine and coastal
sites18.
Over recent years there has been a small fall in the reported percentage of SSSIs in recovering condition. However, the shortfall is small compared to that for the favourable condition target, and recording against this target tends to fluctuate. Having said this the target risks not being met in 2020.
1B No net loss of priority habitat and an increase in the overall extent of priority habitats by at least 200000 ha
Measured and reported on by Natural England.
All increases in the extent of priority habitat since 2011 count towards the target. In January 2015,
As of January 2019, 154,000 ha of priority habitat had been created, or land brought into management to create priority habitat. This
Despite significant progress, this is insufficient to meet the target in 2020. Additionally, it has not been possible to establish mechanisms to

Evaluation of Biodiversity 2020
32
19 TBG Progress report TBG20-3b, 16th March 2016
delivery was reported at 60,377 Ha19.
represents 77% of
target17. Increases since 2015 partly reflect inclusion of new data.
report habitat losses and therefore assess ‘no net loss’.
1C At least 17% of land and inland water, especially areas of particular importance for biodiversity and ecosystem services, conserved through effective, integrated and joined up approaches to safeguard biodiversity and ecosystem services including through management of our existing systems of protected areas and the establishment of nature improvement areas.
Outcome 1C was interpreted as a commitment to taking an Ecosystem Approach in the landscape scale delivery of the strategy’s targets for terrestrial
biodiversity18
There has been significant progress towards implementation of an Ecosystems Approach, using an agreed methodology, in National Parks and AONBs. Both National Parks England and The National Association for AONBs have undertaken projects to support National Parks and AONBs to embed and apply the Ecosystem Approach for biodiversity and public benefits. Once ‘self- assessment’ work by the Protected Landscape family has been completed and embedded into their management plans, the area of National Parks and AONBs embedding an ecosystem approach should meet the 17% target in due course but this is
unlikely before 202017.
1D 15% of degraded ecosystems restored as a contribution to climate change mitigation and adaptation.
Targets representing 15% of the baseline have been set across board habitat types. For terrestrial coastal and wetland areas, the target is 153,581 ha. For open freshwater and transitional and coastal water habitats, the target is 161,135 ha. Woodland areas have not yet been assessed as the methodology is under
development17.
All restoration since 2011 is included in progress towards the target.
As of March 2019, 93,141 ha of coastal and wetland habitat restoration was underway or completed equivalent to 60.6% of the
target17.
1,430 ha of freshwater and transitional and coastal waters restoration was underway or completed, equivalent to 0.9% of
target17.
Some useful progress has been made but this is insufficient to meet the target in 2020.
3
By 2020, we will see an overall improvement in the status of our wildlife and will have prevented
The assessment of progress has been made on the basis of: changes in the distribution and numbers of well-monitored species, notably many birds and butterflies, and some
England Biodiversity Indicator 4a: Abundance of Priority
species (UK level)16 - Trend
shows a significant decline in the long term (1970-2015) and short term (2010-2015).
Whilst major knowledge gaps remain regarding the number and trends of

Evaluation of Biodiversity 2020
33
further human-induced extinctions of known threatened species.
plants and moths; progress in the execution of actions identified by the expert Taxon Groups as integral to the recovery of Priority Species; the position of Priority Species on their ‘species recovery curve’; International Union for Conservation of Nature (IUCN) status assessments to provide an overall evaluation of the risk of extinction for a large number of species; and, the status of species on the list of those likely to be lost from England by 2020 using a definition that preventing ‘human-induced extinctions of known threatened species’ is considered as equivalent to not knowingly allowing or causing the loss of the last wild population of any English native species from England’.
England Biodiversity Indicator 4b: Distribution of priority
species (UK level)16 - Trend
shows no significant change in the long term (1970 – 2016) or short term (2011 – 2016).
threatened species there is evidence to show ongoing decline, though there are some limited cases of progress being made for individual species. Examples include successful re-introductions of the pool frog, field cricket, Cirl bunting and Lady’s Slipper Orchid.
However, there has been insufficient progress to improve the overall status of wildlife in England and so to meet the outcome. Though not all species have had their risk of extinction assessed and the evidence base is partial, there is however evidence of some national extinctions in England over the timeframe of Strategy.
England Biodiversity Indicator
5: Breeding farmland birds16 -
Trend shows a significant decline in the long term (1970-2015) and short term (2009-2015). England Biodiversity Indicator
5: Butterflies on farmland16 -
Trend shows a significant decline in the long term (1990-2017) and short term (2011-2017).
England Biodiversity Indicator
5: Bat populations16 - Trend
shows significant increase in the long term (1999-2016) but no significant change in the short term (2010-2016).
England Biodiversity Indicator
6: Breeding woodland birds16
- Trend shows significant declines in the long term (1970-2015) but no significant change in the short term (2009-2015). England Biodiversity Indicator
6. Woodland butterflies16 -
Trend shows significant decline in the long term (1990-2017) but no significant change in the short term (2011-2015). England Biodiversity Indicator
7: Breeding wetland birds16 -
Trend shows no significant change in the long term (1975 – 2015) or short term (2010 – 2015).
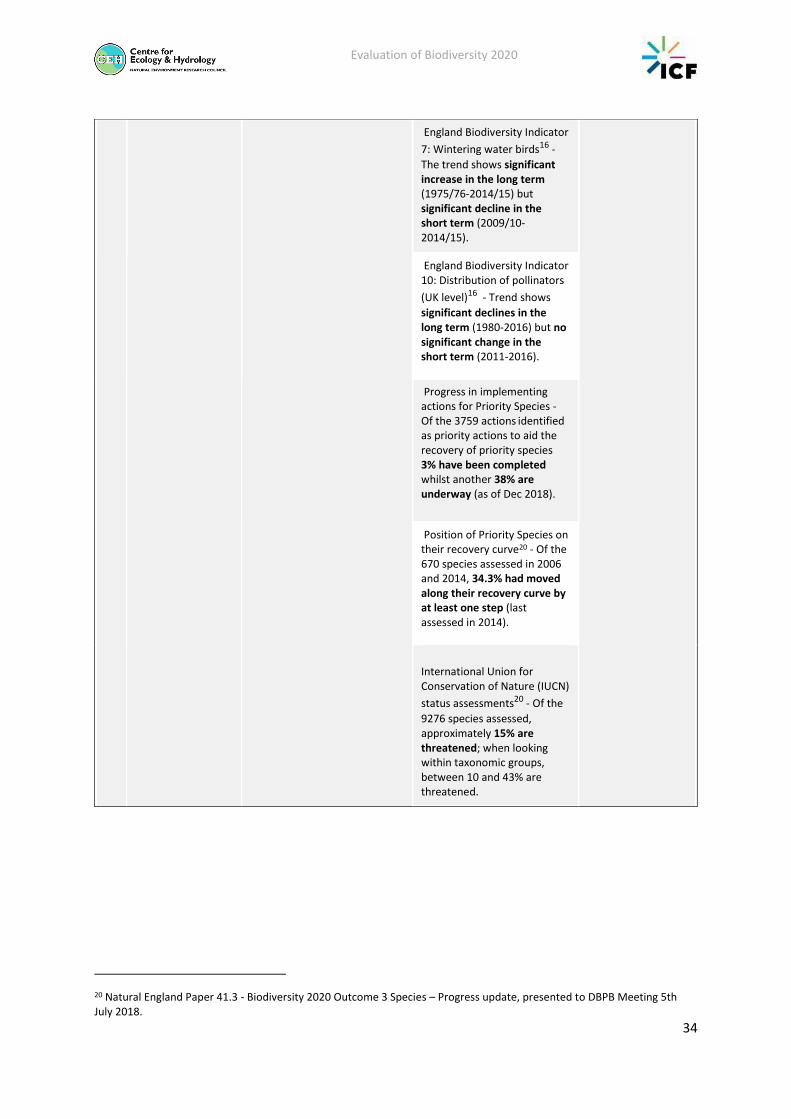
Evaluation of Biodiversity 2020
34
20 Natural England Paper 41.3 - Biodiversity 2020 Outcome 3 Species – Progress update, presented to DBPB Meeting 5th July 2018.
England Biodiversity Indicator
7: Wintering water birds16 -
The trend shows significant increase in the long term (1975/76-2014/15) but significant decline in the short term (2009/10-2014/15). England Biodiversity Indicator 10: Distribution of pollinators
(UK level)16 - Trend shows
significant declines in the long term (1980-2016) but no significant change in the short term (2011-2016).
Progress in implementing actions for Priority Species - Of the 3759 actions identified as priority actions to aid the recovery of priority species 3% have been completed whilst another 38% are underway (as of Dec 2018).
Position of Priority Species on their recovery curve20 - Of the 670 species assessed in 2006 and 2014, 34.3% had moved along their recovery curve by at least one step (last assessed in 2014).
International Union for Conservation of Nature (IUCN)
status assessments20 - Of the
9276 species assessed, approximately 15% are threatened; when looking within taxonomic groups, between 10 and 43% are threatened.

Evaluation of Biodiversity 2020
35
21 Defined as one with ‘a greater than 50% chance that the species will not be found during a species-specific, England-wide search (which includes sites known to be in use within the last 25 years) in 2020, assuming that no further specific action is taken to prevent that extinction. 22 Natural England (2018). Monitor of Engagement with the Natural Environment. The national survey on people and the natural environment. Headline report 2018. 23 Natural England (2018). Monitor of Engagement with the Natural Environment. The national survey on people and the natural environment. Headline report 2018.
The status of species on the list of those likely to be lost from England by 202021 - Expert taxon Groups have advised that 361 species are at high risk of being lost from England by 2020. A total of 161 of these are listed as Priority Species. Some have been lost from England, including Golden Eagle, Dotterel, Golden Oriole, Witham Orb Mussel, and the
fly Dolichopus melanopus20.
4 Significantly more people engaged in biodiversity issues, aware of its value and taking positive action
England Biodiversity Indicator 13. Awareness,
understanding and support for
conservation 16
In 2015, 5% of people in England were highly engaged with the issue of biodiversity loss, 26% of people in England showed some engagement, 17% of people were aware of the threat to biodiversity, but are not concerned about it, and 52% of survey respondents stated that they were not aware of the threat to biodiversity in England. There is no trend information to measure progress, and no further data since 2015.
Overall there are some limited signs of progress however It is not possible to make a full assessment whether the outcome will be achieved, as the target for ‘significantly more people’ has not been defined.
England Biodiversity Indicator 14. Taking
action for the natural
environment16
There has been no significant change in the index of volunteer time spent on the natural environment for selected organisations in England, between 2011 and 2016.
The proportion of those with a garden who agreed ‘they encouraged wildlife in their gardens’ (e.g. through feeding areas or planting) increased from 34% in 2013/14 to 38% of respondents in 2015/16.
Frequency of visits to the natural
environment22
The proportion of adults taking visits in the natural environment at least once a week increased, from 54% in 2009/10 to 62% in 2017/18. The increase has been seen across population groups (e.g. by age, ethnicity)
Participation in pro-environment behaviours23
The proportion of adults choosing to walk or cycle instead of using their car (when they can) increased from 40% to

Evaluation of Biodiversity 2020
36
48% over 2009/10-2017/18. The proportion of adults who recycle (when they can) increased by 3 percentage point to 77% over the same period. There has been little change in other pro-environment behaviours (2 percentage points or less).

Evaluation of Biodiversity 2020
37
4 Evaluation findings: Theme 1
4.1 Key findings for Theme 1 (A more integrated large-scale approach to conservation on land)
1. Theme 1 is comprised of three Priority Actions (plus one additional marine Priority Action which is out of scope of this evaluation). Our intervention logic models showed that progress in this Theme contributes to Outcomes 1 (habitats and ecosystems on land), 3 (improvement in species) and 4 (more people engaged).
Progress
2. Progress has been made in delivering activities under Priority Action 1.1, to establish more coherent and resilient ecological networks that safeguard ecosystem services. Activities have focussed on bringing habitat under active management to deliver habitat improvements and restoration, particularly through management of SSSIs, Nature Improvement Areas, and agri-environment schemes. These activities aimed at improving ecological networks by focussing on the Lawton Principles of “bigger, better, more and joined up" habitat. However, there are not agreed metrics to measure coherence or resilience of ecological networks, so it is not possible to establish how well these habitat improvements deliver progress towards the overall goal. There has been slow progress towards improving the condition of SSSIs and priority habitat, which is insufficient to meet the targets under Outcome 1. There has been some progress towards creating and restoring habitats, but again this is insufficient to meet the targets under Outcome 1.
3. In the Strategy, Priority Action 1.1 (establishing ecological networks) and actions under Theme 3 (reducing pressures on biodiversity) were the primary mechanisms through which recovery of a wide range of species were expected to be delivered. Therefore, apart from priority species, there was relatively little specific emphasis given to species in the Strategy.
4. Although there has been progress in agreeing actions for the recovery of priority species (Priority Action 1.3), experts suggested that a lack of resources has prevented further progress in delivering these actions. Expert assessment indicates that there has been ‘some’ progress, but only for ‘a few’ priority species, with 34.3% of assessed priority species moving along their recovery curve by at least one step by the end of 2014. More substantive progress has been made in improving knowledge of species autecology, and reasons for decline, than in improving species distribution or abundance trends.
5. Progress has been made towards conserving agricultural genetic diversity under Priority Action 1.4, particularly in terms of ex situ storage of plant genetic resources attributed mainly to effort made to acquisition of new accessions by the Millennium Seed Bank. However, much less progress has been made with in-situ conservation of plant genetic resources, including landrace and Crop Wild Relatives. Trends in populations of rare breed farm animals suggest there has been little progress in increasing effective population sizes, which would be beneficial for breeds which have very small populations below the threshold of 50 individuals suggested by The United Nations Food and Agriculture Organisation. The development of the Farm Animal Genetic Resource (FAnGR) Breeds

Evaluation of Biodiversity 2020
38
Inventory and FAnGR Biodiversity Indicator, marks progress in monitoring and reporting stocks or rare breeds.
6. Progress has been greatest when related to specific activities (e.g. funding partnerships or agreeing actions for priority species) rather than Outcomes (e.g. improving the condition of protected sites or the status of priority species). This progress in implementing specific actions has had local impacts, but has not necessarily scaled-up to improvements over large spatial scales, and therefore is not reflected in national level indicators.
7. There has been a lack of a coherent framework for spatially targeting activities under Priority Action 1.1; experts agreed that this hindered incorporation of biodiversity goals into local and regional planning, which hindered progress towards the Strategy Outcomes. Conversely, the development of a prioritised list of actions for the recovery of priority species provided a focus for action and resources across stakeholders. Improving the communication and accessibility of the list would further enhance its use for engaging stakeholders at local scales, but there currently lacks mechanisms for doing this.
Monitoring, evaluation, metrics and targets
8. Monitoring and evaluation of activities supports assessment of progress, but this is costly. Assessing progress here was hindered by a lack of evaluation of some activities and a lack of up to date monitoring data, for example on the condition of SSSIs and on species recovery status, and a lack of recording of important data such as loss of priority habitat. Assessment towards progress is also hindered by the lack of a baseline, and especially the lack of a counterfactual (i.e. a target has not been achieved, but has the presence of the Strategy supported progress in the right direction?).
9. Evaluation is rarely resourced beyond the end of the formal activity. This hinders assessment of contribution towards the overall Outcomes of the Strategy, and reduces our ability to learn from past activities.
10. Experts agreed that a lack of clarity of goals hindered progress by preventing clear communication of what was trying to be achieved and what action was needed to achieve it. For example, there was lack of clarity over what a more coherent ecological network looks like, or the action needed to achieve it.
11. Lack of up-to-date metrics has hindered the ability to assess progress, and probably hindered progress itself. There was a lack of up-to-date information to assess progress in Priority Actions, lack of centralised collection of data (e.g. for wildlife crime) and lack of clarity around some targets (e.g. metrics of “resilient networks”). In particular, for some targets, there are no data on metrics later than 2015.
Partnerships and people
12. Where there have been strong and effective partnerships and collaboration, this has supported progress by providing the greater scale of activity valuable to better access funding, resources and knowledge. For example, Government investment in the Species Recovery Programme elicited a two-fold additional investment in cash or in kind from partners. Conversely a lack of joined up working has been cited as a reason for lack of progress in tackling off-site issues impacting SSSIs.
13. People are important within partnerships; involving the right people, which includes those able to influence or authorise the delivery of action (for example landowners) supports progress towards the Outcomes.
Evaluation of Biodiversity 2020
39
4.2 Introduction to Theme 1
Theme 1 is concerned with taking a more integrated and large-scale approach to conservation, in order to halt overall biodiversity loss, support healthy well-functioning ecosystems and establish coherent ecological networks. It aims to establish more coherent and resilient ecological networks on land and at sea, take targeted action for species whose conservation is not delivered through wider habitat and ecosystem measures, and to conserve agricultural genetic diversity in cultivated plants, farmed animals and wild relatives. Activities under Theme 1 are carried out under four Priority Actions, which directly contribute to achieving Outcomes 1 and 3 of the Strategy. These Priority Actions are:
14. There is limited evidence that partnerships are sustained beyond the period of funding.
15. Personal contact (e.g. a coordinator in a partnership, or an advisor for an incentive scheme) is effective in supporting: (i) uptake of incentive schemes, (ii) appropriate targeting of agri-environment agreements, (iii) correct implementation of agri-environment management actions, and (iv) effective partnership working. Experts said that a lack of resource for one-to-one advisors has hindered more wide-scale uptake of AES agreements, which are a crucial delivery mechanism to achieve the goals of the Strategy.
. Resources and longevity
16. Funding was important to support effective partnerships, incentives and activities. Short-term funding hindered the longevity of partnerships and hindered uptake of incentives: partnerships take time to develop and there is limited evidence of their ongoing sustainability once funding ceased. Reduced funding to support action for priority species under Priority Action 1.3 has hindered progress, but long-term funding where it exists (usually from conservation organisations rather than government) has provided stability to support effective planning and activity.
17. Workshop participants believe that short-term funding signals a short-term government commitment, which hinders the building of trust with stakeholders, and can lead to a lack of uptake or buy-in. Short-term initiatives and uncertainty in resourcing hinders long term planning of actions, and therefore prevents further progress.
18. Long term funding for Agri-Environment schemes has manifest in significant delivery towards Outcomes. AES were considered by experts to have contributed the most progress towards improving habitat condition, extent and connectivity (see Annex 1.2).
Integration
19. Where benefits for biodiversity have aligned with other policy areas (e.g. improvements in water quality for aquatic priority species) this has supported progress towards the Strategy Outcomes. However, workshop participants felt that in general, a lack of integration of biodiversity goals across policy areas, prevents tackling of some larger scale issues such as water and air pollution, which prevent further progress towards improving habitat quality and removing the threats to species recovery. Experts agreed this is a key challenge hindering further progress towards species recovery. A lack of integration of conservation of genetic resources into landscape-scale measures such as designated sites and AES was also cited by survey respondents as a barrier to progress.

Evaluation of Biodiversity 2020
40
▪ Priority Action 1.1: Establish more coherent and resilient ecological networks on land that safeguard ecosystem services for the benefits of wildlife and people (Section 4.3).
▪ Priority Action 1.2: Establish and effectively manage an ecologically coherent network of marine protected areas (outside of the scope of this evaluation).
▪ Priority Action 1.3: Take targeted action for the recovery of priority species, whose conservation is not delivered through wider habitat-based and ecosystem measures (Section 4.4).
▪ Priority Action 1.4: Ensure that ‘agricultural’ genetic diversity is conserved and enhanced wherever appropriate (Section 4.5).
4.3 Priority Action 1.1: Establish coherent and resilient ecological networks
4.3.1 Introduction to Priority Action 1.1
Priority Action 1.1 aims to ‘establish more coherent and resilient ecological networks on land that safeguard ecosystem services for the benefit of wildlife and people’. Following the Making Space for Nature review by Professor Sir John Lawton24 , resilience and coherence in ecological networks are expected to be delivered by better, bigger, more and joined up areas of priority habitat. Achieving these four aspects is therefore the ambition of this Priority Action. To achieve this ambition, the Strategy encourages landscape-scale action, along with integrated approaches which join up with other activities and achieve multiple benefits for biodiversity and people.
Activities under this Priority Action can be grouped into three types:
1. Landscape-scale action delivered through partnerships;
2. Management of designated areas and of the public estate; and
3. Incentive-based schemes.
Activities are geared towards bringing a greater proportion of the landscape into active management to improve or restore areas of priority habitat. Management also aims to take a more ecosystem-based approach to ensure ecosystem services are safe-guarded and to provide benefits to people.
To facilitate more coherent landscape-scale management approaches, local partnerships are encouraged between stakeholders including local authorities, farmers, land-owners, statutory and voluntary bodies and local businesses. These partnerships should enable more joined-up and coherent management plans and people working together across the landscape towards common goals. The establishment of Nature Improvement Areas by local partnerships was a goal of this Priority Action. The purpose of these areas is to restore and connect nature on a significant scale as well as engaging local communities and providing multiple benefits.
24 Lawton, J.H., Brotherton, P.N.M., Brown, V.K., Elphick, C., Fitter, A.H., Forshaw, J., Haddow, R.W., Hilborne, S., Leafe, R.N., Mace, G.M., Southgate, M.P., Sutherland, W.J., Tew, T.E., Varley, J., & Wynne, G.R. (2010) Making Space for Nature: a review of England’s wildlife sites and ecological network. Report to Defra. https://webarchive.nationalarchives.gov.uk/20130402170324/http://archive.defra.gov.uk/environment/biodiversity/documents/201009space-for-nature.pdf

Evaluation of Biodiversity 2020
41
Designations such as SSSIs are used to protect our most important habitats. Management of designated areas focuses on bringing a greater area into favourable condition, to improve overall habitat quality. Management in National Parks (NPs) and Areas of Outstanding Natural Beauty (AONB’s) aims to embed an Ecosystem Approach to management, following CBD guidelines to promote conservation and sustainable use in an equitable way. Management of the public estate aims to ensure areas such as those beside roads and railways, along with other areas of publicly owned land such as the forest estate, are managed to improve their value to biodiversity, which will help create a better-connected landscape.
Incentive-based schemes include agri-environment schemes such as Countryside Stewardship (CS), along with grants for habitat creation and improvement such as the Woodland Creation Grant, Peatland Fund and Water Environment Grant. They aim to incentivise land owners/land managers to manage their land in a more ecologically sustainable way to achieve landscape-scale goals, or to create, restore or improve target habitats. A large proportion of land in England is agricultural. Targeting improvements to the management of agricultural land to provide better quality and better-connected habitats will therefore help improve ecological networks to achieve ecological targets, whilst maintaining agricultural food production. Creation of target habitats such as woodland and peatland will aid climate change mitigation along with providing other ecosystem and wildlife benefits.
The intervention logic for Priority Action 1.1 can be found in Annex 1 Section 1.2.1. This visualises how the different types of conservation initiatives (landscape-scale conservation delivered through partnerships; management of designated areas and public estate; and incentive schemes), intended to lead to improvements in habitat quality and connectivity, habitat creation or restoration, and ecosystem management, through improving management plans, increasing the proportion of land under environmental management and delivering landscape-scale actions.
This Priority Action was evaluated through a review of indicators and evidence from published literature and reports, together with a one-day stakeholder workshop with 17 participants representing Defra and partner organisations, NGOs and academia.
4.3.2 Q1. What actions and activities have been delivered under Theme 1 Priority Action 1.1?
A summary of the key actions and activities that have taken place in support of delivery of Theme 1 Priority Action 1.1 is provided in Annex 1 Table 1.2. The specific actions which were promised within the Strategy have been delivered or at least initiated. These include the formation of 12 Nature Improvement Areas (NIAs), 61 Farmer Clusters, 48 Local Nature Partnerships, and approximately 3 million ha of land managed under agri-environment agreements. However, it has not been possible to evaluate the extent to which some of these actions or activities, for example NIA partnerships, have been sustained after the initial government funding period.
4.3.3 Q2. What progress has been made towards achieving the long-term goal of establishing more coherent and resilient ecological networks?
4.3.3.1 Introduction
In the absence of widely accepted metrics to directly measure coherence or resilience, coherent and resilient ecological networks are assumed to be attained by achieving the four

Evaluation of Biodiversity 2020
42
principles set out by John Lawton et al. 25 of more, bigger, better and joined up areas; this assumption is supported by several scientific studies 26,27. Targets associated with these principles form part of Outcome 1 of the Strategy, (Outcomes 1a, 1b and 1c), along with measures of progress towards safeguarding ecosystem services and improving resilience/adaptation to climate change (Outcomes 1c and 1d). Assessing progress towards achieving Outcomes 1a-d can therefore give an idea of progress towards creating more coherent and resilient networks and safeguarding ecosystem services. It is not yet clear how much bigger, better or well-connected networks would need to be in order to be resilient or to safeguard ecosystem services27; nevertheless achieving Outcome 1 targets would undoubtedly demonstrate progress in establishing such ecological networks.
4.3.3.2 Evidence
Delivery of Outcome 1 is overseen by the Terrestrial Biodiversity Group (TBG), and progress reports produced by TBG form the basis of assessment of progress, together with England Biodiversity Indicators 1 (Extent and condition of protected areas), 2a (Extent and condition of priority habitats) and 3 (Habitat connectivity in the wider countryside)28, which are also directly relevant to measuring progress towards achieving more, bigger, better and joined up areas. However, this only provides a partial picture of progress, as some of the underlying data on condition of SSSIs and priority habitat may be out-of-date, and more importantly, there is no data on the condition of the 31% of priority habitat that occur outside of SSSIs and which are not under Higher Level Stewardship, Countryside Stewardship or Forestry Commission management. There is currently no central recording of loss of priority habitat, so although areas of newly created or restored priority habitat are logged and measured (albeit with potential inaccuracies – see Annex 1 Section 1.3.2.2), overall net gain of priority habitat is unknown. Also, England Biodiversity Indicator 3 on habitat connectivity is still under development and therefore progress towards the ‘joined-up’ aspect of the Lawton principles is not currently measured or reported on.
Measuring progress towards Outcome 1d requires calculation of the baseline of how much of each type of ecosystem has been degraded, and defining ‘degraded’ across different ecosystem types, to calculate the amount of habitat restoration that is needed to reach the 15% target for each. This has been done for coastal and wetland ecosystems, but further work is needed for others such as open freshwater and transitional and coastal water habitats, to give a complete assessment of progress. Work is underway to establish the contribution of woodland restoration to this target.
Further evidence of progress was provided through workshop discussions and the opinions of expert workshop attendees provided in the pre-workshop questionnaire, shown in Figure 3.
25 Lawton, J.H., Brotherton, P.N.M., Brown, V.K., Elphick, C., Fitter, A.H., Forshaw, J., Haddow, R.W., Hilborne, S., Leafe, R.N., Mace, G.M., Southgate, M.P., Sutherland, W.J., Tew, T.E., Varley, J., & Wynne, G.R. (2010) Making Space for Nature: a review of England’s wildlife sites and ecological network. Report to Defra. Available at: https://webarchive.nationalarchives.gov.uk/20130402170324/http://archive.defra.gov.uk/environment/biodiversity/documents/201009space-for-nature.pdf 26 Hodgson, J. A., Moilanen, A., Wintle, B. A. and Thomas, C. D. (2011), Habitat area, quality and connectivity: striking the balance for efficient conservation. Journal of Applied Ecology, 48: 148-152 27 Isaac, N.J.B., Brotherton, P.N.M., Bullock, J.M., et al. Defining and delivering resilient ecological networks: Nature conservation in England. J Appl Ecol. 2018; 55:2537–2543 28 England Biodiversity Indicators, available at https://www.gov.uk/government/statistics/england-biodiversity-indicators.

Evaluation of Biodiversity 2020
43
Figure 3 What category of progress do you think has been made towards establishing more coherent and resilient ecological networks? Reponses from pre-workshop survey (n=14).
Table 2 summarises the targets set out in Outcome 1 of the Strategy, together with an assessment of progress towards these targets and current delivery, based on evidence from a TBG progress report in July 201929 and the 2018 England Biodiversity Indicators30,31.
Table 2 Outcome 1 targets and delivery progress Outcome Target Progress since 2011 Current delivery (2019)
1A 90% of priority habitats in favourable or recovering condition
47.2% in 2011. However little
change since 2015 (delivery was at
64.9% in 2015/16 and 64.4% in
2016/17)3233
Indicator 2a (March 2018) - 66%
priority habitat in favourable or
recovering condition30.
TBG progress update (July 2019) –
64.2% (49% for woodland only,
72% when woodland excluded)29
50% of SSSIs in favourable condition
36.6% in 2011 (Indicator 1b)28
Estimated trajectory (by Natural England in 2017) for achievement of the 50% milestone is 2024/25 with delivery in 2020 likely to be
around 46%33
Indicator 1b (March 2018) - 38.8%
SSSIs in favourable condition30
TBG progress report (July 2019) –
38.8%.29
95% of SSSIs in favourable or recovering condition
In 2011 this was above the 95% target and remained marginally
above until 201830
Indicator 1b (March 2018) – 94.3% 30
29 Natural England Paper 44.2B - Biodiversity 2020 Outcome 1 Habitats and Ecosystems – Progress update, presented to DBPB Meeting 24th July 2019. 30 England Biodiversity Indicators, available at https://www.gov.uk/government/statistics/england-biodiversity-indicators. 31 Note that figures may vary between TBG progress reports and England Biodiversity Indictors, as the TBG progress reporting is based on an updated inventory of priority habitat, an updated definition of ‘appropriate management’ and assessment of AES delivery based on option boundary rather than agreement boundary. See Annex 1 Section 1.3.2 for more information 32 Natural England Paper 41.2B - Biodiversity 2020 Outcome 1 Habitats and Ecosystems – Progress update, presented to DBPB Meeting 5th July 2018.
012345678
No
pro
gres
s
Min
or
pro
gres
s
Mo
der
ate
pro
gres
s
Sign
ific
ant
pro
gres
s
Sub
stan
tial
Pro
gre
ss
Do
n’t
kn
ow
Low
Med
ium
Hig
h
ConfidenceProgress

Evaluation of Biodiversity 2020
44
Outcome Target Progress since 2011 Current delivery (2019)
TBG progress report (July 2019) - 93.5% of SSSIs by area in favourable or recovering
condition29
1B No net loss of priority habitat and an increase in the overall extent of priority habitats by at least 200000 ha
Delivery was reported at 60,377 Ha in Jan 201533.
TBG progress report (July2019) – 154,000 ha priority habitat created
by Jan 2019 (77% of target)29
Significant progress has been made. However, increases partly reflect inclusion of new data so progress is unlikely to be sustained over the coming years. CS delivery is under target. Furthermore, due to a lack of recording of loss of priority habitat, net gain is unknown.
1C At least 17% of land and inland water, especially areas of particular importance for biodiversity and ecosystem services, conserved through effective, integrated and joined up approaches to safeguard biodiversity and ecosystem services including through management of our existing systems of protected areas and the establishment of nature improvement areas.
Implementation of Ecosystems Approach in NPs and AONBs is underway. The National Association for AONBs, with support from Natural England and Defra, is undertaking a project to support AONBs to embed and apply the Ecosystem Approach for biodiversity and public benefits. Once completed, the area of NPs and AONBs embedding an ecosystem
approach should meet the 17% target29Ecosystems Approach has been
implemented in 9/10 English National Parks and 4 AONBs and will be taken up by a further 10-12 AONBs this year. Once completed, the area of NPs and AONBs embedding an ecosystem approach should meet the 17%
target33
Indicator 1a shows the overall extent of protected areas has declined in England from 1,033,668 Ha in 2011 to 1,017,777 Ha in 2018. However, this is due to a change in recording process of terrestrial vs marine sites in
2014 and does not reflect a true decline in extent30.
1D 15% of degraded ecosystems restored as a contribution to climate change mitigation and adaptation.
93,141 ha of coastal and wetland restoration completed, which is 60.6% of the calculated baseline target of 153,581 ha for terrestrial coastal and
wetland ecosystems2933.
1,430 ha of freshwater and transitional and coastal waters restoration,
equivalent to 0.9% of the calculated 161,135 ha target29.
Work is ongoing to assess the contribution of woodland restoration to the target.
4.3.3.3 Evaluation
Overall, the evidence shows that although progress has been made, there has been insufficient progress to meet the targets in 2020.
Progress has been made towards creating priority habitats, but measuring overall net gain of priority habitat is hampered by a lack of recording of loss. Habitat created under recent schemes such as the Woodland Creation Grant and Peatland Restoration Fund is likely to move the extent of habitat creation and restoration of ecosystems as a contribution to climate change mitigation and adaptation, closer to the target. Embedding the Ecosystems Approach into management plans for National Parks (NPs) and Areas of Outstanding Natural Beauty (AONBs) will help ensure ecosystem services are safeguarded in these areas, and ongoing work
33 TBG Progress report TBG20-3b, 16th March 2016

Evaluation of Biodiversity 2020
45
is needed to ensure this is rolled out and taken up by all AONBs and becomes integrated into annual management plans across these and other managed areas.
Workshop participants suggested that progress has been made in terms of processes put in place and activity happening at small-scales, but this hasn’t necessarily scaled-up to progress in improving national level trends and meeting targets.
Accurate assessment of progress towards Outcomes here was hindered by lack of up-to-date information regarding the condition of SSSIs and priority habitat, including priority habitat occurring outside of SSSI or ES/CS/FC management; and a lack of accurate information regarding loss and creation of priority habitat. Furthermore, workshop participants suggested that a lack of clarity over the targets and metrics has hindered progress, and the assessment of progress. There is a lack of clarity over what a more coherent and resilient ecological network would look like, and also lack of a coherent spatial framework to set out what needs to be done and where, in order to achieve this ambition.
4.3.4 Q3. How effective has landscape-scale action delivered through partnership approaches been and what factors have influenced progress?
4.3.4.1 Introduction
The Strategy highlights partnership working as an important mechanism for delivering coherent landscape-scale action, establishing ecological networks and achieving multiple benefits for people and wildlife. To evaluate how effective landscape-scale action delivered through partnership approaches has been, we will consider:
a) What influence have partnership approaches had on delivering the long-term Outcomes and have partnership approaches resulted in partners working together to achieve integrated/landscape scale delivery?
b) What factors have contributed to / hindered the success of partnership approaches?
4.3.4.2 Evidence
This section draws on evidence from literature (see Annex 1.1 section 1.3.3) and expert opinion (see Annex 1.2) to assess the impacts of partnerships on delivering landscape-scale conservation, covering a breadth of schemes. However, much of this evidence is from 2016 or earlier and therefore does not allow assessment of the longevity of schemes. For example, the evaluation of NIAs was carried out at the end of the 3-year NIA funding period in 2015, so their long-term success or factors influencing their continuation after the initial funding period, could not be evaluated.
4.3.4.3 What influence have partnership approaches had on delivering the long-term Outcomes, and have partnership approaches resulted in partners working together to achieve integrated/landscape scale delivery?
This question aims to evaluate what additional value partnerships bring to delivering landscape-scale conservation and whether partnership working has enabled integrated delivery (i.e. delivering multiple benefits) at a landscape-scale that wouldn’t otherwise be achieved. The evaluative evidence shows that partnership approaches have brought several

Evaluation of Biodiversity 2020
46
benefits to the delivery of integrated, landscape-scale conservation, including increased coordination and collaboration, which breaks down barriers between organisations enabling collaborative working and providing opportunities to achieve outcomes that may otherwise have been missed. Partnerships can also help provide access to the scale of funding and resources necessary to deliver landscape scale conservation, by promoting partner ownership and ensuring buy-in, particularly where partnerships have worked together to jointly develop objectives. Partnership approaches also increase knowledge sharing and awareness raising, particularly between partners, along with increasing opportunities for engaging with stakeholders and the public. For further details see Annex 1 Section 1.3.3.
There is some evidence that partnerships have influenced the integrated delivery of environmental outcomes along with a number of other social and economic benefits, however the specific impacts of partnerships on increasing or improving delivery, over and above the presence of conservation initiatives, is unclear (see Annex 1 Section 1.3.3). Evidence is also lacking as to whether partnership approaches have been sustained beyond the initial funding period. For example, the NIA evaluation suggested that the government grant seemed to act as ‘seed’ money to ‘encourage match-funding and gain partner support; enabling initial work on projects, encouraging participation and help in-kind; helping partner organisations work together on joint funding bids; and funding staff to encourage volunteers and communities to become involved’. However, it is unclear the extent to which these partnerships continued after the initial funding period finished; the NIA evaluation stated that that a key challenge at the end of the government grant funding period, as well as for the future, was how to continue delivery of each NIA’s objectives. Only four NIAs had already been successful in securing some new funding (as of January 2015) after the initial funding period ended. Long term evaluation of the impacts of this, and other projects, would enable evaluation of the lasting impacts and legacy of the project, as well as the extent to which they contribute to the overall Outcomes and Strategy goals.
Workshop participants scored the contribution of landscape-scale action delivered through partnership approaches to the overall goal of creating more coherent and resilient ecological networks, as minor-moderate (see Figure 4). Participants agreed this was because of the restricted spatial scale, and sometimes short-term impacts of schemes such as NIAs.
Figure 4 The extent that landscape-scale action delivered through partnership schemes has contributed to progress. Responses to pre-workshop survey (n=14)
4.3.4.4 What factors have contributed to or hindered the success of partnership approaches?
A number of factors were highlighted in the literature and in the expert workshop as influencing the effectiveness of partnerships.
0
2
4
6
8
10
12
14
Min
or
con
trib
uti
on
Mo
der
ate
con
trib
uti
on
Sign
ific
ant
con
trib
uti
on
Sub
stan
tial
con
trib
uti
on
Low
Med
ium
Hig
h

Evaluation of Biodiversity 2020
47
Partnerships which have a clear organisational structure in place for coordination, delegation and communication of tasks, were supported by a strong mandate or policy underpinning from government, and that developed joint aims and shared visions, and with lots of local stakeholder buy-in, were considered to be more successful. Resourcing was also a key issue; resource constraints proved a considerable challenge for LNPs and NIAs to meet their objectives. Funding for a dedicated coordinator was considered important to improve success and maintain the longevity of the project, and to help provide organisational structure. The government grant was important in providing flexibility to employ staff, particularly coordinators. Workshop participants also suggested that it is important to include the right people within the partnership to ensure actions can be done; i.e. statutory bodies with influence, or major landowners to ensure access to land. There is also an issue of time-scales; new partnerships take time to set up and to establish relationships and agree on objectives and goals. This means short-term funding may be at odds with establishing new partnerships to deliver in short timescales. Nevertheless, entirely new partnerships were successfully established in two NIAs, although it is not clear to this evaluation whether these partnerships are still operating and delivering for biodiversity.
A structured monitoring and evaluation process established at the commencement of the project was found to be useful by some NIAs to provide an evidence base of impact, to support funding applications. However, monitoring and evaluation required a lot of time and energy at the NIA level and needed more external support than was originally anticipated. Evidence from the Moors for the Future partnership programme suggests that monitoring from the start of, or before project implementation can help: (1) identify whether recovery is progressing in the absence of intervention and therefore save unnecessary financial investment, (2) identify the most appropriate measures to put in place, and (3) provide baseline data against which to evaluate the success of restoration activities, and therefore the return on investment34. Furthermore, ongoing monitoring and evaluation beyond the ‘end’ of the project would help determine the long-term impacts and trends, which can help inform future management.
4.3.5 Q.4 How effective has management of designated areas and the public estate been and what factors influenced progress?
4.3.5.1 Introduction
Areas of particular value for nature or cultural heritage are protected by national or international designations, which place restrictions on the activities or development that can take place. Designated areas are therefore a cornerstone for conservation in England and should protect our most valuable areas of countryside.
Within the Strategy, designated areas form the core areas of the sought-after ecological networks, and improving the condition and management of these areas to bring greater benefits for wildlife and people, is a key theme throughout the Strategy. The designated areas considered here are SSSIs including terrestrial SACs and SPAs, National Parks, AONBs, NNRs and local sites, which are all specifically mentioned within the Strategy.
Management of areas of public estate, for example those areas at the sides of roads and railways and public forest estate, to maximise their value to biodiversity, can also contribute to
34 JNCC. 2019. Sixth National Report to the United Nations Convention on Biological Diversity: United Kingdom of Great Britain and Northern Ireland. JNCC, Peterborough.

Evaluation of Biodiversity 2020
48
establishing coherent ecological networks by improving connectivity between areas of habitat and delivering biodiversity gains.
This question aims to evaluate how effective management of designated areas and public estate has been in terms of delivering the long-term Outcomes of Theme 1 Priority Action 1.1, along with assessing which factors have influenced or hindered progress.
4.3.5.2 Evidence
The following quantitative metrics are available to assess the effectiveness of designated area management in terms of site condition and the proportion of sites under positive management:
• Defra statistics35 show that there has been a moderate improvement recorded in the proportion of Local Sites under positive management, from approximately 45% in 2011/12 to 50% in 2016/17. However, the 2016/17 figure is based on only 46% of Local Authorities data, so it is unclear how representative this is across the whole country.
• England Biodiversity Indicator 1b reports on the condition of SSSIs36, and shows that since 2011 there has been a slight improvement in the percentage of SSSIs in favourable condition from 36.6% in 2011 to 38.8% in 2018. The percentage in favourable or recovering condition has dropped slightly from 96.6% in 2011 to 94.3% in 201836. A total of 3,614 ha was recorded as no longer recovering in 2017/18. The TBG stated that ‘this reflects the latest evidence that some existing measures will be insufficient to achieve favourable condition, mainly water quality remedies over large areas of the Solent and south coast’37.
Metrics to assess habitat quality or management of other designated areas (areas outside of SSSIs in National Parks and AONBs, and NNRs for example) are lacking.
Further evidence is available in the literature (see Annex 1.1 section 1.3.4) and from expert opinion (see Annex 1.2).
4.3.5.3 Management of Protected Sites
Progress has been slow in improving the condition of protected sites
There has been slow progress in improving the percentage of SSSIs in favourable condition and no improvement in the percentage in favourable or recovering condition. Furthermore, there is evidence that protected landscapes such as National Parks and AONBs are failing to buck the national trend of declining species or habitats.
Although statistical data show a moderate improvement in the proportion of Local Sites in positive management, the 2016/17 figure is based on only 46% of Local Authorities data, with some Local Authorities reporting that they have insufficient funding or resources to carry out the assessment needed to provide the information. This increase may reflect improvements in knowledge of sites or changes to the baseline reporting; it is not clear whether it reflects an actual improvement to levels of site management.
35Defra (2019). Nature conservation: Local Sites in positive conservation management in England, 2008/09 to 2017/18. https://assets.publishing.service.gov.uk/government/uploads/system/uploads/attachment_data/file/665345/Local_Sites_in_positive_conservation_management_England_200809_201617.pdf 36 England Biodiversity Indicators, available at https://www.gov.uk/government/statistics/england-biodiversity-indicators. 37 Natural England Paper 41.2B - Biodiversity 2020 Outcome 1 Habitats and Ecosystems – Progress update, presented to DBPB Meeting 5th July 2018.
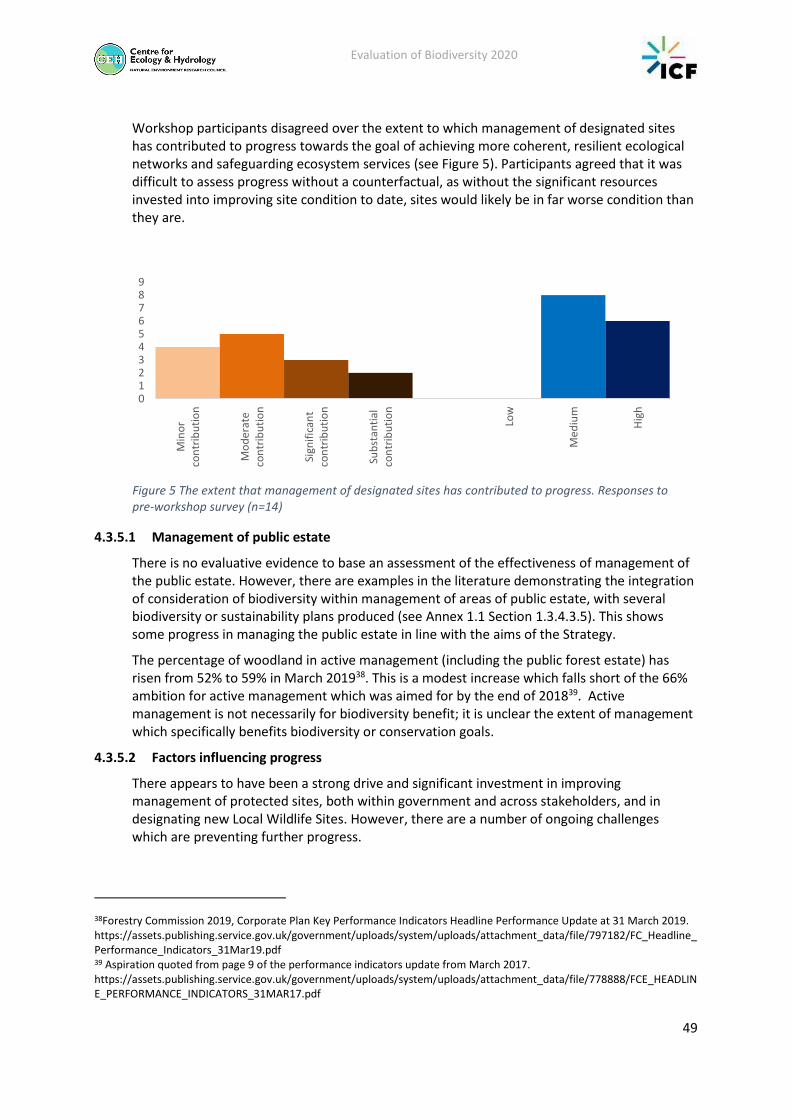
Evaluation of Biodiversity 2020
49
Workshop participants disagreed over the extent to which management of designated sites has contributed to progress towards the goal of achieving more coherent, resilient ecological networks and safeguarding ecosystem services (see Figure 5). Participants agreed that it was difficult to assess progress without a counterfactual, as without the significant resources invested into improving site condition to date, sites would likely be in far worse condition than they are.
4.3.5.1 Management of public estate
There is no evaluative evidence to base an assessment of the effectiveness of management of the public estate. However, there are examples in the literature demonstrating the integration of consideration of biodiversity within management of areas of public estate, with several biodiversity or sustainability plans produced (see Annex 1.1 Section 1.3.4.3.5). This shows some progress in managing the public estate in line with the aims of the Strategy.
The percentage of woodland in active management (including the public forest estate) has risen from 52% to 59% in March 201938. This is a modest increase which falls short of the 66% ambition for active management which was aimed for by the end of 201839. Active management is not necessarily for biodiversity benefit; it is unclear the extent of management which specifically benefits biodiversity or conservation goals.
4.3.5.2 Factors influencing progress
There appears to have been a strong drive and significant investment in improving management of protected sites, both within government and across stakeholders, and in designating new Local Wildlife Sites. However, there are a number of ongoing challenges which are preventing further progress.
38Forestry Commission 2019, Corporate Plan Key Performance Indicators Headline Performance Update at 31 March 2019. https://assets.publishing.service.gov.uk/government/uploads/system/uploads/attachment_data/file/797182/FC_Headline_Performance_Indicators_31Mar19.pdf 39 Aspiration quoted from page 9 of the performance indicators update from March 2017. https://assets.publishing.service.gov.uk/government/uploads/system/uploads/attachment_data/file/778888/FCE_HEADLINE_PERFORMANCE_INDICATORS_31MAR17.pdf
0123456789
Min
or
con
trib
uti
on
Mo
der
ate
con
trib
uti
on
Sign
ific
ant
con
trib
uti
on
Sub
stan
tial
con
trib
uti
on
Low
Med
ium
Hig
h
Figure 5 The extent that management of designated sites has contributed to progress. Responses to pre-workshop survey (n=14)

Evaluation of Biodiversity 2020
50
Factors hindering effective site management:
• Lack of influence over landowner behaviour - As most of the area of National Parks and AONBs are privately owned, influencing the behaviour of a large number of private land-owners is therefore necessary to drive progress. Agri-environment schemes have been cited as being ‘instrumental in delivering improvements in habitat restoration and increases in species within the Parks40; improving the uptake of AES within National Parks and other designated sites could further improve progress by bringing a larger proportion of land under suitable management. Improved resourcing for engaging with landowners and providing one-to-one advice to encourage uptake and effective targeting, may help.
• Infrequent monitoring may impede development of effective management plans and assessment of progress - 47.9% of SSSI units have not undergone a full condition assessment since before 2011, and 43.8% have not undergone a full or rapid condition assessment in the same time period. Workshop participants believe this hinders knowledge of current site condition, understanding of whether remedial actions have been effective, and knowledge and understanding of the most appropriate site management to improve site condition. Without this knowledge, annual management plans may not be as effective as they could be. Infrequent site monitoring can also impede demonstration of delivery and impacts, which can impact on future investment, for example from water companies. It may also signal a lack of government commitment, leading to the disengagement of stakeholders.
Furthermore, a lack of monitoring and reporting prevents accurate assessment of
progress, with evidence that as few as 3.6% of Local Wildlife Sites were monitored in
2017, and only 15.5% of sites were monitored in the last 5 years. Some Local
Authorities have attributed their lack of monitoring or reporting of Local Sites in
positive management, to insufficient funding or resources to carry out the assessment
needed to provide the information.
• External pressures are difficult to address - The reasons for SSSIs, SACs and SPAs being in adverse condition (i.e. not reaching favourable or recovering condition) span many processes and pressures, including unsuitable management such as overgrazing by farmers, but also including pressures arising from management offsite, such as: water pollution (discharge and agricultural run-off); water management (drainage and inappropriate water levels) air pollution and invasive species/disease.
Offsite issues are difficult to address in isolation, requiring changes to land
management outside of the protected site. Tackling off-site issues has been
highlighted as a barrier to progress by members of the Major Land-Owners group and
in the IPENS programme report41.
Factors improving progress
• Resources and financial investment improve progress - Where there have been
improvements to management, this has been attributed to financial investment (e.g.
40 Campaign for National Parks (2018). Raising the Bar: Improving nature in our National parks. https://www.cnp.org.uk/sites/default/files/uploadsfiles/Raising%20the%20bar%20improving%20wildlife%20in%20our%20National%20Parks.pdf 41 Improvement Programme for England’s Natura 2000 Sites (IPENS) Planning for the future: Programme Report – a summary of the programme findings (2015).

Evaluation of Biodiversity 2020
51
Local Sites). Conversely, reduction in funding, expired funding agreements, or
insecurity in long term funding have been cited as reason for reduction in management
or management not being secure or fully effective (e.g. Local Sites; Natura 2000 sites).
This suggests some sort of dedicated funding is necessary to maintain positive
management. Furthermore, a large majority of wildlife site partnerships surveyed
have said they do not have sufficient resources to enable the identification,
management and protection of Local Wildlife Sites in their area; only one responded
that they did42. Further resources are required primarily for survey and monitoring,
secondly for landowner advice and support and thirdly for practical land management
and assistance. Also, new initiatives such as the Ecosystems Self-Assessment Toolkit
are difficult to implement without increased resources to do so.
• Collaborative working may help
Collaborative and partnership working has been cited as a success factor for improving
the proportion of Local sites under positive management and for delivering improved
management in National Parks. Due to the number of different private landowners
managing land within designated sites, working in partnership with land owners and
managers to deliver improvements is essential.
Conversely a lack of collaboration and joined up working amongst different delivery
groups may have prevented taking advantage of opportunities to address off-site
issues impacting on SSSIs.
4.3.6 Q.5 How effective have incentive schemes been and what factors have influenced progress?
4.3.6.1 Introduction
Incentivising landowners to manage their land in an ecologically sustainable way is a widely employed mechanism to achieve environmental outcomes, in line with Aichi Biodiversity Target 3, which promotes the application of ‘positive incentives for the conservation and sustainable use of biodiversity’.
This question considers how effective incentive schemes have been in terms of delivering the long-term goal of establishing more coherent and resilient ecological networks, and what factors have contributed to or hindered progress. To answer this, the following questions will be considered:
a) What influence have incentive schemes had on delivering the long-term Outcomes?
b) Are the schemes ensuring that individual actions are working together at a landscape scale?
c) What factors have contributed to/ hindered the success of incentive scheme approaches?
The incentive schemes considered within this evaluation are agri-environment schemes (AES), Peatland Fund, Woodland Creation Grant and Woodland Carbon Fund. The latter 3 incentivise landowners to create specific habitats, namely peatland or woodland. However, these are
42 The Wildlife Trusts, 2018. The status of England’s Local wildlife Sites 2018. This survey had responses from 46 of the 55 administrative boundaries for LWS systems. Report available from: https://www.wildlifetrusts.org/sites/default/files/2019-01/181122%20RSWT%20Wildlife%20Sites%20Report%202018%20MB%20web_0.pdf

Evaluation of Biodiversity 2020
52
relatively recent schemes, and therefore there is not yet any evaluative evidence to assess their impact and factors influencing success.
Agri-environment schemes encourage farmers and landowners to protect and enhance the environment on their land by paying them for the provision of environmental services. Between 2005 and the end of 2014, agri-environment activities were promoted through Environmental Stewardship (ES). This scheme had two strands; Entry Level Schemes (ELS) and Higher-Level Schemes (HLS). ELS agreements lasted for 5 years and encouraged a broad range of activities to provide environmental benefits, whereas HLS was a more targeted scheme with agreements lasting 10 years. ES closed to new agreements in December 2014 although existing agreements continue to be honoured until they expire, and 950 of 1500 HLS agreements due to expire in 2019 have been extended for a further year. In 2015 a new agri-environment scheme, Countryside Stewardship (CS), was launched with the first agreements commencing in 2016. This scheme intended to be more competitive and targeted, to achieve environmental priorities within local areas.
4.3.6.2 Evidence
England Biodiversity Indicator 22a reports on the amount of land managed under agri-environment schemes. This shows that since 2011 there has been a 2.5% increase in the amount of land under targeted AES agreements, with a total of 1.4 million ha of land managed under higher-level or targeted agri-environment agreements in 201743. Total land under agri-environment agreements reduced by 46% between 2013 and the end of 2017 due to expiring entry-level environmental stewardship agreements.
Further evidence for this section is drawn from literature (see Annex 1.1 Section 1.3.5) and expert opinion (see Annex 1.2), discussing the impacts of agri-environment schemes, including at a landscape scale.
4.3.6.3 What influence have incentive schemes had on delivering the long-term Outcomes?
Workshop participants considered that incentive schemes have had a moderate to significant contribution to establishing more coherent and resilient ecological networks (see Figure 6)
43 England Biodiversity Indicators, available at https://www.gov.uk/government/statistics/england-biodiversity-indicators.
0
2
4
6
8
10
12
Min
or
con
trib
uti
on
Mo
der
ate
con
trib
uti
on
Sign
ific
ant
con
trib
uti
on
Sub
stan
tial
con
trib
uti
on
Low
Med
ium
Hig
h
Figure 6 The extent that incentive schemes have contributed to progress. Responses to pre-workshop survey (n=14)

Evaluation of Biodiversity 2020
53
There are many examples providing evidence of positive local impacts of AES, both in the UK, including those cited in the 2016 Monitoring and Evaluation Programme Annual Report44, and throughout Europe45. For example, a study looking at the effectiveness of HLS agreements deploying the Farmland Bird package (FBP - a package designed to deliver suitable nesting and year-round foraging habitat for key farmland bird species), found that 42% of species assessed (11 species) showed either a significantly greater increase in abundance, or a significantly smaller decrease, on FBP farms compared to areas where no bird-friendly AES management was in place. A further 27% of species (7 species) showed a positive, but non-significant, response of abundance to FBP management46. Furthermore, breeding bird surveys on 68 farms under targeted agreements between 2008 and 2014 showed more positive changes in abundance for the majority of surveyed species compared to surveys in the surrounding countryside (although regional variation was observed), and there were no species for which changes in abundance were more negative on farms with targeted AES in place47. Carvell et al. (2015)48 showed that local (patch-level) densities of males and queens of three out of four bumblebee species were significantly increased on AES managed wildflower patches compared to controls.
However, some studies report a more mixed picture of both positive and negative impacts across different species. For example, a study into the impacts of Environmental Stewardship on farmland birds found that most option types showed a balance of positive over negative associations, for example AES options delivering winter seeds (overwinter stubbles and wild bird seed mixtures) had benefits for granivorous farmland birds at local and landscape scales49,50. However, for other options such as arable margins, hedgerows and arable fields there were a fairly even spread of positive and negative impacts, and for ditch management, cultivated margin, field corner, lapwing plot and wet grassland categories, there were more negative than positive associations51.
There are also some clear species success stories, for example that of the Cirl bunting (see Annex 1.1 Section 1.3.5.3), whereby application of AES agreements to encourage species-specific habitat management, have supported recovery of species populations locally, and at a
44 OATWAY, R. (2018). Agri-Environment Monitoring and Evaluation Programme Annual Report 2016/17- A summary of findings from recently published projects. Natural England Research Reports, Number NERR074. http://publications.naturalengland.org.uk/file/5285810244419584 45 E.g. Batáry, P., A. Báldi, D. Kleijn, and T. Tscharntke. 2011. Landscape-moderated biodiversity effects of agrienvironmental management – a meta-analysis. Proceedings of the Royal Society B-Biological Sciences 278:1894–1902; Scheper, J., A. Holzschuh, M. Kuussaari, S. G. Potts, M. Rundlöf, H. G. Smith, and D. Kleijn. 2013. Environmental factors driving the effectiveness of European agri-environmental measures in mitigating pollinator loss – a meta-analysis. Ecology Letters 16:912–920; Tuck, S. L., C. Winqvist, F. Mota, J. Ahnström, L. A. Turnbull, and J. Bengtsson. 2014. Land-use intensity and the effects of organic farming on biodiversity: a hierarchical meta-analysis. Journal of Applied Ecology 51:746–755. 46 RSPB, 2017, Assessing the effectiveness of HLS agreements deploying the Farmland Bird Package 2011–2016. 47 Walker et al. (2018) Effects of higher-tier agri-environment scheme on the abundance of priority farmland birds. Animal Conservation 21:183-192 doi:10.1111/acv.12386. 48 Carvell, Claire, Bourke, Andrew F. G., Osborne, Juliet L. and Heard, Matthew S. (2015) Effects of an agri-environment scheme on bumblebee reproduction at local and landscape scales. Basic and Applied Ecology, 16 (6). pp. 519-530 49 Baker, D.J., Freeman, S.N., Grice, P.V. & Siriwardena, G.M. 2012. Landscape-scale responses of birds to agrienvironment management: a test of the English Environmental Stewardship scheme. Journal of Applied Ecology 49: 871–882 50 BTO. Not yet published. Impacts of Environmental Stewardship on Bird Populations in Farmland 2005-2017: Report to Natural England. Defra project LM0472. 51 BTO. Not yet published. Impacts of Environmental Stewardship on Bird Populations in Farmland 2005-2017: Report to Natural England. Defra project LM0472.
Evaluation of Biodiversity 2020
54
landscape scale. Cirl buntings showed significantly higher increases on land managed under AES options (146%) compared with non-AES land (58%) between 1992 and 2003, demonstrating the potential for delivery of population-scale recovery through AES. However, the limited range of this species means that AES was able to influence a large proportion of the population to make a difference at the population scale. While lessons can be learnt from this process, it is more challenging for land management actions to have population scale effects for species with a larger range, unless the scale of delivery can be increased to cover the required proportion of a population52.
4.3.6.4 Are the schemes ensuring that individual actions are working together at a landscape scale?
There is still some uncertainty about the extent to which positive impacts of AES seen at the local-scale, translate into positive impacts at the landscape-scale. There is some evidence in the literature demonstrating landscape-scale impacts of AES for particular species, but only when targeting is appropriate. For example, there is evidence of the landscape-scale impacts of AES on birds53,54, butterflies55, bees56, water quality57, and overall landscape character58. A common conclusion of these studies is that the targeting needs to be applied correctly to achieve impact, such as targeting population limiting factors in birds (winter food resource) or the appropriate seeds sown to attract different bee species. It has also been found that the extent and quality of AES managed land in the landscape may be more important than configuration in determining the overall impact59.
However, one study concluded agri-environment schemes are making only a limited contribution to reducing fragmentation and enhancing ecological networks. There is little evidence to suggest that areas of high habitat fragmentation are the focus for habitat creation, and very little difference in the uptake of habitat creation options between areas that are highly fragmented and those that are less fragmented60. Targeting of habitat creation to areas that are highly fragmented may therefore be beneficial to increase connectivity and to meet landscape scale objectives.
52 Walker et al. (2018) Effects of higher-tier agri-environment scheme on the abundance of priority farmland birds. Animal Conservation 21:183-192 doi:10.1111/acv.12386. 53 Baker, D.J., Freeman, S.N., Grice, P.V. & Siriwardena, G.M. 2012. Landscape-scale responses of birds to agri-environment management: a test of the English Environmental Stewardship scheme. Journal of Applied Ecology 49: 871–882 54Walker, L.K., Morris, A.J., Cristinacce, A., Dadam, D.,Grice, P. V. & Peach, W. J. 2018. Effects of higher-tier agri-environment scheme on the abundance of priority farmland birds. Animal Conservation 10.1111/acv.12386. 55 Zingg, Silvia & Ritschard, Eva & Arlettaz, Raphaël & Humbert, Jean-Yves. (2019). Increasing the proportion and quality of land under agri-environment schemes promotes birds and butterflies at the landscape scale. Biological Conservation. 231. 39-48. 56 Carvell, Claire, Bourke, Andrew F. G., Osborne, Juliet L. and Heard, Matthew S. (2015) Effects of an agri-environment scheme on bumblebee reproduction at local and landscape scales. Basic and Applied Ecology, 16 (6). pp. 519-530 57 Assessment of the water quality outcomes from agri-Environment & development of an associated Rural Development Programme (RDP) ‘impact’ indicator for Agriculture & Water Quality. Available from: http://randd.defra.gov.uk/Document.aspx?Document=14031_ECM6717_FinalReport_Submit.pdf 58Monitoring the contribution that Environmental Stewardship is making to the maintenance and enhancement of landscape character and quality: Report of the Rapid Survey (2014-2016). Available from: http://randd.defra.gov.uk/Document.aspx?Document=14222_RapidSurvey2014to2016Report_V3.0(1).pdf 59 Zingg, Silvia & Ritschard, Eva & Arlettaz, Raphaël & Humbert, Jean-Yves. (2019). Increasing the proportion and quality of land under agri-environment schemes promotes birds and butterflies at the landscape scale. Biological Conservation. 231. 39-48. 60 Assessing the contribution of agri-environment schemes to climate change adaptation. Available from: http://randd.defra.gov.uk/Document.aspx?Document=14225_AtkinsContributionofAEStoCCadaptationRev3FINAL.pdf

Evaluation of Biodiversity 2020
55
The CS facilitation fund aims to encourage coordinated landscape-scale delivery To improve the landscape-scale impacts of individual AES agreements, a Facilitation Fund was established in 2015 to provide funding for groups of farmers and landowners to work together to deliver shared environmental outcomes that go beyond what could be achieved by individual holdings. £7.2 million was made available between 2015-2020 to pay facilitators to coordinate action amongst farmers and other land managers working in collaboration. To date 98 groups have been set up across England, funded through the Natural England Facilitation Fund, involving 2240 land managers and 453,000 ha of land. The UK 6NR61 reports that early indications suggest alignment and option choice is better informed, aided by the focussed training and advice provided by the group facilitator.
Large-scale assessment and targeted monitoring will address questions about landscape-scale impacts A new species monitoring strategy and analytical approaches to quantify the relationship between the extent of AES intervention and the responses of taxa at local and landscape scales, has been developed and will provide evidence of the population distribution and abundance responses for a number of species, in relation to AES interventions62. This evidence will enable a better understanding of the landscape-scale impacts of AES on mobile species.
4.3.6.5 What factors have contributed to or hindered the success of incentive scheme approaches?
A number of factors are highlighted in the literature and through expert opinion as influencing the success of incentive schemes.
Factors influencing scheme uptake:
• Insufficient financial gain - Feedback from farmers and stakeholders suggests that in some cases payments were considered to be too low, with upfront capital costs of entering the scheme and carrying out works cited as a barrier to uptake63,64. Conversely, financial gain was also cited as a reason for land-owners entering into schemes65.
• Insufficient guidance was considered a barrier to making applications. The CS scheme was considered too complex or inflexible and the application process too lengthy65, impacting on decisions to apply where guidance was not available.
• Poor administrative management for setting up agreements, inspections and processing payments may have led to CS having a poor reputation in the rural sector66, which deterred farmers from applying.
61 JNCC. 2019. Sixth National Report to the United Nations Convention on Biological Diversity: United Kingdom of Great Britain and Northern Ireland. JNCC, Peterborough. 62 Staley, J.T., Siriwardena, G.M., Smart, S.M., O’Connor, R.S., Henderson, I.G., Jarvis, S.K., Jones, N., Freeman, S.N., Redhead, J.W., Carvell, C., Hallam, C., Jitlal, M. (2016). A study to develop the scope for monitoring landscape-scale biodiversity impacts of agri-environment schemes in England, final report to Natural England, project ECM 42922 63 Format For A Prioritised Action Framework (PAF) for Natura 2000 – England. 2016. http://jncc.defra.gov.uk/pdf/PAF_England_2016.pdf 64 Results taken from the following news release. Full survey results could not be obtained. https://www.nfuonline.com/news/latest-news/cs-scheme-too-complex-survey-reveals/ 65 Initial Evaluation of the Implementation of Countryside Stewardship (CS) in England, 2018. 66 CLA ‘Improvement Plan for Countryside Stewardship’ https://www.cla.org.uk/sites/default/files/FINAL_CLA%20_CS_improvement%20plan2018.pdf

Evaluation of Biodiversity 2020
56
• Fit with current management or personal values – A poor fit with currently implemented land management was cited as a reason for farmers not entering into CS agreements. Conversely, where there was a good fit with the currently implemented land management practises, and when schemes are in accordance with personal values and attitudes towards the environment, this encouraged uptake65.
• Scheme longevity - the longevity of management of Environmental Stewardship is likely to have contributed to the success of the scheme, by increasing stakeholder confidence and uptake. Scheme longevity is also important for maintaining the biodiversity benefits of schemes, with a risk that some of the benefits of habitat creation or restoration delivered under ES could be lost if agreements are not renewed under CS. There is some evidence that some farmers have continued with management started under HLS, but on a voluntary basis without entering into CS, which will continue to contribute to benefits to biodiversity, but won’t be captured in AES uptake statistics, making it difficult to fully evaluate the biodiversity benefits of AES.
• One-to-one advice - Personal contact with an advisor is considered important to engage with landowners and facilitate take-up of CS agreements; restricted resources for advisors and facilitators in National Parks was cited as a reason for a lack of uptake of CS agreements in these areas.
Factors influencing effectiveness of implementation
• The provision of guidance and advice is important for guiding correct targeting and implementation of actions and therefore improving biodiversity outcomes. Evidence suggests that the setting up of individual agreements was found to be a critical stage in determining the success of interventions and that outcomes could be improved by increasing the accuracy of feature identification and ensuring that the right options are used in the right locations There was also evidence that improved guidance, advice and training in specific areas could be beneficial, for example to ensure ongoing appropriate management beyond the initial set-up67.
• Spatial Targeting – experts suggested that the inability to target uptake to priority areas is likely to hinder overall progress towards biodiversity targets. This is supported by some evidence from literature suggesting that targeting of habitat creation to areas that are highly fragmented would be beneficial to increase connectivity and to meet landscape scale objectives60.
• Tightly prescribed options enabling effective communication to landowners of the actions necessary was suggested by workshop participants to improve the effectiveness. Conversely, the inflexibility of options has also been cited as a reason for poor scheme uptake, particularly in some areas such as the uplands.
4.3.7 Q.6 Which approaches were most effective and how cost-effective are the different approaches to landscape-scale conservation?
4.3.7.1 Introduction
This question aims to compare the effectiveness of the different approaches in delivering progress towards establishing more coherent and resilient ecological networks.
67 Oatway, R. (2018). Agri-Environment Monitoring and Evaluation Programme Annual Report 2016/17- A summary of findings from recently published projects. Natural England Research Reports, Number NERR074. http://publications.naturalengland.org.uk/file/5285810244419584

Evaluation of Biodiversity 2020
57
4.3.7.2 Evidence
To compare the effectiveness of the different approaches to landscape-scale conservation, ideally comparable data on delivery of environmental benefits from the different approaches, are needed. Examples of such data include the extent of habitat creation/restoration, local species trends under different management options, changes in habitat connectivity, or changes in habitat condition under different management options. Ideally these would also be linked to biodiversity trends at a landscape-scale. To compare cost-effectiveness, data on financial expenditure for each scheme would also be needed. However comparable data of the type described are not available. Instead, insights were gained through pre-workshop questionnaire responses and discussions at the expert workshop.
4.3.7.3 Evaluation
The modal category selected by workshop participants for the extent of contribution to establishing more coherent and resilient ecological networks, was ‘moderate’ for both incentive schemes and management of designated areas, and ‘minor’ for partnership scheme delivery (see Figures 4-6).
‘Higher level Environmental Stewardship’ was selected by the highest number of participants as contributing most progress towards improving habitat condition, increasing habitat extent, and increasing habitat connectivity; ‘management of SSSIs’ was selected by the highest number of participants as contributing most progress towards restoring degraded ecosystems and safeguarding ecosystem services. However, participants noted and generally agreed that they were more likely to be aware of the schemes and impacts of better funded and longer running schemes, making it difficult to compare the impacts and effectiveness between different schemes. They also noted that some schemes receive much more funding so would be expected to have more impact. However, the scale of impact is difficult to measure without knowing the baseline or having a counterfactual to compare against. Participants agreed that proper evaluation of the impacts of schemes and initiatives would be needed to make accurate comparisons.
Participants suggested some general factors which affect the impact or effectiveness of schemes. These are:
• Easily communicable actions, linked to goals. The ability to communicate to stakeholders and landowners exactly what needs to be done to achieve goals, improves the success of schemes. The tight prescription of AES options was given as an example of where this has been effective. However, the inflexibility of AES options under CS has also been cited as a reason for poor scheme uptake in some areas.
• Schemes with longevity. Participants considered that stakeholders and landowners are less likely to engage in a scheme if they don’t have faith that it will be long lasting, and that scheme longevity helps build trust and encourages uptake, improving success. Environmental Stewardship was given as an example of a successful scheme with longevity.
• Engagement with stakeholders. Schemes that deal directly with the people who carry out actions (such as AES schemes) are more effective than schemes which are slightly removed from direct stakeholder engagement. Success often depends on the presence of advisors who can communicate across different disciplines and provide advice to people implementing the scheme.
• Schemes with stakeholder buy-in to Outcomes. Schemes work better when there is stakeholder buy-in to the Outcomes; where the people delivering on the ground have been engaged with the Outcome, there has been better success, such as with the Cirl
Evaluation of Biodiversity 2020
58
bunting recovery project where landowners were engaged with the objective of re-introducing Cirl buntings. Working in partnership with stakeholders is an effective way of gaining stakeholder buy-in to projects.
• Strategic frameworks at local and regional levels. Schemes based on regional priorities and goals, which scale up to national objectives, can be effective. For example, the Breckland project was effective at engaging stakeholders around regionally set priorities and goals. Workshop participants agreed that having locally set priorities and objectives aids planning for delivery at local and regional levels, and that local delivery is important for overall success.
Overall there is a lack of available evidence to compare the impacts and effectiveness of different schemes. To ensure comparison of the effectiveness of different types of scheme is possible in future, detailed and accurate quantitative information on the environmental contributions of the schemes, along with full costs, would be needed.
4.3.8 Q.7 What lessons can be learnt for future strategic actions to support the establishment of more coherent and resilient ecological networks?
4.3.8.1 Introduction
This question examines the lessons that can be learnt to improve progress in future. Evidence supporting this section comes from discussions at the expert workshops (see Annex 1.2) along with lessons learnt from the evaluative evidence assessed (see Annex 1.1).
4.3.8.2 Evaluation
The following key lessons have been identified:
Partnership working has influenced success Across the different types of schemes, partnership or collaborative working has been highlighted as a key factor influencing success of delivery of landscape- scale conservation. In some cases, improved collaboration or better join-up between agencies has been highlighted as a possible way forward to address barriers to progress (e.g. for tackling off-site issues to improve condition of SSSIs).
Partnerships break down barriers between organisations, enable common goals to be set and worked towards, and can open up access to funds and delivery at scales which wouldn’t otherwise be possible. They also encourage stakeholder buy-in to goals, driving action. There is evidence that partnerships have more impact when they have a strong mandate and support from government, but they require resourcing to set up and continued resourcing to enable employment of dedicated coordinating staff is cited as a factor influencing success. Partnerships should involve an appropriate range of partners depending on the situation and goals, to ensure partners can influence delivery.
Short-term funding and resource constraints hinder progress for some projects Resource constraints are often cited as a barrier to progress, particularly in terms of whether a project can continue after the initial funding period has ended, or whether the necessary management actions identified, can be implemented. Short-term funding also hinders project longevity, which has been suggested as an important factor in gaining support and trust from stakeholders and encouraging voluntary uptake of initiatives.

Evaluation of Biodiversity 2020
59
Provision of one-to-one advice and guidance can help build trust, improve voluntary uptake, and improve outcomes Investing in local advisors and project officers to engage with stakeholders and provide one-to-one advice can help build trust and confidence and encourage voluntary uptake of initiatives such as AES. Furthermore, receiving advice, support and training aids the correct targeting and set up of agri-environment agreements, and helps ensure that management actions are applied correctly. Given the extent of private land ownership, investing in building these relationships with individual landowners is important for delivery of biodiversity improvements across the landscape.
A lack of coherent spatial prioritisation and planning for biodiversity is hindering progress The presence of a clear spatial plan of what we want to achieve and where has been lacking; this would enable local plans to be developed incorporating spatial targets for biodiversity, to help achieve this.
Mainstreaming of biodiversity could improve progress; better valuation of biodiversity and a mandate to support biodiversity goals could help. To improve progress more widely, nature/biodiversity needs to be seen as fundamental to a range of other agendas and explicitly planned for rather than seen as a by-product. Workshop participants noted that more could be done to ‘mainstream’ biodiversity, to remove the tension between current agendas within government, as well as across the public and private sectors, which were identified as a hindrance to progress: for example, the housing growth agenda is thought to be in conflict with biodiversity goals. Better valuation of biodiversity would help inform cost/benefit analysis, enabling clearer communication of the value of biodiversity across sectors and helping to make biodiversity more central on the agenda of a wider range of sectors. Also, a mandate to support biodiversity would ensure better consideration for biodiversity goals in decision-making.
Clear, time-bound, and scalable, goals with intermediate milestones aid communication of what we want to achieve and monitoring of progress
Goals need to be clear so they can be easily communicated to stakeholders, with time-bound targets and intermediate milestones to enable monitoring and reporting of progress; this helps provide a sense of accountability and ensure delivery can be modified in line with monitoring of progress to help ensure targets are achieved. Goals should also be scalable to ensure that locally appropriate targets can be set, in the context of the overall framework/Strategy. Participants also suggested that longer term sustained objectives help to maintain stakeholder buy-in and confidence. A lack of clarity over the current goals was seen as a hindrance to progress; i.e. we do not know what a more coherent and resilient ecological network looks like, which makes motivating action and measuring progress towards achieving it particularly difficult.
Reliable, accurate and up-to-date records aid monitoring of progress To enable accurate monitoring of progress, reliable up-to-date measures are needed, particularly robust measuring of habitat in terms of net gain, connectivity and condition, and losses of habitat through development/planning. Monitoring and updating of records should be done frequently enough to enable assessment of progress, and to feed back into improving management plans. A lack of knowledge of progress has been cited as a barrier to generating efficient landscape management plans, as the underlying issues that need to be addressed are not well known. Monitoring the impact of interventions is also important to determine what works and to improve delivery.

Evaluation of Biodiversity 2020
60
4.4 Priority Action 1.3: Recovery of Priority species
4.4.1 Introduction to Priority Action 1.3
Priority Action 1.3 aims to take targeted action for the recovery of priority species, whose conservation is not delivered through wider habitat and ecosystem approaches.
Within the Strategy, activities under Theme 1 Priority Action 1.1 to improve habitat and ecological networks, and actions under Theme 3 to reduce pressures on biodiversity (e.g. from Invasive non-native species (INNS), air and water pollution, etc.) are the primary mechanisms through which recovery of a wide range of species is expected to be delivered. However, some species may require more targeted action for population declines to be reversed. Within the Strategy, greatest priority for targeted action is given to those ‘at most risk of extinction, and those for which England has a particular international responsibility, for example, species that are endemic or which are threatened at European or global scales’. This focusses on Priority Species, which is a list of 943 species drawn up as required under Section 41 of the NERC Act68 (also referred to as S41 species). This is a revised list of the species found in England which were identified as requiring conservation action under the UK BAP69 and which continue to be regarded as conservation priorities70.
Specified activities under this Priority Action in the Strategy include establishing a prioritised program of targeted actions for Priority Species. By establishing species recovery plans, actions can be prioritised and stakeholders, including local communities, engaged to deliver particular actions. These actions can be of many types, such as education and awareness raising, improving species knowledge, policy-related, habitat management, survey and monitoring, or specific species management actions. The different action types would be expected to be delivered through different mechanisms; for example, habitat management could be delivered through agri-environment agreements, and through management of the public estate and of NGO estate. Species management and survey/monitoring is likely to be delivered through partnerships with NGOS and other agencies.
Direct pressures on species from humans are also considered, with the aim to reduce pressures by ensuring relevant species are given sufficient protection, along with reducing wildlife crime. The Strategy highlighted the need to work with partners, public bodies and authorities to implement these actions. NGO and voluntary bodies also play a key role in delivering projects aimed at improving the status of specific species, which will contribute to the success of this Priority Action.
The intervention logic for Priority Action 1.3 can be found in Annex 2.1 Section 1.2.1.
This Priority Action was evaluated through: (i) a review of indicators and evidence from published literature and reports, (ii) questionnaire responses and interviews with 8 Natural England taxon experts to gather further insight into the Species Recovery Programme, and (iii) a one-day stakeholder workshop with 16 participants representing Defra and partner organisations, NGOs and academia.
68 https://www.legislation.gov.uk/ukpga/2006/16/contents 69 UK BAP species are those that were identified as being the most threatened and requiring conservation action under the UK Biodiversity Action Plan (UK BAP). The list was created between 1995-1999 and revised in 2007. 70 Along with species on the original UK BAP list, the Hen Harrier has also been included on the list because it was deemed that without continued conservation action it is unlikely that the Hen Harrier population would increase in England.

Evaluation of Biodiversity 2020
61
4.4.2 Q1. What actions/activities have been delivered?
Progress on delivering key activities identified in the Strategy under Priority Action 1.3 is summarised in Annex 2.1 Table 1.2.
The activities set out in the Strategy have been delivered to some extent. A key activity was to agree a prioritised programme for recovery of priority species. A total of 3759 actions were identified to support the recovery of priority species. Three percent of these actions have been completed whilst another 38% are underway. These actions span survey and monitoring, habitat management, research, species management, site protection, education and awareness raising and policy or legislation. Different actions are expected to have different delivery mechanism; for example, a significant proportion of habitat management work would be expected to be delivered through agri-environment agreements and management of public estate, whereas survey/monitoring and specific species management actions are likely to be delivered through working in partnership with NGOs and other agencies.
Wildlife legislation has been reviewed and number of recommendations made. A continuation of funding for the National Wildlife Crime Unit to 2020 was agreed, to continue to address wildlife crime.
Alongside activities specifically funded by government programmes, and taken forward explicitly in response to the Strategy, numerous species-specific projects have taken place funded through external organisations such as NGOs, National Lottery Heritage Fund (NLHF), EU LIFE and other conservation funding schemes. Furthermore landscape-scale action to improve habitat quality, extent and connectivity, and actions to reduce environmental pressures from pollution and INNS amongst others, are key activities expected to improve the status of species.
4.4.3 Q2. Has the status of priority species improved?
4.4.3.1 Introduction
This question aims to assess whether the status of England’s 943 priority species has improved since the introduction of Biodiversity 2020 in 2011. The status of species can be assessed in several ways, including measuring changes to population abundance, distribution, or overall threat status which may take into account both of these aspects. However, measuring species abundance and distribution is often difficult and resource intensive. Therefore, proxy measures, such as indicators which are based on a smaller selection of species, are often used to inform assessment of status of a wider group of species.
The Defra Biodiversity Programme Board (DBPB) have previously agreed the recommendation by the Terrestrial Biodiversity Group (TBG) that ‘Overall improvement in the status of wildlife should represent an increasing trend in each of the B2020 species indicators and those sub-indicators representing specialist species, including for Priority Species’ and that ‘In addition to determining species status, an assessment of ‘conservation action underway’ should be made for each Priority Species to indicate progress in implementing the key conservation measures required for their recovery’. We adopt these recommendations here, using the priority species indicator (UK level and the new England level indicator) along with information regarding progress in implementing the identified conservation actions for each species, and the movement of species along their recovery curves, to assess progress in improving the status of priority species.

Evaluation of Biodiversity 2020
62
4.4.3.2 Evidence
The quantitative metrics indicating progress towards improving the status of priority species are summarised below:
a) England Biodiversity Indicators Two of the England Biodiversity Indicators relate directly to Priority species (Indicators 4a and 4b); however, these indicators are at a UK level, so mask where trends may be different in different regions. They also include species which do not occur in England (i.e. 152 of the 215 species in the UK abundance indicator are England priority species).
An England Priority species distribution indicator has been developed based on 91 species in England only. This includes fewer species than the UK indicator (91 species in the England indicator compared to 714 in the 2018 UK indicator – See Annex 2.1 Appendix 1.1), however the regional focus may be useful in determining changes to trends in priority species in England.
As these indicators are restricted in the species they include, they are unlikely to be representative of trends in all priority species. For example, species which are particularly rare or difficult to detect and monitor are much less likely to be included in the indicator due to a lack of species records, and thus some of the most vulnerable species may not be represented.
The trends in priority species, as captured by Indictors 4a, 4b and the updated ‘England-only’ version of indictor 4b, are shown in Table 3 below.
Table 3 Trends in Priority species
Indicator Year last assessed
Trend
Indicator 4a – Abundance of priority species (UK level)
2015 Statistically-significant, long-term declines of 68% and short-term declines of 18% (2010-2015) in the abundance of Priority Species71. Since 2010, 42% of species showed an increase and 58% showed a decline
Indicator 4b – distribution of priority species (UK level)
2015 No significant trend in species distributions in the
long or short term71. Since 2010 39% of species
are showing an increase and 35% showing a decline.
Indicator 4b – distribution of priority species (England level)
2015 Statistically-significant long term declines of 48% (1970-2015). No significant trend in the distribution of priority species in the short-term (2010-2015). The index was 9% lower in 2015 than in 2010, with 55% of species decreasing and 24% of species increasing (See Annex 2.1).
At a UK level the picture is mixed, with abundance trends continuing to decline, and distribution trends remaining stable. The decline in the England distribution trend is likely to be due to the taxonomic skew of the species represented, with the trend mainly representing that of moths, which have shown clear declines in distribution in England. These trends are
71 England Biodiversity Indicators, available at https://www.gov.uk/government/statistics/england-biodiversity-indicators.

Evaluation of Biodiversity 2020
63
supported by wider species trends in England, which show, 60% of vascular plant species, 50% of butterflies and 62% of birds declined since 200272.
Although these indicators show little progress overall in improving the status of priority species, within the indicators some species are increasing (42% of species in Indicator 4a, 39% of species in Indicator 4b and 24% of species in the England distribution indicator). The picture is complicated further due to the fact that different species will have had different starting baselines; for example:
• some species have undergone historic declines, and are now showing signs of recovery due to a change or removal of the pressure(s) that caused these historic declines (e.g. some bat species, see Annex 2.1 Section 1.3.3.3.5; species which have previously been persecuted);
• some species have been declining, but have benefited from ongoing targeted actions which have stabilised or reversed the declining trend (e.g. marsh harrier, Cirl bunting, see Annex 2.1 Section 1.3.3.3.5);
• some species are continuing to decline despite targeted actions (e.g. dormice, see Annex 2.1 Section 1.3.3.3.5;);
• some species are stable or increasing despite little targeted action, but possibly because of habitat changes at a landscape-scale
Future work to understand why some species are improving whilst others are still declining will be important in helping to understand ‘what works’ and to inform future conservation action.
b) Movement of species along their recovery curves
The 10 steps on a species’ recovery curve chart progress from understanding of biological status and autecology, through trialling and implementation of recovery actions, to achievement of ‘Least Concern’ status (Annex 2.1 Figure 1.5). Taxon groups assessed the position of species on their recovery curve based on expert opinion in 2006, and again in 201473, enabling an assessment of progress during that period.
Just over a third of species moved along their recovery curve by at least one step between 2006 and 2014. However, two thirds of species did not move along their recovery curve. The average number of steps moved differs across taxonomic groups with greater progress for vertebrates and terrestrial invertebrates (See Annex 2.1 Table 1.4). The average position on the recovery curve in 2014 for most taxonomic groups (all except vertebrates) remains at the stage of establishing species status, with the vast majority of species at stages 1, 2 (establishing species status) or 4 (understanding species ecology). Within vertebrates there are more species at stages 4-7, which suggests species status are better understood for this group, so progress is at the stage of understanding species ecology, causes of decline, and researching and embedding solutions.
72 Hayhow DB, Burns F, Eaton MA, Bacon L, Al-Fulaij N, Brereton T, Brookman E, Burke O, Butler J, Davis J, De Massimi S, Gambling P, Lewis S, Macadam CR, Mathews F, Meredith C, Newson SE, Noble DG, O’Hara D, Pearson J, Stevenson K, Tansley D, Winder F, Wynde RM and Gregory RD (2016) State of Nature 2016: England. The State of Nature partnership. 73 Natural England Paper 41.3 - Biodiversity 2020 Outcome 3 Species – Progress update, presented to DBPB Meeting 5th July 2018.

Evaluation of Biodiversity 2020
64
Although individual organisations may have more recently assessed some groups, the assessment has not been repeated and centrally recorded across all groups since 2014, so evaluation of movement along recovery curves from 2015 onwards is not possible.
c) Progress in implementing conservation actions
A total of 3759 actions74 were identified as priority actions to aid the recovery of priority species. The status of these actions is shown in Figure 7. Three percent of these actions have been completed whilst another 38% are underway75. Some actions may remain ‘underway’ for a long time; for example, species monitoring and habitat management actions are often an on-going, open-ended commitment. Over half of the list of actions are yet to be included in planned works (aspirational). At least one action is underway or has been completed for 608 out of 943 priority species.
There is some taxonomic skew with a larger proportion of identified priority actions being completed or underway for vertebrates, vascular plants and marine invertebrates, than other taxonomic groups (Annex 2.1 Table 1.6). A larger percentage overall of urgent and high priority actions are completed or underway, compared to medium and low priority actions. Conversely a higher percentage of low and medium priority actions remain aspirational (Annex 1.2 Table 1.6). This provides some evidence that resources are targeted towards those actions considered to be higher priority.
Figure 7 Status of species actions
It is unclear from looking at the overall picture of action status against movement along recovery curves, how well actions translate into movement along the curve. The average number of steps moved appears to increase as more targeted actions are underway/complete, however there is substantial variation suggesting that the impact of actions on movement along the recovery curve may depend on the species and/or the action (Annex 2.1 Figure 1.7)
d) Responses of workshop participants
74 This is an evolving list of actions, so this total number is the number of actions identified as of 5th December 2018 (personal communication from Natural England). 75 Information correct as of 5th December 2018
Species Actions
Aspirational
Underway
Completed
Planned
Discontinued

Evaluation of Biodiversity 2020
65
The majority (12/14) of the respondents to the pre-workshop survey responded that there has been progress ‘only for a few/some priority species’, with only 2/14 respondents selecting ‘progress for many priority species’. No respondents thought there had been ‘no progress’, ‘progress for most priority species’, or ‘progress across all priority species’.
7/14 respondents scored the extent of progress for the species which progress had been made as ‘some progress’; 4/14 respondents think there has been significant progress and 2/14 think progress has been minor.
4.4.3.3 Evaluation
Progress has been made in terms of prioritising and implementing actions for many priority species, with a small number of examples where actions have led to improvements for species in terms of increasing distribution or abundance trends. There has been more substantive progress in terms of improving knowledge and understanding of species autecology and reasons for decline. No actions have been initiated for over a third of species, suggesting that progress may be limited for these species.
However, there are large gaps in the knowledge base available to assess progress. Some species trends, and centrally recorded data regarding the position of species on their recovery curve, were last updated 4-5 years ago. Although information for some taxa have been updated by NGOs or experts, this hasn’t been collated centrally, so the available data and information for many species is out of date. Updating this evidence across all taxa is essential to better understand progress.
4.4.4 Q3. What actions and activities, to include species-specific actions, legislation and actions to combat wildlife crime, have been effective in supporting the recovery of priority species? What factors have influenced progress?
4.4.4.1 Introduction
This question aims to assess what has worked well in supporting the recovery of priority species where there has been an improvement, and why? It also considers factors that have hindered progress and what has prevented more significant progress in improving the status of priority species. For the purposes of this evaluation, only activities relating to the key actions specified in the Strategy are considered. However, it is acknowledged that many other activities and projects are likely to have significantly contributed to species conservation in England, including work carried out or funded independently by NGOs and other civil society organisations.
4.4.4.2 Evidence
Evidence to inform the evaluation comes from questionnaire surveys to Natural England species experts, responses to the pre-workshop questionnaire, discussions at the expert workshop, and from project reports. There is no central repository to record actions that have taken place to support the recovery of species at local or regional levels through the species recovery program, so the contribution of this important work is difficult to capture or evaluate.
4.4.4.2.1 Priority actions for species
Workshop participants agreed that having an agreed upon and prioritised list of actions needed for the recovery of each priority species, drawn up and agreed upon in consultation/partnership with stakeholders (NGOs and experts), has been helpful (see Annex

Evaluation of Biodiversity 2020
66
2). However, the current list of priority actions is not published, and there lacks a central communication point (e.g. website or online portal) to do so. Workshop participants considered that this limits accessibility, and reduces the visibility and prominence of the action list, reducing effectiveness for engaging stakeholders and driving action across spatial scales.
4.4.4.2.2 Species Recovery Program
The Species Recovery Programme (SRP) is the umbrella under which funding for targeted species conservation projects is administered by Natural England, and with overall responsibility for allocating funding to projects which address the priority actions identified to secure recovery of priority species. Funding is allocated each year, with project funding only guaranteed for a year, although funding may also be allocated in subsequent years. The Species Recovery Programme budget has fallen from its 2010/11 peak of some £1.72 million to £700,000 in 2017/18 – a decline of 60%76. Workshop participants strongly felt that the lack of long-term guaranteed funding negatively impacts the ability for long term planning across the time-scales necessary to ensure the recovery of species, and therefore limits progress. The most frequently mentioned future priority for the SRP across 8 survey respondents was the need to secure continued funding, with increasing the levels of funding also noted as a priority by some (Annex 2.1 Section 1.3.3.3.1). Participants felt that the SRP has a current focus on pre-recovery work, which is important but not sufficient to ensure species recovery.
The majority of projects under the SRP are delivered through partnerships with other organisations such as RSPB, Butterfly Conservation, Plantlife, BCT etc., commonly through MOA agreements, with significant resources and funding also contributed by the partner organisation. For example, over the two years 2016/17 & 2017/18 Natural England invested, in total, c£1.6M, which elicited an investment of over >£3M in cash and in kind from partners77. A smaller proportion of SRP spend is used to commission work by specialist contractors, and some is invested in projects led by Natural England’s Local Area Teams or used to contribute to wider National Lottery Heritage Fund (NLHF) projects that will deliver several million pounds worth of support to wider species conservation. This suggests that SRP investment in projects is achieving significant benefit in terms of leveraging additional investment from other sources.
Impacts of SRP
There is evidence that the SRP has had impacts in terms of improving the future prospects of species, through actions to improve species knowledge; implement habitat and land management solutions (e.g. supporting improved dormouse populations in areas under management78); survey and monitor species enabling discovery of new populations (e.g. bryophytes -Seligeria carniolica and Riccia canaliculata), and tracking species population trends; and species management work including carrying out translocations, and reintroduction of species (e.g. Pool frog; Wart-biter bush Cricket, Dormouse). There is less evidence for impacts in ‘influencing site protection or designation’ or ‘influencing policy or legislation’. It was noted however that the previous successes of the SRP in terms of recovering species (e.g. Cirl bunting, Red kite), are often celebrated as examples of what can be achieved
76 Natural England Paper 41.3 - Biodiversity 2020 Outcome 3 Species – Progress update, presented to DBPB Meeting 5th July 2018. 77 Information from Natural England. 78 Goodwin, C.E.D., Suggitt, A.J., Bennie, J., Silk, M.J., Duffy, J.P., Al-Fulaij, N., Bailey, S., Hodgson, D.J., McDonald, R.A., 2018. Climate, landscape, habitat, and woodland management associations with hazel dormouse Muscardinus avellanarius population status. Mammal Review 48, 209-223.

Evaluation of Biodiversity 2020
67
through species-based conservation, which helps drive policy and gains public interest and awareness.
There is a perceived lesser impact of the SRP in the area of engagement and education, with opinions expressed that current work of the SRP focusses on aspects such as technical investigatory and pre-recovery work, which do not necessarily lend themselves to public engagement.
However despite the lack of focus on engagement and education work, many examples were given of successful public engagement/education work that has taken place, including engaging with stakeholders and landowners (e.g. Operation Turtle Dove project and short-haired bumblebee project); involving volunteers in species monitoring (e.g. NBMP, NDMP, monitoring Starlings in Bristol); volunteer involvement in project delivery (e.g. Wart-biter project, threatened butterflies project, Breckland programme); engaging with local conservation communities and expert societies; and public engagement activities such as public viewing sites (Cypripedium calceolus reintroduction) and public interpretation (e.g. B2020 messages were incorporated into displays at Kew Gardens). A number of factors have been suggested as influencing successful engagement work. These included having an organisation or individual specifically carrying out targeted work to engage people, including having a communications plan to disseminate information and feedback to volunteers. Technology such as mobile apps (e.g. iSpot79 and Mammal Tracker80) and social media, were highlighted as important engagement tools, particularly for younger generations. Other impacts include enabling larger externally-funded projects to be set up, for example the NLHF funded Back from the Brink project81 which aims to recover 20 species and benefit many others.
4.4.4.2.3 Landscape-scale habitat management
Agri-environment schemes are a key mechanism through which habitat management to benefit species is encouraged in England, through payments to farmers and land managers to manage their land in particular ways. Under Countryside Stewardship, the Wild Pollinator & Farm Wildlife Packages (WPFWP) were introduced to make it easier for farmers to develop applications that would support the ambition of improving the farmed environment for farmland birds and pollinators. A new Threatened Species Supplement is also available in Higher Tier CS to support management focussed on the conservation of specific priority species. A 2017 report by Natural England noted that this package had been introduced on 48 agreements covering over 600 hectares across a wide variety of habitats, to provide bespoke habitat management for such Section 41 priority species as Turtle Dove, Corn Bunting, Greater Horseshoe Bats and Brown Hairstreak82. However, it is too soon to evaluate the impacts of these packages in terms of supporting the recovery of particular priority species.
79 An online platform to share, log and help identify wildlife observations. https://www.ispotnature.org/ 80 An app to enable people to submit mammal observations http://www.brc.ac.uk/mammal_tracker/ 81 The SRP was instrumental in developing the species knowledge and background needed for the development of this project. https://naturebftb.co.uk/ 82 Natural England, 2017. Countryside Stewardship: A review of progress.

Evaluation of Biodiversity 2020
68
There are many examples providing evidence of positive local impacts of AES, both in the UK, and throughout Europe83as discussed in Section 4.3.6.3. For example, Walker et al. (2018)84 found that 12 out of 17 priority bird species, along with the Farmland Bird Indicator, showed more positive changes in abundance on AES farms in at least one region, than in the surrounding countryside, and 8 species exhibited sustained responses to AES management in at least one region.
There are also examples of agri-environment schemes effectively implementing targeted actions to improve habitat for particular species across the species range, resulting in local species recovery. One such example is that of the Cirl bunting (see section 4.3.6.3), whereby targeted actions to improve winter stubble helped to achieve recovery of this species. However, the limited range of this species means that AES was able to influence a large enough proportion of the population to make a difference at the population scale. It is more challenging for land management actions to have population scale effects for species with a larger range, such as the turtle dove or skylark, unless the scale of delivery can be increased to cover the required proportion of a population. Walker et al (2018)52 estimate that 26-33% of the populations for species in the Farmland Bird Indicator would need to be subject to AES-type management to affect a population level change and offset ongoing declines.
Workshop participants felt that Countryside Stewardship lacks the flexibility to target species or to geographically target the scheme, limiting its ability to affect species recovery. Specific species recovery strands with the required flexibility and impetus on species recovery, were suggested as a solution to address this issue. Furthermore, improved uptake of schemes would be necessary to impact species population recovery, particularly for more widespread species. One-to-one advice was noted as an important ‘tool’ to improve both the uptake of options, and also to ensure targeting is appropriate and effective. Also, positive engagement with stakeholders and landowners has helped enable success in projects requiring landscape scale uptake of habitat management, including the Cirl bunting recovery, Operation Turtle Dove, and short-haired bumblebee project. There is some evidence to support the benefit of having dedicated project officers as a point of contact and to coordinate the project and engagement work, to improve project success.
4.4.4.2.4 Legislation
Reviews of wildlife legislation85 and of the NERC Act86 have made a number of criticisms of both, including that wildlife legislation is overly complicated, and that there is currently a lack of reporting requirements, enforcement measures, or statutory procedures for updating schedules and lists of relevant species/habitats, which are hindering the effective
83 E.g. Batáry, P., Dicks, L.V., Kleijn, D., Sutherland, W.J., 2015. The role of agri-environment schemes in conservation and environmental management. Conservation Biology 29, 1006-1016.; Scheper, J., A. Holzschuh, M. Kuussaari, S. G. Potts, M. Rundlöf, H. G. Smith, and D. Kleijn. 2013. Environmental factors driving the effectiveness of European agri-environmental measures in mitigating pollinator loss – a meta-analysis. Ecology Letters 16:912–920; Tuck, S. L., C. Winqvist, F. Mota, J. Ahnström, L. A. Turnbull, and J. Bengtsson. 2014. Land-use intensity and the effects of organic farming on biodiversity: a hierarchical meta-analysis. Journal of Applied Ecology 51:746–755. 84 Walker et al. (2018) Effects of higher-tier agri-environment scheme on the abundance of priority farmland birds. Animal Conservation 21:183-192 doi:10.1111/acv.12386. 85Final report is available here: https://s3-eu-west-2.amazonaws.com/lawcom-prod-storage-11jsxou24uy7q/uploads/2015/11/lc362_wildlife_vol-1.pdf 86 House of Lords, Select Committee on the Natural Environment and Rural Communities Act 2006. Report of Session 2017–19. The countryside at a crossroads: Is the Natural Environment and Rural Communities Act 2006 still fit for purpose? Published March 2018. Available at: https://publications.parliament.uk/pa/ld201719/ldselect/ldnerc/99/99.pdf

Evaluation of Biodiversity 2020
69
implementation and enforcement of policy. Improvements to legislation are yet to be implemented owing to the need to consider the implications of EU exit in the approach to wildlife legislation.
There are however some examples of public bodies taking action for species (see Annex 2.1 Section 1.3.3.3.2), providing some limited evidence that the duty under the NERC Act requiring public bodies to have regard for the conservation of these species whilst exercising their functions, may be having some influence. However, it is not possible to causally attribute the action of these public bodies to the existence of the NERC Act, or to evaluate its’ effectiveness, without a counterfactual or in depth evaluation.
4.4.4.2.5 Tackling wildlife crime
The Government has committed funding for the National Wildlife Crime Unit until 2020. Together with the launch of a ‘Wildlife Crime Policing Strategy 2018-2021’ by the National Police Chief’s Council (NPCC)87 in 2018, this signals ongoing effort in tackling wildlife crime in England.
However, evaluating progress in addressing wildlife crime in England is made difficult by the lack of central recording of wildlife crime statistics, as most types of offence are not notifiable and are therefore not reported to the Home Office.
Several NGOs record wildlife crime incidents related to specific species or groups; these reports suggest wildlife crime is an ongoing, if not increasing problem in England88,89. The law commission review of wildlife legislation85 highlighted that penalties for wildlife crime are insufficient and do not act as enough of a deterrent. This view is also echoed in the BCT Bat Crime Report89, which states that “All too often the sentences imposed for bat crime have been insufficient to act as a deterrent resulting in the law being bought into disrepute as crime can be perceived as paying”.
Partnership working has been highlighted as an important factor for success in tackling wildlife crime. Intelligence on wildlife crime is submitted to the NWCU from numerous different organisations, including law enforcement agencies, NGOs, Crimestoppers, Government organisations and members of the public. Continued relationships between these organisations is beneficial to maintaining communications and to enable prompt action to combat wildlife crime. Where prosecutions have been successful, partnership working between organisations has been highlighted as an instrumental factor in the success.
4.4.4.3 What factors have influenced progress?
The following factors have been identified from the evaluative evidence and workshop discussions, as important in influencing progress.
Resources
87 The strategy can be found here: https://www.npcc.police.uk/documents/crime/2018/NPCC%20Wildlife%20Crime%20Policing%20Strategy%202018%20%202021.pdf 88 E.g. Birdcrime Report: An annual report published by RSPB to report on offences against birds of prey. The report for 2017 can be found here: https://www.rspb.org.uk/birds-and-wildlife/advice/wildlife-and-the-law/wild-bird-crime/the-birdcrime-report/ 89 Bat Conservation Trust, 2017. The Bat Crime Annual Report 2017. Available at: https://cdn.bats.org.uk/pdf/Our%20Work/Crime-report-2018-final.pdf?mtime=20181101151343

Evaluation of Biodiversity 2020
70
A lack of resources is preventing action from happening for more species. Workshop participants felt that for many species, the knowledge of what is needed is available, but resources to carry out the action needed is not. For some species, further autecological knowledge and understanding is needed before the most effective recovery actions can be identified or trialed, but a lack of resources prevents the research needed to gain this knowledge. Furthermore, a lack of local project or advisory staff to engage with landowners may have prevented wider uptake and efficient targeting of landscape scale agri-environment schemes, reducing the landscape-scale benefits of such agri-environment options aimed at species conservation.
Experts felt that long-term funding, when it has been present (i.e. typically from conservation organisations), has enabled better impact by assuring progress from gaining species knowledge, testing solutions, monitoring impacts and retaining expertise. The current short-term funding allocations in the SRP, i.e. funding typically only guaranteed for a year at a time, prevents long term planning of actions in line with the longer time-frames necessary to recover a species. This was identified as the most important factor influencing progress by workshop participants, and a frequently mentioned future priority for the SRP across survey respondents.
There have been reductions in funding to some core projects such as species monitoring and wildlife disease surveillance, which are needed to contribute to statutory reporting. Funding for some activities can be sought through other external funding sources, such as NLHF, but this tends to be project-based. Charitable funding bodies and trusts are less likely to provide continuous funding for core activities, which includes some monitoring, surveillance and research.
The SRP has been successful in achieving matched funding from partner organisations, and in developing project bids to obtain external funding in collaboration with partner organisations. These means of increasing the funding available for species recovery work helps to ensure the best value for money. Some previous methods of acquiring external funding, such as ‘Species champions’ (where they exist) gave a visibility to particular species and helped enable acquiring funding from other sources i.e. private businesses. However, in general workshop participants felt that more could be done to identify or develop innovative funding streams to drive money into species conservation.
Policy drivers and integration of biodiversity
Where external drivers of species population declines have been addressed through other policy or statutory frameworks, this has had a positive impact on priority species. For example, improvements in water quality brought about through measures under the Water Framework Directive, have benefitted Lampreys. Similarly, control of Invasive Non-Native Species and measures taken under the INNS Framework, have benefitted many native species, particularly where control measures have been implemented prior to native species reintroduction work. Furthermore, workshop participants felt that having a dedicated species recovery program has improved success for the recovery of priority species. However, workshop participants opined that there is not enough focus on ‘species’ in the current Strategy, with focus more on habitat and landscape-scale measures, and that an equal focus on species would strengthen the policy driver for obtaining funding and compelling action for species-based projects.
Workshop participants felt that a lack of integration of biodiversity/species across different policy areas, hinders progress for species. For example, large scale forestry continues to impact water quality which adversely impacts freshwater pearl mussels, so despite the significant investment in their recovery, without addressing this pressure they are still likely to decline.

Evaluation of Biodiversity 2020
71
Furthermore, where there has been integration of species recovery aims into landscape scale schemes such as AES, there has been demonstrated success for some species, particularly priority farmland birds. However, workshop participants felt that there is not enough scope or flexibility for integration of specific species recovery aims at present.
Partnerships, engagement and collective aims
Partnership working has helped improve progress both by increasing the expertise and resources available for carrying out species recovery work, improving cost-effectiveness, as well as enabling a wider range of stakeholders to be engaged and opening communication pathways which has enabled action at a larger scale and enabled more effective action to tackle wildlife crime. Where there is good engagement between stakeholders, including the public, around a focal species, this has created buy-in and achieved funding, which has supported success. Examples include the Restoring Ratty project, recovery of the Cirl bunting, the Short-haired bumblebee project and supporting recovery of the Bittern. A dedicated project officer as a point of contact and to coordinate engagement activities, is suggested as a good investment to improve success.
Workshop participants agreed that having an accessible, high profile and agreed upon plan of action for each species helps to facilitate buy-in, to define who has responsibility for action at different scales, and to drive collective action. Participants agreed that BAPs were the best example of this (prior to the Biodiversity 2020 Strategy). They recognised that the list of species priority actions developed under the current Strategy provides a detailed set of priority actions for many species, which were drawn up and agreed upon in partnership with many NGOs. However, these priority action lists are not published and participants considered that they are not readily accessible, and therefore they are perceived to be less effective than were BAPs at engaging stakeholders and driving action across spatial scales.
Some participants noted that collaborative working with, and partnerships directly involving landowners are important for improving voluntary scheme take up and scaling-up local successes to landscape-scale. The availability of one-to-one advisors improves engagement with landowners, facilitating scheme uptake.
Knowledge sharing
Effective knowledge sharing and learning from others can improve project effectiveness; for example, lessons were learnt through international knowledge sharing about rearing mussels for population enhancement and reintroductions, which helped improve project efficiency and effectiveness.
A lack of collective, open and accessible resource detailing actions taken place at local and regional levels and their impacts, has made applications for funding and reporting of impacts more difficult. The previous system – BARS (discontinued in 2016) - was discussed at the expert workshop, but participants disagreed over the merits and usefulness of BARS. It was agreed that a repository to collate information on actions taken and impacts, at different spatial scales, would be useful but it would need to be more user-friendly and better curated than BARS to ensure it would achieve what stakeholders need.
Species Prioritisation
The emphasis of the Strategy on Priority Species means that obtaining funding for projects aimed at other threatened species has been more difficult. Given the recent Red Listing exercises, updating the list of priority species may help ensure resources are targeted at those species most in need of immediate action.

Evaluation of Biodiversity 2020
72
Monitoring Progress
The evaluation of progress here was hampered by a lack of up-to-date information relating to species status and trends, and a lack of statistical information and evaluative evidence relating to wildlife crimes rates and the impact of wildlife crime in England. To accurately monitor progress towards species recovery, and to assess the influence of pressures on species, the right kind of data needs to be collected at frequent time intervals.
A lack of clear measurable and achievable targets was suggested by workshop participants as a factor that has hindered communication of goals or setting of measurable intermediates to enable monitoring of progress. Participants felt this also prevents there being a sense of real accountability for achieving targets.
4.4.5 Q4. What lessons can be learnt for future strategic actions to support recovery of priority species?
4.4.5.1 Introduction
This question examines the lessons that can be learnt to improve progress in improving the status of priority species in future. Evidence supporting this section comes from discussions at the expert workshops along with lessons learnt from the evaluative evidence assessed.
4.4.5.2 Evaluation
The following key lessons have been identified:
Ensuring species recovery requires planning and resourcing over long time-scales
Moving along the species recovery curve, from gaining species knowledge, understanding the causes for decline and how to address these, trialling solutions, and rolling out solutions across a species range to recover populations, is a long process. Where species projects have had the backing of a partnership with an NGO or conservation organisation and funding over longer time-scales than the year-by-year funding allocation under the SRP, this has enabled better progress, by ensuring that each stage of the process can be planned for, and learning capitalised on throughout the process, enhancing delivery. Continuity of projects also helps with ensuring stakeholder by-in by providing trust that the project will continue.
Integration of species recovery into landscape scale measures and across policy areas improves progress
Reducing external pressures on species, and providing the resources (habitat and food) needed for survival across their range, are critical to ensuring recovery. Success has been better where action has been able to affect a larger proportion of a species range. Where it has happened, integration of species recovery needs into landscape-scale conservation measures such as AES, to ensure the right habitats and resources are being created and improved in the right places, has helped species recovery by ensuring action happens across the species range. This requires appropriate targeting of action, along with sufficient scheme uptake, which requires resourcing for engagement of landowners to improve uptake. Furthermore, integration of species recovery goals into policies across sectors could help reduce the external pressures which are driving species declines.
Good communication with and between stakeholders can support efficient, collective action towards goals

Evaluation of Biodiversity 2020
73
Workshop participants and SRP survey respondents felt that having an agreed upon prioritised list of actions needed for each species, helped enable effective decision making with regards to resource allocation. However, lack of accessibility or communication of this list of actions meant it was less effective than could have been at engaging stakeholders and driving collective action across spatial scales. Improved communication and accessibility may improve the profile of the priority actions for each species, providing better stakeholder engagement, and a stronger driver for action.
Further, a lack of communication of actions and their impacts between stakeholders to enable building on previous knowledge may have reduced project efficiency. A better infrastructure to enable knowledge sharing between stakeholders and at different scales may help improve efficiency.

Evaluation of Biodiversity 2020
74
4.5 Priority Action 1.4: Conserving Agricultural Genetic Diversity
4.5.1 Introduction to Priority Action 1.4
Priority Action 1.4 aims to ensure genetic diversity in cultured plants, farmed animals and their wild relatives is conserved and enhanced wherever appropriate. This genetic diversity can make an important contribution to provisioning of food security by offering genes that are important for future crop or livestock breeding. By raising stakeholder awareness of the importance of genetic diversity along with issuing guidance on the conservation of genetic resources, establishing efficient ID and monitoring systems for genetic diversity, and incentivizing farmers to maintain and increase stocks of rare breed farm animals, the Strategy aims to encourage responsible management of genetic resources and to enhance and conserve agricultural genetic resources in situ. Alongside this, funding for fruit, vegetable and seed banks should enable ex situ storage of genetic diversity of cultivated plants and their wild relatives, for future use. These actions should ensure that agricultural genetic resources are conserved and enhanced, increasing resilience and contributing to long-term food security.
The intervention logic for Priority Action 1.4 can be found in Annex 3, Section 1.1.1. This visualises the Outputs, Intermediate (or short term) Outcomes and the long-term Outcomes that activities under this Priority Action aim to achieve. It shows how activities such as raising awareness and producing guidance, incentivising sustainable management of genetic resources, monitoring, and maintaining and enhancing ex situ collections, should contribute to improved management and conservation, and ultimately to a resilient agricultural genetic resource base, contributing to provisioning of long-term food security.
4.5.2 This Priority Action was evaluated through a review of indicators and limited evidence available from published literature and reports, together with responses of 9 members of the Farm Animal Genetic Resources committee (FAnGR) and UK Plant Genetic Resources Group (UKPGR), to a questionnaire to gather opinions on progress, the factors that have influenced progress, and the opportunities to improve progress in future along. Q1. What actions and activities have been delivered?
The key actions and activities that have been carried out since 2011 under the Strategy to help achieve the aims of Priority Action 1.4 are summarised in Annex 3 Table 1. This includes the development of best-practise guidance, inclusion of incentives to maintain and enhance stocks of rare breed farm animals in AES schemes, publishing the Farm Animal Genetic Resources (FAnGR) Breed inventory, developing the FAnGR Biodiversity Indicator, and maintaining and enhancing ex-situ storage of plant genetic resource through seed banks and live collections.
4.5.3 Q2. What progress has been made towards ensuring conservation of agricultural genetic resources in England?
4.5.3.1 Evidence
A number of metrics are available to measure the extent of genetic resources in England, as shown in Table 4. These measure in situ conservation of animal genetic resources and ex situ conservation of plant genetic resources. However, there are no available metrics to measure in
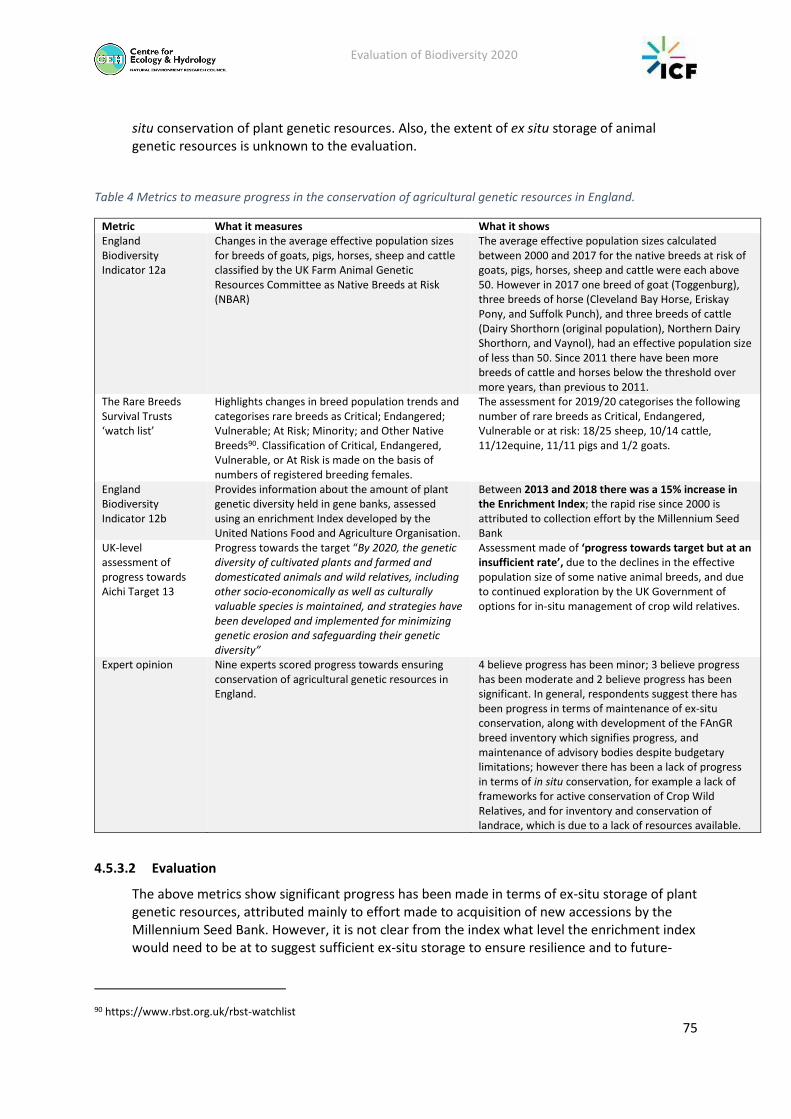
Evaluation of Biodiversity 2020
75
situ conservation of plant genetic resources. Also, the extent of ex situ storage of animal genetic resources is unknown to the evaluation.
Table 4 Metrics to measure progress in the conservation of agricultural genetic resources in England.
Metric What it measures What it shows England Biodiversity Indicator 12a
Changes in the average effective population sizes for breeds of goats, pigs, horses, sheep and cattle classified by the UK Farm Animal Genetic Resources Committee as Native Breeds at Risk (NBAR)
The average effective population sizes calculated between 2000 and 2017 for the native breeds at risk of goats, pigs, horses, sheep and cattle were each above 50. However in 2017 one breed of goat (Toggenburg), three breeds of horse (Cleveland Bay Horse, Eriskay Pony, and Suffolk Punch), and three breeds of cattle (Dairy Shorthorn (original population), Northern Dairy Shorthorn, and Vaynol), had an effective population size of less than 50. Since 2011 there have been more breeds of cattle and horses below the threshold over more years, than previous to 2011.
The Rare Breeds Survival Trusts ‘watch list’
Highlights changes in breed population trends and categorises rare breeds as Critical; Endangered; Vulnerable; At Risk; Minority; and Other Native Breeds90. Classification of Critical, Endangered, Vulnerable, or At Risk is made on the basis of numbers of registered breeding females.
The assessment for 2019/20 categorises the following number of rare breeds as Critical, Endangered, Vulnerable or at risk: 18/25 sheep, 10/14 cattle, 11/12equine, 11/11 pigs and 1/2 goats.
England Biodiversity Indicator 12b
Provides information about the amount of plant genetic diversity held in gene banks, assessed using an enrichment Index developed by the United Nations Food and Agriculture Organisation.
Between 2013 and 2018 there was a 15% increase in the Enrichment Index; the rapid rise since 2000 is attributed to collection effort by the Millennium Seed Bank
UK-level assessment of progress towards Aichi Target 13
Progress towards the target “By 2020, the genetic diversity of cultivated plants and farmed and domesticated animals and wild relatives, including other socio-economically as well as culturally valuable species is maintained, and strategies have been developed and implemented for minimizing genetic erosion and safeguarding their genetic diversity”
Assessment made of ‘progress towards target but at an insufficient rate’, due to the declines in the effective population size of some native animal breeds, and due to continued exploration by the UK Government of options for in-situ management of crop wild relatives.
Expert opinion Nine experts scored progress towards ensuring conservation of agricultural genetic resources in England.
4 believe progress has been minor; 3 believe progress has been moderate and 2 believe progress has been significant. In general, respondents suggest there has been progress in terms of maintenance of ex-situ conservation, along with development of the FAnGR breed inventory which signifies progress, and maintenance of advisory bodies despite budgetary limitations; however there has been a lack of progress in terms of in situ conservation, for example a lack of frameworks for active conservation of Crop Wild Relatives, and for inventory and conservation of landrace, which is due to a lack of resources available.
4.5.3.2 Evaluation
The above metrics show significant progress has been made in terms of ex-situ storage of plant genetic resources, attributed mainly to effort made to acquisition of new accessions by the Millennium Seed Bank. However, it is not clear from the index what level the enrichment index would need to be at to suggest sufficient ex-situ storage to ensure resilience and to future-
90 https://www.rbst.org.uk/rbst-watchlist

Evaluation of Biodiversity 2020
76
proof food provisioning. Furthermore, it appears much less progress has been made with in-situ conservation of plant genetic resources, including landrace and Crop Wild Relatives.
Although the index of effective population sizes demonstrates that only a small number of farm animal breeds have an effective population size below the threshold of 50 individuals, there has been no sustained improvement in this over the last 8 years, with more breeds of cattle and horses below the threshold over more years since 2011, than before. This suggests effective population sizes have been maintained rather than increased, and increased population sizes would be beneficial to those breeds falling below the 50 threshold. Although there is ongoing work to store ex situ genetic material in the form of semen and embryos, including from private breeders, the extent of progress of this work is unknown to the evaluation.
It was noted in the UK Country Report to the FAO on Animal Genetic Resources in 201391, that a main weakness was the absence of an improved, automated, cost effective FAnGR database supporting more regular monitoring of UK FAnGR. The introduction of the FAnGR inventory is likely to have improved collation and access to data on stocks of rare breed farm animal, thus improving monitoring, however there is no evidence to assess the impacts or effectiveness of this resource. Furthermore, the development of the FAnGR Biodiversity Indicator is likely to have improved monitoring and communication, and helped raise awareness.
4.5.4 Q3. What factors/actions have improved or hindered the management of genetic resources?
4.5.4.1 Evidence
Evidence for this question comes solely from the opinion of ten experts who responded to a questionnaire sent to members of the Farm Animal Genetic Resources committee (FAnGR) and UK Plant Genetic Resources Group (UKPGR), to gather opinions on progress, the factors that have influenced progress, and the opportunities to improve progress in future along with the challenges that need to be addressed (see Annex 3 Appendix 1). This is therefore not considered to be a comprehensive evaluation of factors influencing progress.
4.5.4.2 Evaluation
Respondents to our questionnaire have suggested several factors that have improved or hindered progress, as follows:
Factors improving progress
• Defra and EU funding for a) ex situ plant genetic resource genebanks has enabled maintenance of the genebanks and improved coverage of plants represented; and b) for AES supplements has encouraged keeping of ‘native breeds at risk’.
• An engagement with longer term commitments to the genebanks by Defra has allowed more rational and efficient approaches to be taken - although the length of commitment is still limited in some cases.
• Improved relationships between the NGOs in the sector should improve coordination and progress in future.
91 Country report supporting the preparation of The Second Report on the State of the World's Animal Genetic Resources for Food and Agriculture, including sector-specific data contributing to The State of the World's Biodiversity for Food and Agriculture - 2013
Evaluation of Biodiversity 2020
77
• The development and launch of the National Breeds Inventory as an online dataset updated annually and included in official National Statistics, has improved engagement and monitoring.
• Investments in new technology and computing power have allowed breed societies to develop more sophisticated in situ management and conservation programmes for native breeds.
• Work and investment by the private sector have led to reintroduction of breeding lines to some native breeds that had been lost in the live population. Private companies have continued to invest in Research and Development into new technologies such as the mainstreaming of semen sexing in cattle, in-vitro harvesting, fertilisation and maturation of porcine embryos and new ways to cryopreserve and resurrect avian species using germ cells.
• Government and industry have been working together in partnership since 2009 to improve market access for UK Farm Animal Genetic Resources allowing increased export sales that underpin conservation and development programmes.
Factors hindering progress
• A lack of integration of UK Genetic Resources Diversity Conservation with other conservation initiatives including Natural Capital programmes and designated sites, has restricted progress.
• Limitations of funding/resources/support have restricted further progress– i.e. lack of official recognition of the Lizard Peninsula genetic reserve. NGO’s and breed societies have faced challenges in fundraising for conservation programmes.
• A more integrated approach to gene banking could improve progress towards comprehensive coverage. International examples would include the CGN, Netherlands + Nord Gen, Scandinavia + USDA at Fort Collins, Colorado.
• Lack of framework for selecting reserves for proven genetic diversity in CWR taxa or for active conservation of CWR has restricted progress. Similarly, a lack of landrace inventory has restricted progress to establish a conservation plan.
• There exists a skills gap in horticulture - many collection holders are getting older without another generation being there to replace them. This could limit future progress.
4.5.5 Q4. Considering the progress since 2010, what more could be done in future to conserve and enhance agricultural genetic resources? What opportunities are there, and what are the barriers/challenges that need to be addressed?
4.5.5.1 Evidence
Evidence for this question comes solely from the opinion of ten experts who responded to a questionnaire sent to members of the Farm Animal Genetic Resources committee (FAnGR) and UK Plant Genetic Resources Group (UKPGR), to gather opinions on progress, the factors that have influenced progress, and the opportunities to improve progress in future along with the challenges that need to be addressed (see Annex 3 Appendix 1). This is therefore not considered to be a comprehensive evaluation opportunities and barriers.
4.5.5.2 Evaluation

Evaluation of Biodiversity 2020
78
Respondents to our questionnaire noted the following opportunities to enhance conservation of agricultural genetic resources in future, along with challenges to address:
• Public awareness and support are considered to be important, particularly for some of the NGOs which rely on membership to fund their work. Increasing public awareness around the necessity of conservation of agricultural genetic resources, could therefore improve availability of resources for work in future, and improve markets for native breeds.
• There may be opportunities to increase funding or conservation of genetic resources through levies; for example, contributions from horse race betting levies and from the Agricultural and Horticultural Development Board (AHDB) levy receipts.
• There may be opportunities to explore better integration of conservation of genetic diversity with other conservation programmes such as Natural Capital and designated sites; along with improving or developing frameworks to enable site designation for genetic resource value.
• Improvements in sequencing should make the identification of hotspots of genetic diversity in Crop Wild Relatives (CWR) easier. Mechanisms for conservation of taxa in identified hotspots would enable this information to be used to benefit in situ conservation of CWR diversity.
• A more comprehensive approach to conserving genetic diversity outside of national collections would complement the work that collections are doing. An inventory of UK crop landrace diversity would enable conservation plans to be developed to ensure in situ and ex situ conservation of landrace diversity.
• There may be opportunities to improve progress through better engagement with breed societies, and through better liaison between plant and animal genetic resource communities.
• The Agriculture Bill presents an opportunity to actively promote conservation of agricultural genetic diversity, including CWR and landrace as well as protecting native breeds. Recognition of conservation of agricultural genetic resources as a public good, could help raise awareness and support.
• Improvements to data collection and analysis methods for some species (e.g. horses, mountain sheep, poultry) would improve monitoring data
• Future challenges include the threat of new and emerging exotic diseases, which are increasingly likely as climate change leads to changes in species distributions.

Evaluation of Biodiversity 2020
79
5 Evaluation findings: Theme 2
5.1 Summary of key findings for Theme 2 (Putting people at the heart of biodiversity policy)
1 Theme 2 is comprised of three Priority Actions. Progress in this Theme primarily contributes to Outcome 4 (“By 2020, significantly more people will be engaged in biodiversity issues, aware of its value and taking positive action”), but has an indirect contribution to the other Strategy Outcomes.
Progress 2 Judging progress across the Priority Actions is challenging due to a lack of overarching
indicators or thematic evaluative evidence. There are some indications that awareness has increased (from the UK Business Biodiversity Barometer, but not Natural England’s MENE survey) and concern for the environment remains relatively high, but there does not appear to have been significant changes in the extent of positive environmental action being taken.
3 Priority Action 2.1 (work with the biodiversity partnership to engage significantly more people in biodiversity issues, increase awareness of the value of biodiversity and increase the number of people taking positive action), saw the successful set up of a ‘People Engagement Group’ by Defra. Whilst commissioning useful research, the group was dissolved part way through the Strategy implementation period. Stakeholders indicated that the group could have played a more substantive and ongoing role in providing research and supporting partnership working. A wide variety of actions and activities directly seeking to engage people have been delivered, some with Government support and others independently.
4 Organisations are becoming increasingly aware of green market opportunities and of the benefits and availability of tools to help them incorporate the value of biodiversity into their decision making. However, take-up is not widespread – and not aligned with increasing awareness. This applies to both the private and public sector. Whilst the Natura Capital Committee appear to have been influential in environmental policy design and improvements have been made to key guidance documents such as the HMT Green Book, it is not clear that the environment is being more broadly considered across government.
5 Innovative financing mechanisms are increasingly being trialled and piloted. However, they remain innovative and their anticipated potential as contributors to biodiversity funding is not yet being realised.
Indicators and evaluations 6 Monitoring and evaluation of progress was hindered by a lack of progress in developing or
updating relevant indicators. This is true at the overarching Strategy and target Outcome level, as well as for more specific aspects of the Strategy (for example, on use of biodiversity funding products). In addition, there have been limited thematic evaluations during the life of the Strategy – the Natural Environment White Paper Evaluation Framework appears to only have been partially implemented.
Communication and direct engagement 7 How and with what information people engage was found to be a critical factor across the
three Priority Action areas. Across the Priority Action areas, it was found that the terminology and language used can be a barrier to generating understanding and engagement of target audiences. Further, the messages on environmental issues and/or

Evaluation of Biodiversity 2020
80
5.2 Priority Action 2.1: Engaging people in biodiversity and the wider natural environment
5.2.1 Introduction to Priority Action 2.1
Priority Action 2.1 aims to “work with the biodiversity partnership to engage significantly more people in biodiversity issues, increase awareness of the value of biodiversity and increase the number of people taking positive action” (Defra, 2011).
Civil society organisations are expected to continue to play a key role in engaging members of the public in biodiversity issues and the wider natural environment, such as geodiversity. The Strategy recognises this, calling for renewed and expanded effort; with Government principally facilitating the sector in their role and creating the conditions to empower people to make a difference.
Improved awareness and understanding of the value of the environment is one route through which change is anticipated. However, research in the fields of environmental psychology and behaviour change reveal that there can be a much wider range of individual and contextual factors – beyond awareness - that can encourage or deter individuals from engaging with the
actions needs to be adequately framed, and speak to the likely motivators of the target audience - examples such as the Blue Planet TV series demonstrate the power of getting this right. In engaging citizens more broadly, and seeking to engage them in positive action, evidence is increasingly showing the importance of fostering a meaningful ‘connection’ with the natural environment.
8 Some cases demonstrate the benefits of peer-to-peer communication. For example, partnerships were identified, as an effective mechanism through which to share and build understanding and allow peers – particularly organisations - to share knowledge and build capacity. Community champions were identified as effective ways of engaging particular groups of the general public.
Enabling factors 9 Uncertainty was a key factor holding back progress, most notably regarding Priority Action
2.2 and 2.3. A lack of certainty in the longevity of a market, the extent to which competitors may also need to undertake similar action, or of the likely risk or financial return that may be achievable all have a limiting effect on action.
10 Promoting the benefits of engaging in actions targeted under Theme 2 – for businesses or for the public – was identified as necessary, although not sufficient. In some cases, particularly around business-related action, a strong requirement such as regulation was suggested by experts to be necessary.
11 There remains a need for capacity building and facilitation. A lack of capacity was found to be a constraining factor across Priority Actions. For example: 17% of the population stated that they would like to make lifestyle changes to benefit the environment but feel there are barriers to them doing so; businesses often struggle to understand how to effectively incorporate the environment into their decision making.
12 In a number of cases there is a need for supporting infrastructure that can improve access or the functioning of opportunities. This was identified in relation to market infrastructure for green business opportunities and investments, as well as to make it easier for the public to take positive action and lifestyle changes to benefit the environment.

Evaluation of Biodiversity 2020
81
environment and adopting pro-environmental behaviours. Outcome 4 of the Strategy recognises this, emphasising in addition to awareness, engagement and positive action.
This Priority Action was evaluated through a review of literature, interviews held with 13 experts representing government agencies, NGOs and academia and additional evidence provided by interviewees.
5.2.2 Summary of actions and activities delivered
Progress on delivering key activities identified in the Strategy under Priority Action 2.1 is summarised in Table 5.
Table 5 Theme 2 Priority 1 summary of actions and activities
Strategy activities - Key actions identified in the Strategy
Summary of activities delivered
Working with key stakeholders to enhance effectiveness. - Establish stakeholder working group as part of the Strategy’s governance structure. - Explore opportunities for synergies and greater partnerships and collaboration.
A Biodiversity People Engagement Group (PEG) was established. A Biodiversity segmentation scoping study, to help understand the attitudes, values, motivations and behaviours of key groups and how to engage them more effectively, was commissioned and delivered. However, the PEG was disbanded before taking any partnership- or action-oriented steps. Interviewees suggest that whilst an enthusiastic and diverse array of stakeholders were convened in the PEG, an unclear mandate and direction/leadership led to little concrete action (which might have implemented aspects of the PEG-commissioned scoping study) being taken by the group. UK Government led the establishment or offered support to partnerships, e.g. set-up of Local Nature Partnerships (LNPs) and Nature Improvement Areas (NIAs), establishment of a Green Infrastructure Partnership, support for initiatives, like Grow Wild.
Engage society in general & specific interest groups. - “Help for everyone to ‘do the right thing’, at home, when shopping, as volunteers.” - Initiatives to “get more children learning outdoors, removing barriers and increasing schools’ abilities to teach outdoors.”
A broad range of actions, some delivered by or with support from Defra, others independently by civil society organisations and others. For example: - Nature Improvement Area partnerships work with schools and other education centres to engage not only school groups but also teachers. - Supporting young people to experience, learn about, and care for nature, such as through Kew Garden’s ‘Grow Wild’ programme, the Forestry Commission’s ‘Active Forests’, and the Environment Agency’s junior angling support programme delivered by the Angling Trust. - Working with National Citizen Service, the Scout Association, Girlguiding, and others to make sure that young people’s participation in the Great British Spring Clean and other organised litter-picking activity is promoted and formally recognised in progress towards existing qualifications, awards and badges - Launch of #iwill4nature in 2019, an initiative growing environmental youth social action (green action) during the Year of Green Action. Defra also pledged to the #iwill

Evaluation of Biodiversity 2020
82
Strategy activities - Key actions identified in the Strategy
Summary of activities delivered
campaign, which aims to make social action a part of life for 10 to 20 year olds across the UK. - Dissemination of information via social media, reaching out a wide public. RBG Kew disseminates its science via Twitter and blog. - Festival of Nature 2016 - NGOs-Businesses partnerships, such as the case of Wild Challenge project, where RSBP partners with Aldi to explore new ways to connect children with the natural world
Access to green space - “New green areas designation, empowering communities to protect local environments.” - Improvement of quality and access of green spaces to everyone. Empowerment of local communities to this end.
A broad range of actions, some delivered by or with support from Defra, others independently by civil society organisations and others. For example: - Creation of a new “Local Green Spaces” (LGS) designation, and uptake in a number of local areas e.g. Chapel-en-le-Frith Parish Council Neighbourhood Plan allocated 14 LGSs - A £1.5 million fund was allocated by the Government to the Pocket Parks Programme in 2016, supporting 87 community groups to establish public green spaces in England - The Doorstep Greens initiative was set up to provide new or renovated green areas of public use close to people’s homes. It is a joint Natural England and New Opportunities Fund project. - The Parks Action Group, established in 2017, helps parks and green spaces in England meet the needs of communities - The Friends of Ashington Woods Project restored and enhanced local woods, and increase awareness of the woods with the local population.
5.2.3 Q1. Is there increased awareness and improved understanding of the value of biodiversity and wider natural environment?
There is little evidence that directly indicates people’s awareness and understanding of the value of biodiversity and wider natural environment. This section draws on relevant indicators where available, and insights from 13 expert interviews (see Annex 4 Section 2).
5.2.3.1 Progress
The Business Biodiversity Barometer92 provides an indication of the change in public understanding of biodiversity in the UK. Across two indicators (Figure 8) it shows that awareness has increased, although people able to give a correct definition of biodiversity remain a minority. Interviewees suggested that knowledge and understanding tends to be greater for global environmental issues than for UK-specific issues. Across the ten countries the Business Biodiversity Barometer survey is conducted in (which includes the UK), the survey reports that “awareness and understanding of biodiversity is growing globally. It is highest
92 Based on a sample of 1,000 UK consumer survey responses in each year. UK summary report available at: http://www.biodiversitybarometer.org/2018-uk

Evaluation of Biodiversity 2020
83
among youth. It also increases among lower incomes, becoming more mainstream.”93 Some interviewees also suggested that young people are the group with the greatest level of awareness. A few interviewees noted an increase in awareness especially since 2018, attributing this to increased media attention.
Figure 8 Change in UK public understanding of biodiversity, 2009-18
MENE data94 indicates that a large majority of the population agreed with statements regarding concern and importance of the natural environment and biodiversity – 86% of the population are concerned about damage to the natural environment, 94% recognise the importance of natural places and 87% see spending time outdoors as an important part of their life. These proportions are high across age groups, although strong agreement tends to be lower amongst younger age groups (which contrasts to the Business Biodiversity Barometer survey finding that ‘awareness and understanding of biodiversity’ is highest among youth) and increases with age. Agreement with the various statements has been fairly consistent over the last nine years.
5.2.3.2 Assessment of influencing factors
A number of interviewees suggested that increased coverage / prominence of biodiversity issues in the mainstream media was the main factor in recent improvements in people’s awareness. Interviewees frequently referred to TV programs, including BBC’s Blue Planet, which was characterised by one interviewee as a notable success when it comes to making people talk about biodiversity loss and what they can do about it as individuals. Social media was also considered to have played a crucial role in spreading messages and contributing to the understanding and awareness of the threats to biodiversity.
Many interviewees interviewed noted the importance of the framing and narrative associate with communication efforts. Interviewees suggested a need to move beyond information and knowledge-based campaigns to focus on an emotional relationship and connectedness with the natural world. It was suggested that knowledge-based messages are often difficult for people to relate to, whereas emotion-based messages can trigger a more direct and impactful
93 UEBT Biodiversity Barometer 2018. Available at: https://static1.squarespace.com/static/577e0feae4fcb502316dc547/t/5b51dbaaaa4a99f62d26454d/1532091316690/UEBT+-+Baro+2018+Web.pdf 94 A survey undertaken annually by Natural England, with a sample of at least 45,000 England residents each year

Evaluation of Biodiversity 2020
84
response. It was also suggested solutions and actions related to the issue being promoted should be communicated, rather than simply informing people of the problem, as people may better engage with the issue when they feel they can do something about it.
5.2.4 Q2. Are people engaging more with the natural environment?
Engagement refers to more than solely undertaking activity or visits to the natural environment. This section reviews evidence presented across: access to green space, visits in the natural environment, outdoor learning and education, and concerns and attitudes regarding the environment.
The response draws on a range of quantitative indicators, providing robust evidence on a number of specific aspects of engagement, in particular those from the Monitoring Engagement with the Natural Environment (MENE) survey95. This is coupled with evidence from literature and engagement programme evaluations and reviews, as well as evidence from expert interviews.
5.2.4.1 Progress
Access to green space:
MENE data96 indicate that for the vast majority of the population (93% agree or strongly agree) having access to open green space near where they live is important. This proportion has remained consistently high over the last nine years, although the proportion who strongly agree has declined slightly (from 49% in 2009/10 to 44% in 20017/18). The vast majority of the population indicate positive opinions regarding their access to local green spaces, although the proportions strongly agreeing with the stated positive opinions have declined (see Figure 9).
Figure 9 Perceptions of local green spaces – Agree and Strongly Agree responses (% of adults)
Research by the NLHF97 found that fewer park managers reported improved park quality over the last three years (2014-15) than did in the previous survey of 2014, and fewer park
95 Naturel England (2018). Monitor of Engagement with the Natural Environment. The national survey on people and the natural environment. Headline report 2018 96 Naturel England (2018). Monitor of Engagement with the Natural Environment. The national survey on people and the natural environment. Headline report 2018 97 HLF (2016) State of UK Public Parks. Heritage Lottery Fund

Evaluation of Biodiversity 2020
85
managers expected improvement over the next three years (2016-18). The NLHF report does not conclude on why this deterioration has occurred, although one of the possible reasons it suggests is the effects of reduced long term maintenance. Continuing falls in maintenance budgets and staff numbers were reported by vast majority of surveyed park managers. The NLHF report also cites a State of the Market report from the Association of Public Service Excellence (APSE)98 that found that 78% of local authorities agree or agree strongly that ‘the squeeze on public sector resources is affecting parks and green spaces disproportionately to other service areas’
The National Planning Policy Framework (NPPF), introduced a new ‘Local Green Space’ (LGS) designation, which allows local communities to identify and protect areas of significant importance to them via local and neighbourhood plans. There are numerous examples of its use e.g. the Chapel-en-le-Frith Parish (Derbyshire) Neighbourhood Plan 2013-2028 identified and allocated 14 areas of LGS.
Visits in the natural environment
The proportion of adults taking visits at least once a week has increased, from 54% in 2009/10 to 62% in 2017/18. The increase has been seen across population groups, including those for which levels of participation tend to be lowest (as shown in Figure 10).
Figure 10 Frequency of visits (at least once a week) by age, ethnicity and Index of Multiple Deprivation (% of adults)
Learning and education
No robust indicator of overall levels of learning and education activity in the natural environment is available. A number of projects and initiatives have promoted the concept. For example, all of the 12 Nature Improvement Area partnerships99 engaged with schools and further education colleges.
98 APSE (2016) State of the Market Survey 2016, Local Authority Parks and Green Space Services, Briefing 16-15, April 2016, p3. See: apse.org.uk/apse/index.cfm/members-area/ briefings/2016/16-15-local-authority-parks-and-green-spaces-state-of-the-market-2016/ [accessed 05/06/16] 99 Naturel England (2018). Monitor of Engagement with the Natural Environment. The national survey on people and the natural environment. Headline report 2018

Evaluation of Biodiversity 2020
86
A survey100 conducted with a sample of teachers in UK schools participating in the 2016/17 Outdoor Learning Day campaign indicates that nearly two fifths of participating teachers have increased time for outdoor lessons and that four fifths would like to.
The Natural Connections Demonstration Project101 engaged over 40,000 students. Participating schools reported statistically significant increases in the time spent on learning in the natural environment activity across all school terms. Over 90 per cent of schools surveyed agreed that learning in a natural environment was useful for curriculum delivery.
5.2.4.2 Assessment
A number of indicators point towards an increase in engagement – of various forms – with the natural environment.
Despite increases in visits in the natural across all subgroups, interviewees suggest that there remain disparities in accessibility, notably for urban and more deprived areas. Green spaces near where people live continue to be highly valued, although constrained budgets are putting pressure on the quality of parks. Interviewees indicate that access is still an issue – with less access in urban and more deprived areas. In general, a range of actions could still be taken to support and improve access of green spaces – both wild and managed parks. These should extend beyond basic transport and infrastructure access. Evidence indicates that many people do not feel welcome in natural spaces even though they are free, as these are perceived as exclusive102, pointing to a need to address non-physical access barriers.
The important role of champions or mediators was identified in evaluations from programmes across a range of interest areas – including encouraging black and ethnic minorities to visit national parks (where the role of community champions also helped address non-physical access barriers) and in encouraging schools to increase learning in the natural environment. Such models rely on the champions or mediators being adequately skilled and supported. Training and empowerment of champions can itself also bring benefits for those taking the roles.
A number of examples of success were provided where people have been offered a richer experience of interacting with the natural environment. These range from action-oriented experiences offering physical and mental wellbeing benefits, to more immersive or continual (i.e. multiple day) experiences. Interviewees pointed to a need to continue to move away from simply trying to get people active in nature, towards a more immersive or meaningful experience that builds a greater connection with nature. In relation to this, some interviews suggested a change of approach - shifting from “putting people at the heart of biodiversity” to “putting biodiversity at the centre of people’s lives”.
Making best use of the flexibility and interaction that can be achieved through use of modern online communication channels was highlighted as beneficial. Although it should be recognised that there can be significant work in maintaining a flow of high quality information via such channels.
100 Project Dirt (2018). The impact of outdoor learning and playtime at school – and beyond. A summary of the survey findings conducted for Outdoor Classroom Day 2018 101 Waite, S. (2016). Natural Connections Demonstration Project, 2012-2016: Final Report. Natural England Commissioned Report NECR215 102 Landscapes review - National Parks and AONBs: Review to consider the next steps for National Parks and Areas of Outstanding Natural Beauty sites (AONBs) in England. (2019) Letters between Julian Glover and Michael Gove setting out the interim findings of the designated landscapes review. July 2019

Evaluation of Biodiversity 2020
87
5.2.5 Q3. Are more people engaged in taking positive action for nature?
Positive action is an action with a positive impact on nature either now or in the future, directly or indirectly. Actions range from environmental citizenship actions (e.g. activism, engagement in environmental groups/petitions, practical volunteering) to private sphere actions including consumer purchases, lifestyle choices and waste disposal behaviour.
The response draws on a range of quantitative indicators, coupled with evidence from literature and engagement programme evaluations and reviews, as well as evidence from expert interviews (Annex 4 Section 2).
5.2.5.1 Progress
Evidence indicates little change in the volume of, or participation in, positive action that is closely related to biodiversity issues – although there are examples of successful initiatives. The MENE survey103 indicates an increase in walking instead of using a car, and an increase in recycling, whilst other pro-environment behaviours – some of which are more directly related to improving biodiversity – remain broadly unchanged. Interviewees suggest that over the longer term (i.e. longer than the period of Biodiversity Strategy 2020) there has been an increase in positive action. Such a trend is present in conservation volunteering104. However, interviewees suggested that patterns of volunteering were changing with people less likely to commit to long term actions.
A number of projects have successfully encouraged positive action, from the Blue Planet TV series, to the Wildlife Trusts 30 Days Wild campaign. Some multi-year campaigns, such as the Great British Beach Clean have seen participation increase.
Interviewees suggested that there had been little change in the type of people undertaking positive action, although young people were thought to be particularly vocal in ‘wanting’ to take positive action.
5.2.5.2 Assessment
Awareness of and access to opportunities:
MENE data105 indicates that approximately one third of people would like to make positive changes to their lifestyles to benefit the environment – but half of these (17% of people) have not yet done so due to barriers such as a lack of knowledge (a further 10% of the population did not know whether or not they are likely to make positive changes). Interviewees expressed a need to enhance people’s awareness of the opportunities and address barriers to accessing them. For example:
• Routes to improve awareness: ensure an understanding of what positive action is (and what benefits actions can provide), so that people can apply it in their lives; use peer group messaging to promote opportunities, and use more accessible language – such as nature and wildlife rather than biodiversity.
• Route to improve access: offer opportunities locally and outside of working hours, Ensuring that any supporting infrastructure that is needed is in place and practically accessible for potential users; covering the basic costs of volunteering to make it more accessible to lower income groups; ensuring that environmentally beneficial (or
103 Natural England (2018). Monitor of Engagement with the Natural Environment. The national survey on people and the natural environment. Headline report 2018 104 UK Biodiversity Indicators 2018. Conservation. Taking action for nature: volunteer time spent in conservation 105 Natural England (2018). Monitor of Engagement with the Natural Environment. The national survey on people and the natural environment. Headline report 2018

Evaluation of Biodiversity 2020
88
preferable) products or services are clearly labelled, making it easier for consumers to choose them, and/or using subsidies to ensure they are affordable.
Interviewees recognised that NGOs - as the main providers of organised positive action projects and campaigns - need continued adequate support and funding to provide these opportunities at various geographical scales and locations. By way of example, participation in the Bat Conservation Trust bat survey benefited from offering evening activities in urban areas; whilst the Green Gym initiative lost some volunteers because activities were always on weekends.
Promoting the benefits and enhancing the experience
Promoting benefits of positive action was raised by interviewees and broadly raised in the literature as a route to encouraging participation in positive action activities – be they personal benefits such as health and wellbeing or broader societal benefits such as the ability to influence Government policy e.g. through participating in citizen science campaigns such as the Great British Nurdle Hunt106.
Ensuring there is feedback of results of participation and of how actions are benefiting biodiversity can support continued involvement. Examples of external recognition include the Eco-Schools Green Flag. More generally, it was suggested that publicising results and recognition demonstrate to others that ‘everyone is doing this’ and hence may influence social norms around taking positive action.
Enhancing connectedness was suggested as a necessary factor, beyond increasing environmental knowledge, to encourage more positive action. An example of such a campaign was the Wildlife Trusts’ 30 Days Wild Campaign which sought to encourage people to undertake ‘daily acts of wildness’ and offered a selection of 101 options with particular pathways to connectedness. An evaluation107 reported significant and sustained (i.e. continuing after the end of the campaign) effects of the campaign on health, happiness and nature connection and pro-conservation behaviours.
5.2.6 Q4. Why have some schemes and initiatives been more or less effective in engaging people in biodiversity?
This section takes a cross-cutting view of what works and lessons learnt already touched on in the previous questions 1 to 3, drawing on the available literature and interviews.
5.2.6.1 Partnership working
Establishing the People Engagement Group (PEG) was one of the Priority Actions of the Strategy. The PEG was established by Defra and engaged a range of relevant stakeholders. Interviewees have mixed opinions about the extent to which the PEG played its intended supporting role (e.g. commissioning research) and enabled partnerships to be built. More broadly, the dissolving of PEG was thought to be a missed opportunity – (i) to use the PEG to influence and advise government, and (ii) to use the forum to help build cross-organisation
106 A citizen science initiative to collect help collect data on the distribution and presence of nurdles (the raw material of the plastics industry, used to make plastic products) along coastlines. For more information see: https://www.nurdlehunt.org.uk/ 107 Richardson, M. (nd). 30 Days Wild Evaluation Summary. And: Richardson M, Cormack A, McRobert L, Underhill R (2016) 30 Days Wild: Development and Evaluation of a Large-Scale Nature Engagement Campaign to Improve Well-Being. PLoS ONE 11(2): e0149777. doi:10.1371/journal.pone.0149777

Evaluation of Biodiversity 2020
89
partnerships. Interviewees were of the opinion that the PEG did not have sufficient mandate, weight or leadership to fulfil its potential.
A number of partnership projects and initiatives delivered awareness, engagement and positive action outcomes. For example, the evaluation108 of the Bees for Everyone (BfE) project reported that partnership working aided efficiency and effectiveness – from working with experienced people and benefiting from the skills of others, to pooling resources with partners seeking mutually beneficial outcomes. The Local Nature Partnerships evaluation109 found similar benefits. Some of the Nature Improvement Area partnerships reported110 that the partnership had improved how they worked with schools, although this was attributed to the additional funding made available for the task (rather than the nature of partnership working). Overall there is a lack of evidence on the benefits of partnership working explicitly within the context of awareness, engagement and positive action.
5.2.6.2 Community champions
Community champions or mediators were deployed in some projects to conduct outreach provide coordination and support to encourage target stakeholders to engage with the aims of the project. Two notable examples were the MOSAIC approach, which used community champions to engage black and ethnic minorities in Wales and encourage visits to national parks111; and the Natural Connections Initiative112 which used hub leaders to act as ‘local brokers’ to engage and support schools to increase learning in the natural environment. Such models rely on the champions or mediators being adequately skilled and supported. Training and empowerment of champions to take these roles can itself also bring benefits for those taking the roles, as was found in the MOASIC approach project in Wales.
5.2.6.3 Communication channels and messaging
One of the main actions of the Biodiversity 2020 PEG was to commission research113 exploring people’s engagement with biodiversity. The aim of the report was to guide the action of PEG members to where additional efforts to approach different societal groups may get the best outcomes. The report included recommendations on framing and communicating biodiversity messages – including avoidance of the term ‘biodiversity’ and other inaccessible language. However, as the PEG was dissolved it is not clear whether any coordinated effort to disseminate and promote the research recommendations was made.
A widely suggested example of successful communication was the Blue Planet TV series. Following the final episode of Blue Planet, online searches of ‘plastic recycling’ increased by 55% in the UK, as did searches for conservation charities: 169% increase of visits in the Marine Conservation website and 35% raise in visits to the Plastic Oceans Foundation – increases which may have been influenced by the Blue Planet TV series. The series is an example of successful framing, storing telling and impactful imagery – points raised by interviewees and the PEG-commissioned research as being necessary for effective communication.
108 Bees Conservation Trust (2017). HLF Evaluation Report. Bees for Everyone – saving the sound of summer. 109 ICF and Rick Minter (2015). Local Nature Partnership Phase II Evaluation. Final Report 110 Collingwood Environmental Planning (2015) Monitoring and Evaluation of Nature Improvement Areas: Final Report (2012-15). Defra Research Project WC1061 111 The Gilfillan Partnership (2015). Evaluation of the Mosaic Cymru project. Final Report Summary 112 Waite, S. (2016). Natural Connections Demonstration Project, 2012-2016: Final Report. Natural England Commissioned Report NECR215 113 Christmas, S., Wright, L., Morris, L., Watson, A., and Miskelly, C. (2013). Engaging people in biodiversity issues. Final report of the Biodiversity Segmentation Scoping Study.

Evaluation of Biodiversity 2020
90
Social media was also considered to have played a crucial role in spreading messages and contributing to the understanding and awareness of the threats to biodiversity. Web and/or multi-media platforms were recognised in a number of projects/initiatives as necessary to enable ongoing, flexible and relevant communication with target stakeholders or participants. However, it was also noted that this can be resource intensive, and that ‘using social media’ does not guarantee engagement114.
The role of peer-to-peer communication – such as via community champions as identified earlier – was noted by interviewees and visible in a number of different projects.
5.2.6.4 Focussing on connections with nature
Some interviewees pointed to a need to continue to move away from simply trying to get people active in nature, towards a more immersive or meaningful experience that builds a greater connection with nature. Evidence115 indicates that people’s connection, or relationship, with nature is an important determinant of their attitudes and likelihood to undertaken positive action.
A number of projects have sought to directly address people’s relationship with nature, providing more immersive, interactive and emotional activities to directly engage people with. These range from the relatively simple to the carefully curated – for example, from interactive walk-through exhibits at Durrell Conservation Trust Zoo, to the 30 Days Wild campaign116 which encourages daily participation in one of a list of carefully curated activities designed with regards contact, emotion, meaning, compassion and engagement with natural beauty, to specifically build participants’ connection with nature.
5.2.6.5 Access to opportunities for positive action
Whilst little evaluative evidence was available on how successfully projects have enhanced access to opportunities for taking positive action, it was a need raised by a majority of interviews and evident from the MENE data which indicates that nearly two fifths of the population would like make ‘positive lifestyle changes’ for the benefit of the environment but feel there are barriers to doing so.
A number of projects and initiatives offer skills training for volunteers or some form of feedback or recognition of achievement. This is suggested to help retain volunteers’ ongoing engagement and broaden the range of opportunities to them. A range of other measures were suggested by interviewees – from covering volunteer costs to increase access for lower income groups, to improving labelling on environmentally sensitive products to provide better signals to consumers.
114 As was found in: Festival of Nature 2016. Evaluation Report. Bristol Natural History Consortium (BNHC) 115 E.g. Lumber R, Richardson M, Sheffield D (2017) Beyond knowing nature: Contact, emotion, compassion, meaning, and beauty are pathways to nature connection. PLoS ONE 12(5): e0177186. https://doi.org/10.1371/journal.pone.0177186; and Otto, S. and Pensini, P. (2017). Nature-based environmental education of children: Environmental knowledge and connectedness to nature, together, are related to ecological behavior. Global Environmental Change, 47:88-94; Richardson, Miles; Hunt, Anne; Hinds, Joe; Bragg, Rachel; Fido, Dean; Petronzi, Dominic; Barbett, Lea; Clitherow, Theodore; White, Matthew (2019). A Measure of Nature Connectedness for Children and Adults: Validation, Performance, and Insights. Sustainability 11, no. 12: 3250 116 Richardson M, Cormack A, McRobert L, Underhill R (2016) 30 Days Wild: Development and Evaluation of a Large-Scale Nature Engagement Campaign to Improve Well-Being. PLoS ONE 11(2): e0149777. doi:10.1371/journal.pone.0149777

Evaluation of Biodiversity 2020
91
5.3 Priority Action 2.2: Incorporating biodiversity values into decision-making
The objective of Priority Action 2,2 was to “Promote taking better account of the values of biodiversity in public and private sector decision-making, including by providing tools to help consider a wider range of ecosystem services” (Defra, 2011: p39). The Strategy proposes a range of actions (see Annex 4 - Section 3) to improve understanding of the natural environment and encourage consideration of it in decision-making.
The evaluation of Priority Action 2.2 focusses on the following evaluation questions, examining progress, challenges, opportunities and lessons on what works:
1. Do businesses and organisations have better awareness of green market opportunities?
2. Has relevant guidance and tools been developed to support integration of natural values in impact assessments? To what extent is that helpful? Are some more helpful for that others and for which audiences - why?
3. Are natural values better integrated into private and public sector decision-making?
Key terms used in the evaluation of Theme 2 are explained in the introduction of each of the evaluation question response sections.
The evaluation of this Priority Action draws on a review of available evidence from literature (see Annex 4 Section 3) and expert opinion117 provided by 12 experts from academia, businesses, civil society organisations, Defra and its agencies, participating in a half-day evaluation workshop (see Evaluation Workshop Note Annex 4 Section 5) to provide an assessment against each of the evaluation questions. A list of participants can be found in Annex 4 Section 5.6. There is a vast range of sectors for which biodiversity, although relevant, does not directly impact on their area of work. In some sectors, such as the water industry, were links are more direct, engagement with experts as well as available literature were more readily available. This is reflected in Annex 4 and the evaluation responses below.
5.3.1 Q1. Do businesses and organisations have better awareness of green market opportunities?
The Biodiversity Strategy set out an aim to work alongside businesses to raise awareness, promote and support the development and uptake of green market goods and services opportunities.
‘Green market goods and services’ incorporate a range of opportunities across business sectors. This evaluation focused on a review of 12 opportunities (listed in
Table 6) identified by the Ecosystem Markets Taskforce (EMTF)118 as high priority and/or most promising in terms of their potential impact (EMTF, 2013; EMTF, 2012).
117 When we refer to expert opinion, henceforth we will mean that provided at the Evaluation Workshop. 118 A business-led initiative originally set up by the Government

Evaluation of Biodiversity 2020
92
This section draws on evidence from literature (see Annex 4 Section 3) and expert opinion119 (see Evaluation Workshop Note Annex 4 Section 5) to assess awareness and take-up of green market opportunities and the factors that have supported and hindered progress.
There have been no evaluations or comprehensive reviews of progress in awareness or take-up of green market opportunities in the UK. Global literature pointed to overall improvements in business awareness of biodiversity particularly with reference to multinational corporations (TEEB, 2012120;Winn & Pogutz, 2013121) and a positive impact of green markets on green entrepreneurship (Lotfi, Yousefi & Jafari, 2018122), but without qualifying these changes as to the extent that they were relevant to a particular country or sector. Hence, the evaluation of improvements in awareness of green market opportunities relied predominantly on expert assessment provided in the evaluation workshop. The evaluation of progress in take-up, drew on fragmented123 evidence in the literature and, where available, an assessment based on factors such as actual versus ‘expected’ uptake, comparisons with take-up in other countries or progress towards achieving environmental outcomes. There is better evidence on the barriers to, and supporting factors for, the uptake of green market opportunities.
5.3.1.1 Progress in raising awareness and uptake of green market opportunities
References in the literature (see Annex 4) suggested a general improvement in business awareness. Although a ‘lack of awareness’ was also identified across the literature as one of the factors limiting take-up of green market opportunities. Experts’ assessment in the Evaluation Workshop align with the literature, suggesting that businesses and organisations have increased awareness of green market opportunities (11 out of 12 ‘Slightly agreed’ with medium confidence). However, there is no reported measure, and insufficient evidence to conclude more specifically, on the extent of that improvement. Evidence indicates that awareness is not sufficient to stimulate uptake. The workshop indicates that take-up rates may be lower than the rate of increased awareness (see Figure 11).
In the absence of evaluative evidence on the uptake of green market opportunities, this study carried out a rapid review of progress across the green market opportunities specified as part of the initial Evidence Review. Table 6 summarises progress in awareness/up-take for each opportunity in turn, drawing on the available literature. The scope of each summary varies, depending on the evidence available.
119 When we refer to expert opinion, henceforth we will mean that provided at the Evaluation Workshop. 120 TEEB (2012). The Economics of Ecosystems and Biodiversity in Business and Enterprise. 121 Winn, M. I., & Pogutz, S. (2013). Business, ecosystems, and biodiversity: New horizons for management research. Organization & Environment, 26(2), 203-229. 122 Lotfi, M., Yousefi, A., & Jafari, S. (2018). The effect of emerging green market on green entrepreneurship and sustainable development in knowledge-based companies. Sustainability, 10(7), 2308. 123 Specific to the take-up of some of these opportunities by market segments

Evaluation of Biodiversity 2020
93
Figure 11: Awareness and take-up of green market opportunities (n=12)
0
2
4
6
8
10
12
Stronglydisagree
Slightlydisagree
Slightlyagree
Stronglyagree
High Medium Low
Agreement Confidence
Green market opportunities
Businesses and organisations have increased awareness of green marketopportunities
Businesses and organisations are increasingly taking-up green marketopportunities

Evaluation of Biodiversity 2020
94
Table 6: Summary of progress against green market opportunities
124 O’Brien, L., Ambrose-Oji, B., Hemery, G., Petrokofsky, G and Raum, S. (2018) Payments for ecosystem services, land manager networks and social learning. Forest Research, Farnham 125 OECD (2016). Environmental labelling and information schemes. https://www.oecd.org/env/policy-persectives-environmental-labelling-and-information-schemes.pdf
Green market opportunity Summary of progress
Biodiversity offsetting Approach remains voluntary. Slow take up with a shortage in both supply and demand of offsets and implications on the scale of benefits materialised (Baker et al., 2014)
Bioenergy and anaerobic digestion on farms
Initially slow, but rate of take up is increasing. Progress still considered “modest” compared to developments in other EU countries (NFU, 2018)
Woodland enhancement through wood fuel market
Evidence is inadequate for an assessment of progress. Some relevant initiatives are identified, however O’Brien et al. (2018)124 note that lack of awareness of these opportunities by woodland managers has restricted take-up.
Nature-based certification and labelling
Certification and labelling – largely voluntary - have become more widely adopted by businesses across sectors (OECD, 2016125, Addison et al., 2018126).
Water cycle catchment management
According to industry professionals “SuDS are beginning to become the norm” (Melville‐Shreeve et al., 2018), while an increased number of water companies have adopted catchment-based management approaches. Defra’s Catchment Based Approach (CaBA) was adopted by 93 catchments in England between 2011-13 (Defra, 2015)127. During 2017/18, CaBA partnerships delivered over 450 projects and leveraged millions from non-governmental funders.
Carbon abatement via a Peatland Carbon Code
Low take up. One peatland site has validated emissions benefits of restoration activities (in Scotland) and another are under development in Scotland, England and Wales (Peatland Code Registry128)
Developing the UK Ecosystems Knowledge economy
UK considered a leader in the development of guidance and tools to support the integration of natural values into decision-making. An increasing number of opportunities are available for businesses to further build and capitalise on the UK Ecosystems Knowledge economy.
Payment for Ecosystem Services (PES)
Overall low take-up. Defra’s PES pilot projects highlighted challenges in securing stakeholder buy-in and identified the lack of awareness of PES amongst the key factors (Defra, 2016129; Waylen & Martin-Ortega, 2017130).
Carbon sequestration as an 'Allowable solution'
Allowable solutions were part of the Government’s Zero Carbon policy to deliver zero carbon homes from 2016. However, in 2015 the Government revised its plans noting it does “not intend to proceed with the zero carbon Allowable Solutions carbon offsetting scheme…” (HM Treasury, 2015)131. Prior to 2015 there are limited examples of innovative projects adopting Allowable solutions.
Optimising the ecological and economic benefits of sustainable tourism
Some progress and increased business awareness. No overarching review of evidence or practices to allow an assessment.
Reducing risk for insurers through investment in green infrastructure
Little evidence on progress in terms of households investing in green infrastructure. No evidence that the insurance industry is making any meaningful contribution to flood management investment.
Developing environmental bonds as vehicles for investments in nature
Increased number of green bonds listed on the London Stock Exchange, although there is no disaggregated evidence to confirm whether their contributions to funding are spent within the UK.
Evaluation of Biodiversity 2020
95
5.3.1.2 Supporting factors and limitations
A number of factors were identified in the literature review and expert evaluation workshop which - to varying extents - contribute to awareness raising and encourage take up. These are summarised as:
Factors that support awareness-raising:
• Adequate awareness of opportunities and communication of the benefits of participation to businesses has been identified as necessary condition. Literature and examples of successes and past failures further suggest that awareness raising works best when tailored to the particular motivations of those it seeks to engage. Stakeholder engagement must also ensure there is an understanding and acceptance of new terms and concepts which tend to characterise new green market opportunities (e.g. natural capital).
• Partnership working can help disseminate knowledge of available opportunities and motivate participation through increased opportunities for organisations to share knowledge and build capacity.
Factors that build confidence and encourage take-up:
• Public funding (especially in initial stages) can provide confidence in the prospects and longevity of a new market, which is attracting to businesses.
• A robust policy grounding generates confidence in the market and provides clarity and assurance for businesses. Examples are found on both ends of the spectrum: Biodiversity offsetting and PES have demonstrated slow take up with stakeholders highlighting concerns around stability and uncertainty related to a lack of a strong policy signal. On the contrary, stakeholders identified the National Planning Policy as one of the key factors driving the uptake of SuDS.
• Sharing practical examples and guidance has proven effective in engaging stakeholders and can act to reassure risk-averse businesses. Pilots tend to offer opportunities for learning, though dissemination of those lessons varies.
Enabling factors:
• A clear institutional and technical framework is necessary to enable the normal functioning of green markets. Amongst the key elements providing assurance to market participants are guidance, standards, metrics, a registry of supply and brokers.
126 Addison, P. F. E., Carbone, G., McCormick, N. (2018) The development and use of biodiversity indicators in business: an overview. Gland, Switzerland: IUCN. vi + 16pp. 127 Defra (2015) Evaluation of the Catchment Based Approach: Phase 2. Final report: WT1559 128 http://www.iucn-uk-peatlandprogramme.org/peatland-code-registry 129 Defra (2016) Defra’s Payments for Ecosystem Services Pilot Projects 2012-15. Review of key findings. 130 Waylen, K., & Martin-Ortega, J. (2017). Exploring the ideas and views on PES held by professionals working on environmental management in the UK. 131https://assets.publishing.service.gov.uk/government/uploads/system/uploads/attachment_data/file/443897/Productivity_Plan_print.pdf

Evaluation of Biodiversity 2020
96
5.3.2 Q2. Has relevant guidance & tools been developed, to support integration of natural values in impact assessments?
Amongst the actions outlined in the Strategy was the development of guidance and tools that can support public and private sector actors integrate biodiversity into their decision-making. The Strategy made specific references to the integration of nature’s value in Impact Assessments carried out by the Government and further identified the need to develop guidance and support for businesses trying to assess their environmental impacts.
This evaluation considered ‘guidance and tools’ to encompass guidelines, tools, metrics and decision-support toolkits referring to the identification, quantification and assessment of environmental impacts and the valuation and integration of natural values in decision-making. Terms such as ‘natural values’ are much-debated in both literature and practice and were also discussed in the expert workshop. The evaluation took a wide view of ‘natural values’ with an understanding that they incorporate biodiversity to varying degrees, depending on the capacity of different valuation methods to capture values derived from biodiversity. Hence, the results below offer an overview but should not be considered an exclusive indication of progress in the area of biodiversity as overlaps exist with related concepts of ‘ecosystem services’ and ‘natural capital’.
This section draws on a review of available evidence from literature (see Annex 4 Section 3) and expert opinion132 (see Evaluation Workshop Note Annex 4 Section 5) to assess the availability and quality of guidance and tools and the extent to which they have supported users incorporate natural values in impact assessment and decision-making.
No comprehensive review or evaluation of guidance and tools was found. As part of this evaluation researchers carried out a review, identifying and collating a list of key documents and guidance, which offers an overview of progress made in the past 8 years (see Annex 4 Section 3). Largely missing from the literature reviewed, was an understanding of the quality, adequacy and effectiveness of these tools in supporting users. General views on the value of tools and guidance were provided by experts at the evaluation workshop.
5.3.2.1 Progress in developing guidance and tools A considerable number of guidance and tools have been developed in the past 8 years. They aim to support practitioners across sectors understand and assess the impact of their policies, products, services and/or processes on the natural environment, and incorporate natural values into decision-making.
Key guidance produced by the Government over this period included detailed guides on new approaches in the integration of specific impacts, the use of valuation tools and wider guidance combining latest knowledge and signposting readers to further resources. Amongst the latter were revisions to the Green Book and Supplementary guidance on environmental appraisal (HM Treasury, 2018)133.
An increasing number of tools, toolkits, resource hubs and online knowledge communities have emerged pooling together resources and providing further guidance, case studies and practical examples, which extend to support users in selecting the appropriate method or tool. Different tools and toolkits tend to focus in a specific area (e.g. Environmental Value Look-Up
132 When we refer to expert opinion, henceforth we will mean that provided at the Evaluation Workshop. 133 https://www.gov.uk/government/publications/green-book-supplementary-guidance-environment

Evaluation of Biodiversity 2020
97
Tool134), ecosystem (e.g. Woodland Valuation Tool135) or type of user (e.g. EcoBiz). However, some are more generic, such as Oppla knowledge marketplace136 providing a database of guidance, case studies and methods, and the Ecosystem Knowledge Network Toolkit137 bringing together a selection of 14 tools. Whilst results were not published at the time of authoring this report, the Ecosystem self-assessment checklist developed by EKN to support local partnerships, such as AONBs, explore “how they are currently applying an Ecosystem Approach to their planning and delivery” (EKN, 2015)138, is expected to support the assessment of progress towards Biodiversity 2020 Outcome 1C (Hunt & Wain, 2019)139.
5.3.2.2 Assessment of guidance and tools: availability, quality, effectiveness
The review established that a range of guidance and tools were developed which in their majority are publicly available. However, there is little evidence on user take-up and perceptions on the accessibility, quality or suitability of these tools in supporting the integration of natural values in decision-making processes. With reference to the Green Book Guidance140, an early review in 2014 (eftec)141 offered some insights from practitioners. A number of these have been taken into consideration in the Green Book revisions and the development of the Green Book Supplementary Guidance (HM Treasury, 2018), in the extent that it adopted suggestions to incorporate links to other guidance and policies and signpost users to additional documents, annexes and websites, thus not overflowing the core guidance with technical information.
Across the range of available tools some gaps and challenges remain. These primarily reflect the variety of approaches available, the complexity of concepts and range of impacts and user needs:
• Methods / approaches: Some gaps remain in the (i) valuation of certain ecosystem services, (ii) integration of wider social and distributional impacts, and (iii) monetisation of biodiversity
• Data availability, quality and transparency: there are challenges associated with ensuring a continuous flow of high quality data at the right scale
• Resources and efficiency: There are costs associated with ensuring there is adequate data, technical capacity, time and budget to use such tools, with some stakeholders querying the balance of the benefits of using these tools versus costs (in Howard et al. 2016). This was also raised as a concern by workshop participants.
• Scope of use: Both literature and workshop participants highlighted that there is a confusing number of tools available making the selection of the most appropriate one
134http://sciencesearch.defra.gov.uk/Default.aspx?Menu=Menu&Module=More&Location=None&Completed=0&ProjectID=19514#Description 135 https://www.forestry.gov.uk/forestry/beeh-as4j2w 136 https://oppla.eu/marketplace 137 https://ecosystemsknowledge.net/tool-assessor-list-of-tools 138 https://ecosystemsknowledge.net/sites/default/files/wp-content/uploads/Outcome1C_SelfAssessmentForm.pdf 139 Hunt, D. and Wain, J. (2019) Biodiversity 2020: Delivering Outcome 1C by England’s AONB Partnerships. Prepared on behalf of National Association for Areas of Outstanding Natural Beauty, Natural England and Defra. Available at: https://landscapesforlife.org.uk/application/files/3015/6769/0365/Delivering_Outcome_1C_by_Englands_AONB_Partnerships_-_Final_Report_March_2019.pdf 140 The Green Book government guidance on appraisal and evaluation was first published in 2003. That edition has now been withdrawn and replaced with a revised 2018 version available at: https://www.gov.uk/government/publications/the-green-book-appraisal-and-evaluation-in-central-governent 141 Baseline Evaluation of Environmental Appraisal and Sustainable Development Guidance Across Government. http://randd.defra.gov.uk/Document.aspx?Document=11937_131003_ERG1222_Appraisals_Final_2014_03_07.pdf

Evaluation of Biodiversity 2020
98
challenging for users. However, most tools are developed for a specific application and there is a trade-off between the generalisability of a tool and the depth of analysis and outputs it provides. There is no a one-size-fits-all tool.
Experts to the valuation workshop emphasised that other factors, beyond the availability of tools and guidance, seem to be more important in supporting integration of natural values into decision making. These are explored in subsequent sections.
5.3.3 Q3. Are natural values better integrated into public and private sector decision making?
The integration of natural values into decision making is multifaceted, encompassing different types of decision-makers using different approaches to integrating natural values.
The evaluation assessed evidence available from literature (see Annex 4 Section 3) across business and public sector decision-making. It consulted experts (see Evaluation Workshop Note Annex 4 Section 5) in an in-depth discussion on factors influencing integration across business and policy makers. It provides an assessment of the extent of integration and of the challenges and lessons / supporting factors and limitations.
There is a lack of systematic evidence on the integration on natural values into decision-making. Despite the range of tools and guidance developed and the various avenues for integration, there are no reviews or evaluations assessing the extent to which these have been more or less successful. A limited number of studies suggest factors that can encourage decision-makers to integrate environmental considerations. Some go further to discuss the practical challenges. These factors were explored in the Evaluation workshop and the cross-cutting findings are presented below.
5.3.3.1 Extent of integration
The evidence indicates that there has been limited progress in the integration of natural values into both business and public sector decision-making. Expert opinion (see Figure 12) indicated that there has been ‘minor progress’ (with medium to high confidence) in the integration of biodiversity values into decision-making.
Experts to the workshop queried the extent to which integration of ‘natural values’ reflects an integration of ‘biodiversity values’. The group highlighted that biodiversity values differ and are more challenging in their valuation and integration compared to natural capital or natural values more generally. Although progress in the integration of natural values can indirectly benefit biodiversity, they were not considered good proxies for biodiversity and isolating benefits retrospectively was recognised as extremely challenging.

Evaluation of Biodiversity 2020
99
Figure 12: Extent of integration of biodiversity values in decision-making (n=12)
Business
Evidence suggests that businesses are increasingly trying to understand, measure and minimise their impact on the natural environment. However, there is no evidence on the extent to which this information influences business decision-making. Table 7 summarises the findings of the Evidence review, indicating progress across the most widespread forms of integration.
Table 7: Summary of progress in the integration of natural values in business decision-making
Types of natural value integration in business decision-making
Summary of progress
Use of Environmental Management Systems (EMS)
The UK’s Biodiversity Indicator A5 (Defra, 2019)142 provides a snapshot of progress between 2011-2013, revealing that in 2013:
• 77% of large companies143 had an EMS in place - a decrease from 83% in 2012 and 79% in 2011, and
• 92% of large companies considered environmental issues in their supply chain - an increase from 78% in 2012.
However, this picture is only representative of large businesses and is outdated; the survey on which this indicator was based was discontinued in 2013 and no alternative sources of evidence were identified. More recent data on ISO 14002 – the most commonly used EMS – suggest a steady increase between 2011 and 2015 in the number of certified businesses. However, it is not clear whether this corresponds to an overall increase in the use of EMS or a switch to ISO14001 from other EMS.
Consideration of environmental impacts in business supply chains
Environmentally-related reporting and disclosure
An increasing number of businesses are incorporating environmental considerations as part of their Corporate Responsibility and climate and sustainability-related reporting disclosures. However, this type of
142 Defra (2019). UK Biodiversity Indicators 2018. http://jncc.defra.gov.uk/page-6072 143 The proportion of large businesses (250+ employees) in a range of sectors that are taking steps to minimise their environmental impact as measured using an Environmental Management System (EMS), based on the Environmental Protection Expenditure (EPE) survey
0
2
4
6
8
10
12
No progress Minorprogress
Significantprogress
Substantialprogress
Don’t know High Medium Low
Progress Confidence
Are biodiversity values integrated into decision making?
Biodiversity values are being integrated into public sector decision-making
Biodiversity values are being integrated into business decision-making

Evaluation of Biodiversity 2020
100
Types of natural value integration in business decision-making
Summary of progress
reporting is linked predominantly to climate change with questionable links to biodiversity. It was only in 2018 that a Performance Indicator on biodiversity (GRI 304)144 came into effect and no data were available at the timing of authoring this report.
Adopting a natural capital framework for assessing natural capital
There is no overarching review of the number of businesses adopting a natural capital approach, which may have been expected considering the novelty of the approach. A review by Pritchard and van der Horst (2018) suggested an increasing number of businesses are carrying out natural capital assessments. The review itself identified and reviewed 42 cases.
Incorporating nature’s value in financial accounting
Literature suggests a growing interest in Natural Capital Accounts (NCC, 2014)145 and the integration of natural capital accounting in business Environmental Profit & Loss (CISL, 2016)146. Yet progress in the area of natural capital accounting for businesses, as assessed by the EU Business @ Biodiversity Platform (2018)147, appears to be limited with approaches under development and businesses struggling to measure biodiversity-related performance.
As highlighted by experts, progress with integrating natural values into decision making varies across industries. For instance, the water industry has recently made a step change, with references to natural capital and biodiversity now commonly found in water company business plans and used to justify action. Similarly, it was pointed out that some larger property developers already integrate biodiversity via efforts to deliver biodiversity ‘net gain’ through their developments. However, the examples above are not representative of the entire industry and the NCC’s latest report (NCC, 2019) highlights that the net gain consultation “falls short of what is required to ensure that development does not lead to a net environmental loss”.
Public sector
The Biodiversity Strategy identified ways in which the Government can integrate natural values into decision-making. Ongoing efforts to incorporate natural values in public policy and decision-making are summarised in Table 8 as identified in the review and discussed by experts.
Table 8: Summary of progress in the integration of natural values in public decision-making
Integrating natural values in public sector decision-making
Summary of progress
Natural Capital Committee (NCC)148
Established in 2012 to advise the Government on issues around natural capital, the Committee has been instrumental in the development of relevant guidance, metrics and methods to improve understanding and
144 GRI 304: BIODIVERSITY 2016 Standard. Available at:https://www.globalreporting.org/standards/gri-standards-download-center/gri-304-biodiversity-2016/ 145 Natural Capital Coalition (2014). Valuing natural capital in business. Taking Stock: Existing Initiatives and Applications. https://naturalcapitalcoalition.org/wp-content/uploads/2016/07/Valuing_Nature_in_Business_Part_2_Taking_Stock_WEB.pdf 146 University of Cambridge Institute for Sustainability Leadership (CISL) (2016). Biodiversity and Ecosystem Services in Corporate Natural Capital Accounting: Synthesis report. Cambridge, UK: Cambridge Institute for Sustainability Leadership 147 Business @ Biodiversity (2018) Assessment of biodiversity accounting approaches for businesses and financial institutions. Discussion paper. 148 https://www.gov.uk/government/groups/natural-capital-committee

Evaluation of Biodiversity 2020
101
Integrating natural values in public sector decision-making
Summary of progress
support integration of natural capital in decision-making. In addition to guidance produced, addressed to all users of natural capital approaches, the Committee has produced Annual reports advising the Government on progress and next steps. The latest Annual report (NCC, 2019) states that embedding the natural capital approach in decision-making will require an escalation of efforts across multiple fronts. The Committee’s initial term (2012-2015) had been extended (2016-2020) with the Committee focusing on supporting the Government deliver the 25 Year Environment Plan.
Integration in Policy There are a number of examples of policies and strategies which integrate environmental values. The 25 Year Environment Plan recognises natural values (Defra, 2018 )149; recent strategies such as the Clean Growth Strategy (HM Government, 2017)150 and Industrial Strategy (HM Government, 2017)151; revisions to the National Planning Policy Framework (Ministry of Housing, Communities and Local Government, 2018)152; and a recent Government consultation on incorporating biodiversity net gain in the UK’s planning permission process (Defra, 2018)153. Experts to the workshop highlighted the net gain consultation does not indicate an integration of natural values in monetary terms. The NCC report indicated that incorporating references to natural capital and biodiversity in guidance and plans will not suffice to deliver actual integration. A statutory footing to plans such as the 25 YEP and net gain, and resourcing of delivery bodies to ensure that decision-makers are able to apply approaches and carry out high quality analysis will be required for any meaningful progress to be achieved.
Natural capital and valuation informing decision-making
Q2 above suggest there is improved availability of guidance and support tools to incorporate natural values into decision-making. Revisions to the Green Book and Supplementary Guidance, have introduced a requirement to embed natural capital in government appraisals of alternative options in public spending decisions. References to the development of performance measures154 to assess impacts of infrastructure on natural capital were also introduced in the first National Infrastructure Assessment as a result of collaborative working between the NCC and the National Infrastructure Committee (NCC, 2019; NIC, 2018155). However, there is no evidence yet as to the implementation of the revised Green Book or the new requirements across Government Departments. Eftec’s review of practice (2014), although outdated, suggests there is a lack of analytical rigour and a tendency to ignore environmental impacts identified as of ‘Low’
149 https://www.gov.uk/government/publications/25-year-environment-plan 150 https://www.gov.uk/government/publications/clean-growth-strategy 151 https://www.gov.uk/government/publications/industrial-strategy-building-a-britain-fit-for-the-future 152 https://www.gov.uk/government/collections/revised-national-planning-policy-framework 153 https://consult.defra.gov.uk/land-use/net-gain/ 154 Performance measures are only available in energy and water sector infrastructure. Gaps remain in transport, waste, flood risk and digital communications. (NIC, 2018) 155 https://www.nic.org.uk/wp-content/uploads/CCS001_CCS0618917350-001_NIC-NIA_Accessible.pdf
Evaluation of Biodiversity 2020
102
Integrating natural values in public sector decision-making
Summary of progress
significance. A more recent review (Atkinson et al., 2018)156 provides a positive assessment suggesting that policy officials in the UK “routinely” use some form of environmental valuation to inform “policy and investment project decisions” or discussions on the broader policy agenda. Expert opinion indicated that outside of Defra there is little consideration of environment impacts. Still they offer no indication of the influence of this information on actual decisions taken.
National Natural Capital Accounts
In 2014 Defra and the Office for National Statistics (ONS) developed the Principles of Natural Capital Accounting157 (updated in 2017), providing guidance to support practitioners in developing national and sub-national Natural Capital Accounts. Several broad habitat accounts have been developed and are expected to be completed by 2020 (ONS, 2018)158. Work on the UK aggregate accounts has progressed with two more updates expected leading up to 2020 (NCC, 2019). Some gaps in coverage exist, such as the cross-cutting biodiversity and soil accounts (ONS, 2018).
Government-backed research and projects
A number of Government-backed pilots and projects (e.g. the 25YEP Pioneers projects) were identified in the review and mentioned by experts. These demonstrated continued public support to test and progress understanding of how to integrate natural values.
Despite progress in generating information and understanding around natural values, there is some evidence to suggest that this information is not being widely used to inform decision-making (Turner et al., 2019159 nor is it adequate to the extent that would be necessary to deliver meaningful benefits for biodiversity according to literature (NCC, 2019) and expert opinion.
5.3.3.2 Challenges and lessons /Supporting factors and limitations
Challenges encountered to date have been useful in identifying lessons for the future which are summarised below:
• Consistent use of terminology: Improvements in clarity in language and consistency in
the use of terminology were identified in stakeholder engagement literature and
emphasised by experts as necessary to improve the accessibility of the subject area. In
particular, consistency of terminology used within individual Government departments
needs to be ensured.
156 Atkinson, G., Groom, B., Hanley, N., & Mourato, S. (2018). Environmental valuation and benefit-cost analysis in UK policy. Journal of Benefit-Cost Analysis, 9(1), 97-119. http://eprints.lse.ac.uk/87615/1/Mourato_Environmental%20Valuation.pdf 157 https://www.ons.gov.uk/economy/environmentalaccounts/methodologies/principlesofnaturalcapitalaccounting 158 ONS (2018) UK Natural Capital: interim review and revised 2020 roadmap https://www.ons.gov.uk/economy/nationalaccounts/uksectoraccounts/methodologies/uknaturalcapitalinterimreviewandrevised2020roadmap 159 Turner, K., Badura, T., Ferrini, S. (2019) Valuation, Natural Capital Accounting and Decision Support Systems: Process, Tools and Methods. CSERGE, University of East Anglia, Norwich. http://ec.europa.eu/environment/nature/capital_accounting/pdf/EUNCA_SynthReport_4_2_CSERGE_Year2_190115_sent.pdf

Evaluation of Biodiversity 2020
103
• Biodiversity goals: More explicit and better communicated ‘biodiversity goals’ would
help ensure that decision makers place greater emphasis on biodiversity, which may
otherwise be overlooked as part of the wider scope of natural values.
• Improving engagement: Further to clearly articulating business benefits there is a
need to translate biodiversity goals to targets that businesses can relate to. Tailored
communication and industry-specific guidance were identified as particularly valuable
across business sectors. Engaging businesses in the target setting process and working
with (or supporting) business to understand ‘how’ to integrate them could enhance
business ‘ownership’ of the resulting targets and approaches.
The same applies for public decision-makers, particularly outside of Defra and its agencies. Demonstrating and clearly communicating the benefits to non-environmental policy objectives could provide a greater incentive for decision makers to integrate natural values. Engaging early in the introduction of new requirements, training and capacity building can also help address cultural and institutional resistance to change.
• Policy and regulation: Stronger political and regulatory drivers may help to move on
from isolated examples towards a step change in how biodiversity and natural values
are considered and integrated across public sector and business practice.
• Methodological challenges: The availability of accessible, high quality data of
appropriate scale and granularity is identified as a challenge across approaches used
by businesses and public sector. Beyond data gaps, methodological rigour and
transparency are also key. Where certain tools and approaches lack in the above, they
can face distrust and criticism.
• Resource requirements: Appropriate technical capacity and expertise within
organisations is needed to apply approaches integrating natural values in decision-
making. The Natural Capital Protocol (NCC, 2017)160 and Application Programme161 set
up to support businesses, identified a need for training and technical support to
encourage take-up and support existing users. Considering the novelty of some of the
approaches and tools this is a common issue, with financial implications for
organisations who need to enhance capacity through training or recruitment. Further
costs may be related to implementing new data monitoring systems and developing
new metrics and KPIs required to inform decision making and assess business
performance.
• Partnership-working: collaborative working across businesses, organisations and
government to share data, knowledge and lessons on specific approaches can help
address many of the challenges described above.
160 NCC (2017) Biodiversity and Natural Capital. 161 https://naturalcapitalcoalition.org/protocol-invalid/protocol-application-program/

Evaluation of Biodiversity 2020
104
5.4 Priority Action 2.3: New and innovative financing mechanisms
Priority Action 2.3 aimed to “develop new and innovative financing mechanisms to direct more funding towards the achievement of biodiversity outcomes” (Defra, 2011). Although no definition of ‘innovative financing mechanisms’ (henceforth IFMs) was provided in the Strategy, IFMs were identified in international literature (OECD, 2011; Eftec, 2012; OECD, 2013) as opportunities for scaling-up finance for biodiversity. The Convention on Biological Diversity (CBD, 2011)162 identified the following six categories:
• Environmental fiscal reform
• Payments for ecosystem services
• Biodiversity offsets
• Markets for green products
• Biodiversity in climate change funding
• Biodiversity in international development finance
A further review of UK literature identified those IFMs in use or being piloted in the UK. The evidence review and evaluation focused on identifying the extent of their use, contribution to funding for biodiversity and lessons emerging from challenges, successes and failures to date.
The evaluation of Priority Action 2.3 set out to answer the following evaluation questions:
1) Are new tools or innovative mechanisms making a meaningful contribution to overall funding levels for nature?
2) Are there some (tools/financing mechanisms) that worked better than others? Why / why not? Have they directed more funding towards nature?
The evaluation of this Priority Action draws on a review of available evidence from literature (see Annex 4 Section 3) and expert opinion provided by 12 experts from academia, businesses, civil society organisations, Defra and its agencies, participating in a half-day evaluation workshop (see Evaluation Workshop Note Annex 4 Section 5).
5.4.1 Q1. Are new and innovative mechanisms making a meaningful contribution to overall funding levels for nature?
There is a growing body of work on IFMs and how they can be developed and deployed.
There is limited evidence on the extent to which IFMs have financially contributed to levels of funding for nature (even less so on biodiversity) or to the delivery of actions to support biodiversity. Workshop experts suggested that IFMs are still little used and are not significant contributors. In the absence of an overarching review or evaluation of IFMs, this study carried out a review of the most prominent IFMs in use in England and collated available evidence on their funding contributions. The review covered:
• Payments for ecosystem services163
162 CBD (2011) Collection of Submissions on Innovative Financial Mechanisms. https://www.cbd.int/financial/doc/compilation-innovative-financial-mechanisms-2011-09-en.pdf 163 The review of PES did not include payments under the Pillar 2 of the Common Agricultural Policy, which has been a major contributor of funds for biodiversity. Experts noted that these more ‘traditional’ sources of financing, such as CAP,

Evaluation of Biodiversity 2020
105
• Biodiversity offsets
• Other financing mechanisms and commonly used financing instruments and vehicles,
such as green bonds.
Most evidence on IFMs was found in wider European or global literature with no data available at a national level. UK-specific evidence is limited and tends to refer to data obtained through pilots, case studies, scheme evaluations and emerging market assessments. These tend to vary in their scope and usually refer to a specific tool or mechanism. Reasons stated in the studies for the lack of available data included: sensitivities in sharing / obtaining financial information, poor data accuracy and the lack of data that can be spatially disaggregated.
A wider evidence pool was identified around the opportunities and challenges in the use of IFMs. This included more literature available providing stakeholder insights from national governments, private sector businesses and global organisations on specific tools, mechanisms and schemes and why some worked better than others. Workshop Experts also contributed to that evidence base. These are explored in Q2 below.
The Evidence pack (see Annex 4 Section 4) provides a review of the global and EU contribution of IFMs; the focus in the next sections is kept at a national level.
5.4.1.1 Extent of contribution
Figure 13 presents the opinion of Workshop Experts on the extent to which IFMs are contributing to funding for nature. Across IFMs the majority of Workshop Experts considered contributions to be ‘minor’. Workshop Experts’ confidence in their assessments was lower compared to other questions, reflecting the lack of evidence, and varied across IFMs: the majority of experts assigned ‘medium’ confidence in their assessments of all IFMs with the exception of ‘Environmental taxes, fees and charges’164 and ‘Visitor Payback Schemes’165 where they indicated ‘Low’ confidence.
the environmental liability directive etc., provide large amounts of funding for biodiversity and would be worth further exploring how to better channel existing (and IFM) money rather than simply pursuing more/new sources of funding. 164 Experts suggested that fees and charges have more of an impact than taxes, as taxes are not hypothecated. However, in identifying taxes relevant to biodiversity this evaluation did not consider landfill taxes, levies etc. 165 Visitor payback mechanisms or else Visitor Giving provide different methods for encouraging visitors to financially contribute to the maintenance and enhancement of a natural site (Defra, 2013). The approach usually aims to collect small contributions from a large number of visitors (Nurture Lakeland, 2013) https://www.visitengland.com/sites/default/files/downloads/visitor_giving_helpsheets.pdf
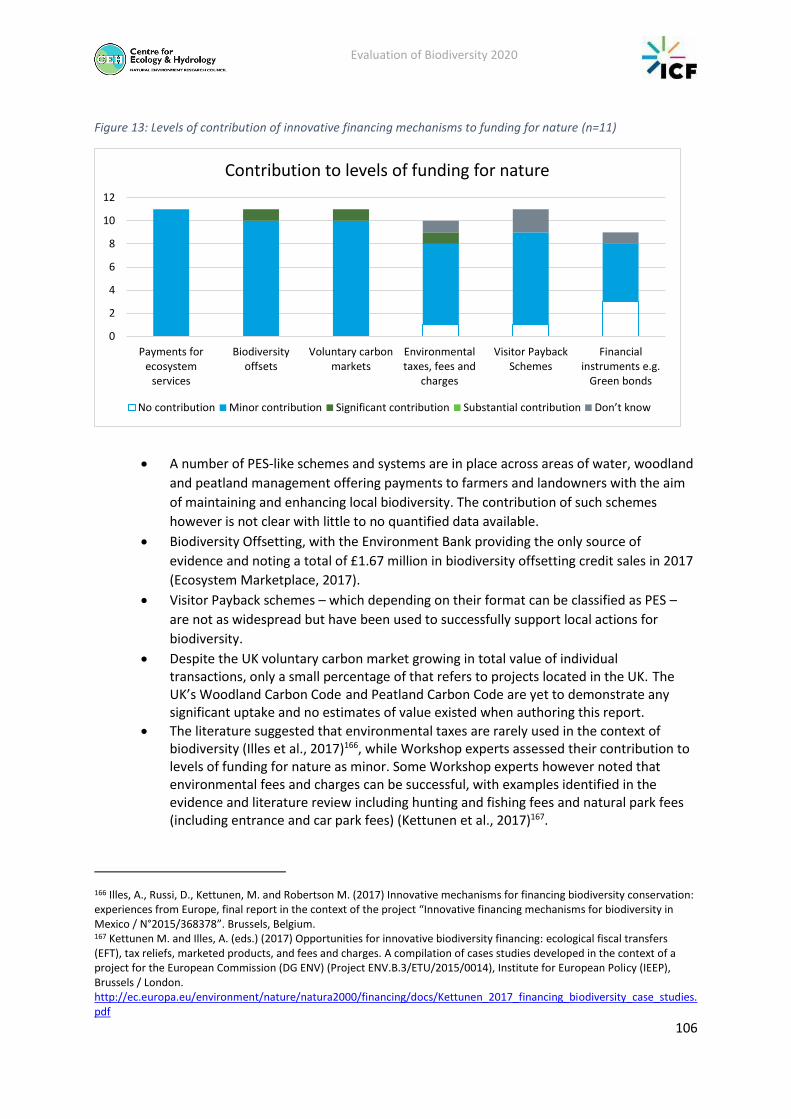
Evaluation of Biodiversity 2020
106
Figure 13: Levels of contribution of innovative financing mechanisms to funding for nature (n=11)
• A number of PES-like schemes and systems are in place across areas of water, woodland
and peatland management offering payments to farmers and landowners with the aim
of maintaining and enhancing local biodiversity. The contribution of such schemes
however is not clear with little to no quantified data available.
• Biodiversity Offsetting, with the Environment Bank providing the only source of
evidence and noting a total of £1.67 million in biodiversity offsetting credit sales in 2017
(Ecosystem Marketplace, 2017).
• Visitor Payback schemes – which depending on their format can be classified as PES –
are not as widespread but have been used to successfully support local actions for
biodiversity.
• Despite the UK voluntary carbon market growing in total value of individual transactions, only a small percentage of that refers to projects located in the UK. The UK’s Woodland Carbon Code and Peatland Carbon Code are yet to demonstrate any significant uptake and no estimates of value existed when authoring this report.
• The literature suggested that environmental taxes are rarely used in the context of biodiversity (Illes et al., 2017)166, while Workshop experts assessed their contribution to levels of funding for nature as minor. Some Workshop experts however noted that environmental fees and charges can be successful, with examples identified in the evidence and literature review including hunting and fishing fees and natural park fees (including entrance and car park fees) (Kettunen et al., 2017)167.
166 Illes, A., Russi, D., Kettunen, M. and Robertson M. (2017) Innovative mechanisms for financing biodiversity conservation: experiences from Europe, final report in the context of the project “Innovative financing mechanisms for biodiversity in Mexico / N°2015/368378”. Brussels, Belgium. 167 Kettunen M. and Illes, A. (eds.) (2017) Opportunities for innovative biodiversity financing: ecological fiscal transfers (EFT), tax reliefs, marketed products, and fees and charges. A compilation of cases studies developed in the context of a project for the European Commission (DG ENV) (Project ENV.B.3/ETU/2015/0014), Institute for European Policy (IEEP), Brussels / London. http://ec.europa.eu/environment/nature/natura2000/financing/docs/Kettunen_2017_financing_biodiversity_case_studies.pdf
0
2
4
6
8
10
12
Payments forecosystem
services
Biodiversityoffsets
Voluntary carbonmarkets
Environmentaltaxes, fees and
charges
Visitor PaybackSchemes
Financialinstruments e.g.
Green bonds
Contribution to levels of funding for nature
No contribution Minor contribution Significant contribution Substantial contribution Don’t know

Evaluation of Biodiversity 2020
107
• Innovative financial instruments in conservation investment, such as green bonds, show promising potential. Whilst the green bond market is very large, it is not clear what proportion targets UK-based nature (much of the market covers non-UK investments and investments in areas such as renewable energy).
Workshop Experts suggested that, despite not being included in the evaluation’s definition of IFMs, Voluntary actions and initiatives, Charitable / philanthropic donations and Crowdfunding are relatively unexplored and have potential to support actions for biodiversity. Crowdfunding, for instance, has been used to finance a range climate change related initiatives from EU cities crowdfunding to finance urban adaptation projects and build climate change resilience (EEA, 2017)168, to innovative crowdfunding platforms co-financing renewable energy projects (Climate-KIC, nd)169.Workshop Experts suggested that there is rich experience in the climate change area, with crowdfunding and other mechanisms , which can be harvested and applied to raise funding for biodiversity focused actions.
5.4.2 Q2. Are there some tools/financing mechanisms that worked better than others and why?
Different IFMs, and how they are deployed, will be more or less appropriate depending on the circumstances and particular context in which they are used. Some of the factors influencing how well IFMs work in raising funding and bringing biodiversity improvements, include, for instance:
• Pre-existing conditions that can support stakeholder engagement, such as familiarity
with the IFM or pre-existing partnerships to build on;
• Leadership that can promote take-up, emerging from different stakeholders, such as
private water companies in PES;
• Capabilities of local stakeholders and investment in building those to support the
delivery of the IFM;
• Existence of market infrastructure, such as intermediaries to facilitate transactions; and
• Investors’ appetite for innovation.
No single tool or financing instrument will offer a silver bullet that addresses funding needs in biodiversity.
In order to scale up use / contribution, greater understanding is needed of how these mechanisms “can best complement or build on existing initiatives and institutions in the UK, including existing legislation and policy mechanisms, with different land ownership and tenure arrangements, as well as existing site-specific management interventions” (Waylen et al., 2015)170.
The evaluation drew on academic literature and existing evaluations of pilots and schemes to offer a qualitative assessment - informed by experts’ views - on barriers and enablers, and lessons for improving the design and delivery of IFMs with the ultimate goal of encouraging
168 https://www.eea.europa.eu/highlights/cities-taking-action-learning-from 169 https://www.climate-kic.org/news/renewables-crowdfunding-platform-lumo-acquired-by-societe-generale/ 170 Waylen, K., Howard, B., Kyle, C. and Martin-Ortega, J. (2015). Applying Payments for Ecosystem Services. https://ecosystemsknowledge.net/sites/default/files/wp-content/uploads/15%2005%2005%20PES%20REPORT%20Final.pdf

Evaluation of Biodiversity 2020
108
take up and scaling up contributions of IFMs to funding for biodiversity. The challenges and lessons summarised below cut across the IFMs reviewed. These are explored at a mechanism-level in the Evidence Pack (See Annex 4 Section 4).
5.4.2.1 Challenges and lessons
This section summarises the key challenges commonly found across IFMs, each followed by a box identifying lessons and potential solutions.
Challenges in setting up and implementing IFMs
• Cost of set up and challenges in stakeholder engagement: Initial set up costs for
developing the institutional and procedural processes of an IFM, such as PES, can
require significant resources. In addition to common issues reviewed around
communication and engagement, such as the need for tailored stakeholder
communication and the resources required to effectively engage stakeholders,
participants in the UK’s PES Pilot scheme (Defra, 2016)171 found an early challenge in
identifying beneficiaries to engage. Further to these, there are also transaction and
ongoing costs of implementing, monitoring, validating and enforcing IFMs – commonly
mentioned in PES, Biodiversity Offsetting and Peatland Code pilots (Defra, 2016) – which
can be daunting for participants. Approaches used in IFMs to measure and verify
changes in ecosystems’ condition and value ecosystems and their services, are limited
by the availability of appropriate, robust data and require technical capabilities which
are not always present within organisations.
• Lack of capacity: Relevant across stakeholders, this links to the novelty of the IFMs and
the range of technical and methodological challenges identified in measuring and
verifying changes in ecosystems’ condition and value ecosystems and their services, and
limitations introduced by the availability of appropriate, robust data
Building capacity amongst stakeholders through training, dissemination of guidance and case studies, could help address some of the lack of capacity in skills such as assessment and valuation. However, there are cases where there is a need to bring in new people through
171 Defra (2016). Defra’s Payments for Ecosystem Services Pilot Projects 2012-15. Review of key findings. 172 Defra (2015). Developing the evidence on beneficiaries for Payment for Ecosystem Services - NR0164. http://randd.defra.gov.uk/Default.aspx?Menu=Menu&Module=More&Location=None&ProjectID=19007&FromSearch=Y&Publisher=1&SearchText=beneficiaries&SortString=ProjectCode&SortOrder=Asc&Paging=10 173 Defra (2016). Defra’s Payments for Ecosystem Services Pilot Projects 2012-15. Review of key findings. 174 https://www.cbd.int/financial/pes/unitedkingdom-bestpractice.pdf
Research and practice (Defra, 2015172; 2016173;2017) highlight a need to further efforts in raising awareness amongst land managers around opportunities available and beneficiaries around the interdependencies between nature and businesses and the benefits the former can provide. Stacking ecosystem services was also identified (Defra, 2017) as a potential solution to attract a wider range of beneficiaries. However, there are challenges in discerning the “exact proportions of benefits and how ecosystem services will be stacked and who should pay” (Defra, 2017) Further dissemination of guidance and case studies, as well as commissioning evaluations to capture and share lessons emerging from practice to date could also support stakeholders in the setup, design and implementation of IFMs. An example of such a guide is the PES Best Practice Guide (Defra, 2013)174

Evaluation of Biodiversity 2020
109
recruitment, third party technical assistance or by using intermediaries. Such cases would include gaps in people with experience in setting up projects, securing and managing large scale financing, able to develop an investment proposition and address investor queries. This was an element where experts identified many of the current biodiversity projects were lacking. Practical examples exist (Pioneers) where third party support was successfully introduced to bring in financial and investment expertise.
Challenges limiting take up of IFMs and investment in biodiversity
• Uncertainty: Uncertainty deters potential investors in, and users of, IFMs. Key sources of
uncertainty include:(i) a lack of Government policy or regulatory backing for a IFM, or
the issues that it is being set up to address, over the longer term. This was reported as a
particular issue for biodiversity offsetting; (ii) unproven investment returns. The lack of
track record of many nature actions means that the likelihood, scale and period of
financial return can be uncertain. Many nature actions are high risk low return
opportunities, which is not conducive to attracting investors.
Regulation can provide certainty for long-term investments in biodiversity and reduce risk. The introduction of a regulatory driver to support IFMs has been advocated by stakeholders and identified as a potential solution by evaluations and experts. Another option identified in literature and frequently mentioned in the expert workshop, was the exploration of opportunities for blended public-private financing or investment subsidies. In these options the regulator bears more of the risk thus allowing a higher rate of return to be made by investors. Developing a standardised framework for capturing, assessing and monitoring the impact of investment on biodiversity – similar to what has been done in the area of natural capital through the Natural Capital Protocol and Natural Capital Accounting – can help ensure there is a consistent approach, linked to measurable outcomes that in time can allow lessons to emerge. Monitoring of the impacts is also essential to ensure that financing is directed at the projects that yield the greatest benefits and impact investors can better understand the impacts of their investments.
• Scale of investment and market liquidity: A widely reported barrier is the size of
investment. Projects around biodiversity tend to be few and small in value which implies
higher transaction cost relative to the potential return and increased search costs for
investors to identify suitable opportunities. Institutional investors typically seek
investment of significantly larger scale than the scale of most biodiversity actions.

Evaluation of Biodiversity 2020
110
• Market structure: A lack of market structure with best practice guidance, intermediaries,
metrics and validation mechanisms has been identified as a barrier in engaging
stakeholders and hindering take-up. In the absence of a structured market or scheme that
everyone ascribes to, there is a risk of free-riding. This was identified as a particular
challenge in PES in cases where multiple beneficiaries exist (Defra, 2016).
In the absence of market infrastructure the use of intermediaries can help build trust between buyers and sellers and facilitate payments particularly where stakeholders are geographically dispersed. The PES pilots demonstrated intermediaries were most critical in bringing in environmental knowledge, understanding of accessing funding and supporting negotiations between stakeholders (Defra, 2013; Defra, 2016). The role of the Environment Bank, as the only broker in Biodiversity offsetting, was also a supporting one. Baker et al (2018) in a review of Biodiversity Offsetting in the UK, further suggest introducing clarity on the roles and responsibilities of local and national government to support delivery.
• Pooling to create investable projects: Experts suggested pooling or bundling biodiversity investment opportunities to achieve an attractive scale of investment opportunity for institutional investors. Pooling / bundling could be achieved by greater collaboration between project proponents at a landscape or catchment scale. Area-based investment priorities can act as a route to pooling or marketing opportunities to investors. Examples are offered by investment mapping by the Landscape Pioneer and other Local Natural Capital Plans under development.
• Innovation and coordination of funding/investment: Better coordination of funding and priorities for investment within Government could support efficiency through realising synergies. Further options to pool and coordinate investment across sources (i.e. blended financing options) was also explored in the expert workshop. A combined cross-government fund and area-based local funds where both Government, private investors and beneficiaries contribute to, were amongst the options discussed. Both of these suggestions were thought by experts to help i) mitigate the risks for investors and ii) increase the size of investment. Leadership by the Government was thought to be required in the above solutions.
• Crowdfunding for smaller, localised investment: Crowdfunding can be suitable for smaller-scale investments. It also enables access to small scale private investors, for whom current opportunities may be too large and who tend to have incentives stronger than return on investment.

Evaluation of Biodiversity 2020
111
6 Evaluation findings: Theme 3
6.1 Key findings for Theme 3 (reducing environmental pressures)
Progress 1. There has been mixed progress in reducing environmental pressures; there has been a
reduction in emissions of several pollutants, although ammonia emissions have continued to increase; and a reduction in area of land exceeding the critical loads for sulphur and nitrogen. There has also been some progress in increasing the extent of woodland, and land managed under AES. However, there has been a reduction in the area of surface water bodies in high or good ecological status, and there is mixed evidence for progress in the planning and development sector, with evidence of some local authorities taking action for biodiversity, but also evidence of shortcomings in the way that planning policy is applied. Despite the progress made, it is clear that pressures across all these sectors continue to adversely impact SSSIs (see Annex 5 Table 1.3).
2. Most activities to reduce environmental pressures are: implementation of (new or amended) policies and guidance to address key pressures; or b) incentivising voluntary uptake of action through programmes and initiatives aimed at changing stakeholder behaviour. Many of the processes for reducing pressures have been implemented in the past few years. There is expected to be a long time lag between implementation of policy and beneficial outcomes.
3. There is some evidence that consideration for biodiversity is being increasingly integrated into the work of key sectors; however voluntary initiatives have had mixed uptake, although stakeholder-led initiatives in some sectors have supported progress.
Supporting progress 4. There is evidence from literature and expert opinion that uptake of incentive schemes and
voluntary initiatives is unlikely to be sufficient to reduce environmental pressures. Uptake of schemes such as Countryside Stewardship, voluntary measures under the Campaign for Farmed Environment, and biodiversity offsetting, for example, have been lower than expected.
5. Effective delivery of advice and guidance supports uptake and implementation of voluntary initiatives. Continuity of projects and project staff aids building relationships with stakeholders and land-owners, aiding delivery of advice and supporting uptake.
6. Ongoing evaluation of activities supports progress because it allows for evidence-based improvements in delivery and demonstration of success, building stakeholder confidence and improving uptake, as demonstrated by the Catchment Sensitive Farming programme.
7. Where there is a strong mandate (e.g. on local authorities to improve air quality) or regulatory underpinning (e.g. the Water Framework Directive) to reduce pressures, this has led to positive action. The regulatory underpinning is perceived by experts to demonstrate government commitment, and so builds confidence across stakeholders, that supports action. Conversely a lack of regulation, or a lack of capacity to carry out regulation, was cited by experts as a reason for lack of positive action (e.g. uncertainty over the extent to which foresters follow the UK Forestry Standards).
8. Positive public engagement can support progress towards reducing environmental pressures, both through changing individual behaviour (e.g. checking equipment to reduce spread of aquatic invasive species) and through consumers influence on companies (e.g. investment by
Evaluation of Biodiversity 2020
112
6.2 Introduction to Theme 3
Theme 3 of the Strategy aims to reduce environmental pressures by integrating consideration of biodiversity into key sectors. Specifically, it aims to foster integration of biodiversity into the work of the following sectors considered to have the greatest potential impacts on biodiversity, in order to reduce their damaging impacts: agriculture, forestry, planning and development, water management, marine management and fisheries (not considered in this evaluation); along with addressing direct pressures from invasive non-native species and air pollution. In line with CBD Aichi target 3 (that harmful incentives are removed, and positive incentives should be developed and applied to incentivise the conservation and sustainable use of biodiversity), the activities under this Theme are aimed at increasing awareness, and regulating, incentivising and guiding behaviour of stakeholders and key sectors. This should ultimately lead to attitude and behaviour changes so that biodiversity is considered in decisions taken within these sectors, leading to more sustainable practices and a reduction of environmental pressures. The intervention logic for Theme 3 is shown in Annex 5.1 Section 1.2.1.
This Theme was evaluated through a review of indicators and evidence from published literature and reports, together with a one-day stakeholder workshop with 14 participants representing Defra and partner organisations, NGOs and academia.
6.3 Q1. What actions and activities have been delivered?
The key actions and activities that have been carried out since 2011 under the Strategy to help achieve the aims of Theme 3 are summarised in Annex 5 Table 1.2.
6.4 Q2. Have the targeted environmental pressures been reduced?
6.4.1 Introduction
This question considers the extent of progress that has been made in reducing environmental pressures, across the six sectors outlined in the Strategy.
6.4.2 Evidence
The England Biodiversity Indicators only include metrics to measure trends in pressures from pollution (Indicator 19), pressures from invasive species (Indicator 20), surface water status (Indicator 21) and agricultural and forest area under environmental management schemes (Indicator 22). Other metrics have been assessed here alongside these, to try to provide a more comprehensive overview of progress (Table 9).
Table 9 below summarises the key metrics measuring progress towards reducing pressures on biodiversity from these sectors.
water companies to reduce impacts on biodiversity). Experts believed that a lack of strategic public communications hinders progress – clear communication involves highlighting interventions and also communicating successes.

Evaluation of Biodiversity 2020
113
Table 9 Summary of metrics measuring progress in reducing environmental pressures.
Sector Strategy aim/target Evidence/metrics Progress since 2011
Agriculture Improve the delivery of environmental outcomes from agricultural land management practices whilst increasing food production
Total Factor Productivity – providing a measure of the efficiency of agricultural production at a UK level175.
Since 2011 there has been a 2% increase in Total Factor productivity. There is an overall upward trend which appears to be slowing, but with a reasonable amount of year to year
fluctuation175.
Land under targeted AES (England Biodiversity Indicator
22)30
Since 2011 there has been a 2.5% increase in the amount of land under targeted AES agreements, with a total of 1.4 million ha of land managed under higher-level or targeted agri-environment
agreements in 201730. There is
evidence to suggest that AES have a range of positive impacts for several species at local scales, with some emerging evidence of landscape-scale impacts (see Section 4.3.6).
Forestry Bring a greater proportion of our existing woodlands into sustainable management and expand the area of woodland in England, with a focus on protecting, enlarging and buffering ancient woodland
Amount of woodland creation (from Forestry Statistics176)
The total area of woodland in England has increased by 1.2% from 1.29 million ha in 2011 to 1.31 million ha in 2018, however the rate of growth appears to have
slowed since 2015176.
Proportion of woodland under positive management (England Biodiversity
Indicator 22)30
25.4% of the total woodland area in England was certified as sustainable managed in 2018. This is a decrease from 25.9% in 2011. However, although Indicator 22b captures forests which are certified, this does not necessarily measure the extent of sustainably managed forest in England. For example, forests which have an approved woodland management plan under the UK Forestry Standard could be considered to be sustainably managed, regardless of whether they have entered into a certification scheme.
Neither of these metrics enable assessment of progress towards protecting, enlarging or buffering ancient woodland
Planning and development
Through reforms of the planning system, we will
There were no metrics found to assess trends in pressures from planning and development, with habitat loss from development not centrally recorded.
175 Defra, 2017. Total factor productivity of the UK agriculture industry. Available from https://assets.publishing.service.gov.uk/government/uploads/system/uploads/attachment_data/file/759963/agriproductivity_statsnotice_29nov18.pdf 176 Forestry Commission 2018. Forest Statistics 2018. Available from: https://www.forestresearch.gov.uk/documents/5319/Complete_FS2018.pdf

Evaluation of Biodiversity 2020
114
Sector Strategy aim/target Evidence/metrics Progress since 2011
take a strategic approach to planning for nature. We will retain the protection and improvement of the natural environment as core objectives of the planning system. We will pilot biodiversity offsetting, to assess its potential to deliver planning policy more effectively.
The Biodiversity Net Gain Impact Assessment (2018) shows that on average, 16,800ha of land annually are converted from non-developed to developed uses, compared to 4600ha converted from developed to non-developed uses. This shows an overall trend towards loss of non-developed land, and increased developed land177. However, this does not show the biodiversity impacts of this development.
Water management
The Strategy aimed to: ‘align measures to protect the water environment with action for biodiversity’; ‘promote approaches to flood and erosion management which conserve the natural environment and improve biodiversity’; and to make water abstraction more sustainable and less damaging to ecosystems. A specific aim relating to water pollution, is to increase the proportion of water bodies in Good Ecological Status (GES) from 26% to 32% by 2015, and to get as many water bodies as possible to GES by 2027.
The proportion of surface water bodies in good ecological status (England biodiversity
indicator 2130)
36% decrease in the percentage of surface water bodies in England awarded high or good status
between 2011 and 201730. In
2017, 16% of surface water bodies assessed under the Water Framework Directive (WFD) were in high or good status compared to 25% in 2011.
Water abstraction statistics178 The targets for the proportion of sustainably abstracted surface water bodies and groundwater bodies for 2021 are 90% and 77% respectively.
The proportion of sustainably abstracted surface water bodies and groundwater bodies in 2018 were 82% and 72%. These were not calculated prior to 2018, so no assessment of progress can be made.
There are no metrics with which to assess progress towards aligning measures to protect the water environment with action for biodiversity or promotion of flood and erosion management which conserve the natural environment and improve biodiversity. However, flood and coastal erosion risk management schemes completed during 2011-2017 have created or improved over 10800 ha of habitat, including over 900 ha of intertidal habitat; improved 80km of protected rivers; and removed barriers to fish and eel passage from 290 flood management structures179
Air pollution Reduce air pollution impacts on biodiversity through approaches at national, UK, EU and international levels targeted at the sectors which are the source
Sulphur and Nitrogen deposition (England Biodiversity Indicator
1930) Last updated in
2015 so current figures unknown.
The percentage of sensitive habitat area exceeding critical loads for acid pollution decreased from 62.8% in 2011 to 59.2% in 2015. The percentage of sensitive habitat where nutrient nitrogen pollution exceeded critical load
177 Biodiversity Net Gain Impact Assessment 2018. https://consult.defra.gov.uk/land-use/net-gain/supporting_documents/181121%20%20Biodiversity%20Net%20Gain%20Consultation%20IA%20FINAL%20for%20publication.pdf 178https://assets.publishing.service.gov.uk/government/uploads/system/uploads/attachment_data/file/679918/Water_Abstraction_Statistics_England_2000_2016.pdf 179 Environment Agency, 2018. Managing flood and coastal erosion risks in England: 1 April 2011 to 31 March 2017.

Evaluation of Biodiversity 2020
115
Sector Strategy aim/target Evidence/metrics Progress since 2011
of the relevant pollutants (nitrogen oxides, ozone, sulphur dioxide, ammonia). Specific targets include achieving the projected fall in the proportion of sensitive ecosystems which exceed the critical load for acidity to 59% by 2020, and a fall in the proportion exceeding the critical load for eutrophication to 94%.
reduced from 96.5% in 2011 to 95.4% in 2015.
Emissions of air pollutants in the UK180
• Ammonia emissions have increased 6.6% between 2011-2017.
• Nitrogen oxides emissions have decreased by 24.3% between 2011-2017.
• Sulphur dioxide emissions have decreased by 59.5% between 2011-2017.
• Non-methane volatile organic compound emissions have decreased by 5.8% between 2011-2017.
• PM10 emissions have increased by 1.8% between 2011-2017
• PM2.5 emissions have decreased by 0.5% between 2011-2017
Invasive non-native species
Continue to implement the Invasive Non-Native Species Framework Strategy for Great Britain
Trends in pressures from non-native species (England Biodiversity Indicator
2030)
Number of invasive non-native species established in or along 10% or more of Great Britain’s land area or coastline has remained constant in terrestrial environments (at 56 species) but has increased in freshwater environments (from 12 to 13 species). This metric does not enable assessment of the biodiversity impacts of these non-native species.
6.4.3 Evaluation
Overall these metrics demonstrate mixed progress across these sectors, with some metrics showing little improvement (surface water status, woodland creation and area of sustainably managed woodland) and more progress demonstrated in other sectors (Air pollution – specifically a reduction in nitrogen oxide and sulphur dioxide emissions). Environmental pressures across these sectors continue to adversely impact habitat quality and biodiversity. For example, condition assessments of SSSI’s in England (see Annex 5 Table 1.3), list adverse impacts from all of these sectors as reasons for unfavourable status, demonstrating that these pressures are still having a significant impact on habitat quality in some areas.
180 Defra, 2019, EMISSIONS OF AIR POLLUTANTS IN THE UK, 1970 TO 2017. https://assets.publishing.service.gov.uk/government/uploads/system/uploads/attachment_data/file/681445/Emissions_of_air_pollutants_statistical_release_FINALv4.pdf

Evaluation of Biodiversity 2020
116
Expert respondents to the Theme 3 pre-workshop questionnaire assessed progress in reducing environmental pressures across all sectors as minor/some181 (see Figure 14 and Annex 5 Section 2). Progress in Water Management was considered to be ‘significant’ by more respondents than for other sectors, in contrast to the Surface Water Status Indicator which shows a decline in surface water status since 2011. Workshop participants suggested that implementation of the Water Framework Directive, which drives catchment level action to improve water quality, represents progress which should lead to improvements in the metric over time.
Figure 14 Results from the pre-workshop questionnaire (n=13) regarding progress towards reducing environmental pressures across sectors. Participants confidence in their response is given in blue.
Participants noted that perhaps a lot more progress could not be expected, as the timelines involved in reducing pressures and seeing results in terms of improvements to metrics or Indicators are quite long, but that many processes have been put in place in the last few years, which are expected to show results in the future. This is also evident also by the number of policies, guidance and incentives that have been introduced or updated, relating to reducing environmental pressures (see Annex 5 Table 1.2); these are expected to deliver further progress.
It is notable, however, that no metrics are available to measure progress towards several of the intended aims, for example, there is no available metric to measure pressure from planning/development, and habitat loss or gain through development is not centrally recorded so cannot be assessed. Furthermore, some of the available metrics do not directly measure progress towards reducing pressures. For example, although England Biodiversity Indicator 20 reports on the number of invasive species established, this does not provide information about the impact of these species, and whether they are detrimental to native biodiversity. Some of the aims, for example to ‘align measures to protect the water environment with action for biodiversity’also lack specific, measurable targets, making it difficult to evaluate progress.
181 The modal category of progress selected was ‘minor’ for agriculture, planning and development and invasive species, ‘some’ for forestry and air pollution, and ‘some’/’significant’ for water management.
0 5 10 15 20 25
Agriculture
Forestry
Planning and Development
Water Management
Air Pollution
Invasive Species
Progress towards reducing pressures
No progress Minor progress Some progress
Significant progress Substantial progress Don’t know
Low Medium High
Progress
Confidence
Progress Confidence

Evaluation of Biodiversity 2020
117
6.5 Q3. What progress has been made towards integrating biodiversity into the work of key sectors?
6.5.1 Introduction
This question aims to evaluate the progress that has been made towards integrating biodiversity into the work of key sectors, with reference to the strategies/policies, guidance and initiatives that have been put in place and the impacts these have had in terms of changing the behaviours of stakeholders in key sectors and encouraging better consideration of biodiversity into the work of these sectors.
6.5.2 Evidence
Numerous examples demonstrating the take-up of initiatives and usage of guidance, as well as examples of sector-led activities, were available in the literature and expert opinion (see Annex 5.1), providing some evidence that stakeholders are changing their behaviours or implementing actions to benefit biodiversity. However, there are no quantitative metrics with which to assess the extent of integration of biodiversity into the work of key sectors.
6.5.2.1 Responses to pre-workshop questionnaire
Workshop participants scored progress towards integration of consideration of biodiversity into the work of key sectors as minor-significant; the modal category of progress selected was ‘minor’/‘some’ for air pollution and planning and development; ‘some’ for agriculture and invasive species; ‘minor’/‘some’/‘significant’ for forestry; and ‘some’/‘significant’ for water management (see Figure 15).
Figure 15 Results from the pre-workshop questionnaire (n=13) regarding progress towards integration of biodiversity into the work of key sectors. Participants confidence in their response is given in blue.
Water Management was viewed as having slightly more progress, whereas progress was viewed as more ‘minor’ for air pollution and planning and development. The majority of participants also strongly agreed or agreed that compared to 2011, stakeholders have a greater awareness of environmental concerns and the environmental impacts of their sector (8/13 strongly agreed; 5/15 slightly agreed); a greater awareness of the actions that can be
0 5 10 15 20 25
Agriculture
Forestry
Planning and Development
Water Management
Air Pollution
Invasive Species
Progress towards integration
No progress Minor progress Some progress
Significant progress Substantial progress Don’t know
Low Medium High
Progress
Progress
Confidence
Confidence
Evaluation of Biodiversity 2020
118
taken to reduce their impacts on the environment (1/13 strongly agreed; 11/13 slightly agreed; 1/13 slightly disagreed); and that stakeholders in key sectors are taking more action to reduce their impacts on the environment (4/13 strongly agreed; 8/13 slightly agreed; 1/13 strongly disagreed).
6.5.3 Progress towards integrating biodiversity into the work of key sectors
Overall, the qualitative evidence suggests that there has been some progress in influencing the activities of key sectors, with many examples of voluntary uptake and action within the key sectors reviewed here (see Annex 5.1 Section 1.3.3), and also some emerging industry-led initiatives across several sectors, suggesting awareness and an appetite to take action to reduce environmental impacts. However, a lack of quantitative metrics with which to assess progress towards the integration of biodiversity impacts on the ability to evaluate progress.
There is some doubt over whether the extent of voluntary uptake is sufficient, with the majority of workshop participants agreeing182 that incentive schemes and grants have encouraged stakeholders to take action to reduce impacts on biodiversity, but of the opinion that stakeholder uptake of incentive schemes is not sufficient to reduce environmental pressures183. Uptake of schemes such as Countryside Stewardship and voluntary measures under the Campaign for Farmed Environment, for example, have been lower than expected, which will have reduced the biodiversity benefits of such schemes. Also, a survey by the Campaign for Farmed Environment on land managed voluntarily showed that although almost 269 thousand hectares of land were under voluntary environmental management in the 2014/15 farming year, this was a decrease of 41% on the 2013/14 area, demonstrating a reduction in voluntary management. The voluntary approach to uptake of biodiversity offsetting is also considered one of the key factors behind the slow take up of this scheme, with a shortage in both supply and demand of offsets, which has implications for the scale of benefits materialised.
Conversely, by 2018, 99.4% of the 2023 target had been met for the number of agricultural holdings supported under the Countryside Productivity scheme, demonstrating a good level of uptake for this scheme. There has also been a good level of uptake of Catchment Sensitive Farming; success has been underpinned by effective farmer engagement and advice delivery achieved through a combination of CSF Officers, commissioned contractors, and partnerships with other organisations.
Workshop Participants agreed that government policies and regulations have helped guide stakeholders to take action to reduce impacts on biodiversity184, with the WFD cited as an example of such a policy which has been influential in driving stakeholder behaviour. Where there has been a strong mandate in place, for example a mandate placed on Local Authorities to improve air quality, there is evidence of significant actions taken to reduce pressures (see Annex 5.1 Section 1.3.3.2.5). However, in other cases, such as planning policy, even with a strong policy in place and evidence of some local authorities taking action for biodiversity,
182 Responses from pre-workshop survey of level of agreement with the statement “Incentive schemes and grants have encouraged stakeholders to take action to reduce impacts on biodiversity”: 8/13 strongly agreed; 4/13 slightly agreed; 1/13 slightly disagreed. 183 Responses from pre-workshop survey of level of agreement with the statement “There is sufficient stakeholder uptake of incentive schemes to bring about a reduction in environmental pressures”: 5/13 strongly disagreed; 3/13 slightly disagreed; 3/13 slightly agreed; 2/13 responded that they don’t know 184 Responses from pre-workshop survey of level of agreement with the statement “Government policies and regulations have helped guide stakeholders to take action to reduce impacts on biodiversity”: 6/13 strongly agreed, 7/13 slightly agreed.

Evaluation of Biodiversity 2020
119
there is also evidence of shortcomings in the way the policy is applied and the level of consideration given to biodiversity, particularly with respect to development in AONBs (See Annex 5.1 section 1.3.3.2.3).
6.6 Q4. What factors have influenced progress, and what lessons can be learnt for future activities that seek to integrate biodiversity thinking in order to reduce environmental pressures?
Across available literature and workshop discussions, several factors emerge as supporting or hindering progress, which enable lessons to be learnt to support delivery in the future.
Factors supporting uptake and delivery of action:
• Effective delivery of advice and guidance helps to support uptake and effective implementation of voluntary actions and initiatives; this was seen as key to the success of CSF in delivering positive environmental impact in relation to improvements in water quality. A lack of resources and capacity for delivering one-to-one advice was considered to be a factor influencing poor uptake of CS. Receiving advice helps to reduce the perceived risk of uptake of actions, which improves perception of the risk:benefit ratio, encouraging uptake. Also, advice and guidance help ensure that correct actions are taken up in the right places, improving effectiveness of the actions.
More guidance or capacity building within local authorities was also suggested as something which would have improved success in the Biodiversity Offset pilots.
• Continuity of projects/initiatives and staff helps to build the trust of landowners/stakeholders, influencing uptake. Long-term resourcing provides confidence in the longevity of projects, supporting uptake and buy-in.
• A statutory/regulatory underpinning helps to drive action, supporting progress. A perceived lack of support in planning policy, and a voluntary rather than mandatory approach to biodiversity offsetting was seen as hindering take-up, with a mandatory approach suggested as a way to improve supply and demand for offsets and drive progress. In contrast, the successful uptake of the catchment-based approach across 93 catchments was underpinned by a policy framework. Further, significant investment by water companies in environmental improvements has been driven by a strong strategic underpinning and regulatory approach. Similarly, action taken to implement air quality improvement measures by some local authorities is likely driven by the mandate on local authorities to improve air quality, along with associated funding mechanisms. The Water Framework Directive was suggested as an example of a strong policy framework which has driven investment and progress in reducing impacts on biodiversity. However, in the case of Planning, there is some evidence that even with a strong policy framework in place, this is not necessarily then incorporated into core strategy at a local level. Regulatory or mandatory measures may also be necessary to ensure the policy framework is translated into positive impact.
Enabling factors:
• Positive, targeted public engagement can help support progress. Participants felt public awareness is an important mediator of how much improvement can be made, as the public need to be ‘on side’ to drive change. Water company price reviews are an example

Evaluation of Biodiversity 2020
120
of consumer choice driving impact for biodiversity, as consumers selected biodiversity improvements as important, which has driven investment from water companies. This works for the water sector as water companies have a consumer funding mechanism so have less financial liability. Public engagement campaigns can work well if they are targeting people who could be impacted by an action; for example, the ‘Check, Clean, Dry’ campaign worked well with anglers who were persuaded to carry out preventative measures to stop spreading invasive species on their kit, as the impacts of spreading invasive species would affect them. However, it has been much more difficult to engage with and change the behaviours of large shipping vessels for example, as the spread of invasive species would have much less impact on them. Participants also noted that strong evidence-based campaigns are more successful, which reinforces the need for long-term monitoring and evaluations to develop the evidence base.
Workshop participants also noted that public perception and a lack of public understanding can also have negative impacts, for example by preventing sustainable management of species such as deer which impact on woodlands; and control of INNS.
• Ongoing evaluation supports improved progress through demonstrating impacts and improving delivery. The Catchment Sensitive Farming programme has benefitted from an ongoing evaluation programme which is built into delivery of the programme. This is considered to have been critical to improving progress by enabling improvements to delivery based on feedback, and by demonstrating project success which maintains stakeholder engagement and encourages uptake. Within the CSF project the detailed insight into the impacts of the programme gained through continuous evaluation, has enabled predictions to be made about what is achievable in terms of impact on local water quality, from future advice and voluntary measures.
Without ongoing evaluation, it is difficult to measure success, particularly in cases where maintaining the status quo would be considered a success, e.g. success demonstrated by no new invasive species or no further detrimental impacts.
Challenges:
• A lack of strategic public communication hinders progress by preventing effective public engagement which could facilitate behaviour change. Participants noted Defra family organisations do not have organisational websites and are limited on the extent of public communications, which hinders engagement, and public awareness. Workshop participants agreed that in general organisations are poor at communicating their successes, which may hinder public perception of the work they do and what can be achieved.
• A lack of metrics and quantitative goals hinders evaluation of progress. Several aims under Theme 3 lack specific, measurable targets, making it difficult to evaluate progress. Metrics are not available to measure progress towards several of the intended aims; for example, there is no available metric to measure pressure from planning/development, and habitat loss or gain through development is not centrally recorded so cannot be assessed. Furthermore, some of the available metrics do not directly measure progress towards reducing pressures. For example, although England Biodiversity Indicator 20 reports on the number of invasive species established, this does not provide information about the impact of these species, and whether they are detrimental to native biodiversity. Quantitative targets, where they exist, tend to be set by international
Evaluation of Biodiversity 2020
121
obligations e.g. for air quality and water quality. These are associated with better progress monitoring and more action taking place to deliver progress.
Lessons:
• Incentives are needed to drive uptake. Workshop participants recognised the need for an appropriate balance of both regulation and voluntary action, to drive uptake of action. In some cases, a voluntary approach has not led to sufficient enough uptake, and this has hindered progress towards landscape-scale impacts. Stronger incentives may be needed to drive voluntary uptake; this may be provided through increased resourcing for advice and guidance to increase awareness of benefits along with removing knowledge barriers to uptake. Workshop participants felt that regulation/enforcement is somewhat lacking at present, due in part to a lack of resources for carrying out enforcement. The findings of the WWF commissioned review assessing levels of regulatory compliance in the agricultural sector, that on average, compliance was between 70-80%, suggests that targeted enforcement towards stakeholders or landowners who are non-compliant, would be beneficial. Furthermore, proper monitoring/evaluation of the impact of regulation/enforcement and advice delivery would help to demonstrate the cost-effectiveness of this work and help develop the evidence base for deciding the most appropriate type of incentive to improve uptake of different types of action.
• Partnership working helps engage stakeholders and generate collective action. Working in partnership or collaborating with stakeholders increases investment and buy-in, which increases available resources and promotes ownership of projects (including their aims and goals), improving and expanding delivery. Partnership and collaborative working were seen as key to success in future. CaBA partnerships and LAGs have been successful in supporting capacity building, engagement, and securing additional funding and resources such as volunteer time. Industry-led partnerships such as ‘Grown in Britain’ and ‘Campaign for Farmed England’ have been instrumental in drawing stakeholders together to promote action towards common goals.
• Quantitative targets, which can be readily monitored, can improve evaluation of progress and improve reporting and efficiency. Quantitative targets which can be readily evaluated through monitoring (including field monitoring) built in and planned for from the outset, linked to the aims and objectives, would enable better assessment of progress and demonstration of the impacts and effectiveness of actions. Aligning metrics/Indicators with international obligations on reporting, for example the Habitats Directive, would also help to ensure efficiency in reporting and monitoring. Progress monitoring which informs delivery through an iterative process can improve the effectiveness and impact of projects. An implementation plan to set out delivery, targets and milestones, would be useful as both a communication tool, and to aid progress monitoring. This would also provide a sense of accountability.

Evaluation of Biodiversity 2020
122
7 Evaluation findings: Theme 4
7.1 Key findings for Theme 4 (improving our knowledge)
1. There are few quantitative metrics to access progress towards Theme 4, so evaluation of progress is largely based on expert opinion.
2. In general, experts believe there is a good evidence base to guide decisions, so in many cases a lack of evidence is not what hinders progress, although gaps remain in our understanding. There is no evaluative evidence of whether external research agendas have helped to fill gaps in understanding and there is mixed opinion whether public sector research is directed to the highest priority issues to deliver the Outcomes and priorities set out in the Strategy (see Section 7.3.1 and Annex 6)
3. There is an increasing amount of biodiversity monitoring data available (through investment in new data collection via earth observation or volunteer schemes, and through enhanced analysis adding value to existing data), especially for species but less so for habitats. However, experts believed that monitoring is not adequate to assess progress towards Strategy Outcomes. This is supported by the evaluation, which found data for several metrics lacking, or out-dated (e.g. condition of SSSIs (See Section 4.3.5), condition of priority habitat outside of protected areas or AES management (See Section 4.3.3), progress of species along their recovery curve (See Section 4.4.3)). Reductions in funding for monitoring will further hinder assessment of progress towards Outcomes, in particular hindering provision of rapid answers to specific questions at the correct spatial scale (i.e. not using UK metrics to assess an England strategy, or not having information to assess specific impacts at local scales).
4. There is clear progress towards data being more openly-accessible, which supports assessment of progress towards Outcomes in the Strategy, although experts believe that a lack of resourcing of data providers and data curators hinders the provision of data. However, experts stated that there is often limited capacity to interpret data at and translate research to local scales, and a lack of infrastructure for sharing knowledge and best practice. This hinders the integration of data and evidence into planning and decision-making.
5. A lack of infrastructure for knowledge exchange and communication between researchers and stakeholders also hinders the understanding of the data and evidence needs of different sectors and stakeholders, and therefore the extent to which research needs are informed by practice.
6. Experts consider that in general, the impacts of interventions are not well monitored or evaluated, which makes it difficult to draw conclusions about the effectiveness of different actions, which can hinder effective decision-making. However, when there is structured monitoring and evaluation built in from the start of projects, this can help to demonstrate their impacts, as shown by the Catchment Sensitive Farming project.

Evaluation of Biodiversity 2020
123
7.2 Introduction to Theme 4
Theme 4 aims to improve the evidence base for decision-making, to ensure the right actions are being done the right places, using resources effectively, and focusing on actions that will have the most impact.
There are 3 specific Priority Actions under this Theme relating to:
1) investment in research and development to fill knowledge gaps; 2) monitoring changes in the state of biodiversity; and 3) improving access to data.
The rationale is that there needs to be a better understanding of why biodiversity is changing, the consequences of these changes, and the link between biodiversity and ecosystem services, in order to make evidence-based decisions about management and to enable development of approaches to biodiversity conservation that deliver multiple benefits. Monitoring and surveillance are vital to track biodiversity change, as well as enabling assessment of the effectiveness of biodiversity policy and alerting us to changes in the state of the environment. This knowledge and data need to be available to the right people at the right time to inform decision making. Therefore, information and data need to be accessible. Improving data sharing and public access to data will enable the most up-to-date knowledge and information to be used within decision making at all scales.
Achieving these three Priority Actions will increase the capacity for making management decisions that are well informed and evidence-based, ensuring interventions are effective, and resources are used efficiently. Furthermore, the information gained from effective environmental monitoring will ensure that progress towards delivering the Strategy and meeting environmental targets can be evaluated.
The intervention logic for Theme 4 is presented in Annex 6 Figure 1 visualising how activities under the three Priority Actions aim to improve decision making through better targeting of research funds towards filling evidence gaps; better monitoring of biodiversity and the impacts of management action to enable evaluation of actions and better inform decisions; and improving data sharing and data accessibility through new tools and open access mechanisms, so that decision makers have access to the right data.
This Theme was evaluated through a review of indicators and evidence from published literature and reports, together with a discussion at four Theme-based stakeholder workshops involving a total of 59 participants, representing Defra and partner organisations, NGOs, businesses/private sector, and academia.
7.3 Q1. What progress has been made, and what has influenced progress towards:
7.3.1 A) Filling knowledge gaps and building the evidence base?
7.3.1.1 Introduction
This section examines whether improvements to knowledge and the evidence base have been effective in terms of supporting delivery of other Strategy Themes and actions, and what has influenced progress.

Evaluation of Biodiversity 2020
124
7.3.1.2 Evidence
There is no evaluative evidence to determine how well external research agendas have been influenced by the Strategy to improve the evidence base for delivery of the Strategy. There is some evidence of evidence gaps which suggest areas where sufficient advances in knowledge and understanding are yet to be made. An overview of key biodiversity evidence research programs is included in Annex 6. Further insights are available from responses to the pre-workshop questionnaire and from discussions that took place at the expert workshops (See Annex 6).
The majority of survey respondents believe that there is a good evidence base to guide decisions (31/49 slightly or strongly agree compared to 17/49 slightly or strongly disagree). However, it is notable that in the ‘People’ workshop (Theme 2 – regarding integration of biodiversity in decision making and innovative funding mechanisms) more respondents disagreed than agreed. As would be expected, workshop participants also agree that gaps in understanding remain that require continued research (47/49 slightly or strongly agree compared to 1/49 slightly or strongly disagree). Participants were divided over whether public sector research investment is directed towards the highest priority issues, with 21/49 slightly or strongly agreeing that it is; 16/49 slightly or strongly disagreeing; and 12/41 participants responding that they don’t know, or neither agree nor disagree.
7.3.1.3 Evaluation
It is unclear from the evidence available the extent to which external research agendas have been influenced by the Strategy to improve the evidence base for delivery of the Strategy, or the extent to which research investment within Government has been directed to areas of highest priority to deliver the Outcomes and priorities set out in this Strategy. Some areas of research, for example basic species autecological research to support the understanding necessary to develop strategies to recover species, is lacking, and workshop participants suggested this type of research is difficult to get funded. However, it is clear that there are multiple government-led research programmes and projects in place to develop the evidence needed, and that some opportunities have been taken to test approaches, for example through NIA partnerships exploring integrated land management approaches (see Annex 6), and through the piloting of approaches such as Biodiversity Offsetting and Payment for Ecosystem Services (see Annex 5.1). Furthermore, advances in analytical techniques have enabled a step-change in the potential for opportunistic species recording to contribute to trend assessments, which has vastly increased the taxonomic breadth of species trends, and improved knowledge of status for many species.
Current research appears to be applied to delivery of conservation and to government and business decision-making to a mixed degree, with a number of tools also available to support integration into decision making, particularly regarding the valuation of natural capital. However, there is some evidence for a lack of join-up between those involved in research and those involved in delivery; this means there may not be an awareness of the current research by those implementing conservation projects, and it takes time for up-to-date knowledge to be translated into practice. There may be opportunities to better integrate research outcomes into delivery of biodiversity conservation work and decision making, including improving the accessibility, communication and understanding of research and available tools, as well as improving awareness of how and where to access tools and research outcomes. Furthermore, a better understanding of what evidence, tools and guidance is needed would be helpful to guide next steps.

Evaluation of Biodiversity 2020
125
A number of evidence gaps have been identified, some of which were outlined in the Strategy, suggesting that ongoing work is needed to address these gaps, particularly when this prevents accurate monitoring towards the Strategy Outcomes. For example, knowledge of the condition and extent of priority habitat outside of protected areas, still appears to be lacking, hindering monitoring of progress towards Strategy Outcome 1B. A lack of evidence available to support the evaluation of Outcome 4 around people engagement was also identified and confirmed by stakeholder interviews (carried out under Theme 2). A summary of key evidence gaps can be found in Annex 6.
7.3.2 B) Improving monitoring of biodiversity and enabling assessment of Strategy Outcomes?
7.3.2.1 Introduction
This section examines what has been done to improve the monitoring of biodiversity and of Strategy Outcomes, and whether this has been effective.
7.3.2.2 Evidence
A summary of government-led biodiversity monitoring programs is provided in Annex 6, demonstrating the scope of species monitoring, and the recently developed programs to attempt to monitor ecosystem services (pollinator monitoring scheme) and habitats (freshwater monitoring, earth observation capability, priority habitats inventory), along with monitoring the impacts of particular interventions (landscape-scale monitoring of AES). Furthermore, analytical developments have ensured that opportunistic recording of biodiversity can now also contribute to species trend information, enabling trends to be produced for many more species than previously. Recent partnerships such as Terrestrial Evidence Partnership of Partnerships (TEPoP) and Terrestrial Surveillance Development and Analyses (TSDA) also aim to improve monitoring and analysis through increased coordination, best-practise sharing and improved analytical join-up between schemes.
However, despite some increases in the scope of monitoring, the majority of respondents to the pre-workshop surveys (29/41) either slightly disagreed (15/41) or strongly disagreed (14/41) that progress towards Strategy Outcomes is well monitored185, and the majority of respondents (43/49) either slightly disagreed (17/49) or strongly disagreed (26/49) that there is adequate monitoring and surveillance of biodiversity. Discussions from the expert workshops provide insight into the reasons for these views (See Annex 6).
7.3.2.3 Evaluation
It is clear that some aspects of biodiversity are well monitored at a national level, for example certain birds, mammals and invertebrates, for which there are long-standing structured monitoring and recording schemes involving thousands of volunteers, enabling reporting on some UK and wider European goals. In general, workshop participants agreed that in England we have some of the best biodiversity data in the world and that long-term monitoring programs are critical for knowing what is happening to populations, with knowledge gained through monitoring biodiversity helping to prioritise and improve delivery of actions. It was noted that funding for monitoring schemes has been reduced in recent years, which has led to some monitoring schemes, such as for scarce and rare birds, being stopped, and some pressure put on other schemes. Participants agreed that it is vital that funding for monitoring continues, to ensure we can detect changes to biodiversity and act quickly to prevent losses.
185 This question was not posed to participants at the Theme 2 ‘People’ workshop.

Evaluation of Biodiversity 2020
126
There has been progress in improving analytical techniques to ensure that opportunistic recording of biodiversity can now also contribute to species trend information, enabling trends to be produced for many more species for which there isn’t a structured monitoring or recording scheme. Recent partnerships set up to share best practise and improve data analysis between recording schemes (TEPoP and TSDA) should also improve progress in analysing and integrating species monitoring data, enabling better use of biodiversity data by providing more informative data products for use in decision making. Furthermore, where monitoring for certain species groups were lacking, progress has been made in establishing new monitoring schemes to ensure we can track changes in these groups, for example plants, pollinators and certain aspects of freshwater biodiversity. These monitoring schemes provide useful information tracking changes to the state of these aspects of biodiversity through time.
However, there is a lack of evidence of monitoring of other aspects of biodiversity such as habitats (although there is some monitoring of the habitat impacts of AES) or ecosystems, suggesting these are much less well monitored. For example, experts attending workshops within this evaluation believed that condition assessments for SSSIs are too infrequent to enable management actions to be adapted to improve progress, and there is little monitoring of priority habitat condition outside of SSSIs, beyond being under favourable management, and no current monitoring of loss of extent of priority habitat. Lack of resources both in terms of funds and staff capacity, were cited as reasons for this.
Furthermore, despite the monitoring and recording schemes in place, there is evidence that the use of this data by land managers and decision makers may still be limited. Biodiversity data may not be effectively communicated or accessible, or in a format or spatial scale that is useful to inform decision making at local levels. As many conservation projects happen on quite small scales, national level trends are not appropriate to inform decision making at these scales. Furthermore, the format of the monitoring or species trend data available may not be appropriate or readily interpretable to land managers. Also, there is a strong species focus to monitoring, rather than habitats, ecosystems or condition, so therefore the data needed to answer certain questions or to inform certain decisions, may not be available. It is unclear the extent to which biodiversity monitoring data are relevant or useable to decision-makers to base decisions about how best to manage a site, particularly at local scales.
With regards to monitoring of progress towards Strategy Outcomes, workshop participants believed that a lack of clear, quantitative targets relating to some of the Outcomes, along with a lack of monitoring data, has hindered monitoring of progress. For example, a lack of, or infrequency of, monitoring or measuring of particular components of biodiversity, such as SSSI site condition, priority habitat outside of management, and loss of priority habitat, hinder monitoring of progress towards Outcome 1 targets. A lack of quantitative targets relating to Outcomes 3 and 4, have hindered monitoring of progress towards these Outcomes. The need for a measure of progress of people’s connectedness to nature, and adoption of environmental behaviours and practices was highlighted through expert interview. Also, poor alignment between the monitoring data that is collected, and the questions that need answering, or at the scale necessary, hinder the use of monitoring data.
The impacts of interventions are also considered to be not well monitored or evaluated, which makes it difficult to draw conclusions about the effectiveness of different actions, which can hinder effective decision-making. However, when there is structured monitoring and evaluation built in from the start of projects, this can help to demonstrate their impacts, for example the Catchment Sensitive Farming project demonstrates the benefits of structured monitoring and evaluation.

Evaluation of Biodiversity 2020
127
7.3.3 C) Improving public access to biodiversity data and other environmental information?
7.3.3.1 Introduction
This section examines what has been done to improve access to data, and whether this has been effective in terms of enabling data to be accessed and used to inform decisions, and how well this has contributed to delivery of the Strategy.
7.3.3.2 Evidence
A summary of Government-led activities aiming to improve access to data and evidence in England since 2011 is provided in Annex 6.
England Biodiversity Indicator 24 reports on the number of biodiversity records within the National Biodiversity Network, and the number of records which are at a spatial resolution of 1km2 or better, as a proxy for the evidence available to underpin conservation decision making. The number of records within the National Biodiversity Network Gateway increased from 68.7 million at the start of 2012, to 131.3 million at the end of March 2017, with an increase of a further 81.9 million records between the launch of the NBN Atlas in April 2018, and May 2018; the majority of this latter increase due to the release of a single large dataset by the British Trust for Ornothology.
The number of publicly accessible records at 1km2 resolution or better increased from 10.5 million at the start of January 2010, to 126.9 million records by May 2018.
Although this indicator demonstrates significant increases in the availability of high-resolution biodiversity records, this does not provide any information about the taxonomic breadth of the data, whether the data are useful or understandable, or whether data are used to inform decision making. Respondents to the pre-workshop questionnaires were divided as to whether biodiversity data are available and accessible to support decision-making185, with 18/41 participants slightly disagreeing, and 20/41 participants slightly (n=19) or strongly (n=1) agreeing.
Over half of respondents to the pre-workshop questionnaires slightly disagree (22/49) or strongly disagree (6/49) that there is adequate data and knowledge sharing between stakeholders. However, 16 participants slightly (15/49) or strongly (1/49) agreed with this statement, demonstrating that there are mixed opinions. In contrast, 28 participants slightly agreed (24/49) or strongly agreed (4/49) that knowledge networks and practitioner communities are increasingly supporting stakeholders across sectors; compared to just 7 participants who slightly disagreed (6/49) or strongly disagreed (1/49). More participants slightly (27/49) or strongly (6/49) disagree that evidence is clearly and consistently communicated; with only 14 participants agreeing that it is.
Literature and discussions at the workshops provided further insight to inform the evaluation (see Annex 6).
7.3.3.3 Evaluation
There has been clear progress towards increasing the amount and types of data that are openly available and accessible online, along with establishing practitioner networks to support knowledge exchange, and toolkits to enable better use of data. However, despite this, workshop participants still felt that data aren’t necessarily available or accessible to support decision making, particularly at local scales. Issues around data ownership and the inaccessibility of records were evident. Concerns raised regarding open data demonstrate that

Evaluation of Biodiversity 2020
128
more may need to be done to ensure stakeholders and data providers are on-board with the idea of open data, and therefore to ensure open data ambition can be realised. Lessons from the Scottish Biodiversity Forum suggests that under-resourcing of those involved with the collection, management and sharing of biodiversity data may reduce capacity for improving the data infrastructure, and that this is exacerbated by expectations that Open Data should be made freely available and by ever-tightening public funding. Shortcomings in the data infrastructure may impact on volunteers who are frustrated by its’ shortcomings, curtailing participation in monitoring projects and thus reducing data collection. Evidence identified that the future availability (i.e. continuity) of data is important, noting that plans should be put in place to ensure this continuity.
A key challenge noted was a lack of local scale data, with suggestion that the problem may lie with a lack of data, rather than a lack of data-sharing. There is also a lack of expertise and familiarity to interpret and advise on the available data, tools and knowledge, and how to apply tools and knowledge and transform these into practise. This is particularly true at local-scales. Record data are not always useful to landowners and instead synthesised outputs from the data, such as modelled data or predictive distribution maps, may be more useful. Furthermore, workshop participants found that the lack of a centralised resource or infrastructure for sharing of knowledge and best practise, reduces the efficiency of projects and sometimes leads to new projects re-inventing the wheel rather than capitalising on knowledge and expertise gained through previous projects. Participants discussed that there is a role for capacity building in terms of knowledge exchange, and a need to better facilitate the exchange of knowledge, both in terms of understanding the data and evidence needs of different sectors and stakeholders, and in terms of applying knowledge gained from research to practise and delivery. Participants commented that this should be an iterative process with research informing delivery, and evaluation of delivery informing the next stage of research needed.
It is unclear from the evidence, the extent to which data are used to better inform decision making, and the impacts this has in terms of achieving the overall goals of the Strategy. For example, no evidence was found on the use of biodiversity monitoring data by the private sector. Workshop participants highlighted the need to better understand how the private sector use such monitoring data and where gaps lie as these might differ from the evidence needs of other stakeholders (e.g. landowners).
7.4 Q2. What lessons can be learnt for future activities that aim to improve knowledge?
This question aims to draw together the lessons that can be learnt, based on workshop discussions, to improve progress in improving knowledge in future.
Several lessons can be learnt regarding improving knowledge, monitoring and data-sharing.
Availability and accessibility of data relevant to local scales is lacking
Although there is substantial ongoing effort to monitor and record biodiversity across England, and to encourage storage of biodiversity records in the NBN Atlas under an open license, many of the useful outputs of such monitoring, such as species indicators, are at too broad a spatial scale to be relevant for local-scale conservation projects. Increasing the spatial coverage and resolution of species records, and ensuring the availability and accessibility of these records to

Evaluation of Biodiversity 2020
129
land-managers at local scales, will help ensure data are available for decision making locally. Furthermore, statistical models which provide outputs which can be downscaled to regional and local levels may improve the local-scale relevance of national monitoring programmes.
Capacity for interpretation of research and data at local scales is lacking
Workshop participants believed that the lack of local expert capacity to inform and advise land managers of data and tools available to aid planning and decision making, along with helping with interpretation of the available information, is hindering progress. Evidence suggests that there are many data sources and tools available to use, but that interpretation of the data and how it can best be used to aid decision making and to answer relevant questions, is lacking. Workshop participants suggested that synthesis of evidence for practitioners are useful.
Lack of link-up between research and data gathering, and conservation projects, is hindering progress
Whilst plenty of research is carried out to answer questions of key importance to the Strategy, discussions at the expert workshops suggested that there is a lack integration of research findings into delivery of conservation projects, and of feeding back knowledge gained through delivery to further inform research needs. This means that the most up-to-date knowledge and research may not always be used to inform decisions, and there may be opportunities to better integrate research outcomes into delivery of biodiversity conservation work.
Lack of infrastructure for sharing of knowledge and best practice
Attendees at several workshops noted that the lack of a centralised resource for sharing knowledge, action and best practise, hindered progress by making it difficult for projects to capitalise on the knowledge and experience gained through previous projects, leading to a lack of efficiency.
Monitoring of progress is hindered by a lack of specific, measurable targets, and a lack of monitoring of certain aspects of biodiversity
Targets set within the Strategy weren’t considered to be specific or measurable, which hinders monitoring of progress. Furthermore, monitoring was not well aligned with the Strategy Outcomes; for example, certain aspects of biodiversity were not measured or monitored, such as priority habitat outside of management, making accurate assessment of progress towards certain Outcomes difficult.
Identifying stakeholder needs
Identification of the evidence needs of different stakeholders would enable a targeted approach to both prioritising and investing in covering evidence gaps, and targeting communication and engagement based on a Needs Assessment exercise.

Evaluation of Biodiversity 2020
130
8 Conclusions Through the evaluation, a range of conclusions have been identified that are cross-cutting, because they address how the whole Strategy is presented, monitored and evaluated, or because they occur through several Themes or were particularly important for a Theme. Here we have drawn these together, under five areas:
• Strategy objectives, targets and progress evaluation (Section 8.1)
• Resources, planning and prioritisation (Section 8.2)
• Working together, engagement and communication (Section 8.3)
• Regulatory and policy drivers, and incentives (Section 8.4)
• Integration of biodiversity across sectors and policy areas (Section 8.5)
8.1 Strategy objectives, targets and progress evaluation
The ability to assess strategies, policies and actions hinges on the availability of evaluative evidence or data monitoring and collection that can support interim and final evaluations. This was found to exist to a mixed degree.
1. Clearly communicable, specific, measurable targets support action, particularly when they are scalable and have stakeholder buy-in.
Specific, measurable targets helped to drive action where they were set, because they gave a clear focus for action and enhanced accountability. There were a range of targets and goals across the Strategy. These targets and goals varied, both in how specific they were, how measurable they were (quantitative versus qualitative targets) and the stage that they focussed on: some targets were process targets (such as undertaking a specific action like establishing a network or a funding call); other targets were more focussed on outcomes, such as those under Outcome 1.
Experts indicated that targets were easier to clearly communicate when they were specific – such as when targets were aligned with recognisable EU and international goals – and this assisted the ability to gain stakeholder engagement. This was particularly true in the parts of the Strategy where there was a clear link between actions and targets (and ultimately between targets and Outcomes). This assisted engagement with external stakeholders and helped to motivate action. Experts suggested that intermediate milestone targets would also help to communicate the actions needed by sectors to achieve the overall goals, thus further enhancing engagement and accountability.
Experts stated that it would be valuable for targets to be spatially scalable, so that they can guide local priorities and be built into local planning. This requires a clear model describing the causal link between individual activities and Strategy Outcomes to make stakeholder engagement effective.
2. A lack of monitoring capacity and targets hinders assessment of progress, and progress itself
Monitoring targets and undertaking evaluation of specific actions are incredibly valuable, but they can be resource-intensive or challenging to undertake. Methodological, technical and data challenges exist where, for instance, a lack or mismatch of skills and capacity, non-

Evaluation of Biodiversity 2020
131
existent baseline or lack of data at the appropriate level, can hinder monitoring and evaluation. Targets that relied upon existing monitoring capability and capacity, especially when these aligned to international requirements (e.g. the biodiversity indicators), were most efficiently and consistently monitored. In contrast, targets requiring much additional work (for translating qualitative to quantitative indicators, for gathering data, and developing analytical methods) were less consistently monitored. This demonstrates the value of considering capacity and capability when setting measurable targets.
Evidence indicates that monitoring capacity was lacking in many areas, and experts agreed that progress towards Strategy Outcomes was not well monitored. A number of monitoring issues were highlighted, including: (i) infrequent monitoring or assessment (site condition of SSSIs – Section 4.3.5; status or movement of species along their recovery curve – Section 4.4.3); (ii) lack of monitoring or data recording (condition of priority habitat outside of SSSIs and AES management – Section 4.4.3; loss of priority habitat – Section 4.4.3), and (iii) a lack of agreed or available metrics (e.g. for measuring progress towards Outcome 4, and towards progress under Theme 2).
Most Strategy targets referred to the desired state of Outcomes by 2020. There were no intermediate targets. Experts suggested that intermediate targets would help to assess whether progress is ‘on track’ and support intermediate evaluation that may indicate whether implemented measures are working as planned (or are being adequately implemented) and whether alternative or remedial action is appropriate.
Along with monitoring progress towards Strategy Outcomes, monitoring the impacts of specific actions is also useful, as it enables assessment of the relative effectiveness of different interventions, which helps inform decision-making. Experts suggested this was not being done enough, or that reporting was inconsistent or inaccessible. Some actions had specific evaluations (e.g. the Nature Improvement Areas or Catchment Sensitive Farming) which provide evidence of their impacts. This required specific resourcing, but was successful because the evaluation was planned form the start. Ongoing evaluation enables reflection on progress and improvements to delivery, capitalising on previous learning to support progress. Communicating the impact of actions, obtained through the evaluation, can build stakeholder confidence, which encourages continued action, and further uptake from new stakeholders.
A lack of action-specific evaluations hindered the overall evaluation of the strategy. The evaluation framework set out for the Natural Environment White Paper (which closely maps to the Strategy) has not been fulfilled - there has been only partial monitoring and evaluation coverage of Strategy actions. Where action-specific evaluations did take place, they were valuable in providing evidence for the evaluation of the Strategy, however where it occurs, such evaluation is rarely resourced beyond the end of a formal activity, which hinders assessment of their long-term contribution towards the overall Outcomes of the Strategy.
8.2 Resources, planning and prioritisation
3. Long-term funding supports progress
Short-term resourcing can be useful to support specific activities, but there are many additional benefits gained through long-term resourcing. Typically, relatively long time-scales are required to obtain measurable biodiversity benefits, especially at large spatial scales. Long-term commitment provides the resources required to have greater chance of gaining and sustaining these benefits. Notably, long-term resourcing of activities is important for
Evaluation of Biodiversity 2020
132
building and maintaining relationships and partnerships through signalling government commitment. Experts suggested that when there is a long-term commitment, this provides greater certainty to all stakeholders and confidence that the activity is seen as a priority (e.g. by government) which, in turn, makes it more likely that other stakeholders will participate and commit to the activities, e.g. by aligning their resources to the goals of the Strategy. A long-term perspective also supports effective planning for evaluation and communication. Within government a long-term perspective supports plans for integration of biodiversity in policy and decision-making; such plans can require time to come to fruition.
One specific benefit of long-term resourcing would be supporting extensions for short-term projects and programmes that have proven successful, thus building on previous successes to efficiently support progress towards Strategy Outcomes. In contrast, short-term (fixed-term) funding provides a clear boundary for the activity (which has benefits, especially when these activities are evaluated well), but at its completion can result in the ‘cliff edge’ where partnerships dissolve and trusted relationships disappear. These issues are exacerbated when staff are employed on a project-specific contract and subsequently move on, given that inter-personal relationships are important for building stakeholder trust and maintaining positive engagement.
4. Progress is hindered by a lack of spatial planning and targeting
Experts strongly indicated that a lack of spatial planning for biodiversity has hindered progress. There is a gap between national level targets, and the joined-up local level planning needed to deliver the targets. Experts suggested that spatially targeted plans for the creation, restoration and improvement of biodiversity could be integrated into local and regional planning to bridge this gap and encourage action towards national goals.
There is some evidence from literature and expert opinion that the inability to spatially target uptake of particular AES prescriptions hindered further contribution of AES to progress towards Outcomes (See Section 4.3.6 and Annex 2 Section 2). This is true for outcomes around enhanced ecological networks, where targeted uptake of habitat creation options in some highly fragmented areas may be beneficial to improving landscape connectivity (see Section 4.3.6); and also true for species recovery goals, whereby uptake of particular options needs to be targeted to species populations. Where this has been successful, it has led to highly beneficial outcomes for species (for example the recovery of the Cirl bunting – see Section 4.4.4).
5. There is limited capacity to access and interpret research, tools and data at local scales
Experts suggested that a limiting factor in conservation planning at local scales is a lack of local expert capacity to inform and advise land managers and stakeholders of the data and tools available to aid planning and decision making, along with a lack of capacity for interpreting the available information. This hinders the integration of the latest data and evidence into local planning and decision-making (See Section 7).
8.3 Working together, engagement and communication
6. Partnerships and collaborative working support progress
There are many benefits of partnerships among stakeholders in supporting progress towards Strategy Outcomes, and tailored communication of the benefits of partnership working to stakeholders can support stakeholder buy-in. Effective partnerships promote shared ownership of activities, which can lead to further resources being released and enable more to be delivered, for example Government investment in the Species Recovery

Evaluation of Biodiversity 2020
133
Programme elicited a two-fold additional investment in cash or in kind from partners – see Section 4.4.4. They also lead to sharing of expertise and knowledge, thus building capacity and improving efficiency by enabling future actions to capitalise on knowledge and experience gained through previous actions (See Annex 1 Section 1.3.3). Experts suggested targeted or tailored communications to stakeholders highlighting some of these benefits of partnership working can support buy-in. Better identification of the needs of different stakeholders (for example data needs, capacity needs) would enable a more targeted approach to communication and engagement, along with ensuring these needs are met to improve buy-in.
Involving the right people in partnerships, which includes those able to influence or authorise
the delivery of action (for example landowners), and having a dedicated coordinator, were
considered important for the success of partnerships by experts and in the literature (See
Section 4.3.4 and Annex 1).
7. One-to-one engagement with stakeholders is important
Communication and engagement with landowners/stakeholders encourages action, but capacity for this has been lacking. For example, personal one-to-one engagement with, and provision of advice for land managers, enhances the uptake of voluntary initiatives (e.g. Catchment Sensitive Farming – Section 6.6, Countryside Stewardship – Section 4.3.6), and supports correct implementation of management actions, which in turn adds value and supports the delivery of the Strategy Outcomes. A lack of capacity for provision of one-to-one advice negatively impacted on the uptake of Higher-Tier Countryside Stewardship agreements when first launched.
8. Lack of communication infrastructure hinders engagement and sharing of knowledge and best practise
Experts suggested that a lack infrastructure to support communication between stakeholders hinders engagement and sharing of knowledge and best practise. For example, the lack of accessibility or visibility of the list of actions for the recovery of priority species, was thought by stakeholders to limit its effectiveness for engaging stakeholders and driving collective action across spatial scales (see Section 4.4.5). Furthermore, experts said that the limitations to sharing of knowledge and best practise, can mean that previous learning is not capitalised on, which sometimes leads to inefficiency and ‘re-inventing the wheel’. It was noted that this is an issue exacerbated by high staff turnover (which may be linked to short-term project funding). Furthermore, experts suggested that the lack of link-up between practitioners and the research community hinders the extent to which research is informed by delivery needs (See Section 7 and Annex 6), and therefore the extent to which current research outputs are useful in improving delivery.
8.4 Regulatory and policy drivers, and incentives
9. Regulatory approaches and statutory frameworks provide confidence to stakeholders and can help drive action
Where there is a strong mandate (e.g. on local authorities to improve air quality – see Annex 5) or a regulatory underpinning to action (e.g. the Water Framework Directive – see Annex 5) this has focussed action and supported progress. Experts suggested the regulatory underpinning is perceived to demonstrate government commitment, and so builds confidence across stakeholders that supports action.

Evaluation of Biodiversity 2020
134
10. Uptake of incentive schemes and voluntary uptake of action, even when there is a financial incentive, is not necessarily sufficient to ensure that goals are met.
Uptake of schemes such as Countryside Stewardship, voluntary measures under the Campaign for Farmed Environment, and biodiversity offsetting, for example, have been lower than expected (See Sections 4.3.6, 5, 6.5.3). Evidence from experts and literature suggests that support from Government, through the provision of advice, guidance, practical support/capacity building or market infrastructure which reduces the perceived risk of uptake, or through the presence of a clear mandate, supports improved uptake of positive action. Examples include advisors facilitating uptake of AES (see Section 4.3.6 and Annex 1), and a suggested mandatory approach to biodiversity offsetting to improve stakeholder confidence and take-up (see Section 79 and Annex 4).
From a business perspective, there is a need for sufficient certainty, scalability and returns – whether this be with regards green market opportunities or involvement in innovative financing mechanisms. Market infrastructure and intermediary availability can support stakeholder participation by providing credibility in the approach and practical support to stakeholders. Intermediaries can range from NGOs to brokers - the suitability of each will differ depending on the purpose and context of engagement (see Section 5 and Annex 4). In addition to regulatory and/or policy certainty, and market infrastructure, there is a need to ensure the demonstration of successful applications.
8.5 Integration of biodiversity across sectors and policy areas
11. There has been little integration of biodiversity goals across sectors and policy areas, which may have limited progress against the Strategy objectives
Although a goal of the Strategy was to better integrate consideration of biodiversity across policy areas, there is limited evidence to suggest meaningful integration of biodiversity has occurred. Where there has been integration of biodiversity considerations, this has led to benefits; for example, AES have delivered substantial biodiversity improvements (see Section 4.3.6), and there has been significant investment by water companies in environmental improvements to benefit biodiversity (see Section 6 and Annex 5). A lack of integration of species recovery goals and conservation of genetic resources into landscape-scale measures such as designated sites and AES was commonly cited by experts as an area preventing further progress (See Section 4.4.4.3, 4.5.4 and Annexes 2 and 3).
There is little evidence that consideration of biodiversity has influenced decision making across policy areas. Agendas from other policy areas may conflict with biodiversity (even within Defra), thus hindering action to reduce external pressures on biodiversity. For example, targets to increase building of housing have led to increased development and concurrently there have been more planning applications and increased consent for developments within AONBs due to the conflicting pressures on local planning authorities.
Experts felt that better integration of biodiversity across sectors would be supported by a greater focus on biodiversity (rather than nature or the environment more generally) and by consistent methods for the valuation of biodiversity (See Section 5.3.3.2, Annex 4, and Annex 5 Section 2.2.4).
The lack of a consolidated approach to the valuation of biodiversity makes it difficult to demonstrate and quantify the value of biodiversity across sectors, and although there are an increasing number of tools to support the integration of biodiversity in policy and decision-making, these can be overwhelming and guidance can only go so far in enabling

Evaluation of Biodiversity 2020
135
people to confidently use these tools. Furthermore, cultural barriers and resistance to change, both within government and private organisations, should not be underestimated when pursuing the integration of new processes and approaches.
There is also a lack of clarity about the use of terminology, both in the literature and in practice. Biodiversity can be confused with ‘nature’ or ‘environment’ more generally, and action for ‘nature’ may not support progress towards biodiversity targets. Furthermore, a focus on ecosystem services or Natural Capital can lead to the exclusion of biodiversity if it is not viewed as being valued or useful.
Evaluation of Biodiversity 2020
136
List of Annexes The following Annexes are provided as separate documents:
• Annex 1 – Theme 1 PA 1 Ecological Networks o A1.1 Evidence Pack: Theme 1 PA 1 o A1.2 Workshop Note: Theme 1 PA 1
• Annex 2 – Theme 1 PA 3 Recovery of Priority Species o A2.1 Evidence Pack: Theme 1 PA 3 o A2.2 Workshop Note: Theme 1 PA 3
• Annex 3- Evidence summary: Theme 1 PA4 Conservation of Agricultural Genetic Resources
• Annex 4 - Theme 2 People o A4.1 o A4.2
• Annex 5 - Theme 3 Reducing Environmental Pressures o A5.1 Evidence Pack: Theme 3 o A5.2 Workshop Note: Theme 3
• Annex 6 - Evidence summary: Theme 4 Improving Our Knowledge

Evaluation of Biodiversity 2020
137