Embed Size (px)
Citation preview
Post Opening Project Evaluation M4 J19 – 20 & M5 J15 – 17 Smart Motorway - One Year After
December 2016
Notice
Although this report was commissioned by Highways England, the findings and recommendations are those of the authors and do not necessarily represent the views of the Highways England. While Highways England has made every effort to ensure the information in this document is accurate, Highways England does not guarantee the accuracy, completeness or usefulness of that information; and it cannot accept liability for any loss or damages of any kind resulting from reliance on the information or guidance this document contains.

Post Opening Project Evaluation M5 J15 – 17 & M4 J19 – 20: One Year After Study
1
Foreword
Highways England’s motorways are some of the safest in the world. Our road network carries a third of road traffic and we have seen demand grow by a quarter since 2000 with continued growth forecast.
One reason for the introduction is smart motorways is because there are more vehicles on the road. By making use of the full width of the road, smart motorways add that extra capacity to carry more vehicles and ease congestion.
They have evolved from Controlled Motorways (with variable speed limits) to Dynamic Hard Shoulder Running (opening the hard shoulder as a running lane to traffic at busy periods) to All Lane Running (permanently removing the hard shoulder and converting it into a running lane).
Compared to a traditional motorway widening they deliver:
• Increased capacity at significantly less cost than traditional motorway widening.
• New technology and variable speed limits to improve traffic flow.
• Less congestion and more reliable journeys for customers.
• Environmental benefits of not taking an extra corridor of land to use as new road.
• A safety record that’s at least as safe, if not safer than conventional motorways.
Before the scheme, this section of the motorway experienced high levels of congestion. Customers experienced delays on the approach to junctions which created queuing onto the mainline. The scheme features variable speed limits throughout and enabled the use of the hard shoulder as an extra lane at busy periods on the M4 (junctions 19 to 20) and M5 (junctions 16-17). When it is open, the speed limit is reduced to a maximum 60mph across all lanes. M5 J15 to J16 is a very short distance and features areas of hard shoulder and the approach to J16 southbound has no hard shoulder.
This report indicates how the scheme was performing within its first year of operation. Whilst this study is not intended to provide conclusive evidence about scheme benefits, it provides an early indication about whether a scheme is heading in the right direction. This initial assessment forms part of a longer-term evaluation which reviews performance over five years.
Personal injury collisions on the strategic road network are very rare and can be caused by many factors. Due to their unpredictable nature, we monitor trends over many years before we can be confident that a real change has occurred. Within the first year, we have observed a reduction in the number and rate of personal injury collisions generated by the scheme.
At the time of designing the scheme it was anticipated that the benefits for road users (in terms of reducing congestion and making the journeys more reliable) would not be observed within the first year of operating the smart motorway and would be more likely to occur in later years. The early indications are that the scheme is helping to make journeys more reliable during the most congested periods of the day, However, we will continue to review the scheme’s impacts as part of the longer-term evaluation.
The evaluation findings have also highlighted that we needed to improve our processes for opening the hard shoulder. Initially, we opened and closed the hard shoulder at similar times each day to provide customers with a predictable driving experience. We now assess whether the road is reaching its peak capacity and open the hard shoulder as required.
Since this scheme, smart motorways have evolved. More recent all lane running schemes have demonstrated that they are making journeys more reliable for those travelling during congested periods, enabling us to operate the road at a higher speed limit for longer periods, whilst maintaining safety.
We’re working to continually improve our smart motorways. Our Traffic Officers work around the clock to operate our smart motorways, keeping customers safe from the control room and attending incidents the road. We’ve committed to additional signs and more visible markings for emergency areas and our latest set of standards will ensure that there’s a safe place to stop in an emergency every mile on our upcoming schemes. All of this helps to provide one of the most modern and safe road environments in the world.
January 2020
Post Opening Project Evaluation M5 J15 – 17 & M4 J19 – 20: One Year After Study
2
Table of Contents
Chapter Pages
Executive summary 4 Scheme description 4 Objectives 4 Key findings 4 Summary of Scheme Impacts 5
1. Introduction 8 Background 8 Scheme Context 8 Scheme Description 9 Nearby Pinch Point Schemes 12 National Pinch Point Programme (PPP) 12 Local Pinch Points 13 Scheme objectives 15 History of the scheme 15 Post Opening Project Evaluation (POPE) 15 Report Structure 16
2. Traffic Evaluation 17 Introduction 17 Traffic Data Sources 17 Traffic Volume Analysis 19 Forecasting Accuracy 26 Journey Time Evaluation 31 Journey Time Reliability 43
3. Safety Evaluation 48 Introduction 48 Data Sources 48 Observed Collision Numbers 51 Statistical Significance 52 Forecast vs Outturn Collision Numbers 52 Collision Rates 53 Fatalities and Weighted Index 53 Personal Security 53
4. Economy 56 Introduction 56 Sources 56 Forecast Present Value Benefits 57 Journey Time Benefits 57 Vehicle Operating Costs 59 Safety Benefits 60 Carbon Impact 61 Journey Time Reliability 62 Summary of Present Value Benefits 62 Indirect Tax Revenues Impact 63 Scheme Costs 64 Investment Costs 64 Operation, Maintenance and Renewal Costs 65 Summary of Present Value Costs (PVC) 65 Benefit Cost Ratio (BCR) 66
Post Opening Project Evaluation M5 J15 – 17 & M4 J19 – 20: One Year After Study
3
5. Environment Evaluation 69 Introduction 69 Data Collection 69 Site Inspections 69 Consultations 70 Animal Mortality 71 Traffic Forecasts and Evaluation 71 Noise 72 Local Air Quality 76 Greenhouse Gases 77 Landscape and Townscape 78 Biodiversity 84 Cultural Heritage and Archaeology 86 Water Quality and Drainage 89 Physical Fitness 89 Journey Ambience 90
6. Accessibility and Integration 94 Accessibility 94 Integration 95
7. Conclusion 100 Scheme Specific Objectives 100
8. Appraisal Summary Table (AST) and Evaluation Summary Table (EST) 101
9. Appendices 103
Appendix A. MIDAS Analysis M5 J17 – 15 104
Appendix B. Environment Information Requested 106
Appendix C. Photomontage Comparison Views 107
Appendix D. Glossary 122
Appendix E. List of Tables and Figures 124
Introduction text

Post Opening Project Evaluation M5 J15 – 17 & M4 J19 – 20: One Year After Study
4
Executive summary
Scheme description The M5 Junctions 15 – 17 and M4 Junctions 19 – 20 Smart Motorway scheme is located to the west of Bristol and forms part of the strategic motorway network, connecting London to south Wales and Devon and Cornwall to the Midlands. The scheme opened to traffic in January 2014 and consists of three main elements to provide additional capacity as follows:
Controlled Motorway – primarily through Almondsbury Interchange
All Lane Running – on the approaches to Almondsbury interchange on the M4 westbound andM5 northbound
Dynamic Hard Shoulder Running (DHSR)– M5 Junction 16 – 17 and M4 J19- 20
This document summarises the findings of the one year after post opening evaluation study completed in 2015. A further POPE evaluation study will be undertaken when the scheme has been open for five years.
Objectives Objective
(stated in Client Scheme Requirements, 2011) Has the objective been achieved?
The scheme shall reduce the number of fatalities, casualties and incidents on the M5 J15 – J17 and M4 J19 – J20, and through the Almondsbury Interchange, per vehicle kilometre.
The scheme shall improve journey times and journey time reliability on the M5 between Junctions 15 and 17, on the M4 between Junctions 19 and 20 and through Almondsbury Junction.
Too early to conclude journey time impacts
Improvements in reliability achieved
The project shall provide high or very high value for money against its whole of life costs in accordance with the Department’s WebTAG guidance.
Too early to conclude
The detrimental environmental effects of the scheme shall be offset by mitigation measures where technically feasible and economic to do so.
Key findings Reliability as measured by how widely journey times vary has improved on weekdays across
the day for vehicles travelling from the M4 to M5 and in the AM peak for vehicles travelling fromthe M5 to M4.
Forecasts expected a negligible improvement in journey times in the opening year andimprovements in journey times were expected in later years with the increased congestionanticipated with traffic growth.
Traffic flows have increased although not to the level expected, which is most likely due to theeconomic downturn. Consequently, congestion levels are lower than expected meaning the useof Variable Mandatory Speed Limits (a Smart Motorway feature) has led to reduced averagespeeds and a slight worsening of journey times in the opening year.
There has been a significant improvement in safety in the opening year, with a 50% reductionin collision rates, which is higher than forecast.
The results in the opening year show there has been a slight journey time disbenefit, however,only a negligible improvement in the opening year was forecast, with more substantial journeytime benefits expected in later years.
Post Opening Project Evaluation M5 J15 – 17 & M4 J19 – 20: One Year After Study
5
Summary of Scheme Impacts
Traffic
Flows
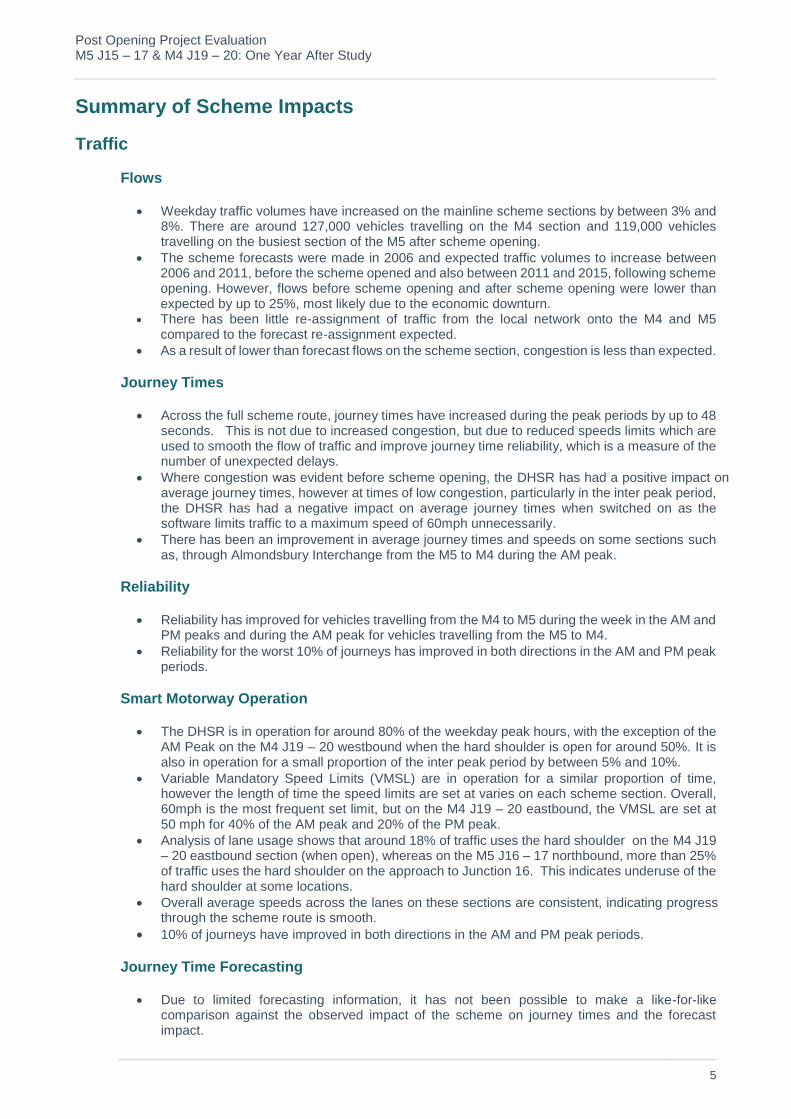
Weekday traffic volumes have increased on the mainline scheme sections by between 3% and8%. There are around 127,000 vehicles travelling on the M4 section and 119,000 vehiclestravelling on the busiest section of the M5 after scheme opening.
The scheme forecasts were made in 2006 and expected traffic volumes to increase between2006 and 2011, before the scheme opened and also between 2011 and 2015, following schemeopening. However, flows before scheme opening and after scheme opening were lower thanexpected by up to 25%, most likely due to the economic downturn.
There has been little re-assignment of traffic from the local network onto the M4 and M5compared to the forecast re-assignment expected.
As a result of lower than forecast flows on the scheme section, congestion is less than expected.
Journey Times
Across the full scheme route, journey times have increased during the peak periods by up to 48seconds. This is not due to increased congestion, but due to reduced speeds limits which areused to smooth the flow of traffic and improve journey time reliability, which is a measure of thenumber of unexpected delays.
Where congestion was evident before scheme opening, the DHSR has had a positive impact onaverage journey times, however at times of low congestion, particularly in the inter peak period,the DHSR has had a negative impact on average journey times when switched on as thesoftware limits traffic to a maximum speed of 60mph unnecessarily.
There has been an improvement in average journey times and speeds on some sections suchas, through Almondsbury Interchange from the M5 to M4 during the AM peak.
Reliability
Reliability has improved for vehicles travelling from the M4 to M5 during the week in the AM andPM peaks and during the AM peak for vehicles travelling from the M5 to M4.
Reliability for the worst 10% of journeys has improved in both directions in the AM and PM peakperiods.
Smart Motorway Operation
The DHSR is in operation for around 80% of the weekday peak hours, with the exception of theAM Peak on the M4 J19 – 20 westbound when the hard shoulder is open for around 50%. It isalso in operation for a small proportion of the inter peak period by between 5% and 10%.
Variable Mandatory Speed Limits (VMSL) are in operation for a similar proportion of time,however the length of time the speed limits are set at varies on each scheme section. Overall,60mph is the most frequent set limit, but on the M4 J19 – 20 eastbound, the VMSL are set at50 mph for 40% of the AM peak and 20% of the PM peak.
Analysis of lane usage shows that around 18% of traffic uses the hard shoulder on the M4 J19– 20 eastbound section (when open), whereas on the M5 J16 – 17 northbound, more than 25%of traffic uses the hard shoulder on the approach to Junction 16. This indicates underuse of thehard shoulder at some locations.
Overall average speeds across the lanes on these sections are consistent, indicating progressthrough the scheme route is smooth.
10% of journeys have improved in both directions in the AM and PM peak periods.
Journey Time Forecasting
Due to limited forecasting information, it has not been possible to make a like-for-likecomparison against the observed impact of the scheme on journey times and the forecastimpact.
Post Opening Project Evaluation M5 J15 – 17 & M4 J19 – 20: One Year After Study
6
Traffic forecasts included information on the expected change in average travel times anddelays during peak periods in the opening year and 2031. This information shows a negligibleimprovement in average travel times was expected in the opening year and more pronouncedimprovements were expected by 2031 as the scheme was expected to deliver benefits withincreased congestion. The trend of benefits expected means at this stage it is too soon toconfidently evaluate the long term economic benefits of the scheme.
The primary reason for the slight reduction in average journey times compared to the negligibleimprovement forecast is due to congestion levels in the opening year being below the levelexpected. This means congestion is not at the level required for the Smart Motorway elementsto improve the operational efficiency of the motorway.
Safety There has been a statistically significant reduction in collisions on the M4 and M5 scheme
sections of an average of 8.6 (55%) and 10.5 (54%) collisions per annum respectively since thescheme opened. These results show the scheme has saved more collisions than expected
The proportion of fatal and serious collisions has also reduced following the scheme opening.There have been no fatal or serious collisions on the M4 and M5 since the scheme opened.
There has been a 55% (0.040 collision/mvkm) reduction in the collision rate on the M4 and 52%(0.052 collisions/mvkm) reduction on the M5 since the scheme opened, which is statisticallysignificant.
Environment The impact of the scheme on all environmental sub-objectives is as expected or better than
expected at OYA.
Greenhouse gas emissions have reduced by 2% with the scheme, compared to the increaseexpected.
Based on comparison between observed and forecast traffic flows, the impact of the schemeon noise is better than expected at OYA.
Observed traffic flows are around 18% lower than forecast, hence the impact of the scheme onnoise is better than expected.
Landscape proposals to mitigate the impact of the scheme have been undertaken as planned,although planting between M5 Junction 16 and 17 has not yet reached a height to providescreening.
Rich grassland has been provided within Almondsbury Interchange as planned, howeverassessment of the scheme impact on biodiversity has been restricted due to limited informationmade available to POPE.
Accessibility and Integration
There has been no change to the severance impact of the motorway since the schemeopened.
The scheme aligns with relevant local, regional and national land use and other governmentpolicies.

Post Opening Project Evaluation M5 J15 – 17 & M4 J19 – 20: One Year After Study
7
Summary of Economic Performance
All monetary values in £m 2002 market prices, discounted Forecast Outturn
re-forecast
Present Value Benefits
Journey Times £591m n/a
Vehicle Operating Costs (VOC) -£22.6m £0.13
Construction & maintenance delay -£30.4m*
Safety £32.9m £71.1m
Indirect Tax £36.8m £0m
Noise* -£0.02m -£0.02m
Carbon -£11.7m £0m
Total PVB £596m n/a
Present Value Costs including operating costs (PVC) £79.3m £77.6m
Benefit Cost Ratio (BCR) 7.5 n/a
* Assumed to be as forecast
Summary of Scheme Economic Performance
The forecasts expected a negligible improvement in journey times in the opening year,increasing to substantial benefits in later years. The outturn opening year results show therehas been a slight worsening of journey times (and some improvement to journey timereliability). Due to the profile of forecast benefits, we cannot be confident the outturnopening year results are reflective of the long term benefits (60 year appraisal period).Consequently, it is too early to be confident that the first year findings are representative ofthe scheme performance.
The monetary benefits of the savings in the number of injury collisions is evaluated as £71.1million over 60 years, more than double that forecast despite excluding the impact ofbackground reduction in collisions over this period from the benefits.
The investment cost of building the scheme was £77.6 million, 2% less than forecast.
Long term costs for Highways England of operating the smart motorway are assumed tobe as forecast at £22.9 million and are included in the overall costs.
There has been a very small change in carbon emissions since the scheme opened hencethe outturn monetised value is £0 million.
An outturn BCR has not been calculated due to the difficulty in evaluating the journey timebenefits at the OYA stage.
It is noted that at OYA the monetised safety benefits and reliability benefits (if they wereachieved in line with the forecast of £131.9 million) outweigh the scheme costs of £77.6million.

Post Opening Project Evaluation M5 J15 – 17 & M4 J19 – 20: One Year After Study
8
1. Introduction
Background 1.1. This report represents the One Year After (OYA) post opening study of the M5 J15 – 17 & M4 J19
– 20 scheme which opened in January 2014. The evaluation has been prepared as part ofHighways England’s (formerly known as the Highways Agency) Post Opening Project Evaluation (POPE) programme.
Scheme Context 1.2. The M5 motorway provides a strategic link to the south west of England, connecting Devon and
Cornwall to the midlands and the north. The M4 motorway provides an east-west connection from London to south Wales. In addition, the M4 and M5 provide a sub-national route connecting major centres (e.g. Worcester, Gloucester, Bristol and Exeter) along the motorway corridors as shown in Figure 1-1.
Figure 1-1 Scheme Location
1.3. The following transport related issues are taken from the Client Scheme Requirements (CSR, Version 1.3, July 2011). The Client Scheme Requirements states “the capacity and congestion issues on the motorway network, from M4 junction 19 through Almondsbury Interchange to M5 Junction 17 are due to a complex interaction between the dynamic traffic movements and the physical constraints of the motorway”. Table 1-1 shows the physical network constraints and issues relating to traffic volumes and movements identified in the Client Scheme Requirement as contributing to congestion and delays.
M4 towards London
M4 towards Wales
M5 towards Midlands
M5 towards South West
M4/M5 Scheme
Post Opening Project Evaluation M5 J15 – 17 & M4 J19 – 20: One Year After Study
9
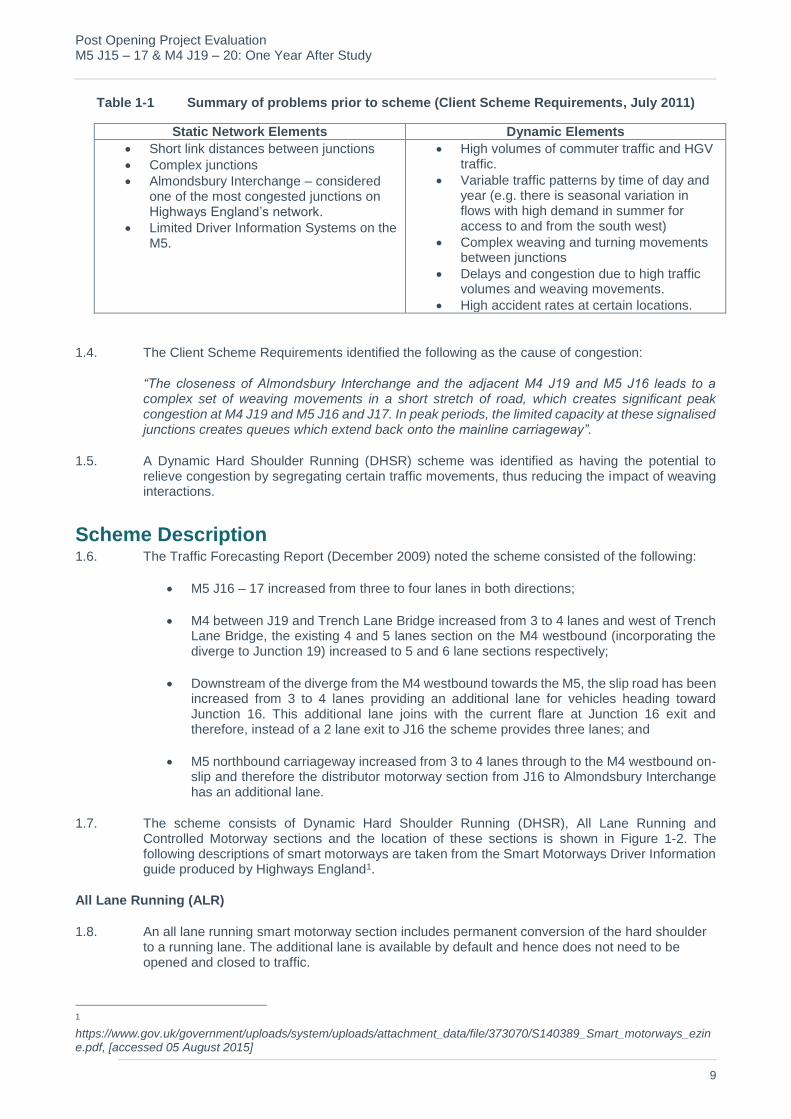
Table 1-1 Summary of problems prior to scheme (Client Scheme Requirements, July 2011)
Static Network Elements Dynamic Elements
Short link distances between junctions
Complex junctions
Almondsbury Interchange – consideredone of the most congested junctions onHighways England’s network.
Limited Driver Information Systems on theM5.
High volumes of commuter traffic and HGVtraffic.
Variable traffic patterns by time of day andyear (e.g. there is seasonal variation inflows with high demand in summer foraccess to and from the south west)
Complex weaving and turning movementsbetween junctions
Delays and congestion due to high trafficvolumes and weaving movements.
High accident rates at certain locations.
1.4. The Client Scheme Requirements identified the following as the cause of congestion:
“The closeness of Almondsbury Interchange and the adjacent M4 J19 and M5 J16 leads to a complex set of weaving movements in a short stretch of road, which creates significant peak congestion at M4 J19 and M5 J16 and J17. In peak periods, the limited capacity at these signalised junctions creates queues which extend back onto the mainline carriageway”.
1.5. A Dynamic Hard Shoulder Running (DHSR) scheme was identified as having the potential to relieve congestion by segregating certain traffic movements, thus reducing the impact of weaving interactions.
Scheme Description 1.6. The Traffic Forecasting Report (December 2009) noted the scheme consisted of the following:
M5 J16 – 17 increased from three to four lanes in both directions;
M4 between J19 and Trench Lane Bridge increased from 3 to 4 lanes and west of TrenchLane Bridge, the existing 4 and 5 lanes section on the M4 westbound (incorporating thediverge to Junction 19) increased to 5 and 6 lane sections respectively;
Downstream of the diverge from the M4 westbound towards the M5, the slip road has beenincreased from 3 to 4 lanes providing an additional lane for vehicles heading towardJunction 16. This additional lane joins with the current flare at Junction 16 exit andtherefore, instead of a 2 lane exit to J16 the scheme provides three lanes; and
M5 northbound carriageway increased from 3 to 4 lanes through to the M4 westbound on-slip and therefore the distributor motorway section from J16 to Almondsbury Interchangehas an additional lane.
1.7. The scheme consists of Dynamic Hard Shoulder Running (DHSR), All Lane Running and Controlled Motorway sections and the location of these sections is shown in Figure 1-2. The following descriptions of smart motorways are taken from the Smart Motorways Driver Information guide produced by Highways England1.
All Lane Running (ALR)
1.8. An all lane running smart motorway section includes permanent conversion of the hard shoulder to a running lane. The additional lane is available by default and hence does not need to be opened and closed to traffic.
1
https://www.gov.uk/government/uploads/system/uploads/attachment_data/file/373070/S140389_Smart_motorways_ezine.pdf, [accessed 05 August 2015]

Post Opening Project Evaluation M5 J15 – 17 & M4 J19 – 20: One Year After Study
10
Dynamic Hard Shoulder Running (DHSR)
1.9. A dynamic smart motorway section uses the hard shoulder as a temporary extra lane to provide more capacity when needed. On these sections the hard shoulder is only open to traffic at busy times to relieve congestion.
Controlled Motorway (CM)
1.10. Controlled motorways have three or more lanes with variable speed limits indicated through the use of overhead gantry signing. The hard shoulder is not used as a running lane, and is only used in a genuine emergency.

Post Opening Project Evaluation M5 J15 – 17 & M4 J19 – 20: One Year After Study
11
Figure 1-2 Scheme Layout
Local Pinch Point: A39 Approach and M5
Junction 17 roundabout widening
National Pinch Point: M5 Junction 17
southbound off-slip
Local Pinch Point: M5 Junction 16
roundabout widening and Merlin Road and
Highwood Road widening
National Pinch Point: M5 Junction 16
northbound off-slip
Post Opening Project Evaluation M5 J15 – 17 & M4 J19 – 20: One Year After Study
12
Nearby Pinch Point Schemes 1.11. The National Pinch Point Programme (PPP) was announced by the Chancellor in November 2011
and consisted of £317 million of funding (three tranches of applications for funding) set aside for pinch point scheme submissions. The schemes targetted areas of the network under particular stress and were also aimed at supporting economic growth (e.g. housing, employment, enterprise zones and gateways). The national pinch point schemes affecting this scheme are M5 Junction 17 southbound off-slip and M5 Junction 16 northbound off-slip
1.12. The Local Pinch Point Fund emerged as part of the Government’s Autumn Statement in 2012 to provide funding to remove bottlenecks on the local highways network which were limiting economic growth by restricting the movement of goods and people. The local pinch point scheme on the M4/M5 scheme section consists of M5 Junction 16 / A38 roundabout and approach widening and M5 Junction 17 roundabout, Merlin Road and Highwood Road widening.
1.13. Further details of the national and local pinch point schemes on the M4/M5 scheme section under evaluation are provided below.
National Pinch Point Programme (PPP)
M5 Junction 17 Southbound Off-slip2 Construction Start: January 2015 Expected Construction End Date: 13 March 20153
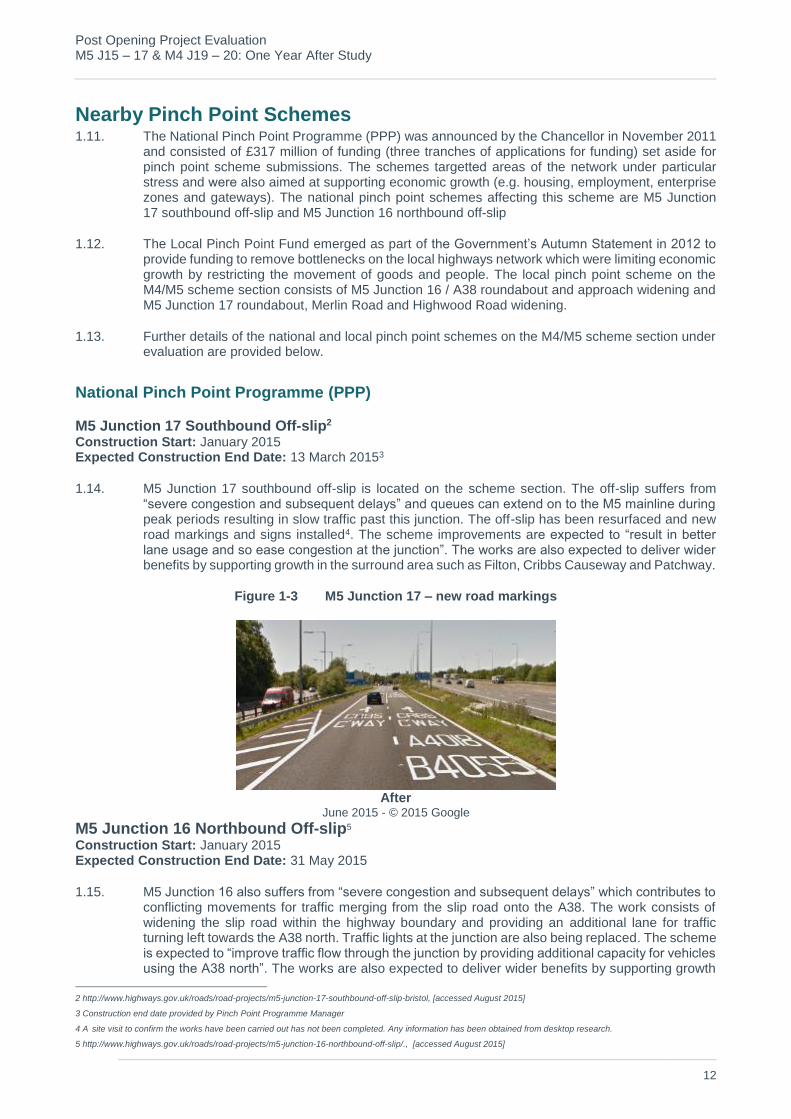
1.14. M5 Junction 17 southbound off-slip is located on the scheme section. The off-slip suffers from “severe congestion and subsequent delays” and queues can extend on to the M5 mainline during peak periods resulting in slow traffic past this junction. The off-slip has been resurfaced and new road markings and signs installed4. The scheme improvements are expected to “result in better lane usage and so ease congestion at the junction”. The works are also expected to deliver wider benefits by supporting growth in the surround area such as Filton, Cribbs Causeway and Patchway.
Figure 1-3 M5 Junction 17 – new road markings
After June 2015 - © 2015 Google
M5 Junction 16 Northbound Off-slip5 Construction Start: January 2015 Expected Construction End Date: 31 May 2015
1.15. M5 Junction 16 also suffers from “severe congestion and subsequent delays” which contributes to conflicting movements for traffic merging from the slip road onto the A38. The work consists of widening the slip road within the highway boundary and providing an additional lane for traffic turning left towards the A38 north. Traffic lights at the junction are also being replaced. The scheme is expected to “improve traffic flow through the junction by providing additional capacity for vehicles using the A38 north”. The works are also expected to deliver wider benefits by supporting growth
2 http://www.highways.gov.uk/roads/road-projects/m5-junction-17-southbound-off-slip-bristol, [accessed August 2015]
3 Construction end date provided by Pinch Point Programme Manager
4 A site visit to confirm the works have been carried out has not been completed. Any information has been obtained from desktop research.
5 http://www.highways.gov.uk/roads/road-projects/m5-junction-16-northbound-off-slip/., [accessed August 2015]

Post Opening Project Evaluation M5 J15 – 17 & M4 J19 – 20: One Year After Study
13
in the surround area such as Filton, Cribbs Causeway and Patchway. Figure 1-4 shows the before and after scheme layout.
Figure 1-4 M5 Junction 16 Before and After PPP
Before October 2008 - © 2015 Google
After June 2015 - © 2015 Google
Local Pinch Points
1.16. South Gloucestershire secured £1.14 million of funding from the Department for Transport (DfT) Local Pinch Point Fund to construct improvements to the local road network at M5 J16 and J17. The scheme entailed the following works.
M5 Junction 16 / A38 Approach and Roundabout Widening6 Construction Start: Approximately October 2014 Construction End Date: Works have been completed.
1.17. This scheme aims to improve capacity to minimise the impact of future development. The scheme consisted of the following:
Widening of the A38 approach to provide a fourth approach lane.
Widening of Almondsbury side of the roundabout to provide a fourth circulating lane (asshown in Figure 1.5).
Realignment of the cycle/footway next to the carriageway.
Improvements to the highway drainage.
Highway resurfacing.
Upgrade of street lighting to LED type to reduce energy consumption.
6 Public Consultation Feedback Document, Almondsbury – M5 Junction 16 / A38 Approach and Roundabout Widening

Post Opening Project Evaluation M5 J15 – 17 & M4 J19 – 20: One Year After Study
14
Figure 1-5 M5 Junction 16 Before and After Local Pinch Point Widening Circulatory
Before October 2008 - © 2015 Google
After June 2014 - © 2015 Google
M5 Junction 17 Roundabout, Merlin Road and Highwood Lane widening7 Construction Start: Approximately January 2015 Expected Construction End Date: On carriageway works have been completed.
1.18. The proposed scheme consists of:
Widening Highwood Lane exit to provide a third traffic lane at the Merlin Road/HighwoodLane traffic signals.
Widening Merlin Road to provide a third traffic lane between the southbound exit slip andHighwood Lane as shown in Figure 1.6.
Change road markings to allow traffic from all three lanes of the northbound exit slip tocirculate around the roundabout into Merlin Road.
Upgrade traffic signals equipment.
Figure 1-6 M5 Junction 17 Before and After Local Pinch Point Widening of Merlin Road
Before June 2009 - © 2015 Google
After May 2015 - © 2015 Google
1.19. There are also two local authority schemes which are not located on the scheme section but could have an impact on traffic flows in and around Bristol. These are the closure of Highwood Road to general traffic (excluding buses, taxis and cycles) in July 2012 and the opening of Hayes Way (also
7 Public Consultation Feedback Document, Almondsbury – M5 Junction 16 / A38 Approach and Roundabout Widening

Post Opening Project Evaluation M5 J15 – 17 & M4 J19 – 20: One Year After Study
15
referred to as A38 Cribbs Causeway Distributor) in December 2010. The location of these schemes and their relevance to the scheme are demonstrated in Chapter 2 (Figure 2-5).
Scheme objectives 1.20. The scheme objectives are taken directly from the Client Scheme Requirements:
1) The project shall provide high or very high value for money against its whole of life costs inaccordance with the Department’s WebTAG guidance.
2) The detrimental environmental effects of the scheme shall be offset by mitigation measureswhere technically feasible and economic to do so.
3) The scheme shall improve journey times and journey time reliability on the M5 betweenJunctions 15 and 17, on the M4 between Junctions 19 and 20 and through AlmondsburyJunction.
4) The scheme shall reduce the number of fatalities, casualties and incidents on the M5 J15 –J17 and M4 J19 – J20, and through the Almondsbury Interchange, per vehicle kilometre.
History of the scheme 1.21. A brief history of events involved in the development of the scheme are shown in Table 1-2.
Table 1-2 History of Scheme
Date Event
June 2008 Highways England undertake study to determine whether the implementation of Managed Motorways is an alternative to widening for increasing capacity. The M4/M5 scheme was included in this study of 25 schemes.
January 2009 Secretary of State announced Managed Motorway with hard shoulder running is the preferred solution for the M4/M5.
October 2011 Advanced works and vegetation clearance begin
November 2011 Public Information Exhibition
January 2012 Start of construction
January 2014 Scheme opened
January 2015 Approximate construction start of M5 Junction 16 northbound off-slip and M5 Junction 17 southbound off-slip National Pinch Point schemes
March 2015 Completion of National PPP M5 J17 southbound off-slip
May 2015 Completion of National PPP M5 J16 northbound off-slip
April – July 2015 Approximate completion of Local Pinch Point schemes
2015 OYA POPE Evaluation
Post Opening Project Evaluation (POPE) 1.22. Highways England is responsible for improving the strategic highway network (motorways and
trunk roads) by delivering the Major Schemes Programme. At each key decision stage through the planning process, schemes are subject to a rigorous appraisal process to provide a justification for the project’s continued development. When submitting a proposal for a major transport scheme, the Department for Transport (DfT) specifies that an Appraisal Summary Table (AST) is produced which records the degree to which the DfT’s objectives8 for transport have been achieved. The contents of the AST allow judgements to be made about the overall value for money of the scheme. The AST for this scheme is presented in Table 8-1.
1.23. POPE studies are carried out for all major schemes to evaluate the strengths and weaknesses in the techniques used for appraising schemes. This is so that improvements can be made in the future. For POPE, this is achieved by comparing information collected before and after the opening of the scheme to traffic, against forecasts made during the planning process. The outturn impacts
8 As of August 2011, this approach has been revised. However, POPE is concerned with evaluation against the appraisal and as such use objectives valid at the time of appraisal.
Post Opening Project Evaluation M5 J15 – 17 & M4 J19 – 20: One Year After Study
16
of a scheme are presented in an Evaluation Summary Table (EST) which summarises the extent to which the objectives of a scheme have been achieved. The EST for this scheme can be found in Table 8-2.
1.24. POPE of Major Schemes goes beyond monitoring progress against targets set beforehand. Instead, it provides the opportunity to study which aspects of the intervention and appraisal tools used to evaluate it are performing better or worse than expected, and how they can be made more effective. More specifically the objectives of POPE evaluation reports are as follows:
Provide a quantitative and qualitative analysis of scheme impacts consistent with national
transport appraisal guidance (WebTAG) and scheme specific objectives.
Identification and description of discrepancies between forecast and outturn impacts.
Explanations of reasons for differences between forecast and outturn impacts.
Identification of key issues relating to appraisal methods that will assist Highways England in
ongoing improvement of appraisal approaches and tools used for major schemes.
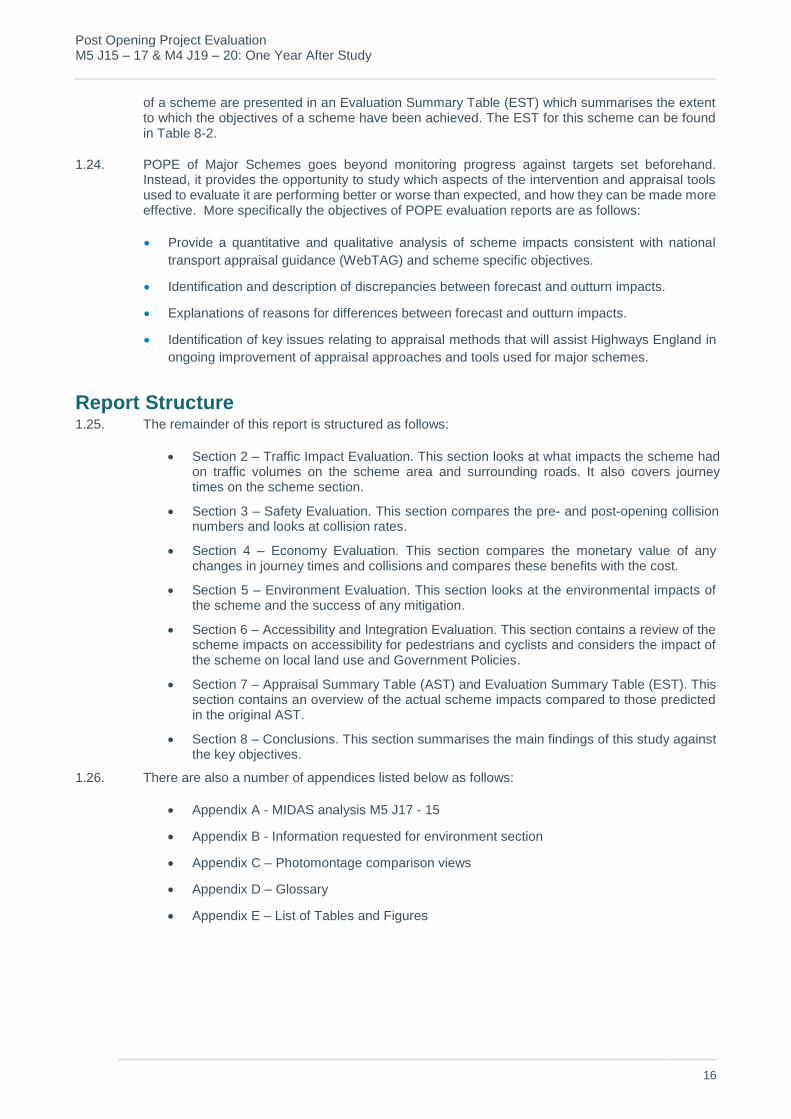
Report Structure 1.25. The remainder of this report is structured as follows:
Section 2 – Traffic Impact Evaluation. This section looks at what impacts the scheme had on traffic volumes on the scheme area and surrounding roads. It also covers journey times on the scheme section.
Section 3 – Safety Evaluation. This section compares the pre- and post-opening collision numbers and looks at collision rates.
Section 4 – Economy Evaluation. This section compares the monetary value of anychanges in journey times and collisions and compares these benefits with the cost.
Section 5 – Environment Evaluation. This section looks at the environmental impacts ofthe scheme and the success of any mitigation.
Section 6 – Accessibility and Integration Evaluation. This section contains a review of thescheme impacts on accessibility for pedestrians and cyclists and considers the impact ofthe scheme on local land use and Government Policies.
Section 7 – Appraisal Summary Table (AST) and Evaluation Summary Table (EST). Thissection contains an overview of the actual scheme impacts compared to those predictedin the original AST.
Section 8 – Conclusions. This section summarises the main findings of this study againstthe key objectives.
1.26. There are also a number of appendices listed below as follows:
Appendix A - MIDAS analysis M5 J17 - 15
Appendix B - Information requested for environment section
Appendix C – Photomontage comparison views
Appendix D – Glossary
Appendix E – List of Tables and Figures
Post Opening Project Evaluation M5 J15 – 17 & M4 J19 – 20: One Year After Study
17
2. Traffic Evaluation
Introduction 2.1. This section examines traffic data from a number of sources to provide before and one year after
opening comparison of traffic flows and journey times on the scheme and other roads in the vicinity. The purpose of this evaluation is to understand whether changes in traffic flows and journey times may be attributable to the scheme.
2.2. The section comprises of the following structure:
A summary of the traffic data sources used.
A description of national, regional and local background changes in traffic to provide acontext against which observed changes in actual traffic can be considered.
A detailed comparison of before and one year after traffic flows on key routes in the studyarea likely to be affected by the scheme.
An evaluation of key differences between the forecasts and outturn impacts of the schemein terms of traffic flows and journey times to identify whether traffic flow changes are asexpected. Any significant differences between observed and forecast impacts areconsidered to identify whether alternative approach in scheme appraisal would have led tomore accurate forecasts.
Traffic Data Sources
Journey Time Data
2.3. Satellite navigation9 data for the M4 J19 – M5 J17 and M5 J17 to M4 J19 has been used to determine if there has been a change in average journey times and speeds and whether the distribution of journey times has changed since the scheme opened. Journey times for March 2011 (before opening) have been compared to March 2015 (after opening).
Halogen Data
2.4. Halogen data is available from Highways England and can be downloaded from the message screens displayed on overhead gantries forming part of a Smart Motorway scheme. The data can be used to determine when, and for how long, the hard shoulder was open for traffic and the different speed limits in place as part of the variable speed limit (queue protection) used in Smart Motorways.
Motorway Incident Detection Automated Signalling (MIDAS) Data
2.5. MIDAS technology forms part of the operation of Smart Motorways. Data is available from Highways England and provides lane by lane traffic flows and speeds. This data along with the settings from the overhead gantries, obtained from Halogen data (e.g. whether the hard shoulder is open and the Variable Mandatory Speed Limit in operation) can provide additional insight into the operation of the Smart Motorway. As MIDAS and Halogen data form part of the technology of Smart Motorways, it is not possible to undertake pre- and post-scheme analysis using this data, but it does help inform the evaluation of the performance of the scheme.
Background Changes in Traffic 2.6. Historically in POPE scheme evaluations, the ‘before’ counts have often been factored to take
account of background traffic growth so they are directly comparable with the ‘after’ counts. However, in light of the recent economic climate, which has seen widespread reductions in motor vehicle travel in the United Kingdom (UK) as a whole since 2008, it is no longer deemed appropriate to use this method of factoring ‘before’ counts to reflect background changes in traffic.
9 Motorists who use satellite navigation devices have the option to allow anonymous data about their journeys to be
collected and used to provide a range of services, including the analysis of historic journey times along specific routes.

Post Opening Project Evaluation M5 J15 – 17 & M4 J19 – 20: One Year After Study
18
Rather, recent POPE studies have taken a more considered approach in order to assess changes in the vicinity of the scheme, within the context of national, regional and locally observed background changes in traffic.
National, Regional and Local Trends
2.7. The Department for Transport (DfT) produces observed annual statistics for all motor vehicles by local authority and road type. Data between 2010 (before start of construction) and 2014 (the latest available) is shown in million vehicle kilometres (mvkm) for Bristol, Gloucester, South West and England Figure 2-1. Changes in mvkm travelled on motorways in England and the South West are also shown.
Figure 2-1 National, Regional and Local Trends (mvkm travelled)
2.8. Figure 2-1 shows:
Overall between 2011 and 2014, mvkm travelled increased nationally, regionally andlocally on all roads, however, during the same time, although mvkm travel on motorwaysnationally increased by 3%, motorways in the southwest reduced by 1%.
Between 2011 and 2012, mvkm travelled on all roads reduced by 1% - 2% before returningto the same level in 2013 as in 2011. From 2013 to 2014, mvkm travelled increased for allroads, however, on motorways in the southwest, mvkm reduced by around 1%.
Long Term Traffic Trends
2.9. In order to establish the degree of changes that can be attributed to the scheme, changes in yearly traffic flows on the mainline sections since the scheme opened are considered against the wider context of background changes shown in Figure 2-1. POPE would normally consider the year on year change in traffic flows from before the scheme opened to after scheme opening, however due to limited data availability between mid-2011 and 2013 (through the construction period), it has only been possible to compare yearly flows in 2011 to flows in 2014/15 (April 2014 – March 2015). The changes in Annual Average Daily Traffic (AADT) flows since the scheme opened are shown in Table 2-1 for the mainline sections.

Post Opening Project Evaluation M5 J15 – 17 & M4 J19 – 20: One Year After Study
19
Table 2-1 Change in AADT
Mainline Section Direction AADT Change
since 2011 2011 2014/15
M5 J15 - 16 NB 54,400 55,100 1%
SB 54,000 56,000 4%
M5 J16 – 17 NB 53,200 53,800 1%
SB 51,700 53,400 3%
M4 J19 - 20 EB 57,700 58,600 2%
WB 57,100 58,500 2%
2.10. The results show changes in traffic levels between these periods follow the majority of trends shown in Figure 2-1. The changes in flows on the mainline sections stand in contrast to the 1% reduction in flows seen on motorways in the south west region.
Conclusions on Background Growth
2.11. The analysis of background traffic changes show national, regional and local trends on all roads between 2011 and 2014 have increased by around 2% to 3%. Flows on motorways across England have increased by 3% whereas flows on motorways in the southwest region have reduced slightly. Traffic flows in the study area have increased by between 1% and 4% during the same period hence are relatively in line with the national, regional and local background changes on all roads and motorways nationally. They are however not in line with the 1% reduction seen on motorways in the southwest region. Given these issues, no traffic flows presented in this report have been adjusted to reflect background traffic growth and it is therefore important to keep in mind any increase in flows of up to 4% is likely to be due to the background increases rather than changes brought about by the scheme itself.
Traffic Volume Analysis
Data Sources
2.12. This section of the report uses a number of the data sources mentioned earlier in this section to inform the before and after analysis of changes in traffic volumes and journey times on key routes, to understand whether changes may be attributable to the scheme. To complete this evaluation, data from before construction (March 2010) has been compared to one year after scheme opening (March 2015).
Traffic Count Data
2.13. For the purpose of this evaluation study, the main sources of traffic count data include the following:
Permanent count data obtained from the TRADS10 database for count locations onHighways England’s network.
Permanent monitoring count site data provided by South Gloucestershire Council (SGC)for pre- and post-scheme periods.
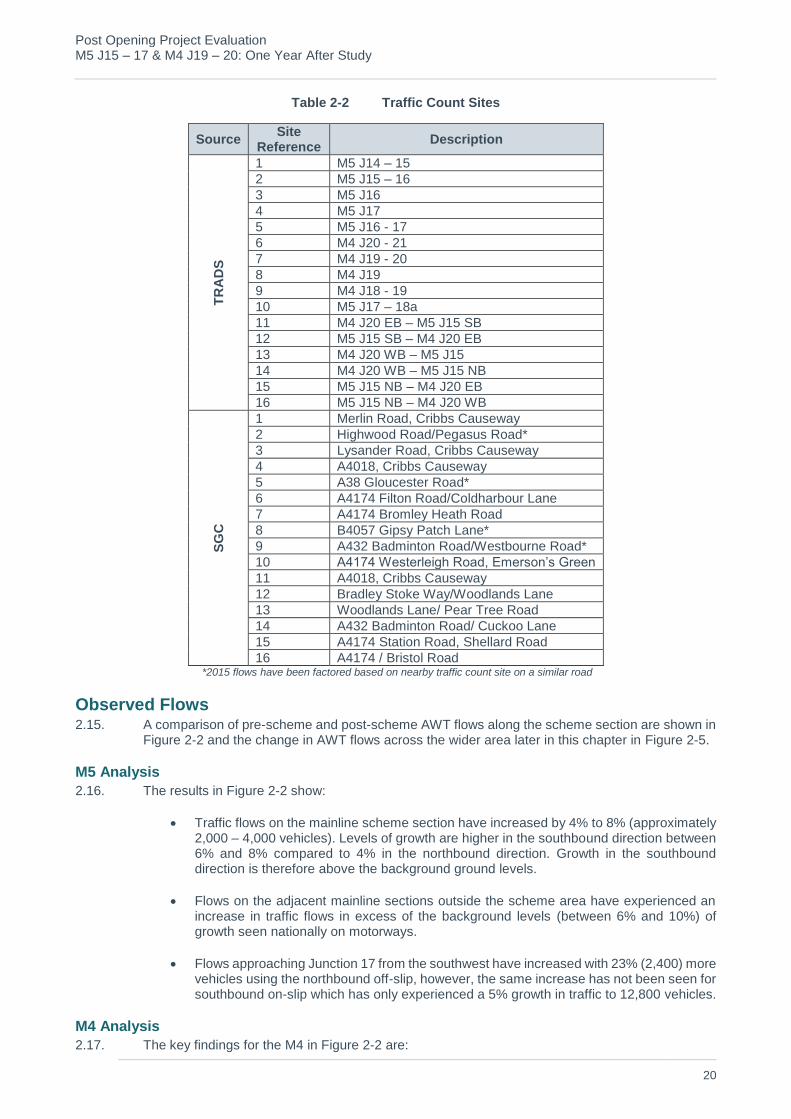
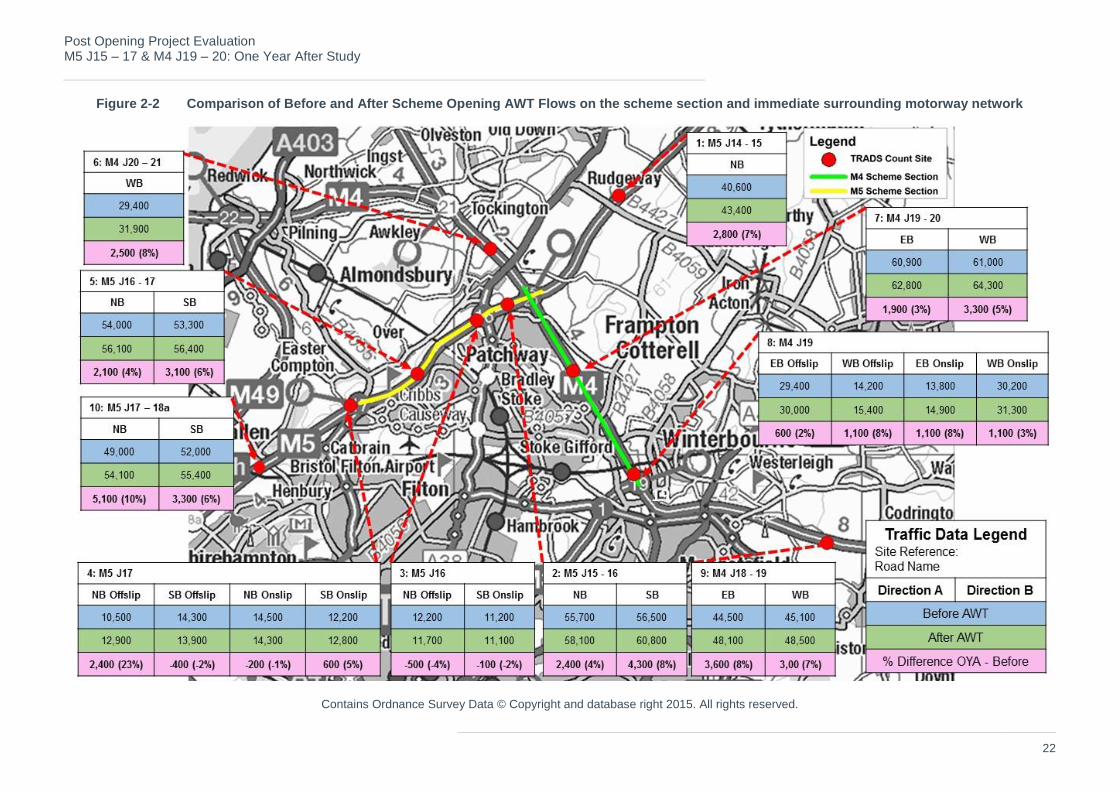
2.14. The details of the traffic count data sites used in this evaluation and their source are shown in Table 2-2. The locations of the sites and the change in observed Average Weekday Traffic (AWT) flows based on suitable data availability are shown for the scheme in Figure 2-2 and local roads in Figure 2-5.
10 TRADS is Highways England website containing traffic flow data from automatic traffic counts on Highways England’s strategic network.
Post Opening Project Evaluation M5 J15 – 17 & M4 J19 – 20: One Year After Study
20
Table 2-2 Traffic Count Sites
Source Site
Reference Description
TR
AD
S
1 M5 J14 – 15
2 M5 J15 – 16
3 M5 J16
4 M5 J17
5 M5 J16 - 17
6 M4 J20 - 21
7 M4 J19 - 20
8 M4 J19
9 M4 J18 - 19
10 M5 J17 – 18a
11 M4 J20 EB – M5 J15 SB
12 M5 J15 SB – M4 J20 EB
13 M4 J20 WB – M5 J15
14 M4 J20 WB – M5 J15 NB
15 M5 J15 NB – M4 J20 EB
16 M5 J15 NB – M4 J20 WB
SG
C
1 Merlin Road, Cribbs Causeway
2 Highwood Road/Pegasus Road*
3 Lysander Road, Cribbs Causeway
4 A4018, Cribbs Causeway
5 A38 Gloucester Road*
6 A4174 Filton Road/Coldharbour Lane
7 A4174 Bromley Heath Road
8 B4057 Gipsy Patch Lane*
9 A432 Badminton Road/Westbourne Road*
10 A4174 Westerleigh Road, Emerson’s Green
11 A4018, Cribbs Causeway
12 Bradley Stoke Way/Woodlands Lane
13 Woodlands Lane/ Pear Tree Road
14 A432 Badminton Road/ Cuckoo Lane
15 A4174 Station Road, Shellard Road
16 A4174 / Bristol Road *2015 flows have been factored based on nearby traffic count site on a similar road
Observed Flows 2.15. A comparison of pre-scheme and post-scheme AWT flows along the scheme section are shown in
Figure 2-2 and the change in AWT flows across the wider area later in this chapter in Figure 2-5.
M5 Analysis
2.16. The results in Figure 2-2 show:
Traffic flows on the mainline scheme section have increased by 4% to 8% (approximately2,000 – 4,000 vehicles). Levels of growth are higher in the southbound direction between6% and 8% compared to 4% in the northbound direction. Growth in the southbounddirection is therefore above the background ground levels.
Flows on the adjacent mainline sections outside the scheme area have experienced anincrease in traffic flows in excess of the background levels (between 6% and 10%) ofgrowth seen nationally on motorways.
Flows approaching Junction 17 from the southwest have increased with 23% (2,400) morevehicles using the northbound off-slip, however, the same increase has not been seen forsouthbound on-slip which has only experienced a 5% growth in traffic to 12,800 vehicles.
M4 Analysis
2.17. The key findings for the M4 in Figure 2-2 are:

Post Opening Project Evaluation M5 J15 – 17 & M4 J19 – 20: One Year After Study
21
Flows on the mainline scheme section have increased by 3% (1,900 vehicles) in theeastbound direction and 5% (3,200 vehicles) in the westbound direction (towards Wales).These increases are generally in line with background traffic changes on motorwaysnationally and within Bristol and Gloucester.
Flows on J19 westbound off-slip have increased by 8% and flows on the eastbound on-slip have also increased by 8%. These levels of change are in line with the 8% and 7%increase in the eastbound and westbound direction respectively on M4 J18 – 19.
The majority of flows accessing M4 Junction 19 are travelling on the M4 from the directionof London, with 30,000 vehicles using the eastbound off-slip and 31,300 using thewestbound on-slip. This route is the main route from London to Bristol.
Post Opening Project Evaluation M5 J15 – 17 & M4 J19 – 20: One Year After Study
22
Figure 2-2 Comparison of Before and After Scheme Opening AWT Flows on the scheme section and immediate surrounding motorway network
Contains Ordnance Survey Data © Copyright and database right 2015. All rights reserved.
Post Opening Project Evaluation M5 J15 – 17 & M4 J19 – 20: One Year After Study
23
Hourly Distribution of Flows on Scheme Sections
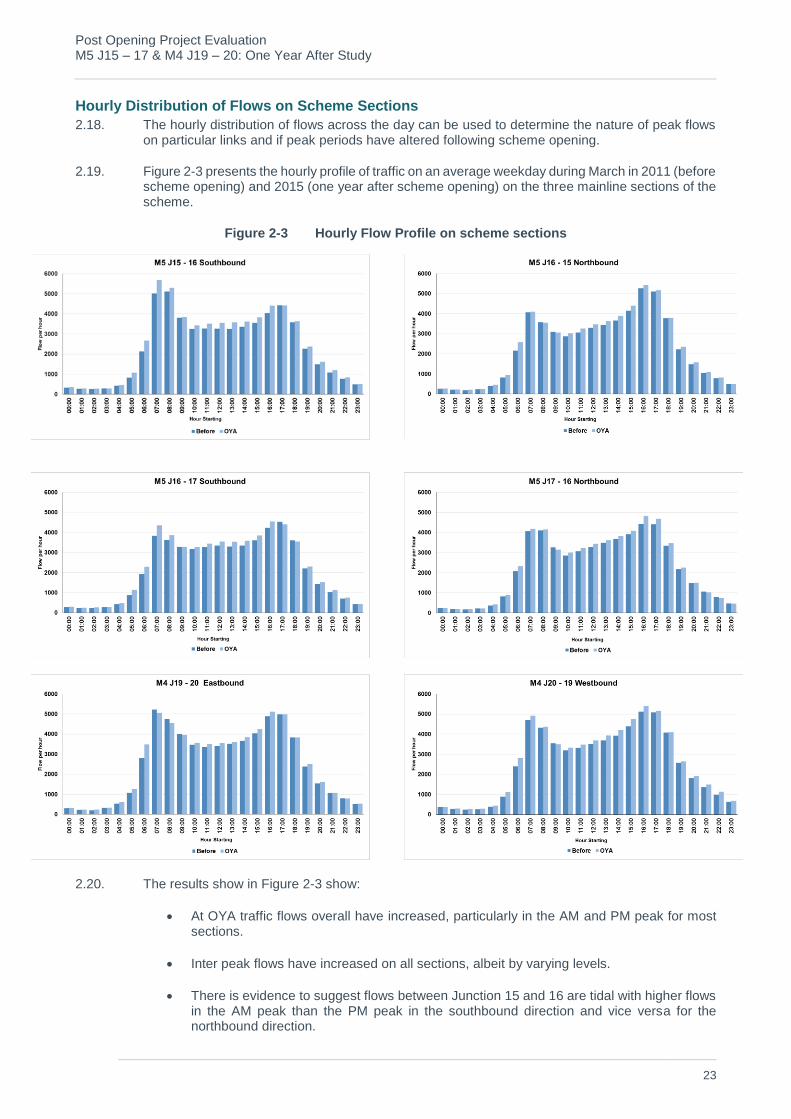
2.18. The hourly distribution of flows across the day can be used to determine the nature of peak flows on particular links and if peak periods have altered following scheme opening.
2.19. Figure 2-3 presents the hourly profile of traffic on an average weekday during March in 2011 (before scheme opening) and 2015 (one year after scheme opening) on the three mainline sections of the scheme.
Figure 2-3 Hourly Flow Profile on scheme sections
2.20. The results show in Figure 2-3 show:
At OYA traffic flows overall have increased, particularly in the AM and PM peak for most sections.
Inter peak flows have increased on all sections, albeit by varying levels.
There is evidence to suggest flows between Junction 15 and 16 are tidal with higher flows in the AM peak than the PM peak in the southbound direction and vice versa for the northbound direction.

Post Opening Project Evaluation M5 J15 – 17 & M4 J19 – 20: One Year After Study
24
There has been a significant increase in the AM peak flows between M5 Junction 15 and17 and in the PM peak on M5 Junction 17 – 16 as traffic moves back into the peak hours.
There is little evidence of any peak contraction or spreading on M4 J19 – 20, where trafficvolumes have increased in most hours through the day.
Traffic Flow changes at the Almondsbury Interchange
2.21. Figure 2-4 shows AWT flows at Almondsbury Interchange based on all available data. The sections shown are all controlled motorway sections, with the exception of the movement from the M4 J20 westbound to M5 J15 southbound (orange movement) which is Dynamic Hard Shoulder Running.
2.22. Figure 2-4 shows overall changes in traffic flows through the interchange have been minimal since the scheme opened and are generally in line with background growth, ranging from 1 to 5% since the scheme opened11.
Figure 2-4 Change in AWT flows through Almondsbury Interchange since scheme opening
Copyright and database right 2015. All rights reserved.
Traffic flow changes on local roads
2.23. Traffic flows on the local network are shown in Figure 2-5.
11 Data was available for the movement from the M4 J20 EB to M5 J15 NB and from the M5 J15 SB to M4 J20 WB,
however, interrogation of the OYA data in the context of the scheme and other flows on the interchange during the same period found this data to be unreliable hence it has not been included in this evaluation. Flows on these links will be considered in the Five Year After (FYA) evaluation.
M5 J15 SB to M4 J20 WB
M4 J20 SB to M5 J15 NB

Post Opening Project Evaluation M5 J15 – 17 & M4 J19 – 20: One Year After Study
25
Figure 2-5 Change in AWT flows on local roads since scheme opening
Copyright and database right 2015. All rights reserved.
Cribbs Causeway

Post Opening Project Evaluation M5 J15 – 17 & M4 J19 – 20: One Year After Study
26
2.24. Figure 2-5 shows changes in traffic flows are minimal at almost half of the sites, which are mainly to the east of M4 Junction 19. The most significant changes in flows have occurred around Cribbs Causeway (to the east of M5 Junction 17) and to the east of M5 Junction 16.
2.25. Traffic flows on Highwood Road / Pegasus Road (Site 2) have decreased by 49% in the northbound direction and 46% in the southbound direction since the scheme opened. The reason for the significant reduction in traffic flows at this location is primarily due to the closure of Highwood Road (from Durban Road to Coniston Road) to general traffic (except buses, taxis and motorcycles) in July 2012, which is between the before and after scheme opening periods.
2.26. The largest traffic flow changes have occurred near Cribbs Causeway, with flows increasing between 13% and 21%. Northbound flows on Merlin Road (Site 1) have increased by 17% (1,900 vehicles) and southbound flows by 21% (2,000 vehicles). Discussions with the South Gloucestershire Council Transport Policy Team identified construction of a house development site has started since the M4/M5 scheme opened. The house development site is located on the parcel of land between Highwood Road and Hayes Way. Approximately 1,200 units have been completed to date out of a total 2,000 and contractors are currently still on site and in the process of completing the final housing units. This development site is likely to explain some of the significant increases in flows on Merlin Road, the A4018 and Lysander Road.
2.27. In summary, the M4/M5 scheme has not led to any significant changes in traffic volumes on the non-motorway network, suggesting that there is a low level of rerouting onto the motorway.
Heavy Goods Vehicle Traffic
2.28. Table 2-3 provides observed Heavy Goods Vehicle (HGV) flows and the percentage of total flow this represents on the mainline sections. For the purposes of this report the classification of a HGV is a vehicle over 6.6 metres in length.
Table 2-3 Weekday HGV flows and proportions
Mainline Section
Direction
March 2011 March 2015 Change in
flow Change in proportion
HGV Flow
Proportion of total
flow
HGV Flow
Proportion of total
flow
M5 J15 - 16 NB 7,850 14% 9,730 17% 1,880 (24%) 3%
SB 9,840 14% 9,260 15% -580 (-6%) 1%
M5 J16 – 17 NB 7,490 14% 9,070 16% 1,580 (21%) 2%
SB 7,490 14% 8,840 16% 2,450 (32%) 2%
M4 J19 - 20 EB 9,260 15% 10,040 16% -780 (-8%) 1%
WB 8,160 13% 8,470 13% 310 (4%) 0%
2.29. The results show HGV flows have increased by up to 32%, which is above background reductions, however, the overall proportions have remained similar increasing from between 13% and 15% of before the scheme opening to between 13% and 17% following scheme opening.
Forecasting Accuracy 2.30. This section compares the observed traffic impacts of the scheme to the traffic changes forecast
in the scheme appraisal. Before comparing the forecast traffic impacts to the observed impacts, it is necessary to understand the appraisal approach and key assumptions underpinning the appraisal as this may assist in explaining any potential differences between the forecast and observed impacts.
Traffic Modelling Approach and Forecast Assumptions 2.31. The details of the traffic modelling and forecast assumption are taken from the M4 M5 Hard
Shoulder Running Stage 2 Traffic Forecast Report (December 2009). A VISSM micro-simulation model was developed for the M4/M5 Interchange and the G-BATS3 strategic transport model, was used to assess the wider impact of the scheme beyond the VISSIM model coverage. Due to the wider geographical coverage, G-BATS3 was used as the basis for the environmental assessment and economic appraisal, which are evaluated in Chapter 4 and 5.

Post Opening Project Evaluation M5 J15 – 17 & M4 J19 – 20: One Year After Study
27
2.32. The G-BATS3 model had a base year of 2006. It includes highway and public transport networks as well as a demand model that takes account of demand responses to changes in travel costs. Forecast years are 2016 and 2031 and include local planning forecasts for new dwellings and employment as incorporated in the Regional Spatial Strategy (RSS) for the West of England sub-region. The model covers the following three time periods:
AM Peak Hour (08:00 – 09:00)
Inter Peak Hours (10:00 – 16:00)
PM Peak Hour (17:00 – 18:00)
2.33. The model includes changes to the transport supply for the forecast years of 2016 and 2031 covering the highway and public transport networks. The assumed schemes in the 2016 scenario (considered relevant to analysis in this report) are shown in Table 2-4. Desktop research including observations during the site visit have been undertaken to confirm the status of the schemes at the time of writing this report.
Table 2-4 Progress of assumed schemes 2016
Assumed schemes in 2016 Status (August 2015) Greater Bristol Bus Network
Increased frequency of Bristol, Avonmouth rail line
Some increases in services have occurred.
A38 – Cribbs Causeway Distributor – new road as part of the Filton Northfield development
Also referred to as “Hayes Way” by South Gloucestershire Council12
Harry Stoke/ A4174 (Avon Ring Road) – new junction and roads as part of Harry Stoke development
South Bristol Link Road – Phases 1 and 2 (A38-A370) and A38-Hengrove)
Currently under construction.
Callington Road Link Not yet under construction.
Forecast vs. Observed Traffic Flows 2.34. Forecast traffic flows are provided in the Traffic Forecast Report. Forecasts are compared with
observed AWT flows on the same section for the three modelled periods described earlier. The Traffic Forecast Report provide flow forecast for a 2016 opening year for the Do Minimum (DM) and Do Something (DS) scenarios. To allow comparison of the observed traffic data from before the scheme opened (2011) to one year after scheme opening (2015), the forecast flows have been adjusted using factors from TEMRPO 6.2 for the Bristol area. The Traffic Forecast Report provided flows in Passenger Car Units (PCUs) and therefore this have been converted to vehicles using factors provided in the report.
2.35. Table 2-5 presents the modelled Do Minimum (without scheme) and Do Something (with scheme) flows on the local roads for the adjusted opening year of 2015 and compares them with the observed DM and DS flows.
12 Completion confirmed by South Gloucestershire Council in May 2015.

Post Opening Project Evaluation M5 J15 – 17 & M4 J19 – 20: One Year After Study
28
Table 2-5 Forecast and Observed Flows (AWT) on local roads
Tim
e
Pe
rio
d
Location
Dir
ec
tio
n Forecast13 Observed
Forecast DM -
Observed DM Dif
% Dif
Forecast DS - Observed DS Dif
% Dif DM 2011
DS 2015
% Dif DM
2011 DS
2015 % Dif
AM
Pe
ak
08
:00
– 0
9:0
0 Merlin Road
E 1,650 1,860 13% 880 1,160 32% -770 -47% -690 -37%
W 970 940 -3% 380 470 24% -590 -61% -470 -50%
A4018 Cribbs Causeway
NE 1,300 1,350 4% 1,090 1,650 51% -210 -16% 300 22%
SW 1,210 1,260 4% 990 1,370 38% -220 -18% 110 9%
A38 North of Junction 16
NB 1,000 1,200 20% 910 1,010 11% -90 -9% -180 -15%
SB 1,150 1,290 12% 1,160 1,080 -7% 10 1% -200 -16%
Inte
r P
ea
k
10
:00
– 1
6:0
0 Merlin Road
E 1,260 1,310 4% 820 890 9% -440 -35% -420 -32%
W 1,120 1,180 5% 640 770 20% -480 -43% -410 -35%
A4018 Cribbs Causeway
NE 870 940 8% 1,150 1,290 12% 280 32% 360 39%
SW 670 680 2% 1,020 1,250 23% 350 53% 570 84%
A38 North of Junction 16
NB 930 970 3% 900 870 -3% -30 -3% -90 -9%
SB 930 1,050 13% 850 830 -2% -80 -9% -220 -21%
PM
Pe
ak
17
:00
– 1
8:0
0 Merlin Road
E 990 1,050 6% 810 980 21% -180 -18% -70 -7%
W 1,210 1,220 0% 1,100 1,310 19% -110 -9% 90 7%
A4018 Cribbs Causeway
NE 1,650 1,800 9% 1,550 1,560 1% -100 -6% -240 -13%
SW 840 890 7% 1,390 1,660 19% 550 65% 760 85%
A38 North of Junction 16
NB 850 870 3% 1,280 1,260 -2% 430 50% 390 45%
SB 1,070 1,300 22% 860 960 12% -210 -20% -340 -26%
2.36. The results in Table 2-5 shows:
On the majority of roads during the three time periods the DM forecast flows areconsiderably higher than the DM observed flows ranging from 9% to 61%. There are a fewexceptions which include the A38 North of Junction 16 southbound in the AM peak andnorthbound in the PM peak and the A4018 near Cribbs Causeway in the southwestdirection in the PM peak where DM observed flows were higher than forecast.
There appears to be more traffic travelling on the A4018 Cribbs Causeway (to the east ofM5 Junction 17) as DS observed flows are significantly higher than expected by up to 85%.
In most cases where the DM observed flows were lower or higher than forecast, a similartrend is observed for the difference between forecast and observed DS flows.
2.37. The traffic forecasting approach included local planning forecasts for new dwellings and employment based on information contained in the Regional Spatial Strategy for the West of England sub-region. As mentioned earlier, construction of a new housing development started following the M4/M5 scheme opening. The Traffic Forecasting Report does not reference this development site in any future demand assumptions and it is unknown whether the RSS included this housing development.
2.38. Forecast and observed flows for the DM and DS on the scheme motorway section and nearby motorway sections are shown in Table 2-6. The following key points are noted:
The majority of DM observed flows on the mainline M4 and M5 sections and junctions arealso considerably lower than forecast. The exceptions are M5 Junction 17 in the PM peakand M5 Junction 16 northbound offslip in the PM peak and southbound offslip in the AMpeak. Overall a similar pattern is shown for the comparison between DS observed and
13 Forecast DM flows 2016 have been adjusted down to 2011 using TEMPRO 6.2 factors for City of Bristol on Urban Principal roads and forecast DS flows 2016 have been adjusted down to 2015 using the same approach as the DM.
Post Opening Project Evaluation M5 J15 – 17 & M4 J19 – 20: One Year After Study
29
forecast flows in that where DM observed flows are lower than forecast, DS observed flows are also lower than forecast.
Forecast levels of growth between the DM and DS scenarios have not occurred on themajority of scheme sections and junctions, particularly at M5 Junction 16 in all time periods.Forecast levels of growth between the DM and DS scenarios ranged from 19% to 109%and the highest level of growth seen is 8%. Observed levels of growth between the DMand DS scenarios are significantly higher than forecast on M5 Junction 17 northboundoffslip (Cribbs Causeway) in all time periods and M5 Junction 15 – 16 northbound in theAM peak and southbound in the PM peak.
2.39. It is clear from Table 2-5 and Table 2-6 that:
Expected growth from 2006 (when the modelling appraisal was undertaken) to 2011 hasnot occurred, almost certainly due to the economic downturn. This has resulted in trafficvolumes being 25% or so lower than expected; and
There has been little re-assignment of traffic onto the M4/M5 compared to the forecast re-assignment expected.
2.40. The cumulative effect of the above two issues is likely to have resulted in lower congestion in the opening year than forecast at the time.

Post Opening Project Evaluation M5 J15 – 17 & M4 J19 – 20: One Year After Study
30
Table 2-6 Forecast and Observed Flows (AWT) on scheme sections
DM DS % % % Dif
2011 2015 Dif Dif
M4 J19 - 20 EB 6300 6700 6% 4750 4550 -4% -1550 -25% -2150 -32%
M4 J19 - 20 WB 6000 6980 16% 4320 4360 1% -1680 -28% -2620 -38%
M5 J15 - 16 NB 4840 5460 13% 3580 5290 48% -1260 -26% -170 -3%
M5 J15 - 16 SB 6040 5190 -14% 5110 3550 -31% -930 -15% -1640 -32%
M5 J16 - 17 NB 5630 6100 8% 4110 4160 1% -1520 -27% -1930 -32%
M5 J16 - 17 SB 5650 6340 12% 3620 3860 7% -2030 -36% -2480 -39%
M5 J17 NB OFFSLIP NB 1070 1020 -5% 1090 1270 17% 20 2% 250 25%
M5 J17 NB ONSLIP NB 1040 1110 6% 940 890 -5% -100 -10% -220 -20%
M5 J17 SB OFFSLIP SB 1340 1580 18% 930 1020 10% -410 -31% -560 -35%
M5 J17 SB ONSLIP SB 850 750 -12% 700 750 7% -150 -18% 0 0%
M5 J16 NB OFFSLIP NB 1840 1910 4% 1290 1320 2% -550 -30% -590 -31%
M5 J16 NB ONSLIP NB 1050 1250 19% 820 710 -13% -230 -22% -540 -43%
M5 J16 SB OFFSLIP SB 1650 2330 44% 2190 2190 0% 570 35% -140 -6%
M5 J16 SB ONSLIP SB 1220 1770 45% 690 740 7% -530 -44% -1030 -58%
M4 J19 - 20 EB 4700 5030 7% 4750 3720 -22% 60 1% -1310 -26%
M4 J19 - 20 WB 4800 4970 3% 4320 3900 -10% -520 -11% -1070 -22%
M5 J15 - 16 NB 4450 4770 7% 3580 3580 0% -870 -20% -1190 -25%
M5 J15 - 16 SB 4360 2960 -32% 3320 3570 8% -1030 -24% 610 21%
M5 J16 - 17 NB 44701 4600 3% 3380 3530 4% -1090 -24% -1070 -23%
M5 J16 - 17 SB 4500 4540 1% 3360 3540 5% -1130 -25% -1000 -22%
M5 J17 NB OFFSLIP NB 610 660 8% 640 780 22% 30 5% 120 18%
M5 J17 NB ONSLIP NB 920 945 3% 920 890 -3% 0 0% -60 -6%
M5 J17 SB OFFSLIP SB 1000 970 -3% 980 930 -5% -10 -1% -40 -4%
M5 J17 SB ONSLIP SB 720 740 4% 760 800 5% 40 6% 60 8%
M5 J16 NB OFFSLIP NB 790 780 0% 680 660 -3% -100 -13% -120 -15%
M5 J16 NB ONSLIP NB 760 950 25% 770 750 -3% 10 1% -200 -21%
M5 J16 SB OFFSLIP SB 840 1760 109% 640 680 6% -200 -24% -1080 -61%
M5 J16 SB ONSLIP SB 970 1860 91% 660 620 -6% -310 -32% -1240 -67%
M4 J19 - 20 EB 5900 6500 10% 4980 4980 0% -930 -16% -1520 -23%
M4 J19 - 20 WB 5800 6210 7% 5080 5160 2% -730 -13% -1050 -17%
M5 J15 - 16 NB 4570 5850 28% 5100 4420 -13% 530 12% -1430 -24%
M5 J15 - 16 SB 4800 3920 -19% 4430 5160 16% -380 -8% 1240 32%
M5 J16 - 17 NB 4840 5600 16% 4410 4680 6% -420 -9% -920 -16%
M5 J16 - 17 SB 4930 5070 3% 4540 4400 -3% -390 -8% -670 -13%
M5 J17 NB OFFSLIP NB 670 680 1% 790 940 19% 120 18% 270 40%
M5 J17 NB ONSLIP NB 1280 1370 7% 1390 1410 1% 110 9% 40 3%
M5 J17 SB OFFSLIP SB 770 780 2% 1250 1190 -5% 480 63% 410 52%
M5 J17 SB ONSLIP SB 1150 1200 4% 1380 1270 -8% 230 20% 70 6%
M5 J16 NB OFFSLIP NB 1330 1350 1% 1010 1020 1% -320 -24% -330 -24%
M5 J16 NB ONSLIP NB 1070 1590 49% 1770 1500 -15% 700 66% -90 -6%
M5 J16 SB OFFSLIP SB 980 1510 54% 1030 1110 8% 50 5% -400 -27%
M5 J16 SB ONSLIP SB 1100 1460 33% 1140 1100 -4% 40 4% -360 -25%
AM Peak
(08:00 - 09:00)
Inter Peak
(10:00 - 16:00)
PM Peak
(17:00 - 18:00)
Time Period Location Direction
Forecast ObservedForecast DM -
Observed DM Dif
Forecast DS -
Observed DS Dif% DifDM
2011
DS
2015

Post Opening Project Evaluation M5 J15 – 17 & M4 J19 – 20: One Year After Study
31
Journey Time Evaluation 2.41. This section considers the impact on journey times following the implementation of the scheme.
Pre-scheme journey times are considered along the routes shown in Figure 2-6.
2.42. These routes were selected as they are the routes most affected by the scheme. Journey time analysis is considered in the following stages:
Analysis of pre and post-scheme average journey times and speeds along the scheme.
A comparison of journey time reliability before and after the scheme opened.
2.43. The journey time periods evaluated are in line with the G-BATS3 model as follows and covered the calendar periods March 2011 (pre-scheme) and March 2015 (post-scheme). Note: data obtained for March 2015 includes periods when the DHSR and VMSL are in operation and when they are not hence the results represent average journey times over the period to be directly comparable with average journey times before opening (March 2010).
Weekdays AM Peak (08:00 – 09:00);
Weekdays Inter Peak (10:00 – 16:00); and
Weekdays PM Peak (17:00 – 18:00).
2.44. Other time periods have also been considered:
Weekday AM Shoulder Peak (07:00 – 08:00); and
Weekday PM Shoulder Peak (16:00 – 17:00).
Figure 2-6 Journey Time Routes
M5 Junction 17
M5 Junction 16
M4 Junction 19
M5 Junction 15/ M4 Junction 20

Post Opening Project Evaluation M5 J15 – 17 & M4 J19 – 20: One Year After Study
32
Observed Journey Times Pre-construction and post-opening average journey time information has been obtained
from satellite navigation data. This section analyses the change in journey times and speeds along the routes shown in Figure 2-6.
2.45. Table 2-7 shows the pre-scheme and post-scheme average journey times along the scheme section and the observed journey time savings. The differences in journey times are colour coded based on an increase in journey times of more than five seconds (red), reduction in journey times of more than five seconds (green) and a five second or less change in journey times (orange).
Table 2-7 Change in journey times following scheme opening
Scheme Type Pre-scheme (mm:ss)
Post-scheme (mm:ss)
Difference (seconds)
AM IP PM AM IP PM AM IP PM
M5 to M4
M5 J17 - 16 DHSR 02:08 02:05 02:44 02:32 02:18 02:40 24 13 -4
M5 J16 - 15 ALR 00:44 00:37 00:54 00:42 00:37 00:45 -2 0 -9
Through Interchange
CM 01:13 00:34 00:37 00:48 00:34 00:36 -25 0 -1
M4 J20 - 19 DHSR 04:06 02:28 02:43 04:07 02:42 03:45 1 14 62
Total - 08:11 05:44 06:58 08:09 06:11 07:46 -2 27 48
M4 to M5
M4 J20 - 19 DHSR/ALR 03:13 02:38 03:13 03:20 02:53 03:07 7 15 -6
Through Interchange
DHSR 00:45 00:27 00:28 00:46 00:29 00:29 1 2 1
M5 J15 - 16 DHSR/ALR 00:54 00:40 00:43 00:54 00:42 00:43 0 2 0
M5 J16 - 17 DHSR 02:01 02:02 02:04 02:22 02:15 02:26 21 13 22
Total - 06:53 05:47 06:28 07:22 06:19 06:45 29 32 17
2.46. Overall the results indicate increases in average journey times have occurred on the scheme sections which are DHSR (M5 J17 – 16 and M4 J20 – 19). No change and reductions in journey times have occurred on the All Lane Running Sections (ALR) (M5 J16 – 15) and Controlled Motorway (CM) (through the interchange). This is despite similar levels of traffic volumes before and after opening.
2.47. The following more detailed observations can be observed from Table 2-7:
Across the route from the M5 to the M4, average journey times have increased during theinter peak and PM peak periods by 27 and 48 seconds respectively. The increase in theinterpeak period is made up of increased average journey times on the DHSR sections.The PM peak increase is attributable to a worsening in average journey times on the M4J20 – 19 by 62 seconds, however, this is offset by improvements on other sections.
Average journey times have increased for the route from the M4 to M5 in all three timeperiods by a maximum of 32 seconds. Increases in the AM and PM peak are largely madeup of increased journey times on M5 J16 – 17, whereas there has been an increase inaverage journey times on the M4 J19 – 20 and M5 J16 – 17 during the inter peak period.
2.48. Table 2-8 shows average speeds (kph) before and after the scheme opened for the same calendar and time periods used to assess journey times.
Post Opening Project Evaluation M5 J15 – 17 & M4 J19 – 20: One Year After Study
33
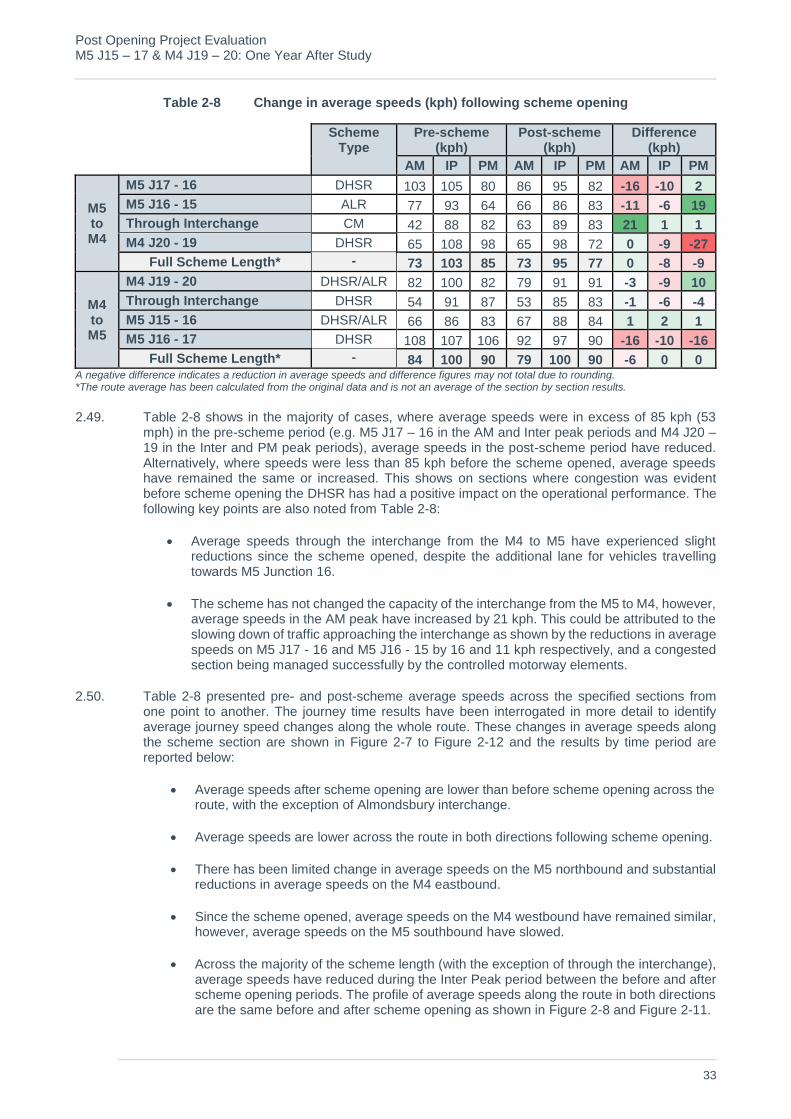
Table 2-8 Change in average speeds (kph) following scheme opening
Scheme Type
Pre-scheme (kph)
Post-scheme (kph)
Difference (kph)
AM IP PM AM IP PM AM IP PM
M5 to M4
M5 J17 - 16 DHSR 103 105 80 86 95 82 -16 -10 2
M5 J16 - 15 ALR 77 93 64 66 86 83 -11 -6 19
Through Interchange CM 42 88 82 63 89 83 21 1 1
M4 J20 - 19 DHSR 65 108 98 65 98 72 0 -9 -27
Full Scheme Length* - 73 103 85 73 95 77 0 -8 -9
M4 to M5
M4 J19 - 20 DHSR/ALR 82 100 82 79 91 91 -3 -9 10
Through Interchange DHSR 54 91 87 53 85 83 -1 -6 -4
M5 J15 - 16 DHSR/ALR 66 86 83 67 88 84 1 2 1
M5 J16 - 17 DHSR 108 107 106 92 97 90 -16 -10 -16
Full Scheme Length* - 84 100 90 79 100 90 -6 0 0 A negative difference indicates a reduction in average speeds and difference figures may not total due to rounding. *The route average has been calculated from the original data and is not an average of the section by section results.
2.49. Table 2-8 shows in the majority of cases, where average speeds were in excess of 85 kph (53 mph) in the pre-scheme period (e.g. M5 J17 – 16 in the AM and Inter peak periods and M4 J20 – 19 in the Inter and PM peak periods), average speeds in the post-scheme period have reduced. Alternatively, where speeds were less than 85 kph before the scheme opened, average speeds have remained the same or increased. This shows on sections where congestion was evident before scheme opening the DHSR has had a positive impact on the operational performance. The following key points are also noted from Table 2-8:
Average speeds through the interchange from the M4 to M5 have experienced slightreductions since the scheme opened, despite the additional lane for vehicles travellingtowards M5 Junction 16.
The scheme has not changed the capacity of the interchange from the M5 to M4, however,average speeds in the AM peak have increased by 21 kph. This could be attributed to theslowing down of traffic approaching the interchange as shown by the reductions in averagespeeds on M5 J17 - 16 and M5 J16 - 15 by 16 and 11 kph respectively, and a congestedsection being managed successfully by the controlled motorway elements.
2.50. Table 2-8 presented pre- and post-scheme average speeds across the specified sections from one point to another. The journey time results have been interrogated in more detail to identify average journey speed changes along the whole route. These changes in average speeds along the scheme section are shown in Figure 2-7 to Figure 2-12 and the results by time period are reported below:
Average speeds after scheme opening are lower than before scheme opening across the route, with the exception of Almondsbury interchange.
Average speeds are lower across the route in both directions following scheme opening.
There has been limited change in average speeds on the M5 northbound and substantialreductions in average speeds on the M4 eastbound.
Since the scheme opened, average speeds on the M4 westbound have remained similar,however, average speeds on the M5 southbound have slowed.
Across the majority of the scheme length (with the exception of through the interchange),average speeds have reduced during the Inter Peak period between the before and afterscheme opening periods. The profile of average speeds along the route in both directionsare the same before and after scheme opening as shown in Figure 2-8 and Figure 2-11.

Post Opening Project Evaluation M5 J15 – 17 & M4 J19 – 20: One Year After Study
34
2.51. Overall, there is a consistent pattern with lower average speeds after opening than before, despite the additional capacity offered by DHSR. Clearly this requires further investigation to identify whether the operation of the DHSR is working efficiently, or whether the management of traffic speeds may not have increased traffic speeds, but made them more reliability. The following section summarises the finding on these two issues.

Post Opening Project Evaluation M5 J15 – 17 & M4 J19 – 20: One Year After Study
35
Figure 2-7 Average Speed (kph) from M5 to M4 AM Peak (08:00 - 09:00) Figure 2-8 Average Speed (kph) from M5 to M4 Inter Peak (10:00 - 16:00) Figure 2-9 Average Speed (kph) from M5 to M4 PM Peak (17:00 - 18:00)
Figure 2-10 Average Speed (kph) from M4 to M5 AM Peak (08:00 - 09:00) Figure 2-11 Average Speed (kph) from M4 to M5 Inter Peak (10:00 - 16:00) Figure 2-12 Average Speed (kph) from M4 to M5 PM Peak (17:00 - 18:00)
Post Opening Project Evaluation M5 J15 – 17 & M4 J19 – 20: One Year After Study
36
Halogen Data Analysis 2.52. Halogen Data has been downloaded for March 2015 to maintain consistency with the traffic and
journey time data used in this report. The halogen data has been used:
To determine how much on average the hard shoulder was open for traffic during thedifferent peak periods on the Dynamic Hard Shoulder scheme sections.
To determine how much on average different speed limits were in place during the peakperiods on all sections of the scheme, noting that if DHSR is in operation, it is mandatoryfor speeds to reduce to at least 60 mph.
2.53. Halogen data points have been taken from roughly the centre of each junction. The speed limits set by VMSL can vary along a scheme section of carriageway and therefore the speed analysis is relevant to the chosen gantry location, however the following analysis is appropriate for the full length of each section.
2.54. The peak periods used in this analysis are the same as those used in the journey time analysis section:
Weekdays AM Peak (08:00 – 09:00);
Weekdays Inter Peak (10:00 – 16:00); and
Weekdays PM Peak (17:00 – 18:00).
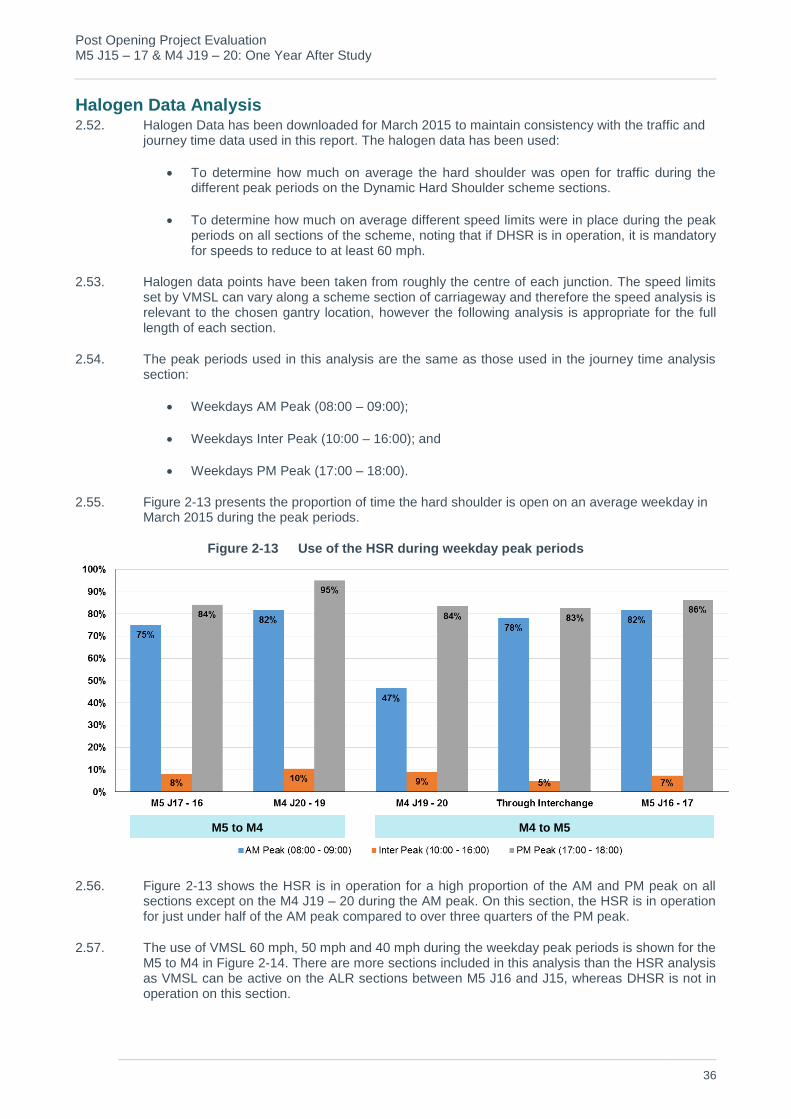
2.55. Figure 2-13 presents the proportion of time the hard shoulder is open on an average weekday in March 2015 during the peak periods.
Figure 2-13 Use of the HSR during weekday peak periods
2.56. Figure 2-13 shows the HSR is in operation for a high proportion of the AM and PM peak on all sections except on the M4 J19 – 20 during the AM peak. On this section, the HSR is in operation for just under half of the AM peak compared to over three quarters of the PM peak.
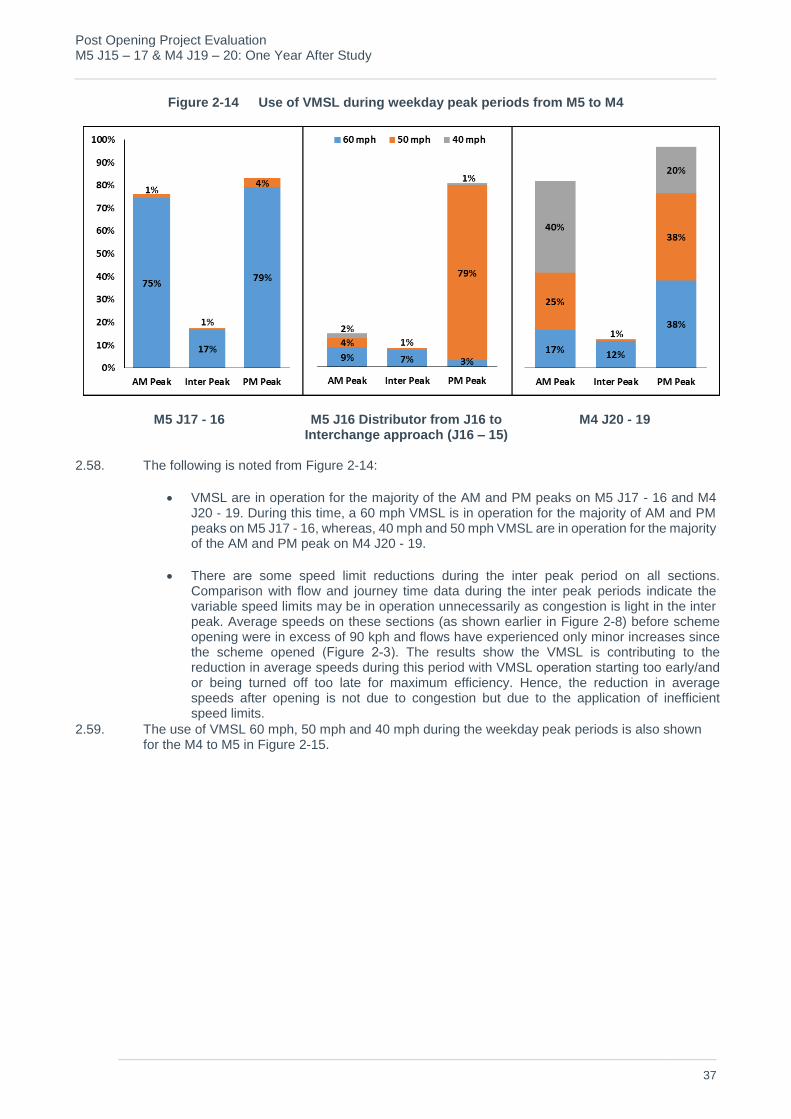
2.57. The use of VMSL 60 mph, 50 mph and 40 mph during the weekday peak periods is shown for the M5 to M4 in Figure 2-14. There are more sections included in this analysis than the HSR analysis as VMSL can be active on the ALR sections between M5 J16 and J15, whereas DHSR is not in operation on this section.
M5 to M4 M4 to M5
Post Opening Project Evaluation M5 J15 – 17 & M4 J19 – 20: One Year After Study
37
Figure 2-14 Use of VMSL during weekday peak periods from M5 to M4
M5 J17 - 16 M5 J16 Distributor from J16 to Interchange approach (J16 – 15)
M4 J20 - 19
2.58. The following is noted from Figure 2-14:
VMSL are in operation for the majority of the AM and PM peaks on M5 J17 - 16 and M4J20 - 19. During this time, a 60 mph VMSL is in operation for the majority of AM and PMpeaks on M5 J17 - 16, whereas, 40 mph and 50 mph VMSL are in operation for the majorityof the AM and PM peak on M4 J20 - 19.
There are some speed limit reductions during the inter peak period on all sections. Comparison with flow and journey time data during the inter peak periods indicate the variable speed limits may be in operation unnecessarily as congestion is light in the inter peak. Average speeds on these sections (as shown earlier in Figure 2-8) before scheme opening were in excess of 90 kph and flows have experienced only minor increases since the scheme opened (Figure 2-3). The results show the VMSL is contributing to the reduction in average speeds during this period with VMSL operation starting too early/and or being turned off too late for maximum efficiency. Hence, the reduction in average speeds after opening is not due to congestion but due to the application of inefficient speed limits.
2.59. The use of VMSL 60 mph, 50 mph and 40 mph during the weekday peak periods is also shown for the M4 to M5 in Figure 2-15.

Post Opening Project Evaluation M5 J15 – 17 & M4 J19 – 20: One Year After Study
38
Figure 2-15 Use of VMSL during weekday peak periods from M4 to M5
2.60. The results in Figure 2-15 show:
VMSL are in operation for the majority of the AM and PM peak on all sections from the M4to M5, mirroring the proportion of time the DHSR is in operation, with 60 mph VMSL inoperation for the majority of AM and PM peak on all sections except the link from theinterchange to M5 J16 and the M5.
On the link from Almondsbury interchange to M5 J16 offslip, VMSL are in operation formost of the AM and PM peak. Of the AM peak a 50 mph VMSL is in operation for 20% ofthe time and a 40 mph VMSL for 40%.
Figure 2-15 confirms that the VMSL may be starting too early/and or turned off too late formaximum efficiency on M5 J16 – 17. Average speeds before the scheme opened on thissection were in excess of 60 mph during the AM and PM peak hence the VMSL operationhas reduced average speeds.
MIDAS Date Analysis 2.61. In addition to traffic flow, journey time and halogen analysis presented in this chapter, additional
analysis has been undertaken to understand the journey time and speed changes following scheme opening on sections in time periods where speeds were not above 85kph before opening. Analysis of MIDAS data focuses on the AM peak and PM peaks on the following scheme sections M4 J20 – 19 and M5 J17 – 15.
M4 J20 – 19
2.62. M4 J20 - 19 is the scheme section which has experienced the largest average speed reduction of 27 kph during the PM peak, from 98 kph (61 mph) before scheme opening to 72 kph (48 mph) after scheme opening. During the AM peak, average speeds before opening were 65 kph (40 mph) and there has been no change in journey times or average speeds during the AM peak. Table 2-9 provides a summary of the:
Journey time results;
HSR and VMSL operation; and
Flow distribution across lanes at same the location as the halogen analysis.
M4 J19 - 20 Through Interchange Link from interchange to J16 and M5
M5 J16 - 17

Post Opening Project Evaluation M5 J15 – 17 & M4 J19 – 20: One Year After Study
39
Table 2-9 Summary of findings for M4 J20 - 19
Profile AM Peak PM Peak
Average Speed
Before (kph) 65 98
After (kph) 65 72
Difference (kph) 0 -27
DHR Operation 82% 95%
VMSL
60 mph 17% 38%
50 mph 25% 38%
40 mph 40% 20%
Distribution of flow across lanes
Lane 1 (HS) 18% 19%
Lane 2 25% 26%
Lane 3 29% 29%
Lane 4 28% 26%
2.63. Table 2-9 shows VMSL are in operation for on average 95% of the PM peak, with 58% of the peak set at 50mph or lower. In comparison, VMSL are in operation for 82% of the AM peak and 42% of the peak is set at 50 mph or 60 mph. VMSL usage in contrast to the before speeds could be one reason for the significant reduction in average speeds during the PM peak. There is reasonable use, to a similar level, of the hard shoulder in the AM and PM peak, although there is clearly some inefficient lane usage.
2.64. MIDAS data provides flows (Figure 2-16 and Figure 2-17) and speeds (Figure 2-18 and Figure 2-19) by lane. It should be noted that Lanes 1 and 2 are mainline lanes, whereas once the DHSRsection starts, Lane 1 is the hard shoulder until it becomes an off-slip for Junction 19. Analysis of the data on the M4 J20 – 19 section during the AM and PM peak shows:
Use of the hard shoulder increases on the approach to the M4 J19 diverge, linked to thehard shoulder being used for Junction 19 only.
Speeds across the route are relatively consistent, however, on the approach to J19 offslipaverage speeds in Lanes 1 and 2 reduce to 40 – 60 kph (25 – 40 mph) in the AM and PMpeaks. They reduce at a faster rate and to a lower speed in the PM peak.
Flows in Lanes 1 and 2 increase on the approach to the M4 J19 diverge, which alongsidethe reduction in speeds suggests there is demand for M4 J19 exit and queuing could bean issue. The results in Figure 2-14 show the 40 mph VMSL is in operation for 40% of theAM peak and 20% of the PM peak, indicating queueing for J19 could be an issue andtriggering Queue Protection speed reduction. This algorithm triggers queue protectionwhich is the setting of the VMSL to 40 mph on the main carriageway.
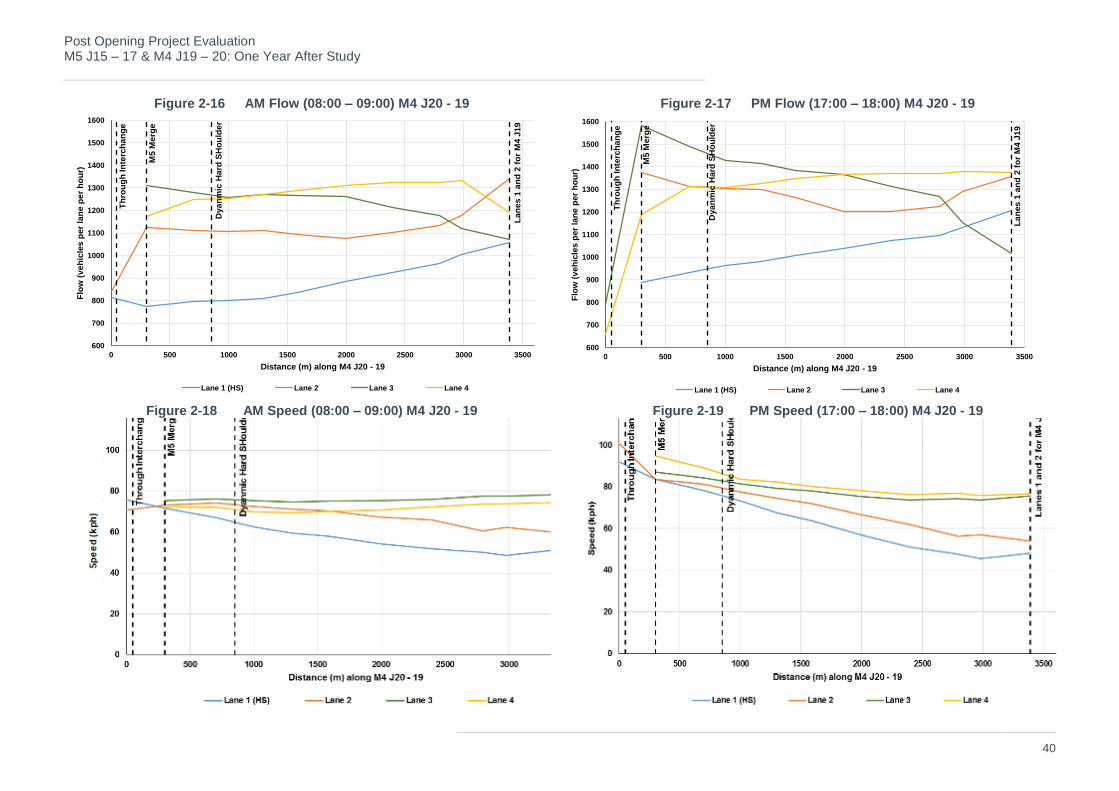
Post Opening Project Evaluation M5 J15 – 17 & M4 J19 – 20: One Year After Study
40
Figure 2-16 AM Flow (08:00 – 09:00) M4 J20 - 19 Figure 2-17 PM Flow (17:00 – 18:00) M4 J20 - 19
Figure 2-18 AM Speed (08:00 – 09:00) M4 J20 - 19 Figure 2-19 PM Speed (17:00 – 18:00) M4 J20 - 19
600
700
800
900
1000
1100
1200
1300
1400
1500
1600
0 500 1000 1500 2000 2500 3000 3500
Flo
w (
ve
hic
les
pe
r la
ne
pe
r h
ou
r)
Distance (m) along M4 J20 - 19
Lane 1 (HS) Lane 2 Lane 3 Lane 4
Th
rou
gh
In
terc
ha
ng
e
M5
Me
rge
La
ne
s 1
an
d 2
fo
r M
4 J
19
Dya
nm
icH
ard
SH
ou
lde
r
600
700
800
900
1000
1100
1200
1300
1400
1500
1600
0 500 1000 1500 2000 2500 3000 3500
Flo
w (
veh
icle
s p
er
lan
e p
er
ho
ur)
Distance (m) along M4 J20 - 19
Lane 1 (HS) Lane 2 Lane 3 Lane 4
Th
rou
gh
In
terc
han
ge
M5
Merg
e
Lan
es 1
an
d 2
fo
r M
4 J
19
Dyan
mic
Hard
SH
ou
lder

Post Opening Project Evaluation M5 J15 – 17 & M4 J19 – 20: One Year After Study
41
M5 J17 - 16
2.65. M5 J17 – 16 has increased from three lanes to four lanes (inclusive of the DHSR) and M5 J16 to the interchange has an additional lane following scheme opening. Analysis in earlier sections shows:
Hourly flows in the AM peak remain similar following scheme opening and flows in the PMpeak have increased by 6% (300 vehicles).
Journey times have increased and average speeds reduced by 16kph during the AM peakon this section and there has been negligible change in speeds during the PM peak (Table2-8).
Before speeds in the AM peak were 103 kph and in the PM peak, 80 kph (Table 2-8).
For most of the AM and PM peaks the hard shoulder is in operation and VMSL are set atmainly 60 mph.
2.66. Midas data has been analysed (as shown in Appendix A) to identify the smart motorway operational aspects of this section during the AM and PM peak. The results show the hard shoulder is being used in excess of the 25% additional capacity on the approach to M5 Junction 16 during the AM peak period and use in the PM peak is between 18% and 21%. It is noted in Appendix A that use of the hard shoulder increases on the approach to Junction 16 reflecting the use of the hard shoulder for vehicles leaving the motorway at Junction 16. This is supported through analysis of the Halogen data as “Hard Shoulder for Junction 16 only” is displayed on overhead message signs for 75% of the AM peak and 84% during the PM peak.
2.67. The results in Appendix A show overall the smart motorway operation on this section is similar in the AM and PM peaks with the only exception slightly less use of the hard shoulder in the PM peak. The operational aspects of the smart motorway scheme on this section show no significant dissimilarities between the AM and PM peak hence the impacts of the scheme on average speeds is unlikely to be explained by operational aspects are more likely linked to varying congestion levels before the scheme opened.
Forecast vs. Observed Journey Times 2.68. The Traffic Forecasting Report Stage 2 (December 2009) and Economic Assessment Report Stage
2 (December 2009) do not contain specific details on the forecast impact of the scheme on speeds and journey times following scheme opening. The Traffic Forecasting Report does however contain the forecast results for junction performance in terms of number of processed vehicles in the network, maximum queue lengths and average delay for the DM and DS scenarios based on the VISSIM model. In addition, comparison between the DM and DS average weighted travel time comparison are shown graphically, but the origin and destinations of the routes considered are unclear.
2.69. Based on the information made available in these reports, it has not been possible to make a like for like comparison against observed changes in journey times and speeds following scheme opening with forecast changes.
2.70. The Traffic Forecasting Report does include forecasts for the impact of the scheme on network average travel time and delay during peak periods in the opening year (2016) and design year (2031) as shown in Table 2-10.
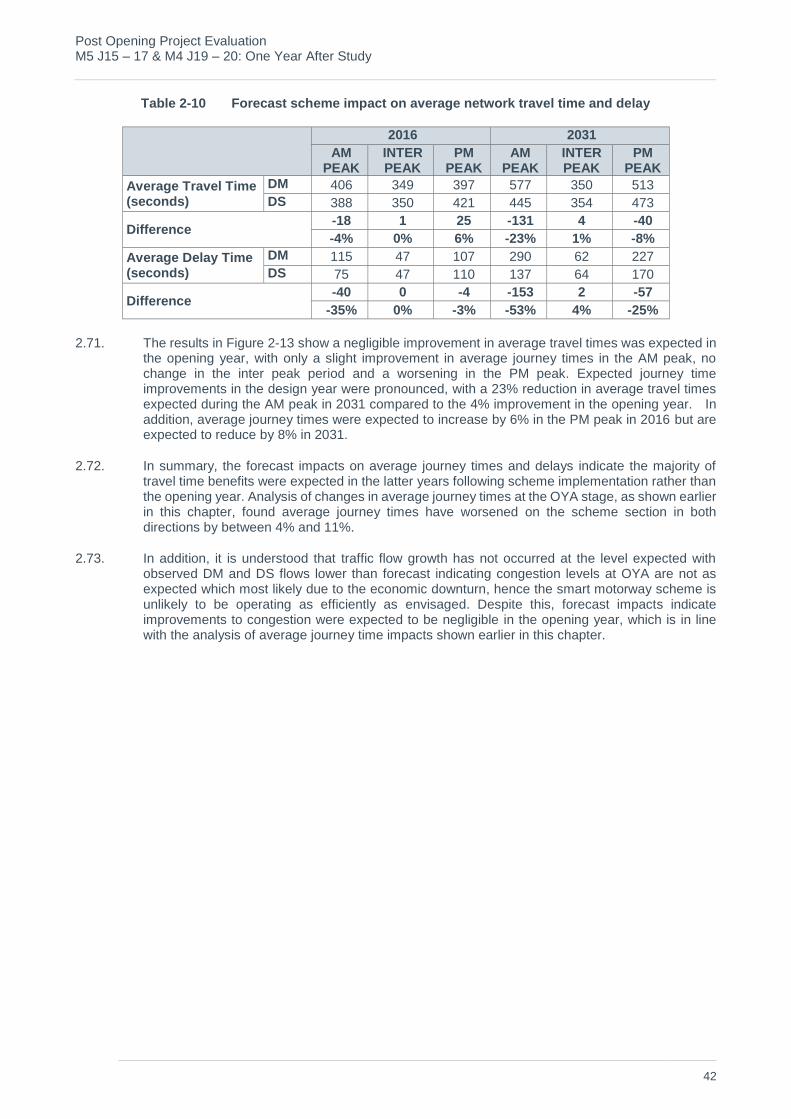
Post Opening Project Evaluation M5 J15 – 17 & M4 J19 – 20: One Year After Study
42
Table 2-10 Forecast scheme impact on average network travel time and delay
2016 2031
AM PEAK
INTER PEAK
PM PEAK
AM PEAK
INTER PEAK
PM PEAK
Average Travel Time (seconds)
DM 406 349 397 577 350 513
DS 388 350 421 445 354 473
Difference -18 1 25 -131 4 -40
-4% 0% 6% -23% 1% -8%
Average Delay Time (seconds)
DM 115 47 107 290 62 227
DS 75 47 110 137 64 170
Difference -40 0 -4 -153 2 -57
-35% 0% -3% -53% 4% -25%
2.71. The results in Figure 2-13 show a negligible improvement in average travel times was expected in the opening year, with only a slight improvement in average journey times in the AM peak, no change in the inter peak period and a worsening in the PM peak. Expected journey time improvements in the design year were pronounced, with a 23% reduction in average travel times expected during the AM peak in 2031 compared to the 4% improvement in the opening year. In addition, average journey times were expected to increase by 6% in the PM peak in 2016 but are expected to reduce by 8% in 2031.
2.72. In summary, the forecast impacts on average journey times and delays indicate the majority of travel time benefits were expected in the latter years following scheme implementation rather than the opening year. Analysis of changes in average journey times at the OYA stage, as shown earlier in this chapter, found average journey times have worsened on the scheme section in both directions by between 4% and 11%.
2.73. In addition, it is understood that traffic flow growth has not occurred at the level expected with observed DM and DS flows lower than forecast indicating congestion levels at OYA are not as expected which most likely due to the economic downturn, hence the smart motorway scheme is unlikely to be operating as efficiently as envisaged. Despite this, forecast impacts indicate improvements to congestion were expected to be negligible in the opening year, which is in line with the analysis of average journey time impacts shown earlier in this chapter.
Post Opening Project Evaluation M5 J15 – 17 & M4 J19 – 20: One Year After Study
43
Journey Time Reliability 2.74. The assessment of benefits that might be obtained from improved reliability through the appraisal
period was calculated using Incident Cost Benefit Analysis (INCA) (considered further in the Economy Chapter). The monetised reliability benefits was not included in the economic justification for the scheme, but would have been included in the overall ‘value for money’ assessment. The reliability sub-objective includes the impact of the scheme on incidents and day to day journey time variability. Although average journey times have mostly increase on the M4/M5 after opening, a key objective for these sections is to improve driver experience by reducing journey time reliability. This section assesses this objective.
2.75. Variability is the extent to which journey times vary from the expected average journey time on any day or time period. This distribution of journey times is considered to be a good indication of how much journey times vary.
2.76. The AST scored reliability as “moderate positive” and states:
“Additional peak period capacity (HSR) and variable speeds limits reduce occurrence of ‘stop-start’ traffic conditions and will improve reliability of journey times. Assessment using INCA gives benefits of £131.9 million which are not included in the BCR [Benefit Cost Ratio] at this stage”.
2.77. In order to assess the impact of the scheme on journey time reliability, the satellite navigation data has been utilised to show the distribution of journey times before and after the scheme opened. This is summarised in Figure 2-20 and Figure 2-21.
2.78. The results in Figure 2-20 and Figure 2-21 show:
The inter-quartile ranges (difference between the 75th and 25th percentile) from the M4 toM5 have reduced in all time periods (with the exception of the inter-peak period) indicatingreliability has improved in this direction. Extreme journey times (95th percentile) have alsoreduced in all time periods.
From the M5 to M4 there has been limited reductions in the inter-quartiles ranges, with theAM peak and shoulder peak the only time periods to experience a reduction (inferringreliability has improved). It is also noted that there has not been an increase in averagejourney times in this period. The PM peak and shoulder peak does not show animprovement in the inter-quartile range. Extreme journey times have improved in allperiods, albeit only very slightly in the AM shoulder peak, inter-peak and PM shoulderpeak.
2.79. Further investigation of the impact of the scheme on the delay experienced in the worst 10% of journeys has also been considered. This has been measured by comparing the difference between the mean journey time and 90th percentile journey times for the before and after scheme opening periods to calculate delay. The results displayed in Table 2-11 are for the full routes as shown earlier in Figure 2-6.

Post Opening Project Evaluation M5 J15 – 17 & M4 J19 – 20: One Year After Study
44
Figure 2-20 Journey Time Reliability from the M4 to M5
Figure 2-21 Journey Time Reliability from the M5 to M4
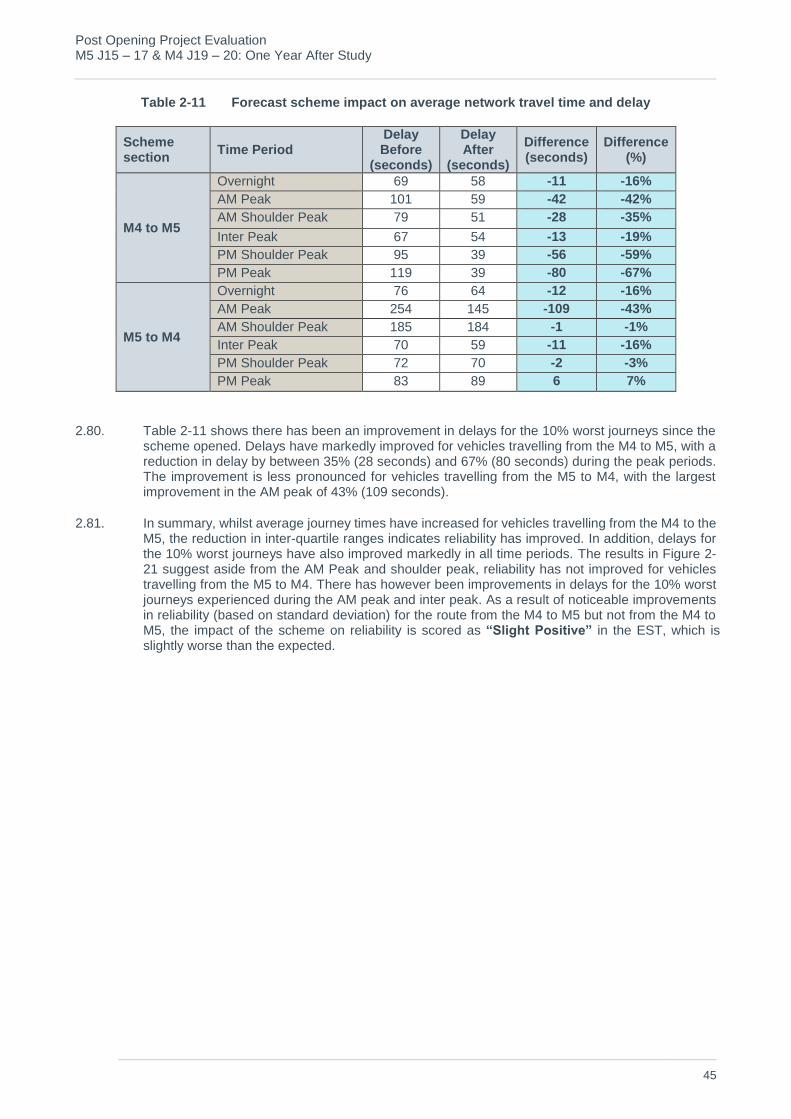
Post Opening Project Evaluation M5 J15 – 17 & M4 J19 – 20: One Year After Study
45
Table 2-11 Forecast scheme impact on average network travel time and delay
Scheme section
Time Period Delay Before
(seconds)
Delay After
(seconds)
Difference (seconds)
Difference (%)
M4 to M5
Overnight 69 58 -11 -16%
AM Peak 101 59 -42 -42%
AM Shoulder Peak 79 51 -28 -35%
Inter Peak 67 54 -13 -19%
PM Shoulder Peak 95 39 -56 -59%
PM Peak 119 39 -80 -67%
M5 to M4
Overnight 76 64 -12 -16%
AM Peak 254 145 -109 -43%
AM Shoulder Peak 185 184 -1 -1%
Inter Peak 70 59 -11 -16%
PM Shoulder Peak 72 70 -2 -3%
PM Peak 83 89 6 7%
2.80. Table 2-11 shows there has been an improvement in delays for the 10% worst journeys since the scheme opened. Delays have markedly improved for vehicles travelling from the M4 to M5, with a reduction in delay by between 35% (28 seconds) and 67% (80 seconds) during the peak periods. The improvement is less pronounced for vehicles travelling from the M5 to M4, with the largest improvement in the AM peak of 43% (109 seconds).
2.81. In summary, whilst average journey times have increased for vehicles travelling from the M4 to the M5, the reduction in inter-quartile ranges indicates reliability has improved. In addition, delays for the 10% worst journeys have also improved markedly in all time periods. The results in Figure 2- 21 suggest aside from the AM Peak and shoulder peak, reliability has not improved for vehicles travelling from the M5 to M4. There has however been improvements in delays for the 10% worst journeys experienced during the AM peak and inter peak. As a result of noticeable improvements in reliability (based on standard deviation) for the route from the M4 to M5 but not from the M4 to M5, the impact of the scheme on reliability is scored as “Slight Positive” in the EST, which is slightly worse than the expected.
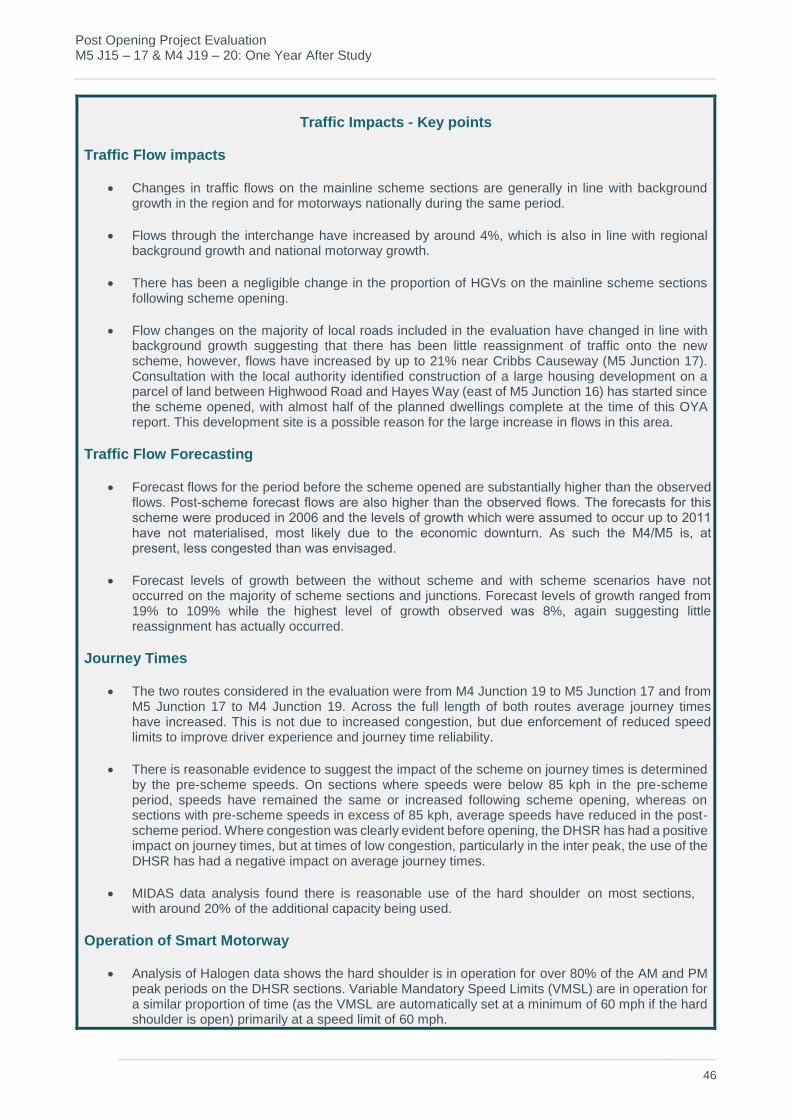
Post Opening Project Evaluation M5 J15 – 17 & M4 J19 – 20: One Year After Study
46
Traffic Impacts - Key points
Traffic Flow impacts
Changes in traffic flows on the mainline scheme sections are generally in line with backgroundgrowth in the region and for motorways nationally during the same period.
Flows through the interchange have increased by around 4%, which is also in line with regionalbackground growth and national motorway growth.
There has been a negligible change in the proportion of HGVs on the mainline scheme sectionsfollowing scheme opening.
Flow changes on the majority of local roads included in the evaluation have changed in line withbackground growth suggesting that there has been little reassignment of traffic onto the newscheme, however, flows have increased by up to 21% near Cribbs Causeway (M5 Junction 17).Consultation with the local authority identified construction of a large housing development on aparcel of land between Highwood Road and Hayes Way (east of M5 Junction 16) has started sincethe scheme opened, with almost half of the planned dwellings complete at the time of this OYAreport. This development site is a possible reason for the large increase in flows in this area.
Traffic Flow Forecasting
Forecast flows for the period before the scheme opened are substantially higher than the observed flows. Post-scheme forecast flows are also higher than the observed flows. The forecasts for this scheme were produced in 2006 and the levels of growth which were assumed to occur up to 2011 have not materialised, most likely due to the economic downturn. As such the M4/M5 is, at present, less congested than was envisaged.
Forecast levels of growth between the without scheme and with scheme scenarios have not occurred on the majority of scheme sections and junctions. Forecast levels of growth ranged from 19% to 109% while the highest level of growth observed was 8%, again suggesting little reassignment has actually occurred.
Journey Times
The two routes considered in the evaluation were from M4 Junction 19 to M5 Junction 17 and from M5 Junction 17 to M4 Junction 19. Across the full length of both routes average journey times have increased. This is not due to increased congestion, but due enforcement of reduced speed limits to improve driver experience and journey time reliability.
There is reasonable evidence to suggest the impact of the scheme on journey times is determinedby the pre-scheme speeds. On sections where speeds were below 85 kph in the pre-schemeperiod, speeds have remained the same or increased following scheme opening, whereas onsections with pre-scheme speeds in excess of 85 kph, average speeds have reduced in the post-scheme period. Where congestion was clearly evident before opening, the DHSR has had a positiveimpact on journey times, but at times of low congestion, particularly in the inter peak, the use of theDHSR has had a negative impact on average journey times.
MIDAS data analysis found there is reasonable use of the hard shoulder on most sections, with around 20% of the additional capacity being used.
Operation of Smart Motorway
Analysis of Halogen data shows the hard shoulder is in operation for over 80% of the AM and PMpeak periods on the DHSR sections. Variable Mandatory Speed Limits (VMSL) are in operation fora similar proportion of time (as the VMSL are automatically set at a minimum of 60 mph if the hardshoulder is open) primarily at a speed limit of 60 mph.

Post Opening Project Evaluation M5 J15 – 17 & M4 J19 – 20: One Year After Study
47
MIDAS analysis of flow and speeds by lane on the M4 J19 – 20 eastbound indicated queueing atM4 Junction 19 could be triggering queue protection measures (which is the automatic changing ofthe Variable Mandatory Speed Limit to 40 mph). 40 mph VMSL are in operation for 40% of the AMpeak and 20% of the PM peak on this section, which is higher than all other scheme sections.
Journey Time Forecasting
It has not been possible to compare directly before and after observed average journey time impacts with forecast impacts due to limited detailed forecasting information.
The forecasting information that has been provided shows a negligible improvement in average journey times was expected in the opening year but large improvements were expected in the design year (2031). Consequently opening year changes in average journey times are not considered to reflect the benefits expected across the scheme life.
Reliability
There has been a noticeable reduction in delays for the 10% worst journey times for vehiclestravelling from the M4 to M5 but there has been limited change in reliability or delays for vehiclestravelling from the M5 to M4.
Journey time reliability has improved for vehicles travelling from M4 Junction 19 to M5 Junction 17but there has been no change (except in the AM peak) for vehicles travelling from M5 Junction 17to M4 Junction 19. As a result, the EST scores “Slight Positive”, worse than the “Moderate Positive”scored in the AST.

Post Opening Project Evaluation M5 J15 – 17 & M4 J19 – 20: One Year After Study
48
3. Safety Evaluation
Introduction 3.1. This section examines the impact of the scheme on safety and how successful the scheme has
been in addressing the objective of improving safety. The focus of this objective is to reduce loss of life, injuries and damage to property resulting from transport accidents and crime. The Client Scheme Requirements (CSR) document reports the “scheme shall reduce the number of fatalities, casualties and incidents on the M5 J15 – 17 and M4 J19 – 20, and through the Almondsbury Interchange, per vehicle kilometre”. The Stage 2 Traffic Survey Report (October 2009) documents collision numbers are “higher on the approaches to Almondsbury Interchange, with twice as many collisions on the M4 westbound approach to the interchange than the eastbound approach and three times more accidents on the M5 northbound approach than southbound approach”.
3.2. In order to assess the impact of the scheme on safety, this section of the report analyses changes in Personal Injury Collisions (PICs)14 occurring in the five year period before the start of construction compared to the available post-opening period. Evaluation of the scheme’s impact on personal security has been undertaken through the use of observations made during a site visit.
Data Sources
Forecast Data 3.3. Forecasts of the impact of the scheme on safety have been obtained from the M4 M5 Hard
Shoulder Running Stage 2 Economic Appraisal Report (December 2009), which detailed the forecast safety impact of the scheme. The evaluation of accident savings has been achieved by estimating the costs of accidents to the Year 2072 (with an opening year 2012, a 60 year appraisal from 2013) in line with the Design Manual for Roads and Bridges (June 2006). Guidance on the economic assessment of HSR was also considered in the calculation of safety benefits.
3.4. The safety forecasts assume no traffic growth beyond 2031 and the Economic Appraisal Report considered the benefits to be conservative. HSR guidance at the time of appraisal indicated a 15% reduction in PICs should be assumed when HSR and ALR is operating. Furthermore, if MIDAS has not been installed in the DM situation, then an additional 13% reduction in collisions can be expected. Where MIDAS was not installed previously and the scheme is HSR or ALR, a scheme is expected to reduce collisions by 26%.
3.5. In terms of this scheme, in the DM scenario, MIDAS was not present on the M5 but was already installed on the M4 hence different rates of safety benefits have been applied for the two sections following scheme opening. Forecast changes in collision numbers for the DM and DS scenarios have not been made available to POPE and therefore the forecast safety benefits assessed in this study are:
15% reduction in collisions on the M4 scheme section; and
26% reduction in collisions on the M5 scheme section.
Observed Data 3.6. Collisions by their nature are unpredictable events and therefore to ensure the scheme is the only
known change, pre-scheme collision data has been obtained for the most recent five years before construction. Collision data has been obtained from the Area 2 Managing Agent Contractor (MAC) for the following date periods:
Before opening: January 2008 to December 2012 (60 months)
14 Collisions were previously referred to as accidents. The naming convention has been changed in line with Highways
England’s current terminology.
Post Opening Project Evaluation M5 J15 – 17 & M4 J19 – 20: One Year After Study
49
Construction: January 2012 to January 2014 (25 months)
After opening: February 2014 to January 2015 (12 months)
3.7. The collision data is based on the records of PICs (i.e. collisions that involved injuries to one of more persons) recorded in STATS19 data collected by the police when attending collisions. Collisions that do not result in injury are not included in this dataset hence are not considered in this evaluation. Only 12 months of post-opening data are used in this report and this should be considered when drawing conclusions. It should also be noted that at this stage the collision data may not yet have been validated by the DfT. The requirement for up-to-date and site specific information necessitated the use of unvalidated data sourced from the local authority. Thus the data is judged to be sufficiently robust for use in this study but it may be subject to change. It is not anticipated that this would be significant enough to affect the analysis of collision numbers presented in this report.
3.8. As noted in Paragraph 3.5, the M4 and M5 scheme sections have different forecast safety impacts, therefore to allow direct comparison between observed and forecast impacts, analysis of the change in the number of PICs has been undertaken for the M4 and M5 sections separately. The Stage 2 Appraisal Summary Table (December 2009) reports “the midpoint of the slip roads linking the M4 and M5 motorways was used as the boundary between the sections” and “accidents occurring on slip-roads entering or leaving the HSR sections were included in the analysis of that section, as appropriate. For the purpose of this evaluation, the geographic areas shown in Figure 3-1 have been used to inform analysis. The following have been excluded from the analysis in line with the AST Report:
M5 J17 northbound off-slip;
M5 J17 southbound on-slip;
M4 J19 eastbound off-slip; and
M4 J19 westbound on-slip.

Post Opening Project Evaluation M5 J15 – 17 & M4 J19 – 20: One Year After Study
50
Figure 3-1 Geographic Areas used in collision analysis
Background Changes in Collision Reduction 3.9. It is widely recognized that for over a decade there has been a year-on-year reduction in the
number of PICs on roads, even against the trend of increasing traffic volumes during much of the same period. The reasons for the reduction are considered to be wide ranging and include improved safety measures in vehicles and reduced numbers of younger drivers. This background trend needs to be considered when examining the changes in collision numbers. If the scheme had not been built, collision numbers in the area are still likely to have been influenced by wider trends and therefore reduced.
3.10. When the number of collisions in this area in the years before (pre-scheme) and after (post-scheme) the scheme was built are compared, a link can be made between the change in the number of collisions and the scheme. The best way to do this is to assume that, had the scheme had not been built, the number of collisions on the roads in the study area would have dropped at the same rate as they did nationally during the same time period. This gives what is known as a “counterfactual” scenario. The counterfactual scenario (without scheme) scenario can be compared on a like-for-like basis with post-opening (with scheme) scenario. The difference between the number of collisions in these two scenarios can then be attributed to the scheme rather than the wider national trends. This result informs the calculation of monetised safety benefits achieved by the scheme, as discussed in the economy chapter of this report.
3.11. The counterfactual scenario compares the national collision data15 in the period after the scheme opened to a representative year in the pre-construction period (the middle year of the before scheme opening period). The most recent statistics available only extend to 2013. As a result, the change in the number of collisions on motorways from 2009 (the middle of the before scheme period) to 2013 (most recent data available) has been compared. Table 3-1 illustrates there has been a 19% reduction in collision numbers on motorways between 2009 and 2013. This reduction has been applied to the pre-scheme opening collision numbers to create the counterfactual scenario.
15 National trend data is sourced from DfT Table RAS10002.
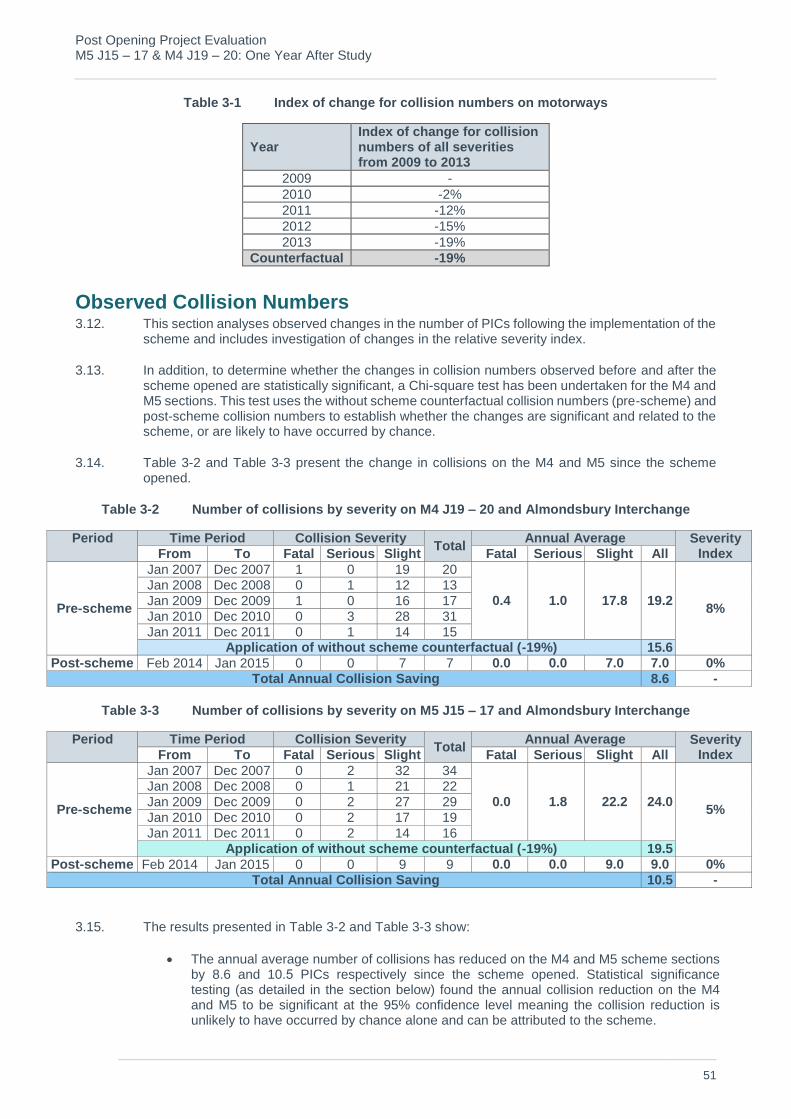
Post Opening Project Evaluation M5 J15 – 17 & M4 J19 – 20: One Year After Study
51
Table 3-1 Index of change for collision numbers on motorways
Year Index of change for collision numbers of all severities from 2009 to 2013
2009 -
2010 -2%
2011 -12%
2012 -15%
2013 -19%
Counterfactual -19%
Observed Collision Numbers 3.12. This section analyses observed changes in the number of PICs following the implementation of the
scheme and includes investigation of changes in the relative severity index.
3.13. In addition, to determine whether the changes in collision numbers observed before and after the scheme opened are statistically significant, a Chi-square test has been undertaken for the M4 and M5 sections. This test uses the without scheme counterfactual collision numbers (pre-scheme) and post-scheme collision numbers to establish whether the changes are significant and related to the scheme, or are likely to have occurred by chance.
3.14. Table 3-2 and Table 3-3 present the change in collisions on the M4 and M5 since the scheme opened.
Table 3-2 Number of collisions by severity on M4 J19 – 20 and Almondsbury Interchange
Period Time Period Collision Severity Total
Annual Average Severity Index From To Fatal Serious Slight Fatal Serious Slight All
Pre-scheme
Jan 2007 Dec 2007 1 0 19 20
0.4 1.0 17.8 19.2 8%
Jan 2008 Dec 2008 0 1 12 13
Jan 2009 Dec 2009 1 0 16 17
Jan 2010 Dec 2010 0 3 28 31
Jan 2011 Dec 2011 0 1 14 15 Application of without scheme counterfactual (-19%) 15.6
Post-scheme Feb 2014 Jan 2015 0 0 7 7 0.0 0.0 7.0 7.0 0%
Total Annual Collision Saving 8.6 -
Table 3-3 Number of collisions by severity on M5 J15 – 17 and Almondsbury Interchange
Period Time Period Collision Severity Total
Annual Average Severity Index From To Fatal Serious Slight Fatal Serious Slight All
Pre-scheme
Jan 2007 Dec 2007 0 2 32 34
0.0 1.8 22.2 24.0 5%
Jan 2008 Dec 2008 0 1 21 22
Jan 2009 Dec 2009 0 2 27 29
Jan 2010 Dec 2010 0 2 17 19
Jan 2011 Dec 2011 0 2 14 16 Application of without scheme counterfactual (-19%) 19.5
Post-scheme Feb 2014 Jan 2015 0 0 9 9 0.0 0.0 9.0 9.0 0%
Total Annual Collision Saving 10.5 -
3.15. The results presented in Table 3-2 and Table 3-3 show:
The annual average number of collisions has reduced on the M4 and M5 scheme sections by 8.6 and 10.5 PICs respectively since the scheme opened. Statistical significance testing (as detailed in the section below) found the annual collision reduction on the M4 and M5 to be significant at the 95% confidence level meaning the collision reduction is unlikely to have occurred by chance alone and can be attributed to the scheme.
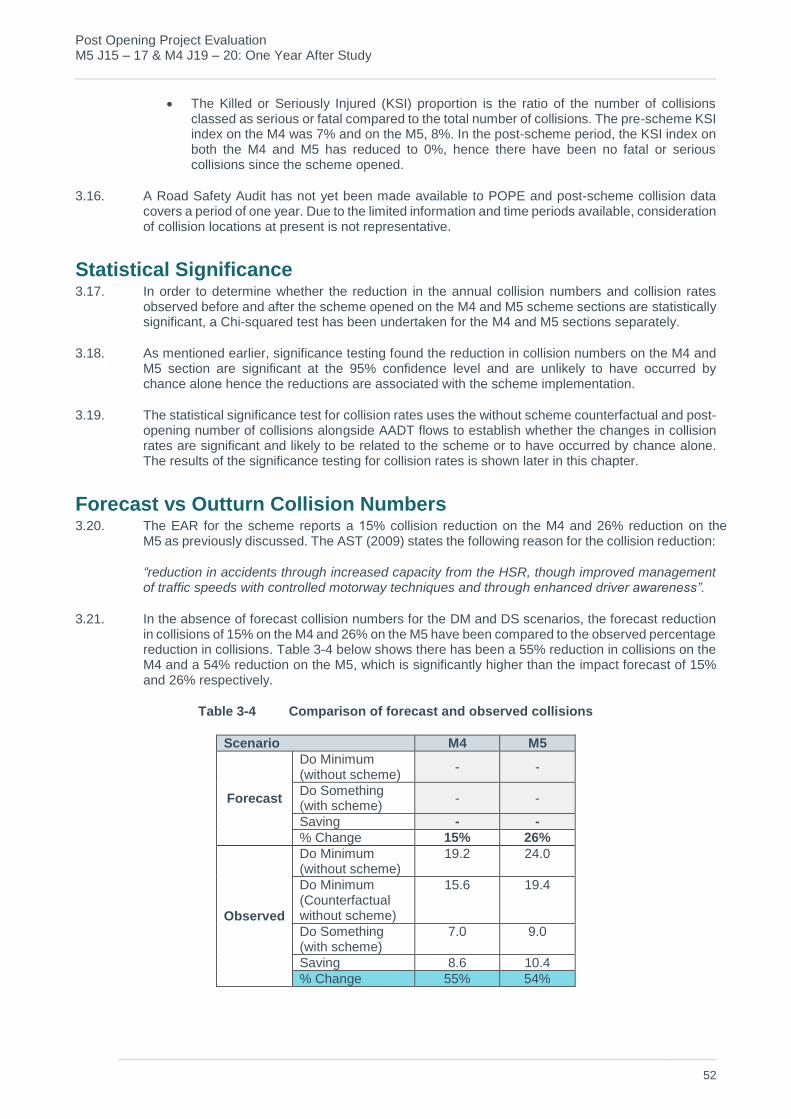
Post Opening Project Evaluation M5 J15 – 17 & M4 J19 – 20: One Year After Study
52
The Killed or Seriously Injured (KSI) proportion is the ratio of the number of collisionsclassed as serious or fatal compared to the total number of collisions. The pre-scheme KSIindex on the M4 was 7% and on the M5, 8%. In the post-scheme period, the KSI index onboth the M4 and M5 has reduced to 0%, hence there have been no fatal or seriouscollisions since the scheme opened.
3.16. A Road Safety Audit has not yet been made available to POPE and post-scheme collision data covers a period of one year. Due to the limited information and time periods available, consideration of collision locations at present is not representative.
Statistical Significance 3.17. In order to determine whether the reduction in the annual collision numbers and collision rates
observed before and after the scheme opened on the M4 and M5 scheme sections are statistically significant, a Chi-squared test has been undertaken for the M4 and M5 sections separately.
3.18. As mentioned earlier, significance testing found the reduction in collision numbers on the M4 and M5 section are significant at the 95% confidence level and are unlikely to have occurred by chance alone hence the reductions are associated with the scheme implementation.
3.19. The statistical significance test for collision rates uses the without scheme counterfactual and post-opening number of collisions alongside AADT flows to establish whether the changes in collision rates are significant and likely to be related to the scheme or to have occurred by chance alone. The results of the significance testing for collision rates is shown later in this chapter.
Forecast vs Outturn Collision Numbers 3.20. The EAR for the scheme reports a 15% collision reduction on the M4 and 26% reduction on the
M5 as previously discussed. The AST (2009) states the following reason for the collision reduction:
“reduction in accidents through increased capacity from the HSR, though improved management of traffic speeds with controlled motorway techniques and through enhanced driver awareness”.
3.21. In the absence of forecast collision numbers for the DM and DS scenarios, the forecast reduction in collisions of 15% on the M4 and 26% on the M5 have been compared to the observed percentage reduction in collisions. Table 3-4 below shows there has been a 55% reduction in collisions on the M4 and a 54% reduction on the M5, which is significantly higher than the impact forecast of 15% and 26% respectively.
Table 3-4 Comparison of forecast and observed collisions
Scenario M4 M5
Forecast
Do Minimum (without scheme)
- -
Do Something (with scheme)
- -
Saving - -
% Change 15% 26%
Observed
Do Minimum (without scheme)
19.2 24.0
Do Minimum (Counterfactual without scheme)
15.6 19.4
Do Something (with scheme)
7.0 9.0
Saving 8.6 10.4
% Change 55% 54%

Post Opening Project Evaluation M5 J15 – 17 & M4 J19 – 20: One Year After Study
53
Collision Rates 3.22. The number of collisions along a length of road used together with AADT for the same section can
be used to calculate a collision rate, known as PIC per million vehicle kilometres (mvkm). By looking at the rate it is possible to identify the impact of the scheme, eliminating any potential impact of traffic volume changes. Table 3-5 shows the change in collisions rates following the scheme opening on the M4 and M5 separately.
Table 3-5 Collisions Rates on M4 and M5 Scheme Sections
Scenario Scheme Section
M4 (PICs/mvkm)
M5 (PICs/mvkm)
Do Minimum (without scheme) 0.092 0.123
Application of without scheme counterfactual rate (0.79) 0.073 0.098
Do Something (with scheme) 0.033 0.046
Saving 0.040 (55%) 0.052(52%)
3.23. From Table 3-5 it can be seen that following scheme opening the collision rate has significantly reduced on the M4 and M5 scheme sections. The results show the collision rate was higher on the M5 than the M4 in the without scheme scenario, however, the collision rate on both scheme sections has reduced by around 50% when the ‘with scheme’ collision rate is compared to the ‘without scheme’ counterfactual rate. Statistical significance testing shows the reduction in collision rates is likely to be attributable to the scheme and has not occurred by chance alone.
Fatalities and Weighted Index 3.24. The collision rate discussed previously and shown in Table 3-5 does not take into account the
severity of collisions. To analyse this, the Fatalities and Weighted Injuries (FWI) metric which is a combined measure of casualties based on the number of fatal, serious and slight casualties is presented. The FWI for the periods three years before and one year after opening are shown in Table 3-6 for the M4 and Table 3-7 for the M5. To take into account the increased traffic on the M4 and M5 and for comparison with other schemes, billion vehicle kilometres (bvkm) and billion vehicle miles (bvm) are also presented. It should however be noted that these figures do not take account for background reductions in casualties or collisions.
Table 3-6 FWI on M4 scheme section
Period FWI/collision FWI/year FWI/bvkm FWI/bvm
Before (three years) 0.039 0.820 3.912 6.296
After (one year) 0.020 0.140 0.655 1.055
Table 3-7 FWI on M5 scheme section
Period FWI/collision FWI/year FWI/bvkm FWI/bvm
Before (three years) 0.025 0.543 2.747 4.420
After (one year) 0.019 0.170 0.870 1.400
3.25. The results show all the FWI metrics have reduced following scheme opening on the M4 and M5 indicating the absolute number and seriousness of casualty injuries has reduced significantly.
Personal Security 3.26. The aim of this sub-objective is to consider both the changes in security and the likely number of
users affected by the changes. For highways schemes, security includes the perception of risk from damage to or theft from vehicles, personal injury or theft of property from individuals or from vehicles. Security issues may arise from the following:

Post Opening Project Evaluation M5 J15 – 17 & M4 J19 – 20: One Year After Study
54
On the road itself (e.g. being attacked whilst broken down).
In service areas/ car parks/ lay-bys (e.g. vehicle damaged while parked at service stationsor attacked whilst walking to a parked car).
At junctions (e.g. smash and grab incidents whilst queueing at traffic lights).
3.27. The primary indicators for personal security on roads include:
Surveillance
Landscaping
Lighting and Visibility
Emergency call facilities
Cyclists and pedestrian facilities
Forecast 3.28. The scheme AST scored the sub-objective slight positive and states “additional CCTV cameras
provide extra security through higher level of surveillance. Emergency Refuge Areas provide safer locations for broken down vehicles”.
Evaluation 3.29. As shown in Figure 3-2, CCTV cameras and Emergency Refuge Areas have been provided in line
with the AST. Overall, the impact of the scheme is considered to be “Slight Positive”, as expected.
Figure 3-2 Additional CCTV Cameras and Emergency Refuge Area
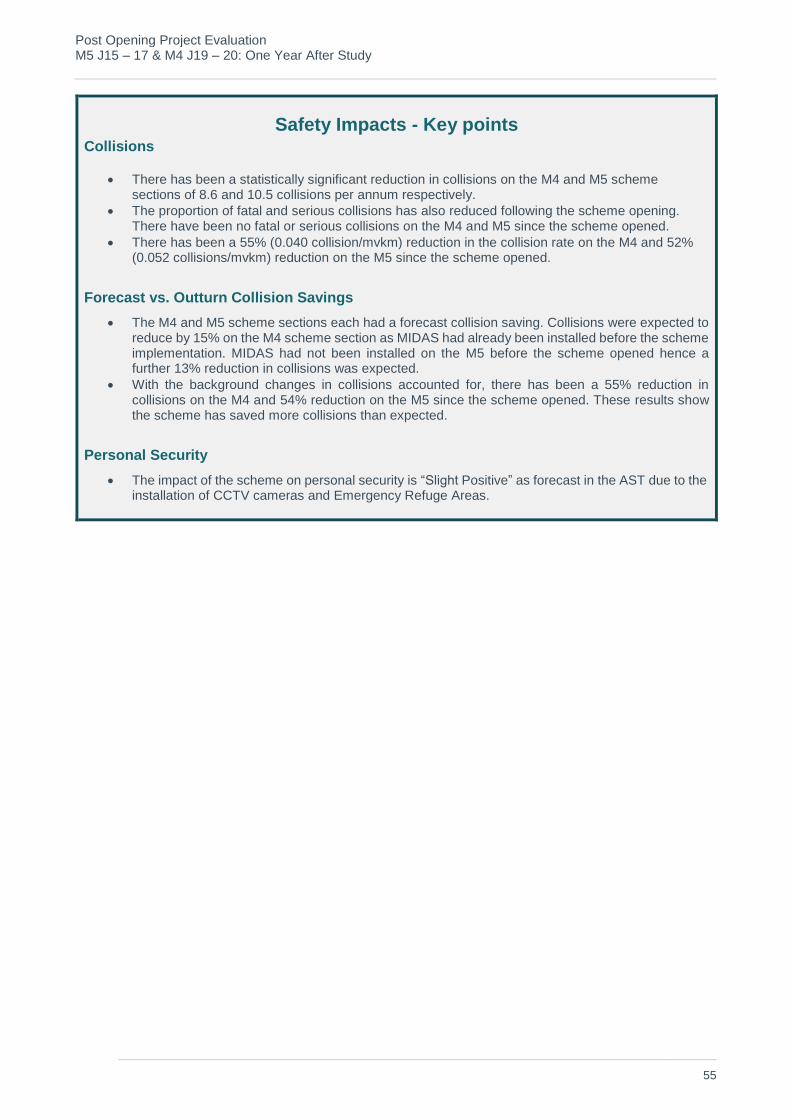
Post Opening Project Evaluation M5 J15 – 17 & M4 J19 – 20: One Year After Study
55
Safety Impacts - Key points Collisions
There has been a statistically significant reduction in collisions on the M4 and M5 schemesections of 8.6 and 10.5 collisions per annum respectively.
The proportion of fatal and serious collisions has also reduced following the scheme opening.There have been no fatal or serious collisions on the M4 and M5 since the scheme opened.
There has been a 55% (0.040 collision/mvkm) reduction in the collision rate on the M4 and 52%(0.052 collisions/mvkm) reduction on the M5 since the scheme opened.
Forecast vs. Outturn Collision Savings
The M4 and M5 scheme sections each had a forecast collision saving. Collisions were expected toreduce by 15% on the M4 scheme section as MIDAS had already been installed before the schemeimplementation. MIDAS had not been installed on the M5 before the scheme opened hence afurther 13% reduction in collisions was expected.
With the background changes in collisions accounted for, there has been a 55% reduction incollisions on the M4 and 54% reduction on the M5 since the scheme opened. These results showthe scheme has saved more collisions than expected.
Personal Security
The impact of the scheme on personal security is “Slight Positive” as forecast in the AST due to the installation of CCTV cameras and Emergency Refuge Areas.

Post Opening Project Evaluation M5 J15 – 17 & M4 J19 – 20: One Year After Study
56
4. Economy
Introduction 4.1. The purpose of this chapter is to evaluate how the scheme is performing against the economy
objective which is defined in WebTAG as:
“To support sustainable economic activity and achieve good value for money”.
4.2. The economy sub-objectives are:
To achieve good value for money in relation to impacts on public accounts.
Improve transport economic efficiency for business users and transport providers.
Improve transport economic efficiency for consumer users.
Improve reliability.
Provide benefits for wider economic impacts.
4.3. Scheme appraisal consists of an economic assessment to determine the scheme’s value for money. This assessment is based on an estimation of costs and benefits from different sources:
Transport Economic Efficiency (TEE) benefits (savings related to travel times and vehicleoperating costs).
Collisions costs (saving related to number and severity of collisions).
Costs to users due to delays during construction and future maintenance periods.
Cost of building the scheme and;
Cost of operating the scheme over its lifetime.
4.4. This section provides a comparison between the outturn costs and benefits and the forecast economic impact, as well as considering the wider economic impacts of the scheme. Outturn journey time and safety economic impacts are based on analysis presented in Chapters 2 and 3.
Sources 4.5. The following information has been used to inform the economic assessment in this chapter:
M4 M5 Hard shoulder Running Economic Appraisal Report (EAR) (April 2010).
Outturn costs from the Regional Finance Manager in March 2015.
4.6. Forecast benefits are presented for a 60 year appraisal period based on a 2016 opening year. All monetary values presented in this chapter are in 2002 prices discounted to 2002 unless otherwise stated. As stated in Chapter 2, the forecasts included a 2016 opening year, however the scheme opened in January 2014 and the outturn 60 year benefits are presented based on a 2014 opening year.
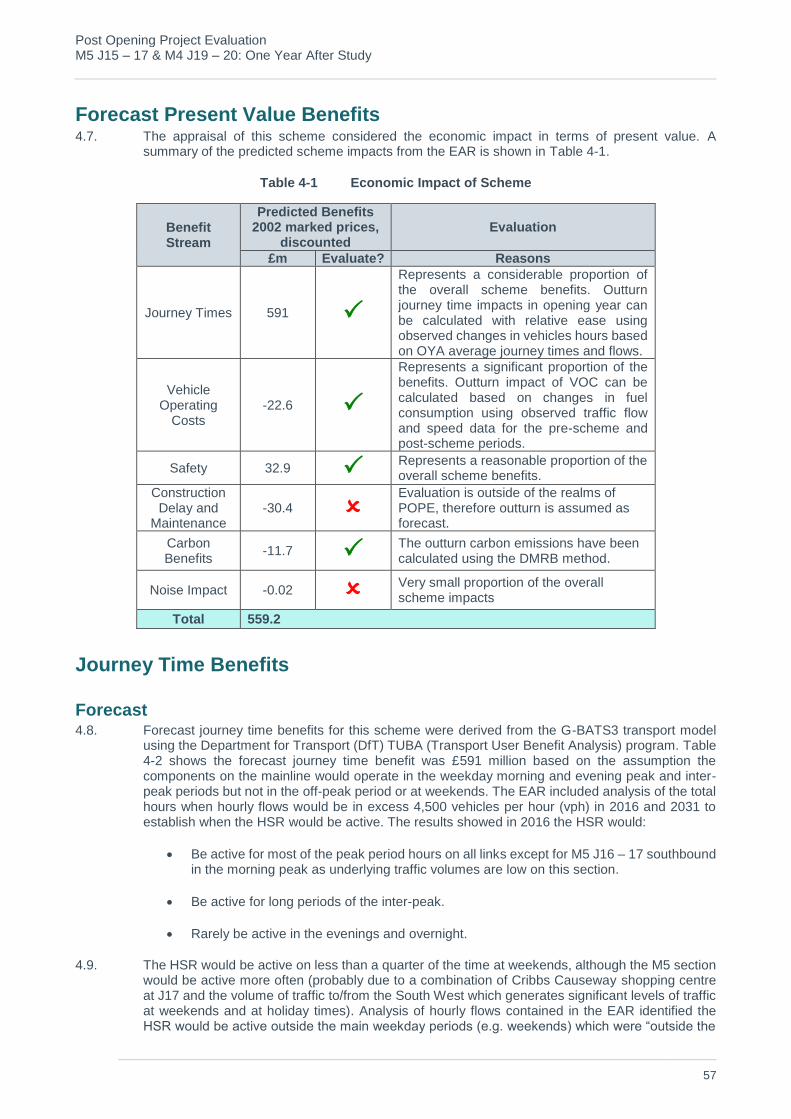
Post Opening Project Evaluation M5 J15 – 17 & M4 J19 – 20: One Year After Study
57
Forecast Present Value Benefits 4.7. The appraisal of this scheme considered the economic impact in terms of present value. A
summary of the predicted scheme impacts from the EAR is shown in Table 4-1.
Table 4-1 Economic Impact of Scheme
Benefit Stream
Predicted Benefits 2002 marked prices,
discounted Evaluation
£m Evaluate? Reasons
Journey Times 591
Represents a considerable proportion of the overall scheme benefits. Outturn journey time impacts in opening year can be calculated with relative ease using observed changes in vehicles hours based on OYA average journey times and flows.
Vehicle Operating
Costs -22.6
Represents a significant proportion of the benefits. Outturn impact of VOC can be calculated based on changes in fuel consumption using observed traffic flow and speed data for the pre-scheme and post-scheme periods.
Safety 32.9 Represents a reasonable proportion of the overall scheme benefits.
Construction Delay and
Maintenance -30.4
Evaluation is outside of the realms of POPE, therefore outturn is assumed as forecast.
Carbon Benefits
-11.7 The outturn carbon emissions have been calculated using the DMRB method.
Noise Impact -0.02 Very small proportion of the overall scheme impacts
Total 559.2
Journey Time Benefits
Forecast 4.8. Forecast journey time benefits for this scheme were derived from the G-BATS3 transport model
using the Department for Transport (DfT) TUBA (Transport User Benefit Analysis) program. Table 4-2 shows the forecast journey time benefit was £591 million based on the assumption the components on the mainline would operate in the weekday morning and evening peak and inter-peak periods but not in the off-peak period or at weekends. The EAR included analysis of the total hours when hourly flows would be in excess 4,500 vehicles per hour (vph) in 2016 and 2031 to establish when the HSR would be active. The results showed in 2016 the HSR would:
Be active for most of the peak period hours on all links except for M5 J16 – 17 southboundin the morning peak as underlying traffic volumes are low on this section.
Be active for long periods of the inter-peak.
Rarely be active in the evenings and overnight.
4.9. The HSR would be active on less than a quarter of the time at weekends, although the M5 section would be active more often (probably due to a combination of Cribbs Causeway shopping centre at J17 and the volume of traffic to/from the South West which generates significant levels of traffic at weekends and at holiday times). Analysis of hourly flows contained in the EAR identified the HSR would be active outside the main weekday periods (e.g. weekends) which were “outside the
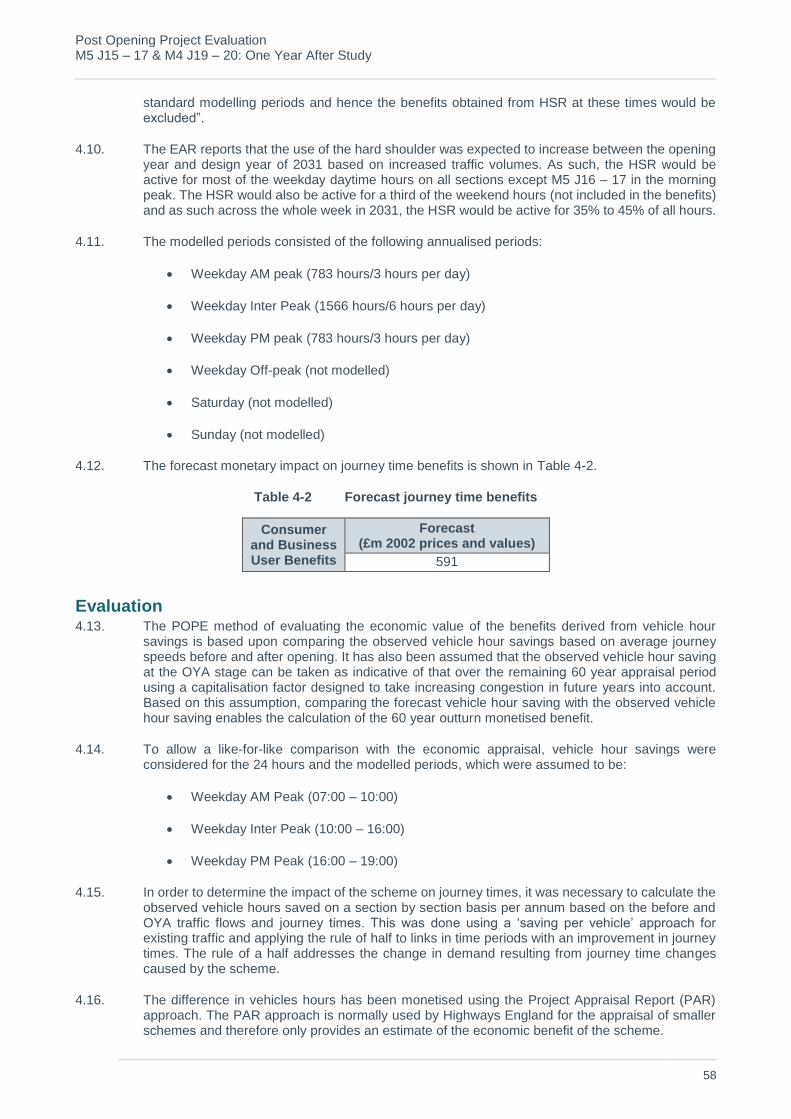
Post Opening Project Evaluation M5 J15 – 17 & M4 J19 – 20: One Year After Study
58
standard modelling periods and hence the benefits obtained from HSR at these times would be excluded”.
4.10. The EAR reports that the use of the hard shoulder was expected to increase between the opening year and design year of 2031 based on increased traffic volumes. As such, the HSR would be active for most of the weekday daytime hours on all sections except M5 J16 – 17 in the morning peak. The HSR would also be active for a third of the weekend hours (not included in the benefits) and as such across the whole week in 2031, the HSR would be active for 35% to 45% of all hours.
4.11. The modelled periods consisted of the following annualised periods:
Weekday AM peak (783 hours/3 hours per day)
Weekday Inter Peak (1566 hours/6 hours per day)
Weekday PM peak (783 hours/3 hours per day)
Weekday Off-peak (not modelled)
Saturday (not modelled)
Sunday (not modelled)
4.12. The forecast monetary impact on journey time benefits is shown in Table 4-2.
Table 4-2 Forecast journey time benefits
Consumer and Business User Benefits
Forecast (£m 2002 prices and values)
591
Evaluation 4.13. The POPE method of evaluating the economic value of the benefits derived from vehicle hour
savings is based upon comparing the observed vehicle hour savings based on average journey speeds before and after opening. It has also been assumed that the observed vehicle hour saving at the OYA stage can be taken as indicative of that over the remaining 60 year appraisal period using a capitalisation factor designed to take increasing congestion in future years into account. Based on this assumption, comparing the forecast vehicle hour saving with the observed vehicle hour saving enables the calculation of the 60 year outturn monetised benefit.
4.14. To allow a like-for-like comparison with the economic appraisal, vehicle hour savings were considered for the 24 hours and the modelled periods, which were assumed to be:
Weekday AM Peak (07:00 – 10:00)
Weekday Inter Peak (10:00 – 16:00)
Weekday PM Peak (16:00 – 19:00)
4.15. In order to determine the impact of the scheme on journey times, it was necessary to calculate the observed vehicle hours saved on a section by section basis per annum based on the before and OYA traffic flows and journey times. This was done using a ‘saving per vehicle’ approach for existing traffic and applying the rule of half to links in time periods with an improvement in journey times. The rule of a half addresses the change in demand resulting from journey time changes caused by the scheme.
4.16. The difference in vehicles hours has been monetised using the Project Appraisal Report (PAR) approach. The PAR approach is normally used by Highways England for the appraisal of smaller schemes and therefore only provides an estimate of the economic benefit of the scheme.
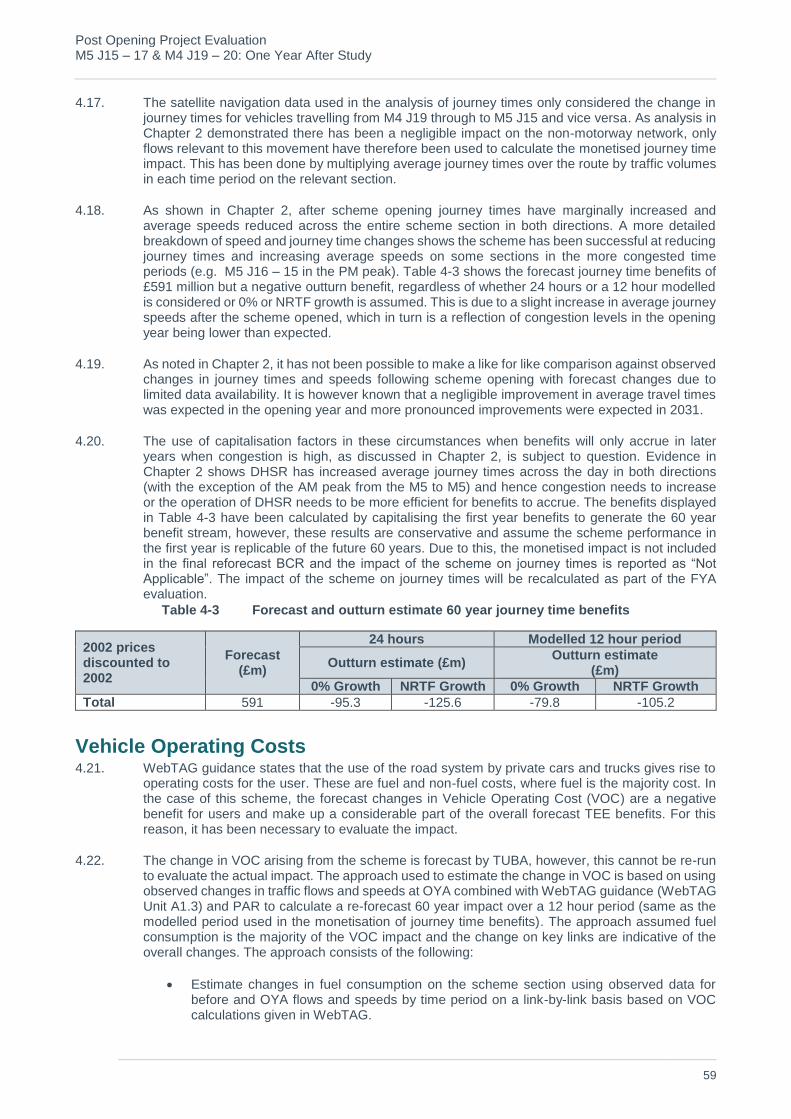
Post Opening Project Evaluation M5 J15 – 17 & M4 J19 – 20: One Year After Study
59
4.17. The satellite navigation data used in the analysis of journey times only considered the change in journey times for vehicles travelling from M4 J19 through to M5 J15 and vice versa. As analysis in Chapter 2 demonstrated there has been a negligible impact on the non-motorway network, only flows relevant to this movement have therefore been used to calculate the monetised journey time impact. This has been done by multiplying average journey times over the route by traffic volumes in each time period on the relevant section.
4.18. As shown in Chapter 2, after scheme opening journey times have marginally increased and average speeds reduced across the entire scheme section in both directions. A more detailed breakdown of speed and journey time changes shows the scheme has been successful at reducing journey times and increasing average speeds on some sections in the more congested time periods (e.g. M5 J16 – 15 in the PM peak). Table 4-3 shows the forecast journey time benefits of £591 million but a negative outturn benefit, regardless of whether 24 hours or a 12 hour modelled is considered or 0% or NRTF growth is assumed. This is due to a slight increase in average journey speeds after the scheme opened, which in turn is a reflection of congestion levels in the opening year being lower than expected.
4.19. As noted in Chapter 2, it has not been possible to make a like for like comparison against observed changes in journey times and speeds following scheme opening with forecast changes due to limited data availability. It is however known that a negligible improvement in average travel times was expected in the opening year and more pronounced improvements were expected in 2031.
4.20. The use of capitalisation factors in these circumstances when benefits will only accrue in later years when congestion is high, as discussed in Chapter 2, is subject to question. Evidence in Chapter 2 shows DHSR has increased average journey times across the day in both directions (with the exception of the AM peak from the M5 to M5) and hence congestion needs to increase or the operation of DHSR needs to be more efficient for benefits to accrue. The benefits displayed in Table 4-3 have been calculated by capitalising the first year benefits to generate the 60 year benefit stream, however, these results are conservative and assume the scheme performance in the first year is replicable of the future 60 years. Due to this, the monetised impact is not included in the final reforecast BCR and the impact of the scheme on journey times is reported as “Not Applicable”. The impact of the scheme on journey times will be recalculated as part of the FYA evaluation.
Table 4-3 Forecast and outturn estimate 60 year journey time benefits
2002 prices discounted to 2002
Forecast (£m)
24 hours Modelled 12 hour period
Outturn estimate (£m) Outturn estimate
(£m)
0% Growth NRTF Growth 0% Growth NRTF Growth
Total 591 -95.3 -125.6 -79.8 -105.2
Vehicle Operating Costs 4.21. WebTAG guidance states that the use of the road system by private cars and trucks gives rise to
operating costs for the user. These are fuel and non-fuel costs, where fuel is the majority cost. In the case of this scheme, the forecast changes in Vehicle Operating Cost (VOC) are a negative benefit for users and make up a considerable part of the overall forecast TEE benefits. For this reason, it has been necessary to evaluate the impact.
4.22. The change in VOC arising from the scheme is forecast by TUBA, however, this cannot be re-run to evaluate the actual impact. The approach used to estimate the change in VOC is based on using observed changes in traffic flows and speeds at OYA combined with WebTAG guidance (WebTAG Unit A1.3) and PAR to calculate a re-forecast 60 year impact over a 12 hour period (same as the modelled period used in the monetisation of journey time benefits). The approach assumed fuel consumption is the majority of the VOC impact and the change on key links are indicative of the overall changes. The approach consists of the following:
Estimate changes in fuel consumption on the scheme section using observed data forbefore and OYA flows and speeds by time period on a link-by-link basis based on VOCcalculations given in WebTAG.
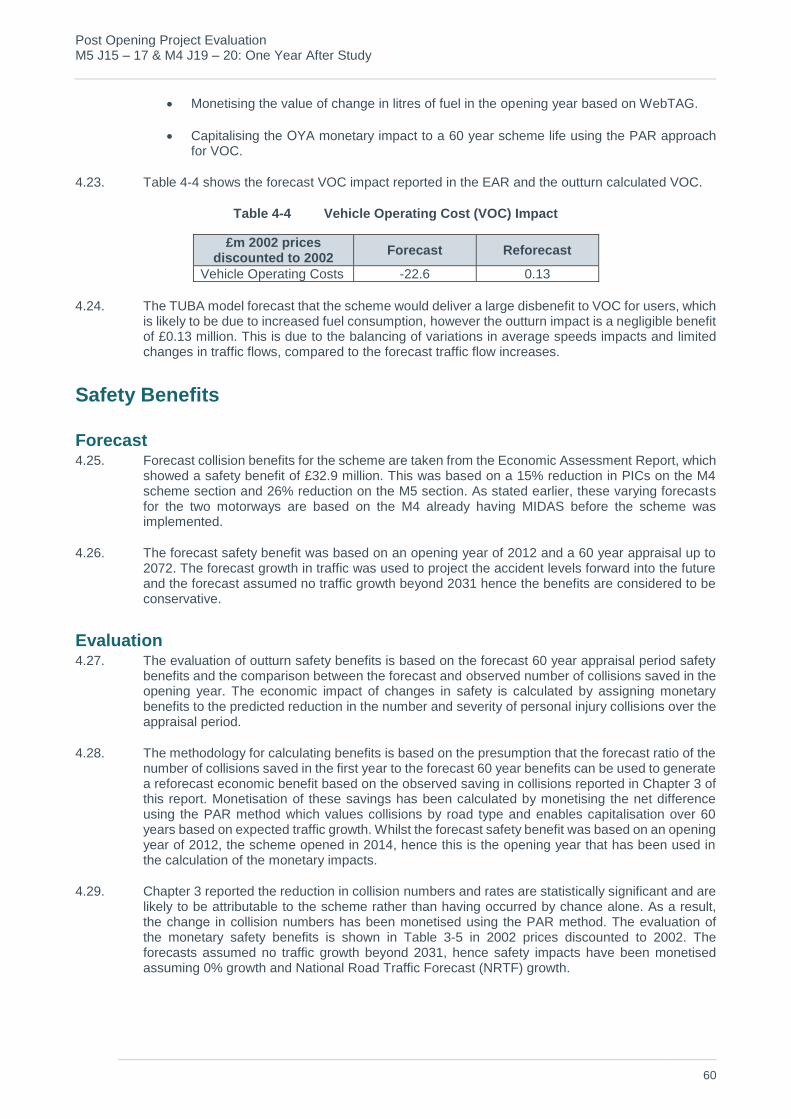
Post Opening Project Evaluation M5 J15 – 17 & M4 J19 – 20: One Year After Study
60
Monetising the value of change in litres of fuel in the opening year based on WebTAG.
Capitalising the OYA monetary impact to a 60 year scheme life using the PAR approach for VOC.
4.23. Table 4-4 shows the forecast VOC impact reported in the EAR and the outturn calculated VOC.
Table 4-4 Vehicle Operating Cost (VOC) Impact
£m 2002 prices discounted to 2002
Forecast Reforecast
Vehicle Operating Costs -22.6 0.13
4.24. The TUBA model forecast that the scheme would deliver a large disbenefit to VOC for users, which is likely to be due to increased fuel consumption, however the outturn impact is a negligible benefit of £0.13 million. This is due to the balancing of variations in average speeds impacts and limited changes in traffic flows, compared to the forecast traffic flow increases.
Safety Benefits
Forecast 4.25. Forecast collision benefits for the scheme are taken from the Economic Assessment Report, which
showed a safety benefit of £32.9 million. This was based on a 15% reduction in PICs on the M4 scheme section and 26% reduction on the M5 section. As stated earlier, these varying forecasts for the two motorways are based on the M4 already having MIDAS before the scheme was implemented.
4.26. The forecast safety benefit was based on an opening year of 2012 and a 60 year appraisal up to 2072. The forecast growth in traffic was used to project the accident levels forward into the future and the forecast assumed no traffic growth beyond 2031 hence the benefits are considered to be conservative.
Evaluation 4.27. The evaluation of outturn safety benefits is based on the forecast 60 year appraisal period safety
benefits and the comparison between the forecast and observed number of collisions saved in the opening year. The economic impact of changes in safety is calculated by assigning monetary benefits to the predicted reduction in the number and severity of personal injury collisions over the appraisal period.
4.28. The methodology for calculating benefits is based on the presumption that the forecast ratio of the number of collisions saved in the first year to the forecast 60 year benefits can be used to generate a reforecast economic benefit based on the observed saving in collisions reported in Chapter 3 of this report. Monetisation of these savings has been calculated by monetising the net difference using the PAR method which values collisions by road type and enables capitalisation over 60 years based on expected traffic growth. Whilst the forecast safety benefit was based on an opening year of 2012, the scheme opened in 2014, hence this is the opening year that has been used in the calculation of the monetary impacts.
4.29. Chapter 3 reported the reduction in collision numbers and rates are statistically significant and are likely to be attributable to the scheme rather than having occurred by chance alone. As a result, the change in collision numbers has been monetised using the PAR method. The evaluation of the monetary safety benefits is shown in Table 3-5 in 2002 prices discounted to 2002. The forecasts assumed no traffic growth beyond 2031, hence safety impacts have been monetised assuming 0% growth and National Road Traffic Forecast (NRTF) growth.
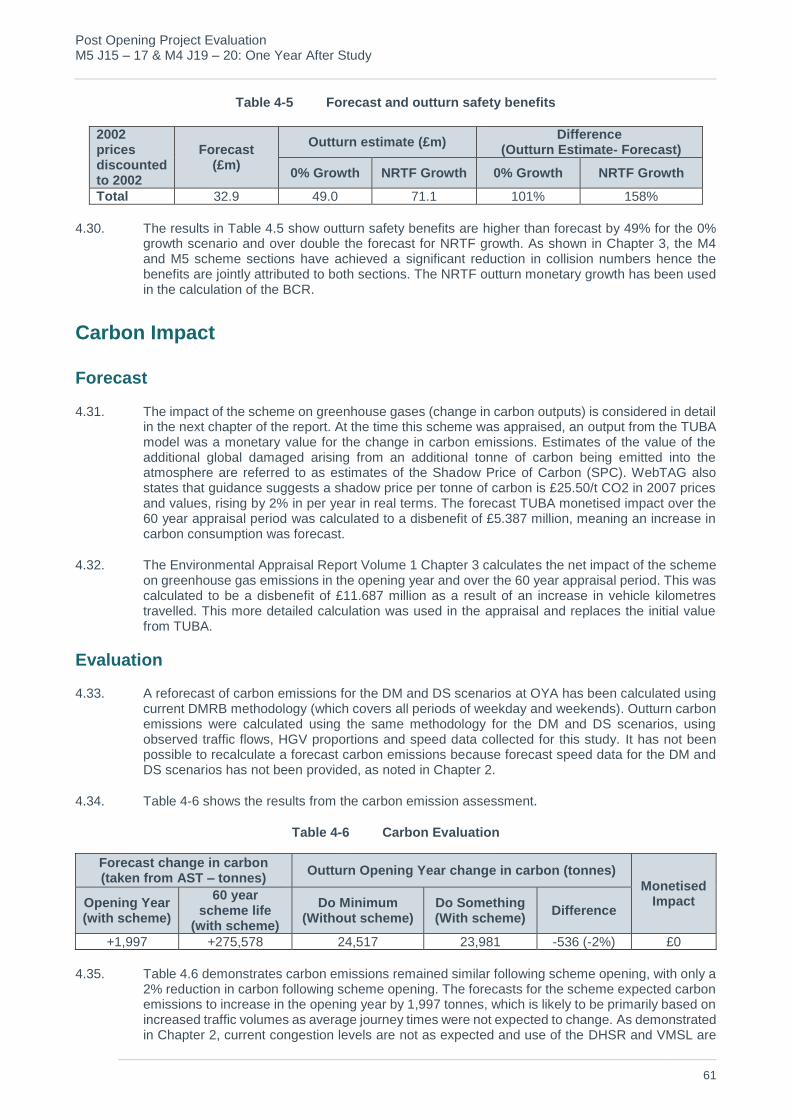
Post Opening Project Evaluation M5 J15 – 17 & M4 J19 – 20: One Year After Study
61
Table 4-5 Forecast and outturn safety benefits
2002 prices discounted to 2002
Forecast (£m)
Outturn estimate (£m) Difference
(Outturn Estimate- Forecast)
0% Growth NRTF Growth 0% Growth NRTF Growth
Total 32.9 49.0 71.1 101% 158%
4.30. The results in Table 4.5 show outturn safety benefits are higher than forecast by 49% for the 0% growth scenario and over double the forecast for NRTF growth. As shown in Chapter 3, the M4 and M5 scheme sections have achieved a significant reduction in collision numbers hence the benefits are jointly attributed to both sections. The NRTF outturn monetary growth has been used in the calculation of the BCR.
Carbon Impact
Forecast
4.31. The impact of the scheme on greenhouse gases (change in carbon outputs) is considered in detail in the next chapter of the report. At the time this scheme was appraised, an output from the TUBA model was a monetary value for the change in carbon emissions. Estimates of the value of the additional global damaged arising from an additional tonne of carbon being emitted into the atmosphere are referred to as estimates of the Shadow Price of Carbon (SPC). WebTAG also states that guidance suggests a shadow price per tonne of carbon is £25.50/t CO2 in 2007 prices and values, rising by 2% in per year in real terms. The forecast TUBA monetised impact over the 60 year appraisal period was calculated to a disbenefit of £5.387 million, meaning an increase in carbon consumption was forecast.
4.32. The Environmental Appraisal Report Volume 1 Chapter 3 calculates the net impact of the scheme on greenhouse gas emissions in the opening year and over the 60 year appraisal period. This was calculated to be a disbenefit of £11.687 million as a result of an increase in vehicle kilometres travelled. This more detailed calculation was used in the appraisal and replaces the initial value from TUBA.
Evaluation
4.33. A reforecast of carbon emissions for the DM and DS scenarios at OYA has been calculated using current DMRB methodology (which covers all periods of weekday and weekends). Outturn carbon emissions were calculated using the same methodology for the DM and DS scenarios, using observed traffic flows, HGV proportions and speed data collected for this study. It has not been possible to recalculate a forecast carbon emissions because forecast speed data for the DM and DS scenarios has not been provided, as noted in Chapter 2.
4.34. Table 4-6 shows the results from the carbon emission assessment.
Table 4-6 Carbon Evaluation
Forecast change in carbon (taken from AST – tonnes)
Outturn Opening Year change in carbon (tonnes)
Monetised Impact Opening Year
(with scheme)
60 year scheme life
(with scheme)
Do Minimum (Without scheme)
Do Something (With scheme)
Difference
+1,997 +275,578 24,517 23,981 -536 (-2%) £0
4.35. Table 4.6 demonstrates carbon emissions remained similar following scheme opening, with only a 2% reduction in carbon following scheme opening. The forecasts for the scheme expected carbon emissions to increase in the opening year by 1,997 tonnes, which is likely to be primarily based on increased traffic volumes as average journey times were not expected to change. As demonstrated in Chapter 2, current congestion levels are not as expected and use of the DHSR and VMSL are
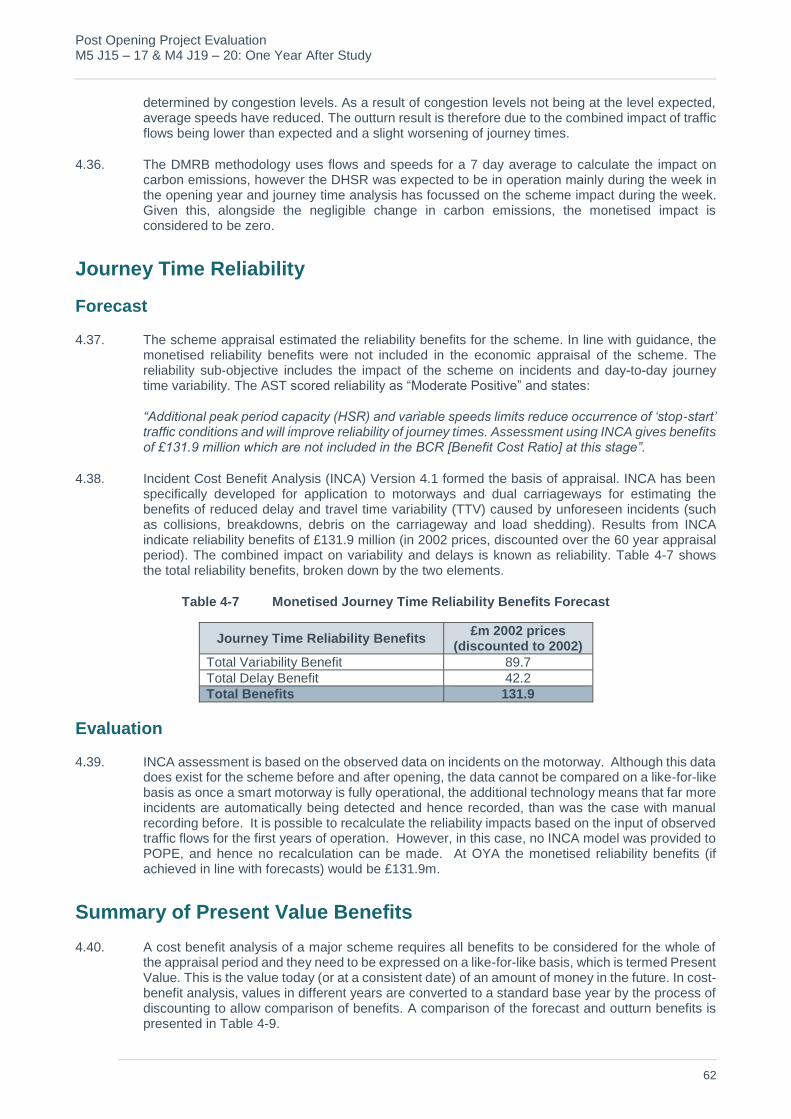
Post Opening Project Evaluation M5 J15 – 17 & M4 J19 – 20: One Year After Study
62
determined by congestion levels. As a result of congestion levels not being at the level expected, average speeds have reduced. The outturn result is therefore due to the combined impact of traffic flows being lower than expected and a slight worsening of journey times.
4.36. The DMRB methodology uses flows and speeds for a 7 day average to calculate the impact on carbon emissions, however the DHSR was expected to be in operation mainly during the week in the opening year and journey time analysis has focussed on the scheme impact during the week. Given this, alongside the negligible change in carbon emissions, the monetised impact is considered to be zero.
Journey Time Reliability
Forecast
4.37. The scheme appraisal estimated the reliability benefits for the scheme. In line with guidance, the monetised reliability benefits were not included in the economic appraisal of the scheme. The reliability sub-objective includes the impact of the scheme on incidents and day-to-day journey time variability. The AST scored reliability as “Moderate Positive” and states:
“Additional peak period capacity (HSR) and variable speeds limits reduce occurrence of ‘stop-start’ traffic conditions and will improve reliability of journey times. Assessment using INCA gives benefits of £131.9 million which are not included in the BCR [Benefit Cost Ratio] at this stage”.
4.38. Incident Cost Benefit Analysis (INCA) Version 4.1 formed the basis of appraisal. INCA has been specifically developed for application to motorways and dual carriageways for estimating the benefits of reduced delay and travel time variability (TTV) caused by unforeseen incidents (such as collisions, breakdowns, debris on the carriageway and load shedding). Results from INCA indicate reliability benefits of £131.9 million (in 2002 prices, discounted over the 60 year appraisal period). The combined impact on variability and delays is known as reliability. Table 4-7 shows the total reliability benefits, broken down by the two elements.
Table 4-7 Monetised Journey Time Reliability Benefits Forecast
Journey Time Reliability Benefits £m 2002 prices
(discounted to 2002)
Total Variability Benefit 89.7
Total Delay Benefit 42.2
Total Benefits 131.9
Evaluation
4.39. INCA assessment is based on the observed data on incidents on the motorway. Although this data does exist for the scheme before and after opening, the data cannot be compared on a like-for-like basis as once a smart motorway is fully operational, the additional technology means that far more incidents are automatically being detected and hence recorded, than was the case with manual recording before. It is possible to recalculate the reliability impacts based on the input of observed traffic flows for the first years of operation. However, in this case, no INCA model was provided to POPE, and hence no recalculation can be made. At OYA the monetised reliability benefits (if achieved in line with forecasts) would be £131.9m.
Summary of Present Value Benefits
4.40. A cost benefit analysis of a major scheme requires all benefits to be considered for the whole of the appraisal period and they need to be expressed on a like-for-like basis, which is termed Present Value. This is the value today (or at a consistent date) of an amount of money in the future. In cost-benefit analysis, values in different years are converted to a standard base year by the process of discounting to allow comparison of benefits. A comparison of the forecast and outturn benefits is presented in Table 4-9.

Post Opening Project Evaluation M5 J15 – 17 & M4 J19 – 20: One Year After Study
63
Table 4-8 Summary of Present Value Benefits
Benefit Stream
Benefits £m 2002 market prices, discounted to 2002
Forecast Outturn Estimate
Journey Times 591 n/a
Vehicle Operating Costs -22.6 0.13
Safety 32.9 71.1
Construction Delay and Maintenance -30.4 -30.4
Carbon Benefits -11.7 0
Noise Impact -0.02 -0.02
Total PVB 559.2 n/a
4.40.1. The outturn benefits presented in Table 4-9 have been calculated by capitalising the first year benefits to a 60 year benefit stream. Our evaluation has shown that congestion levels in this first year are not as substantial as forecast, and as DHSR schemes work best at times of higher congestion, a simple capitalisation approach, which may be applicable for traditional schemes, may not be applicable for DHSR, as benefits increase with congestion. As a result, the monetised impact of average journey times is not included in the economic evaluation of the scheme and is reported as “Not Applicable”.
4.40.2. It is therefore considered that a BCR based on first year results is not representable of benefits over the appraisal periods, hence it will not be reported here and is recorded as “Not Applicable”, but will be re-evaluated in the Five Year After (FYA) evaluation.
4.41. In addition, reliability is a key objective of this scheme and although not considered as part of the BCR, the monetary benefits of this outweigh the costs.
Indirect Tax Revenues Impact
Forecast
4.42. Indirect tax revenue is the expected change in tax revenue to the Government due to changes in the transport sector as a result of the scheme over the appraisal period. For the M4/M5 scheme, the forecast indirect tax impact is derived from increases in mvkm travelled as the Economic Assessment Report for carbon states:
“There is an overall increase in greenhouse gas emissions in the opening year and over the 60 year appraisal period due to a net increase in vehicle kilometres travelled”
4.43. This is also supported by the forecast change in traffic volumes shown in Chapter 2 of this report, which showed an increase in flows was expected following scheme opening leading to an increase in fuel consumption. A scheme may result in a change in fuel consumption due to the following reasons:
Changes in speeds resulting in greater or lesser fuel efficiency for same trips.
Changes in distance travelled
Increase road use through induced traffic or the reduction of trip suppression.

Post Opening Project Evaluation M5 J15 – 17 & M4 J19 – 20: One Year After Study
64
Evaluation
4.44. POPE would normally evaluate the impact of a scheme on fuel consumption by calculating the predicted change in fuel use based on forecast traffic flows and speed changes and calculating the outturn change in fuel use based on observed traffic flow and speed changes. The ratio between the forecast and observed change in fuel use is then applied to the monetised forecast impact on indirect tax revenues to demine an outturn impact. As noted in Chapter 2, details of the forecast impact of the scheme on journey times and speeds has not been made available to POPE, hence it has not been possible to calculate the predicted change in fuel use. Instead, the approach used to determine the outturn impact on indirect tax is based on the outturn impact of the scheme on VOC.
4.45. VOC impacts consists of fuel and non-fuel costs, with fuel the majority of the impact. As indirect tax impacts are also based on changes in fuel consumption, it is therefore considered that the impact of the scheme on VOC is reflective of the likely impact of the scheme on indirect tax. Table 4-4 earlier in this chapter showed the outturn impact of the scheme on VOC over a 60 year scheme life is £0.13 million compared to a forecast disbenefit of £22.6 million.
4.46. Table 4-9 shows the scheme was expected to increase tax revenue for the Government by £36.8 million over the 60 year appraisal period in comparison to the DM scenario. Based on the outturn impact of the scheme on VOC, the scheme has had little impact on indirect tax as traffic volumes are very similar before and after the scheme opened, with small changes in vehicle speeds observed following scheme opening.
Table 4-9 Indirect tax revenue impact as a cost (60 years)
£m 2002 market prices, discounted
Forecast Outturn Estimate
Change to indirect tax revenues
-£36.8 0
Scheme Costs
4.47. Costs of the scheme are also considered for the full appraisal period of 60 years such that they can be compared with the benefits over the same period. Investment costs are considered in terms of a common price base of 2002 for comparison with forecast. For comparison with the benefits, overall costs are expressed in terms of present value, termed Present Value Cost (PVC).
4.48. This section compares the forecast costs of the scheme as of the start of the construction period with the actual spend as of March 2015 (the date the cost was provided by the Regional Finance Manager). Costs are also considered for the full appraisal period of 60 years to allow comparison with the benefits over the same period. The full costs evaluated are made up of:
Investment Costs (which includes maintenance over the 60 year appraisal period).
Indirect Tax Revenues during the 60 years after opening.
Investment Costs
4.49. This section compares the forecast cost of the scheme with the outturn cost. Scheme costs include the cost to Highways England of constructing the scheme and purchasing land.
4.50. Forecast costs are taken from the Economic Assessment Report (April 2010). The outturn cost (obtained from the Highways England Regional Finance Manager) presented in Table 4-10 includes the cost of the scheme as of March 2015. The forecast investment cost of £62.62 million includes a maintenance cost of £5.73 million, which has been removed for the purpose of comparison with the outturn cost as the maintenance cost is likely to be different in the future.

Post Opening Project Evaluation M5 J15 – 17 & M4 J19 – 20: One Year After Study
65
Table 4-10 Investment Cost
Forecast Cost £m Outturn Cost Difference
56.5 (with maintenance cost removed) 63.2 11%
Note: these are 2002 prices not discounted
4.51. Table 4-10 show the outturn cost is £63.2 million which is 11% higher than the forecast cost (with maintenance removed).
Operation, Maintenance and Renewal Costs
4.52. After completion of the scheme, forecast additional costs over the appraisal period were expected to be incurred in the form of maintenance of infrastructure and equipment, the operations aspects of equipment spares, staff, enforcement, telecommunications etc. and renewals of infrastructure and equipment. These costs were calculated based on Highway Englands’ Operational Cost Model for managed motorway schemes. The forecast costs presented in Table 4-11 are taken from the EAR and cover the 60 year appraisal period.
Table 4-11 Forecast operation, maintenance and renewal costs
£m 2002 prices and values Forecast
Ongoing construction maintenance 5.73
Operating Costs 17.13
Total Operation, Maintenance and Renewal Costs 22.86
4.53. For the purpose of this evaluation it is assumed that these costs are almost entirely in the future and no evaluation of maintenance costs to date has been done. It is therefore assumed that the outturn operation, maintenance and renewal costs are the same as forecast.
Summary of Present Value Costs (PVC)
4.54. Cost benefit analysis of a major scheme requires all the costs to be considered for the whole of the appraisal period and they need to be expressed on a like-for-like basis with the benefits. This basis is termed Present Value. Present Value is the value today of an amount of money in the future. In cost-benefit analysis, values in differing years are converted to a standard base year by the process of discounting giving a present value.
4.55. The full PVC for this scheme at the time of appraisal comprised the followings costs converted to present value:
Investment costs;
Operating costs (including an allowance for maintenance);
Impact on Indirect Tax revenues during the scheme life.
4.56. A summary of the forecast and outturn PVC for this scheme are shown in Table 4-12. The result shows the outturn PVC based on recent guidance (with indirect tax as a benefit) is 2% less than forecast.

Post Opening Project Evaluation M5 J15 – 17 & M4 J19 – 20: One Year After Study
66
Table 4-12 Summary of PVC
£m 2002 prices and values Forecast Outturn
Investment Costs 56.5 54.7
Maintenance, Operating and Renewal Costs 22.9 22.9
Indirect Tax impact as a cost -36.8 0
Total PVC (as appraised including indirect tax impact)
42.6 77.6
Total PVC according to recent guidance 79.4 77.6
Benefit Cost Ratio (BCR)
4.57. The benefit cost ratio is used as an indicator of the overall value for money of the scheme. It compares the benefits (PVB) and costs (PVC) to calculate the present value. A BCR in excess of 1 means the value of benefits is greater than the costs, thus providing positive net benefits. At the time of appraisal, the impact of indirect tax was included as part of the costs, and as such is presented here within the costs section. However, current appraisal guidance includes the impact of indirect tax as part of the benefits of a scheme; therefore both methods are presented when calculating the BCR in Table 4-13.
4.58. It is noted that this is a One Year After evaluation and as referenced throughout this report, the forecast journey time benefits were expected to accrue in later years with an increase in congestion. DHSR Smart Motorway schemes only produce journey time benefits when congestion is high, however, as demonstrated congestion levels on the M4/M5 scheme are likely to be less than forecast at OYA due to the economic downturn. Consequently, OYA benefits are negative due to VMSL being applied extensively in first year during less congested conditions than expected. As a result, a BCR is not reported at OYA as benefits are expected to accrue as congestion increases in later years, however, this will be revisited at FYA.
4.59. Reliability benefits (totalling £131.9 million) were not included in the forecast BCR assessment. It is however noted that reliability benefits alone outweigh the cost and operation of the scheme over its lifetime and the scheme has also delivered a beneficial impact on safety.
Table 4-13 Benefit Cost Ratio (all monetary values in 2002 prices £m, discounted)
£m 2002 prices, discounted Forecast Outturn Estimate
Indirect tax in costs
Present Value Benefits (PVB) 559.2 n/a
Present Value Costs (PVC) 42.6 77.6
Benefit Cost Ratio 13.1 n/a
Indirect tax in benefits
Present Value Benefits (PVB) 595.9 n/a
Present Value Costs (PVC) 79.4 77.6
Benefit Cost Ratio (BCR) 7.5 n/a
4.60. The BCR ignores non-monetised impacts. In scheme appraisals, the impact of the scheme on wider objectives must be considered but not monetised. The evaluation of the environmental, accessibility and integration objectives are covered in the following sections.
Wider Economic Impacts
Forecast
4.61. The Wider Impact Report Stage 2 (October 2009) for the scheme states an Economic Impact Report (EIR) was not needed as the scheme was “not expected to have a significant impact on

Post Opening Project Evaluation M5 J15 – 17 & M4 J19 – 20: One Year After Study
67
proposed regeneration area”. The wider impacts of the scheme was therefore assessed based on WebTAG Unit 3.5.14 and Unit 2.8.
4.62. The AST scored the impact of the scheme on Wider Economic Impacts as “slight positive” reasoning:
“Additional user benefits for agglomeration (6% all user benefits), imperfectly competitive markets (6% of user benefits) and labour market impacts (2% all user benefits). Benefits not included in BCR as guidance is for consultation.”
4.63. The report based this assessment on the scheme being located in a Functional Urban Region and based on guidance in WebTAG Unit 2.8 agglomeration benefits are more significant in these areas. As a result, the appraisal expected the scheme to generate agglomeration benefits. In addition, the appraisal referred to evidence in the Eddington Report, although it was noted this report pre-dated WebTAG Unit 2.8. Based on the Eddington Report, wider economic impacts (including competitive markets, agglomeration impacts and labour market effects) can be assessed based on TEE benefits. The report concluded by stating “the range in potential impacts indicates additional economic benefits will be between 10% and 15% of user benefits”.
Evaluation
4.64. Chapter 2 showed journey times have increased since the scheme opened by up to 48 seconds (PM Peak from M5 to M4). Using a similar approach to the appraisal by basing the impact of the scheme on the wider economy from the journey time impact suggests the scheme is unlikely to have a positive impact on the wider economy. Consequently, the EST is scored as “neutral”, worse than the “slight positive” expected.
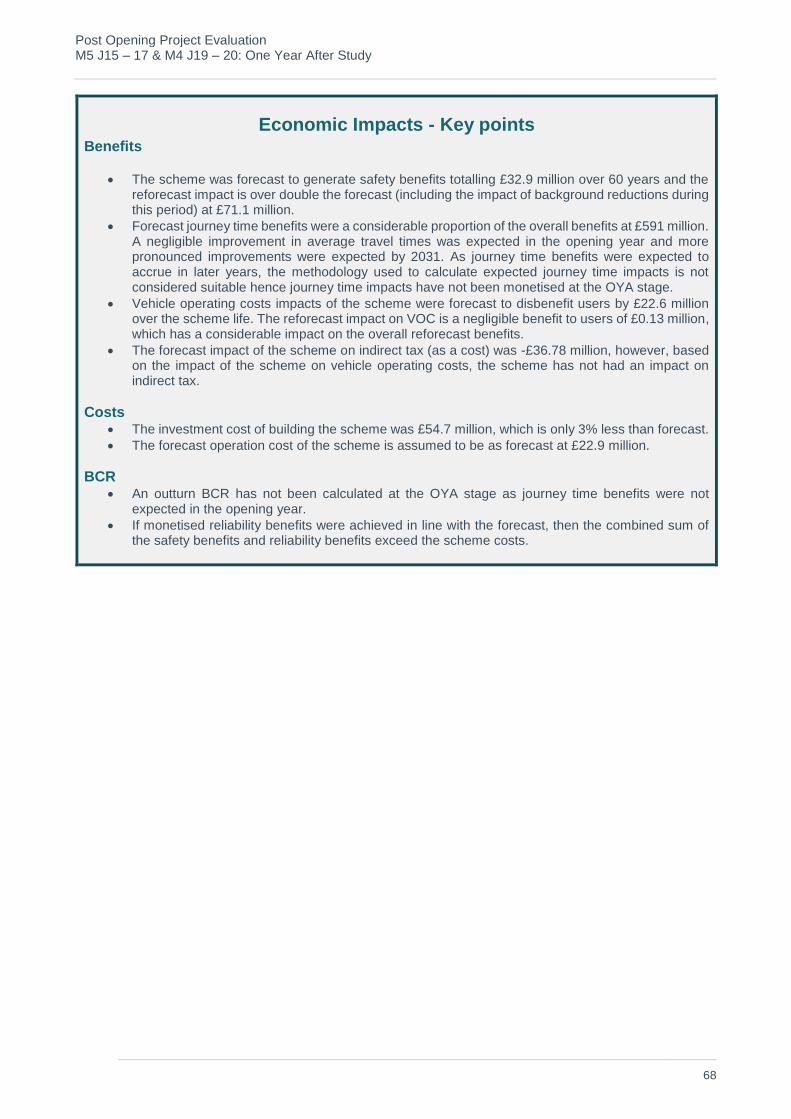
Post Opening Project Evaluation M5 J15 – 17 & M4 J19 – 20: One Year After Study
68
Economic Impacts - Key points Benefits
The scheme was forecast to generate safety benefits totalling £32.9 million over 60 years and thereforecast impact is over double the forecast (including the impact of background reductions duringthis period) at £71.1 million.
Forecast journey time benefits were a considerable proportion of the overall benefits at £591 million.A negligible improvement in average travel times was expected in the opening year and morepronounced improvements were expected by 2031. As journey time benefits were expected toaccrue in later years, the methodology used to calculate expected journey time impacts is notconsidered suitable hence journey time impacts have not been monetised at the OYA stage.
Vehicle operating costs impacts of the scheme were forecast to disbenefit users by £22.6 millionover the scheme life. The reforecast impact on VOC is a negligible benefit to users of £0.13 million,which has a considerable impact on the overall reforecast benefits.
The forecast impact of the scheme on indirect tax (as a cost) was -£36.78 million, however, basedon the impact of the scheme on vehicle operating costs, the scheme has not had an impact onindirect tax.
Costs The investment cost of building the scheme was £54.7 million, which is only 3% less than forecast.
The forecast operation cost of the scheme is assumed to be as forecast at £22.9 million.
BCR An outturn BCR has not been calculated at the OYA stage as journey time benefits were not
expected in the opening year.
If monetised reliability benefits were achieved in line with the forecast, then the combined sum ofthe safety benefits and reliability benefits exceed the scheme costs.

Post Opening Project Evaluation M5 J15 – 17 & M4 J19 – 20: One Year After Study
69
5. Environment Evaluation
Introduction
5.1. This section documents the evaluation of the impacts of the scheme on the environmental sub-objectives.
5.2. The Environment Assessment Report (EAR) noted that the objective for the scheme was to relieve congestion and improve journey time reliability by implementing a Managed Motorway solution, which would include the use of hard shoulder running within the existing Highways Operational Area.
Data Collection
5.3. The following documents have been used in the environmental evaluation part of this study:
Appraisal Summary Table (AST), January 2010;
Environmental Appraisal Report (EAR) Volumes 1, 2 and 3, November 2009;
EAR Volume 2 Appendices, June 2010;
Project Management Plan - Construction Environmental Management Plan, April 2012
As Built drawings, Series 3000 Planting Mitigation, Series 500 Drainage Layout, Series100 General Arrangement, December 2013;
M4 J19-20 and M5 J15-17 Managed Motorways Start of Works Exhibition Boards -November 2011.
5.4. A full list of the background information requested and received to help with the compilation of this report is included in Appendix B.
Site Inspections
5.5. A site visit was undertaken in June 2015. Photomontages were available in the EAR Volume 2 Appendices and selected views have been used in this report. Appendix C shows the comparison of photographs before the scheme with those taken at OYA. Key locations referred to in this report are shown in Figure 5-1.
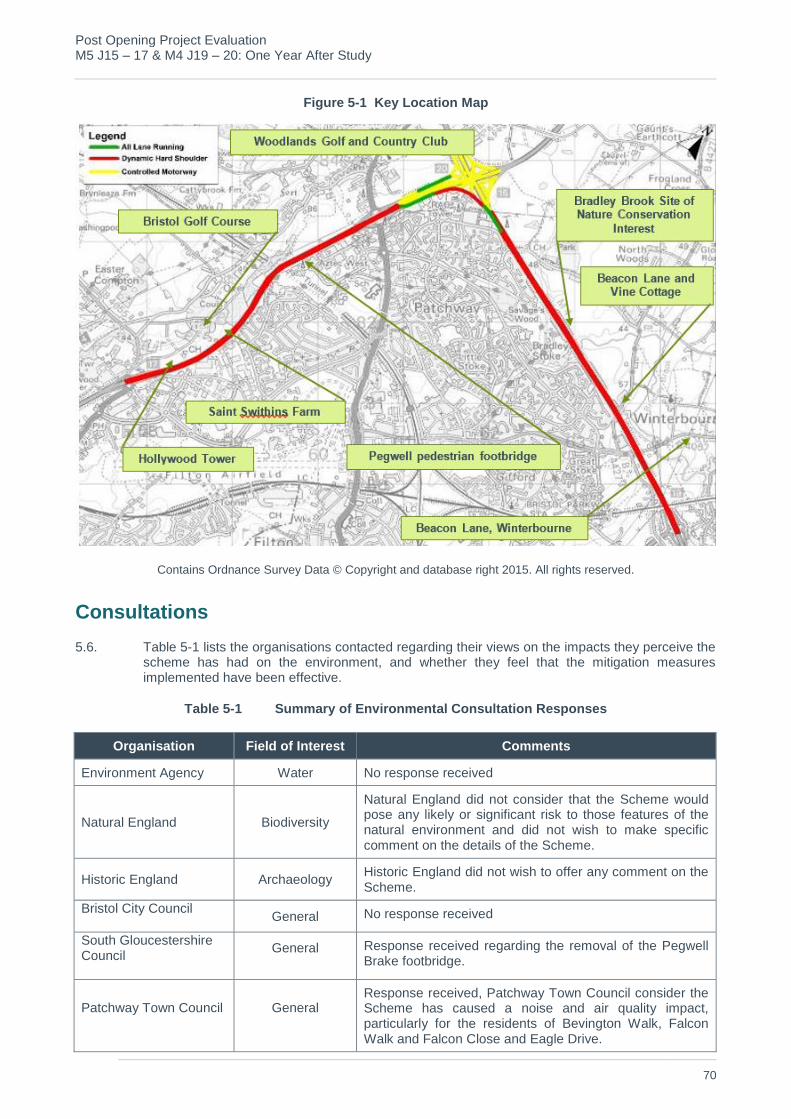
Post Opening Project Evaluation M5 J15 – 17 & M4 J19 – 20: One Year After Study
70
Figure 5-1 Key Location Map
Contains Ordnance Survey Data © Copyright and database right 2015. All rights reserved.
Consultations
5.6. Table 5-1 lists the organisations contacted regarding their views on the impacts they perceive the scheme has had on the environment, and whether they feel that the mitigation measures implemented have been effective.
Table 5-1 Summary of Environmental Consultation Responses
Organisation Field of Interest Comments
Environment Agency Water No response received
Natural England Biodiversity
Natural England did not consider that the Scheme would pose any likely or significant risk to those features of the natural environment and did not wish to make specific comment on the details of the Scheme.
Historic England Archaeology Historic England did not wish to offer any comment on the Scheme.
Bristol City Council General No response received
South Gloucestershire Council
General Response received regarding the removal of the Pegwell Brake footbridge.
Patchway Town Council General Response received, Patchway Town Council consider the Scheme has caused a noise and air quality impact, particularly for the residents of Bevington Walk, Falcon Walk and Falcon Close and Eagle Drive.
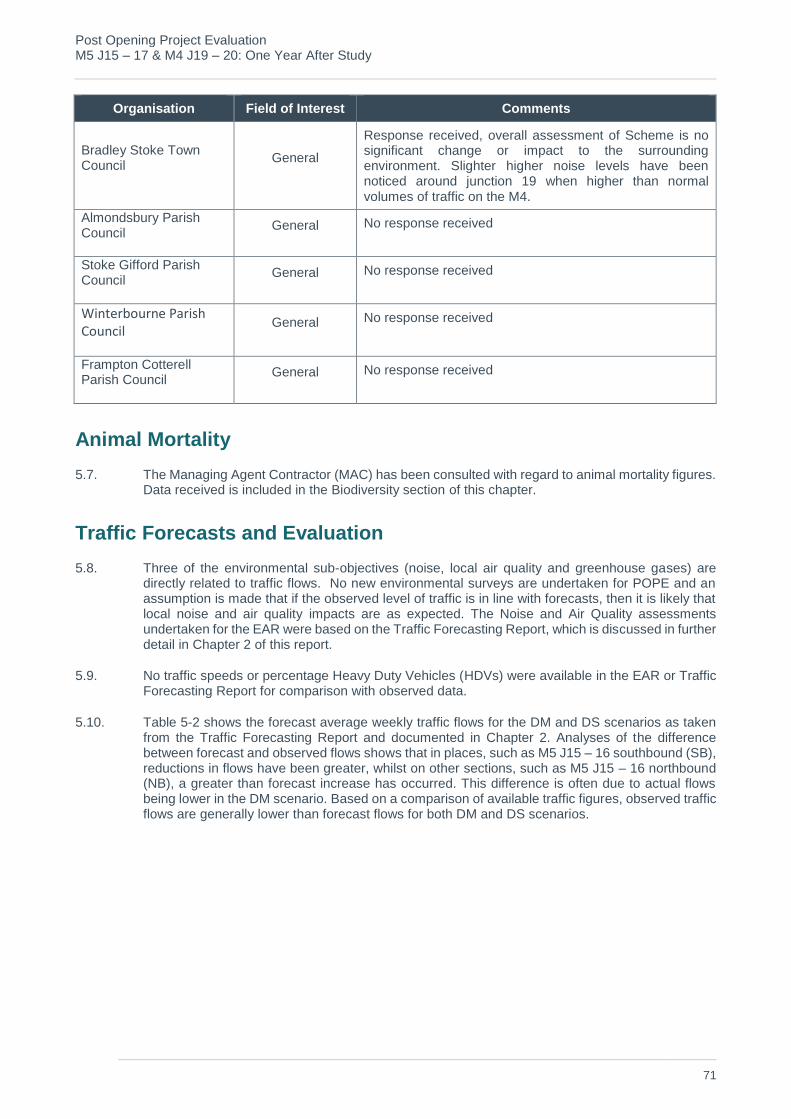
Post Opening Project Evaluation M5 J15 – 17 & M4 J19 – 20: One Year After Study
71
Organisation Field of Interest Comments
Bradley Stoke Town Council
General
Response received, overall assessment of Scheme is no significant change or impact to the surrounding environment. Slighter higher noise levels have been noticed around junction 19 when higher than normal volumes of traffic on the M4.
Almondsbury Parish Council
General No response received
Stoke Gifford Parish Council
General No response received
Winterbourne Parish Council
General No response received
Frampton Cotterell Parish Council
General No response received
Animal Mortality
5.7. The Managing Agent Contractor (MAC) has been consulted with regard to animal mortality figures. Data received is included in the Biodiversity section of this chapter.
Traffic Forecasts and Evaluation
5.8. Three of the environmental sub-objectives (noise, local air quality and greenhouse gases) are directly related to traffic flows. No new environmental surveys are undertaken for POPE and an assumption is made that if the observed level of traffic is in line with forecasts, then it is likely that local noise and air quality impacts are as expected. The Noise and Air Quality assessments undertaken for the EAR were based on the Traffic Forecasting Report, which is discussed in further detail in Chapter 2 of this report.
5.9. No traffic speeds or percentage Heavy Duty Vehicles (HDVs) were available in the EAR or Traffic Forecasting Report for comparison with observed data.
5.10. Table 5-2 shows the forecast average weekly traffic flows for the DM and DS scenarios as taken from the Traffic Forecasting Report and documented in Chapter 2. Analyses of the difference between forecast and observed flows shows that in places, such as M5 J15 – 16 southbound (SB), reductions in flows have been greater, whilst on other sections, such as M5 J15 – 16 northbound (NB), a greater than forecast increase has occurred. This difference is often due to actual flows being lower in the DM scenario. Based on a comparison of available traffic figures, observed traffic flows are generally lower than forecast flows for both DM and DS scenarios.

Post Opening Project Evaluation M5 J15 – 17 & M4 J19 – 20: One Year After Study
72
Table 5-2 Forecast AWT vs. Observed AWT
* Traffic Forecasting Report assumed opening year as 2016, however, as noted in Chapter 2 forecast traffic figures have been adjustedto a 2014 opening year using factors obtained from TEMPRO.
Noise
Forecast
AST
5.11. The AST stated that the predictions of traffic noise showed that all changes in noise at residential properties within 600m of the scheme would be neutral, and therefore no mitigation for noise would be required. The AST confirmed that there would be both slight adverse and slight beneficial noise effects in parts of the wider road network, due to the scheme re-distributing traffic on existing routes.
Environment Assessment Report
5.12. The EAR noted that predictions of traffic noise, based on the output of the traffic model showed that predicted changes in noise at residential properties within 600m of the scheme would be neutral, and therefore no mitigation for noise would be required.
5.13. Additionally, there would be both slight adverse and slight beneficial noise effects in parts of the wider road network due to the scheme re-distributing traffic on existing routes.
Tim
e P
eri
od
Lo
cati
on
Dir
ecti
on
Forecast Observed
Fo
reca
st
DS
-
Ob
serv
ed
DS
Dif
fere
nc
e
% D
iffe
ren
ce
DM
20
11 *
DS
2015 *
% D
iffe
ren
ce
DM
20
11
DS
2015
% D
iffe
ren
ce
AM Peak
(08:00 - 09:00)
M4 J19-20
EB 6,300 6,700 6% 4,750 4,550 -4% -2,150 -32%
M4 J19-20
WB 6,000 6,980 16% 4,320 4,360 1% -2,620 -38%
M5 J15-16
NB 4,840 5,460 13% 3,580 5,290 48% -170 -3%
M5 J15-16
SB 6,040 5,190 -14% 5,110 3,550 -
31% -1,640 -32%
M5 J16-17
NB 5,630 6,090 8% 4,110 4,160 1% -1,930 -32%
M5 J16-17
SB 5,650 6,340 12% 3,620 3,860 7% -2,480 -39%
PM Peak
(16:00 - 17:00)
M4 J19-20
EB 5,910 6,500 10% 4,980 4,980 0% -1,520 -23%
M4 J19-20
WB 5,810 6,210 7% 5,080 5,160 2% -1,050 -17%
M5 J15-16
NB 4,570 5,850 28% 5,100 4,420 -
13% -1,430 -24%
M5 J15-16
SB 4,810 3,920 -19% 4,430 5,160 16% 1,240 32%
M5 J16-17
NB 4,840 5,610 16% 4,410 4,680 6% -920 -16%
M5 J16-17
SB 4,930 5,070 3% 4,540 4,400 -3% -670 -13%

Post Opening Project Evaluation M5 J15 – 17 & M4 J19 – 20: One Year After Study
73
5.14. Details of existing noise mitigation were listed in the EAR and included the following as also detailed in Table 5-3:
Barrier on top of earth bunding between Trench Lane and M4 (outside highway boundary);
Bund between Stanley Mead/Ormonds Close Footpath and M4 (outside highwayboundary);
Barrier on top of earth bunding between Juniper Way/Fennel Drive and M4;
Bund between Palmers Leaze and M4;
Barrier Chillington Court / Blakeney Road adjacent M5 (outside highway boundary);
Bund Bevington Walk / Falcon Walk / Falcon Close adjacent M5.
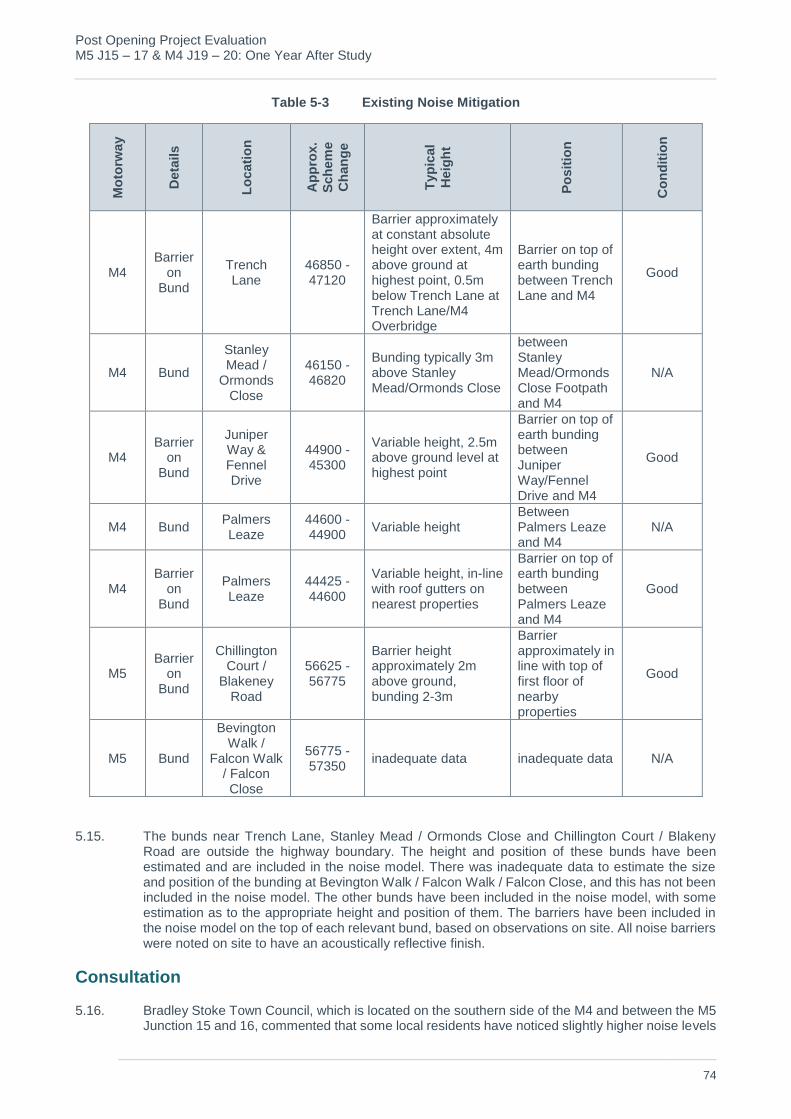
Post Opening Project Evaluation M5 J15 – 17 & M4 J19 – 20: One Year After Study
74
Table 5-3 Existing Noise Mitigation M
oto
rway
Deta
ils
Lo
cati
on
Ap
pro
x.
Sch
em
e
Ch
an
ge
Typ
ical
Heig
ht
Po
sit
ion
Co
nd
itio
n
M4 Barrier
on Bund
Trench Lane
46850 - 47120
Barrier approximately at constant absolute height over extent, 4m above ground at highest point, 0.5m below Trench Lane at Trench Lane/M4 Overbridge
Barrier on top of earth bunding between Trench Lane and M4
Good
M4 Bund
Stanley Mead /
Ormonds Close
46150 - 46820
Bunding typically 3m above Stanley Mead/Ormonds Close
between Stanley Mead/Ormonds Close Footpath and M4
N/A
M4 Barrier
on Bund
Juniper Way & Fennel Drive
44900 - 45300
Variable height, 2.5m above ground level at highest point
Barrier on top of earth bunding between Juniper Way/Fennel Drive and M4
Good
M4 Bund Palmers Leaze
44600 - 44900
Variable height Between Palmers Leaze and M4
N/A
M4 Barrier
on Bund
Palmers Leaze
44425 - 44600
Variable height, in-line with roof gutters on nearest properties
Barrier on top of earth bunding between Palmers Leaze and M4
Good
M5 Barrier
on Bund
Chillington Court /
Blakeney Road
56625 - 56775
Barrier height approximately 2m above ground, bunding 2-3m
Barrier approximately in line with top of first floor of nearby properties
Good
M5 Bund
Bevington Walk /
Falcon Walk / Falcon Close
56775 - 57350
inadequate data inadequate data N/A
5.15. The bunds near Trench Lane, Stanley Mead / Ormonds Close and Chillington Court / Blakeny Road are outside the highway boundary. The height and position of these bunds have been estimated and are included in the noise model. There was inadequate data to estimate the size and position of the bunding at Bevington Walk / Falcon Walk / Falcon Close, and this has not been included in the noise model. The other bunds have been included in the noise model, with some estimation as to the appropriate height and position of them. The barriers have been included in the noise model on the top of each relevant bund, based on observations on site. All noise barriers were noted on site to have an acoustically reflective finish.
Consultation
5.16. Bradley Stoke Town Council, which is located on the southern side of the M4 and between the M5 Junction 15 and 16, commented that some local residents have noticed slightly higher noise levels

Post Opening Project Evaluation M5 J15 – 17 & M4 J19 – 20: One Year After Study
75
around Junction 19, only when higher than normal volumes of traffic occur on the motorway and this can be exacerbated if the wind direction is from the east.
5.17. Patchway Town Council, which is located on the southern side of the M5 between Junction 16 and 17, commented that an acoustic fence has been installed by Highways England after the intervention of their Member of Parliament, following a long campaign by local people and the Council. The acoustic fence is located along the M5 by Falcon Close, which does reduce noise to those properties on Falcon Close, but it does not cover properties on Falcon Walk and Bevington Walk, which are located very close to the M5.
5.18. When the motorway was first constructed in the 1960s, Northavon District Council constructed an earth bund alongside the motorway as housing was constructed very close to its length. In the intervening years, the bund has settled and sunk in height so it no longer provides the intended protection to residents in Bevington Walk, Falcon Close, Falcon Walk and Eagle Drive. Residents of these roads report that noise is dependent on the wind direction and have requested the motorway is resurfaced with low-noise surfacing and more acoustic fences are erected to protect all properties close to the motorway.
5.19. Patchway Town Council also commented that as a result of the installation of the concrete central barrier noise generated from the motorway reflects off the barrier into Patchway rather than dispersing across the valley towards the Severn Valley.
Evaluation
5.20. The Start of Works Exhibition Boards produced by Highways England in November 2011 mention low noise surfacing will be installed along the length of the scheme. It is understood that limited resurfacing was undertaken as part of the works, as existing road surfacings were of appropriate low noise quality.
5.21. POPE environment methodology for assessment allows for a variation in traffic flows of 25% more or 20% less when compared with what was originally forecast in a particular year, which would allow for the assumption that the local noise impact is likely to be either ‘worse than’ or ‘better than’ expected.
5.22. The traffic figures in Table 5-2 show that observed traffic flows are lower than forecast traffic flows by an average of 18%. Local noise impacts as a result of the scheme are therefore better than expected.
5.23. Based on traffic flows in Table 5-2 it is considered likely that the road traffic noise levels are quieter than forecast during the AM peak period due to the reduced traffic flows that were observed. The difference between the forecast and observed flows is more variable for the PM peak period, with road traffic noise levels higher on some traffic links and lower on others.
5.24. As per the Design Manual for Roads and Bridges, Volume 11, Section 3, Part 7 - Noise and Vibration (2011), median concrete barriers less than 1.5m above the road surface offer negligible reflection and screening effects. The concrete central barrier along the M5 that Patchway Town Council commented on is less than 1.5m above the road surface and therefore any additional noise generation as a result of the scheme is considered negligible.
Table 5-4 Summary of Noise Evaluation
Origin of Assessment
Summary of Predicted Impacts Assessment
AST
The predictions of traffic noise impacts showed that all changes in noise at residential properties within 600m of the scheme would be neutral, and therefore no mitigation for noise would be required. There would be both slight adverse and slight beneficial noise effects in parts of the wider road
No change in number of people annoyed. Disbenefit NPV16 of -£20,500
16 Net Present Value

Post Opening Project Evaluation M5 J15 – 17 & M4 J19 – 20: One Year After Study
76
network, due to the scheme re-distributing of traffic on existing routes.
EST
The traffic figures show observed flows are an average of 18% lower than forecast flows across the scheme. This has resulted in an overall lower than expected local noise impacts as a result of the scheme.
Better than expected at OYA
Local Air Quality
Forecast
AST
5.25. The AST stated that there would be a greater number of properties with an improvement or no change in local air quality, than deterioration. The majority of properties in the study area would have a small change in concentrations (between -1 and 1 μg/m³)17. The positive assessment score was due to an increase of up to 4 μg/m³ at around 1,200 properties due to a change in direction of the HDV routing on Avon Ring Road/A431.
5.26. The AST confirmed that there would be new exceedances within the Bristol City priority Air Quality Management Area (AQMA). For Nitrogen Dioxide (NO2), there would be an increase above 2 μg/m³ where the annual mean was greater than 40 μg/m³. For particulate matter (PM10), there would be no increases above 1 μg/m³.
Environment Assessment Report
5.27. The EAR stated that there was one AQMA in the study area (Bristol City AQMA) which is in the wider network and one proposed AQMA at M5 J17 Cribbs Causeway, which is within the scheme corridor (Cribbs Causeway AQMA declared in 2010 for property on Blackhorse Hill in Easter Compton for NO2). It was further noted that whilst there would be no land take as a result of the scheme, the effective carriageway would move closer to receptors with the scheme in place.
5.28. The impact of the scheme on local air quality was assessed to be neutral in the affected road network area and beneficial in the wider Bristol City AQMA area with a predicted overall reduction in the number of properties with potential exceedances of the EU Annual Limit Value for NO2.
Consultation
5.29. Bradley Stoke Town Council commented that no adverse reports have been received from air quality monitors sited around the town. The monitors are operated by South Gloucestershire Council.
5.30. Patchway Town Council commented that pollution has increased with the motorway traffic and as a result of the installation of the concrete central barrier pollution reflects off the barrier into Patchway rather than dispersing across the valley towards the Severn Valley.
Evaluation
5.31. POPE Environmental methodology for assessment allows for variation in traffic flows of more than +/- 10% Annual Average Daily Traffic when compared with what was originally forecast in a particular year, which assumes that local air quality is likely to be either ‘worse than’ or ‘better than’ expected.
5.32. The traffic figures in Table 5-2 show that observed AWT traffic flows are lower than forecast AWT traffic flows by an average of 18%. Local air quality impacts as a result of the scheme are therefore better than expected.
17 Micrograms per cubic meter
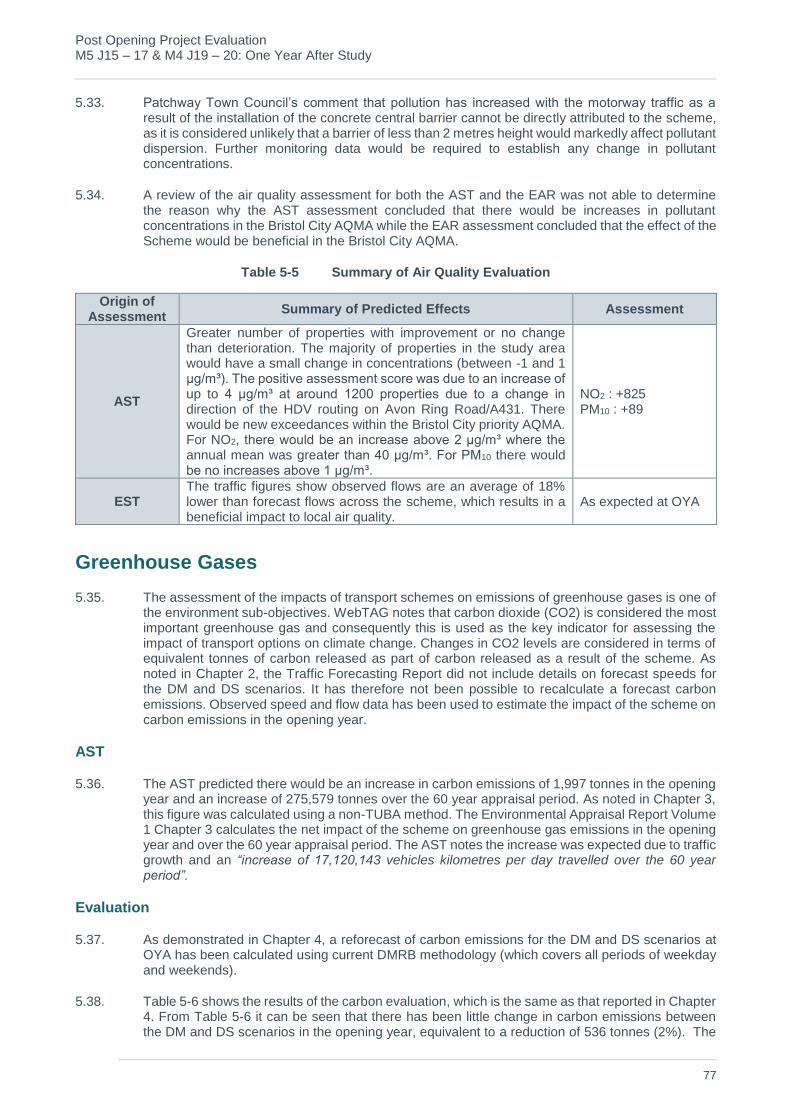
Post Opening Project Evaluation M5 J15 – 17 & M4 J19 – 20: One Year After Study
77
5.33. Patchway Town Council’s comment that pollution has increased with the motorway traffic as a result of the installation of the concrete central barrier cannot be directly attributed to the scheme, as it is considered unlikely that a barrier of less than 2 metres height would markedly affect pollutant dispersion. Further monitoring data would be required to establish any change in pollutant concentrations.
5.34. A review of the air quality assessment for both the AST and the EAR was not able to determine the reason why the AST assessment concluded that there would be increases in pollutant concentrations in the Bristol City AQMA while the EAR assessment concluded that the effect of the Scheme would be beneficial in the Bristol City AQMA.
Table 5-5 Summary of Air Quality Evaluation
Origin of Assessment
Summary of Predicted Effects Assessment
AST
Greater number of properties with improvement or no change than deterioration. The majority of properties in the study area would have a small change in concentrations (between -1 and 1 μg/m³). The positive assessment score was due to an increase of up to 4 μg/m³ at around 1200 properties due to a change in direction of the HDV routing on Avon Ring Road/A431. There would be new exceedances within the Bristol City priority AQMA. For NO2, there would be an increase above 2 μg/m³ where the annual mean was greater than 40 μg/m³. For PM10 there would be no increases above 1 μg/m³.
NO2 : +825 PM10 : +89
EST The traffic figures show observed flows are an average of 18% lower than forecast flows across the scheme, which results in a beneficial impact to local air quality.
As expected at OYA
Greenhouse Gases
5.35. The assessment of the impacts of transport schemes on emissions of greenhouse gases is one of the environment sub-objectives. WebTAG notes that carbon dioxide (CO2) is considered the most important greenhouse gas and consequently this is used as the key indicator for assessing the impact of transport options on climate change. Changes in CO2 levels are considered in terms of equivalent tonnes of carbon released as part of carbon released as a result of the scheme. As noted in Chapter 2, the Traffic Forecasting Report did not include details on forecast speeds for the DM and DS scenarios. It has therefore not been possible to recalculate a forecast carbon emissions. Observed speed and flow data has been used to estimate the impact of the scheme on carbon emissions in the opening year.
AST
5.36. The AST predicted there would be an increase in carbon emissions of 1,997 tonnes in the opening year and an increase of 275,579 tonnes over the 60 year appraisal period. As noted in Chapter 3, this figure was calculated using a non-TUBA method. The Environmental Appraisal Report Volume 1 Chapter 3 calculates the net impact of the scheme on greenhouse gas emissions in the opening year and over the 60 year appraisal period. The AST notes the increase was expected due to traffic growth and an “increase of 17,120,143 vehicles kilometres per day travelled over the 60 year period”.
Evaluation
5.37. As demonstrated in Chapter 4, a reforecast of carbon emissions for the DM and DS scenarios at OYA has been calculated using current DMRB methodology (which covers all periods of weekday and weekends).
5.38. Table 5-6 shows the results of the carbon evaluation, which is the same as that reported in Chapter 4. From Table 5-6 it can be seen that there has been little change in carbon emissions betweenthe DM and DS scenarios in the opening year, equivalent to a reduction of 536 tonnes (2%). The
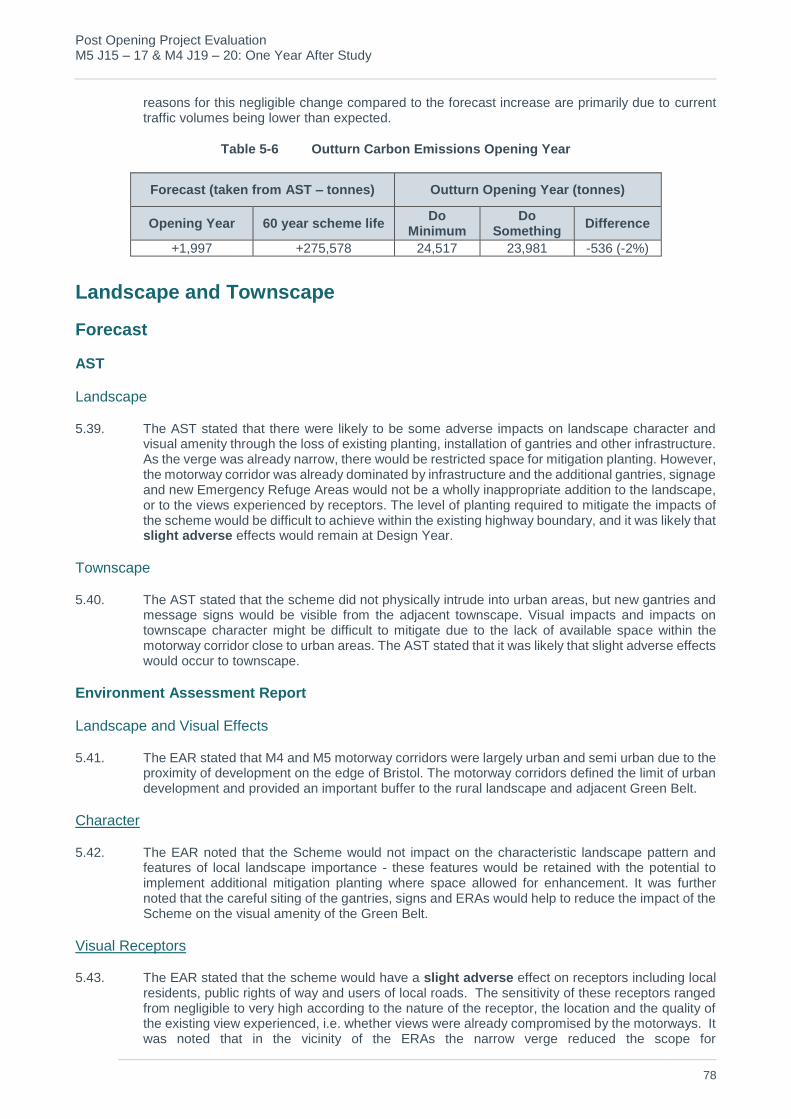
Post Opening Project Evaluation M5 J15 – 17 & M4 J19 – 20: One Year After Study
78
reasons for this negligible change compared to the forecast increase are primarily due to current traffic volumes being lower than expected.
Table 5-6 Outturn Carbon Emissions Opening Year
Forecast (taken from AST – tonnes) Outturn Opening Year (tonnes)
Opening Year 60 year scheme life Do
Minimum Do
Something Difference
+1,997 +275,578 24,517 23,981 -536 (-2%)
Landscape and Townscape
Forecast
AST
Landscape
5.39. The AST stated that there were likely to be some adverse impacts on landscape character and visual amenity through the loss of existing planting, installation of gantries and other infrastructure. As the verge was already narrow, there would be restricted space for mitigation planting. However, the motorway corridor was already dominated by infrastructure and the additional gantries, signage and new Emergency Refuge Areas would not be a wholly inappropriate addition to the landscape, or to the views experienced by receptors. The level of planting required to mitigate the impacts of the scheme would be difficult to achieve within the existing highway boundary, and it was likely that slight adverse effects would remain at Design Year.
Townscape
5.40. The AST stated that the scheme did not physically intrude into urban areas, but new gantries and message signs would be visible from the adjacent townscape. Visual impacts and impacts on townscape character might be difficult to mitigate due to the lack of available space within the motorway corridor close to urban areas. The AST stated that it was likely that slight adverse effects would occur to townscape.
Environment Assessment Report
Landscape and Visual Effects
5.41. The EAR stated that M4 and M5 motorway corridors were largely urban and semi urban due to the proximity of development on the edge of Bristol. The motorway corridors defined the limit of urban development and provided an important buffer to the rural landscape and adjacent Green Belt.
Character
5.42. The EAR noted that the Scheme would not impact on the characteristic landscape pattern and features of local landscape importance - these features would be retained with the potential to implement additional mitigation planting where space allowed for enhancement. It was further noted that the careful siting of the gantries, signs and ERAs would help to reduce the impact of the Scheme on the visual amenity of the Green Belt.
Visual Receptors
5.43. The EAR stated that the scheme would have a slight adverse effect on receptors including local residents, public rights of way and users of local roads. The sensitivity of these receptors ranged from negligible to very high according to the nature of the receptor, the location and the quality of the existing view experienced, i.e. whether views were already compromised by the motorways. It was noted that in the vicinity of the ERAs the narrow verge reduced the scope for

Post Opening Project Evaluation M5 J15 – 17 & M4 J19 – 20: One Year After Study
79
replacement/screen planting with the result that the potential to mitigate the effect on views in most cases was only partial.
Visual Effects
5.44. The EAR confirmed that there would be a negligible impact on views from close residential receptors at Bradley Stoke, Patchway and the new Hortham Village housing development due to the screening provided by intervening vegetation and topography.
Lighting
5.45. The EAR noted that there was an existing high level of lighting in adjacent urban areas. Existing motorway lighting was located within the central reserve throughout the affected length of the M4 and on the M5 north of J16. On the M5 south of J16, lighting was located in verges. Existing lighting, with column heights of 12m and 15m, would be retained, with localised adjustments to accommodate ERAs, and the possible introduction of low level lighting at these locations.
Night Time Effects
5.46. It was expected that additional fixed signage would not significantly increase the level of light spillage that resulted from the lit sections of motorway. It was noted that variable messaging signage on the hard shoulder running gantries might slightly increase levels of light spillage but would not be constant as the signage would not be in constant usage.
5.47. The EAR confirmed that there might be additional light spillage from lighting specifically associated with the ERAs and in opening up additional views of traffic head and tail lights. However, the additional ERA lighting would be motion sensitive as vehicles enter and leave the ERA. Consequently the change in the perceived light pollution was considered to be minor adverse, resulting in a slight adverse effect.
Overall Predictions of Effects
5.48. The EAR stated that the scheme would not substantially increase the overall adverse impact of the existing motorway on most existing receptors. It did note however, that there would be an increase in adverse impact on some receptors, largely as the result of vegetation clearance with limited scope for replacement mitigation planting due to the narrow verge, particularly in the vicinity of ERAs. Overall the scheme would have a slight adverse significance of effect on landscape and visual amenity.
Townscape
1.1. The EAR did not identify significant effects on townscape with minor changes to scale due to increased numbers of gantries, MS4 and AMI5 signs noted and slight changes to the cut slopes / embankments for ERAs and MAPs6 predicted.
Consultation
5.49. Bradley Stoke Town Council commented that the scheme has not had a significant impact upon the local landscape. The area along the M5 between Junction 15 and 16 is mainly bordered by commerce and light industry and thus has little impact on residential and amenity areas. The M4 between Junction 19 and 20 with the existing landscaping of high earthen banks continue to fairly successfully mitigate any further visual impact to the areas immediately abutting the motorway following the inception of the scheme.
Evaluation
Landscape and Visual Effects
5.50. The M4 / M5 motorway interchange and junctions dominate the landscape of the study area. The Scheme has introduced new vertical elements into the landscape, in the form of gantries, lighting and message signs. Where the motorways are in cutting the impacts of the scheme are limited,

Post Opening Project Evaluation M5 J15 – 17 & M4 J19 – 20: One Year After Study
80
but in more open landscapes these new introduced elements are much more visible and as expected make the motorways a more prominent feature in the landscape.
5.51. A review of the locations of gantries illustrated on the Series 100 General Arrangement As Built drawings show they are in the same location as those identified on site. No details of additional mitigation planting was identified during the site visit. Mitigation planting identified on site is as per the Series 3000 As Built Planting Mitigation drawings.
5.52. Figure 5-2 below illustrates the new gantries and signage installed as part of the Scheme along the M5 from the upgraded pedestrian footbridge at Pegwell. As the M4 / M5 was already lit throughout the extent of the scheme, the effect of the additional lighting associated with the ERAs is as expected.
Figure 5-2 New signage and gantries from pedestrian footbridge at Pegwell
5.53. Figure 5-3 below illustrates a view of the scheme from the Bristol Golf Course and Green Belt. As can be seen, the existing earth bund effectively screens the Scheme from the golf course.

Post Opening Project Evaluation M5 J15 – 17 & M4 J19 – 20: One Year After Study
81
Figure 5-3 View from Bristol Golf Course and Green Belt
5.54. Figure 5-4 below illustrates a view from Beacon Lane towards the M4 and Vine Cottage. Prior to the scheme, Vine Cottage had a view of an existing portal gantry located adjacent of the property (Figure 5-5 below) which was removed for the installation of the new gantry located further away from the property. The new gantry and signage can be seen from Vine Cottage highlighting the impact of the scheme upon the surrounding landscape and visual amenity.
Figure 5-4 View of M4 and Vine Cottage from Beacon Lane and Green Belt
Top of gantry on M5

Post Opening Project Evaluation M5 J15 – 17 & M4 J19 – 20: One Year After Study
82
Figure 5-5 View of M4 and Vine Cottage from Beacon Lane and Green Belt (image Google, June 2009)
5.55. Mitigation planting is evident along the M5 by the Bristol Golf Course (Figure 5-6 below). At OYA, the mitigation planting on site reflects the Series 3000 As Built Planting Mitigation drawings. At the time of the site visit the verges were well maintained, they appeared to be free of weeds and litter removed. Ongoing establishment and maintenance of the planting areas should be re-evaluated at FYA.
Figure 5-6 Mitigation planting along the M5 by Bristol Golf Course (image Google, June 2014)
Townscape
5.56. Both the AST and the EAR stated that townscape effects would not be significant with only minor changes to scale due to increased numbers of gantries and signs along the motorways. Based on the POPE site visit this is considered to be the case for residential receptors at Bradley Stoke, Patchway and Hortham Village where the motorways cannot be seen due the screening provided by existing vegetation and intervening landform. Figure 5-7 below shows a view from Beacon Lane in Winterbourne with the scheme in the distance.
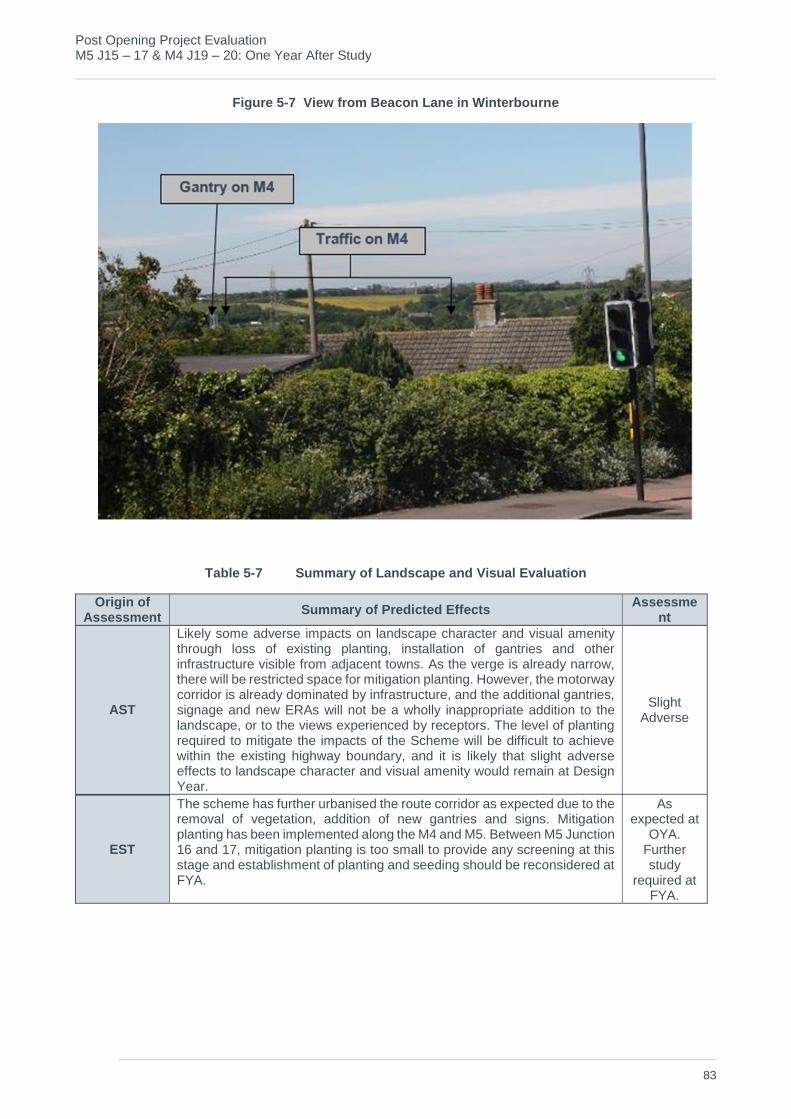
Post Opening Project Evaluation M5 J15 – 17 & M4 J19 – 20: One Year After Study
83
Figure 5-7 View from Beacon Lane in Winterbourne
Table 5-7 Summary of Landscape and Visual Evaluation
Origin of Assessment
Summary of Predicted Effects Assessme
nt
AST
Likely some adverse impacts on landscape character and visual amenity through loss of existing planting, installation of gantries and other infrastructure visible from adjacent towns. As the verge is already narrow, there will be restricted space for mitigation planting. However, the motorway corridor is already dominated by infrastructure, and the additional gantries, signage and new ERAs will not be a wholly inappropriate addition to the landscape, or to the views experienced by receptors. The level of planting required to mitigate the impacts of the Scheme will be difficult to achieve within the existing highway boundary, and it is likely that slight adverse effects to landscape character and visual amenity would remain at Design Year.
Slight Adverse
EST
The scheme has further urbanised the route corridor as expected due to the removal of vegetation, addition of new gantries and signs. Mitigation planting has been implemented along the M4 and M5. Between M5 Junction 16 and 17, mitigation planting is too small to provide any screening at this stage and establishment of planting and seeding should be reconsidered at FYA.
As expected at
OYA. Further study
required at FYA.
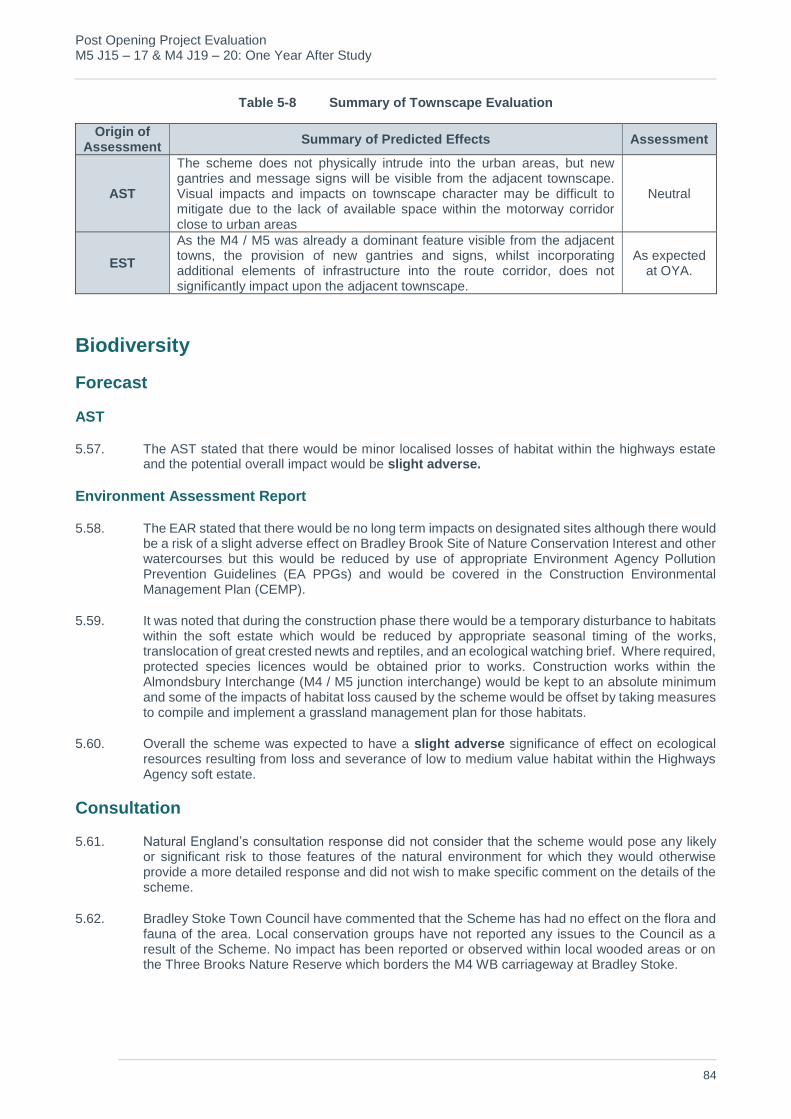
Post Opening Project Evaluation M5 J15 – 17 & M4 J19 – 20: One Year After Study
84
Table 5-8 Summary of Townscape Evaluation
Origin of Assessment
Summary of Predicted Effects Assessment
AST
The scheme does not physically intrude into the urban areas, but new gantries and message signs will be visible from the adjacent townscape. Visual impacts and impacts on townscape character may be difficult to mitigate due to the lack of available space within the motorway corridor close to urban areas
Neutral
EST
As the M4 / M5 was already a dominant feature visible from the adjacent towns, the provision of new gantries and signs, whilst incorporating additional elements of infrastructure into the route corridor, does not significantly impact upon the adjacent townscape.
As expected at OYA.
Biodiversity
Forecast
AST
5.57. The AST stated that there would be minor localised losses of habitat within the highways estate and the potential overall impact would be slight adverse.
Environment Assessment Report
5.58. The EAR stated that there would be no long term impacts on designated sites although there would be a risk of a slight adverse effect on Bradley Brook Site of Nature Conservation Interest and other watercourses but this would be reduced by use of appropriate Environment Agency Pollution Prevention Guidelines (EA PPGs) and would be covered in the Construction Environmental Management Plan (CEMP).
5.59. It was noted that during the construction phase there would be a temporary disturbance to habitats within the soft estate which would be reduced by appropriate seasonal timing of the works, translocation of great crested newts and reptiles, and an ecological watching brief. Where required, protected species licences would be obtained prior to works. Construction works within the Almondsbury Interchange (M4 / M5 junction interchange) would be kept to an absolute minimum and some of the impacts of habitat loss caused by the scheme would be offset by taking measures to compile and implement a grassland management plan for those habitats.
5.60. Overall the scheme was expected to have a slight adverse significance of effect on ecological resources resulting from loss and severance of low to medium value habitat within the Highways Agency soft estate.
Consultation
5.61. Natural England’s consultation response did not consider that the scheme would pose any likely or significant risk to those features of the natural environment for which they would otherwise provide a more detailed response and did not wish to make specific comment on the details of the scheme.
5.62. Bradley Stoke Town Council have commented that the Scheme has had no effect on the flora and fauna of the area. Local conservation groups have not reported any issues to the Council as a result of the Scheme. No impact has been reported or observed within local wooded areas or on the Three Brooks Nature Reserve which borders the M4 WB carriageway at Bradley Stoke.

Post Opening Project Evaluation M5 J15 – 17 & M4 J19 – 20: One Year After Study
85
Evaluation
5.63. No information has been made available to POPE which would confirm any biodiversity and habitat loss as a result of the scheme. As no post opening surveys or Landscape Management Plan (it is understood that a Handover Environmental Management Plan has not been produced, but the information would be in the LMP) have been provided at this stage, an evaluation of the effectiveness of mitigation implemented has not been possible at OYA. The Series 3000 Planting Mitigation Drawings show the majority of the scheme being seeded post construction works, although no details of the planting and maintenance regime has been obtained at OYA.
5.64. No details of the translocation of great crested newts and reptiles have been provided to POPE, however, it is understood that works were undertaken under licence to capture and move a colony of great crested newts to a safe location away from the scheme. It is suggested that this aspect of biodiversity mitigation should be reconsidered at FYA when it is hoped further information would be available (e.g. with regards number relocated, details of the receptor site and monitoring data to confirm success or otherwise of the translocation).
5.65. In Figure 5-8 below wildflower grassland is evident around the M4 / M5 junction interchange as per the Series 3000 Planting Mitigation drawings which indicate that the Almondsbury Interchange has been levelled and dressed with existing species rich material contained within the area.
Figure 5-8 M4 / M5 Junction Interchange wildflowers (image Google, June 2014)
Animal Mortality Figures
5.66. The Managing Agent Contractor (MAC) has been consulted with regard to animal mortality due to motorway traffic within the scheme and have provided the records shown in Table 5-9 below. The figures provided are based on those recorded prior to the scheme between July 2012 and March 2014 when the scheme opened to traffic and after implementation of the scheme from March 2014 to June 2015.
Table 5-9 Animal Mortality Figure provided by the Managing Agent Contractor
Location Species Number Date
M5 J15 SB by Woodlands Golf and Country Club, MP 130/5
Deer 1 November
2013
M4 J19-20 EB, MP 184.5 Badger 1 May 2015

Post Opening Project Evaluation M5 J15 – 17 & M4 J19 – 20: One Year After Study
86
Table 5-10 Summary of Biodiversity Effects
Origin of Assessment
Summary of Effects on Biodiversity Assessment
AST Minor localised losses of habitat within the highways estate.
Slight Adverse
EST
The POPE site visit confirmed the species rich grassland within the Almondsbury Interchange as per the Series 3000 Planting Mitigation drawings. Further study is required at FYA to evaluate the effectiveness of the mitigation due to limited data provided at OYA.
As expected based on Series 3000 Planting Mitigation drawings and site visit. Further study required at FYA.
Cultural Heritage and Archaeology
Forecast
AST
5.67. The AST stated that there would be a neutral impact on the immediate settings of the Listed Buildings and Scheduled Monuments of National importance and that the view from and general appreciation of one Listed Building would be marginally compromised. The impact overall was assessed as Neutral.
Environment Assessment Report
5.68. The Cultural Heritage and Archaeology topic was scoped out of the assessment required for inclusion in the EAR as the scheme was not expected to have a significant adverse effect on the cultural heritage resource, with the exception of the proposed demolition of the footbridge at Pegwell. The footbridge is a locally listed heritage asset as a feature which contributes to the character and appearance of the locality, which would have a moderate adverse effect. No further stages of assessment were deemed necessary for scheduled monuments or listed buildings. However, the EAR stated that a historic building record survey should be undertaken to an appropriate level for the footbridge which should be agreed with the local authority’s conservation officer.
Consultation
5.69. South Gloucestershire Council responded regarding the removal of the Pegwell Break footbridge. The Council have a Written scheme of Investigation for Historic Building Recording (March 2012) which sets out how the historic building record survey is to be carried out but have no record of the survey report following the removal of the bridge.
Evaluation
5.70. Based on the information available to POPE it is not clear whether the Listed Building mentioned in the AST is either of Hollywood Tower or Saint Swithins Farm house noted in the EAR as Grade II Listed Buildings which lie approximately 150m from a super gantry. Figure 5-9 below shows the view from the offices at Hollywood Tower Business Centre towards the M5 and the super gantry. As can be seen in the photo, the motorway and associated infrastructure is not visible from the offices. A similar situation is also likely for Saint Swithins Farm given the intervening vegetation between the farm house and the M5 as seen in the aerial photo from Google (March 2013) below (Figure 5-10). Public access was not available to this property.
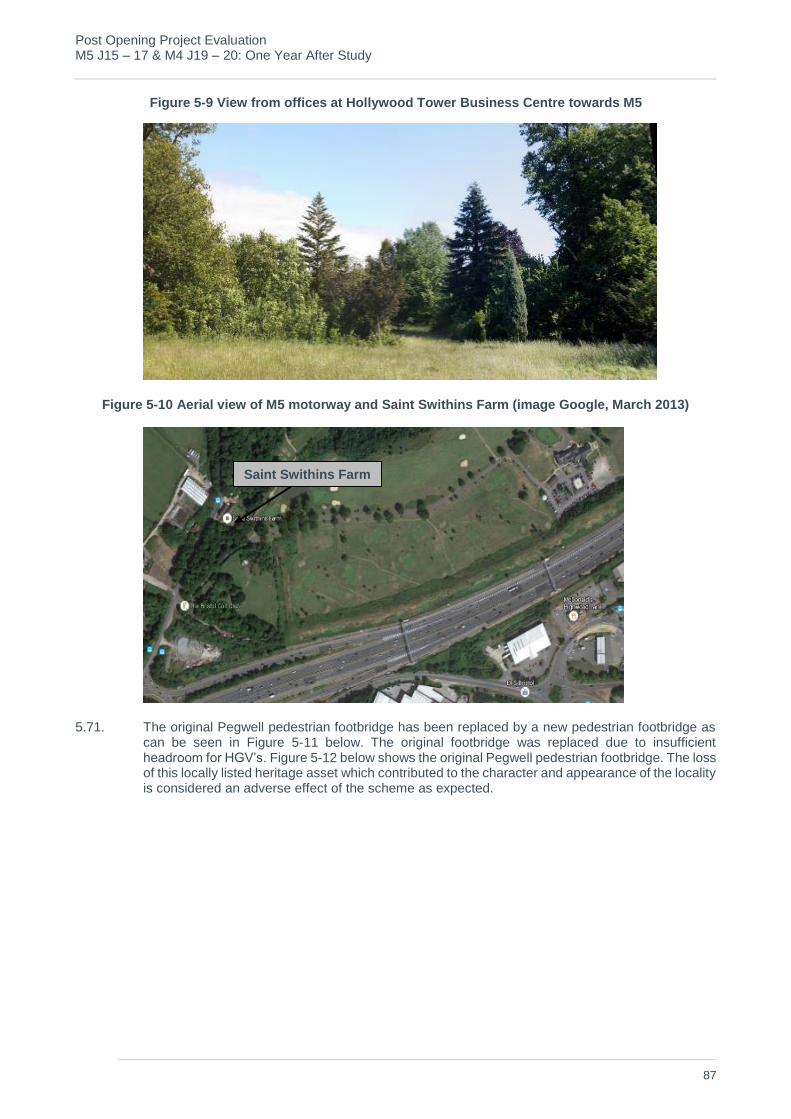
Post Opening Project Evaluation M5 J15 – 17 & M4 J19 – 20: One Year After Study
87
Figure 5-9 View from offices at Hollywood Tower Business Centre towards M5
Figure 5-10 Aerial view of M5 motorway and Saint Swithins Farm (image Google, March 2013)
5.71. The original Pegwell pedestrian footbridge has been replaced by a new pedestrian footbridge as can be seen in Figure 5-11 below. The original footbridge was replaced due to insufficient headroom for HGV’s. Figure 5-12 below shows the original Pegwell pedestrian footbridge. The loss of this locally listed heritage asset which contributed to the character and appearance of the locality is considered an adverse effect of the scheme as expected.
Saint Swithins Farm
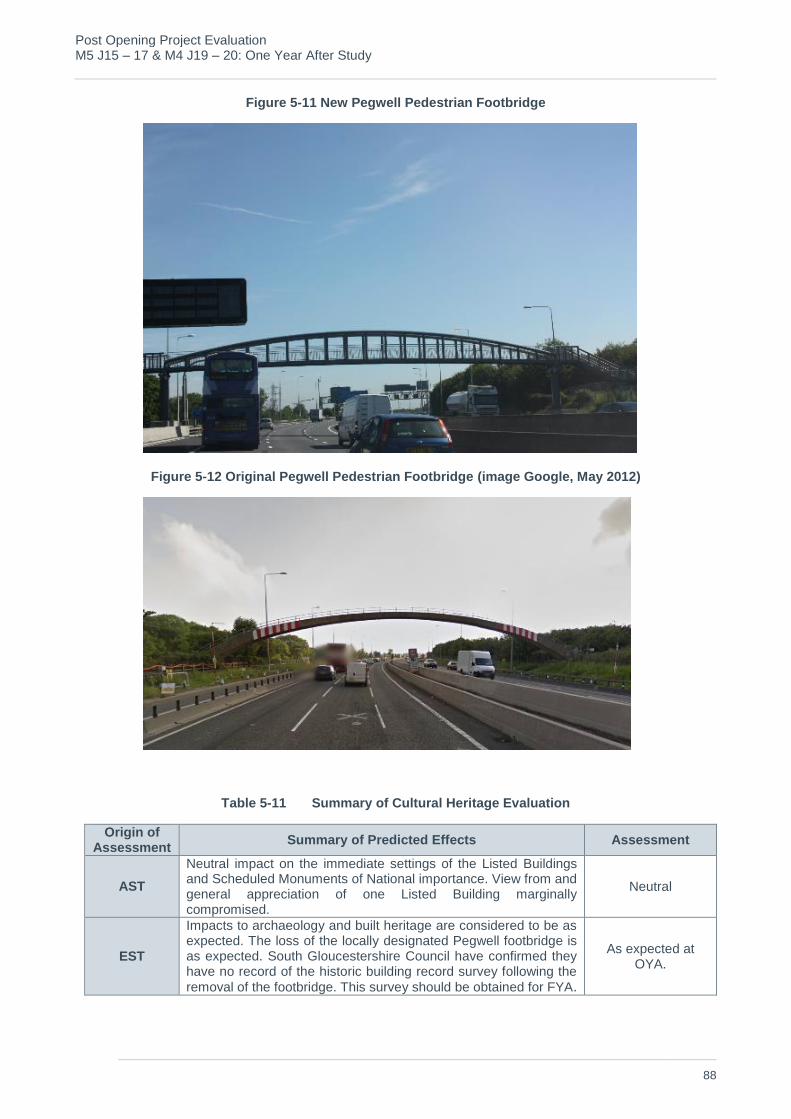
Post Opening Project Evaluation M5 J15 – 17 & M4 J19 – 20: One Year After Study
88
Figure 5-11 New Pegwell Pedestrian Footbridge
Figure 5-12 Original Pegwell Pedestrian Footbridge (image Google, May 2012)
Table 5-11 Summary of Cultural Heritage Evaluation
Origin of Assessment
Summary of Predicted Effects Assessment
AST
Neutral impact on the immediate settings of the Listed Buildings and Scheduled Monuments of National importance. View from and general appreciation of one Listed Building marginally compromised.
Neutral
EST
Impacts to archaeology and built heritage are considered to be as expected. The loss of the locally designated Pegwell footbridge is as expected. South Gloucestershire Council have confirmed they have no record of the historic building record survey following the
removal of the footbridge. This survey should be obtained for FYA.
As expected at OYA.

Post Opening Project Evaluation M5 J15 – 17 & M4 J19 – 20: One Year After Study
89
Water Quality and Drainage
Forecast
AST
5.72. The AST stated that there would be no major impact with good working practice in place and no long term impact. The impact overall was assessed as Neutral.
Environment Assessment Report
5.73. The EAR stated that road drainage required no further consideration in terms of impact assessment as the Scheme was not expected to have an adverse impact on the existing motorway drainage system and nearby watercourses. Additional surface runoff from ERAs and areas of carriageway widening would enter the existing motorway drainage network where it would be attenuated prior to discharge to existing outfalls. Pollution control would be provided for the surface runoff flows generated by the scheme. No formal consultation would take place with the Environment Agency, which would be kept informed of the developments as part of the wider communication strategy.
Consultation
5.74. No response has been received from the Environment Agency at the time of writing.
Evaluation
5.75. The Series 500 Drainage Layout drawings show a series of new surface water channels, narrow filter drains and kerb drains installed throughout the Scheme, taking into account the new ERAs and relocating existing drainage channels where necessary. No other details of as built water quality and drainage features have been received. Further assessment is necessary at FYA.
Table 5-12 Summary of Water Quality and Drainage evaluation
Origin of Assessment
Summary of Predicted Effects Assessment
AST No major impact with good working practice. No long term impact. Neutral
EST
It would appear from the Series 500 As Built Drainage Layout drawings that the drainage measures have been provided and POPE is not aware that they are performing other than as expected, however further information would be necessary to confirm this and water and drainage should be reconsidered at FYA.
As expected based on available information.
Physical Fitness
Forecast
AST
5.76. The AST stated that there would be no change in levels of walking and cycling as a result of the Scheme. The impact overall was assessed as Neutral.
Environment Assessment Report
5.77. The EAR did not include an assessment for Physical Fitness. In the Effects on All Travellers assessment, the EAR stated that:
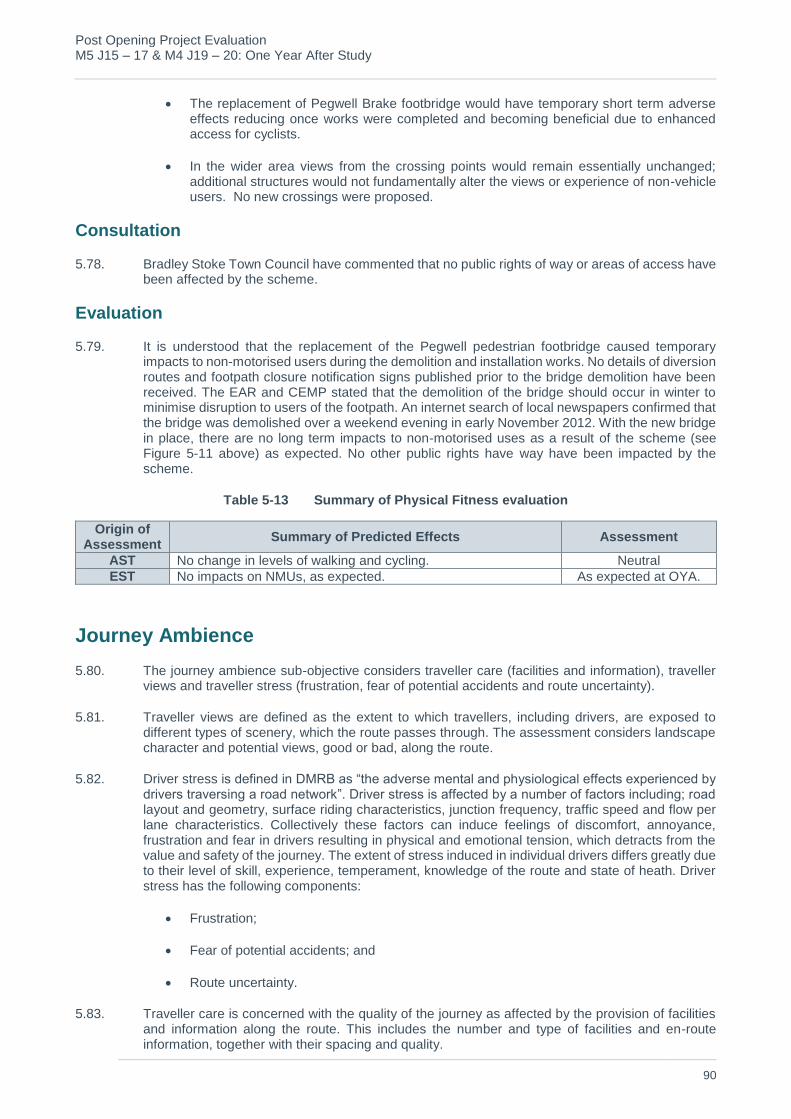
Post Opening Project Evaluation M5 J15 – 17 & M4 J19 – 20: One Year After Study
90
The replacement of Pegwell Brake footbridge would have temporary short term adverseeffects reducing once works were completed and becoming beneficial due to enhancedaccess for cyclists.
In the wider area views from the crossing points would remain essentially unchanged;additional structures would not fundamentally alter the views or experience of non-vehicleusers. No new crossings were proposed.
Consultation
5.78. Bradley Stoke Town Council have commented that no public rights of way or areas of access have been affected by the scheme.
Evaluation
5.79. It is understood that the replacement of the Pegwell pedestrian footbridge caused temporary impacts to non-motorised users during the demolition and installation works. No details of diversion routes and footpath closure notification signs published prior to the bridge demolition have been received. The EAR and CEMP stated that the demolition of the bridge should occur in winter to minimise disruption to users of the footpath. An internet search of local newspapers confirmed that the bridge was demolished over a weekend evening in early November 2012. With the new bridge in place, there are no long term impacts to non-motorised uses as a result of the scheme (see Figure 5-11 above) as expected. No other public rights have way have been impacted by the scheme.
Table 5-13 Summary of Physical Fitness evaluation
Origin of Assessment
Summary of Predicted Effects Assessment
AST No change in levels of walking and cycling. Neutral
EST No impacts on NMUs, as expected. As expected at OYA.
Journey Ambience
5.80. The journey ambience sub-objective considers traveller care (facilities and information), traveller views and traveller stress (frustration, fear of potential accidents and route uncertainty).
5.81. Traveller views are defined as the extent to which travellers, including drivers, are exposed to different types of scenery, which the route passes through. The assessment considers landscape character and potential views, good or bad, along the route.
5.82. Driver stress is defined in DMRB as “the adverse mental and physiological effects experienced by drivers traversing a road network”. Driver stress is affected by a number of factors including; road layout and geometry, surface riding characteristics, junction frequency, traffic speed and flow per lane characteristics. Collectively these factors can induce feelings of discomfort, annoyance, frustration and fear in drivers resulting in physical and emotional tension, which detracts from the value and safety of the journey. The extent of stress induced in individual drivers differs greatly due to their level of skill, experience, temperament, knowledge of the route and state of heath. Driver stress has the following components:
Frustration;
Fear of potential accidents; and
Route uncertainty.
5.83. Traveller care is concerned with the quality of the journey as affected by the provision of facilities and information along the route. This includes the number and type of facilities and en-route information, together with their spacing and quality.
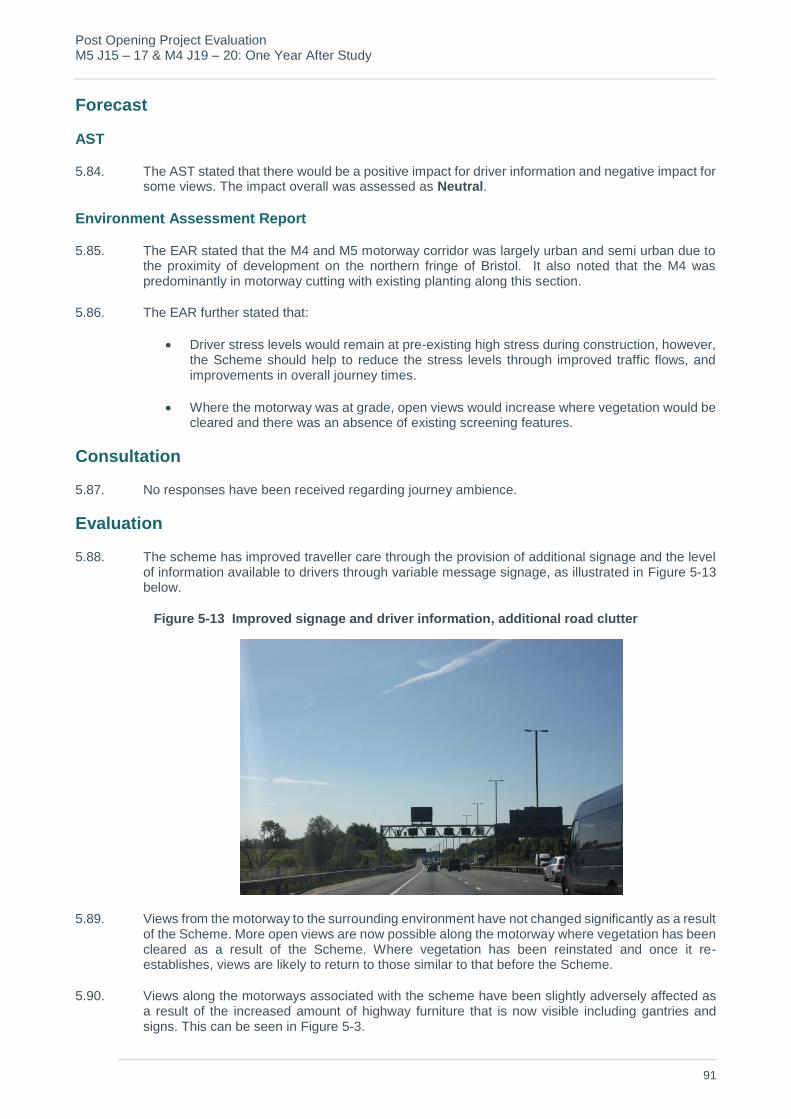
Post Opening Project Evaluation M5 J15 – 17 & M4 J19 – 20: One Year After Study
91
Forecast
AST
5.84. The AST stated that there would be a positive impact for driver information and negative impact for some views. The impact overall was assessed as Neutral.
Environment Assessment Report
5.85. The EAR stated that the M4 and M5 motorway corridor was largely urban and semi urban due to the proximity of development on the northern fringe of Bristol. It also noted that the M4 was predominantly in motorway cutting with existing planting along this section.
5.86. The EAR further stated that:
Driver stress levels would remain at pre-existing high stress during construction, however,the Scheme should help to reduce the stress levels through improved traffic flows, andimprovements in overall journey times.
Where the motorway was at grade, open views would increase where vegetation would becleared and there was an absence of existing screening features.
Consultation
5.87. No responses have been received regarding journey ambience.
Evaluation
5.88. The scheme has improved traveller care through the provision of additional signage and the level of information available to drivers through variable message signage, as illustrated in Figure 5-13 below.
Figure 5-13 Improved signage and driver information, additional road clutter
5.89. Views from the motorway to the surrounding environment have not changed significantly as a result of the Scheme. More open views are now possible along the motorway where vegetation has been cleared as a result of the Scheme. Where vegetation has been reinstated and once it re-establishes, views are likely to return to those similar to that before the Scheme.
5.90. Views along the motorways associated with the scheme have been slightly adversely affected as a result of the increased amount of highway furniture that is now visible including gantries and signs. This can be seen in Figure 5-3.
Post Opening Project Evaluation M5 J15 – 17 & M4 J19 – 20: One Year After Study
92
5.91. Prior to the scheme opening, there was an average of 43.2 accidents a year on the M4 and M5. Since opening this has reduced to an average of 16 accidents a year on the M4 and M5. The number of fatal and serious accidents has reduced from 8% prior to the scheme to 0% since the Scheme has opened. Statistical significance testing has found that the reduction in collisions is likely to be attributed to the scheme rather than the result of chance alone. Fear of accidents has reduced due to improved signage, driver information and variable speed limits.
5.92. Traffic data suggest that journey times throughout the scheme have increased following Scheme opening while journey time reliability has improved for vehicles travelling from the M4 to the M5 and remained constant for vehicles travelling from the M5 to the M4. The improvement in journey time reliability has led to a reduction in driver frustration.
5.93. Provision of additional signage and information associated with the Scheme has improved route certainty for users of the motorways.
Table 5-14 Summary of Journey Ambience Evaluation
Traveller Factor AST
Score OYA evaluation
Views Negative
The character of the motorway corridor has changed as a result of the new equipment installed for the scheme. The clearance of existing vegetation within the highway boundary has resulted in more open views from the motorway at grade where views are not restricted by existing bunds, environmental barriers or off site woodland planting. Where the vegetation has been reinstated, views experienced by drivers would return to those before the scheme once the vegetation becomes established. Overall this has resulted in views as expected at OYA.
Driver Stress Positive
Benefits to driver frustration associated with the scheme have reduced as a result of improved journey time reliability even though journey times have increased. Fear of accidents has reduced due to improved driver awareness from the additional signage and variable speed limits. Improved signage and information for drivers should have improved route certainty. Overall, driver stress is as expected at OYA.
Care Positive Traveller care has improved through the addition of signage and information available to the driver as a result of the Scheme. Traveller care is as expected at OYA.
Summary Score Neutral As expected at OYA

Post Opening Project Evaluation M5 J15 – 17 & M4 J19 – 20: One Year After Study
93
Key Points - Environment
Noise
Local noise impacts as a result of the scheme are better than expected at OYA due to traffic figures beinglower than expected by an average of 18%.
Local Air Quality
As traffic figures are lower than expected, local air quality impacts as a result of the scheme are beneficialat OYA.
Greenhouse Gases
Carbon emissions on the M4 and M5 scheme sections have reduced by 2% (536 tonnes in the opening year). Forecasts expected an increase in carbon emissions due to higher traffic volumes, however current traffic volumes are lower than expected and remain similar following scheme opening.
Landscape and Townscape
The scheme adds further urban clutter to a landscape already dominated by the motorways and itsinfrastructure. The success of mitigation planting along the motorways is unknown at OYA althoughevidence of planting is evident along sections of the scheme. The townscape of the study area has notsignificantly been impacted upon by the scheme with impacts as expected at OYA.
Biodiversity
There are no details of protected species impacts as a result of the scheme at OYA. Biodiversity and habitatloss are unknown at OYA, although mitigation planting is evident along sections of the scheme. The impactof the scheme on biodiversity is as expected at OYA. Further study is required at FYA to evaluate theeffectiveness of the mitigation planting.
Cultural Heritage and Archaeology
Impacts to archaeology and built heritage are as expected based at OYA. No further assessment is requiredat FYA for cultural heritage and archaeology.
Water Quality and Drainage
No impacts have been identified to the water quality of the study area. Impacts are as expected, with furtherstudy required at FYA to evaluate the performance of the installed drainage.
Physical Fitness
No impacts have been identified to NMUs as a result of the scheme.
Journey Ambience
Traveller views have been negatively impacted as a result of the additional infrastructure installed for thescheme. Driver stress is as expected as a result of improved journey time reliability, reduced fear ofaccidents and driver frustration. Traveller care has improved with the addition of signage and informationavailable to the driver. Overall, impacts to journey ambience as result of the scheme are as expected atOYA.
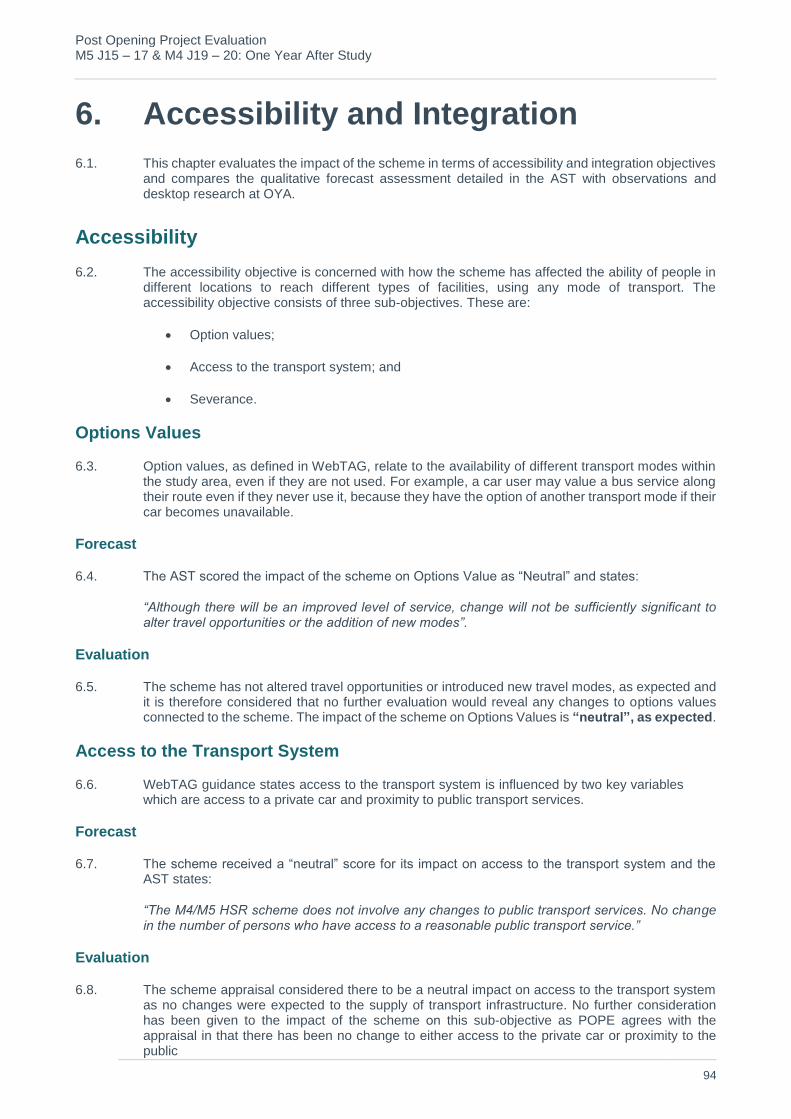
Post Opening Project Evaluation M5 J15 – 17 & M4 J19 – 20: One Year After Study
94
6. Accessibility and Integration
6.1. This chapter evaluates the impact of the scheme in terms of accessibility and integration objectives and compares the qualitative forecast assessment detailed in the AST with observations and desktop research at OYA.
Accessibility
6.2. The accessibility objective is concerned with how the scheme has affected the ability of people in different locations to reach different types of facilities, using any mode of transport. The accessibility objective consists of three sub-objectives. These are:
Option values;
Access to the transport system; and
Severance.
Options Values
6.3. Option values, as defined in WebTAG, relate to the availability of different transport modes within the study area, even if they are not used. For example, a car user may value a bus service along their route even if they never use it, because they have the option of another transport mode if their car becomes unavailable.
Forecast
6.4. The AST scored the impact of the scheme on Options Value as “Neutral” and states:
“Although there will be an improved level of service, change will not be sufficiently significant to alter travel opportunities or the addition of new modes”.
Evaluation
6.5. The scheme has not altered travel opportunities or introduced new travel modes, as expected and it is therefore considered that no further evaluation would reveal any changes to options values connected to the scheme. The impact of the scheme on Options Values is “neutral”, as expected.
Access to the Transport System
6.6. WebTAG guidance states access to the transport system is influenced by two key variables which are access to a private car and proximity to public transport services.
Forecast
6.7. The scheme received a “neutral” score for its impact on access to the transport system and the AST states:
“The M4/M5 HSR scheme does not involve any changes to public transport services. No change in the number of persons who have access to a reasonable public transport service.”
Evaluation
6.8. The scheme appraisal considered there to be a neutral impact on access to the transport system as no changes were expected to the supply of transport infrastructure. No further consideration has been given to the impact of the scheme on this sub-objective as POPE agrees with the appraisal in that there has been no change to either access to the private car or proximity to the public

Post Opening Project Evaluation M5 J15 – 17 & M4 J19 – 20: One Year After Study
95
transport system as part of the scheme. The appraisal impact score of ‘neutral’ is therefore upheld.
Severance
6.9. The severance sub-objective is concerned with non-motorised modes and how movement and activities within the community are affected by the presence of a major road or other transport link, particularly the degree of separation of residents from facilities and services.
Forecast
6.10. The forecast impact of the scheme on severance in the AST was “neutral” as “pedestrian access by footbridges or underpasses across the M4 and M5 will remain the same as at present”.
Evaluation
6.11. No additional facilities have been provided for non-motorised users as part of the scheme, hence the impact of the scheme on severance is scored as “neutral” in the EST, as expected.
Integration
6.12. The integration objective consists of two main elements:
Interchange with other transport modes: how the scheme assists different modes oftransport in working together and the ease of people moving between them to choosesustainable transport choices.
Land Use Policy and Other Government Policies: How the scheme integrates with localland use and wider government policies.
Transport Interchange
6.13. The transport interchange objective relates to the extent to which the scheme contributes towards the Government objectives of improving transport interchange for passengers and freight.
Forecast
6.14. The AST expected the scheme would have a “neutral” impact on transport interchange stating:
“[transport interchange] is only relevant with Park and Ride for highway schemes and hence no impact.”
Evaluation
6.15. With regard to highways schemes, the transport interchange sub-objective is only applicable in certain cases where an interchange between different modes forms part of the scheme (e.g. Park and Ride). The scheme has not had an impact on this sub-objective and the impact is therefore scored as “neutral”, as expected.
Land Use Policies
6.16. This section looks at the scheme in relation to national, regional and local land use policies.
Forecast
6.17. The AST scored the impact of the scheme on Land Use Policy as “Moderate Beneficial” as the scheme was expected to:

Post Opening Project Evaluation M5 J15 – 17 & M4 J19 – 20: One Year After Study
96
“Assist development in Severnside, Filton and Harry Stoke. Improves reliability and resilience of the other inter-regional transport links. Enhanced reliability and reduce congestion of national corridors and in vicinity of an international gateway.”
6.18. The Appraisal Summary Table (October 2009) supporting report identified the national, regional and local policies used in the appraisal of the Land Use Policy and Other Government Policies sub-objectives, which are as follows:
Local: Joint Replacement Structure Plan (2002);
Local: South Gloucestershire Local Plan (2006);
Local: Joint Local Transport Plan (2006/07 to 2010/11);
Regional: Draft Regional Spatial Strategy;
Regional: Regional Economic Strategy;
National Policy: Delivering a Sustainable Transport System (DaSTS); and
National Policy: Roads – Delivering Choice and Reliability.
Evaluation
6.19. Table 6-1 shows the information supporting the assessment of Land Use as taken from the AST Report and the corresponding POPE assessment based on analysis in earlier Chapters.
6.20. As shown in Table 6-1 the impact of the scheme on land use is as expected and the EST is scored as “Moderate Beneficial”.

Post Opening Project Evaluation M5 J15 – 17 & M4 J19 – 20: One Year After Study
97
Table 6-1 Summary of expected integration impacts – Land Use
Other Government Policy
6.21. The AST expected the scheme to have a “Slight Beneficial” impact on the sub-objective Other Government Policies. The assessment was based on the same policies as the Land Use Policy assessment and the Appraisal Summary Table (October 2009) provided further details on the policies the scheme was expected to support and not support as shown in Table 6-2.
6.22. The assessment of the scheme impact against the expected impacts shows overall the impact of the scheme on the sub-objective Other Government Policies is “Slight Positive”, as expected.
Level Policies Supported Policies Not Supported
POPE Evaluation Achieved
Lo
cal
Realising the economic potential of the Avonmouth and Severnside development area through improving strategic highway infrastructure.
Optimising the efficiency of existing transport infrastructure.
Improving air quality through management of traffic speeds and congestion on the motorway network.
Encouraging use of modes other than the private car within the West of England sub-region.
As shown in Chapter 2, journey time reliability has improved for the route from the M4 to M5 in all time periods and during the AM peak for the route from the M5 to M4. There has also been an improvement in delays for the 10% worst journey times.
Chapter 5 shows air quality impacts are as expected based on changes in traffic flows.
Reg
ion
al
Improving the reliability and resilience of inter-regional transport links, thereby assisting the economic development of the South West region.
Management of the M4 and M5 to maintain reliable journey times.
No direct impact.
Journey time reliability has improved on the route from the M4 to M5 and remains similar for vehicles travelling from the M5 to M4.
Current congestion levels are not at the level expected and there has been a slight increase in journey times the following scheme opening, however, forecasts did not expect an improvement in journey times in the opening year.
Nati
on
al
Reliving congestion and improving reliability on two key inter-urban (national) corridors.
Relieving congestion and improving reliability in the vicinity of an international gateway.
No direct impact.
Overall AST assessment score: Moderate Beneficial
POPE Evaluation: As Expected – Moderate Beneficial
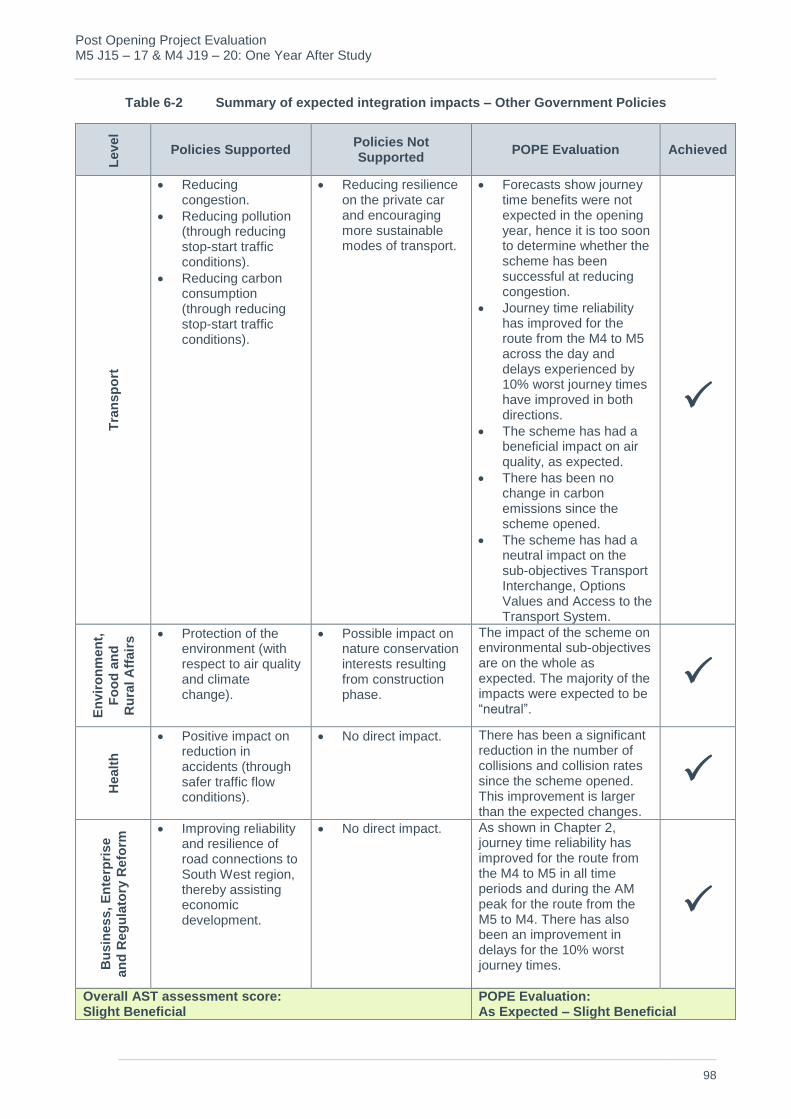
Post Opening Project Evaluation M5 J15 – 17 & M4 J19 – 20: One Year After Study
98
Table 6-2 Summary of expected integration impacts – Other Government Policies L
evel
Policies Supported Policies Not Supported
POPE Evaluation Achieved
Tra
nsp
ort
Reducing congestion.
Reducing pollution (through reducing stop-start traffic conditions).
Reducing carbon consumption (through reducing stop-start traffic conditions).
Reducing resilience on the private car and encouraging more sustainable modes of transport.
Forecasts show journey time benefits were not expected in the opening year, hence it is too soon to determine whether the scheme has been successful at reducing congestion.
Journey time reliability has improved for the route from the M4 to M5 across the day and delays experienced by 10% worst journey times have improved in both directions.
The scheme has had a beneficial impact on air quality, as expected.
There has been no change in carbon emissions since the scheme opened.
The scheme has had a neutral impact on the sub-objectives Transport Interchange, Options Values and Access to the Transport System.
En
vir
on
men
t,
Fo
od
an
d
Ru
ral A
ffair
s Protection of the
environment (with respect to air quality and climate change).
Possible impact on nature conservation interests resulting from construction phase.
The impact of the scheme on environmental sub-objectives are on the whole as expected. The majority of the impacts were expected to be “neutral”.
Healt
h
Positive impact on reduction in accidents (through safer traffic flow conditions).
No direct impact. There has been a significant reduction in the number of collisions and collision rates since the scheme opened. This improvement is larger than the expected changes.
Bu
sin
es
s, E
nte
rpri
se
an
d R
eg
ula
tory
Refo
rm Improving reliability
and resilience of road connections to South West region, thereby assisting economic development.
No direct impact. As shown in Chapter 2, journey time reliability has improved for the route from the M4 to M5 in all time periods and during the AM peak for the route from the M5 to M4. There has also been an improvement in delays for the 10% worst journey times.
Overall AST assessment score: Slight Beneficial
POPE Evaluation: As Expected – Slight Beneficial

Post Opening Project Evaluation M5 J15 – 17 & M4 J19 – 20: One Year After Study
99
Accessibility and Integration - Key points
The scheme has had a “neutral” impact on the sub-objectives Access to the Transport System, Severance, Transport Interchange and Options Values. These impact of the scheme on these sub-objectives is therefore as expected.
The impact of the scheme on land use is “Moderate Beneficial”, as expected due to improvements in reliability and air quality, which align with local, regional and national land use policy at the time of appraisal.
The scheme has had a “Slight Beneficial” impact as expected based on Other Government Policies based on improved journey time reliability, statistical significant reduction in collision numbers and rates and no change in carbon emissions. This means the scheme aligns to Other Government Policies at the time the scheme was appraised.
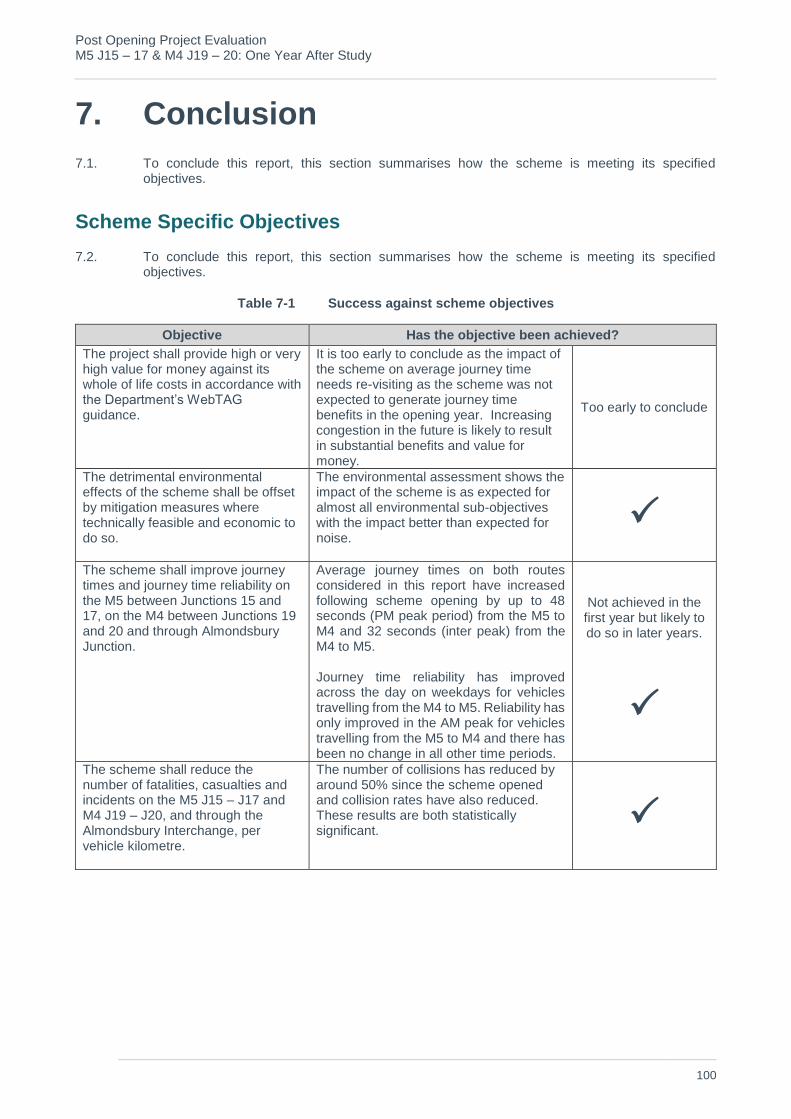
Post Opening Project Evaluation M5 J15 – 17 & M4 J19 – 20: One Year After Study
100
7. Conclusion
7.1. To conclude this report, this section summarises how the scheme is meeting its specified objectives.
Scheme Specific Objectives
7.2. To conclude this report, this section summarises how the scheme is meeting its specified objectives.
Table 7-1 Success against scheme objectives
Objective Has the objective been achieved?
The project shall provide high or very high value for money against its whole of life costs in accordance with the Department’s WebTAG guidance.
It is too early to conclude as the impact of the scheme on average journey time needs re-visiting as the scheme was not expected to generate journey time benefits in the opening year. Increasing congestion in the future is likely to result in substantial benefits and value for money.
Too early to conclude
The detrimental environmental effects of the scheme shall be offset by mitigation measures where technically feasible and economic to do so.
The environmental assessment shows the impact of the scheme is as expected for almost all environmental sub-objectives with the impact better than expected for noise.
The scheme shall improve journey times and journey time reliability on the M5 between Junctions 15 and 17, on the M4 between Junctions 19 and 20 and through Almondsbury Junction.
Average journey times on both routes considered in this report have increased following scheme opening by up to 48 seconds (PM peak period) from the M5 to M4 and 32 seconds (inter peak) from the M4 to M5. Journey time reliability has improved across the day on weekdays for vehicles travelling from the M4 to M5. Reliability has only improved in the AM peak for vehicles travelling from the M5 to M4 and there has been no change in all other time periods.
Not achieved in the first year but likely to do so in later years.
The scheme shall reduce the number of fatalities, casualties and incidents on the M5 J15 – J17 and M4 J19 – J20, and through the Almondsbury Interchange, per vehicle kilometre.
The number of collisions has reduced by around 50% since the scheme opened and collision rates have also reduced. These results are both statistically significant.
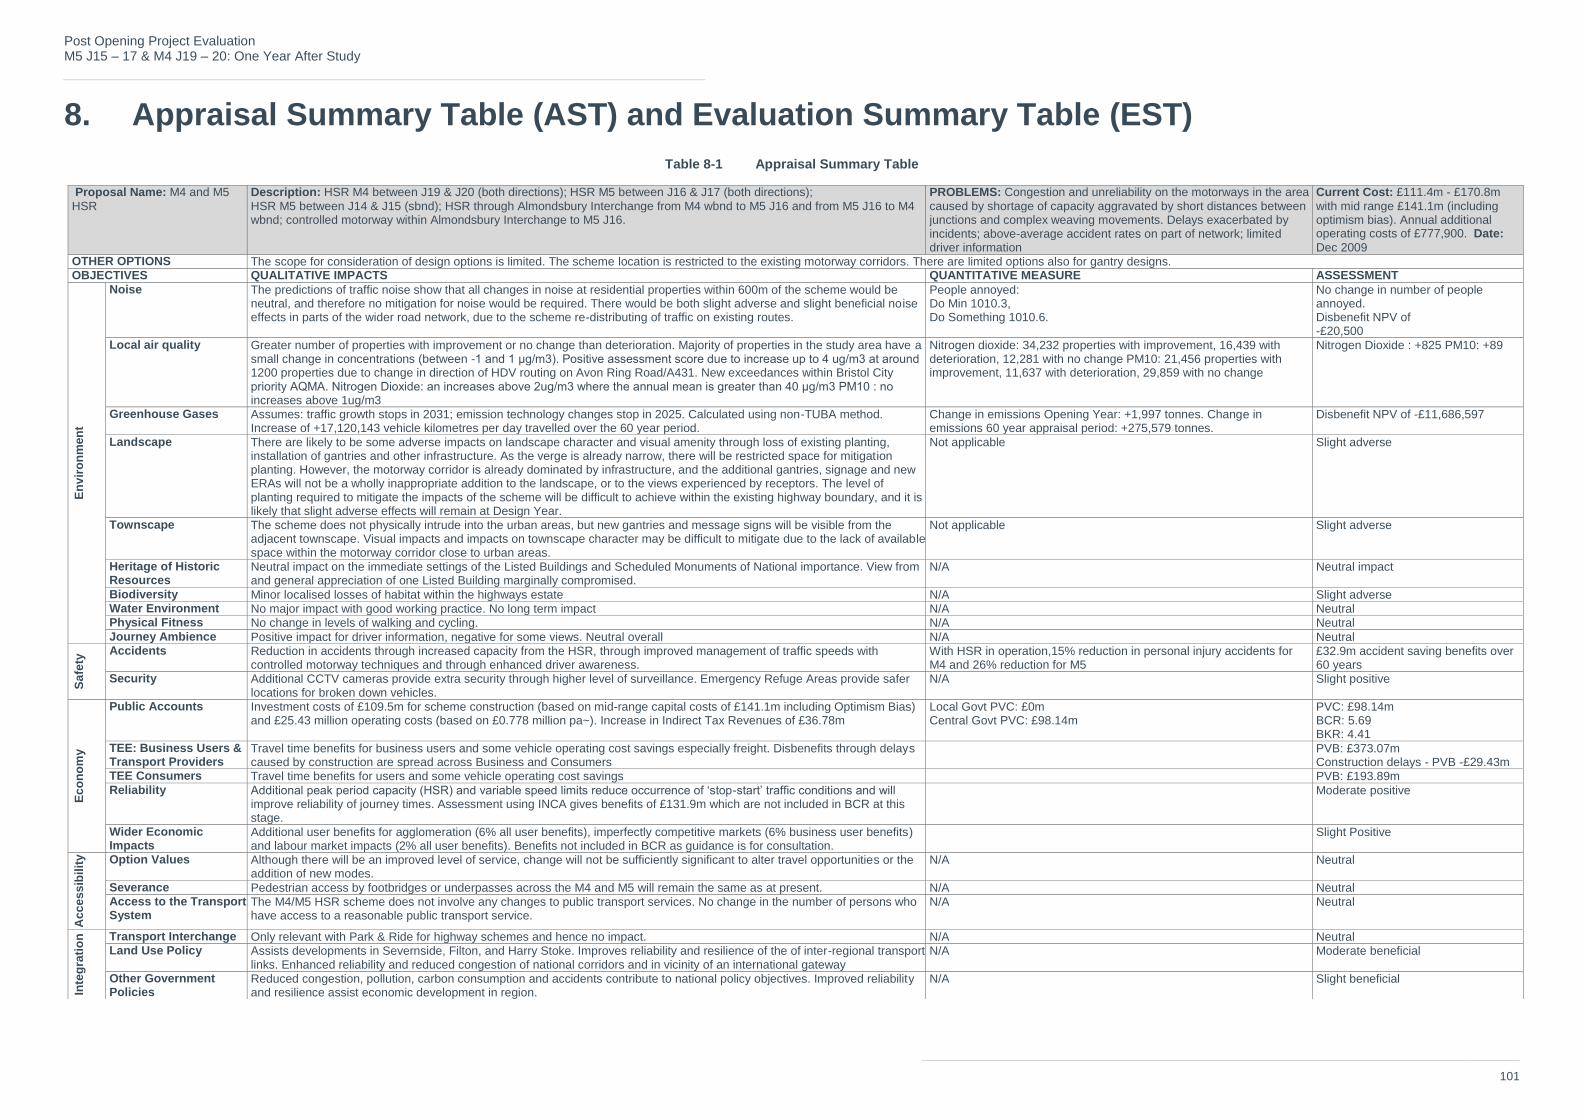
Post Opening Project Evaluation M5 J15 – 17 & M4 J19 – 20: One Year After Study
101
8. Appraisal Summary Table (AST) and Evaluation Summary Table (EST)
Table 8-1 Appraisal Summary Table
Proposal Name: M4 and M5
HSR
Description: HSR M4 between J19 & J20 (both directions); HSR M5 between J16 & J17 (both directions);
HSR M5 between J14 & J15 (sbnd); HSR through Almondsbury Interchange from M4 wbnd to M5 J16 and from M5 J16 to M4 wbnd; controlled motorway within Almondsbury Interchange to M5 J16.
PROBLEMS: Congestion and unreliability on the motorways in the area
caused by shortage of capacity aggravated by short distances between junctions and complex weaving movements. Delays exacerbated by incidents; above-average accident rates on part of network; limited driver information
Current Cost: £111.4m - £170.8m
with mid range £141.1m (including optimism bias). Annual additional operating costs of £777,900. Date:
Dec 2009 OTHER OPTIONS The scope for consideration of design options is limited. The scheme location is restricted to the existing motorway corridors. There are limited options also for gantry designs. OBJECTIVES QUALITATIVE IMPACTS QUANTITATIVE MEASURE ASSESSMENT
En
vir
on
men
t
Noise The predictions of traffic noise show that all changes in noise at residential properties within 600m of the scheme would be neutral, and therefore no mitigation for noise would be required. There would be both slight adverse and slight beneficial noise effects in parts of the wider road network, due to the scheme re-distributing of traffic on existing routes.
People annoyed: Do Min 1010.3, Do Something 1010.6.
No change in number of people annoyed. Disbenefit NPV of -£20,500
Local air quality Greater number of properties with improvement or no change than deterioration. Majority of properties in the study area have a small change in concentrations (between -1 and 1 μg/m3). Positive assessment score due to increase up to 4 ug/m3 at around 1200 properties due to change in direction of HDV routing on Avon Ring Road/A431. New exceedances within Bristol City priority AQMA. Nitrogen Dioxide: an increases above 2ug/m3 where the annual mean is greater than 40 μg/m3 PM10 : no increases above 1ug/m3
Nitrogen dioxide: 34,232 properties with improvement, 16,439 with deterioration, 12,281 with no change PM10: 21,456 properties with improvement, 11,637 with deterioration, 29,859 with no change
Nitrogen Dioxide : +825 PM10: +89
Greenhouse Gases Assumes: traffic growth stops in 2031; emission technology changes stop in 2025. Calculated using non-TUBA method. Increase of +17,120,143 vehicle kilometres per day travelled over the 60 year period.
Change in emissions Opening Year: +1,997 tonnes. Change in emissions 60 year appraisal period: +275,579 tonnes.
Disbenefit NPV of -£11,686,597
Landscape There are likely to be some adverse impacts on landscape character and visual amenity through loss of existing planting, installation of gantries and other infrastructure. As the verge is already narrow, there will be restricted space for mitigation planting. However, the motorway corridor is already dominated by infrastructure, and the additional gantries, signage and new ERAs will not be a wholly inappropriate addition to the landscape, or to the views experienced by receptors. The level of planting required to mitigate the impacts of the scheme will be difficult to achieve within the existing highway boundary, and it is likely that slight adverse effects will remain at Design Year.
Not applicable Slight adverse
Townscape The scheme does not physically intrude into the urban areas, but new gantries and message signs will be visible from the adjacent townscape. Visual impacts and impacts on townscape character may be difficult to mitigate due to the lack of available space within the motorway corridor close to urban areas.
Not applicable Slight adverse
Heritage of Historic Resources
Neutral impact on the immediate settings of the Listed Buildings and Scheduled Monuments of National importance. View from and general appreciation of one Listed Building marginally compromised.
N/A Neutral impact
Biodiversity Minor localised losses of habitat within the highways estate N/A Slight adverse Water Environment No major impact with good working practice. No long term impact N/A Neutral Physical Fitness No change in levels of walking and cycling. N/A Neutral Journey Ambience Positive impact for driver information, negative for some views. Neutral overall N/A Neutral
Sa
fety
Accidents Reduction in accidents through increased capacity from the HSR, through improved management of traffic speeds with controlled motorway techniques and through enhanced driver awareness.
With HSR in operation,15% reduction in personal injury accidents for M4 and 26% reduction for M5
£32.9m accident saving benefits over 60 years
Security Additional CCTV cameras provide extra security through higher level of surveillance. Emergency Refuge Areas provide safer locations for broken down vehicles.
N/A Slight positive
Ec
on
om
y
Public Accounts Investment costs of £109.5m for scheme construction (based on mid-range capital costs of £141.1m including Optimism Bias) and £25.43 million operating costs (based on £0.778 million pa~). Increase in Indirect Tax Revenues of £36.78m
Local Govt PVC: £0m Central Govt PVC: £98.14m
PVC: £98.14m BCR: 5.69 BKR: 4.41
TEE: Business Users & Transport Providers
Travel time benefits for business users and some vehicle operating cost savings especially freight. Disbenefits through delays caused by construction are spread across Business and Consumers
PVB: £373.07m Construction delays - PVB -£29.43m
TEE Consumers Travel time benefits for users and some vehicle operating cost savings PVB: £193.89m Reliability Additional peak period capacity (HSR) and variable speed limits reduce occurrence of ‘stop-start’ traffic conditions and will
improve reliability of journey times. Assessment using INCA gives benefits of £131.9m which are not included in BCR at this stage.
Moderate positive
Wider Economic Impacts
Additional user benefits for agglomeration (6% all user benefits), imperfectly competitive markets (6% business user benefits) and labour market impacts (2% all user benefits). Benefits not included in BCR as guidance is for consultation.
Slight Positive
Acc
es
sib
ilit
y
Option Values Although there will be an improved level of service, change will not be sufficiently significant to alter travel opportunities or the addition of new modes.
N/A Neutral
Severance Pedestrian access by footbridges or underpasses across the M4 and M5 will remain the same as at present. N/A Neutral Access to the Transport System
The M4/M5 HSR scheme does not involve any changes to public transport services. No change in the number of persons who have access to a reasonable public transport service.
N/A Neutral
Inte
gra
tio
n
Transport Interchange Only relevant with Park & Ride for highway schemes and hence no impact. N/A Neutral Land Use Policy Assists developments in Severnside, Filton, and Harry Stoke. Improves reliability and resilience of the of inter-regional transport
links. Enhanced reliability and reduced congestion of national corridors and in vicinity of an international gateway N/A Moderate beneficial
Other Government Policies
Reduced congestion, pollution, carbon consumption and accidents contribute to national policy objectives. Improved reliability and resilience assist economic development in region.
N/A Slight beneficial

Post Opening Project Evaluation M5 J15 – 17 & M4 J19 – 20: One Year After Study
102
Table 8-2 Evaluation Summary Table
Scheme Name M5 J15 – 17 & M4 J19 – 20 Smart Motorway Qualitative Impacts Quantitative Assessment .Assessment Score
Objective
En
vir
on
me
nt
Noise The traffic figures show observed flows are an average of 18% lower than forecast flows across the scheme. This has resulted in an overall lower than expected local noise impacts as a result of the scheme.
- Better than expected at OYA
Local air quality The traffic figures show observed flows are an average of 18% lower than forecast flows across the Scheme which results in a beneficial impact to local air quality.
- As expected at OYA
Greenhouse Gases There has been a 2% (536 tonnes) reduction in carbon emissions since the scheme opened. This reduction is contrary to the forecast increase as observed traffic flows are lower than forecast and average journey times have slightly increased, whereas a negligible change was expected in the opening year.
Outturn Do Minimum: 24,157 tonnes Outturn Do Something: 23,981 tonnes
Change: -536 tonnes Better than expected at OYA
Landscape
The scheme has further urbanised the route corridor as expected due to the removal of vegetation, addition of new gantries and signs. Mitigation planting has been implemented along the M4 and M5. Between junction 16 and 17 of the M5 mitigation planting is too small to provide any screening at this stage and establishment of planting and seeding should be reconsidered at FYA.
- As expected at OYA. Further study
required at FYA.
Townscape As the M4 / M5 was already a dominant feature visible from the adjacent towns, the provision of new gantries and signs, whilst incorporating additional elements of infrastructure into the route corridor, does not significantly impact upon the adjacent townscape.
- As expected at OYA.
Heritage of Historic Resources
Impacts to archaeology and built heritage are considered to be as expected. The loss of the locally designated Pegwell footbridge is as expected. South Gloucestershire Council have confirmed they have no record of the historic building record survey following the removal of the footbridge. This survey should be obtained for FYA.
- As expected at OYA.
Biodiversity The POPE site visit confirmed the species rich grassland within the Almondsbury Interchange as per the Series 3000 Planting Mitigation drawings. Further study is required at FYA to evaluate the effectiveness of the mitigation due to limited data provided at OYA.
- As expected based on Series 3000
Planting Mitigation drawings and site visit. Further study required at FYA.
Water Environment It would appear from the Series 500 As Built Drainage Layout drawings that the drainage measures have been provided and POPE is not aware that they are performing other than as expected, however further information would be necessary to confirm this and water and drainage should be reconsidered at FYA.
- As expected based on available
information
Physical Fitness No impacts on NMUs, as expected. - As expected at OYA.
Journey Ambience The impact of the scheme on this sub-objective is as expected at OYA due to traveller views being negatively impacted due to additional infrastructure and improvements to driver stress through improved journey time reliability and reduced driver frustration and fear of accidents. Traveller care has also improved due to additional driver information.
- Neutral
(As expected)
Sa
fety
Accidents There has been a 55% reduction in the collision rate on the M4 and 52% on the M5 after background reductions are considered.
19.1 collisions saved in the opening year PVB = £71.1 million
Security Emergency Refuge Areas and additional CCTV has been implemented as part of the scheme which provide greater driver information and surveillance.
- Slight Positive (as expected)
Ec
on
om
y
Public Accounts The cost of the scheme is slightly lower than forecast, including indirect tax as a reduction in cost and operating costs. - PVC = £77.6 million
TEE: Business Users & Transport Providers
Average journey times have slightly reduced in the opening year, however, forecasts expected a negligible change in average journey times in the peak period in the opening year. As a result, at OYA the impact of the scheme on TEE has not been monetised.
Not monetised at OYA Not monetised
TEE Consumers As for Business TEE.
Reliability The scheme has improved journey time reliability for vehicles travelling from the M4 to M5 across the day but only during the AM peak for vehicles traveling from the M5 to M4. There has been an improvement in the delays experienced by the 10% worst journey times in both direction during the peak periods.
Not monetised Slight Beneficial (As expected)
Wider Economic Impacts
Using a similar approach to the appraisal by basing the impact of the scheme on the wider economy from the journey time impact suggests the scheme is unlikely to have a positive impact on the wider economy at OYA.
- Neutral
(Worse than expected)
Acc
ess
ibil
ity
Option Values The scheme has not altered the travel options available or introduced new modes of travel. - Neutral
(As expected)
Severance There has been no change in the facilities provided to non-motorised users as part of the scheme. Neutral
(As expected)
Access to the Transport System
There have been no changes to the supply of transport infrastructure. - Neutral
(As expected)
Inte
gra
tio
n
Transport Interchange
This sub-objective is only applicable in certain cases where an interchange between different modes forms part of the scheme (e.g. Park and Ride), which is not included as part of this scheme.
- Neutral
(As expected)
Land Use Policy The scheme is supporting local, regional and national land use policies by improving journey time reliability and delays as well as air quality.
- Moderate Beneficial
(As expected)
Other Government Policies
The scheme has improved journey time reliability and delays, minimised the environmental impact of the scheme and significantly improved safety on the M4 and M5 scheme sections. As a result, the scheme is successfully aligning with other government policies.
- Slight Beneficial (As expected)

Post Opening Project Evaluation M5 J15 – 17 & M4 J19 – 20: One Year After Study
103
9. Appendices

Post Opening Project Evaluation M5 J15 – 17 & M4 J19 – 20: One Year After Study
104
Appendix A. MIDAS Analysis M5 J17 – 15 AM Peak Flows by Lane PM Peak Flows by Lane
Where N/A is stated, data is available but the data quality is considered poor hence the data has been removed from the analysis. Figures may not total due to rounding.
Almondsbury Interchange
M4 (W) M4 (W) M4 (E) M5 M5 M5
N/A 1400 1200 400 800 800
- - - 100% 50% 50% 4500m
M4 (W) M4 ( E ) M4 ( E ) & M5
800 1600 1400
21% 42% 37%
J16 Onslip
L1 M4 (E&W) M4 (E) M5 M5
1500 1200 900 700 800
100% 57% 43% 47% 53% 4000m
J16 Offslip
L1 L2 M4 M4&M5 M5
600 400 1200 1600 900
60% 40% 32% 43% 24% 3500m
L1 (HS) L2 L3 L4
1000 1200 1600 900
21% 26% 34% 19% 3300m
L1 (HS) L2 L3 L4
900 1200 1600 900
20% 26% 35% 20% 2800m
L1 (HS) L2 L3 L4
900 1200 1700 900
19% 26% 36% 19% 2500m
L1 (HS) L2 L3 L4
800 1200 1700 1000
17% 26% 36% 21% 2200m
L1 (HS) L2 L3 L4
800 1200 1700 1000
17% 26% 36% 21% 1900m
L1 (HS) L2 L3 L4
800 1200 1800 1100
16% 24% 37% 22% 1500m
L1 L2 L3 L4
700 1400 1700 1000
15% 29% 35% 21% 1100m
L1 L2 L3
1600 1600 900 0
J17 Onslip Lane 2 merges with mainline 39% 39% 22% 700m
L1 L2
600 800
43% 57% L1 L2 L3
900 1500 900 0
27% 45% 27% 400m
L1 L2 L3 0
800 1400 1000
25% 44% 31%
Almondsbury Interchange
M4 (W) M4 (W) M4 (E) M5 M5 M5
N/A 1000 700 200 700 600
- - - 100% 54% 46% 4500m
M4 (W) M4 ( E ) M4 ( E ) & M5
400 1200 800
17% 50% 33%
J16 Onslip
L1 M4 (E&W) M4 (E) M5 M5
710 980 570 730 560
100% 63% 37% 57% 43% 4000m
J16 Offslip
L1 L2 M4 M4&M5 M5
700 600 1000 1300 600
54% 46% 34% 45% 21% 3500m
L1 (HS) L2 L3 L4
1300 900 1300 600
32% 22% 32% 15% 3300m
L1 (HS) L2 L3 L4
1200 1000 1400 600
29% 24% 33% 14% 2800m
L1 (HS) L2 L3 L4
1100 1000 1400 600
27% 24% 34% 15% 2500m
L1 (HS) L2 L3 L4
1000 1000 1400 700
24% 24% 34% 17% 2200m
L1 (HS) L2 L3 L4
1000 1000 1500 700
24% 24% 36% 17% 1900m
L1 (HS) L2 L3 L4
700 1000 1500 800
18% 25% 38% 20% 1500m
L1 L2 L3 L4
600 1300 1600 800
14% 30% 37% 19% 1100m
L1 L2 L3
1200 1300 700 0
J17 Onslip Lane 2 merges with mainline 38% 41% 22% 700m
L1 L2
400 500
44% 56% L1 L2 L3
1000 1400 800 0
31% 44% 25% 400m
L1 L2 L3 0
900 1400 1000
27% 42% 30%

Post Opening Project Evaluation M5 J15 – 17 & M4 J19 – 20: One Year After Study
105
AM Peak Speeds by Lane PM Peak Speeds by Lane
Where N/A is stated, data is available but the data quality is considered poor hence the data has been removed from the analysis. Figures may not total due to rounding.
Almondsbury Interchange
M4 (W) M4 (W) M4 (E) M5 M5 M5
26 79 86 89 94 104 4500m
M4 (W) M4 ( E ) M4 ( E ) & M5
79 76 83
J16 Onslip
L1 M4 (E&W) M4 (E) M5 M5
58 79 86 88 92 4000m
0
J16 Offslip
L1 L2 M4 M4&M5 M5
47 60 77 82 88 3500m
0
L1 (HS) L2 L3 L4
66 74 80 85 3300m
L1 (HS) L2 L3 L4 0
73 79 83 89 2800m
L1 (HS) L2 L3 L4
80 83 87 95 2500m
L1 (HS) L2 L3 L4
82 84 89 95 2200m
0
L1 (HS) L2 L3 L4
82 80 90 96 1900m
0
L1 (HS) L2 L3 L4
77 80 89 95 1500m
L1 L2 L3 L4 0
82 85 91 98 1100m
L1 L2 L3
J17 Onslip Lane 2 merges with mainline 85 93 101 0 700m
L1 L2
76 80
L1 L2 L3
89 95 101 400m
0 0
L1 L2 L3
91 97 103
0
Almondsbury Interchange
M4 (W) M4 (W) M4 (E) M5 M5 M5
N/A 82 89 94 101 113 4500m
M4 (W) M4 ( E ) M4 ( E ) & M5
87 85 92
J16 Onslip
L1 M4 (E&W) M4 (E) M5 M5
70 86 94 95 102 4000m
0
J16 Offslip
L1 L2 M4 M4&M5 M5
53 58 82 87 91 3500m
0
L1 (HS) L2 L3 L4
72 81 85 89 3300m
L1 (HS) L2 L3 L4 0
75 86 90 94 2800m
L1 (HS) L2 L3 L4
82 88 92 98 2500m
L1 (HS) L2 L3 L4
83 88 93 98 2200m
0
L1 (HS) L2 L3 L4
84 86 94 98 1900m
0
L1 (HS) L2 L3 L4
79 86 92 96 1500m
L1 L2 L3 L4 0
84 87 94 98 1100m
L1 L2 L3
J17 Onslip Lane 2 merges with mainline 89 95 101 0 700m
L1 L2
76 82
L1 L2 L3
91 97 101 400m
0 0
L1 L2 L3
92 97 102
0

Post Opening Project Evaluation M5 J15 – 17 & M4 J19 – 20: One Year After Study
106
Appendix B. Environment Information
Requested Requested Information Response
Environmental Statement N/A
Environmental Assessment Report Environmental Appraisal Report (EAR) Volumes 1, 2 and 3, November 2009
AST Version dated January 2010
Any amendments/updates/addendums etc to the EAR or any further studies or reports relevant to environmental issues. Have there been any significant changes to the scheme since the EAR.
No information received.
'As Built' drawings for landscape, ecological mitigation measures, drainage, fencing, earthworks etc. Preferably electronically or on CD.
As Built Series 3000 Planting Mitigation, As Built Series 500 Drainage Layout and As Built Series 100 General Arrangement December 2013
Contact names for consultation Sourced by POPE team
Archaeology - were there any finds etc. Have any Archaeological reports been written either popular or academic and if so are these available?
N/A
Have any properties been eligible for noise insulation? No information received
Have there been any Part 1 Claims regarding noise, air quality or lighting? Have any post opening surveys been undertaken?
No information received for air quality or lighting. It is understood that there was no requirement for noise insulation of provision of noise fencing as part of permanent works.
Has any post opening survey or monitoring been carried out e.g. for ecology/biodiversity or water quality and if so would copies of the reports be available?
No information received.
Animal Mortality Data Information provided by MAC.
Any publicity material
Highways England Road Projects webpage Publications :
M4 Junction 19-20 and M5 Junction 15-17 Managed Motorways - Interactive Scheme Leaflet;
M4 Junction 19-20 and M5 Junction 15-17 Managed Motorways Leaflet; and
M4 J19-20 and M5 J15-17 Managed Motorways Start of Works Exhibition Boards - November 2011.
Pre scheme Non-Motorised User (NMU) Audit or Vulnerable User Survey
No information received.
Copy of NMU post opening survey N/A
Employers Requirements Works Information - Environment sections
No information received.
Health and Safety File – Environment sections No information received.
Construction Environment Management Plan (CEMP)
Balfour Beatty M4/M5 Hard Shoulder Running Project Management Plan – Construction Environmental Management Plan, April 2012. Master Document ENVS-TF-202 Version 2.
Landscape and Ecology Aftercare Plan (LEAP) and / or Landscape Management Plan (LMP)
No information received.
Handover Environmental Management Plan (HEMP) No information received.
Has the scheme received any environmental awards CEEQUAL Sustainability Performance Assessment Good achieved, 2012
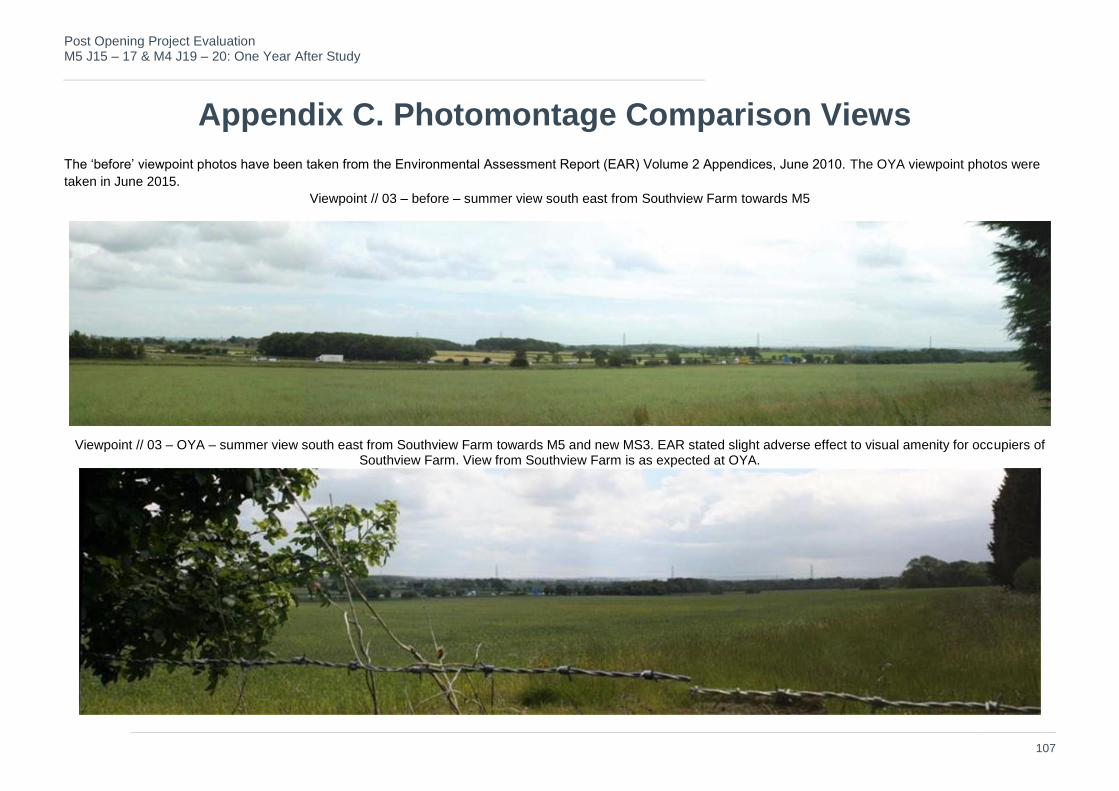
Post Opening Project Evaluation M5 J15 – 17 & M4 J19 – 20: One Year After Study
107
Appendix C. Photomontage Comparison Views
The ‘before’ viewpoint photos have been taken from the Environmental Assessment Report (EAR) Volume 2 Appendices, June 2010. The OYA viewpoint photos were
taken in June 2015.
Viewpoint // 03 – before – summer view south east from Southview Farm towards M5
Viewpoint // 03 – OYA – summer view south east from Southview Farm towards M5 and new MS3. EAR stated slight adverse effect to visual amenity for occupiers of Southview Farm. View from Southview Farm is as expected at OYA.
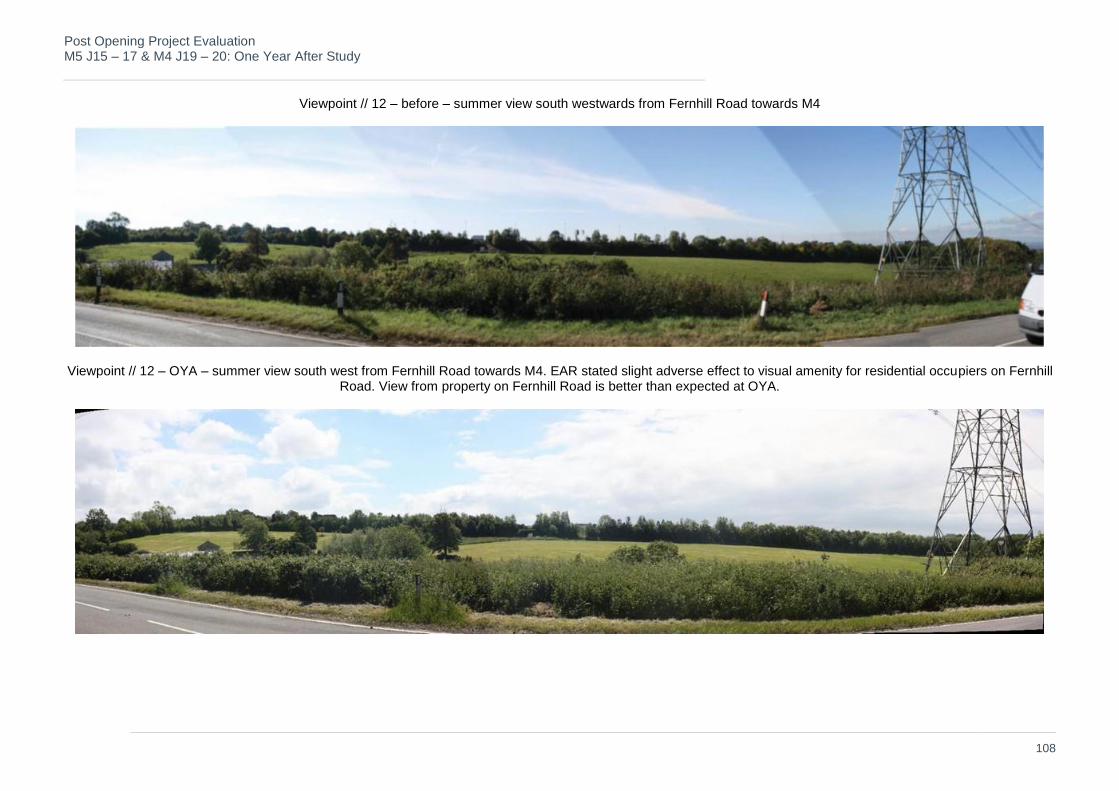
Post Opening Project Evaluation M5 J15 – 17 & M4 J19 – 20: One Year After Study
108
Viewpoint // 12 – before – summer view south westwards from Fernhill Road towards M4
Viewpoint // 12 – OYA – summer view south west from Fernhill Road towards M4. EAR stated slight adverse effect to visual amenity for residential occupiers on Fernhill Road. View from property on Fernhill Road is better than expected at OYA.

Post Opening Project Evaluation M5 J15 – 17 & M4 J19 – 20: One Year After Study
109
Viewpoint // 13 – before – summer view from Florence Park, Almondsbury towards M4
Viewpoint // 13 – OYA – summer view from Florence Park, Almondsbury towards M4. EAR stated neutral effect to visual amenity for users of footpath in Florence Park.
View from Florence Park is as expected at OYA.
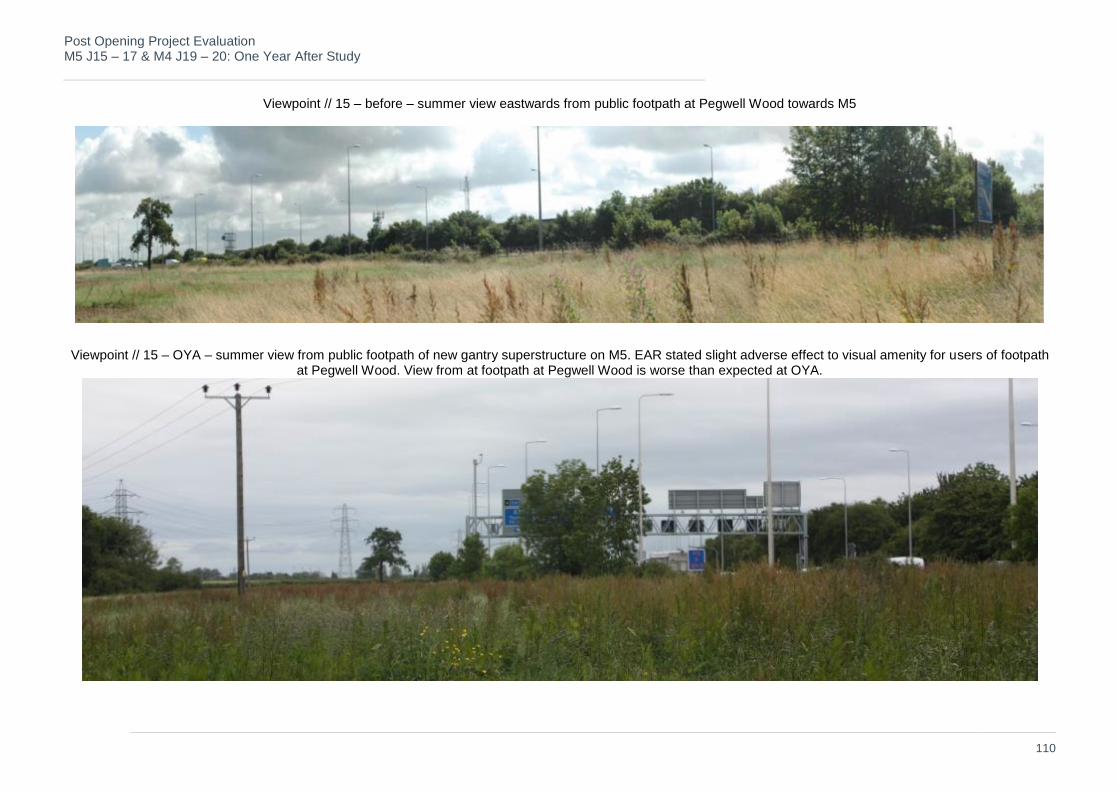
Post Opening Project Evaluation M5 J15 – 17 & M4 J19 – 20: One Year After Study
110
Viewpoint // 15 – before – summer view eastwards from public footpath at Pegwell Wood towards M5
Viewpoint // 15 – OYA – summer view from public footpath of new gantry superstructure on M5. EAR stated slight adverse effect to visual amenity for users of footpath at Pegwell Wood. View from at footpath at Pegwell Wood is worse than expected at OYA.

Post Opening Project Evaluation M5 J15 – 17 & M4 J19 – 20: One Year After Study
111
Viewpoint // 16 – before – summer view north from public footpath onto M5
Viewpoint // 16 – OYA – summer view north from public footbridge over M5 towards new gantry superstructure. EAR stated neutral effect to visual amenity for users of footbridge over M5 near Pegwell Break. View from at footbridge at Pegwell Break is worse than expected at OYA.

Post Opening Project Evaluation M5 J15 – 17 & M4 J19 – 20: One Year After Study
112
Viewpoint // 17 – before – summer view south from public footpath onto M5
Viewpoint // 17 – OYA – summer view north from public footbridge over M5 towards new gantry superstructure and MS3. EAR stated neutral effect to visual amenity for
users of footbridge over M5 near Pegwell Break. View from at footbridge at Pegwell Break is worse than expected at OYA.

Post Opening Project Evaluation M5 J15 – 17 & M4 J19 – 20: One Year After Study
113
Viewpoint // 18 – before – summer view eastwards from Bristol Golf Club driving range towards M5
Viewpoint // 18 – OYA – summer view eastwards from Bristol Golf Club driving range towards M5 and new MS3. EAR stated slight adverse effect to visual amenity for users of Bristol Golf Club driving range. View from Bristol Golf Club driving range is as expected at OYA.

Post Opening Project Evaluation M5 J15 – 17 & M4 J19 – 20: One Year After Study
114
Viewpoint // 20 – before – summer view east of Bristol Golf Club driving range towards M5
Viewpoint // 20 – OYA – summer view east of Bristol Golf Club driving range towards M5 and new gantry superstructure. EAR stated slight adverse effect to visual amenity for users of Bristol Golf Club driving range. View from Bristol Golf Club driving range is as expected at OYA.

Post Opening Project Evaluation M5 J15 – 17 & M4 J19 – 20: One Year After Study
115
Viewpoint // 21 – before – summer view south west of Bristol Golf Club towards M5
Viewpoint // 21 – OYA – summer view south west of Bristol Golf Club towards M5 and new gantry superstructure. EAR stated slight adverse effect to visual amenity for users of Bristol Golf Club driving range. View from Bristol Golf Club driving range is better than expected at OYA.

Post Opening Project Evaluation M5 J15 – 17 & M4 J19 – 20: One Year After Study
116
Viewpoint // 22 – before – summer view north west towards M5
Viewpoint // 22 – OYA – summer view north west towards M5 and new gantry superstructure. EAR stated slight adverse effect to visual amenity for users of MacDonald’s restaurant. View from MacDonald’s restaurant is worse than expected at OYA.
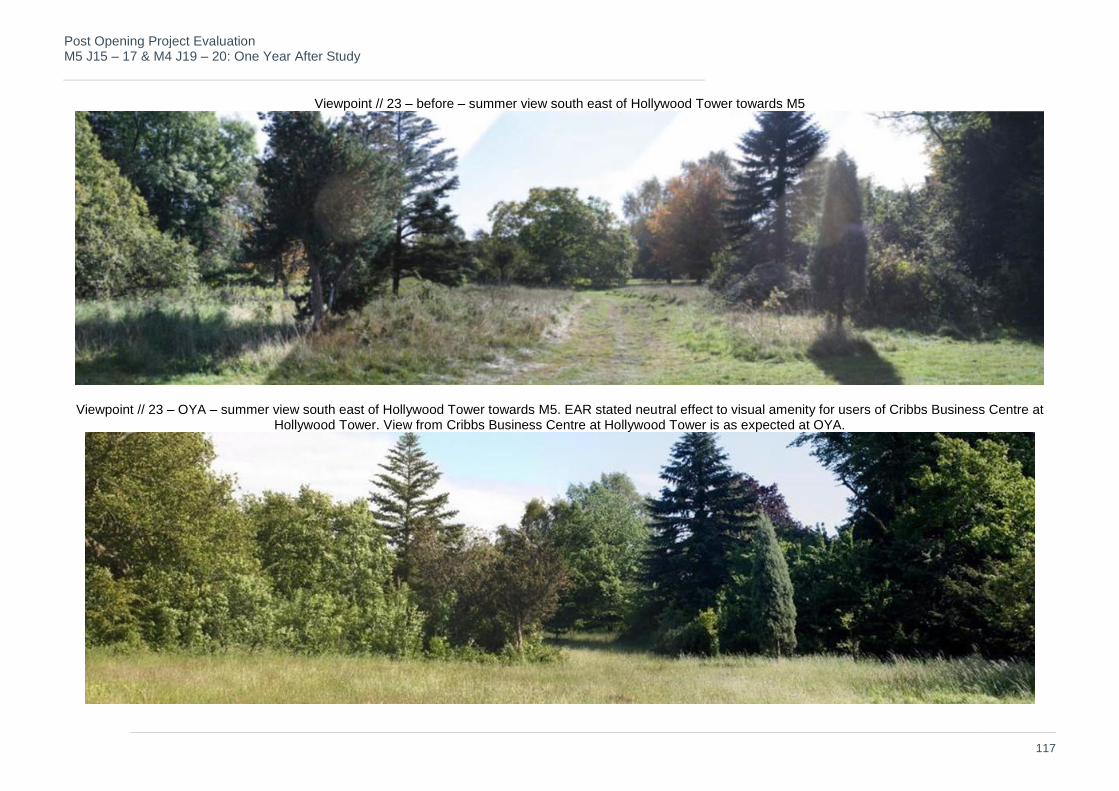
Post Opening Project Evaluation M5 J15 – 17 & M4 J19 – 20: One Year After Study
117
Viewpoint // 23 – before – summer view south east of Hollywood Tower towards M5
Viewpoint // 23 – OYA – summer view south east of Hollywood Tower towards M5. EAR stated neutral effect to visual amenity for users of Cribbs Business Centre at Hollywood Tower. View from Cribbs Business Centre at Hollywood Tower is as expected at OYA.
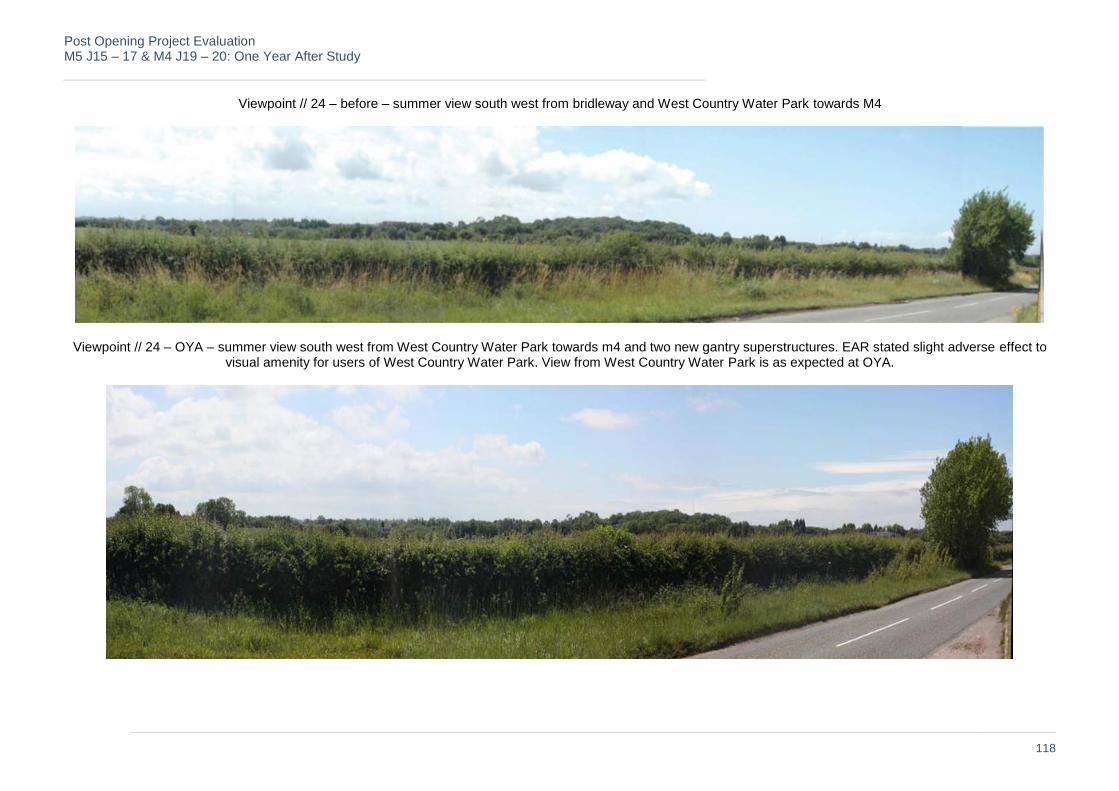
Post Opening Project Evaluation M5 J15 – 17 & M4 J19 – 20: One Year After Study
118
Viewpoint // 24 – before – summer view south west from bridleway and West Country Water Park towards M4
Viewpoint // 24 – OYA – summer view south west from West Country Water Park towards m4 and two new gantry superstructures. EAR stated slight adverse effect to visual amenity for users of West Country Water Park. View from West Country Water Park is as expected at OYA.

Post Opening Project Evaluation M5 J15 – 17 & M4 J19 – 20: One Year After Study
119
Viewpoint // 26 – before – summer view south east from properties on Church Lane, Winterbourne towards M4
Viewpoint // 26 – OYA – summer view south east from property on Church Lane, Winterbourne towards M4. EAR stated neutral effect to visual amenity for occupiers of Court Farm on Church Lane, Winterbourne. View from Court Farm on Church Lane, Winterbourne is as expected at OYA.

Post Opening Project Evaluation M5 J15 – 17 & M4 J19 – 20: One Year After Study
120
Viewpoint // 29 – before – summer view west from the junction of the B4057 and B4058 in Winterbourne towards M4
Viewpoint // 29 – OYA – summer view west from junction of B4057 and B4058 in Winterbourne towards M4 and new gantry superstructure. EAR stated neutral effect to visual amenity for users of footpath south of B4057, Winterbourne. View from junction of B4057 and B4058 in Winterbourne is as expected at OYA.
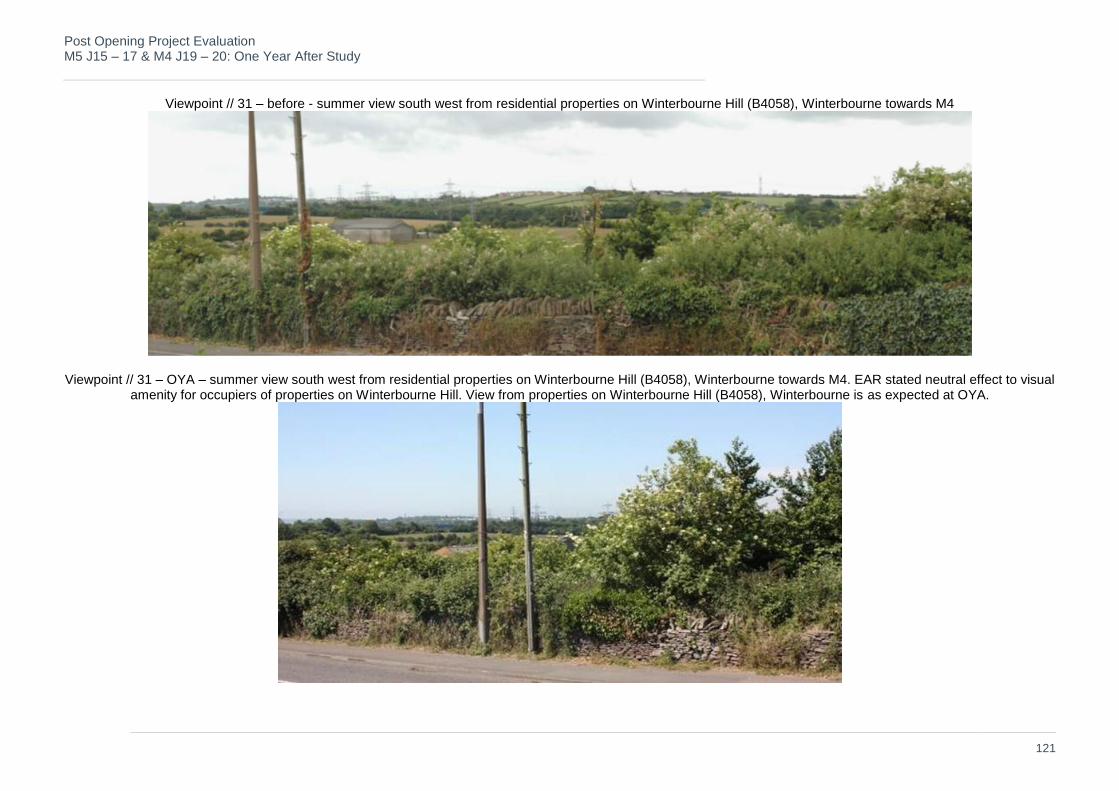
Post Opening Project Evaluation M5 J15 – 17 & M4 J19 – 20: One Year After Study
121
Viewpoint // 31 – before - summer view south west from residential properties on Winterbourne Hill (B4058), Winterbourne towards M4
Viewpoint // 31 – OYA – summer view south west from residential properties on Winterbourne Hill (B4058), Winterbourne towards M4. EAR stated neutral effect to visual amenity for occupiers of properties on Winterbourne Hill. View from properties on Winterbourne Hill (B4058), Winterbourne is as expected at OYA.
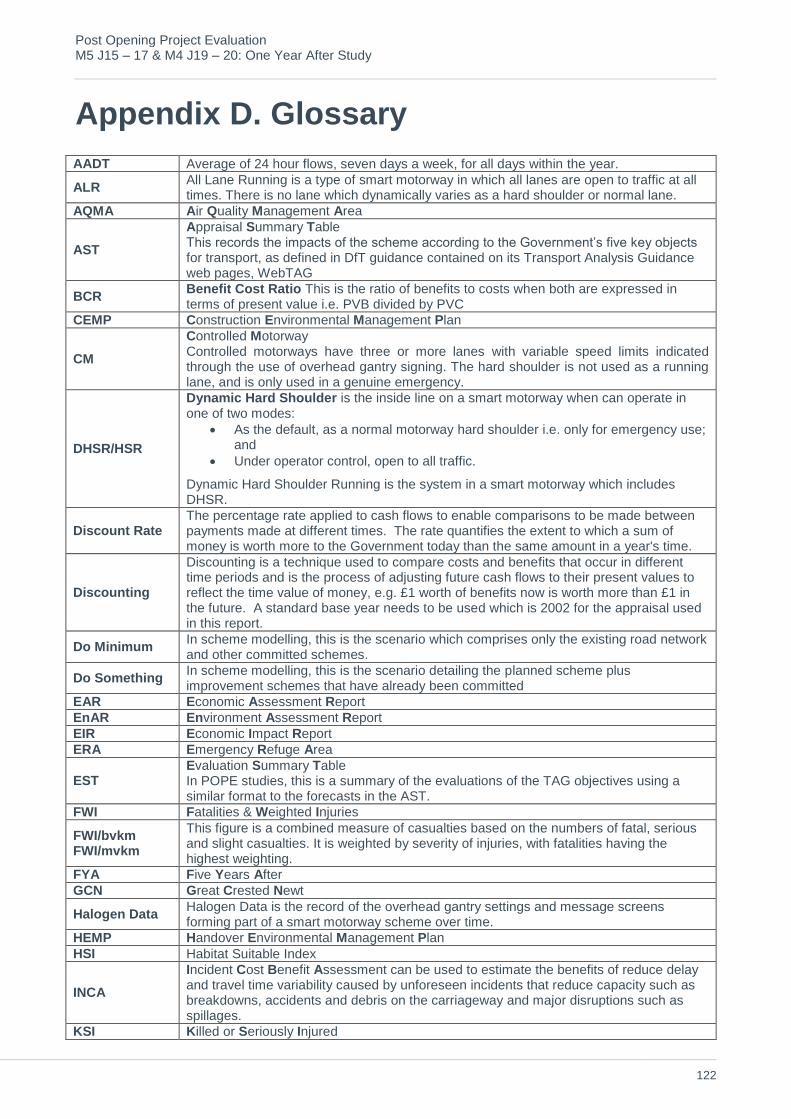
Post Opening Project Evaluation M5 J15 – 17 & M4 J19 – 20: One Year After Study
122
Appendix D. Glossary
AADT Average of 24 hour flows, seven days a week, for all days within the year.
ALR All Lane Running is a type of smart motorway in which all lanes are open to traffic at all times. There is no lane which dynamically varies as a hard shoulder or normal lane.
AQMA Air Quality Management Area
AST
Appraisal Summary Table This records the impacts of the scheme according to the Government’s five key objects for transport, as defined in DfT guidance contained on its Transport Analysis Guidance web pages, WebTAG
BCR Benefit Cost Ratio This is the ratio of benefits to costs when both are expressed in terms of present value i.e. PVB divided by PVC
CEMP Construction Environmental Management Plan
CM
Controlled Motorway Controlled motorways have three or more lanes with variable speed limits indicated through the use of overhead gantry signing. The hard shoulder is not used as a running lane, and is only used in a genuine emergency.
DHSR/HSR
Dynamic Hard Shoulder is the inside line on a smart motorway when can operate in one of two modes:
As the default, as a normal motorway hard shoulder i.e. only for emergency use; and
Under operator control, open to all traffic.
Dynamic Hard Shoulder Running is the system in a smart motorway which includes DHSR.
Discount Rate The percentage rate applied to cash flows to enable comparisons to be made between payments made at different times. The rate quantifies the extent to which a sum of money is worth more to the Government today than the same amount in a year's time.
Discounting
Discounting is a technique used to compare costs and benefits that occur in different time periods and is the process of adjusting future cash flows to their present values to reflect the time value of money, e.g. £1 worth of benefits now is worth more than £1 in the future. A standard base year needs to be used which is 2002 for the appraisal used in this report.
Do Minimum In scheme modelling, this is the scenario which comprises only the existing road network and other committed schemes.
Do Something In scheme modelling, this is the scenario detailing the planned scheme plus improvement schemes that have already been committed
EAR Economic Assessment Report
EnAR Environment Assessment Report
EIR Economic Impact Report
ERA Emergency Refuge Area
EST Evaluation Summary Table In POPE studies, this is a summary of the evaluations of the TAG objectives using a similar format to the forecasts in the AST.
FWI Fatalities & Weighted Injuries
FWI/bvkm FWI/mvkm
This figure is a combined measure of casualties based on the numbers of fatal, serious and slight casualties. It is weighted by severity of injuries, with fatalities having the highest weighting.
FYA Five Years After
GCN Great Crested Newt
Halogen Data Halogen Data is the record of the overhead gantry settings and message screens forming part of a smart motorway scheme over time.
HEMP Handover Environmental Management Plan
HSI Habitat Suitable Index
INCA
Incident Cost Benefit Assessment can be used to estimate the benefits of reduce delay and travel time variability caused by unforeseen incidents that reduce capacity such as breakdowns, accidents and debris on the carriageway and major disruptions such as spillages.
KSI Killed or Seriously Injured
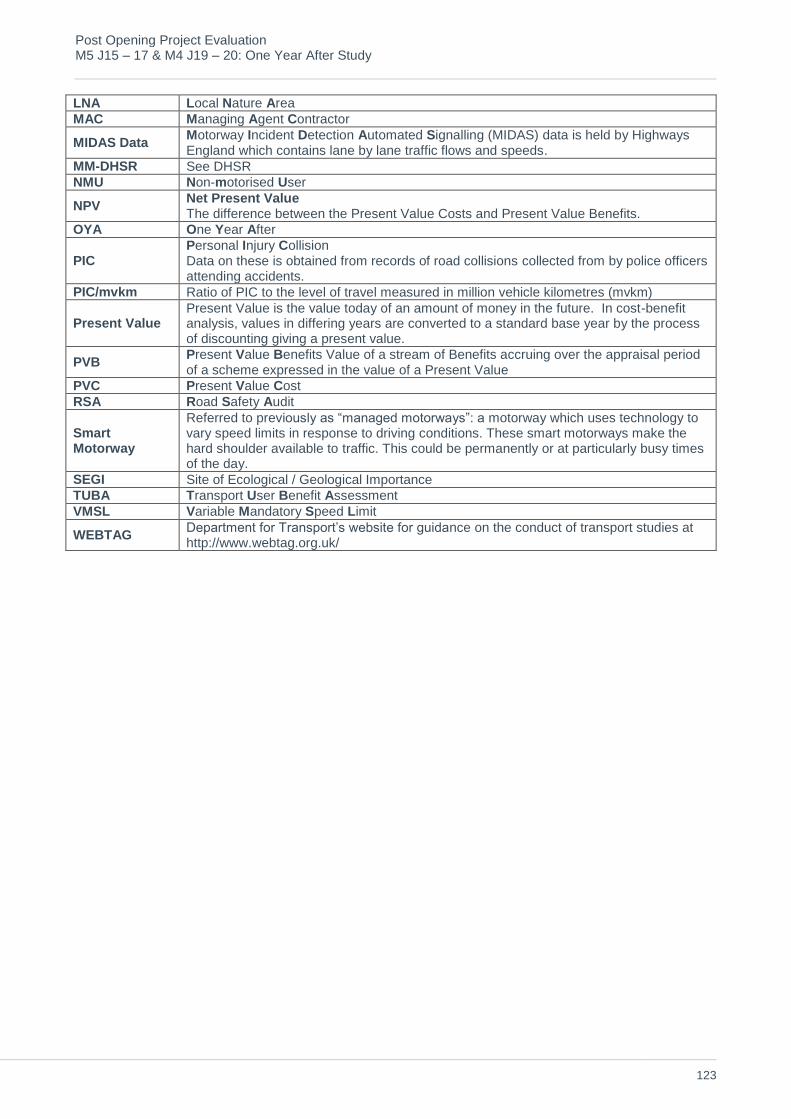
Post Opening Project Evaluation M5 J15 – 17 & M4 J19 – 20: One Year After Study
123
LNA Local Nature Area
MAC Managing Agent Contractor
MIDAS Data Motorway Incident Detection Automated Signalling (MIDAS) data is held by Highways England which contains lane by lane traffic flows and speeds.
MM-DHSR See DHSR
NMU Non-motorised User
NPV Net Present Value The difference between the Present Value Costs and Present Value Benefits.
OYA One Year After
PIC Personal Injury Collision Data on these is obtained from records of road collisions collected from by police officers attending accidents.
PIC/mvkm Ratio of PIC to the level of travel measured in million vehicle kilometres (mvkm)
Present Value Present Value is the value today of an amount of money in the future. In cost-benefit analysis, values in differing years are converted to a standard base year by the process of discounting giving a present value.
PVB Present Value Benefits Value of a stream of Benefits accruing over the appraisal period of a scheme expressed in the value of a Present Value
PVC Present Value Cost
RSA Road Safety Audit
Smart Motorway
Referred to previously as “managed motorways”: a motorway which uses technology to vary speed limits in response to driving conditions. These smart motorways make the hard shoulder available to traffic. This could be permanently or at particularly busy times of the day.
SEGI Site of Ecological / Geological Importance
TUBA Transport User Benefit Assessment
VMSL Variable Mandatory Speed Limit
WEBTAG Department for Transport’s website for guidance on the conduct of transport studies at http://www.webtag.org.uk/
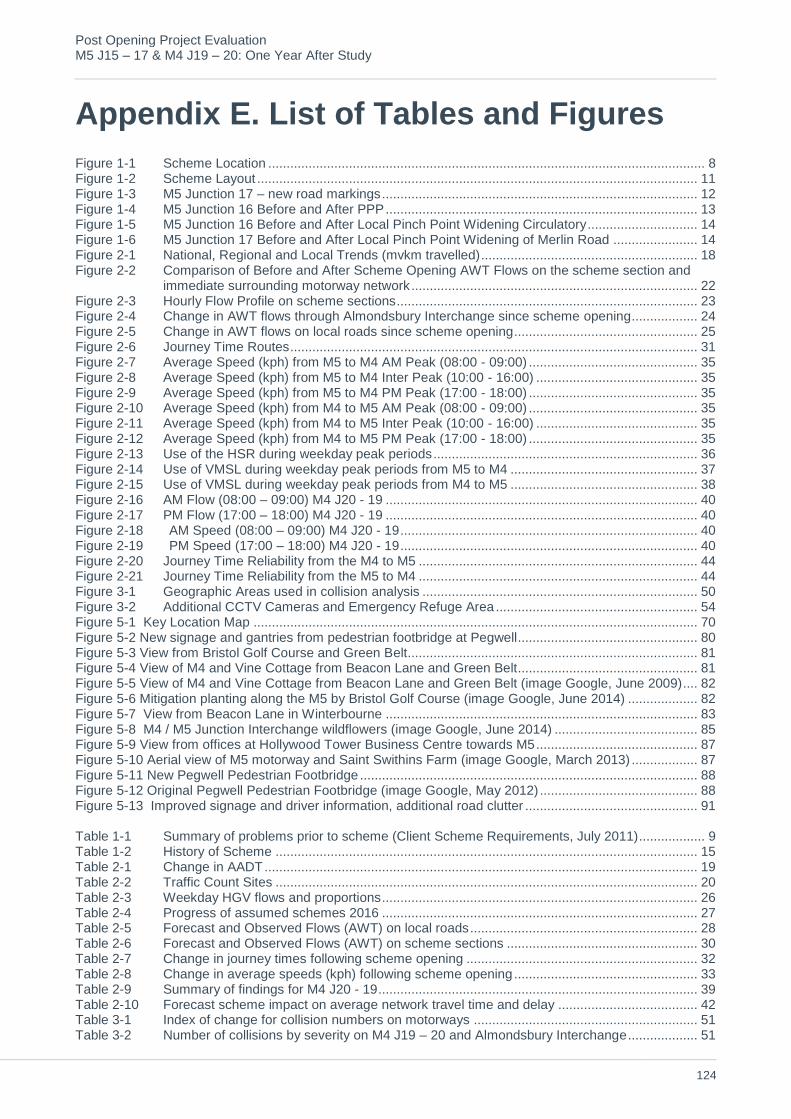
Post Opening Project Evaluation M5 J15 – 17 & M4 J19 – 20: One Year After Study
124
Appendix E. List of Tables and Figures
Figure 1-1 Scheme Location ....................................................................................................................... 8 Figure 1-2 Scheme Layout ........................................................................................................................ 11 Figure 1-3 M5 Junction 17 – new road markings ...................................................................................... 12 Figure 1-4 M5 Junction 16 Before and After PPP ..................................................................................... 13 Figure 1-5 M5 Junction 16 Before and After Local Pinch Point Widening Circulatory .............................. 14 Figure 1-6 M5 Junction 17 Before and After Local Pinch Point Widening of Merlin Road ....................... 14 Figure 2-1 National, Regional and Local Trends (mvkm travelled) ........................................................... 18 Figure 2-2 Comparison of Before and After Scheme Opening AWT Flows on the scheme section and
immediate surrounding motorway network .............................................................................. 22 Figure 2-3 Hourly Flow Profile on scheme sections .................................................................................. 23 Figure 2-4 Change in AWT flows through Almondsbury Interchange since scheme opening .................. 24 Figure 2-5 Change in AWT flows on local roads since scheme opening .................................................. 25 Figure 2-6 Journey Time Routes ............................................................................................................... 31 Figure 2-7 Average Speed (kph) from M5 to M4 AM Peak (08:00 - 09:00) .............................................. 35 Figure 2-8 Average Speed (kph) from M5 to M4 Inter Peak (10:00 - 16:00) ............................................ 35 Figure 2-9 Average Speed (kph) from M5 to M4 PM Peak (17:00 - 18:00) .............................................. 35 Figure 2-10 Average Speed (kph) from M4 to M5 AM Peak (08:00 - 09:00) .............................................. 35 Figure 2-11 Average Speed (kph) from M4 to M5 Inter Peak (10:00 - 16:00) ............................................ 35 Figure 2-12 Average Speed (kph) from M4 to M5 PM Peak (17:00 - 18:00) .............................................. 35 Figure 2-13 Use of the HSR during weekday peak periods ........................................................................ 36 Figure 2-14 Use of VMSL during weekday peak periods from M5 to M4 ................................................... 37 Figure 2-15 Use of VMSL during weekday peak periods from M4 to M5 ................................................... 38 Figure 2-16 AM Flow (08:00 – 09:00) M4 J20 - 19 ..................................................................................... 40 Figure 2-17 PM Flow (17:00 – 18:00) M4 J20 - 19 ..................................................................................... 40 Figure 2-18 AM Speed (08:00 – 09:00) M4 J20 - 19 ................................................................................. 40 Figure 2-19 PM Speed (17:00 – 18:00) M4 J20 - 19 ................................................................................. 40 Figure 2-20 Journey Time Reliability from the M4 to M5 ............................................................................ 44 Figure 2-21 Journey Time Reliability from the M5 to M4 ............................................................................ 44 Figure 3-1 Geographic Areas used in collision analysis ........................................................................... 50 Figure 3-2 Additional CCTV Cameras and Emergency Refuge Area ....................................................... 54 Figure 5-1 Key Location Map ......................................................................................................................... 70 Figure 5-2 New signage and gantries from pedestrian footbridge at Pegwell ................................................. 80 Figure 5-3 View from Bristol Golf Course and Green Belt ............................................................................... 81 Figure 5-4 View of M4 and Vine Cottage from Beacon Lane and Green Belt................................................. 81 Figure 5-5 View of M4 and Vine Cottage from Beacon Lane and Green Belt (image Google, June 2009) .... 82 Figure 5-6 Mitigation planting along the M5 by Bristol Golf Course (image Google, June 2014) ................... 82 Figure 5-7 View from Beacon Lane in Winterbourne ..................................................................................... 83 Figure 5-8 M4 / M5 Junction Interchange wildflowers (image Google, June 2014) ....................................... 85 Figure 5-9 View from offices at Hollywood Tower Business Centre towards M5 ............................................ 87 Figure 5-10 Aerial view of M5 motorway and Saint Swithins Farm (image Google, March 2013) .................. 87 Figure 5-11 New Pegwell Pedestrian Footbridge ............................................................................................ 88 Figure 5-12 Original Pegwell Pedestrian Footbridge (image Google, May 2012) ........................................... 88 Figure 5-13 Improved signage and driver information, additional road clutter ............................................... 91 Table 1-1 Summary of problems prior to scheme (Client Scheme Requirements, July 2011) .................. 9 Table 1-2 History of Scheme ................................................................................................................... 15 Table 2-1 Change in AADT ...................................................................................................................... 19 Table 2-2 Traffic Count Sites ................................................................................................................... 20 Table 2-3 Weekday HGV flows and proportions ...................................................................................... 26 Table 2-4 Progress of assumed schemes 2016 ...................................................................................... 27 Table 2-5 Forecast and Observed Flows (AWT) on local roads .............................................................. 28 Table 2-6 Forecast and Observed Flows (AWT) on scheme sections .................................................... 30 Table 2-7 Change in journey times following scheme opening ............................................................... 32 Table 2-8 Change in average speeds (kph) following scheme opening .................................................. 33 Table 2-9 Summary of findings for M4 J20 - 19 ....................................................................................... 39 Table 2-10 Forecast scheme impact on average network travel time and delay ...................................... 42 Table 3-1 Index of change for collision numbers on motorways ............................................................. 51 Table 3-2 Number of collisions by severity on M4 J19 – 20 and Almondsbury Interchange ................... 51

Post Opening Project Evaluation M5 J15 – 17 & M4 J19 – 20: One Year After Study
125
Table 3-3 Number of collisions by severity on M5 J15 – 17 and Almondsbury Interchange ................... 51 Table 3-4 Comparison of forecast and observed collisions ..................................................................... 52 Table 3-5 Collisions Rates on M4 and M5 Scheme Sections .................................................................. 53 Table 3-6 FWI on M4 scheme section ..................................................................................................... 53 Table 3-7 FWI on M5 scheme section ..................................................................................................... 53 Table 4-1 Economic Impact of Scheme ................................................................................................... 57 Table 4-2 Forecast journey time benefits ................................................................................................. 58 Table 4-3 Forecast and outturn estimate 60 year journey time benefits ................................................. 59 Table 4-4 Vehicle Operating Cost (VOC) Impact ..................................................................................... 60 Table 4-5 Forecast and outturn safety benefits ....................................................................................... 61 Table 4-6 Carbon Evaluation ................................................................................................................... 61 Table 4-7 Monetised Journey Time Reliability Benefits Forecast ............................................................ 62 Table 4-8 Summary of Present Value Benefits ........................................................................................ 63 Table 4-9 Indirect tax revenue impact as a cost (60 years) ..................................................................... 64 Table 4-10 Investment Cost ....................................................................................................................... 65 Table 4-11 Forecast operation, maintenance and renewal costs .............................................................. 65 Table 4-12 Summary of PVC ..................................................................................................................... 66 Table 4-13 Benefit Cost Ratio (all monetary values in 2002 prices £m, discounted) ................................ 66 Table 5-1 Summary of Environmental Consultation Responses ............................................................. 70 Table 5-2 Forecast AWT vs. Observed AWT........................................................................................... 72 Table 5-3 Existing Noise Mitigation .......................................................................................................... 74 Table 5-4 Summary of Noise Evaluation ................................................................................................. 75 Table 5-5 Summary of Air Quality Evaluation .......................................................................................... 77 Table 5-6 Outturn Carbon Emissions Opening Year ............................................................................... 78 Table 5-7 Summary of Landscape and Visual Evaluation ....................................................................... 83 Table 5-8 Summary of Townscape Evaluation ........................................................................................ 84 Table 5-9 Animal Mortality Figure provided by the Managing Agent Contractor ..................................... 85 Table 5-10 Summary of Biodiversity Effects .............................................................................................. 86 Table 5-11 Summary of Cultural Heritage Evaluation ............................................................................... 88 Table 5-12 Summary of Water Quality and Drainage evaluation .............................................................. 89 Table 5-13 Summary of Physical Fitness evaluation ................................................................................. 90 Table 5-14 Summary of Journey Ambience Evaluation ............................................................................. 92 Table 6-1 Summary of expected integration impacts – Land Use ........................................................... 97 Table 6-2 Summary of expected integration impacts – Other Government Policies ............................... 98 Table 7-1 Success against scheme objectives ...................................................................................... 100 Table 8-1 Appraisal Summary Table ..................................................................................................... 101 Table 8-2 Evaluation Summary Table .................................................................................................... 102